Article

Associations of Indoor Nighttime Ventilation with the Relative Abundances of Typical Pathogenic Bacteria and Fungi in Settled Dusts from Floor, Desk, and Bed of University Dormitories


1
School of Civil and Hydraulic Engineering, Chongqing University of Science and Technology, Chongqing 401331, China
2
Institute for Health and Environment, Chongqing University of Science and Technology, Chongqing 401331, China
3
Beijing Key Laboratory of Green Built Environment and Energy Efficient Technology, Beijing University of Technology, Beijing 100124, China
4
Chongqing Research Institute of Beijing University of Technology, Chongqing 401100, China
*
Author to whom correspondence should be addressed.
Microorganisms 2026, 14(7), 1521; https://doi.org/10.3390/microorganisms14071521
Submission received: 22 May 2026 / Revised: 29 June 2026 / Accepted: 10 July 2026 / Published: 12 July 2026
(This article belongs to the Section Environmental Microbiology)

Abstract

Inadequate ventilation in university dormitories risks microbial exposure, but its association with pathogen prevalence in dust across indoor surfaces remains unclear. In this study, we monitored nocturnal air exchange rates (AERs) over a year in dormitory rooms and collected settled dust samples from beds, desks, and floors across four seasons. Based on the World Health Organization (WHO) priority bacterial and fungal pathogen lists, 34 pathogenic species were initially identified from gene sequencing data. We built multivariate regression models to evaluate the associations of daily cumulative ventilation status before dust sampling with the distribution of these pathogens. The results indicated a low compliance rate (AER ≥ 0.7 h−1, 43.2–52.1%) for ventilation in the dormitories. Fusarium and Acremonium were detected in most samples (92.3–99.5%). The modulatory effect of nighttime cumulative ventilation varied heavily across pathogen species and surface types. The relative abundance of Candida tropicalis on bed dust exhibited a stable negative correlation with long-term cumulative AER (β: −0.42 to −0.50), whereas the relative abundance of Salmonella correlated positively with higher AERs. This study demonstrates that ventilation is not a universal pathogen-control measure, revealing its temporal cumulative characteristics and spatial heterogeneity of ventilation in modulating indoor pathogens, and provides a theoretical foundation for implementing precision ventilation strategies in university dormitory environments.

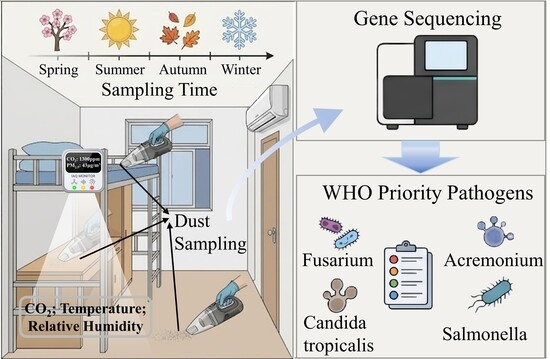
Graphical Abstract

1. Introduction

People now spend approximately 90% of their time indoors, directly linking indoor environment quality to public health outcomes [1,2,3]. Among various indoor pollutants, bioaerosols, encompassing bacteria and fungi, have garnered significant attention due to their potential pathogenicity [4,5,6]. Substantial epidemiological evidence links exposure to specific indoor microbes with adverse health outcomes, such as allergic reactions, asthma, and other immune-regulated disorders [1,7,8,9,10,11]. To address these threats, the World Health Organization (WHO) published the WHO Fungal Priority Pathogens List (2022) [12] and the WHO Bacterial Priority Pathogens List (2024) [13], establishing an authoritative framework for monitoring high-risk pathogens.
University dormitories, characterized by confined spaces and high occupant density, serve as primary residential settings where students spend over 10 h daily [14,15]. Consequently, dormitory environmental quality poses a continuous and direct health threat to occupants [16,17,18]. Ventilation is a key measure for regulating indoor environments and reducing the risks associated with airborne pollutants and microbial exposure [19,20,21,22,23]. Research demonstrates that higher ventilation rates effectively mitigate the infection risk of airborne pathogens [24,25], and in certain contexts, their role may even surpass that of exposure duration and occupant density [26]. However, unlike residential apartments equipped with mechanical ventilation systems, university dormitories primarily rely on window operations and door infiltration, resulting in generally low overall ventilation efficiency [27]. Field measurements consistently show low air exchange rates (AERs) in university dormitories across multiple regions, frequently falling below international standards [28,29,30,31].
Existing studies have identified inadequate ventilation as a critical factor contributing to indoor microbial pollution [32,33,34,35]. In university dormitories, this widespread inadequate ventilation not only correlates with higher respiratory infection rates [36,37,38,39] but also continuously drives the accumulation of airborne pathogens [40,41,42,43]. Despite these recognized links, a critical research gap remains: the modulatory effect of ventilation on indoor microbiomes is rarely instantaneous. Most existing research relies on single-day or snapshot ventilation measurements [22,44,45,46], largely neglecting the temporal accumulation process of indoor pathogens. While many studies focus on airborne microbes, bioaerosols are highly transient and fluctuate rapidly due to immediate environmental disturbances [47]. Conversely, settled dust acts as a continuous environmental sink that integrates microbial accumulation over time, providing a more stable and reliable indicator of long-term occupant exposure [1,48,49].
This study introduces the novel metric of “cumulative nighttime ventilation.” Based on longitudinal field monitoring data, we investigate the associations of daily cumulative ventilation, defined as the average AER over the 1–7 days preceding dust sampling, with typical pathogens present in settled dust from various locations within university dormitory, and aim to provide a theoretical foundation for developing targeted ventilation control strategies in the indoor environments as university dormitory.

2. Methods

2.1. Study Sites and Sampling

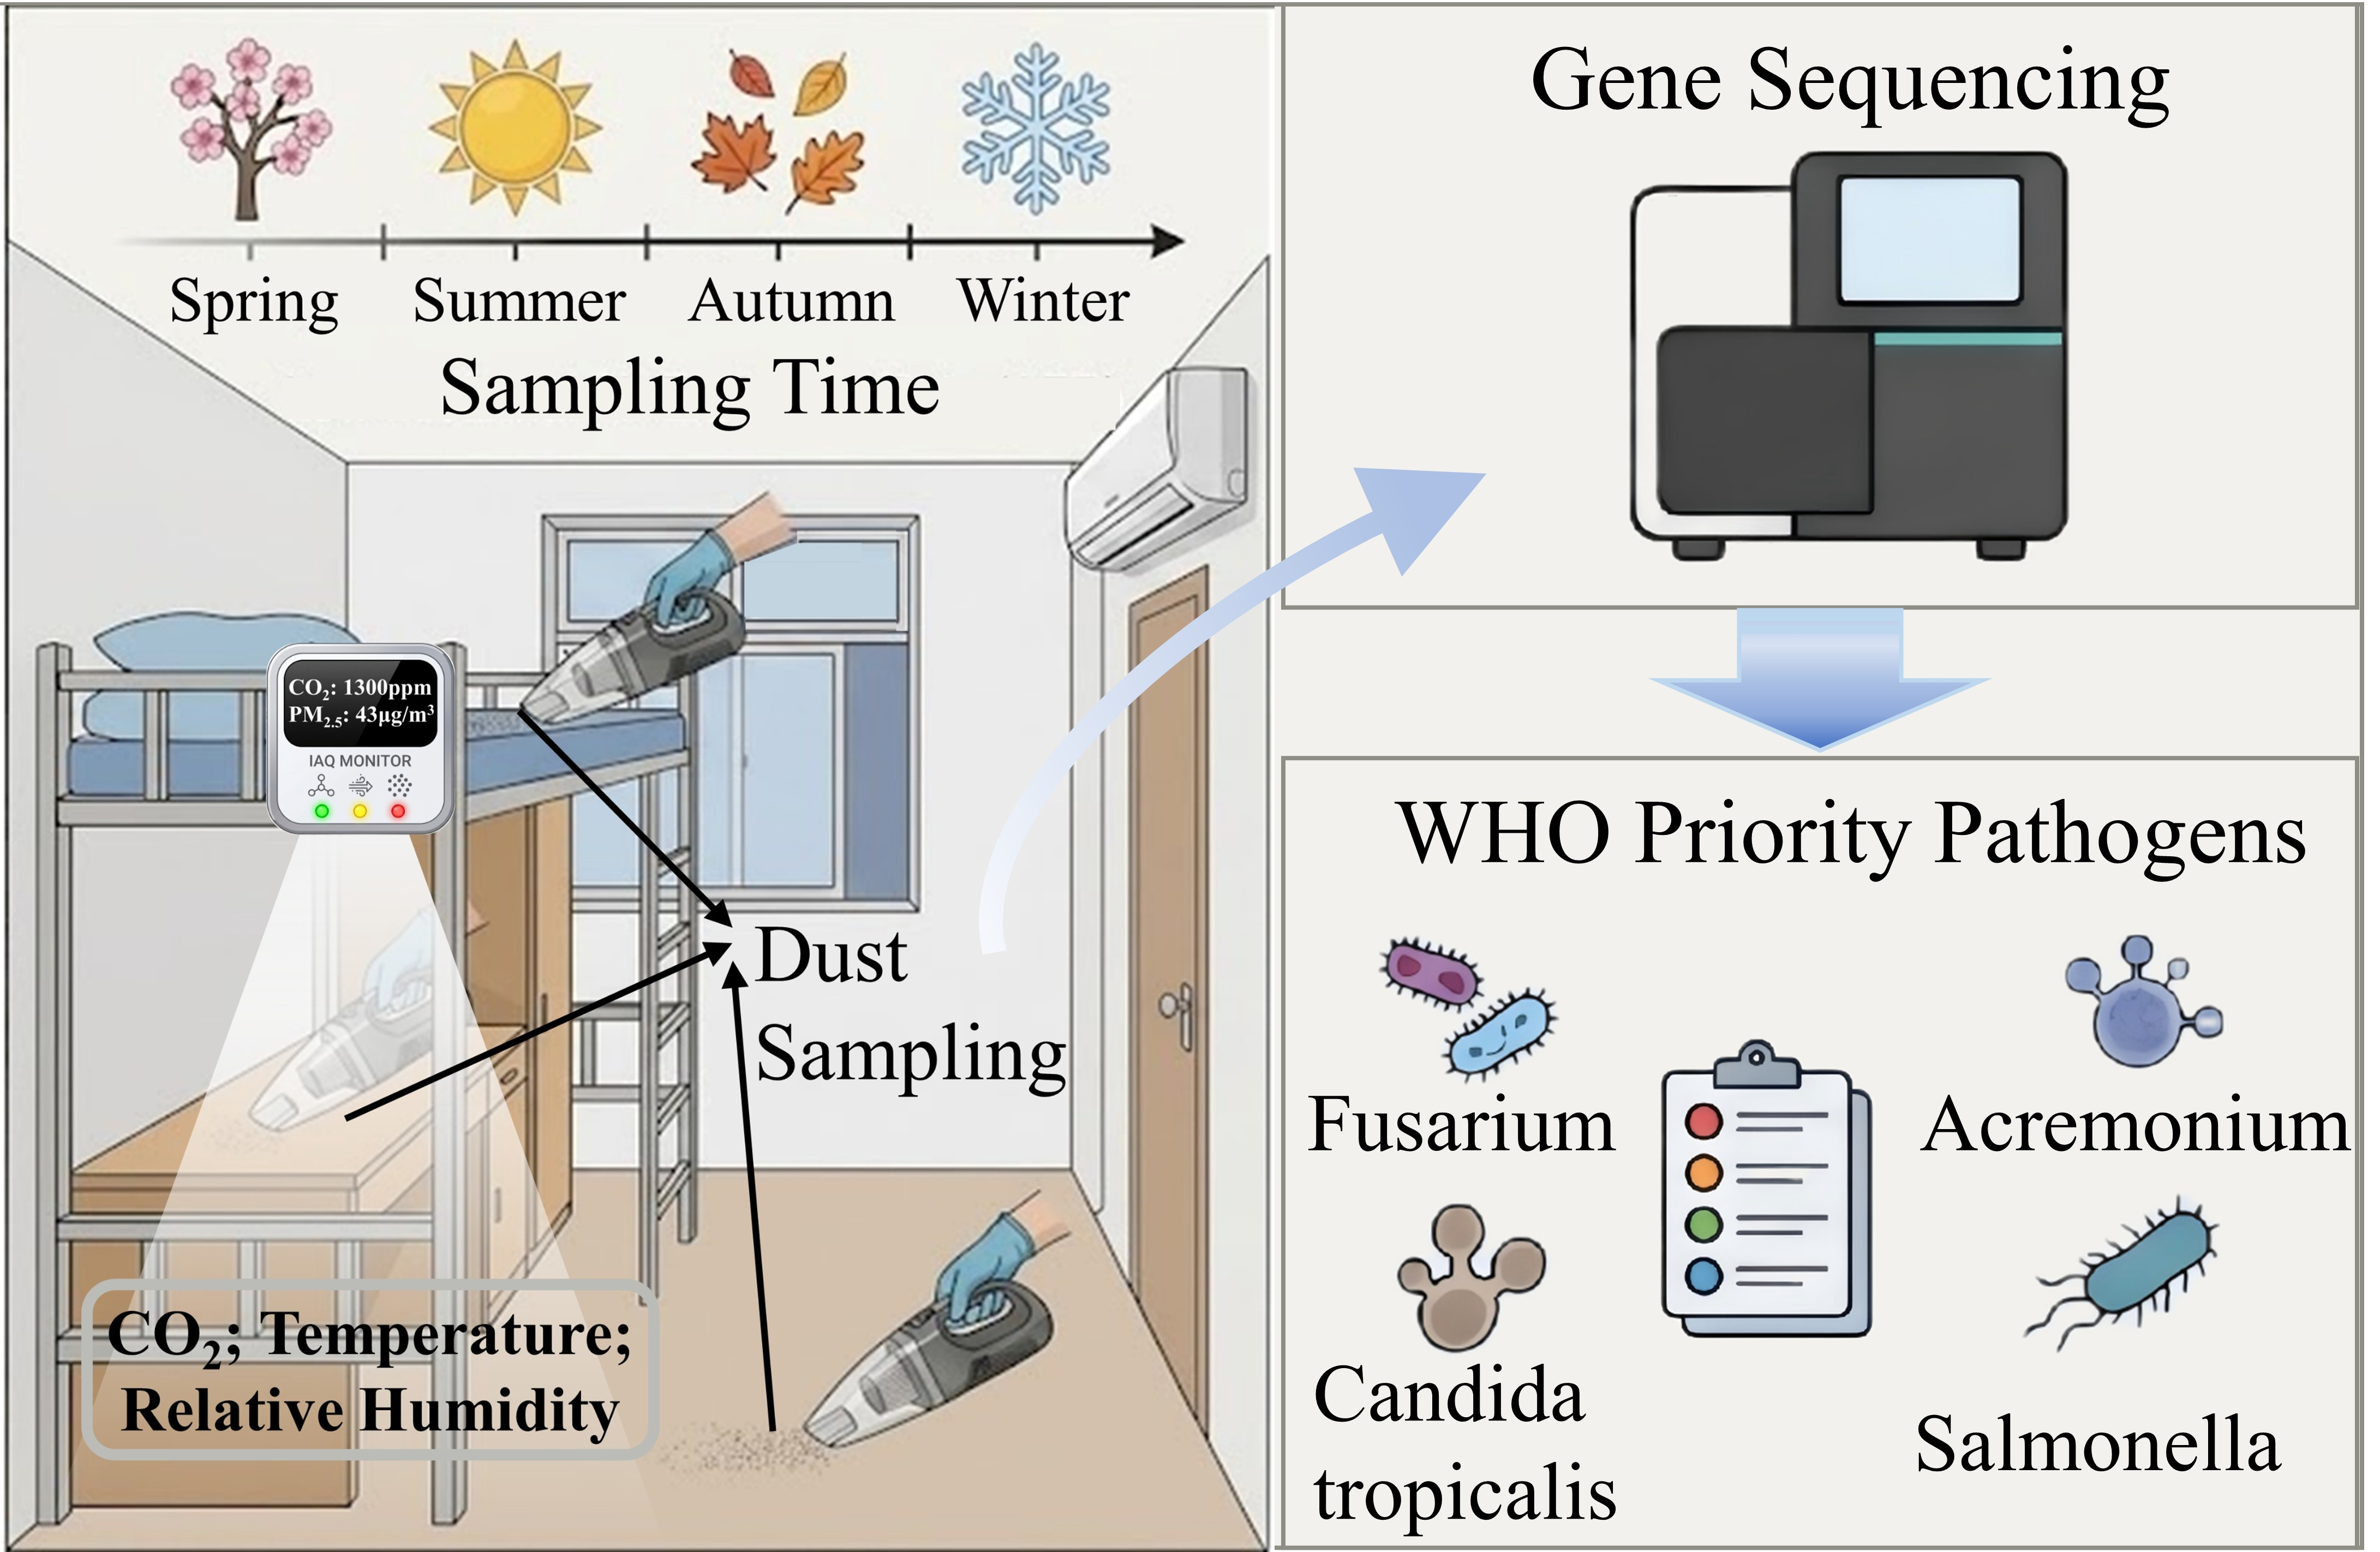
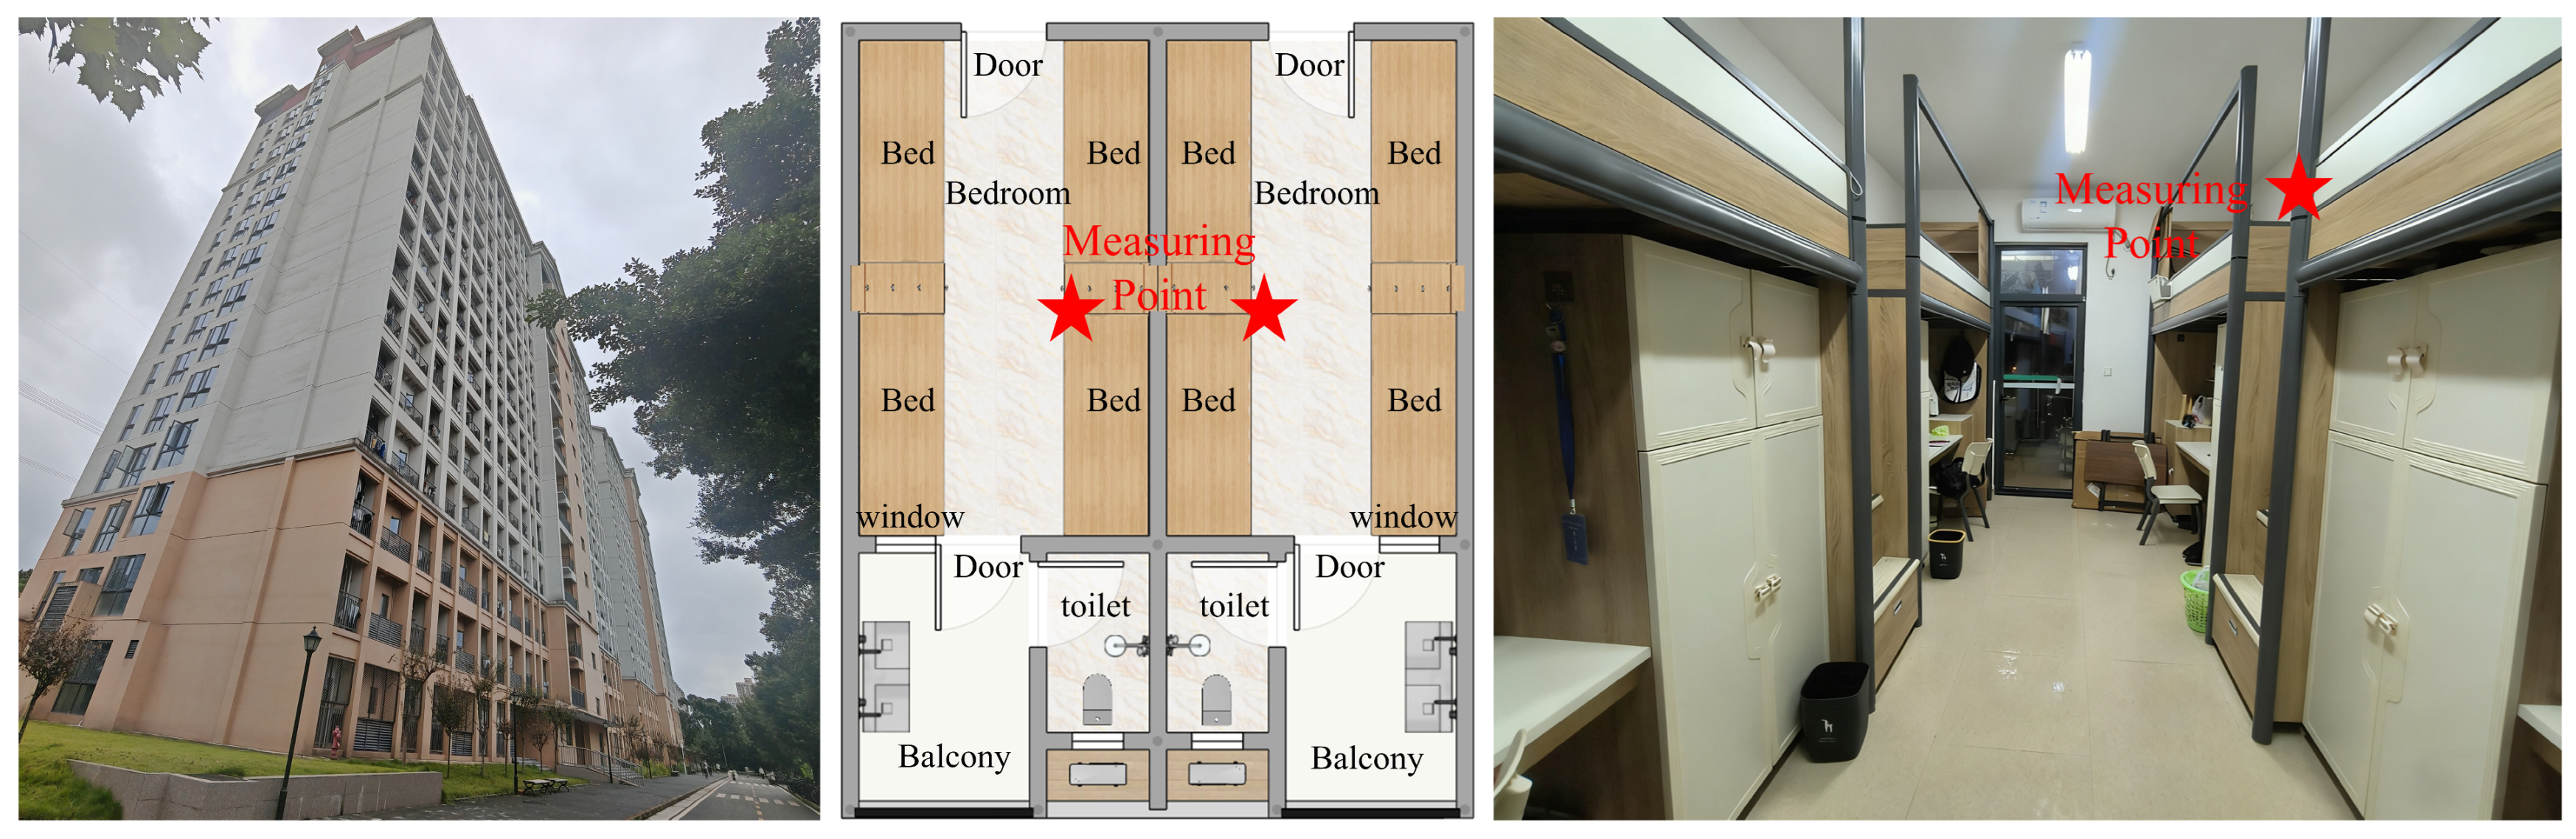
This study was conducted in a 15-story university dormitory building (occupied since 2022) located in Chongqing, China. To account for spatial and orientation variations, a total of 12 dormitory rooms were selected from the 8th floor (6 rooms, 24 male students) and the 12th floor (6 rooms, 24 female students), with each floor comprising three south-facing and three north-facing rooms. All rooms housed four students and featured a standardized layout with lofted beds above study desks. Ventilation was dependent on the opening of balcony doors and windows (Figure 1).
Settled dust sampling was conducted in each season from 1 May 2024 to 30 April 2025. Sampling dates were selected based on the predominant weather pattern for each season and further calibrated to ensure that the daily temperature was within ±2 °C of the seasonal average, humidity fell within the typical range for that weather type, and no extreme weather events had occurred in the 72 h preceding sampling. Dust samples were collected from beds, desks, and floors in each dormitory using a 700 W household vacuum cleaner (Yangzi YZ-SC-X2; Ningbo Jiequ Electric Appliance Co., Ltd., Ningbo, Zhejiang, China) fitted with a custom stainless-steel nozzle, with each sample collected in about a 5 min period. To ensure methodological consistency, the sampling area for each site was strictly defined and kept identical across all longitudinal sampling campaigns. Specifically, the entire surface of the bed (0.9 m × 2.0 m) was vacuumed due to the relatively sparse dust accumulation, while a fixed area of at least 1 m2 was sampled for both the desk and the floor. The dust was collected on DR-85 circular filter media (85 mm diameter, 95% capture efficiency for particles ≥ 0.3 μm; Ningbo Shengbao Safe Technology Co., Ltd., Ningbo, Zhejiang, China). Following collection, filter membranes were wrapped in aluminum foil, sealed in bags, and stored at −80 °C until DNA extraction for high-throughput gene sequencing.
During each sampling, we administered questionnaires on dormitory environment characteristics and student lifestyle habits. The lifestyle habits included the frequency of airing and changing bed linens, bed-making habit after waking, desk cleaning frequency, and floor sweeping and mopping frequency. The detailed statistical characteristics of these lifestyle habits are summarized in Supplementary Table S1. Ultimately, a total of 552 valid settled dust samples were successfully collected across the four seasons. These comprised 142 samples from spring, 141 from summer, 136 from autumn, and 133 from winter. Regarding the specific sampling sites, the dataset included 178 samples from beds, 187 from desks, and 187 from floors. These samples were subjected to subsequent high-throughput sequencing for bacterial and fungal community analyses.

2.2. Indoor Ventilation Evaluation

Indoor temperature, relative humidity, and CO2 concentration were monitored using QD-G3 air quality sensors (Beijing Green Built Environment Technology Co., Ltd., Beijing, China). The measurement ranges and accuracies for each parameter were as follows: temperature 0–60 °C (±0.5 °C), relative humidity 0–99% (±10%), and CO2 concentration 0–5000 ppm (±70 ppm). The sampling interval for all parameters was set to 1 min. Before deployment, we cross-calibrated all sensors simultaneously for 12 h. One sensor was positioned in the center of each dormitory room at a height of 1.8 m above the floor to minimize interference from occupant activities (Figure 1). The air exchange rate (AER) was estimated using the CO2 concentration step-up method [50] based on the integral mass balance equation. Assuming well-mixed indoor air, the dynamic change in indoor CO2 concentration is expressed as C t = C o u t + E V A E R + C 0 C o u t E V A E R e A E R t , where C t is the indoor CO2 concentration at time t , C 0 is the initial concentration, C o u t is the outdoor background concentration, E is the total CO2 emission rate of the occupants, and V is the room volume. We applied a non-linear curve-fitting method to iteratively solve for the AER that minimized the sum of squared errors between the theoretically predicted and actual continuous sensor readings. A detailed step-by-step example of this calculation, including the determination of occupant-specific emission rates, is provided in Section S1 of the Supplementary Materials. To avoid potential disturbances from frequent daytime activities, the nighttime period (22:00 to 08:00 in the next day) was selected for AER calculation, utilizing the rising segment of the CO2 concentration data. This selection was driven by both the methodological requirements of the tracer gas technique and the unique occupancy patterns of graduate student dormitories. During the daytime, graduate students primarily work in laboratories, leaving the dormitories largely unoccupied. This absence of a stable indoor CO2 generation source makes daytime AER estimation unreliable. Furthermore, frequent daytime door-opening events introduce significant interference. In contrast, during the nighttime (sleeping hours), dormitories are fully occupied, providing a continuous and stable CO2 emission source suitable for the step-up method. More importantly, this continuous nighttime occupancy represents the absolute primary period of residents’ prolonged exposure to the dormitory indoor environment. Furthermore, annual temperature and humidity data from all dormitories were exported, and the daily average values for each parameter were computed for each room to serve as the basis for subsequent data analysis.
Approximately 6% of the raw continuous monitoring data for AER, indoor air temperature, and relative humidity were missing due to sporadic sensor disconnections. These missing values were handled using multiple imputation. Five complete datasets were generated via the Markov Chain Monte Carlo algorithm, with the imputation model incorporating the continuous distribution characteristics of the variables and constraints based on their physical meanings to ensure result plausibility.
All subsequent statistical analyses were performed using the imputed datasets and focused on the indicator “Cumulative AER for n days before sampling” (where n = 1 to 7). This indicator is specifically defined as the arithmetic mean of the nocturnal AER over the n consecutive days immediately preceding the sampling day (e.g., the 3 days pre-sampling AER represents the average of AER from days 1, 2, and 3 before sampling). It was designed to reflect the cumulative ventilation level over different durations (1 to 7 days) prior to sampling, thereby assessing the sustained effect of dormitory ventilation rather than its instantaneous state on a single day. The overall ventilation compliance rates in different seasons were also analyzed according to the compliance threshold for residential ventilation (AER ≥ 0.7 h−1) recommended by the Standard for Indoor Air Quality (GB/T 18883-2022) [51].

2.3. Measurement of Bacteria and Fungi

Gene sequencing for this study was performed by Shanghai Majorbio Bio-pharm Technology Co., Ltd., Shanghai, China. Each collected dust sample was divided into two aliquots, designated for bacterial and fungal gene sequencing analysis, respectively. Genomic DNA was extracted from the dust samples using the DNeasy® PowerSoil® Pro Kit (QIAGEN, Germantown, MD, USA). The quality of the extracted DNA was assessed via 1% agarose gel electrophoresis and a NanoDrop2000 spectrophotometer. The targeted sequencing regions were the V3–V4 hypervariable region of the bacterial 16S rRNA gene and the ITS1 region of the fungal ITS gene. The primer pairs were 338F (5′-ACTCCTACGGGAGGCAGCAG-3′) and 806R (5′-GGACTACHVGGGTWTCTAAT-3′) for bacteria [52] and ITS1F (5′-CTTGGTCATTTAGAGGAAGTAA-3′) and ITS2R (5′-GCTGCGTTCTTCATCGATGC-3′) for fungi [53]. The PCR products were extracted from 2% agarose gels, purified using a PCR Clean-Up Kit (Yuhua, Shanghai, China), and quantified with a Qubit 4.0 fluorometer (Thermo Fisher Scientific, Waltham, MA, USA). Sequencing libraries were constructed using the NEXTFLEX Rapid DNA-Seq Kit and subsequently sequenced on the Illumina PE300/PE250 platform (Majorbio Bio-Pharm Technology Co., Ltd., Shanghai, China). Following sequencing, the raw paired-end reads were subjected to rigorous quality control. The sequences were demultiplexed, quality-filtered using FASTP to remove low-quality reads, and merged using FLASH. Taxonomic assignment of the high-quality sequences was performed using a Naïve-Bayes consensus taxonomy classifier, referenced against the SILVA database for bacterial 16S rRNA genes and the UNITE database for fungal ITS sequences.
Based on the gene sequencing results, pathogens within the dust samples were screened against the World Health Organization (WHO) Fungal Priority Pathogens List (2022) [12] and the Bacterial Priority Pathogens List (2024) [13]. The initial screening identified six pathogenic bacterial and 13 pathogenic fungal taxa. To ensure the robustness of subsequent statistical analyses, species detected only in very few samples (i.e., pathogens with an exceedingly low detection rate) were excluded. Thus, we retained three pathogenic bacterial taxa and seven pathogenic fungal taxa for in-depth analyses.

2.4. Statistical Analyses

We used a hierarchical statistical approach to evaluate the associations of cumulative ventilation with pathogens. First, we applied the Mann–Whitney U test to compare the distribution differences in pathogen relative abundance among the different sampling sites (bed, desk, floor). Then, we built multivariate logistic regression models to investigate the associations of cumulative ventilation (represented by the average AER over 1 to 7 days before sampling) with pathogen detection status (i.e., detected vs. non-detected). The generalized linear models (GLMs) were built to evaluate the associations of cumulative ventilation with the relative abundances of the 10 pathogens, respectively. Separate models were built for each target pathogens. All models considered season, dormitory orientation, indoor air temperature, and relative humidity as covariates. Furthermore, lifestyle habit variables were incorporated into the models based on the characteristics of each sampling location (e.g., frequency of airing and changing bed linens for beds, desk cleaning frequency for desks, floor sweeping frequency for floors). In the GLM analyses, to address the high prevalence of zero values (zero-inflation) in the relative abundance data, zero values were replaced with half of the minimum non-zero values that were observed for each respective species. This widely accepted pseudo-count addition method is essential for compositional microbiome data to avoid undefined logarithmic transformations in the subsequent log-link Gamma distribution models, while effectively minimizing distortion to the dataset’s underlying distribution. A Gamma distribution with a log-link function was selected for model fitting. Odds ratio (ORs) and regression coefficients (β), accompanied by their 95% confidence intervals are recorded to show the target associations in the logistic regression analyses and GLM analyses, respectively. A statistical significance threshold of p < 0.05 was applied for all analyses. The statistical analyses were performed using SPSS Statistics (version 27.0). Figures were generated using Origin software (version 2024).

3. Results

3.1. Basic Status of Indoor Ventilation

Table 1 shows the cumulative nighttime AERs from 1 to 7 days before sampling and the overall ventilation compliance rates, which ranged from 43.2% to 52.1%. The ventilation conditions had significant seasonal differences, with spring showing the highest compliance rates (58.3–69.4%), while the rates in summer, autumn, and winter were mostly below 50%. Additionally, the median AER in spring consistently remained above the compliance threshold, whereas the medians in the other three seasons predominantly fell below or near this benchmark (Figure S1).

3.2. Pathogenic Bacteria and Fungi Communities

Table 2 details the six pathogenic bacterial genera and 13 pathogenic fungal genera across the sampling sites, cross-referenced with the WHO priority lists.
For the pathogenic bacterial communities, Serratia and Enterobacter were the genera with the highest detection rates. The detection rates of both Serratia and Enterobacter were significantly higher in floor dust samples compared to bed and desk surface dust samples. Salmonella exhibited its highest detection frequency (21.4%) in desk samples. The detection rates of the remaining bacterial genera were below 5%.
Regarding the pathogenic fungal communities, Fusarium and Acremonium were detected in nearly all samples, exhibiting extremely high detection rates (92.3–99.5%). Four species in the Candida genus were detected, and Candida parapsilosis and Candida tropicalis generally showed high detection rates, particularly in bed and floor samples. Notably, the detection rate of Candida parapsilosis was substantially higher on bed surface dusts (68.8%) and floor dusts (71.7%) than on desk surface dusts (49.7%). The detection rates of the remaining fungal genera/species, such as Scedosporium and Pichia kudriavzevii, were below 13% (Table 2).

3.3. Associations Between AER with Pathogenic Bacteria and Fungi

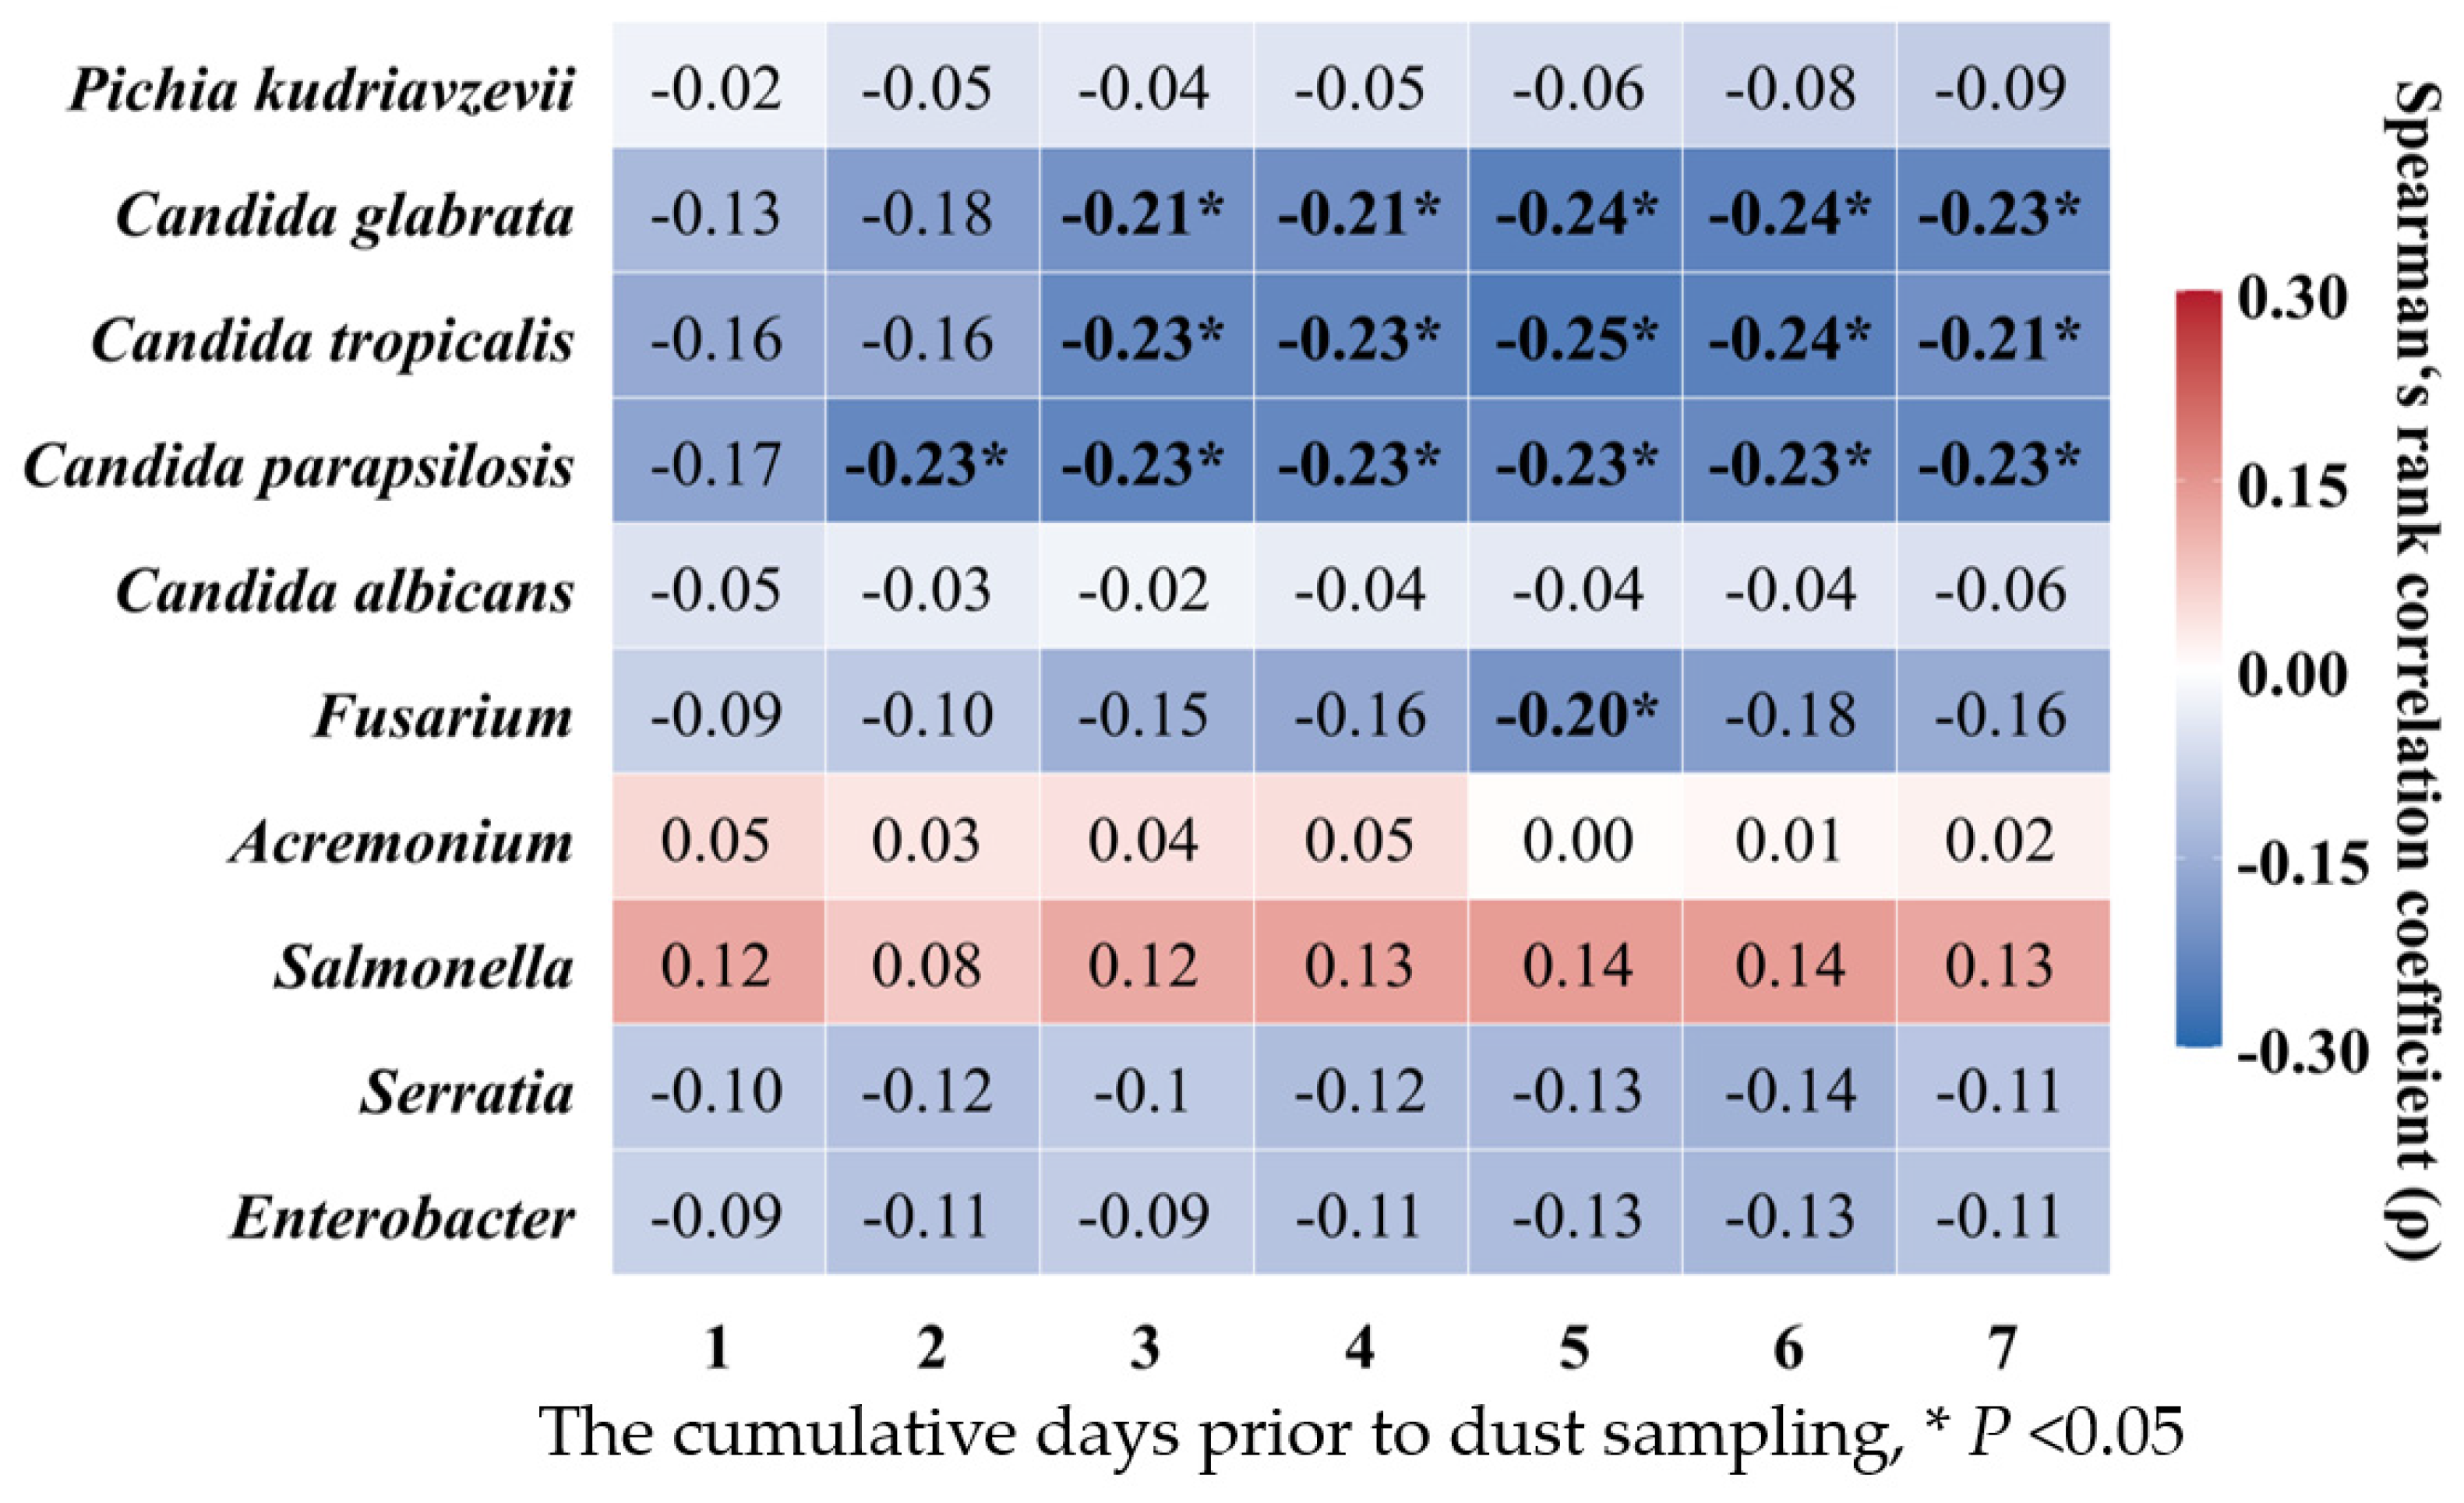
Cumulative AERs (1–7 days prior to sampling) generally exhibited negative correlations with the relative abundances of most pathogens (Figure 2). However, these correlations only reached statistical significance among pathogens from bed dust (Figure 2), and no significant correlation was found among pathogens in floor and desk dust (Figure S2). In bed dust samples, the relative abundances of Candida glabrata, Candida tropicalis, and Candida parapsilosis showed significant negative correlations with cumulative AERs over multiple periods before sampling (particularly 3 to 7 days), with correlation coefficients (ρ) ranging from −0.21 to −0.25. Fusarium in bed dust also exhibited a significant negative correlation (ρ = −0.20) with the cumulative AERs in five days before dust sampling.
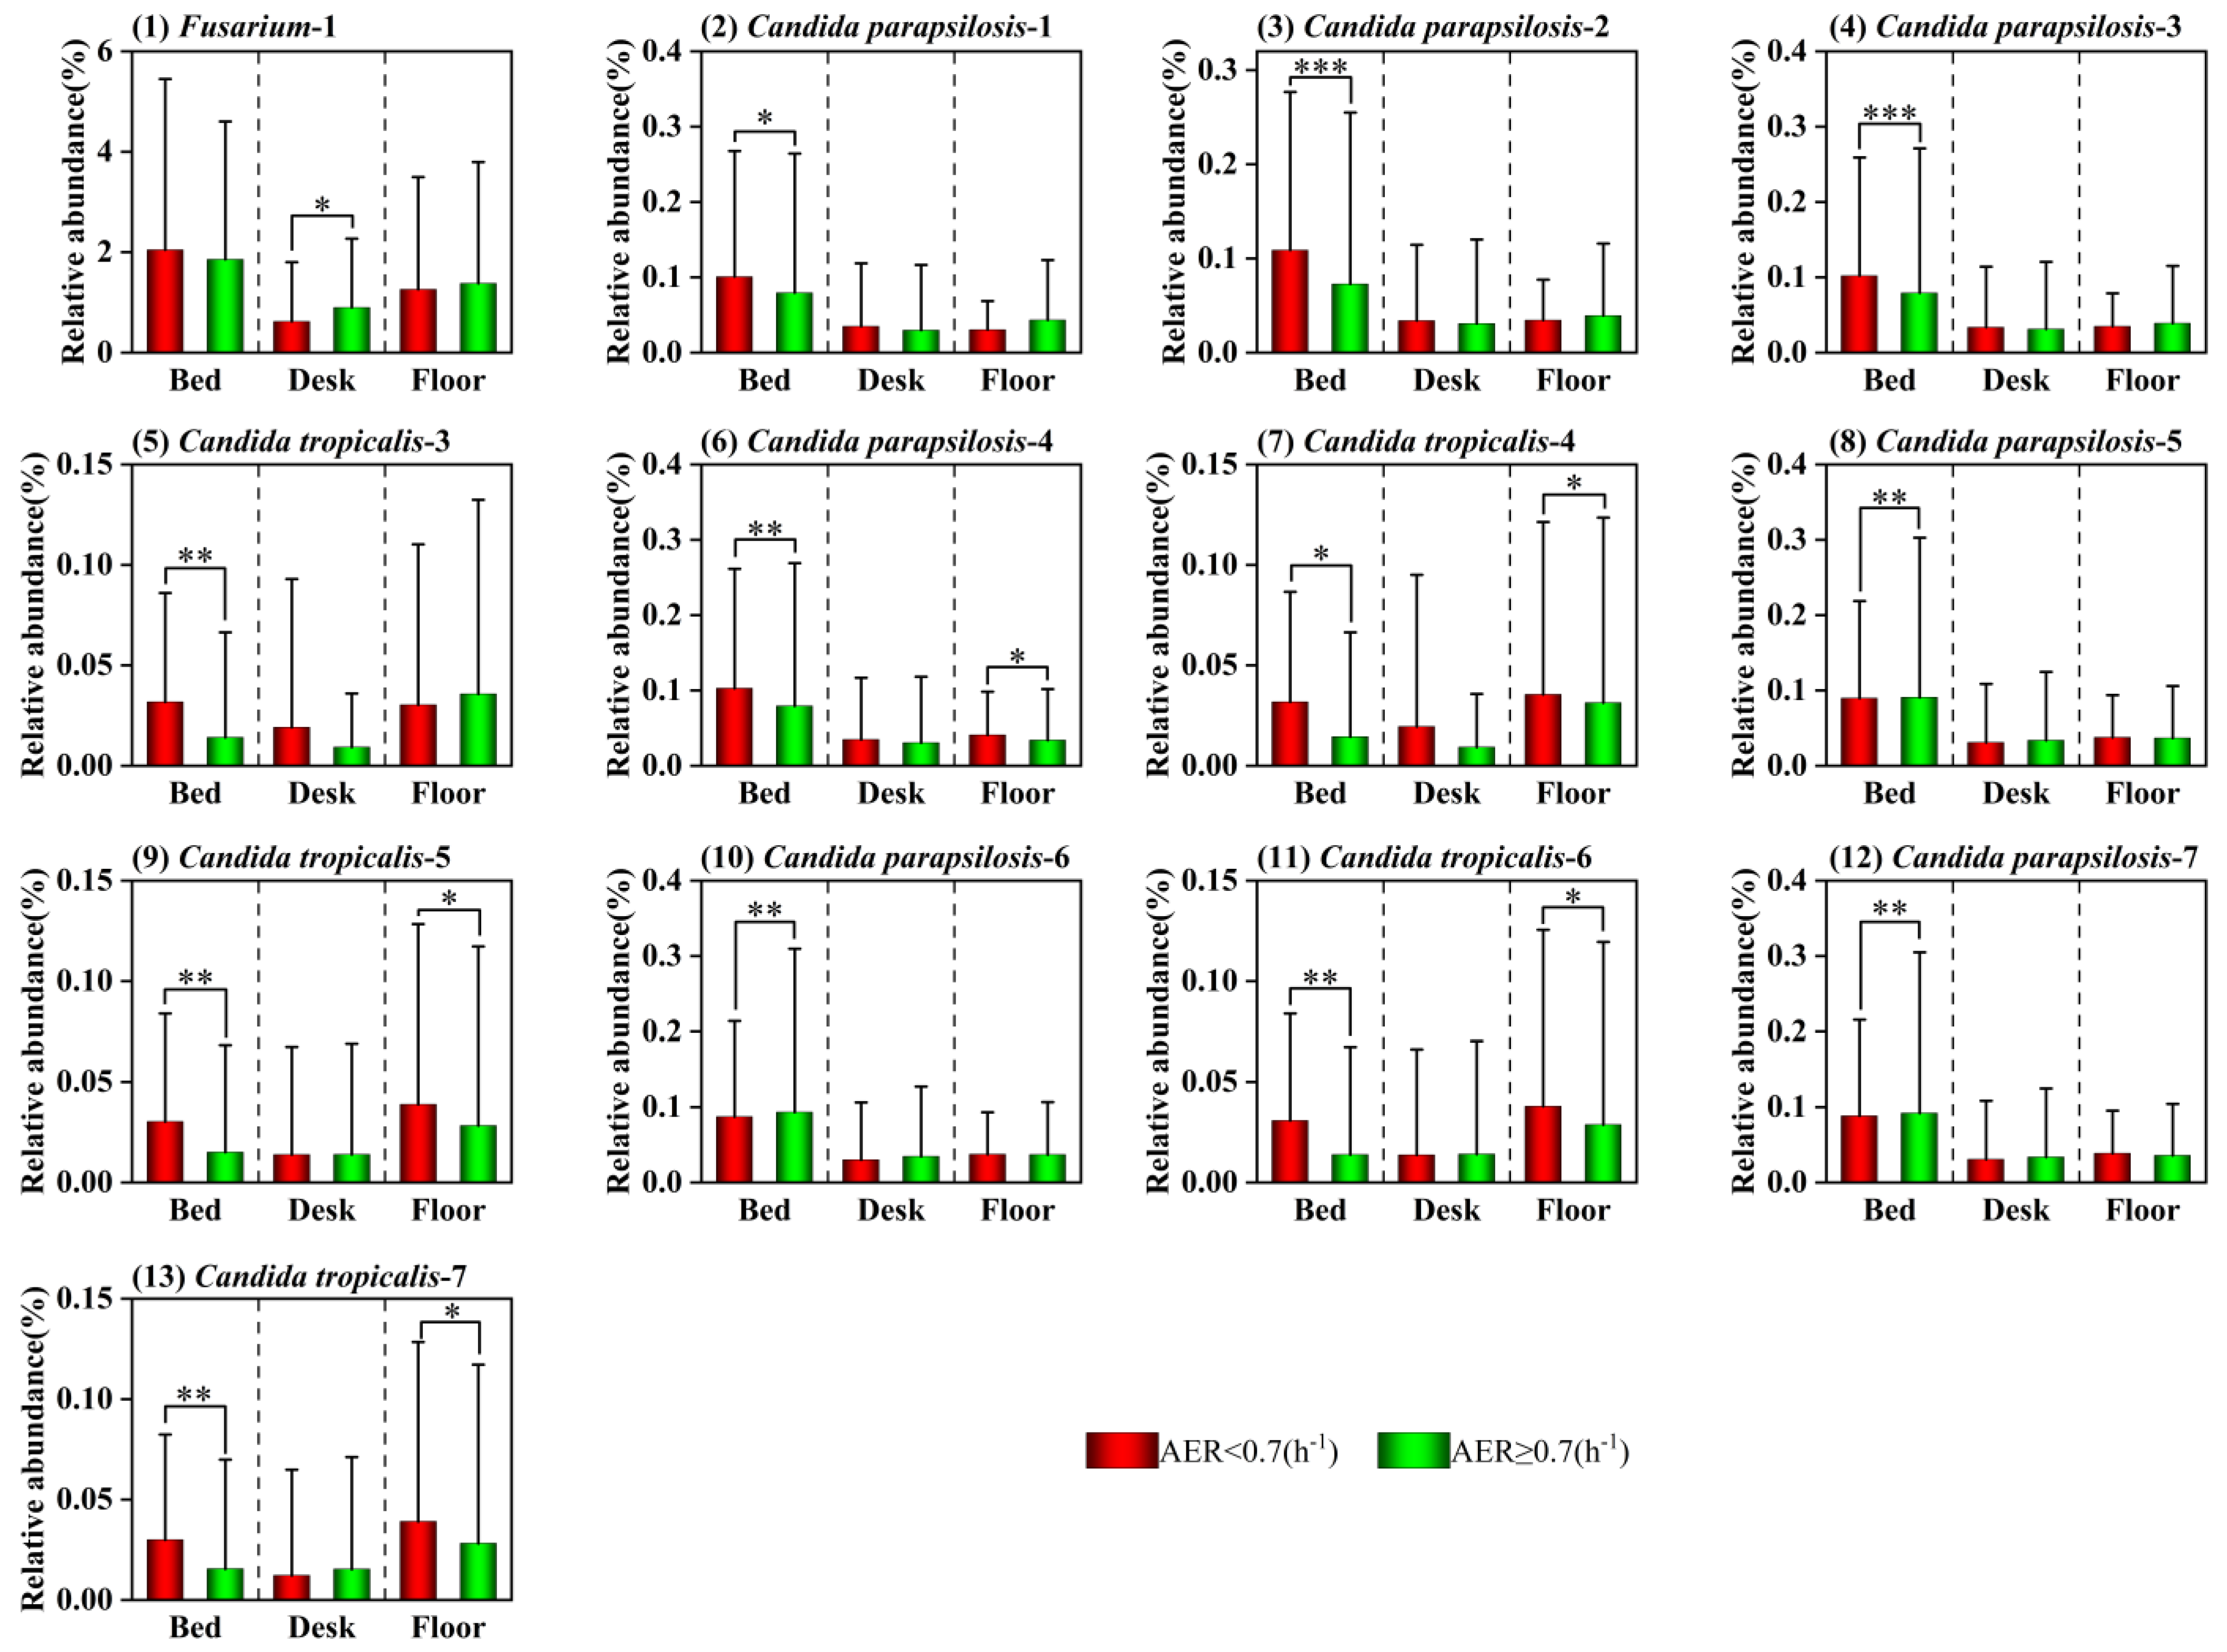
Figure 3 and Figure S3 show the differences in relative abundances of pathogens in the three sampling sites between non-compliant ventilated dormitories (AER < 0.7 h−1) and compliant ventilated dormitories (AER ≥ 0.7 h−1). Among the 10 target pathogens analyzed, statistically significant differences in relative abundances were observed only for specific pathogens, at specific locations, and for specific days before the dust sampling. For pathogenic bacteria, the relative abundance of Serratia was generally higher across beds, desks, and floors in the dormitories without compliant ventilation on 2–5 days prior to the dust sampling. The differences reached statistical significances among pathogenic bacteria from desk (2–4 days) and floor (4–5 days) dust samples. Conversely, the relative abundance of Salmonella in bed dust was significantly higher in the dormitories with compliant ventilation on six days before the dust sampling. Regarding pathogenic fungi, Acremonium and Fusarium in the desk dust exhibited a pattern of significantly higher relative abundance in the dormitories with compliant ventilation across multiple time periods (e.g., Acremonium for the first day and 3–7 days; Fusarium for the first day prior to dust sampling). In contrast, several Candida from bed surface dust, particularly Candida parapsilosis and Candida tropicalis, showed significantly lower relative abundance in the dormitories with compliant ventilation across multiple periods (e.g., Candida parapsilosis for 1–4 days; Candida tropicalis for 3–7 days). A similar relationship was observed for Candida tropicalis in floor dust samples (4–7 days). However, the relative abundance of Pichia kudriavzevii in floor dust samples was significantly lower in the dormitories with compliant ventilation from 5 to 7 days before sampling.
In the logistic regression analyses, five pathogens exhibited statistically significant associations with cumulative AER at specific locations (Table 3, Supplemental Table S2). The association of cumulative ventilation with the pathogen detection rate varied significantly across species and sampling locations. Among the pathogenic bacteria, the detection rate of Serratia in bed dust significantly decreased with increasing cumulative AER over the 5 days preceding sampling. Conversely, the detection rate of Salmonella in bed dust significantly increased with higher AERs. For the pathogenic fungi, the detection rate of Candida parapsilosis in bed dust showed a significantly negative associations with cumulative AER across all 1–7 days before dust sampling, whereas its detection possibility on desks exhibited a positive association with cumulative AERs. Meanwhile, Candida tropicalis showed negative associations in both bed and floor dusts. The detection rate of Fusarium in bed dust was negatively associated with the AER in the first day before dust sampling.
In the multivariable generalized linear regression analyses (Table 4, Supplemental Table S3), the association of cumulative AER on the relative abundances of pathogens also exhibited significant species and spatial specificity, and temporal gradient effects were demonstrated for some pathogens.
Among the pathogenic bacteria, the relative abundance of Salmonella in bed dust showed a significant positive association with cumulative AERs. The regression coefficient (β) progressively increased with longer time windows (from 0.27 for the first day to 0.33 for 7 days). Conversely, the relative abundance of Enterobacter in desk dust was significantly and negatively associated with the cumulative AER, and this negative association strengthened as the time window extended.
The temporal cumulative effect was more prevalent among the pathogenic fungi (Table 4, Supplemental Table S3). The relative abundance of Candida tropicalis on bed dust showed a significant negative association with cumulative AER on 3–7 days prior to the dust sampling. Similarly, the strength of the negative association (absolute β value) for Candida glabrata in bed dust increased significantly from 1 to 3 days. Fusarium abundance in bed and desk dust also displayed a similar pattern, and its negative associations with cumulative AER emerged from 4 days and intensified over time.

4. Discussion

This study systematically evaluated the associations of indoor cumulative ventilation with WHO priority pathogens in settled dust of university dormitories. The principal findings indicate that the modulatory associations of the indoor nighttime ventilation with both the relative abundances and detection rates of pathogens are not merely inhibitory or promotive but rather exhibits a complex pattern highly dependent on the species type, sampling location, and cumulative ventilation days.
Our study revealed a distinct spatial specificity in the distribution of WHO priority pathogens in the dormitory floor, desk, and bed settled dusts, a pattern likely shaped by the combined influence of surface functions and human activities. For instance, Serratia and Enterobacter exhibited their highest detection rates on floors. This aligns with findings by Liu et al., who reported Serratia marcescens as a dominant pathogen on residential kitchen surfaces [54], suggesting that high-frequency contact surfaces are prone to microbial contamination. For the fungal communities, the widespread presences of Fusarium and Acremonium are consistent with studies detecting these genera in air conditioning filters [55] and in dormitory wall surface samples [56]. However, Fan et al. reported detection rates exceeding 50% for Cladosporium, Aspergillus, and Penicillium in residential dust, while Fusarium was not detected [57]. This notable discrepancy in fungal composition compared to our findings may be attributed to inherent differences between residential and dormitory environments. The high detection rates of Candida species, such as Candida parapsilosis, in bed dust further underscore the role of direct human contact in shaping this intimate micro-environment. Compared to clinical or older residential settings [58,59,60,61,62], our newly constructed dormitories lacked widespread detection of critical pathogens (e.g., Mycobacterium tuberculosis or Aspergillus fumigatus). As a possible explanation, this distinctive, lower-risk microbial profile likely stems from the healthier, homogeneous student population and reduced colonization risks associated with the newer building.
In evaluating the associations of cumulative ventilation before the sampling with pathogen presences, the species and spatial specificity associations suggest that indoor sustained ventilation may modulate the settlement and retention of human-associated microbiota on bed (near-body) surfaces [63]. Recent evidence aligns with this observation: natural ventilation actively reduces indoor pathogen prevalence [48], whereas elevated CO2 correlates positively with airborne rhinovirus bioaerosols [64]. These findings collectively reinforce the crucial role of ventilation in modulating microbial exposure.
Our results indicate that generally stronger and more stable associations were observed in bed dust compared to floors or desks. We attribute this discrepancy to the distinct functional and physical layouts of these surfaces: the bed environment is relatively static and experiences prolonged human occupancy during sleeping hours. In contrast, the microbial community on desks and floors is likely dominated by frequent, transient activities and mechanical disturbances that may mask the baseline effects of ventilation. This masking effect of disturbances also explains why short-term window opening often fails to significantly alter the overall microbial community [19].
Our results demonstrated that the cumulative AER exhibited contrasting association patterns with different pathogens. Specifically, the relative abundances of Candida tropicalis, Candida glabrata, and Enterobacter showed stable negative associations with longer-term cumulative AERs. This underscores that single-day or short-duration ventilation is often insufficient, whereas sustained cumulative ventilation provides substantial mitigation, aligning with previous findings [22,44]. Since Candida spp. are closely associated with human shedding [65], continuous fresh air exchange can persistently lower the local indoor temperature and relative humidity, thereby disrupting the micro-climatic conditions necessary for their survival and proliferation [66,67]. Similarly, the inhibition of Enterobacter is consistent with the established role of ventilation in restricting specific bacterial growth [68]. In addition, our data revealed that the relative abundance of Salmonella on beds and desks, as well as Candida albicans on floors, increased following higher cumulative AERs. First, although speculative, while introducing fresh air, increased ventilation may concurrently facilitate the continuous ingress of outdoor-origin microorganisms into the dormitory. Other field measurements indirectly support this hypothesis, showing that enhanced natural ventilation elevates both outdoor-origin bacteria [69] and indoor fungal diversity [70]. Second, instead of direct outdoor introduction, enhanced ventilation might drive the mechanical resuspension of previously settled dust [71], subsequently re-depositing it onto high-exposure surfaces like beds and desks.
Although this study systematically revealed the cumulative inhibitory associations and spatial specificity of ventilation with some pathogens, the observed statistically significant correlation coefficients between AER and specific pathogens (e.g., ρ ranging from −0.25 to 0.20 in Figure 2 and Figure S2) are crucially relatively weak. Ventilation levels assessed based on single-day or shorter time windows were not a primary driver of their distribution. This finding aligns with the conclusion drawn by Liu et al. from residential dust, where ventilation showed weak associations with pathogens [62]. Furthermore, the relative abundance of pathogens in settled dust is simultaneously driven by stochastic occupant shedding, surface cleaning frequency, and background microclimate [32,66,72,73]. The emergence of these weak but stable correlations underscores that cumulative ventilation exerts a consistent modulatory baseline association amidst a highly noisy environmental background. Consequently, viewing ventilation as a universal microbial control measure is unrealistic. It must be integrated with comprehensive strategies such as source control and regular cleaning, consistent with the assertion by Gilkeson et al. [40].
Several limitations should be acknowledged in this study. First, the estimation of ventilation rates relied on the CO2 concentration step-up method to derive air exchange rates (AERs) during nighttime. Specifically, settled dust accumulates continuously over 24 h, whereas our AER data strictly reflects nighttime ventilation conditions. Second, direct measurement of airflow velocity or ventilation pathways was not conducted, which may introduce some degree of error. Third, the reliance on relative abundance data from sequencing is a critical limitation; observed microbial shifts reflect proportional changes rather than absolute quantitative variations in pathogen biomass. Fourth, the absence of concurrent outdoor microbial air sampling restricts our ability to definitively trace pathogen sources. Lastly, although potential confounders such as indoor air temperature, relative humidity, and lifestyle habits were controlled, the inherent complexity of microbial communities might still influence a fully comprehensive interpretation. Furthermore, while this study observed opposing associations of ventilation with different pathogens, it could not precisely trace their specific sources (e.g., whether originating from indoor or outdoor environments). This limitation restricts a more mechanistic interpretation of the bidirectional associations of ventilation. Concurrently, the study focused solely on a subset of species from the WHO priority pathogen lists and did not encompass all potential pathogenic microorganisms. Future research could integrate more precise ventilation monitoring techniques, simultaneous indoor and outdoor microbial sampling, metagenomic functional analysis, and longitudinal study designs to more comprehensively elucidate the sources and regulatory mechanisms of ventilation on indoor microbial pollution risks.

5. Conclusions

This study elucidates the associations of cumulative indoor natural ventilation with the distribution of WHO priority pathogens in settled dust from dormitory beds, desks, and floors. We found that increased air exchange rates (AERs) correlated with lower relative abundance and detection possibility of specific Candida species (e.g., Candida tropicalis and Candida glabrata) on bed and floor surfaces. Conversely, the relative abundances of certain pathogens, such as Salmonella, correlated positively with higher AERs. Because these contrasting patterns reflect complex environmental associations rather than direct causation, ventilation should not be viewed as a universal pathogen-control strategy. Instead, its modulatory role is highly species-specific and surface-specific. Therefore, precision dormitory management requires integrating sustained daily ventilation with regular surface cleaning and near-body source control (e.g., frequent laundering of bed linens). Finally, future studies should incorporate concurrent outdoor microbial sampling and precise source tracking to comprehensively elucidate the origins and transmission pathways of indoor pathogens.

Supplementary Materials

The following supporting information can be downloaded at https://www.mdpi.com/article/10.3390/microorganisms14071521/s1. Figure S1: The nighttime air exchange rate (AER) during 1–7 days before sampling in different seasons; Figure S2: The correlations of relative abundances of pathogenic bacterial genera, fungal genera, and fungal species in the floor and desk dusts with nighttime air exchange rates (AERs) in the cumulative 1–7 days prior to dust sampling; Figure S3: Differential analysis of relative abundances of additional pathogenic bacteria and fungi at different sampling sites (bed, desk, floor) between air exchange rate (AER) groups (<0.7 h−1 vs. ≥0.7 h−1). The number suffix after each microbial taxon (e.g., “_1” to “_7”) indicates the day prior to sampling for which the AER was assessed. * p < 0.05, ** p < 0.01, *** p < 0.001; Table S1: Characteristics of occupants’ habits in the studied dormitories; Table S2: The associations between air exchange rates (AERs) during the cumulative 1–7 days before dust sampling and pathogenic bacteria and fungi in the multivariate logistic regression analyses; Table S3: The significant associations between air exchange rate and relative abundances of pathogenic bacteria and fungi in the multivariable generalized linear regression analyses.

Author Contributions

W.L. (Wei Liu): Writing—review & editing, Conceptualization, Methodology, Supervision, Funding acquisition, Resources. W.L. (Wangjin Lai): Writing—original draft, Methodology, Validation. Y.Z.: Methodology, Writing—review & editing. J.D.: Writing—review & editing. Y.C.: Writing—review & editing. Z.L.: Writing—review & editing. N.Z.: Resources. J.C.: Writing—review & editing, Conceptualization, Methodology, Supervision, Funding acquisition, Resources. All authors have read and agreed to the published version of the manuscript.

Funding

This study is financially supported by the Science and Technology Project of the Chongqing Housing and Urban Rural Construction Commission (2024-21); the National Natural Science Foundation of China (52478078); New Chongqing Youth Innovation Talent Project (CSTB2025YITP-QCRCX0023) Natural Science Foundation of Chongqing, China (CSTB2025NSCQ-LZX0108); and the Innovation Program Project for Master’s Degree Students of Chongqing University of Science and Technology (YKJCX2520720).

Institutional Review Board Statement

Ethical review and approval were waived for this study by the Ethics Committee of Chongqing University of Science and Technology, because the questionnaire strictly involved non-sensitive, observational queries regarding daily cleaning habits and routine dormitory environmental characteristics, posing no psychological or physiological risks to the participants.

Informed Consent Statement

Informed consent was obtained from all subjects involved in the study.

Data Availability Statement

The original data of 16s rRNA gene sequencing have been deposited in NCBI under accession number PRJNA1393291 and PRJNA1393299.

Conflicts of Interest

The authors declare no conflicts of interest.

References

  1. Gilbert, J.A.; Hartmann, E.M. The indoors microbiome and human health. Nat. Rev. Microbiol. 2024, 22, 742–755. [Google Scholar] [CrossRef] [Scilit] [PubMed]
  2. Klepeis, N.E.; Nelson, W.C.; Ott, W.R.; Robinson, J.P.; Tsang, A.M.; Switzer, P.; Behar, J.V.; Hern, S.C.; Engelmann, W.H. The National Human Activity Pattern Survey (NHAPS): A resource for assessing exposure to environmental pollutants. J. Expo. Sci. Environ. Epidemiol. 2001, 11, 231–252. [Google Scholar] [CrossRef] [Scilit] [PubMed]
  3. Fujiyoshi, S.; Tanaka, D.; Maruyama, F. Transmission of Airborne Bacteria across Built Environments and Its Measurement Standards: A Review. Front. Microbiol. 2017, 8, 2336. [Google Scholar] [CrossRef] [Scilit] [PubMed]
  4. Humbal, C.; Gautam, S.; Trivedi, U. A review on recent progress in observations, and health effects of bioaerosols. Environ. Int. 2018, 118, 189–193. [Google Scholar] [CrossRef] [Scilit] [PubMed]
  5. Walser, S.M.; Gerstner, D.G.; Brenner, B.; Bünger, J.; Eikmann, T.; Janssen, B.; Kolb, S.; Kolk, A.; Nowak, D.; Raulf, M.; et al. Evaluation of exposure-response relationships for health effects of microbial bioaerosols—A systematic review. Int. J. Hyg. Environ. Health 2015, 218, 577–589. [Google Scholar] [CrossRef] [Scilit] [PubMed]
  6. Gu, Y.; Zhuang, W.; Zhong, K.; Yang, Z. Dwelling features and occupants’ behaviours as predictors of airborne fungi contamination levels in overcrowded dormitories: A case study in Shanghai, China. Indoor Built Environ. 2025, 34, 1348–1365. [Google Scholar] [CrossRef] [Scilit]
  7. Cowling, B.J.; Ip, D.K.M.; Fang, V.J.; Suntarattiwong, P.; Olsen, S.J.; Levy, J.; Uyeki, T.M.; Leung, G.M.; Peiris, J.S.M.; Chotpitayasunondh, T.; et al. Aerosol transmission is an important mode of influenza A virus spread. Nat. Commun. 2013, 4, 1935. [Google Scholar] [CrossRef] [Scilit] [PubMed]
  8. Morawska, L.; Cao, J. Airborne transmission of SARS-CoV-2: The world should face the reality. Environ. Int. 2020, 139, 105730. [Google Scholar] [CrossRef] [Scilit] [PubMed]
  9. Tellier, R.; Li, Y.; Cowling, B.J.; Tang, J.W. Recognition of aerosol transmission of infectious agents: A commentary. BMC Infect. Dis. 2019, 19, 101. [Google Scholar] [CrossRef] [Scilit] [PubMed]
  10. Zhao, Y.; Xiong, M.; Huang, Y.; Ho, K.-F.; Cao, J.; Cui, L. A review of airborne microorganism transmission and control in household indoor air. Particuology 2025, 97, 143–153. [Google Scholar] [CrossRef] [Scilit]
  11. Dannemiller, K.C.; Conrad, L.A.; Haines, S.R.; Huang, Y.J.; Marr, L.C.; Siegel, J.A.; Hassan, S.; King, J.C.; Prussin, A.J., II; Shamblin, A.; et al. Indoor bioaerosols and asthma: Overview, implications, and mitigation strategies. J. Allergy Clin. Immunol. 2025, 155, 714–725. [Google Scholar] [CrossRef] [Scilit] [PubMed]
  12. Burki, T. WHO publish fungal priority pathogens list. Lancet Microbe 2023, 4, E74. [Google Scholar] [CrossRef] [Scilit] [PubMed]
  13. Satin, H.; Carraran, E.; Savoldi, A.; Hansen, P.; Garlasco, J.; Campagnaro, E.; Boccia, S.; Castillo-Polo, J.A.; Magrini, E.; Garcia-Vello, P.; et al. The WHO Bacterial Priority Pathogens List 2024: A prioritisation study to guide research, development, and public health strategies against antimicrobial resistance. Lancet Infect. Dis. 2025, 25, 1033–1043. [Google Scholar] [CrossRef] [Scilit] [PubMed]
  14. Fu, X.; Li, Y.; Meng, Y.; Yuan, Q.; Zhang, Z.; Norbäck, D.; Deng, Y.; Zhang, X.; Sun, Y. Associations between respiratory infections and bacterial microbiome in student dormitories in Northern China. Indoor Air 2020, 30, 816–826. [Google Scholar] [CrossRef] [Scilit] [PubMed]
  15. Zhao, R.; Guo, L.; Qi, J.H.; An, T.C. Indoor and outdoor bioaerosol distributions and concentration profiles during different seasons and pollution events in Qingdao city. Build. Environ. 2025, 279, 113056. [Google Scholar] [CrossRef] [Scilit]
  16. Wu, Y.; Li, X.; Zhao, S.; Wang, Q.; Wang, S.; Yu, L.; Wang, F. Evaluation of Air Quality and Thermal Comfort in University Dormitories in China. Atmosphere 2024, 15, 586. [Google Scholar] [CrossRef] [Scilit]
  17. Hu, Y.B.; Xu, L.; Liang, W.H. A preliminary study on volatile organic compounds and odor in university dormitories: Situation, contribution, and correlation. Build. Simul. 2023, 16, 379–391. [Google Scholar] [CrossRef] [Scilit]
  18. Zhang, N.B.; Kang, Y.M.; Zhong, K.; Liu, J.P. Indoor environmental quality of high occupancy dormitory buildings in winter in Shanghai, China. Indoor Built Environ. 2016, 25, 712–722. [Google Scholar] [CrossRef] [Scilit]
  19. Núñez, A.; García, A.M. Effect of the passive natural ventilation on the bioaerosol in a small room. Build. Environ. 2022, 207, 108438. [Google Scholar] [CrossRef] [Scilit]
  20. Wang, J.-X.; Cao, X.; Chen, Y.-P. An air distribution optimization of hospital wards for minimizing cross-infection. J. Clean. Prod. 2021, 279, 123431. [Google Scholar] [CrossRef] [Scilit] [PubMed]
  21. Park, J.; Lee, K.S.; Park, H. Optimized mechanism for fast removal of infectious pathogen-laden aerosols in the negative-pressure unit. J. Hazard. Mater. 2022, 435, 128978. [Google Scholar] [CrossRef] [Scilit] [PubMed]
  22. Xiong, J.; Yang, J.; Wu, D.; Zhang, Y.; Yang, C.; Yin, H.; Hou, Y.; Guo, J.; Hu, Z.; Li, A. Removal of culturable airborne bacteria and fungi by natural ventilation in greenhouse environments across three growth stages. Build. Environ. 2025, 284, 113499. [Google Scholar] [CrossRef] [Scilit]
  23. Zhang, Y.; Shen, F.; Yang, Y.; Niu, M.; Chen, D.; Chen, L.; Wang, S.; Zheng, Y.; Sun, Y.; Zhou, F.; et al. Insights into the Profile of the Human Expiratory Microbiota and Its Associations with Indoor Microbiotas. Environ. Sci. Technol. 2022, 56, 6282–6293. [Google Scholar] [CrossRef] [Scilit] [PubMed]
  24. Liu, Z.; Li, C.; Hu, C.; Rong, R.; Shi, Y.; Dong, Z.; Ye, C.; Zhang, C. Wind tunnel experiments on bioaerosol dispersion and exposure risk assessment in wastewater treatment plants under natural ventilation. Build. Environ. 2025, 269, 112420. [Google Scholar] [CrossRef] [Scilit]
  25. Li, T.; Liu, Y.; Di, B.; Wang, M.; Shen, J.; Zhang, Y.; Chen, X.; Yuan, J.; Wu, J.; Li, K.; et al. Epidemiological investigation of an outbreak of pandemic influenza A (H1N1) 2009 in a boarding school: Serological analysis of 1570 cases. J. Clin. Virol. 2011, 50, 235–239. [Google Scholar] [CrossRef] [Scilit] [PubMed]
  26. Li, C.; Tang, H. Study on ventilation rates and assessment of infection risks of COVID-19 in an outpatient building. J. Build. Eng. 2021, 42, 103090. [Google Scholar] [CrossRef] [Scilit] [PubMed]
  27. Hou, J.; Zhang, Y.; Sun, Y.; Wang, P.; Zhang, Q.; Kong, X.; Sundell, J. Air change rates at night in northeast Chinese homes. Build. Environ. 2018, 132, 273–281. [Google Scholar] [CrossRef] [Scilit]
  28. Sun, Y.; Zhang, Y.; Bao, L.; Fan, Z.; Wang, D.; Sundell, J. Effects of gender and dormitory environment on sick building syndrome symptoms among college students in Tianjin, China. Build. Environ. 2013, 68, 134–139. [Google Scholar] [CrossRef] [Scilit]
  29. Yang, X.; Zhang, J.; Cheng, Y.; Weng, X.; Yin, R.; Guo, L.; Cheng, Z. A Method to Optimize Dormitory Environments Based on Personnel Behavior Regulation. Buildings 2024, 14, 2111. [Google Scholar] [CrossRef] [Scilit]
  30. Yang, F.; Sun, Y.; Wang, P.; Weschler, L.B.; Sundell, J. Spread of respiratory infections in student dormitories in China. Sci. Total Environ. 2021, 777, 145983. [Google Scholar] [CrossRef] [Scilit] [PubMed]
  31. Zhang, W.; Wang, L.; Ji, Z.; Ma, L.; Hui, Y. Test on Ventilation Rates of Dormitories and Offices in University by the CO2 Tracer Gas Method. Procedia Eng. 2015, 121, 662–666. [Google Scholar] [CrossRef] [Scilit]
  32. Wang, X.; Liu, W.; Huang, C.; Cai, J.; Shen, L.; Zou, Z.; Lu, R.; Chang, J.; Wei, X.; Sun, C. Associations of dwelling characteristics, home dampness, and lifestyle behaviors with indoor airborne culturable fungi: On-site inspection in 454 Shanghai residences. Build. Environ. 2016, 102, 159–166. [Google Scholar] [CrossRef] [Scilit]
  33. Baker, D.; Henderson, J. Differences between infants and adults in the social aetiology of wheeze. The ALSPAC Study Team. Avon Longitudinal Study of Pregnancy and Childhood. J. Epidemiol. Community Health 1999, 53, 636–642. [Google Scholar] [CrossRef] [Scilit] [PubMed]
  34. Reponen, T.; Levin, L.; Zheng, S.; Vesper, S.; Ryan, P.; Grinshpun, S.A.; LeMasters, G. Family and home characteristics correlate with mold in homes. Environ. Res. 2013, 124, 67–70. [Google Scholar] [CrossRef] [Scilit] [PubMed]
  35. Marasinghe, S.A.; Sun, Y.; Norback, D.; Adikari, A.M.P.; Mlambo, J. Indoor environment in Sri Lankan university dormitories: Associations with ocular, nasal, throat and dermal symptoms, headache, and fatigue among students. Build. Environ. 2024, 251, 111194. [Google Scholar] [CrossRef] [Scilit]
  36. Sun, Y.; Zhang, Y.; Sundell, J.; Fan, Z.; Bao, L. Dampness in dorm rooms and its associations with allergy and airways infections among college students in China: A cross-sectional study. Indoor Air 2009, 19, 348–356. [Google Scholar] [CrossRef] [Scilit] [PubMed]
  37. Gold, T.L.; McPhaul, K.M.; Lin, H.; Doughty, R.; Berry, I.M.; Hong, F.; Lai, J.; Treangen, T.J.; Srebric, J.; Milton, D.K. Impact of Ventilation on Respiratory Virus Transmission in College Residence Hall Cohorts: Potential for Causal Inference About Mode of Transmission. Influenza Other Respir. Viruses 2025, 19, e70133. [Google Scholar] [CrossRef] [Scilit] [PubMed]
  38. Sun, Y.; Wang, Z.; Zhang, Y.; Sundell, J. In China, Students in Crowded Dormitories with a Low Ventilation Rate Have More Common Colds: Evidence for Airborne Transmission. PLoS ONE 2011, 6, e27140. [Google Scholar] [CrossRef] [Scilit] [PubMed]
  39. Shengwei, Z.; Sara, J.; Kofi, A.; Mohammad, H.; Sebastian, A.R.; Avery, L.; Joshua, E.; Daniel, D.; Nicholas, W.M.; Filbert, H.; et al. Ventilation and laboratory confirmed acute respiratory infection (ARI) rates in college residence halls in College Park, Maryland. Environ. Int. 2020, 137, 105537. [Google Scholar] [CrossRef] [Scilit] [PubMed]
  40. Gilkeson, C.A.; Camargo-Valero, M.A.; Pickin, L.E.; Noakes, C.J. Measurement of ventilation and airborne infection risk in large naturally ventilated hospital wards. Build. Environ. 2013, 65, 35–48. [Google Scholar] [CrossRef] [Scilit]
  41. Rosario, K.; Fierer, N.; Miller, S.; Luongo, J.; Breitbart, M. Diversity of DNA and RNA Viruses in Indoor Air As Assessed via Metagenomic Sequencing. Environ. Sci. Technol. 2018, 52, 1014–1027. [Google Scholar] [CrossRef] [Scilit] [PubMed]
  42. Zhang, T.; Liu, M.; Zhou, D.; Ma, Z.; Chen, L.; Wu, D.; Diao, H.; Wang, W.; Li, D.; Zhen, Q. Environmental factors and particle size shape the community structure of airborne total and pathogenic bacteria in a university campus. Front. Public Health 2024, 12, 1371656. [Google Scholar] [CrossRef] [Scilit] [PubMed]
  43. Li, J.; Cheng, Z.; Zhang, Y.; Mao, N.; Guo, S.; Wang, Q.; Zhao, L.; Long, E. Evaluation of Infection Risk for SARS-CoV-2 Transmission on University Campuses. Sci. Technol. Built Environ. 2021, 27, 1165–1180. [Google Scholar] [CrossRef] [Scilit]
  44. Guo, X.; Wu, P.; Ding, W.; Zhang, W.; Li, L. Reduction and characterization of bioaerosols in a wastewater treatment station via ventilation. J. Environ. Sci. 2014, 26, 1575–1583. [Google Scholar] [CrossRef] [Scilit] [PubMed]
  45. Sundell, J.; Levin, H.; Nazaroff, W.; Cain, W.; Fisk, W.; Grimsrud, D.; Gyntelberg, F.; Li, Y.; Persily, A.; Pickering, A.; et al. Ventilation rates and health: Multidisciplinary review of the scientific literature. Indoor Air 2011, 21, 191–204. [Google Scholar] [CrossRef] [Scilit] [PubMed]
  46. Dimitroulopoulou, C.; Bartzis, J. Ventilation rates in European office buildings: A review. Indoor Built Environ. 2014, 23, 5–25. [Google Scholar] [CrossRef] [Scilit]
  47. Šantl-Temkiv, T.; Sikoparija, B.; Maki, T.; Carotenuto, F.; Amato, P.; Yao, M.; Morris, C.E.; Schnell, R.; Jaenicke, R.; Huffman, J.A.; et al. Bioaerosol field measurements: Challenges and perspectives in outdoor studies. Aerosol Sci. Technol. 2020, 54, 520–546. [Google Scholar] [CrossRef] [Scilit]
  48. Raymenants, J.; Geenen, C.; Budts, L.; Thibaut, J.; Thijssen, M.; Mulder, H.D.; Gorissen, S.; Craessaerts, B.; Laenen, L.; Beuselinck, K.; et al. Indoor air surveillance and factors associated with respiratory pathogen detection in community settings in Belgium. Nat. Commun. 2023, 1, 1332. [Google Scholar] [CrossRef] [Scilit] [PubMed]
  49. Adams, R.I.; Bhangar, S.; Dannemiller, K.C.; Eisen, J.A.; Fierer, N.; Gilbert, J.A.; Green, J.L.; Marr, L.C.; Miller, S.L.; Siegel, J.A.; et al. Ten questions concerning the microbiomes of buildings. Build. Environ. 2016, 109, 224–234. [Google Scholar] [CrossRef] [Scilit]
  50. Liang, W.; Qiu, X. Comparative analysis of CO2 tracer gas methods for the measurement of air change rates in student dormitory rooms with open/closed window statuses. Energy Build. 2023, 296, 113363. [Google Scholar] [CrossRef] [Scilit]
  51. GB/T 18883-2022; Standard for Indoor Air Quality. China Standards Press: Beijing, China, 2022.
  52. Liu, C.; Zhao, D.; Ma, W.; Guo, Y.; Wang, A.; Wang, Q.; Lee, D. Denitrifying sulfide removal process on high-salinity wastewaters in the presence of Halomonas sp. Appl. Microbiol. Biotechnol. 2016, 100, 1421–1426. [Google Scholar] [CrossRef] [Scilit] [PubMed]
  53. Adams, R.I.; Miletto, M.; Taylor, J.W.; Bruns, T.D. Dispersal in microbes: Fungi in indoor air are dominated by outdoor air and show dispersal limitation at short distances. ISME J. 2013, 7, 1262–1273, Erratum in ISME J. 2013, 7, 1460. https://doi.org/10.1038/ismej.2013.84. [Google Scholar] [CrossRef] [Scilit] [PubMed]
  54. Liu, H.; Ma, T.; Liu, Z.; Li, Q.; Shen, B.; Xin, J.; Feng, C.; Liu, M.; Liu, L. Quantitative risk assessment for bacterial community in residential kitchens. Build. Environ. 2023, 228, 109841. [Google Scholar] [CrossRef] [Scilit]
  55. Jarma, D.; Maestre, J.P.; Sanchez, J.; Brodfuehrer, S.; Katz, L.E.; Horner, S.; Kinney, K.A. Participant-collected household dust for assessing microorganisms and semi-volatile organic compounds in urban homes. Sci. Total Environ. 2024, 908, 168230. [Google Scholar] [CrossRef] [Scilit] [PubMed]
  56. Lai, Q.; Fu, T.; Huang, D.; Gao, S.; Liu, H.; Guimarães, A.S.; Feng, C. Mold severity and fungal communities in university dormitories: The role of building characteristics and living habits. Build. Environ. 2025, 280, 113176. [Google Scholar] [CrossRef] [Scilit]
  57. Fan, G.; Xie, J.; Yoshino, H.; Yanagi, U.; Zhang, H.; Li, Z.; Li, N.; Lv, Y.; Liu, J.; Zhu, S.; et al. Investigation of fungal contamination in urban houses with children in six major Chinese cities: Genus and concentration characteristics. Build. Environ. 2021, 205, 108229. [Google Scholar] [CrossRef] [Scilit]
  58. An, C.; Yamamoto, N. Fungal compositions and diversities on indoor surfaces with visible mold growths in residential buildings in the Seoul Capital Area of South Korea. Indoor Air 2016, 26, 714–723. [Google Scholar] [CrossRef] [Scilit] [PubMed]
  59. Jodelle, D.; Marc, V.; Patrick, P.; Benoit, L.; Daniel, A.; Boualem, O.; Mario, B.; François, M.; Caroline, D. Indoor air quality assessment in dwellings with different ventilation strategies in Nunavik and impacts on bacterial and fungal microbiota. Indoor Air 2021, 31, 2213–2225. [Google Scholar] [CrossRef] [Scilit] [PubMed]
  60. Rocchi, S.; Reboux, G.; Frossard, V.; Scherer, E.; Valot, B.; Laboissière, A.; Zaros, C.; Vacheyrou, M.; Gillet, F.; Roussel, S.; et al. Microbiological characterization of 3193 French dwellings of Elfe cohort children. Sci. Total Environ. 2015, 505, 1026–1035. [Google Scholar] [CrossRef] [Scilit] [PubMed]
  61. Liu, M.; Gan, Z.; Shen, B.; Liu, L.; Zeng, W.; Li, Q.; Liu, H. Occupants contribute to pathogens and probiotics in indoor environments. Build. Environ. 2022, 213, 108863. [Google Scholar] [CrossRef] [Scilit]
  62. Liu, M.; Shen, B.; Gan, Z.; Liu, J.; Li, Q.; Ma, T.; Wang, S.; Liu, L.; Feng, C.; Liu, H. Operation of air conditioners affects the microbial pathogenic potential in bedrooms: A metagenomics and culture-dependent study. Build. Environ. 2023, 239, 110335. [Google Scholar] [CrossRef] [Scilit]
  63. Zhou, Y.; Lai, Y.H.; Tong, X.Z.; Leung, M.H.Y.; Tong, J.C.K.; Ridley, I.A.; Lee, P.K.H. Airborne Bacteria in Outdoor Air and Air of Mechanically Ventilated Buildings at City Scale in Hong Kong across Seasons. Environ. Sci. Technol. 2020, 54, 11732–11743. [Google Scholar] [CrossRef] [Scilit] [PubMed]
  64. Myatt, T.A.; Johnston, S.L.; Zuo, Z.; Wand, M.; Kebadze, T.; Rudnick, S.; Milton, D.K. Detection of airborne rhinovirus and its relation to outdoor air supply in office environments. Am. J. Respir. Crit. Care Med. 2004, 169, 1187–1190. [Google Scholar] [CrossRef] [Scilit] [PubMed]
  65. Barber, C.; Crank, K.; Papp, K.; Innes, G.K.; Schmitz, B.W.; Chavez, J.; Rossi, A.; Gerrity, D. Community-Scale Wastewater Surveillance of Candida auris during an Ongoing Outbreak in Southern Nevada. Environ. Sci. Technol. 2023, 57, 1755–1763. [Google Scholar] [CrossRef] [Scilit] [PubMed]
  66. Wang, S.; Qian, H.; Sun, Z.; Cao, G.; Ding, P.; Zheng, X. Comparison of airborne bacteria and fungi in different built environments in selected cities in five climate zones of China. Sci. Total Environ. 2023, 860, 160445. [Google Scholar] [CrossRef] [Scilit] [PubMed]
  67. Dallongeville, A.; Le Cann, P.; Zmirou-Navier, D.; Chevrier, C.; Costet, N.; Annesi-Maesano, I.; Blanchard, O. Concentration and determinants of molds and allergens in indoor air and house dust of French dwellings. Sci. Total Environ. 2015, 536, 964–972. [Google Scholar] [CrossRef] [Scilit] [PubMed]
  68. Qiu, Y.; Zhou, Y.; Chang, Y.; Liang, X.; Zhang, H.; Lin, X.; Qing, K.; Zhou, X.; Luo, Z. The Effects of Ventilation, Humidity, and Temperature on Bacterial Growth and Bacterial Genera Distribution. Int. J. Environ. Res. Public Health 2022, 19, 15345. [Google Scholar] [CrossRef] [Scilit] [PubMed]
  69. Liu, M.; Shen, B.; Liu, L.; Li, Q.; Mao, W.; Gan, Z.; Liu, H. Source tracing the bedroom bacteria across different climate zones in China during the heating season. Build. Environ. 2024, 259, 111651. [Google Scholar] [CrossRef] [Scilit]
  70. Yuan, C.; Wang, X.; Pecoraro, L. Environmental Factors Shaping the Diversity and Spatial-Temporal Distribution of Indoor and Outdoor Culturable Airborne Fungal Communities in Tianjin University Campus, Tianjin, China. Front. Microbiol. 2022, 13, 928921. [Google Scholar] [CrossRef] [Scilit] [PubMed]
  71. Kim, M.Y.; Jung, Y.G.; Park, J.C.; Yang, Y.K. The impact of airflow and air purification on the resuspension and removal of deposited particulate matter. J. Build. Eng. 2021, 41, 102367. [Google Scholar] [CrossRef] [Scilit]
  72. Fan, L.; Wang, J.; Yang, Y.; Yang, W.; Zhu, Y.; Zhang, Y.; Li, L.; Li, X.; Yan, X.; Yao, X.; et al. Residential airborne culturable fungi under general living scenario: On-site investigation in 12 typical cities, China. Environ. Int. 2021, 155, 106669. [Google Scholar] [CrossRef] [Scilit] [PubMed]
  73. Weikl, F.; Tischer, C.; Probst, A.J.; Heinrich, J.; Markevych, I.; Jochner, S.; Pritsch, K. Fungal and Bacterial Communities in Indoor Dust Follow Different Environmental Determinants. PLoS ONE 2016, 11, e0154131. [Google Scholar] [CrossRef] [Scilit] [PubMed]
Figure 1. Schematic diagram of the university dormitories and measuring point distribution.
Microorganisms 14 01521 g001
Figure 2. The correlations of relative abundances of pathogenic bacterial genera, fungal genera, and fungal species in the bed dust with nighttime air exchange rates (AERs) in the cumulative 1–7 days prior to dust sampling.
Microorganisms 14 01521 g002
Figure 3. Differential analysis of relative abundances of representative key pathogenic bacteria and fungi at different sampling sites (bed, desk, floor) between air exchange rate (AER) groups (<0.7 h−1 vs. ≥0.7 h−1). The number suffix after each microbial taxon (e.g., “−1” to “−7”) indicates the day prior to sampling for which the AER was assessed. * p < 0.05, ** p < 0.01, *** p < 0.001.
Microorganisms 14 01521 g003
Table 1. The nighttime air exchange rates (AERs) and compliance rates in different periods.
PeriodMean ± SD, (h−1)Compliance (AER ≥ 0.7 h−1) Rate, %
SpringSummerAutumnWinterAll
1 day before sampling day1.28 ± 1.6458.341.766.741.752.1
2 days before sampling day1.23 ± 1.5866.741.737.533.344.8
3 days before sampling day1.27 ± 1.5969.438.936.130.643.8
4 days before sampling day1.22 ± 1.5766.737.537.531.343.2
5 days before sampling day1.26 ± 1.6165.036.738.338.344.6
6 days before sampling day1.26 ± 1.5665.336.140.340.345.5
7 days before sampling day1.27 ± 1.5465.538.140.542.946.7
SD, standard deviation.
Table 2. Detection rates of pathogenic bacterial genera, fungal genera, and fungal species.
GradeDetection Rate, %
BedDeskFloor
Bacteria (genus)
Serratia 119.727.852.9
Enterobacter 18.419.323.0
Salmonella 26.721.413.9
Morganella11.11.12.7
Proteus11.73.74.8
Citrobacter10.00.00.5
Fungi (genus)
Fusarium 297.794.599.5
Acremonium 293.892.396.3
Choanephora20.60.00.0
Rhizopus20.00.50.0
Lichtheimia20.00.50.0
Madurella20.00.00.5
Scedosporium30.61.11.1
Fungi (species)
Candida albicans 18.52.26.4
Candida parapsilosis 268.849.771.7
Candida tropicalis 244.923.555.1
Candida glabrata 26.31.64.3
Pichia kudriavzevii 36.812.68.0
Talaromyces marneffei30.60.00.0
Note: Grade indicates the hazard classification levels for respective bacterial genera and fungal taxa (genera/species) in the WHO priority pathogen list; the bold pathogens were included in the following association analyses.
Table 3. The significant associations between air exchange rates (AERs) during the cumulative 1–7 days before dust sampling and pathogenic bacteria and fungi.
Odds Ratio (Detected vs. Undetected)
1 Day2 Days3 Days4 Days5 Days6 Days7 Days
SerratiaBed 0.65 *
SalmonellaBed1.42 *1.60 *1.81 *1.73 *
Desk 1.61 **1.65 **1.64 **1.47 *1.48 *1.48 *
Floor1.29 *
FusariumBed0.56 *
Candida parapsilosisBed0.80 *0.76 *0.67 **0.69 *0.70 *0.69 *0.70 *
Desk 1.44 *1.47 *1.41 *1.47 *1.44 *
Candida tropicalisBed 0.69 *0.67 *0.64 **0.65 **0.64 **
Floor 0.73 *0.66 **0.64 **0.59 **0.60 **0.61 **
Note: * p < 0.05, ** p < 0.01; models were adjusted for indoor air temperature, relative humidity, and lifestyle habits.
Table 4. The significant associations between air exchange rates and relative abundances of pathogenic bacteria and fungi in the multivariable generalized linear regression analyses.
Regression Coefficient, β
1 Day2 Days3 Days4 Days5 Days6 Days7 Days
Enterobacterbed −0.33 *−0.35 **−0.33 **−0.34 **−0.30 *
desk −0.38 *−0.41 *−0.49 **−0.55 **
Serratiadesk −0.54 *−0.89 ***−0.60 *−0.61 *
floor −0.36 *
Salmonellabed0.27 **0.30 *0.34 *0.34 *0.32 *0.33 *0.33 *
Acremoniumbed0.05 *
Fusariumbed −0.18 *−0.23 **−0.26 **−0.29 **
desk −0.20 *−0.20 *−0.23 *−0.24 *
Candida albicansbed 1.23 ***
desk 0.28 *
floor 0.16 * 0.15 *0.14 *0.17 *
Candida tropicalisbed −0.42 **−0.46 **−0.48 **−0.49 **−0.50 **
floor −0.54 **−0.68 ***−0.69 ***−0.70 ***
Candida glabratabed−0.31 ***−0.49 ***−0.64 ***−0.54 ***−0.52 ***−0.52 ***−0.53 ***
floor −0.28 *−0.37 **−0.36 *−0.33 *−0.32 *−0.32 *
Pichia kudriavzeviifloor −0.25 *
Note: * p < 0.05, ** p < 0.01, *** p < 0.001; models were adjusted for indoor air temperature, relative humidity, and lifestyle habits.
Disclaimer/Publisher’s Note: The statements, opinions and data contained in all publications are solely those of the individual author(s) and contributor(s) and not of MDPI and/or the editor(s). MDPI and/or the editor(s) disclaim responsibility for any injury to people or property resulting from any ideas, methods, instructions or products referred to in the content.