Article

Six-Year Biochar Experiment Reduces Soil N2O Emissions in Eucalyptus Plantations: Associations with Microbial N-Cycle Genes
1
College of Environmental Science and Engineering, Guilin University of Technology, Guilin 541000, China
2
Guangxi Key Laboratory of Plant Conservation and Restoration Ecology in Karst Terrain, Guangxi Institute of Botany, Guangxi Zhuang Autonomous Region and Chinese Academy of Sciences, Guilin 541000, China
3
Guangxi Key Laboratory of Functional Phytochemicals and Sustainable Utilization, Guangxi Institute of Botany, Guangxi Zhuang Autonomous Region and Chinese Academy of Sciences, Guilin 541000, China
4
Guangxi Guilin Urban Ecosystem Observation and Research Station, Guilin 541000, China
5
College of Life Sciences, Guangxi Normal University, Guilin 541000, China
*
Authors to whom correspondence should be addressed.
Microorganisms 2026, 14(7), 1519; https://doi.org/10.3390/microorganisms14071519
Submission received: 1 June 2026 / Revised: 1 July 2026 / Accepted: 8 July 2026 / Published: 12 July 2026
(This article belongs to the Special Issue Soil Microbial Carbon/Nitrogen/Phosphorus Cycling: 2nd Edition)

Abstract

Nitrous oxide (N2O) is a major greenhouse gas, and terrestrial ecosystems are among the primary sources of its emissions. Biochar is recognized as an effective soil amendment for mitigating N2O emissions, but its long-term residual effects and microbial mechanisms in subtropical plantations remain unclear. Therefore, this study evaluated the residual effects of Eucalyptus-derived biochar on soil N2O emissions six years after a single application and explored associations with nitrogen cycle functional genes. A field experiment was conducted in a Eucalyptus plantation in northern Guangxi with biochar applied at six rates (0–6% w/w). Soil N2O fluxes were measured in the fifth and sixth years (2022–2023); soil chemical parameters, soil enzyme activities, and N2O-related microbial functional genes (amoA, nirK, nirS and nosZ) abundance were analyzed. Biochar application significantly reduced ammonium nitrogen content but enhanced nitrate nitrogen content. Urease, protease, and sucrase activities increased, while nitrate reductase, nitrite reductase, and hydroxylamine reductase activities decreased. Furthermore, quantitative analysis revealed substantial variations in functional gene abundances. The abundance of ammonia-oxidizing archaea (AOA-amoA) exhibited a unimodal response, whereas ammonia-oxidizing bacteria (AOB-amoA) showed a robust dose-dependent accumulation. Notably, annual N2O emissions were suppressed by up to 35.2%, driven by a 3.4-fold increase in nosZ gene abundance and a significant reduction in the (nirK + nirS)/nosZ ratio. This mitigation was attributed to enhanced N2O consumption by nosZ-harboring denitrifiers and reduced heterotrophic ammonia oxidation. Overall, these findings highlight the pivotal role of long-term organic amendments in steering nitrogen transformation pathways, providing a theoretical basis for sustainable soil management in subtropical plantations.

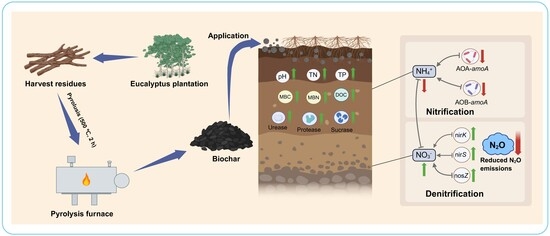
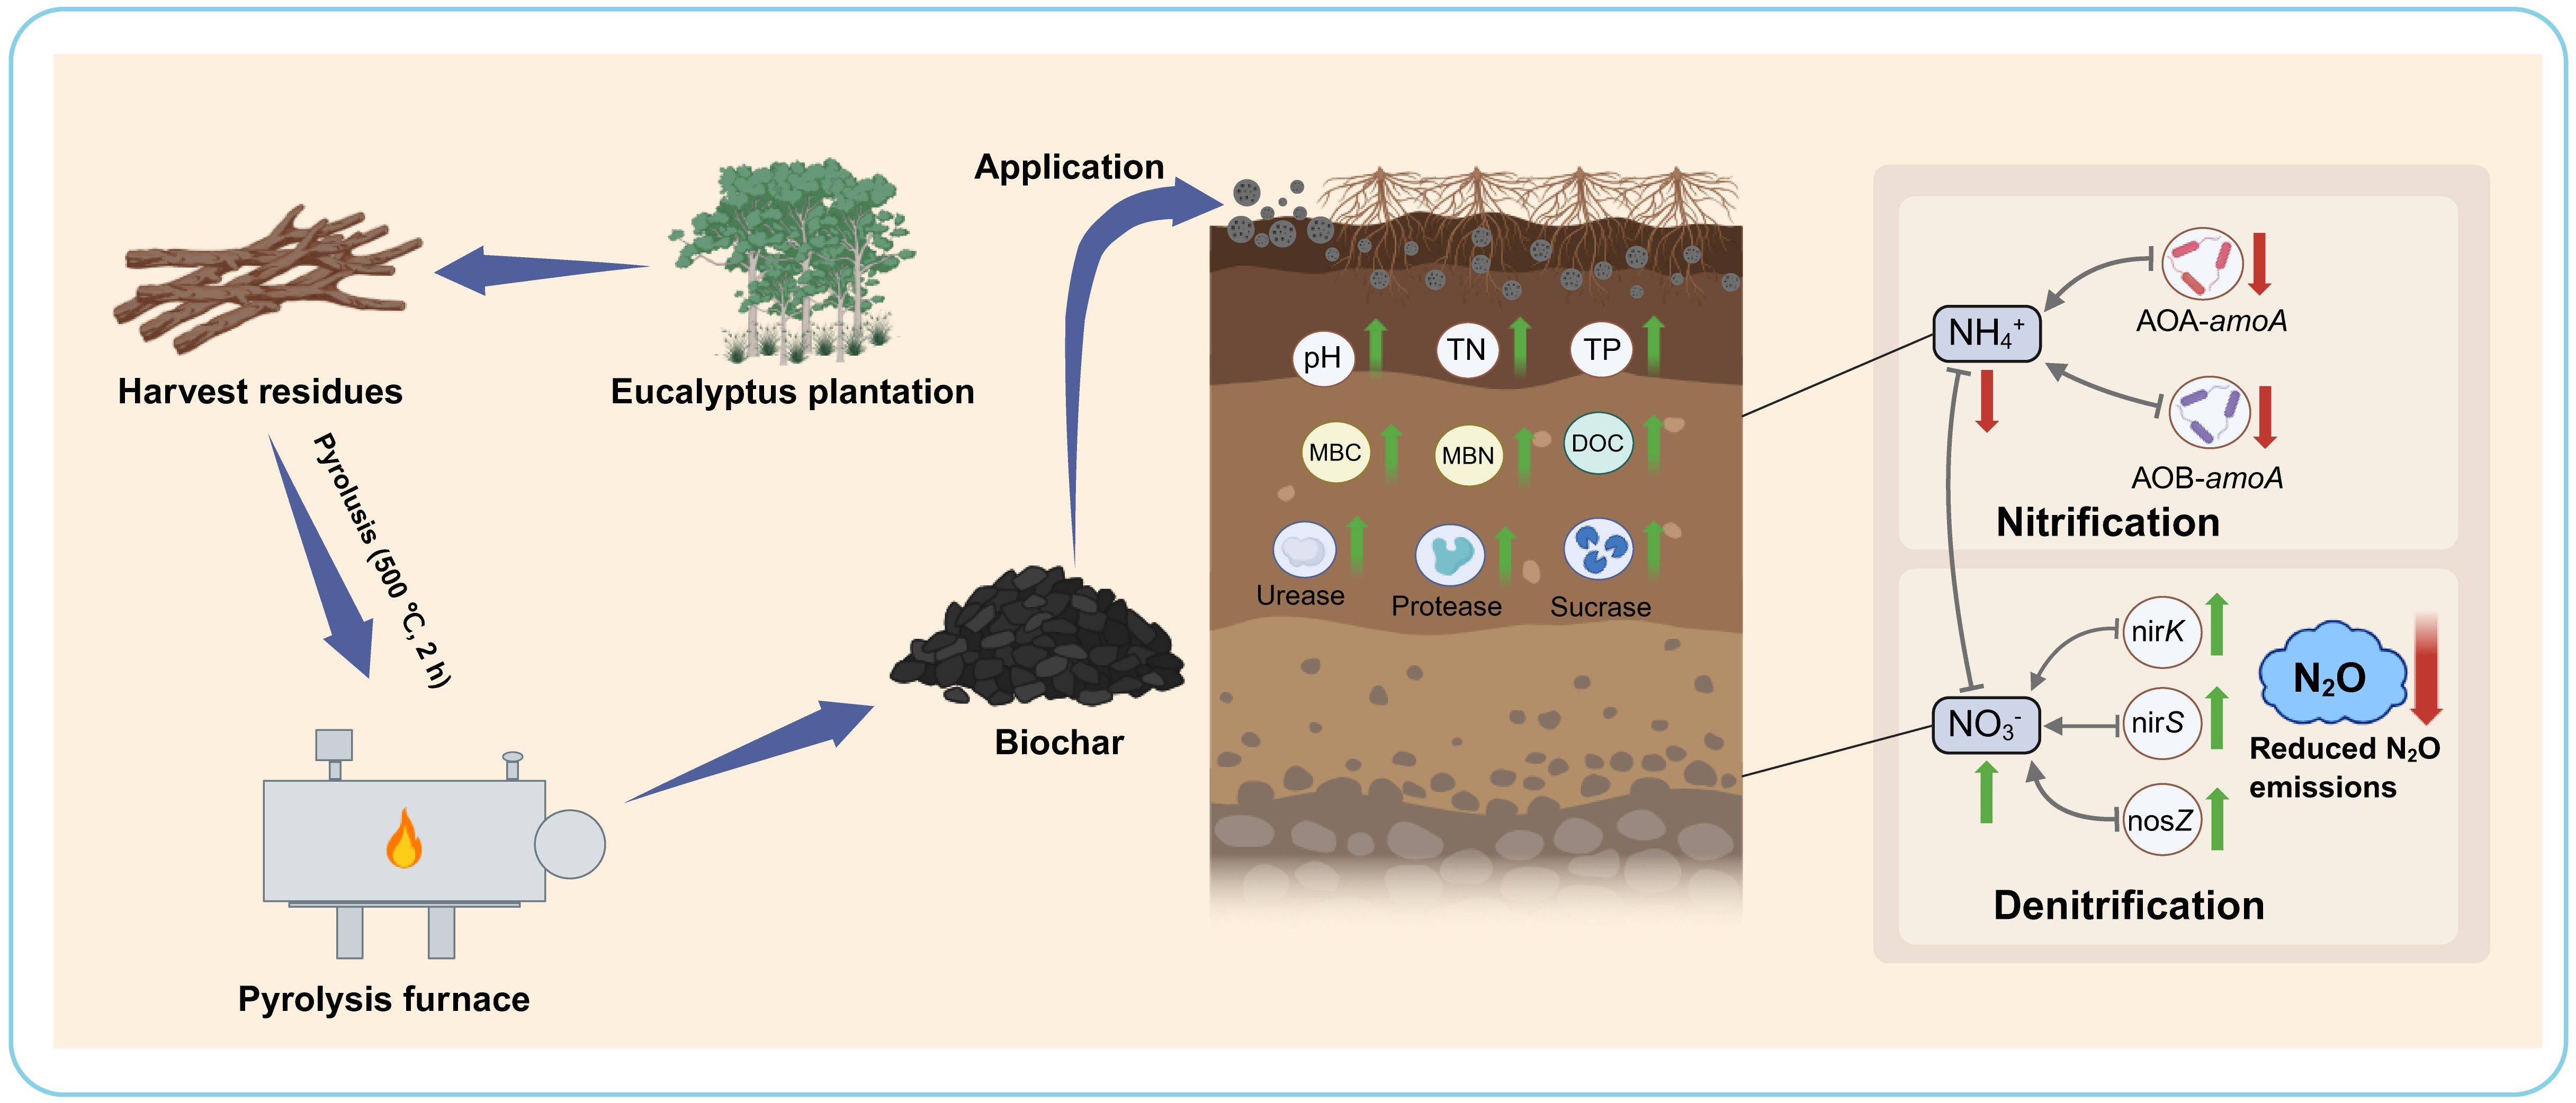
Graphical Abstract

1. Introduction

Greenhouse gases, such as carbon dioxide (CO2), methane (CH4), and nitrous oxide (N2O), increase Earth’s surface temperature by enhancing the greenhouse effect [1]. N2O is one of the major greenhouse gases with a retention period of approximately 114 years in the atmosphere, indicating persistence in the environment for a long time [2]. Although N2O accounts for only about 0.03% of total greenhouse gas emissions, its global warming potential is approximately 265 times that of CO2 [3]. Since industrialization, the concentration of N2O in the atmosphere has increased by more than 20%, leading to ozone depletion, ecosystem imbalances, and intensified greenhouse effects. These changes and its impact on global climate change have attracted much attention [4]. Atmospheric N2O concentrations, which are primarily driven by anthropogenic activities, are rising continuously [5]. According to the recent high-resolution projections building on the global N2O budget, these anthropogenic emissions are rising at an accelerating pace, necessitating more robust mitigation frameworks including stricter N policies [6].
More than two-thirds of terrestrial N2O emissions are driven by microbial nitrification and denitrification pathways mediated by soil bacteria and fungi, which are primarily driven by the excessive use of nitrogen fertilizers [7]. The nitrification process in soil is primarily regulated by ammonia-oxidizing archaea (AOA) and ammonia-oxidizing bacteria (AOB), which typically exhibit distinct niche differentiation and adaptive thresholds under varying substrate availability [8].
In addition, the functional genes nirK, nirS, and nosZ play crucial roles in the denitrification process [9], with the (nirK + nirS)/nosZ ratio serving as a key proxy for net N2O reduction efficiency. Therefore, exploring the interrelationships among soil physical and chemical properties; enzyme activities; AOA and AOB abundance or functions; and the genes nirK, nirS, and nosZ is essential. Research on the biological mechanisms underlying soil N2O emissions is crucial for addressing global climate change. Biochar, recognized for its cost-effectiveness, stability, and environmental remediation potential, has emerged as a promising soil amendment material. In recent years, it has been extensively used for soil remediation purposes [10]. Studies have demonstrated that biochar can significantly reduce N2O emissions in some agricultural and forest soils [11]. However, other studies have reported highly variable effects, ranging from no significant net reduction [12,13] to even increased emissions under specific conditions [14]. Most of these studies were conducted over short periods (typically <1 year) or under indoor cultivation conditions. Given that short-term experiments often fail to account for critical long-term processes such as biochar aging effects and the accumulation of soil organic matter, there is a lack of validation through long-term field trials of biochar application, particularly regarding how biochar continuously regulates microbial functional groups over extended temporal scales. The influence of biochar on soil N2O emissions depends on various factors, such as biochar type, experimental duration, soil characteristics, and vegetation type. Therefore, the long-term effects of biochar application on N2O emissions still require further investigation [15].
Eucalyptus is widely distributed in the subtropical regions of China and is one of the important afforestation tree species in China [16]. It plays an indispensable role in ecological restoration, increases forest coverage, and enhances wood processing [17]. However, short rotation cycles and intensive management practices have caused ecological problems, such as reductions in soil fertility, soil acidification, and alterations in soil microbial community structure. These changes, especially the imbalances within nitrogen cycling microbial networks, may contribute to increased N2O emissions from Eucalyptus plantations [18,19,20,21].
However, knowledge regarding the residual effects of a single biochar application on soil N2O emissions over extended temporal scales in subtropical Eucalyptus plantations remains scarce. To address this gap, this study leveraged a six-year in situ field experiment conducted in a Eucalyptus plantation in northern Guangxi to investigate the residual effects of a single Eucalyptus-derived biochar application on soil N2O emissions. It is hypothesized that biochar reduces soil N2O emissions through dual mechanisms involving soil chemical improvement and microbial reconfiguration. The specific objectives were as follows: (1) to evaluate the long-term effects of biochar on soil properties; (2) to quantify the residual mitigation of soil N2O emissions six years after a single biochar application; and (3) to elucidate the microbial mechanisms underlying these changes.

2. Materials and Methods

2.1. Sampling Area and Experimental Setup

The study area was situated in the state-owned Huangmian Forest Farm (24°37′25″–24°52′11″ N, 109°43′46″–109°58′18″ E) at the junction of Luzhai County (Liuzhou City) and Yongfu County (Guilin City) in Guangxi. This region is characterized by a subtropical climate with an annual average temperature of 19 °C and rainfall of 1750–2000 mm, primarily concentrated between April and August. The forest farm is characterized by low mountains and hills and predominantly contains red soil and mountain yellow–red soil. The physicochemical properties of the soils are shown in Table S1 in the Supplementary Materials.
This study was an extension of an in situ biochar application experiment established in March 2017 in a Eucalyptus plantation [22,23]. Biochar was produced from Eucalyptus branches collected from the forest farm and surrounding areas via pyrolysis at 500 °C for 2 h under anaerobic conditions (Jining Dehanqi Mechanical Engineering Technology Co., Ltd., Jining, China). The basic properties of the biochar are presented in Table S2 in the Supplementary Materials. The prepared biochar was then milled and screened to a 2 mm sieve to ensure homogeneous particle dimensions. The experimental plots were selected from a typical Eucalyptus plantation with similar parent materials, altitudes, and relatively gentle topographies. Biochar was applied following the protocols outlined by [24,25], with application rates controlled based on the mass percentage of biochar to dry soil weight. Biochar application ratios comprised six treatments: CK (0%), T1 (0.5%), T2 (1.0%), T3 (2%), T4 (4%), and T5 (6%). Each treatment contained three replicates, making a total of 18 plots of 8 m × 8 m each, with 1 m buffer zones between adjacent plots. The 18 plots were arranged in a randomized complete block design with three blocks. Blocks were established to account for topographic variation across the site, and each treatment was randomly assigned to one plot within each block. Prior to application, all the plots were ploughed to a depth of 30 cm, and biochar was thoroughly mixed into the tilled soil at the designated ratios in a single application. The control plots were tilled similarly without the addition of biochar. No additional fertilizer was applied during the experiment, and biochar was applied only once to observe its long-term effects.

2.2. Sample Collection

Soil samples were collected from the Eucalyptus plantation in northern Guangxi in March 2023. Five representative sampling points per plot were selected following an S-shaped sampling design. Soil samples were collected from the surface layer (0–10 cm) using a stainless steel corer. Immediately after collection, the samples were placed in sterile polyethylene bags, stored in a sealed ice container, and transported to the laboratory without delay. Upon arrival at the laboratory, samples were stored at 4 °C and −20 °C in a dedicated refrigerator until further analysis. Each sample was subsequently divided into two subsamples: fresh sample for microbial community analysis and air-dried sample for physicochemical characterization. Soil surface temperature, soil water content, and pH were continuously monitored from January 2022 to December 2023, corresponding to the fifth and sixth years after a single biochar application.

2.3. Soil Physicochemical Property Analysis

Soil surface temperature (ST) and soil water content (SWC) were measured in situ using a portable three-parameter probe (TDR-350, Jinkai Co., Ltd., Nanjing, China). Soil pH data was measured in the field using an IQ-150 in situ pH meter (IQ Inc., Walnut, CA, USA). Soil organic carbon (SOC) was determined via wet oxidation using a total carbon analyzer (Shimadzu TOC-5000A, Kyoto, Japan), and total nitrogen (TN) was determined via dry combustion using an elemental analyzer (Vario EL III, Elementar, Langenselbold, Germany). Total phosphorus (TP) was determined after digestion with concentrated H2SO4–HClO4, followed by colorimetric analysis using the molybdenum–antimony (Mo–Sb) method with a UV–Vis spectrophotometer (Agilent, CA, USA). Total potassium (TK) was determined using flame photometry following H2SO4–HClO4 digestion. Available nitrogen (AN) was determined using the alkaline hydrolysis–diffusion method; available phosphorus (AP) was extracted with 0.5 mol L−1 NaHCO3 and determined using the Mo–Sb method; available potassium (AK) was determined using flame photometry [26]. Nitrate (NO3–N) and ammonium (NH4+–N) were extracted with 2 mol L−1 KCl and determined using a continuous flow analyzer (SAN++8505, Skalar Analytical B.V., Breda, Netherlands). Soil microbial biomass carbon (MBC) and nitrogen (MBN) were determined using the chloroform fumigation–extraction method [27]. Dissolved organic carbon (DOC) and dissolved organic nitrogen (DON) were extracted with 0.5 mol L−1 K2SO4 and determined using a total organic carbon analyzer (Multi N/C 3100, Analytik Jena, Jena, Germany).

2.4. Measurements of Soil Enzyme Activity

Urease (UR) activity was determined using the sodium phenolate colorimetric method, protease (PRO) activity using ninhydrin colorimetry, and sucrase (SUC) activity using the 3,5-dinitrosalicylic acid (DNS) method [28]. Nitrate reductase (NR) activity was determined colorimetrically at 520 nm by measuring nitrite production, and nitrite reductase (NiR) activity was determined by monitoring nitrite consumption using the benzenesulfonic acid–acetic acid–1-naphthylamine method. Hydroxylamine reductase (HyR) activity was determined colorimetrically at 510 nm using the ammonium ferric sulfate–1,10-phenanthroline method. These enzymes were selected because they represent key steps in soil N transformation directly coupled to N2O production and consumption. UR and PRO convert organic N to NH4+, supplying substrates for nitrification. SUC reflects overall microbial activity and C turnover, influencing denitrifier metabolism. NR, NiR, and HyR are directly involved in denitrification and hydroxylamine reduction, a key nitrification intermediate.

2.5. Quantification of Soil Total Nitrification Rate, Denitrification Rate, and Related Gene Abundance

Total nitrification and denitrification rates were determined using the barometric process separation technique [29]. The abundances of nitrification-related genes (AOA–amoA and AOB–amoA) and denitrification-related genes (nirK, nirS, and nosZ) were determined via quantitative real-time PCR (qPCR) using SYBR Green chemistry on a CFX96 Real-Time PCR Detection System (Bio-Rad, Hercules, CA, USA). The quantitative PCR amplification reaction mixture consisted of 20 μL, comprising 10 μL SYBR Green, 0.2 μL Rox Dye II, 1 μL DNA template, 0.4 μL each of upstream and downstream primers (10 μM), and 8.0 μL sterile water. The experimental samples were sent to Shanghai Meiji Biomedical Technology Co., Ltd., Shanghai, China for bacterial DNA extraction, PCR amplification, gene library construction, and double-end sequencing.

2.6. Measurement of N2O Flux

Soil N2O fluxes were measured from January 2022 to December 2023, corresponding to the fifth and sixth years after a single biochar application. The soil N2O flux was determined using static headspace gas chromatography. A headspace incubation period of 30 min was employed, with a sampling container consisting of a 100 mL medical syringe equipped with a three-way valve. Approximately 100 mL of gas sample was collected while simultaneously recording the sampling time, chamber temperature, ambient air temperature, soil surface temperature, and temperature at a depth of 5 cm below the soil surface. Subsequently, samples were collected every 10 min; thus, each sampling chamber yielded four gas samples at 0, 10, 20, and 30 min after incubation. The collected gas samples were transported to the laboratory and injected into the injector of a gas chromatograph (HP 6890) for analysis of the target concentrations of the analytes. The annual cumulative flux was calculated by multiplying the average flux from two consecutive sampling periods by the interval between them and summing the results. The static chamber–gas chromatography method was used [30].
The N2O flux was calculated as follows:
N 2 O = ρ · V A · c t = ρ · H · c t
where N2O flux is the N2O emission flux (μg m−2 h−1); ρ is the gas density within the chamber (kg m−3); Δc is the change in gas mixing ratio (ppbv) during chamber closure; Δt is the time interval (h) over which the concentration change occurs; A, V, and H are the basal area (m2), volume (m3), and height (m) of the static chamber, respectively.

2.7. Statistical Analysis

Data were initially processed using Microsoft Excel 2024 (Microsoft Corp., Redmond, WA, USA). Pearson correlation analysis and one-way analysis of variance (ANOVA) were conducted using SPSS version 24.0 (IBM Corp., Armonk, NY, USA) with a significance level of α = 0.05. The hierarchical clustering heatmap was generated using R software (v.4.2.2) package “pheatmap” (v.1.0.12) through Hiplot Pro (https://hiplot.com.cn/). The primary factors influencing soil N2O emissions were identified and evaluated using structural equation modeling (SEM) in R software. All figures and tables were generated using Origin 2022 (OriginLab Corp., Northampton, MA, USA). Figure layouts were further refined and typeset using Adobe Illustrator 2024 (Adobe Inc., San Jose, CA, USA).

3. Results

3.1. Changes in Soil Temperature, Soil Water Content, and pH

Biochar application significantly modulated soil physicochemical properties for two consecutive growing seasons, most parameters exhibiting a clear dose-dependent trend (Table 1). Compared to the CK, ST showed a consistent but moderate increase, increasing by 0.47 °C in 2022 and 0.84 °C in 2023 under T5. SWC increased by 4.12 percentage points in 2022 and 4.97 percentage points in 2023 under T5. Furthermore, biochar application increased soil pH by 1.79 units in 2022 and 1.67 units in 2023 under T5. The monthly variations in these soil properties during the monitoring period are further detailed in Figure S1 in the Supplementary Materials. These results for 2022 and 2023, coupled with the highly significant differences (p < 0.01) observed for nearly all treatments, underscore the effects of biochar on soil thermal properties, water retention, and alkalinity.

3.2. Changes in Soil Nutrient and Carbon and Nitrogen Contents

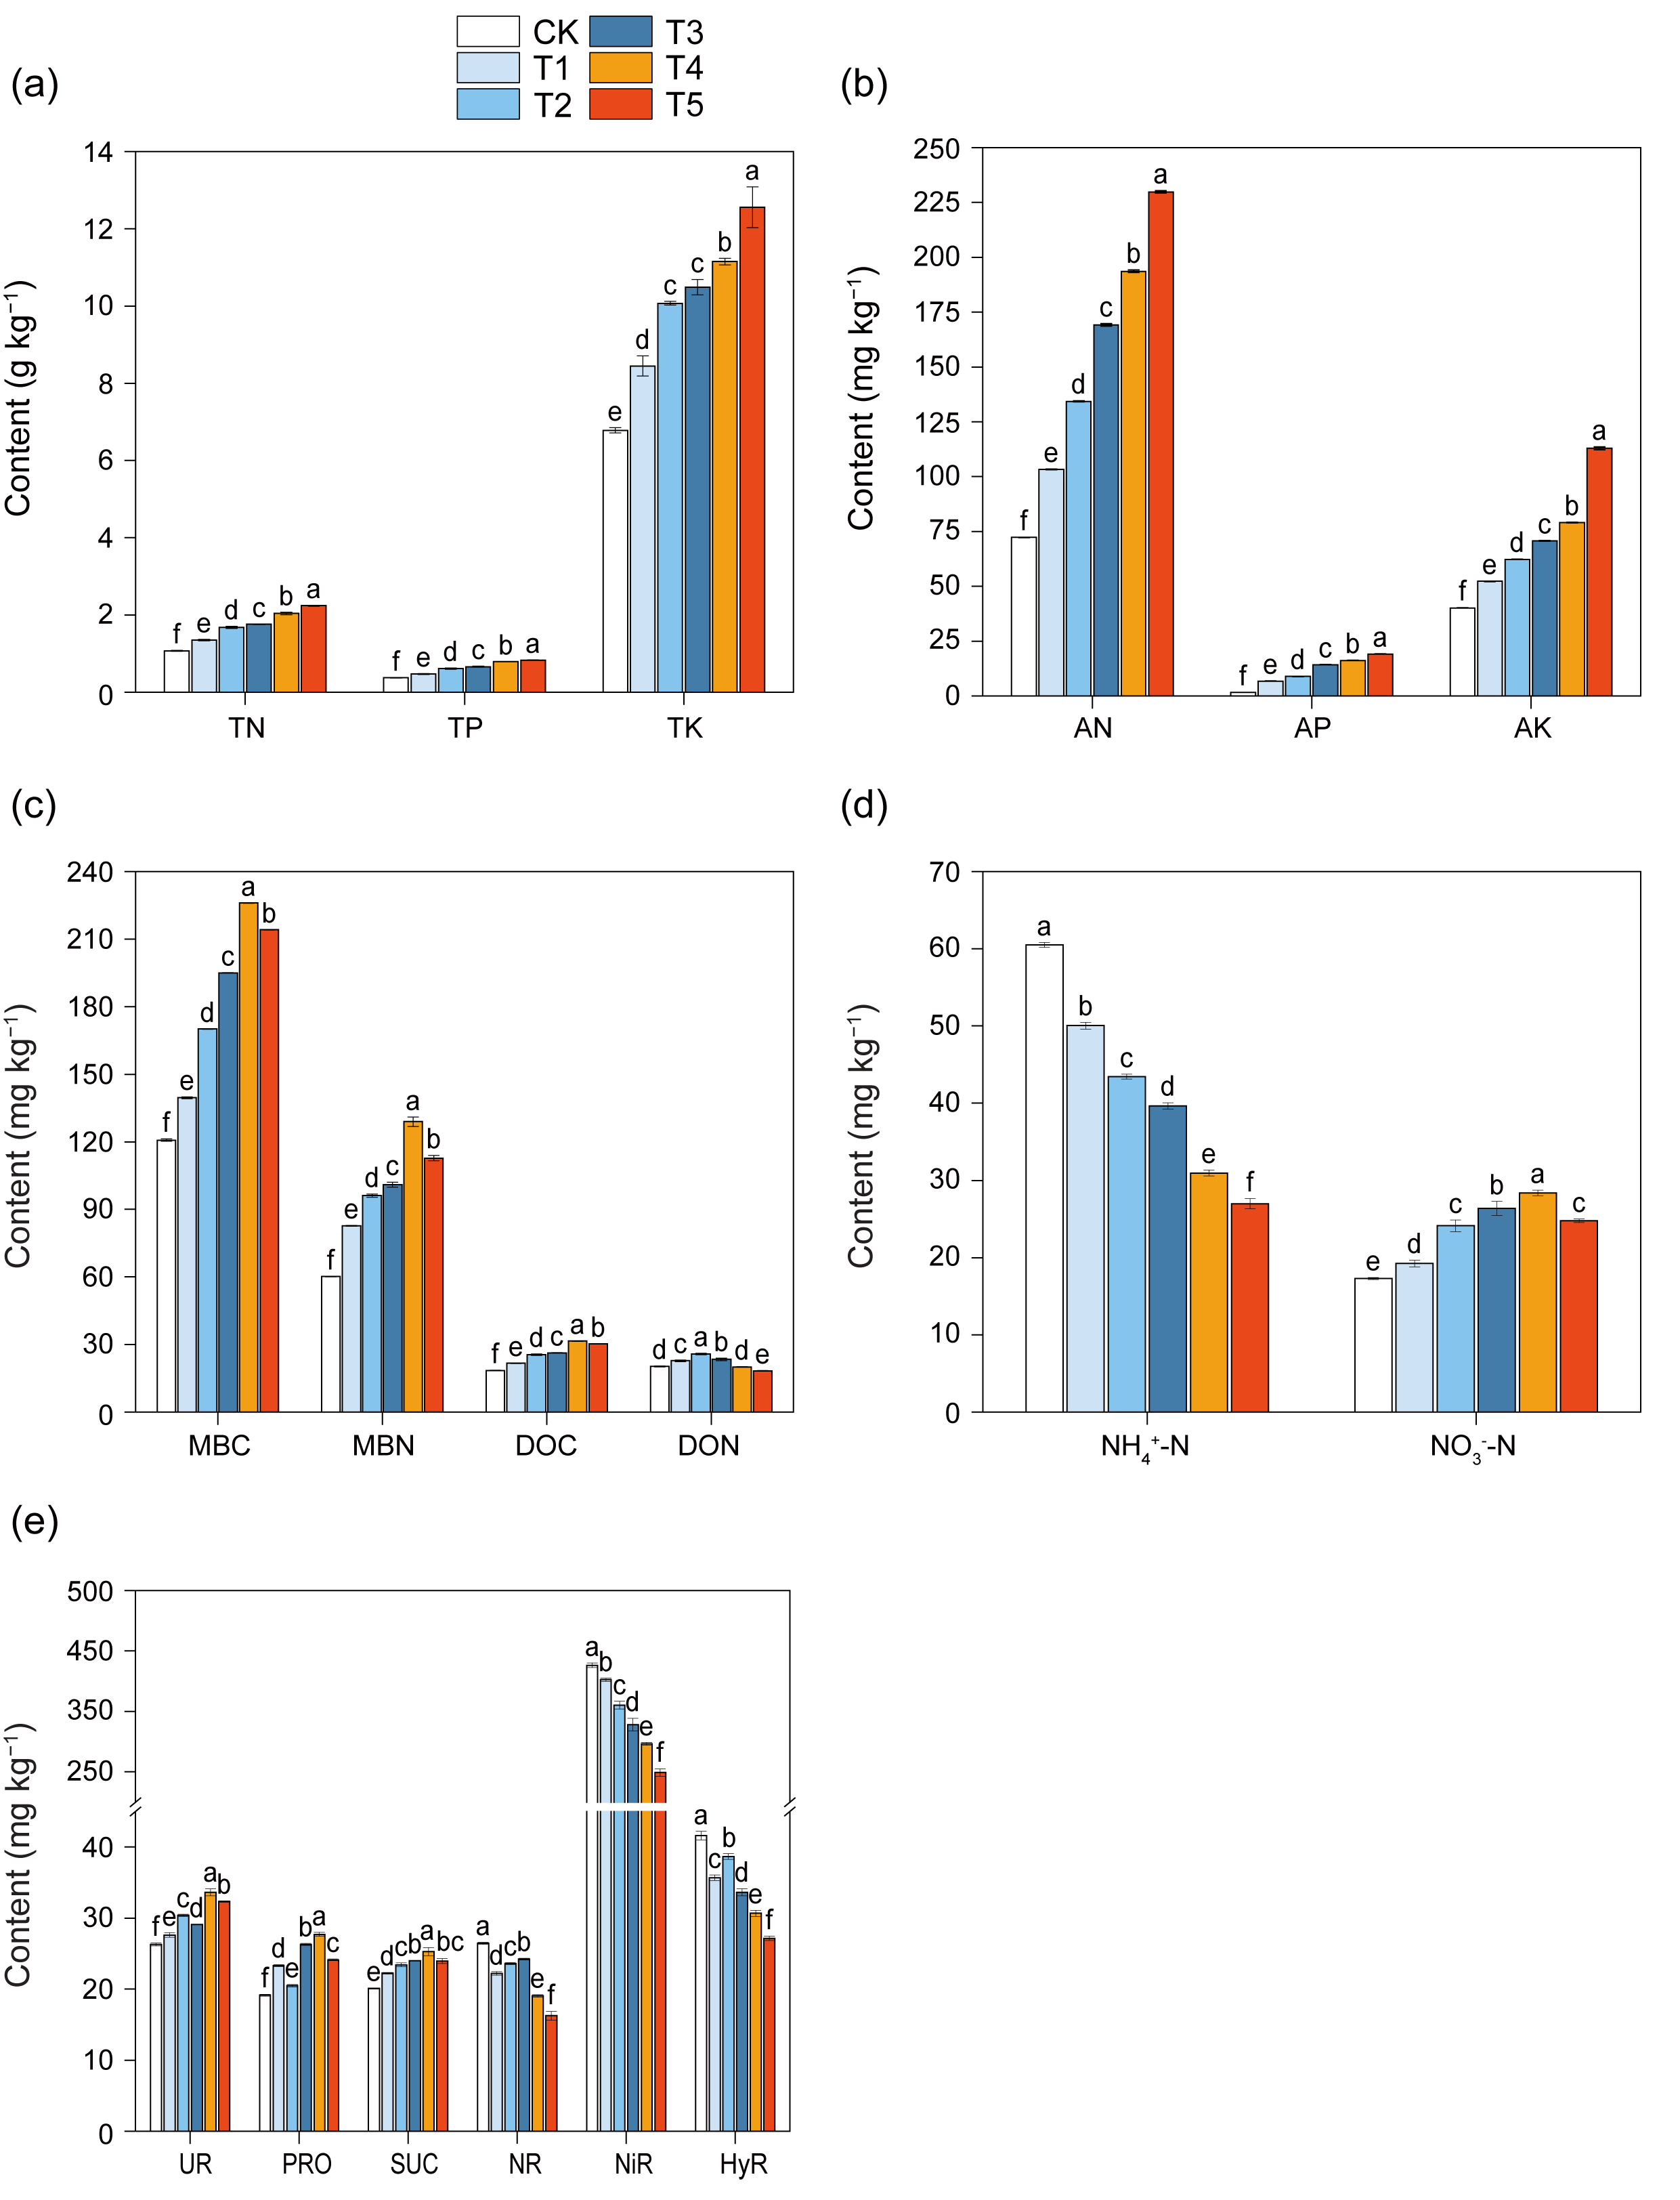
TK, TN, TP, AN, AK, and AP generally increased with increasing biochar application rates (Figure 1a,b). MBC, MBN, and DOC showed unimodal responses; DON reached its maximum at T2 and declined thereafter (Figure 1c). Soil NH4+-N and NO3-N concentrations responded differently to increasing biochar application rates (Figure 1d). NH4+-N content decreased consistently across treatments, corresponding to reductions of 17.3–55.4% compared to that in CK. In contrast, NO3-N showed an increasing trend with increasing biochar application rate.

3.3. Changes in Soil Enzyme Activities

Soil enzyme activities responded differentially to biochar application (Figure 1e). UR, PRO, and SUC activities increased initially and peaked at T4, with increases of 27.8%, 44.7%, and 27.4%, respectively, compared to that in CK. In contrast, NR, NiR, and HyR decreased with increasing biochar rates, with reductions ranging from 35% to 42% compared to those in CK.

3.4. Changes in Soil N2O Emissions

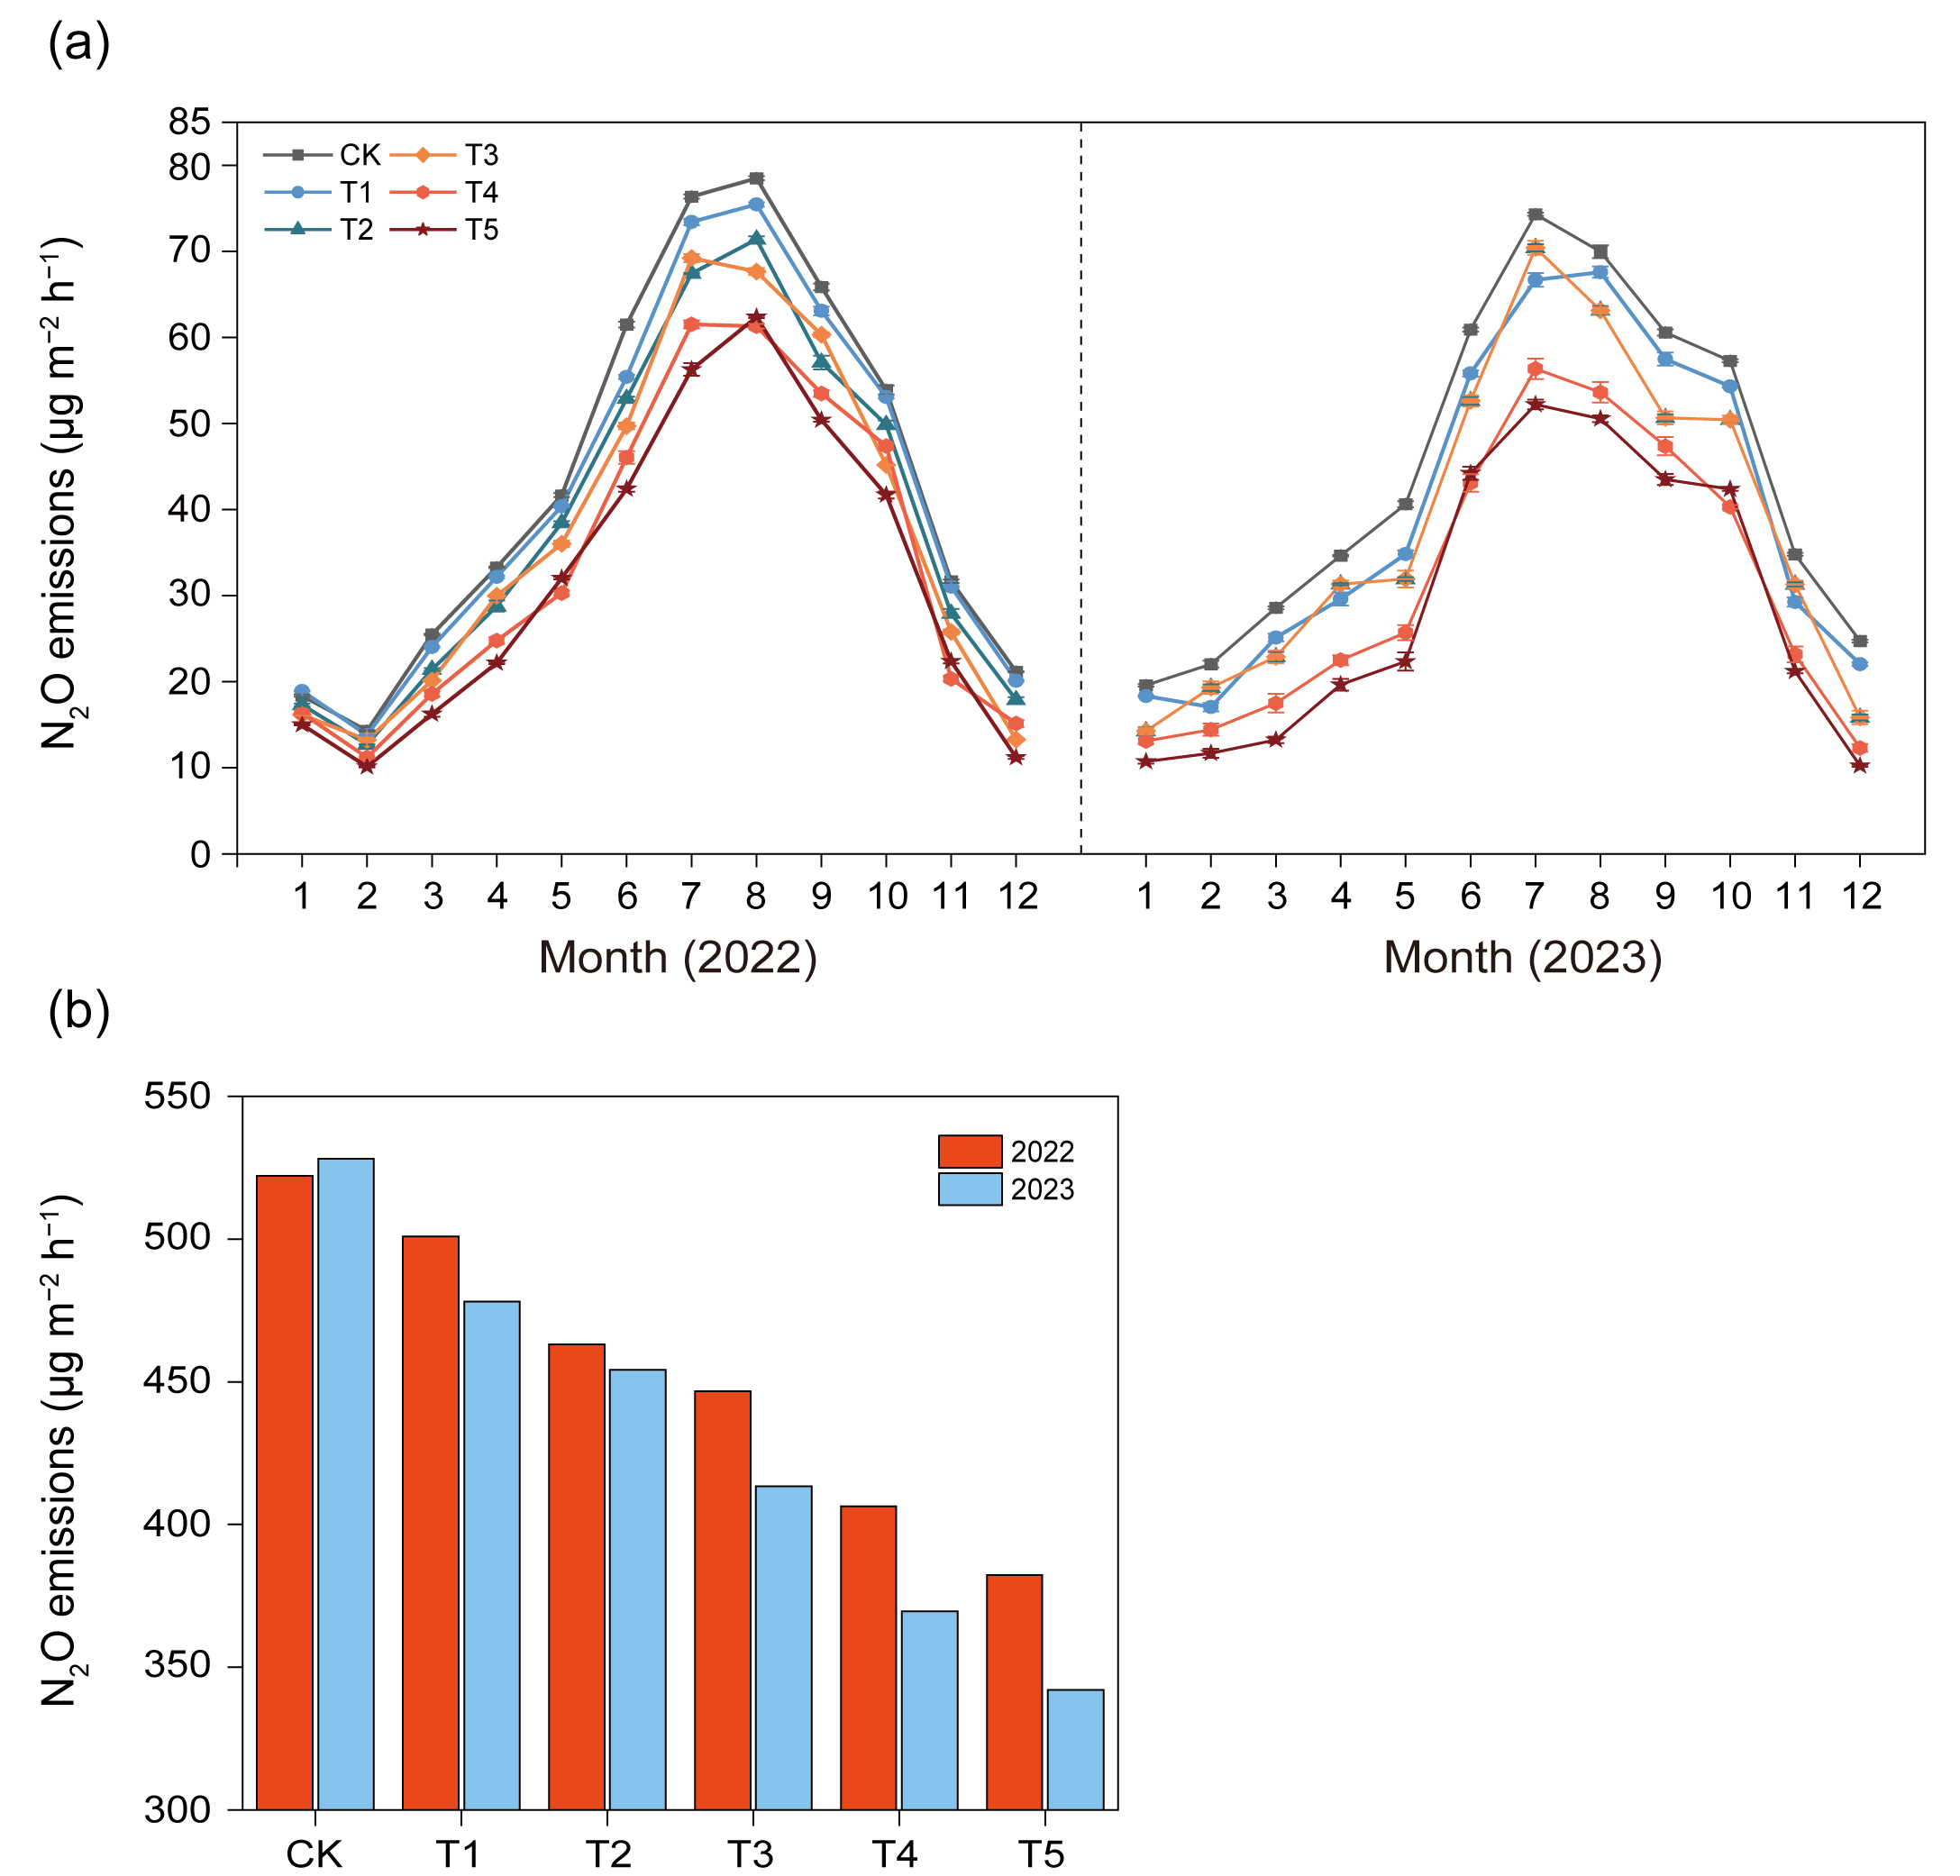
Soil N2O emissions exhibited a seasonal pattern across all treatments, with a unimodal trajectory that peaked in mid-summer and declined thereafter in both 2022 and 2023 (Figure 2a). Biochar amendment significantly suppressed N2O emissions. In 2022, T4 achieved reduction rates of 27.25%, 21.90%, and 35.79% in May, August, and November, respectively, compared to the control, whereas T5 exhibited reduction rates ranging from 18.32% to 47.01% during the remaining months. In 2023, T4 showed reduction rates of 29.23% and 29.64% in June and September, respectively, while T5 maintained reduction rates ranging from 27.75% to 58.64% in the other months. In summary, while T4 showed the strongest suppression during specific emission months, higher application rates, particularly T5, generally maintained the lowest emission fluxes for the majority of the observation period.
Annually, cumulative N2O emissions decreased with increasing biochar application rate, indicating a dose–response relationship (Figure 2b). The mitigation effect was more pronounced in 2023 than in 2022, with reduction efficiencies ranging from 4.1% to 26.8% in 2022 and from 9.5% to 35.2% in 2023, based on the two monitored years. Statistical analysis identified soil temperature and moisture content as the primary drivers of N2O flux variability, and both were positively correlated with emissions in both years (p < 0.01; Supplementary Materials, Figure S2). The influence of pH was not significant in 2022, but a significant negative correlation was observed in 2023 (p < 0.05), indicating that biochar-induced alkalization played a more significant role in emission suppression in 2023 compared to 2022. Overall, these results demonstrate that biochar application effectively reduced soil N2O emissions, with a higher mitigation efficiency observed in the second monitored year (2023) under strong environmental regulation.

3.5. Changes in Nitrification and Denitrification

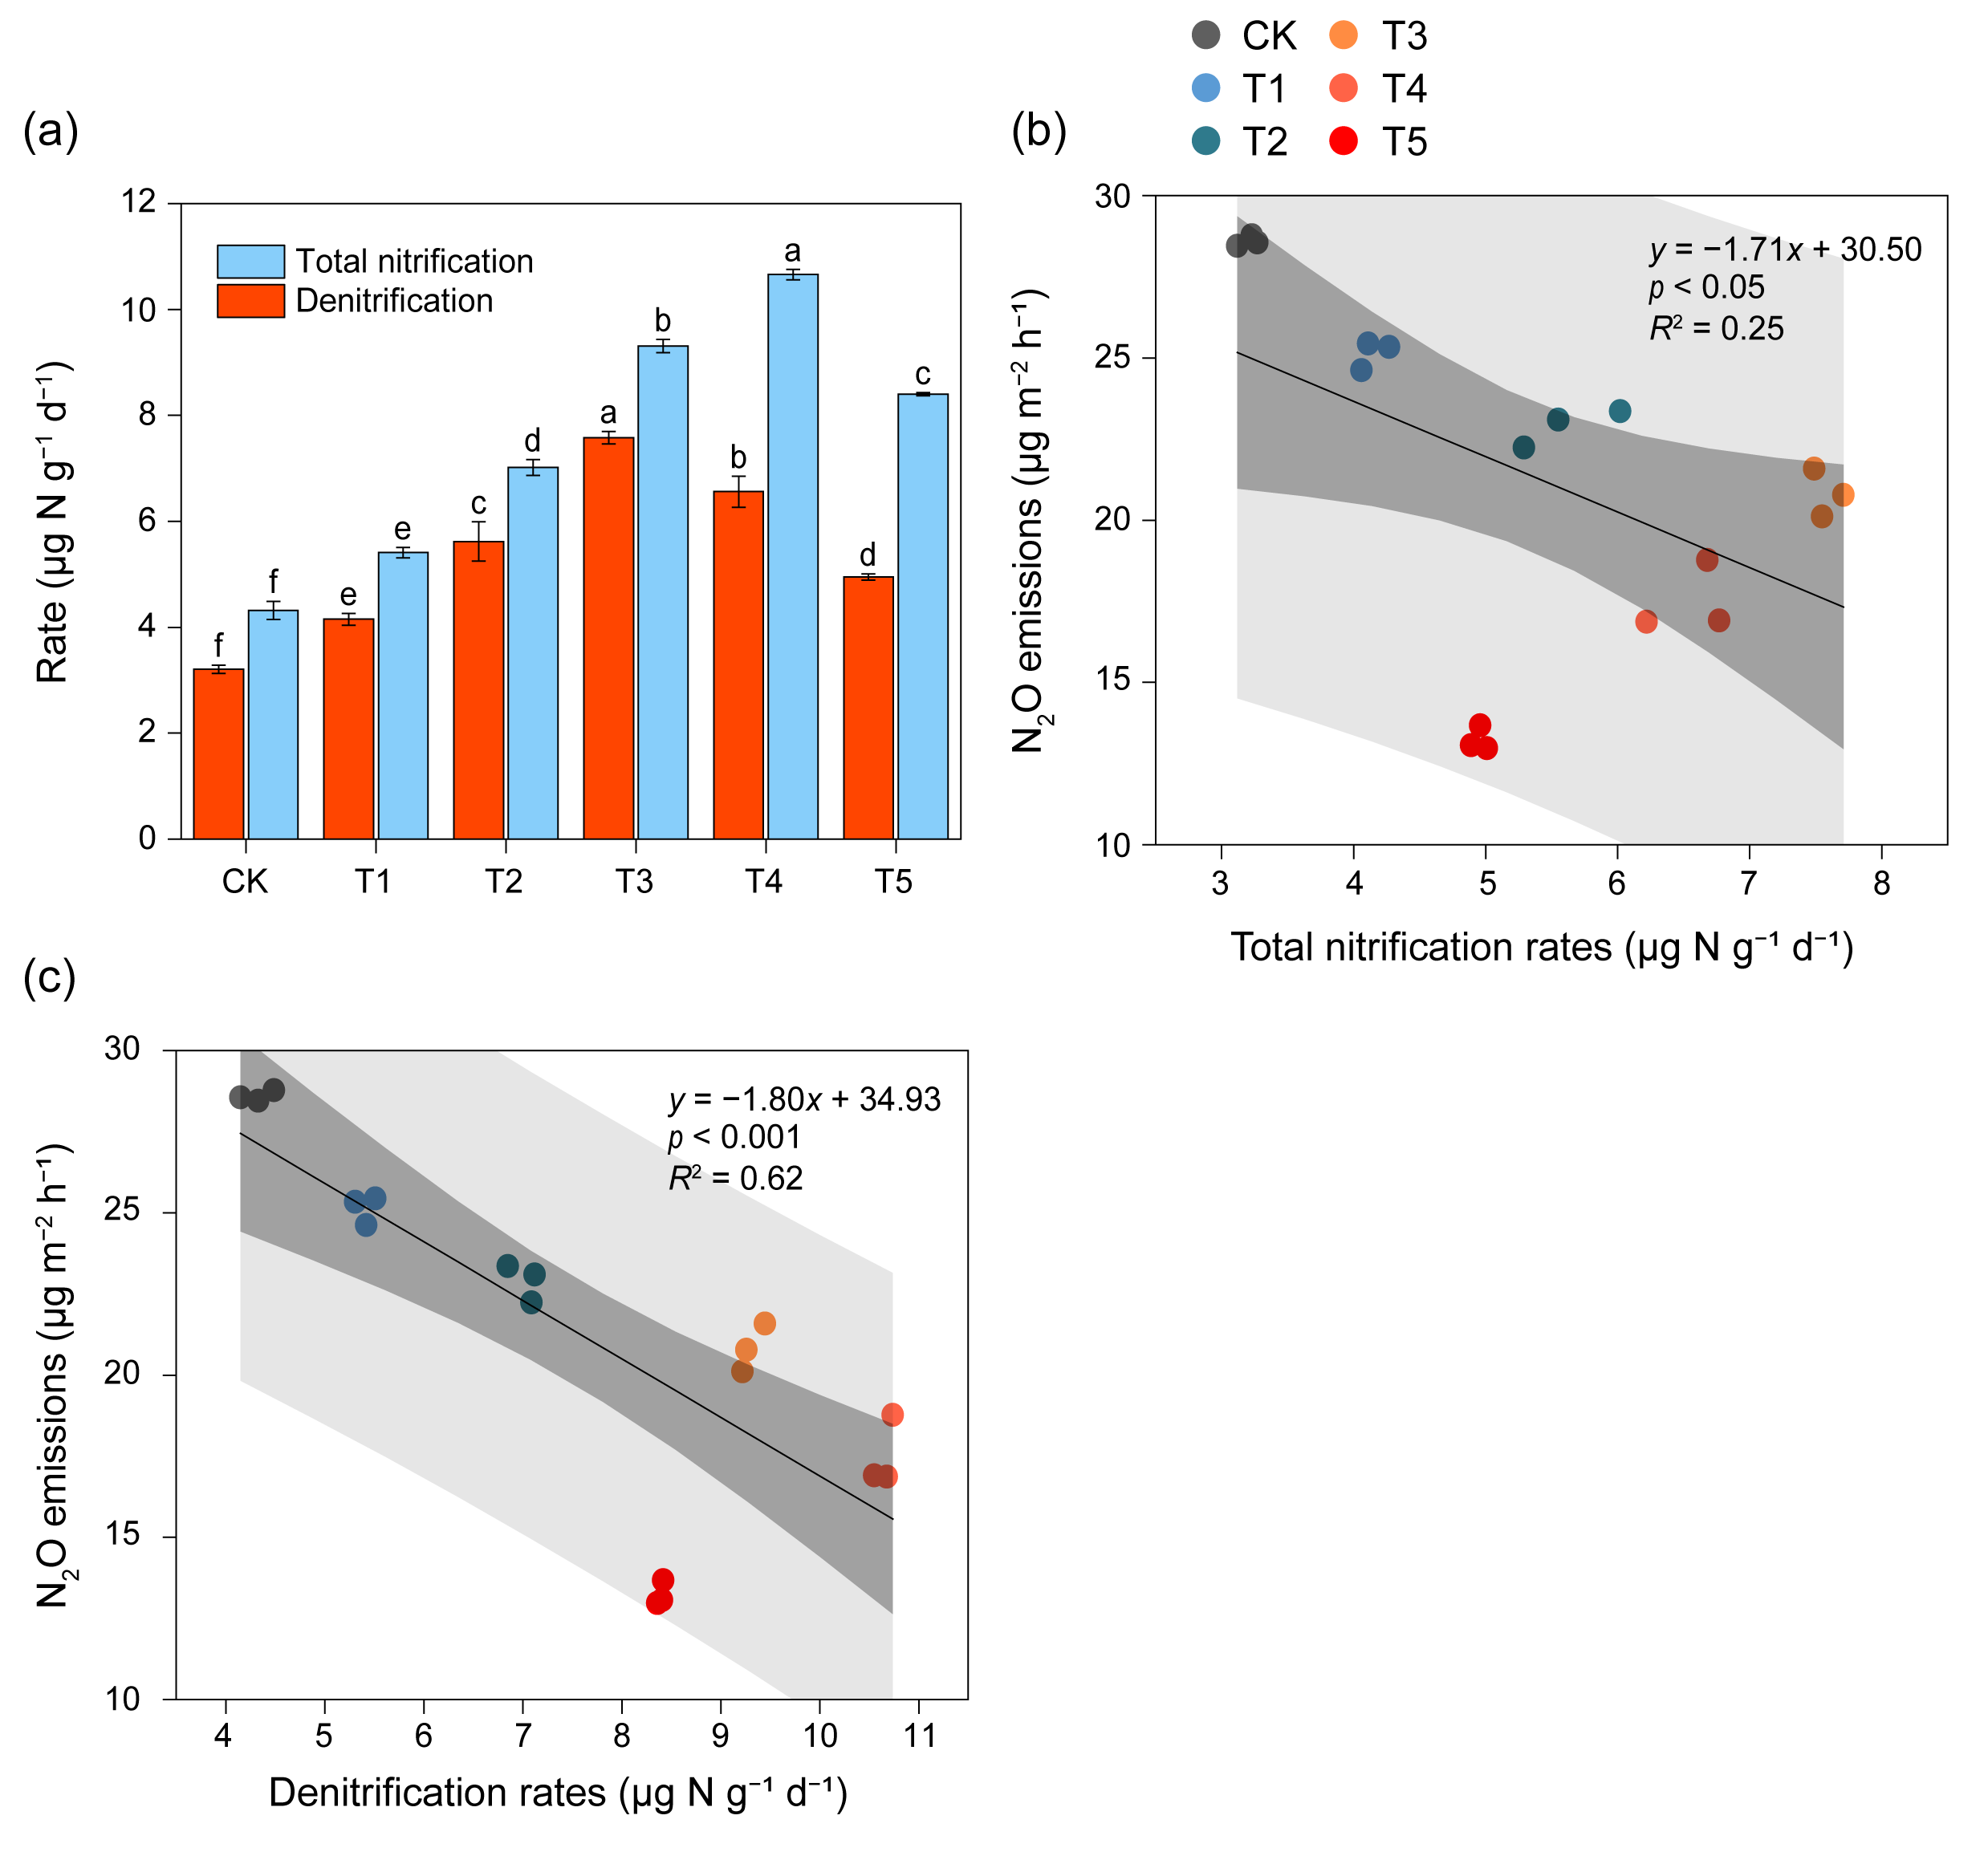
Both total nitrification (TNR) and denitrification (DNR) rates exhibited unimodal responses to increasing biochar application, with peak values observed in T3 and T4 treatments, respectively (Figure 3a). TNR reached a maximum of 7.58 μg N g−1 d−1 in T3, that is, a 2.36-fold increase compared to that in CK. Similarly, DNR reached its highest value in T4 (10.66 μg N g−1 d−1), that is, a 2.46-fold increase compared to that in the control. Linear regression analysis revealed significant negative relationships between N2O emissions and both TNR and DNR (Figure 3b,c). Specifically, N2O emissions negatively correlated with TNR (R2 = 0.25, p < 0.05) and exhibited a stronger negative correlation with DNR (R2 = 0.62, p < 0.001). These results suggest that denitrification may play a more important role than nitrification in regulating net N2O emissions under biochar amendment.

3.6. Changes in Nitrogen-Cycle-Related Functional Genes

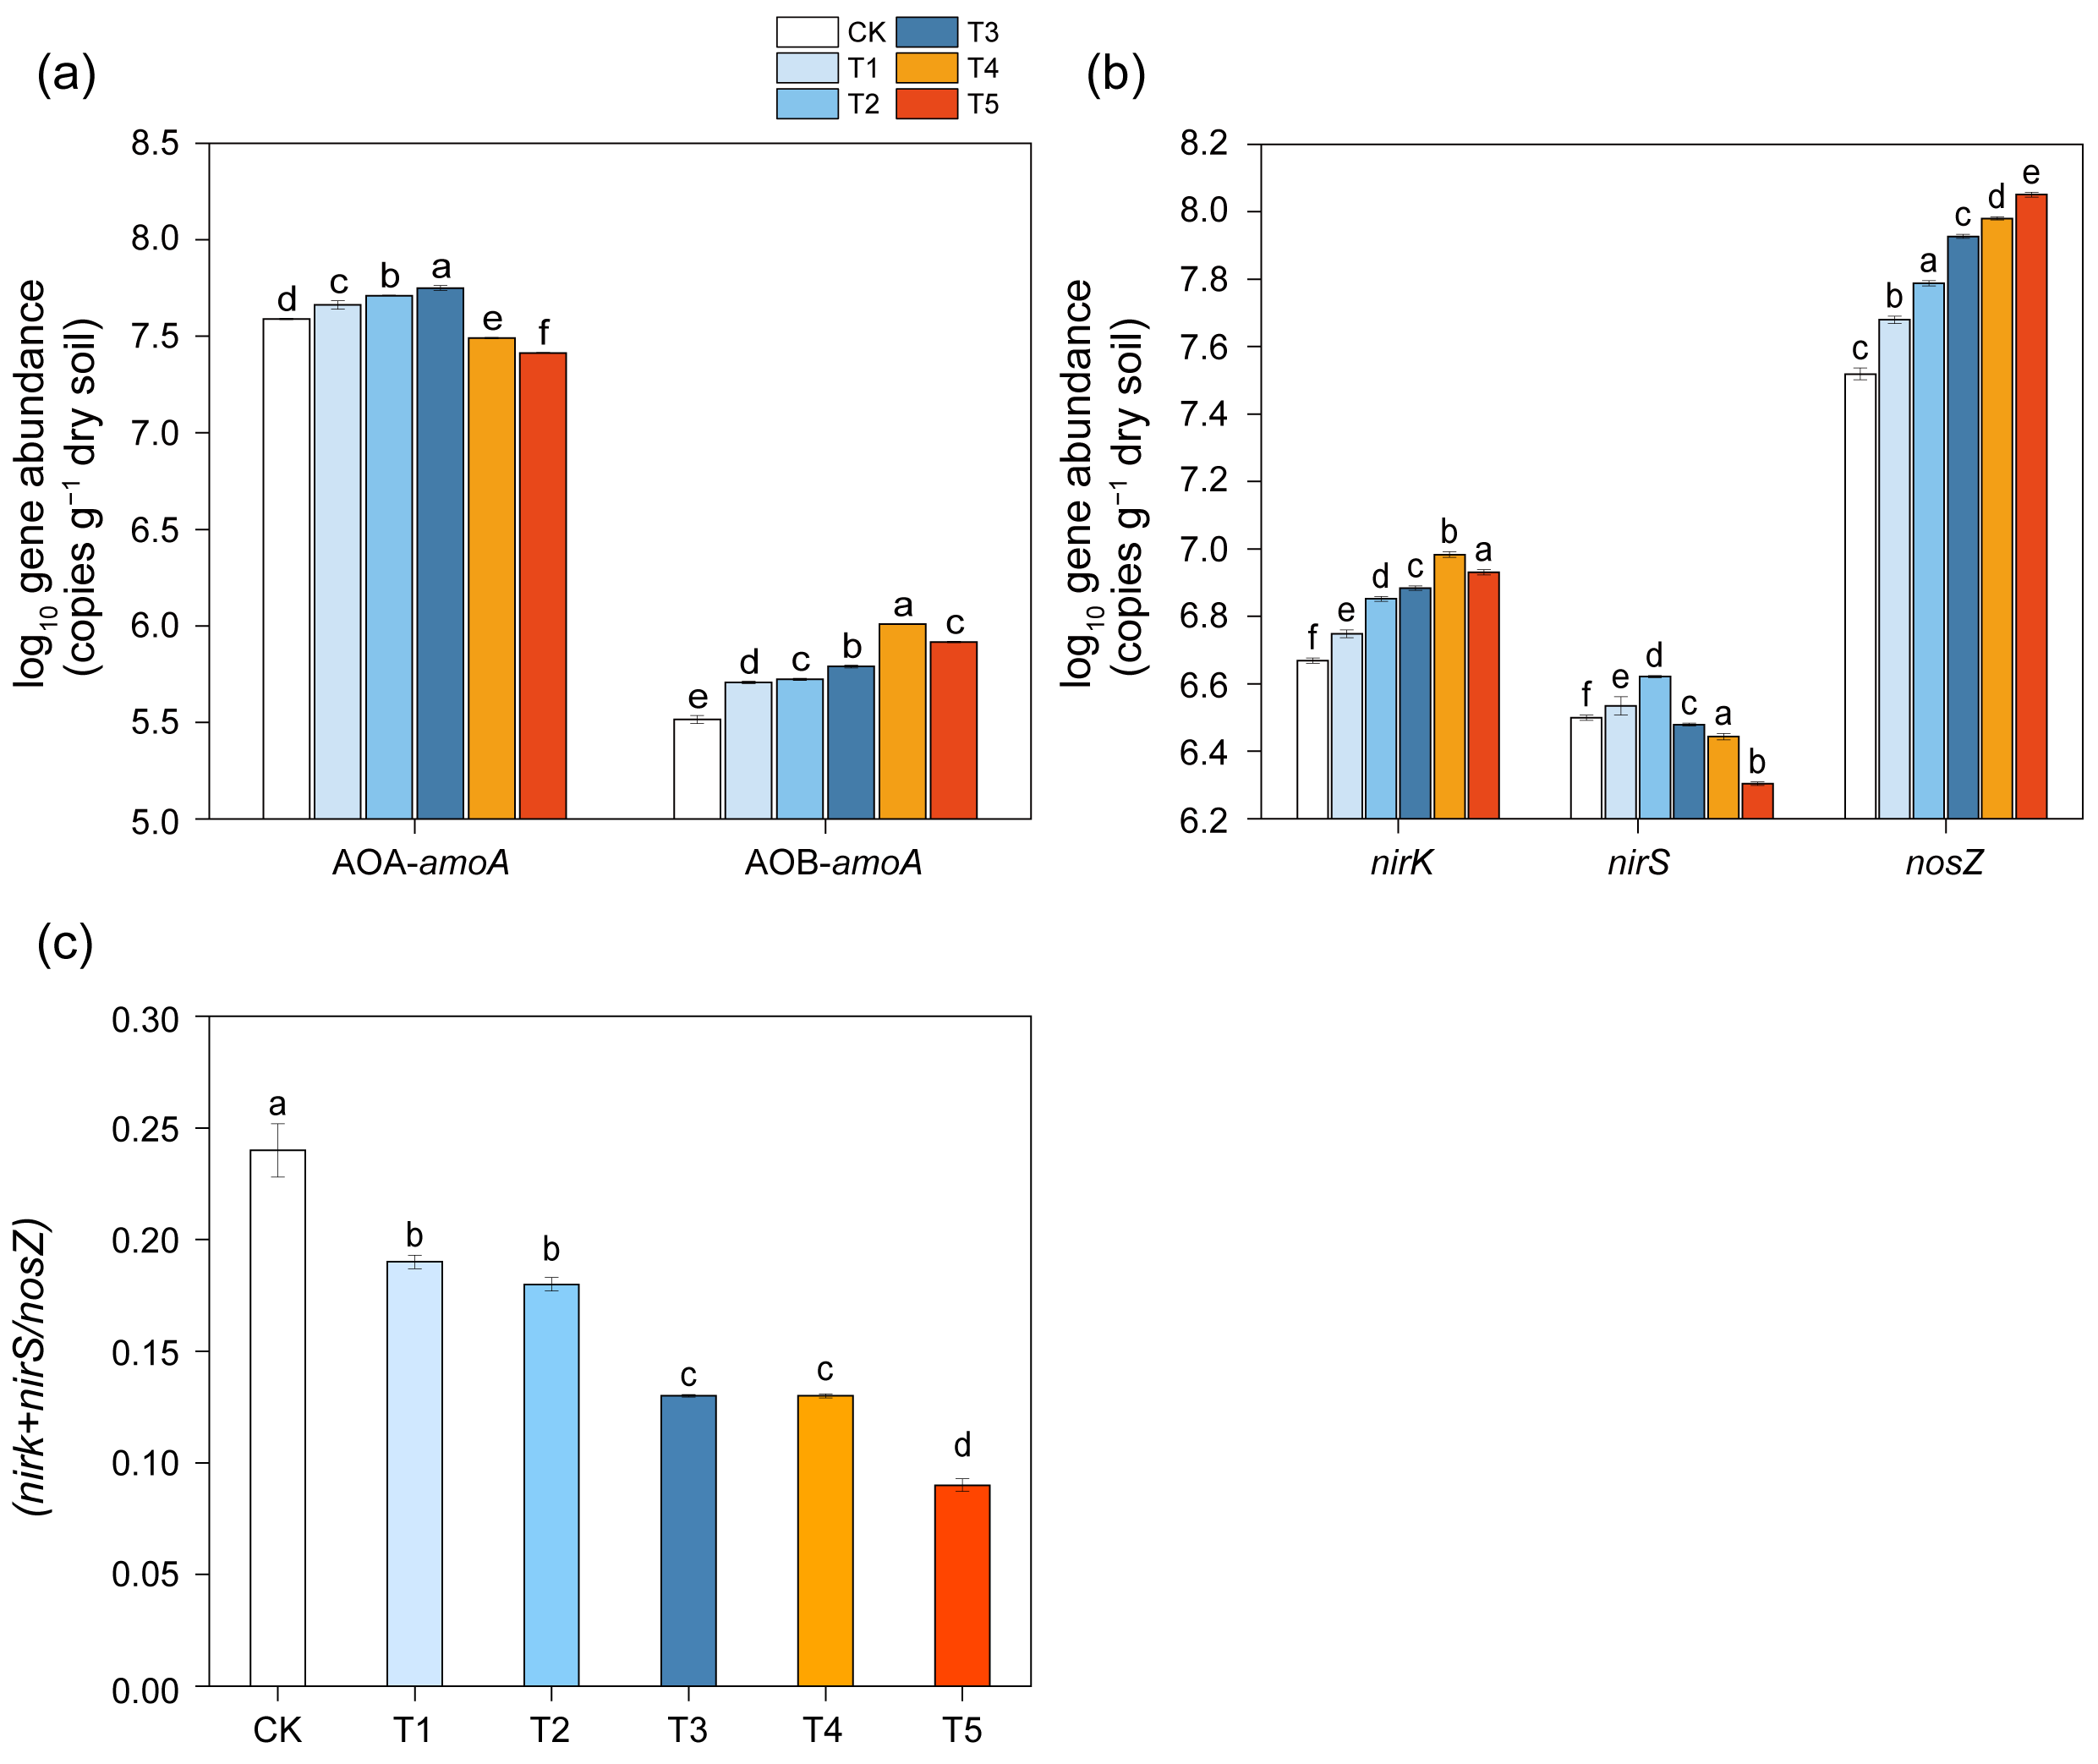
The abundance of AOA-amoA exhibited a unimodal response to biochar addition, reaching its maximum at moderate application rates before declining thereafter. In contrast, AOB-amoA abundance displayed a dose-dependent increase across the gradient (Figure 4a). Compared to that in the CK, AOA-amoA abundance was significantly suppressed under high-dosage treatments (T4 and T5). Notably, AOA-amoA maintained numerical predominance over AOB-amoA across all treatments, underscoring its pivotal role in ammonia oxidation within the acidic soil matrix investigated in this study. Compared with that in the CK, the abundances of nirS followed a non-monotonic trend, characterized by an initial increase followed by a subsequent decline at elevated biochar rates (Figure 4b). Conversely, nosZ and nirK abundance showed a robust monotonic increase, reaching the maximum value in T5 and T4 treatments compared to that in CK treatment. (nirK + nirS)/nosZ ratio underwent a significant dose-dependent reduction, suggesting a potential shift toward complete denitrification (Figure 4c).

3.7. Correlation Analysis of Physicochemical Properties, Enzyme Activities, and Nitrogen-Cycle-Related Functional Genes

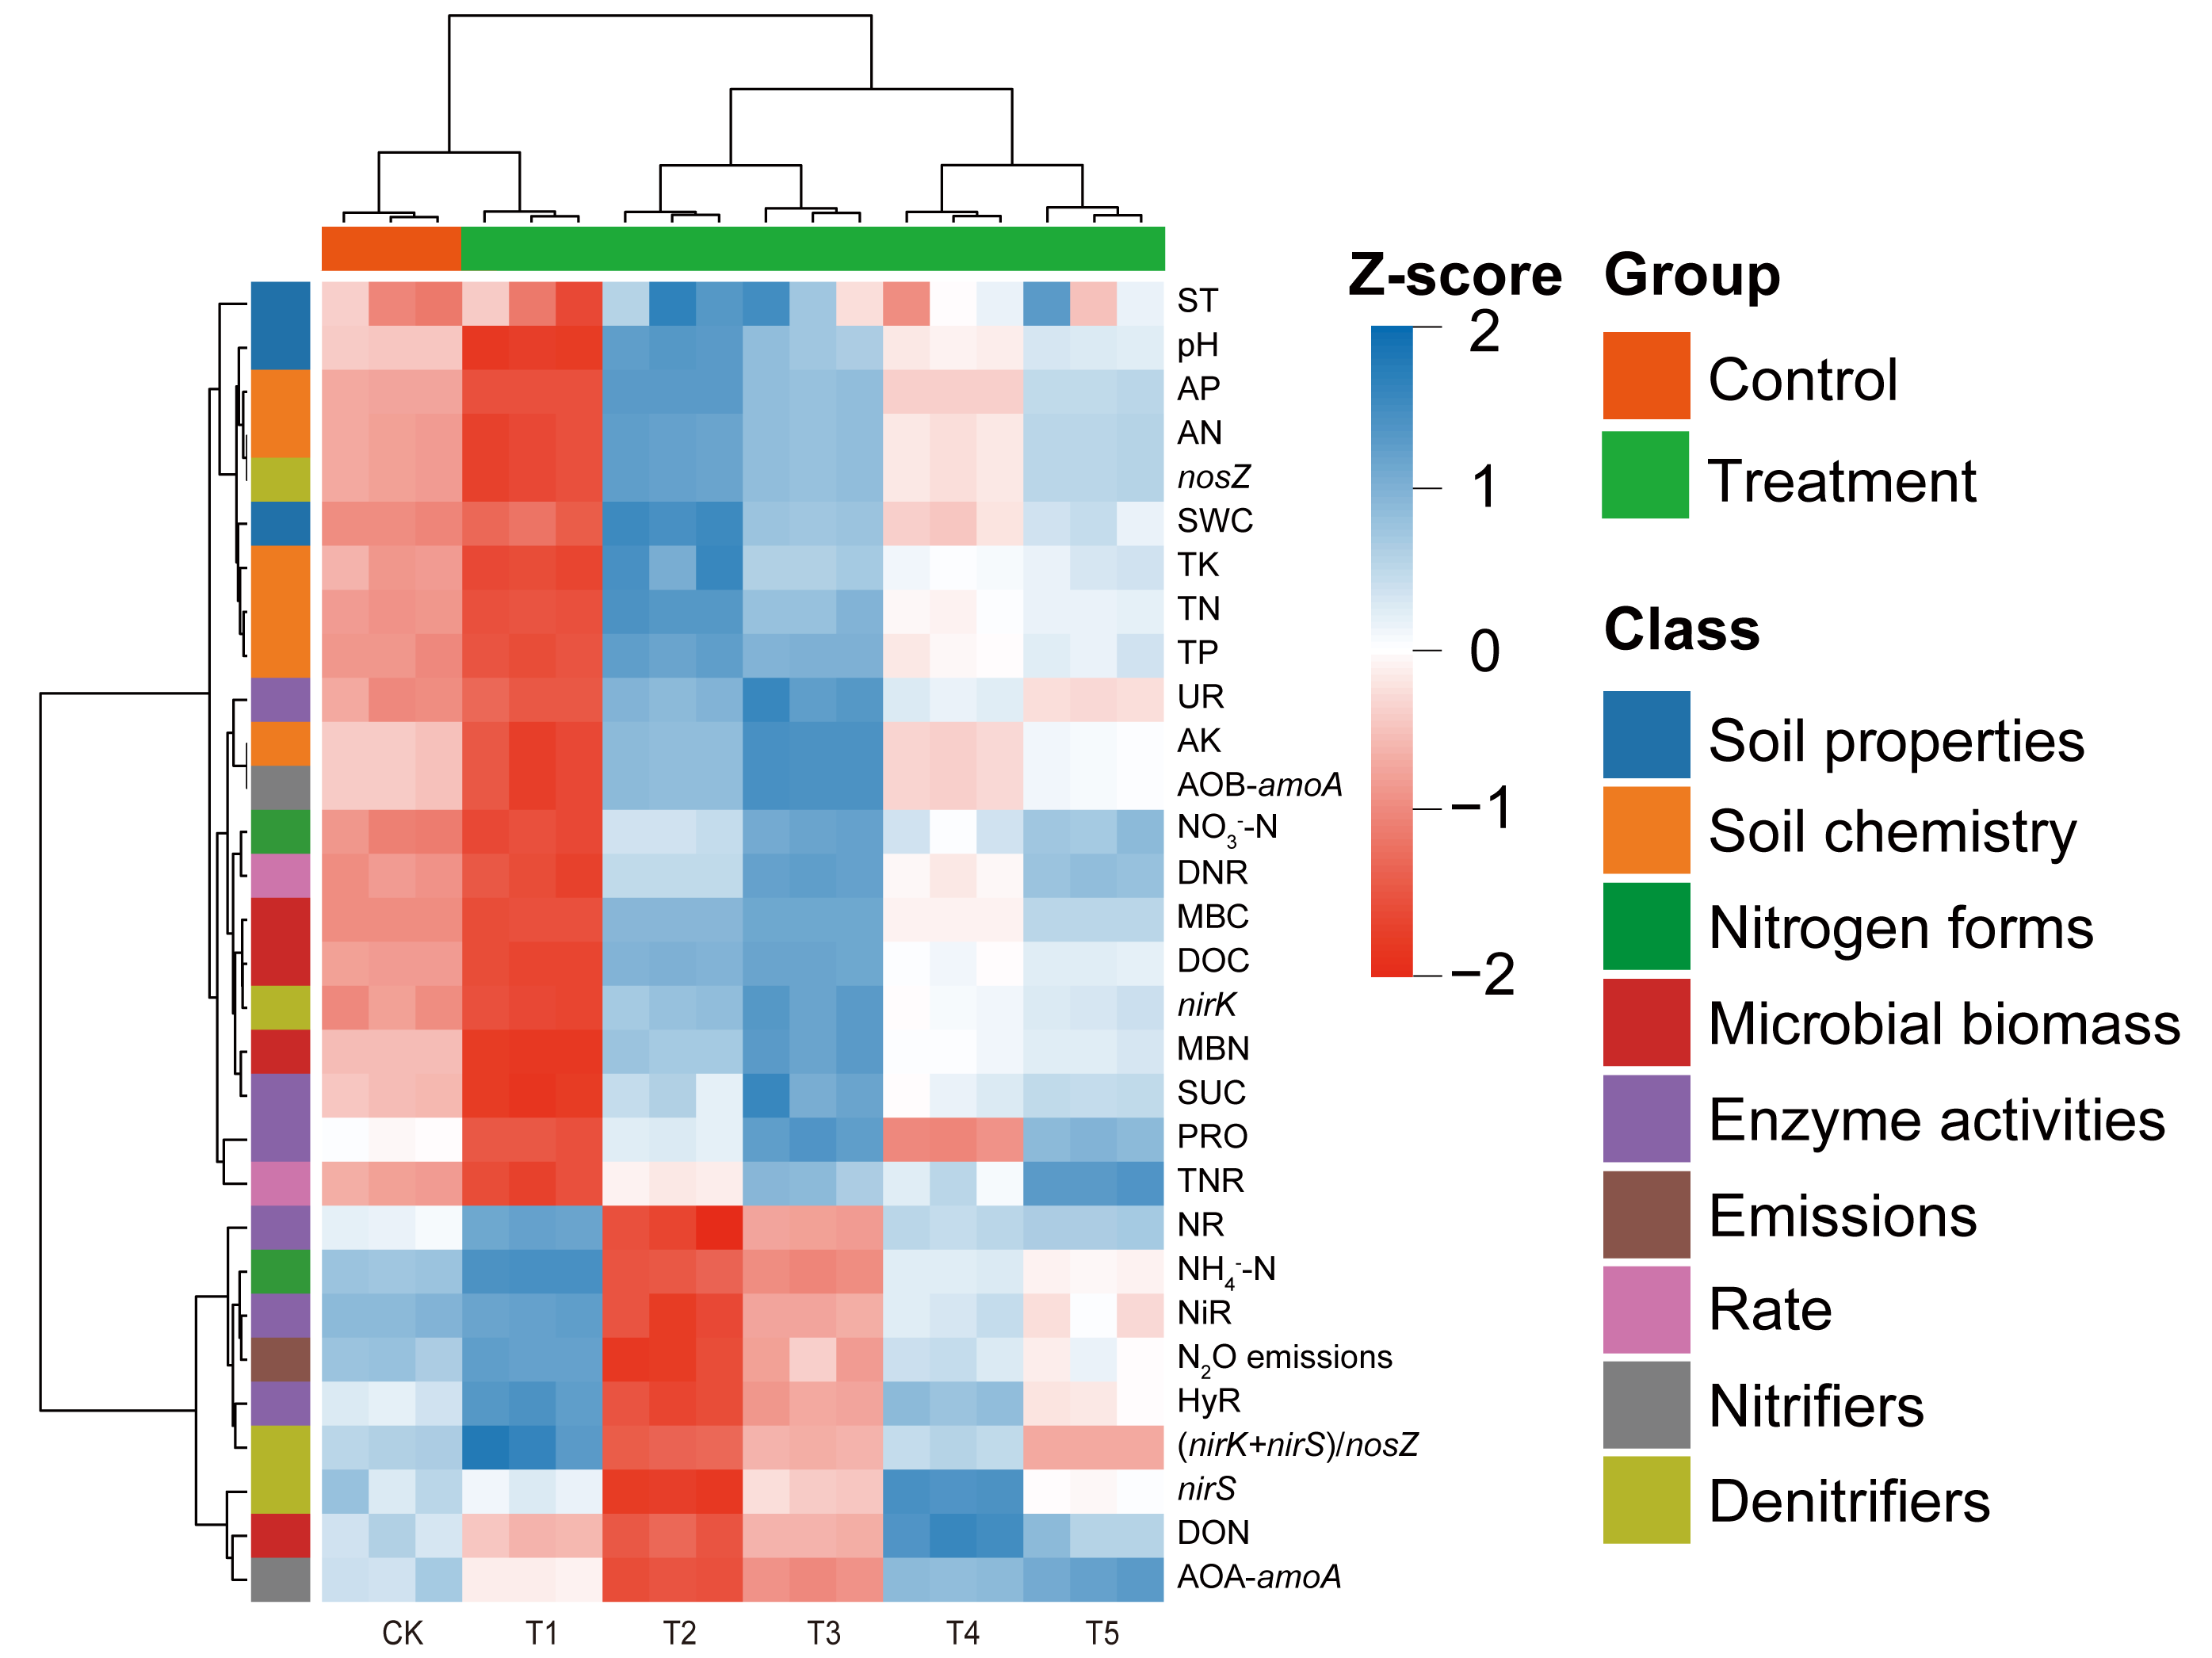
Hierarchical clustering analysis and the associated heatmap further elucidated the divergent responses of soil physicochemical properties, enzymatic activities, and nitrogen cycle indices to biochar amendment (Figure 5). The treatments were bifurcated into two primary clusters: the CK and T1 formed a cohesive group, whereas the higher-dosage biochar treatments (T4 and T5) were distinctly segregated. This clustering hierarchy underscores a dose-dependent shift in the soil microenvironment induced by substantial biochar input. Specifically, high-dosage treatments (T4 and T5) were characterized by a synergistic enrichment of soil moisture, total nutrients (TN, TP, and TK), and inorganic N dominated by nitrate (NO3-N), as evidenced by their elevated standardized Z-scores for these specific parameters. Conversely, these treatments exhibited depletion in ammonium (NH4+-N) and DON. These coordinate shifts in soil properties and microbial functional traits suggest that biochar-driven alterations in N-cycling pathways are the primary drivers behind the observed variations in N2O emission patterns.

3.8. SEM Model and Standardised Impact Values

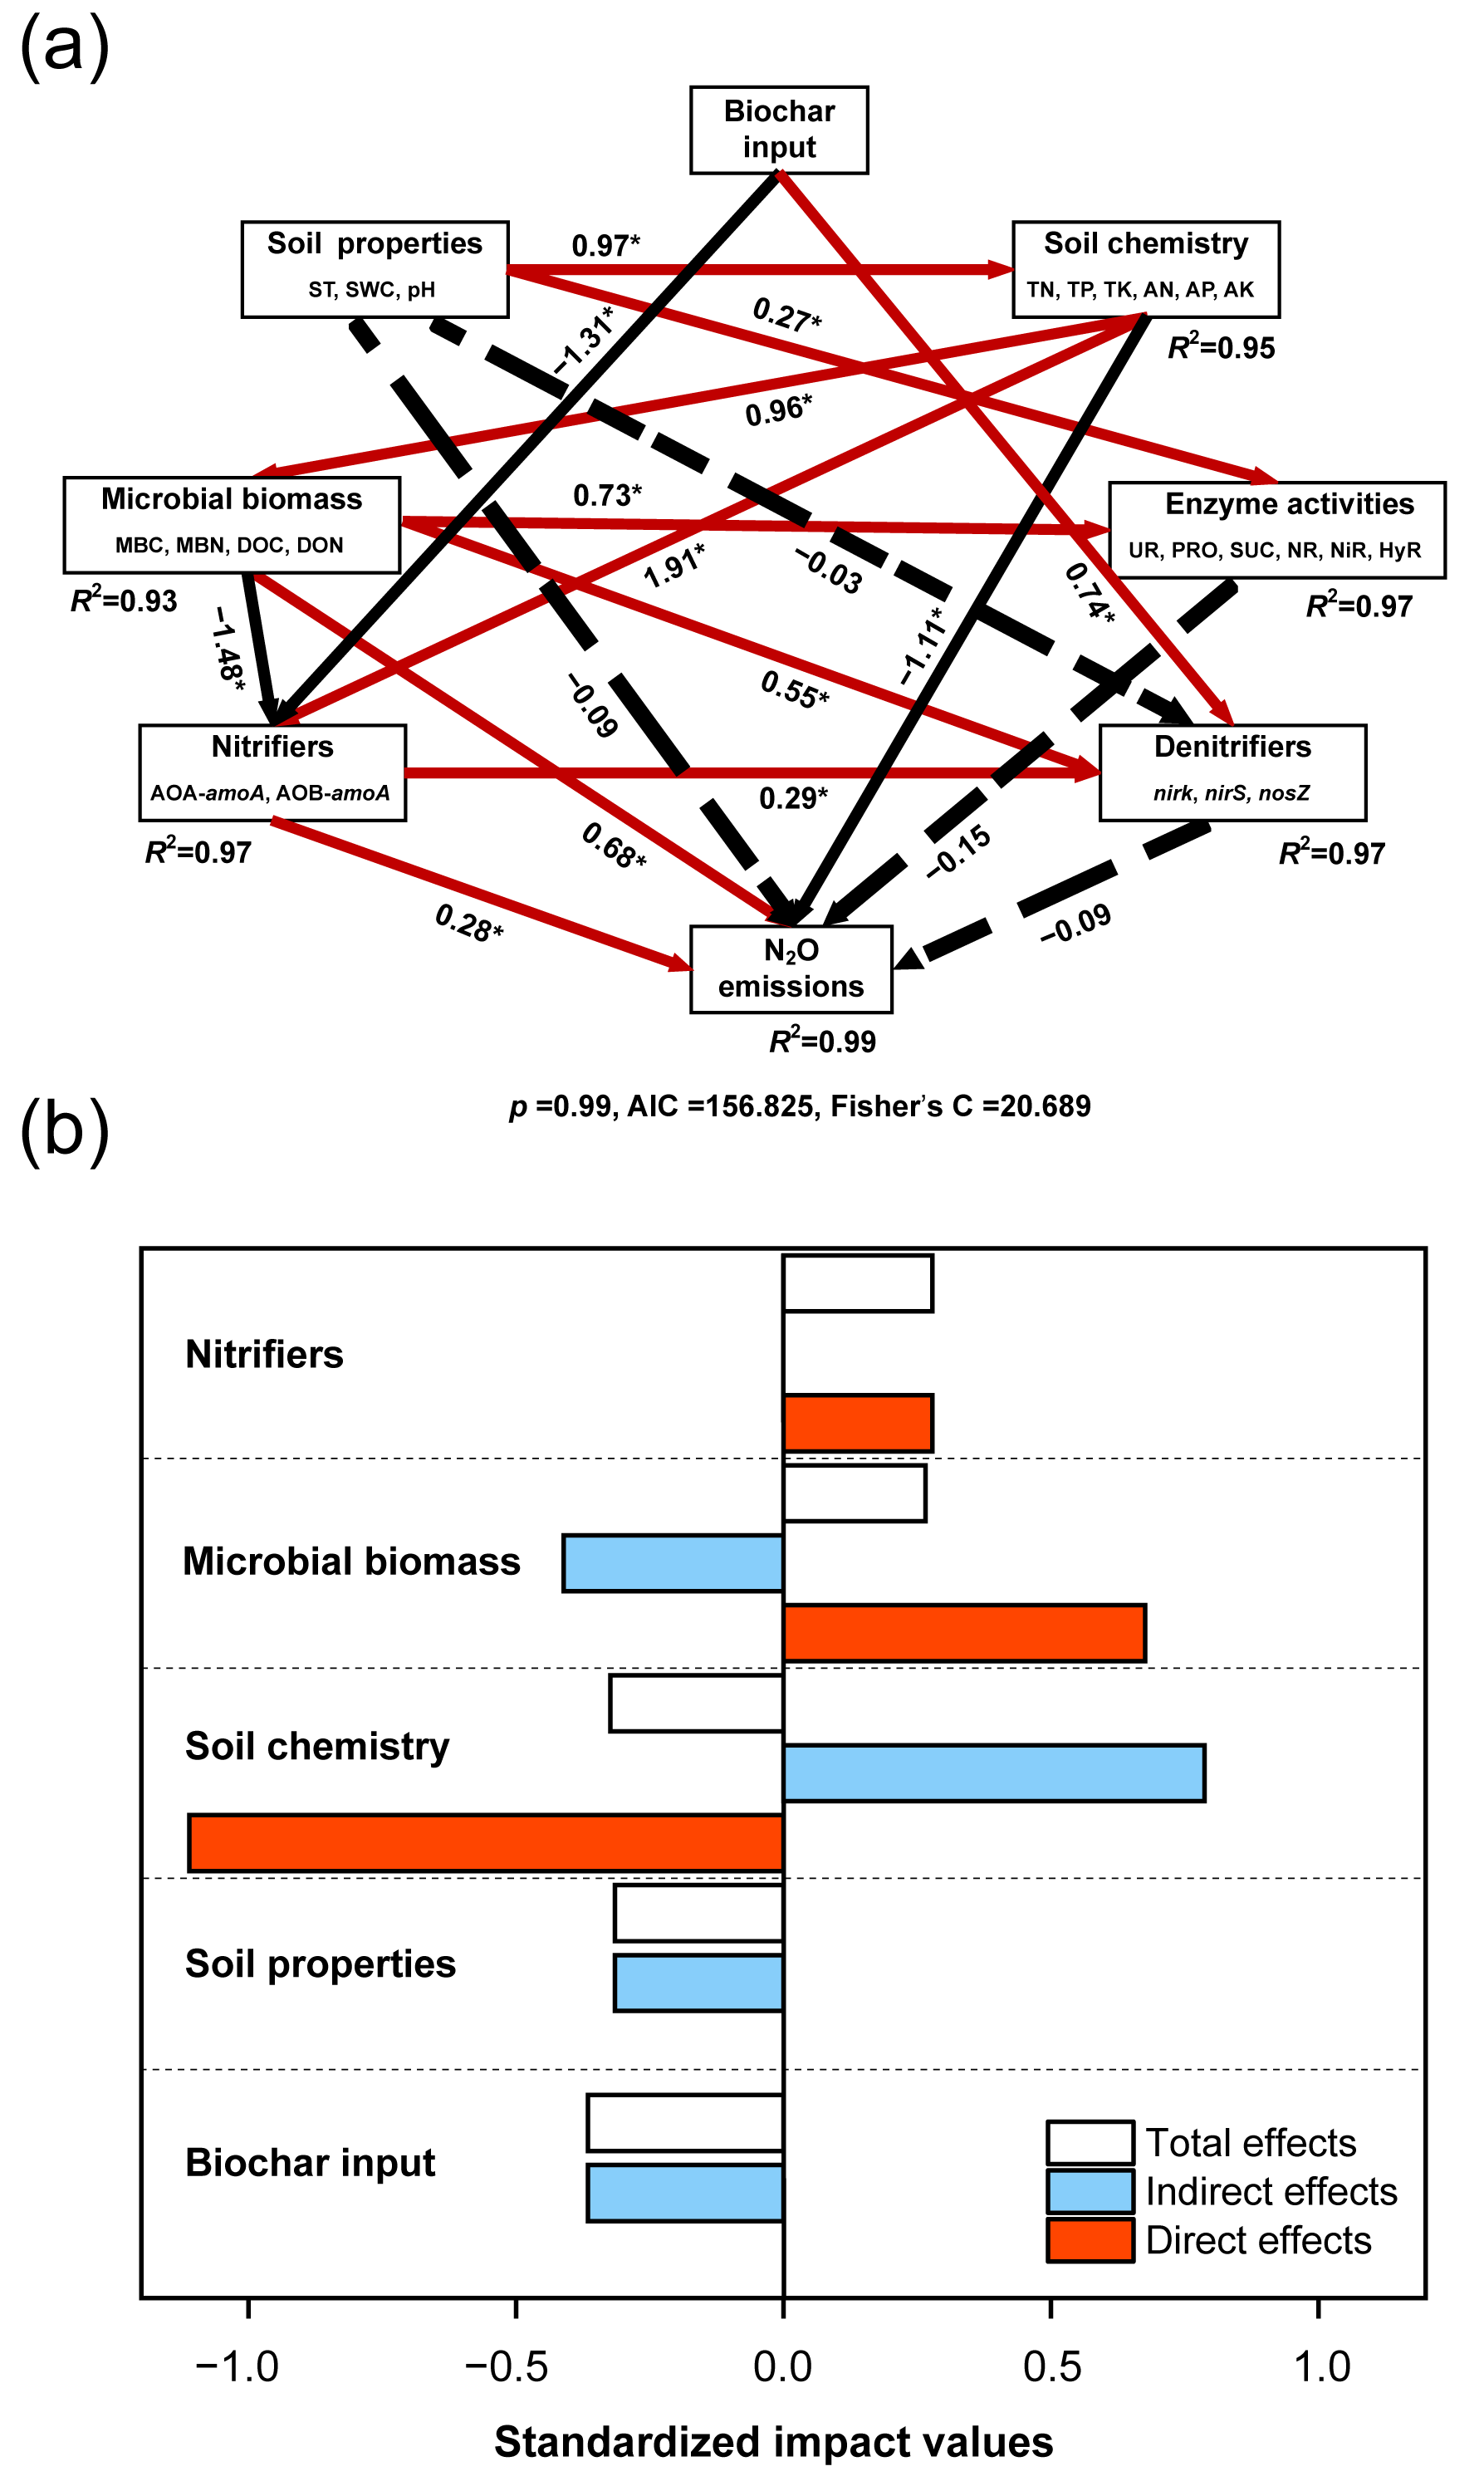
SEM model illustrated the direct and indirect pathways linking soil physicochemical properties, microbial biomass, enzyme activity, nitrification and denitrification processes, and N2O emissions (Figure 6). The model showed an acceptable fit (AIC = 156.825, Fisher’s C = 20.689, p > 0.05). ST, SWC, and pH had a significant positive effect on soil chemical properties (path coefficient = 0.97, p < 0.05). Improved soil chemical properties subsequently promoted microbial biomass (path coefficient = 0.96, p < 0.05), which further stimulated soil enzyme activity (path coefficient = 0.73, p < 0.05). Biochar input showed a significant negative effect on the gene abundances of AOA-amoA and AOB-amoA (path coefficient = −1.31, p < 0.05); however, nitrifiers remained a significant positive driver of N2O emissions (path coefficient = 0.28, p < 0.05). In contrast, soil chemical properties exhibited a strong direct negative effect on N2O emissions (path coefficient = −1.11, p < 0.05). Overall, the model explained 99% of the variance in N2O emissions, indicating that soil physicochemical and microbial variables accounted for most of the observed variation.
These results suggest that the variation in N2O emissions was controlled by the balance between two interacting pathways. On the one hand, biochar directly suppressed the abundance of nitrifying microorganisms, which may reduce nitrification-derived N2O production. On the other hand, biochar indirectly enhanced microbial biomass and enzyme activity by improving soil properties, potentially stimulating microbial groups involved in N2O reduction, particularly those harboring the nosZ.

4. Discussion

4.1. Effect of Biochar Application on Soil N2O Emissions in Eucalyptus Plantations

This study reveals that amendment with Eucalyptus branch-derived biochar induced a consistent, dose-dependent attenuation of both soil N2O fluxes and cumulative emissions. This mitigation effect is consistent with global meta-analyses on significant N2O reductions following biochar incorporation across diverse ecosystems [31]. Biochar-induced suppression appears to arise largely from improvements in soil physicochemical properties. Biochar amendment significantly elevated soil alkalinity, microbial biomass carbon and nitrogen, and nutrient content. Significant negative correlations (p < 0.01) between N2O emissions and these soil parameters further indicate that biochar-induced environmental improvements, particularly the substantial reduction in soil acidity (with pH increasing by up 1.79 units), effectively suppress the substrate-driven potential for N2O generation [32]. However, it is necessary to consider the potential confounding effects of soil physical changes. Table 1 illustrates that high biochar application increased soil temperature by up to 0.84 °C. While this minor warming theoretically stimulates microbial metabolism and baseline N2O production, it failed to disrupt the overall emission reduction trend. Potential temperature-driven stimulation was ultimately outweighed by the primary physicochemical and biological mechanisms of biochar, namely soil alkalization and the enrichment of nosZ genes.
Furthermore, biochar application significantly influenced N transformation rates. In the T4 treatment, a significant decrease in NH4+-N content was accompanied by a peak in NO3-N concentration. This pattern suggests that biochar facilitates nitrification and potentially promotes N immobilization, thereby reducing the mineral N pool available for N2O generation, reshaping the substrate availability for subsequent microbial pathways. Although total nitrification and denitrification rates were enhanced, the strong negative correlation (p < 0.01) between denitrification rates and N2O emissions suggests that denitrification plays a more important role than nitrification in regulating net N2O emissions under biochar amendment, potentially leading to a more complete denitrification process [33,34,35]. The coexistence of enhanced nitrification and reduced net N2O emissions is primarily driven by the substantial enrichment of nosZ gene abundance, which ensures rapid reduction of intermediately produced N2O to N2. Additionally, biochar-induced improvements in soil aeration and NH4+-N adsorption further modulate the microenvironment, collectively reconciling this apparent paradox. This optimization may effectively redirect a greater proportion of reactive N toward the production of benign N2 gas. Additionally, this mitigation pattern is conceptually consistent with the established paradigm of biochar acting as an extracellular electron shuttle, facilitating inter-microbial electron transfer that sustains the energetically intensive reduction of N2O catalyzed by the nosZ enzyme [36].
In the present study, the sustained mitigation observed underscores a long-term microbial optimization process, potentially involving the remodeling of key metabolic pathways directly involved in N2O production [37]. SEM model analysis further suggests that this mitigation effect is controlled by a bifurcated regulatory framework involving direct improvement in soil chemistry and indirect modulation of microbial functional communities.

4.2. Effect of Biochar on the Abundance of Soil N-Cycle Functional Genes

Biochar application significantly influenced the abundance of key microbial functional genes involved in soil N cycle, thereby regulating nitrification processes and net N2O emissions [38]. The contrasting responses of their respective amoA genes point toward a potential niche differentiation between AOA and AOB, suggesting that these two nitrifying guilds possess distinct adaptive thresholds within the biochar-modified microenvironment [39,40]. Biochar amendment significantly enhanced AOB-amoA abundance in a dose-dependent manner, whereas AOA-amoA abundance exhibited a unimodal response in Eucalyptus plantations, peaking at intermediate application rates before declining [41]. This ecological differentiation likely originates from biochar-induced changes in soil microenvironments, where elevated pH and microbial biomass carbon and nitrogen align more closely with the physiological requirements of copiotrophic AOB [42]. Beyond pH and substrate preferences, the marked decline in AOA at high biochar dosages may also involve direct toxicity from biochar-derived substances [43]. Residual volatile organic compounds and excessive salts accumulated locally could induce environmental stress that disproportionately inhibits sensitive oligotrophic archaea [44].
Despite the positive response of AOB, the absolute abundance of AOA-amoA consistently exceeded that of AOB-amoA throughout the study period. This pattern highlights the fundamental role of oligotrophic AOA in maintaining baseline nitrification in acidic forest soils [45,46,47]. For denitrification, biochar amendment significantly increased nosZ gene abundance, with a 3.4-fold increase in T5 treatment and concurrent reduction in (nirK + nirS)/nosZ ratio. This functional shift, accompanied by rising NO3-N concentrations, signals a transition toward a more complete denitrification pathway that favours the reduction of N2O to N2 [48,49]. Similarly, [50] demonstrated that rice straw biochar significantly boosted the abundance of nosZ and nirK genes in acidic soils, indicating an enhanced microbial genetic potential for N2O consumption.
This transition appears to be driven by two interconnected mechanisms. First, biochar improves soil physical structure and aeration, which help to create micro-aerobic conditions that stimulate nosZ-harboring microorganisms and reduce the advantage of anaerobic denitrifiers [51]. Second, biochar likely acts as an electron mediator, enhancing the transfer efficiency required for the energy-intensive reduction step catalyzed by the nosZ enzyme [52]. Collectively, these coordinated functional gene responses indicate that biochar can directionally steer microbial community function pathways that favor the mitigation of N2O emissions, ultimately mitigating net GHG emissions in subtropical plantations [53].

4.3. Limitations and Future Prospects

While this study provides valuable insights, several limitations remain. First, a notable limitation of the present study is that it did not evaluate the role of arbuscular mycorrhizal (AM) fungi. Although AM fungi are widely recognized to influence soil nitrogen cycling, nitrification, denitrification, and nitrogen leaching, their responses to biochar application and potential interactions with N-cycling microbes were not assessed here, leaving a gap in fully understanding the microbial mechanisms of N2O mitigation. Second, this study did not perform high-throughput sequencing to analyze the composition and diversity of narG, nirK, nirS, and nosZ denitrifying bacterial communities. Therefore, the impact of biochar on soil denitrifying bacterial community composition and diversity, as well as their main influencing factors, remains unclear within the scope of this study. Third, despite observing significant mitigation effects six years after a single biochar application, this study lacks continuous interannual monitoring of N2O fluxes and soil properties throughout the entire experimental period. Hence, the interannual dynamic changes and long-term temporal legacy differences in soil N2O emissions need to be further elucidated through extended, multi-site field experiments. Future research should establish long-term continuous monitoring to better guide the practical application of biochar in subtropical forestry.

5. Conclusions

Biochar-amended soil decreased N2O flux and cumulative N2O emission compared to non-amended soils. The high adsorption capacity for NH4+-N and N2O and the enhanced soil aeration in biochar-amended soil may explain the reduction in N2O emissions after six years of application. Biochar amendment reconstructs a soil microenvironment that is less favorable for N2O generation through synergistic improvements in pH, enzyme activity, microbial biomass carbon and nitrogen, dissolved organic carbon and nitrogen, and nutrient content. This regulatory framework operates through the direct improvement in soil physicochemical properties and the closely associated adaptive responses of microbial functional communities that correlate with the mitigated N2O pathways. These findings demonstrate the applicability of biochar amendment to this subtropical plantation system, providing localized evidence for regional greenhouse gas mitigation and facilitating the sustainable valorization of forestry wastes.

Supplementary Materials

The following supporting information can be downloaded at https://www.mdpi.com/article/10.3390/microorganisms14071519/s1, Table S1: Physicochemical properties of the soil. Table S2: Basic properties of the biochar. Figure S1: Monthly variations in soil temperature (ST), soil water content (SWC), and soil pH under different treatments in 2022 and 2023: (a) January; (b) February; (c) March; (d) April; (e) May; (f) June; (g) July; (h) August; (i) September; (j) October; (k) November; (l) December. Different lowercase letters indicate significant differences among treatments at p < 0.05. Figure S2: Relationship between N2O emissions and ST, SWC, and pH in 2022 and 2023.

Author Contributions

Conceptualization, Y.S. (Yuyi Shen), G.X. and L.H.; methodology, Y.S. (Yingjie Sun), G.X., L.H., K.H., Z.T., J.C., J.L. and Y.C.; software, Y.L.; validation, G.X., L.H., K.H., Z.T., J.C., J.L. and Y.C.; formal analysis, Y.L.; investigation, H.S., Y.S. (Yingjie Sun), D.Z., Q.T., L.H., K.H., Z.T., J.C., J.L. and Y.C.; resources, Y.S. (Yuyi Shen) and G.X.; data curation, Y.L., H.S., D.Z. and Q.T.; writing—original draft preparation, Y.L.; writing—review and editing, Y.S. (Yuyi Shen) and G.X.; visualization, Y.L.; supervision, G.X.; project administration, L.H., K.H., Z.T., J.C., J.L. and Y.C.; funding acquisition, Y.S. (Yuyi Shen) and G.X. All authors have read and agreed to the published version of the manuscript.

Funding

This research was funded by the National Natural Science Foundation of China (42267007 and 32460311); Natural Science Foundation of Guangxi (2026GXNSFAA00640022 and 2025GXNSFAA069946); Basic Research Fund of Guangxi Academy of Sciences (CQZ-E-1912); Basic Research Fund of Guangxi Institute of Botany (26004 and 25007).

Data Availability Statement

The data supporting the findings of this study are available from the corresponding authors upon reasonable request.

Acknowledgments

The graphical abstract was created with BioRender.com. We also thank Shanghai Tengyun Biotechnology Co., Ltd. for providing the Hiplot Pro platform (https://hiplot.com.cn/) and valuable tools for data analysis and visualization. We would like to thank Guixia Cheng, Jianchun Liu, Lei Tian, and Zelin Guo for providing assistance with the testing of the experimental samples. We gratefully acknowledge the support from the Guangxi Third Batch of Young Talent Universal Research Project.

Conflicts of Interest

The authors declare that they have no competing financial or non-financial interest.

References

  1. Kopittke, P.M.; Dalal, R.C.; McKenna, B.A.; Smith, P.; Wang, P.; Weng, Z.; van der Bom, F.J.T.; Menzies, N.W. Soil is a major contributor to global greenhouse gas emissions and climate change. Soil 2024, 10, 873–885. [Google Scholar] [CrossRef] [Scilit]
  2. Xu, R.; Prentice, I.C.; Spahni, R.; Niu, H. Modelling terrestrial nitrous oxide emissions and implications for climate feedback. New Phytol. 2012, 196, 472–488. [Google Scholar] [CrossRef] [Scilit] [PubMed]
  3. Deng, B.; Fang, H.; Jiang, N.; Feng, W.; Luo, L.; Wang, J.; Wang, H.; Hu, D.; Guo, X.; Zhang, L. Biochar Is Comparable to Dicyandiamide in the Mitigation of Nitrous Oxide Emissions from Camellia oleifera Abel. Fields. Forests 2019, 10, 1076. [Google Scholar] [CrossRef] [Scilit]
  4. Tian, H.; Xu, R.; Canadell, J.G.; Thompson, R.L.; Winiwarter, W.; Suntharalingam, P.; Davidson, E.A.; Ciais, P.; Jackson, R.B.; Janssens-Maenhout, G.; et al. A comprehensive quantification of global nitrous oxide sources and sinks. Nature 2020, 586, 248–256. [Google Scholar] [CrossRef] [Scilit] [PubMed]
  5. Zhu, G.; Shi, H.; Zhong, L.; He, G.; Wang, B.; Shan, J.; Han, P.; Liu, T.; Wang, S.; Liu, C.; et al. Nitrous oxide sources, mechanisms and mitigation. Nat. Rev. Earth Environ. 2025, 6, 574–592. [Google Scholar] [CrossRef] [Scilit]
  6. Lu, C.Q.; Li, L.C.; Winiwarter, W.; Canadell, J.G.; Liu, W.H.; Tian, H.Q. Underestimation of Future Agricultural Soil N2O Emissions and Abatement Needs. Glob. Change Biol. 2026, 32, e70919. [Google Scholar] [CrossRef] [Scilit] [PubMed]
  7. Thomson, A.J.; Giannopoulos, G.; Pretty, J.; Baggs, E.M.; Richardson, D.J. Biological sources and sinks of nitrous oxide and strategies to mitigate emissions. Philos. Trans. R. Soc. B 2012, 367, 1157–1168. [Google Scholar] [CrossRef] [Scilit] [PubMed]
  8. Qin, W.; Wei, S.P.; Zheng, Y.; Choi, E.; Li, X.; Johnston, J.; Wan, X.; Abrahamson, B.; Flinkstrom, Z.; Wang, B.; et al. Ammonia-oxidizing bacteria and archaea exhibit differential nitrogen source preferences. Nat. Microbiol. 2024, 9, 524–536. [Google Scholar] [CrossRef] [Scilit] [PubMed]
  9. Xiong, R.; Gao, N.; Huang, W.; Zhang, X.; Shen, W. Recent progress in microbial production and consumption of nitrous oxide in agricultural soils. World J. Microbiol. Biotechnol. 2025, 41, 235. [Google Scholar] [CrossRef] [Scilit] [PubMed]
  10. Nguyen, T.B.; Sherpa, K.; Bui, X.T.; Nguyen, V.; Vo, T.D.H.; Ho, H.T.T.; Chen, C.W.; Dong, C.D. Biochar for soil remediation: A comprehensive review of current research on pollutant removal. Environ. Pollut. 2023, 337, 122571. [Google Scholar] [CrossRef] [Scilit] [PubMed]
  11. Yang, J.R.; Xia, L.L.; van Groenigen, K.J.; Zhao, X.; Ti, C.P.; Wang, W.L.; Du, Z.L.; Fan, M.S.; Zhuang, M.H.; Smith, P.; et al. Sustained benefits of long-term biochar application for food security and climate change mitigation. Proc. Natl. Acad. Sci. USA 2025, 122, e2509237122. [Google Scholar] [CrossRef] [Scilit] [PubMed]
  12. Rittl, T.F.; Butterbach-Bahl, K.; Basile, C.M.; Pereira, L.A.; Alms, V.; Dannenmann, M.; Couto, E.G.; Cerri, C.E.P. Greenhouse gas emissions from soil amended with agricultural residue biochars: Effects of feedstock type, production temperature and soil moisture. Biomass Bioenergy 2018, 117, 1–9. [Google Scholar] [CrossRef] [Scilit]
  13. Suddick, E.C.; Six, J. An estimation of annual nitrous oxide emissions and soil quality following the amendment of high temperature walnut shell biochar and compost to a small scale vegetable crop rotation. Sci. Total Environ. 2013, 465, 298–307. [Google Scholar] [CrossRef] [Scilit] [PubMed]
  14. Verhoeven, E.; Six, J. Biochar does not mitigate field-scale N2O emissions in a Northern California vineyard: An assessment across two years. Agric. Ecosyst. Environ. 2014, 191, 27–38. [Google Scholar] [CrossRef] [Scilit]
  15. Kaur, N.; Kieffer, C.; Ren, W.; Hui, D.F. How much is soil nitrous oxide emission reduced with biochar application? An evaluation of meta-analyses. GCB Bioenergy 2023, 15, 24–37. [Google Scholar] [CrossRef] [Scilit]
  16. Chen, W.; Zou, Y.; Dang, Y.; Sakai, T. Spatial distribution and dynamic change monitoring of Eucalyptus plantations in China during 1994–2013. Trees-Struct. Funct. 2022, 36, 405–414. [Google Scholar] [CrossRef] [Scilit]
  17. Xie, Y.; Arnold, R.J.; Wu, Z.H.; Chen, S.; Du, A.; Luo, J. Advances in eucalypt research in China. Front. Agric. Sci. Eng. 2017, 4, 380–390. [Google Scholar] [CrossRef] [Scilit]
  18. Chu, S.; Ouyang, J.; Liao, D.; Zhou, Y.; Liu, S.; Shen, D.; Wei, X.; Zeng, S. Effects of enriched planting of native tree species on surface water flow, sediment, and nutrient losses in a Eucalyptus plantation forest in southern China. Sci. Total Environ. 2019, 675, 224–234. [Google Scholar] [CrossRef] [Scilit] [PubMed]
  19. Ntshuxeko, V.E.; Ruwanza, S. Physical properties of soil in Pine elliottii and Eucalyptus cloeziana plantations in the Vhembe biosphere, Limpopo Province of South Africa. J. For. Res. 2020, 31, 625–635. [Google Scholar] [CrossRef] [Scilit]
  20. Wang, Y.; Zhu, Y.; Meng, S.; Wang, S.; Yang, F.; Qin, F.; Lu, J. Linkages between the soil microbial network and nutrient cycling along a subtropical plantation chronosequence. Plant Soil 2025, 515, 1463–1476. [Google Scholar] [CrossRef] [Scilit]
  21. Zhu, L.; Wang, J.; Weng, Y.; Chen, X.; Wu, L. Soil characteristics of Eucalyptus urophylla × Eucalyptus grandis plantations under different management measures for harvest residues with soil depth gradient across time. Ecol. Indic. 2020, 117, 106530. [Google Scholar] [CrossRef] [Scilit]
  22. Duan, C.Y. Effects of Eucalyptus Branches Biochar Application on Soil Nitrogen Components and Microbiological Characteristics of Eucalyptus Plantation in Northern Guangxi. Master’s Thesis, Guangxi Normal University, Guilin, China, 2020. [Google Scholar]
  23. Mou, Z.; Shen, Y.; Cao, Y.; Wang, Z.; Chen, Y.; Teng, Q.; Huang, K. Effects of Biochar Application on Soil Organic Carbon Component in Eucalyptus Plantations After Five Years in Northern Guangxi. Environ. Sci. 2023, 48, 6869–6879. [Google Scholar] [CrossRef] [Scilit] [PubMed]
  24. Guo, Y.; Wang, D.; Zheng, J.; Zhao, S.; Zhang, X. Effect of Biochar on Soil Greenhouse Gas Emissions in Semi-arid Region. Environ. Sci. 2015, 36, 3393–3401. [Google Scholar] [CrossRef]
  25. Zhou, L.; Li, J.; Mi, C.; Fan, H.; Ma, S.; Shao, J. Effect of straw biochar on availability of phosphorus in brown soil during the freezing and thawing period. Acta Pedol. Sin. 2017, 54, 171–179. [Google Scholar] [CrossRef]
  26. Bao, S. Chemical Analysis for Agricultural Soil; China Agriculture Press: Beijing, China, 2000. [Google Scholar]
  27. Vance, E.D.; Brookes, P.C.; Jenkinson, D.S. An extraction method for measuring soil microbial biomass C. Soil Biol. Biochem. 1987, 19, 703–707. [Google Scholar] [CrossRef] [Scilit]
  28. Guan, S. Soil Enzymes and Their Research Methods; China Agriculture Press: Beijing, China, 1986. [Google Scholar]
  29. Chen, S.; Huang, Y. Determination of respiration, gross nitrification and denitrification in soil profile using BaPS system. J. Environ. Sci. 2006, 18, 937–943. [Google Scholar] [CrossRef] [Scilit] [PubMed]
  30. Wang, Y.; Wang, Y. Quick measurement of CH4, CO2 and N2O emissions from a short-plant ecosystem. Adv. Atmos. Sci. 2003, 20, 842–844. [Google Scholar] [CrossRef] [Scilit]
  31. Zhang, X.; Lv, J.; Zhang, Y.; Li, S.; Chen, X.; Sha, Z. A Meta-Analysis Study on the Use of Biochar to Simultaneously Mitigate Emissions of Reactive Nitrogen Gases (N2O and NO) from Soils. Sustainability 2023, 15, 2384. [Google Scholar] [CrossRef] [Scilit]
  32. Xu, Z.; Zhang, S.; Lakshmanan, P.; Li, Y.; Xu, D.; Zhu, Q. Mitigation of soil acidification is critical for reducing GHG emission and improving soil quality, crop yield and farm economic benefits: Evidence from a global meta-analysis. Field Crops Res. 2025, 322, 109757. [Google Scholar] [CrossRef] [Scilit]
  33. Cayuela, M.L.; Sanchez-Monedero, M.A.; Roig, A.; Hanley, K.; Enders, A.; Lehmann, J. Biochar and denitrification in soils: When, how much and why does biochar reduce N2O emissions? Sci. Rep. 2013, 3, 1732. [Google Scholar] [CrossRef] [Scilit] [PubMed]
  34. Quin, P.; Joseph, S.; Husson, O.; Donne, S.; Mitchell, D.; Munroe, P.; Phelan, D.; Cowie, A.; Van Zwieten, L. Lowering N2O emissions from soils using eucalypt biochar: The importance of redox reactions. Sci. Rep. 2015, 5, 16773. [Google Scholar] [CrossRef] [Scilit] [PubMed]
  35. Zhang, Y.; Yan, C.; Wang, T.; Zhang, G.; Bahn, M.; Mo, F.; Han, J. Biochar strategy for long-term N2O emission reduction: Insights into soil physical structure and microbial interaction. Soil Biol. Biochem. 2025, 202, 109685. [Google Scholar] [CrossRef] [Scilit]
  36. Liu, X.; Liu, X.; Gao, S. The electrochemical mechanism of biochar for mediating the product ratio of N2O/(N2O+N2) in the denitrification process. Sci. Total Environ. 2024, 951, 175566. [Google Scholar] [CrossRef] [Scilit] [PubMed]
  37. Liu, H.; Li, X.H.; Lu, S.; Wang, N.; Li, Y.; Zhang, Y.; Qi, G.; Lu, H.; Dong, H.; Wang, H.; et al. Biennial biochar application mitigates N2O emissions in saline-alkali soils by modulating microbial communities and metabolic pathways. Environ. Technol. Innov. 2025, 40, 104475. [Google Scholar] [CrossRef] [Scilit]
  38. Iturbe-Espinoza, P.; Elsgaard, L.; Sapkota, R.; Ellegaard-Jensen, L.; Winding, A. Eight-year effect of biochar amendment on soil properties, extracellular enzyme activity, N-cycling genes and microbiome structure in two Danish fallow soils. Microbiol. Res. 2026, 303, 128398. [Google Scholar] [CrossRef] [Scilit] [PubMed]
  39. He, L.; Bi, Y.; Zhao, J.; Pittelkow, C.M.; Zhao, X.; Wang, S.; Xing, G. Population and community structure shifts of ammonia oxidizers after four-year successive biochar application to agricultural acidic and alkaline soils. Sci. Total Environ. 2018, 619, 1105–1115. [Google Scholar] [CrossRef] [Scilit] [PubMed]
  40. Zhang, L.; Hu, H.; Shen, J.; He, J. Ammonia-oxidizing archaea have more important role than ammonia-oxidizing bacteria in ammonia oxidation of strongly acidic soils. ISME J. 2012, 6, 1032–1045. [Google Scholar] [CrossRef] [Scilit] [PubMed]
  41. Liu, Q.; Wu, Y.; Ma, J.; Jiang, J.; You, X.; Lv, R.; Zhou, S.; Pan, C.; Liu, B.; Xu, Q.; et al. How does biochar influence soil nitrification and nitrification-induced N2O emissions? Sci. Total Environ. 2024, 908, 168530. [Google Scholar] [CrossRef] [Scilit] [PubMed]
  42. Di, H.J.; Cameron, K.C.; Shen, J.P.; Winefield, C.S.; O’Callaghan, M.; Bowatte, S.; He, J.Z. Nitrification driven by bacteria and not archaea in nitrogen-rich grassland soils. Nat. Geosci. 2009, 2, 621–624. [Google Scholar] [CrossRef] [Scilit]
  43. Cantou, G.; Wang, J.J.; Zhou, B.; Lee, J.-M.; Park, J.-H. Toxicological fate of biochar according to feedstock and pyrolysis temperature. Ind. Crops Prod. 2025, 236, 122094. [Google Scholar] [CrossRef] [Scilit]
  44. Yao, R.-J.; Li, H.-Q.; Yang, J.-S.; Wang, X.-P.; Xie, W.-P.; Zhang, X. Biochar Addition Inhibits Nitrification by Shifting Community Structure of Ammonia-Oxidizing Microorganisms in Salt-Affected Irrigation-Silting Soil. Microorganisms 2022, 10, 436. [Google Scholar] [CrossRef] [Scilit] [PubMed]
  45. Leininger, S.; Urich, T.; Schloter, M.; Schwark, L.; Qi, J.; Nicol, G.W.; Prosser, J.I.; Schuster, S.C.; Schleper, C. Archaea predominate among ammonia-oxidizing prokaryotes in soils. Nature 2006, 442, 806–809. [Google Scholar] [CrossRef] [Scilit] [PubMed]
  46. Morimoto, S.; Hayatsu, M.; Hoshino, Y.T.; Nagaoka, K.; Yamazaki, M.; Karasawa, T.; Takenaka, M.; Akiyama, H. Quantitative Analyses of Ammonia-oxidizing Archaea (AOA) and Ammonia-oxidizing Bacteria (AOB) in Fields with Different Soil Types. Microbes Environ. 2011, 26, 248–253. [Google Scholar] [CrossRef] [Scilit] [PubMed]
  47. Zhang, H.; Sun, H.; Zhou, S.; Bai, N.; Zheng, X.; Li, S.; Zhang, J.; Lv, W. Effect of Straw and Straw Biochar on the Community Structure and Diversity of Ammonia-oxidizing Bacteria and Archaea in Rice-wheat Rotation Ecosystems. Sci. Rep. 2019, 9, 9367. [Google Scholar] [CrossRef] [Scilit] [PubMed]
  48. Li, Q.; Zhao, L.; Wang, F.; Chen, H.; Qian, X. Reduction in N2O Emissions and Improvement in Nitrifier and Denitrifier Communities through Bamboo-Biochar-Based Fertilization in Pomelo Orchard Soil. Agronomy 2023, 13, 2504. [Google Scholar] [CrossRef] [Scilit]
  49. Wang, C.; Lu, H.; Dong, D.; Deng, H.; Strong, P.J.; Wang, H.; Wu, W. Insight into the Effects of Biochar on Manure Composting: Evidence Supporting the Relationship between N2O Emission and Denitrifying Community. Environ. Sci. Technol. 2013, 47, 7341–7349. [Google Scholar] [CrossRef] [Scilit] [PubMed]
  50. Aamer, M.; Shaaban, M.; Hassan, M.U.; Huang, G.; Liu, Y.; Haiying, T.; Rasul, F.; Ma, Q.; Li, Z.; Rasheed, A.; et al. Biochar mitigates the N2O emissions from acidic soil by increasing the nosZ and nirK gene abundance and soil pH. J. Environ. Manag. 2020, 255, 109891. [Google Scholar] [CrossRef] [Scilit] [PubMed]
  51. Liao, J.; Hu, A.; Zhao, Z.; Liu, X.; Jiang, C.; Zhang, Z. Biochar with large specific surface area recruits N2O-reducing microbes and mitigate N2O emission. Soil Biol. Biochem. 2021, 156, 108212. [Google Scholar] [CrossRef] [Scilit]
  52. Harter, J.; El-Hadidi, M.; Huson, D.H.; Kappler, A.; Behrens, S. Soil biochar amendment affects the diversity of nosZ transcripts: Implications for N2O formation. Sci. Rep. 2017, 7, 3338. [Google Scholar] [CrossRef] [Scilit] [PubMed]
  53. Wang, H.; Guo, Y.; Fang, H.; Cheng, S.; Shi, F.; Chen, L.; Pu, H.; Liu, B. Divergent effects of straw and straw-derived biochar on soil N transformation and N2O emissions: A global meta-analysis. J. Environ. Manag. 2025, 395, 127784. [Google Scholar] [CrossRef] [Scilit] [PubMed]
Figure 1. Dose-dependent responses of soil physicochemical properties, microbial biomass, and enzymatic activities to varying biochar application rates: (a) total potassium (TK), total nitrogen (TN), and total phosphorus (TP); (b) available nitrogen (AN), available potassium (AK), and available phosphorus (AP); (c) microbial biomass carbon (MBC), microbial biomass nitrogen (MBN), dissolved organic carbon (DOC), and dissolved organic nitrogen (DON); (d) ammonium nitrogen (NH4+-N) and nitrate nitrogen (NO3-N); (e) urease (UR), protease (PRO), sucrase (SUC), nitrate reductase (NR), nitrite reductase (NiR), and hydroxylamine reductase (HyR). In all the panels, bars represent means ± standard deviation (SD) of three independent replicates (n = 3). Different lowercase letters indicate significant differences among treatments at p < 0.05.
Microorganisms 14 01519 g001
Figure 2. Changes in soil N2O emissions from January to December 2022 and 2023 (a) and their respective annual cumulative emissions (b).
Microorganisms 14 01519 g002
Figure 3. Impact of biochar application rates on nitrogen transformation processes and their relationships with N2O emissions. (a) Responses of total nitrification rate (TNR) and denitrification rate (DNR) to different biochar application rates. Error bars indicate S. D (n = 3), and different letters denote significant differences among treatments (p < 0.05). (b,c) Linear relationships between N2O emissions and TNR (b) and DNR (c). Solid lines represent linear fits, and the shaded areas denote 95% confidence intervals.
Microorganisms 14 01519 g003
Figure 4. Dose-dependent responses of soil nitrogen cycling functional gene abundances and potential denitrification balance to varying biochar application rates: (a) nitrification-related genes (AOA-amoA and AOB-amoA), (b) denitrification-related genes (nirK, nirS, and nosZ), and (c) (nirK + nirS)/nosZ ratio. Gene abundance values in panels (a,b) are presented on a log10 scale (copies g−1 dry soil). In all the panels, bars represent means ± standard deviation (SD) of three independent replicates (n = 3). Different lowercase letters indicate significant differences among treatments at p < 0.05.
Microorganisms 14 01519 g004
Figure 5. Hierarchical clustering heatmap showing the coordinate shifts in soil physicochemical properties, enzyme activities, and nitrogen cycling functional genes across treatments. The original data were standardized using Z-scores to a range of −2.0 (red, below-average intensity) to 2.0 (blue, above-average intensity). Hierarchical clustering of both parameters and treatments was executed using the Ward.D2 algorithm based on Euclidean distances to identify structural similarities and divergent treatment responses. The dendrograms at the top and left represent the clustering relationships among treatments and variables, respectively.
Microorganisms 14 01519 g005
Figure 6. SEM model (a) and standardized impact values (b). Path diagram illustrating the direct and indirect effects of biochar input on soil properties, microbial functions, and N2O emissions. Numbers on arrows are standardised path coefficients. Significant paths are marked with asterisks *. Solid red arrows indicate significant positive effects; solid black arrows indicate significant negative effects; dashed black arrows denote non-significant effects. The coefficient of determination (R2) for each response variable is adjacent to its box.
Microorganisms 14 01519 g006
Table 1. Effects of biochar application on soil basic properties (ST, SWC, and pH) in two growing seasons.
Soil PropertiesGroupMean ± SD (2022)ΔT (°C)Mean ± SD (2023)ΔT (°C)
Soil temperature (°C)CK18.60 ± 0.03 f 18.59 ± 0.04 e
T118.71 ± 0.02 e+0.1118.87 ± 0.10 d+0.28
T218.81 ± 0.02 d+0.2119.04 ± 0.03 c+0.44
T318.87 ± 0.02 c+ 0.2719.12 ± 0.03 bc+ 0.52
T418.94 ± 0.01 b+0.3419.23 ± 0.01 b+0.64
T519.07 ± 0.02 a+0.4719.44 ± 0.16 a+0.84
Soil water content (%)CK18.76 ± 0.08 f 20.28 ± 0.03 f
T119.27 ± 0.07 e+0.5121.27 ± 0.08 e+0.99
T220.46 ± 0.03 d+1.6921.88 ± 0.11 d+1.61
T321.07 ± 0.03 c+2.3023.22 ± 0.06 b+2.94
T422.05 ± 0.10 b+3.2824.12 ± 0.04 c+3.84
T522.89 ± 0.06 a+4.1225.25 ± 0.08 a+4.97
pHCK5.40 ± 0.00 f 5.39 ± 0.00 f
T16.17 ± 0.00 e+0.776.13 ± 0.01 e+0.74
T26.38 ± 0.00 d+0.986.27 ± 0.00 d+0.88
T36.70 ± 0.01 c+1.306.57 ± 0.02 c+1.19
T46.89 ± 0.01 b+1.496.74 ± 0.02 b+1.35
T57.19 ± 0.01 a+1.797.05 ± 0.02 a+1.67
Values are presented as the annual mean ± standard deviation (SD, n = 3). The temperature increase relative to the control (CK) within the same year is shown as ∆T (°C). Different lowercase letters (a, b, c, …) indicate statistically significant differences among treatments based on a one-way ANOVA (p < 0.05).
Disclaimer/Publisher’s Note: The statements, opinions and data contained in all publications are solely those of the individual author(s) and contributor(s) and not of MDPI and/or the editor(s). MDPI and/or the editor(s) disclaim responsibility for any injury to people or property resulting from any ideas, methods, instructions or products referred to in the content.