1. Introduction
Black soil is a critical soil resource in China’s major grain-producing regions and is generally characterized by high organic matter content, a well-developed aggregate structure, and strong nutrient-supplying capacity [
1]. These characteristics reflect the inherent fertility potential of the black soil region rather than the current condition of every cultivated field. The Northeast black soil region is a major commodity-grain production base, and maize is one of its principal crops [
2,
3]. However, long-term intensive cultivation, continuous monocropping, inadequate return of organic residues, imbalanced nutrient inputs, and erosion have contributed to declines in soil organic carbon (SOC), aggregate stability, nutrient-retention capacity, and biological activity in some cultivated black soils [
4,
5,
6]. Consequently, current high maize productivity can coexist with soil degradation: fertilizer and other management inputs may sustain short-term yields, whereas progressive carbon loss and structural deterioration may increase production costs and reduce resilience to climatic variability over the longer term.
Soil microorganisms are essential components of farmland ecosystems. They participate in organic matter decomposition, nitrogen, phosphorus, and potassium transformation, rhizosphere nutrient supply, soil aggregate formation, and crop health maintenance [
7,
8]. Changes in bacterial and fungal community structure therefore provide biologically meaningful indicators of shifts in soil environmental conditions and of the effectiveness of sustainable farmland management practices [
9,
10]. An integrated assessment of soil physicochemical properties and microbial communities is consequently important for black soil conservation, fertility maintenance, and sustainable maize production [
11,
12].
Biochar is a carbon-rich material produced through the pyrolysis of biomass under oxygen-limited conditions [
13]. It is commonly characterized by stable aromatic carbon, a porous structure, mineral ash, surface functional groups, and variable cation-exchange capacity [
14,
15]. These properties can influence soil pH, water retention, nutrient sorption and retention, and microbial habitat conditions [
16,
17]. Although most biochar carbon is relatively stable, smaller labile fractions, surface-associated organic compounds, and adsorption–desorption processes may also alter dissolved organic carbon (DOC) availability and microbial access to substrates. Together with biochar-induced changes in pH and nutrient availability, these processes may influence microbial biomass, extracellular enzyme activity, and coupled carbon, nitrogen, and phosphorus transformations [
15,
18,
19,
20,
21]. The magnitude and direction of these effects depend on feedstock type, pyrolysis conditions, application rate, soil properties, climate, and field management practices [
22,
23,
24,
25].
Biochar also provides a potential pathway for recycling agricultural residues and increasing stable carbon inputs to soil under sustainable agricultural management systems [
13,
21]. In the Northeast black soil region, biochar may influence crop growth and soil microbial processes by regulating pH, enhancing nutrient retention, and modifying the rhizosphere microenvironment [
22,
23]. Therefore, long-term field experiments are needed to determine how different biochar application rates affect soil fertility and microbial communities under realistic interannual variation, rather than under short-term incubation or pot conditions [
24,
25,
26,
27,
28,
29].
Soil bacteria and fungi may respond differently to biochar application [
30]. Bacteria are generally more sensitive to changes in soil pH, nutrient availability, labile carbon sources, and moisture conditions. In contrast, fungi, owing to their hyphal growth form and capacity to decompose complex organic matter, may be more strongly influenced by organic carbon fractions, carbon-to-nitrogen ratios, rhizosphere conditions, and soil pore structure [
31,
32]. Previous studies have shown that biochar can alter bacterial and fungal community composition, affect microbial diversity, shift the relative abundance of dominant taxa, and influence functional microbial groups associated with carbon and nitrogen cycling [
33,
34]. These responses do not necessarily indicate uniform improvement; instead, they may reflect diversity maintenance, selective enrichment of dominant taxa, or broader community restructuring [
35,
36].
Three knowledge gaps remain particularly relevant to black soil maize systems. First, multi-year field evidence regarding rate-dependent biochar effects remains limited because much of the available evidence is derived from pot experiments, greenhouse trials, or short-term incubations [
37]. Second, the coordinated interannual responses of bacterial and fungal communities to the same biochar application rate gradient have rarely been evaluated within a single field experiment [
38,
39]. Third, the relationships among soil nutrient status, pH, microbial diversity, and community reassembly require further clarification through integrated multivariate analyses [
40,
41,
42]. Although biochar may affect active carbon processes, the present study did not directly measure DOC, microbial biomass carbon, enzyme activities, SOC fractions, or soil CO
2 fluxes. Therefore, these processes are discussed only as plausible mechanisms rather than directly demonstrated pathways.
This study focused on a maize farmland ecosystem in the Northeast black soil region, where maintaining soil fertility is closely linked to regional food security. Using a three-year field experiment, we explicitly considered interannual variation, and compared low, medium, and high biochar application rates in terms of soil fertility enhancement, microbial community stability, and community restructuring. This design provides evidence for interpreting ecological trade-offs across the tested application rate gradient without assuming that the highest rate necessarily represents a practical management recommendation.
Accordingly, a field experiment was conducted in a maize field at Sifengshan, Jiamusi City, Heilongjiang Province, China, from 2023 to 2025, with four biochar application rates: 0, 10, 20, and 40 t ha−1. We evaluated soil physicochemical properties, bacterial and fungal alpha diversity, community composition, beta diversity, and differential microbial taxa. Redundancy analysis (RDA) and Spearman correlation analysis were used to examine associations between soil environmental factors and microbial community shifts. We hypothesized that biochar application would improve soil fertility and increase soil pH; that bacterial and fungal communities would respond differently to increasing application rates; and that medium-to-high application rates would induce stronger community reassembly, with the medium rate producing a comparatively balanced microbial response and the high rate exerting stronger selective pressure. Because crop yield, economic feasibility, and direct active carbon mechanisms were not assessed, this study does not define an agronomically optimal biochar application rate.
2. Materials and Methods
2.1. Study Site
The field experiment was conducted from 2023 to 2025 in a maize field at Sifeng Mountain, Jiamusi City, Heilongjiang Province, China. The experimental site was located at 45°45′35″ N and 130°22′59″ E, and the soil was classified as black soil. During the preceding decade, the region had a mean annual precipitation of 688 mm and a reported mean annual temperature of 3 °C. The site is located within a typical maize-producing area of the Northeast black soil region. The plow layer soil texture was suitable for maize cultivation, the cultivation histories of the plots were broadly comparable, and field management followed local conventional maize production practices.
Because microbial communities in open-field agroecosystems can be sensitive to interannual climatic variation, year was included as an explanatory factor in all relevant statistical analyses. This approach enabled the effects of biochar application to be assessed while accounting for interannual variation, rather than treating them as isolated single-factor responses.
Before treatment application, soil samples were collected from the 0–20 cm plow layer to determine baseline physicochemical properties. Initial soil properties were as follows: organic matter, 18.44 g kg−1; total nitrogen, 0.27 g kg−1; alkali-hydrolyzable nitrogen, 164.88 mg kg−1; total phosphorus, 0.83 g kg−1; available phosphorus, 33.11 mg kg−1; total potassium, 21.47 g kg−1; available potassium, 177.88 mg kg−1; and pH, 7.31. Using the conventional conversion factor of 1.724, initial SOC was estimated at 10.70 g kg−1 from the measured organic matter content. This value is provided solely to clarify the baseline carbon status and should not be regarded as a direct SOC measurement. These baseline characteristics provided an appropriate basis for evaluating rate-dependent responses to biochar application in black soil maize farmland.
2.2. Basic Properties of the Tested Soil and Biochar
Maize cultivar ‘Mengfa 9009’ was used in the field experiment. Stanley compound fertilizer was applied at an N–P
2O
5–K
2O nutrient ratio of 25–12–13. The biochar was supplied by Henan Lize Environmental Protection Technology Co., Ltd (Shangqiu, China), and was produced from maize straw by oxygen-limited pyrolysis at 500 °C for 2 h. The dry-mass biochar yield was 30.2%, calculated as the dry mass of recovered biochar divided by the dry mass of input maize straw × 100. Before field application, the biochar was crushed and passed through a 2 mm sieve to facilitate uniform incorporation into the 0–20 cm plow layer. The applied biochar batch contained 447.07 g kg
−1 organic matter, 258.7 g kg
−1 total carbon, 6.01 g kg
−1 total nitrogen, 5.89 g kg
−1 total phosphorus, and 27.61 g kg
−1 total potassium. Its pH was 8.89, ash content was 18.60%, C/N ratio was 43.10, cation-exchange capacity (CEC) was 38.1 cmolc kg
−1, and specific surface area was 86.35 m
2 g
−1. The basic properties of the biochar used in the experiment are presented in
Table 1.
The measured total carbon content, CEC, alkaline pH, potassium content, and specific surface area of the applied biochar provide a physicochemical basis for interpreting its potential effects on soil carbon input, nutrient retention, pH regulation, and microbial habitat conditions. However, these material properties do not demonstrate that soil CEC or active carbon fractions increased after field application, because these soil responses were not directly measured in the present study.
2.3. Experimental Design and Field Management
A randomized complete block design was used to minimize the influence of spatial heterogeneity across the field. The experiment included four biochar application rates, with three independent field replicates per treatment, resulting in a total of 12 experimental plots. Each plot measured 9 m2 (3 m × 3 m), and plots within each block were managed under comparable field conditions. The treatments were 0 t ha−1 (W0, control), 10 t ha−1 (W1, low rate), 20 t ha−1 (W2, medium rate), and 40 t ha−1 (W3, high rate). In each year, one composite soil sample was collected from each replicate plot; thus, three independent composite samples were obtained per treatment for soil physicochemical analyses and microbial sequencing.
The highest biochar rate (40 t ha−1) was intentionally included as an upper-bound intensification scenario to characterize the response range of soil fertility and microbial communities. It was not intended to represent a practical one-season on-farm residue-return rate. Based on the recorded dry-mass biochar yield of 30.2%, W3 was equivalent to the biochar produced from approximately 132.5 t dry maize straw ha−1. This mass-equivalent calculation illustrates why W3 should be interpreted as a boundary-response treatment for evaluating ecological trade-offs and potential nonlinear responses. W2 was included as an intermediate rate to determine whether a less intensive amendment could maintain soil and microbial benefits while reducing biochar input requirements and the potential for stronger community restructuring.
Before maize sowing in 2023, biochar was applied once at the designated rates to the soil surface of each plot and incorporated into the 0–20 cm plow layer by tillage. Maize was sown in early May each year; specifically, on 5 May 2023, 6 May 2024, and 5 May 2025. The crop reached maturity between late September and early October, and maturity-stage soil sampling and harvest were conducted on 28 September 2023, 29 September 2024, and 28 September 2025. Maize was planted at a row spacing of 65 cm and a plant spacing of 25 cm, corresponding to a theoretical density of approximately 61,500 plants ha−1.
Compound fertilizer was applied once before sowing as basal fertilizer at 750 kg ha−1, equivalent to 187.5 kg N ha−1, 90.0 kg P2O5 ha−1, and 97.5 kg K2O ha−1. No topdressing was applied during the maize growing season. All treatments received the same conventional local field management, except for differences in biochar application rate. This three-year field experiment was designed to assess the effects of biochar application rate on soil physicochemical properties, bacterial and fungal community structure, and their relationships with soil environmental factors in maize farmland.
2.4. Soil Sampling and Processing
Soil samples were collected at maize maturity in 2023, 2024, and 2025. In each replicate plot, soil was collected from the 0–20 cm plow layer at five points along a diagonal transect to reduce microsite variability. The five subsamples from each plot were thoroughly homogenized to produce one composite sample, which was treated as an independent biological replicate. Thus, each treatment was represented by three independent biological replicates per year. Across the three-year experiment, 36 composite soil samples were collected (4 treatments × 3 replicates × 3 years) and subsequently allocated to soil physicochemical and microbial community analyses. Surface residues, visible roots, stones, and other debris were removed during sampling.
Each composite sample was divided into two subsamples. One subsample was air-dried, ground, and sieved for soil physicochemical analysis. The other subsample was transferred to sterile centrifuge tubes, transported to the laboratory on dry ice, and stored at −80 °C until high-throughput sequencing of soil bacterial and fungal communities. Microbial sequencing was conducted by Shanghai Personal Biotechnology Co., Ltd. (Shanghai, China). A continuous cold chain was maintained during transport and storage to minimize microbial DNA degradation and potential shifts in community composition.
2.5. Determination of Soil Physicochemical Properties
Soil physicochemical properties were determined using standard agrochemical procedures after the samples had been air-dried, ground, and passed through a 2 mm sieve. Soil pH was measured potentiometrically in a soil-to-deionized-water suspension (1:2.5, w/v) using a calibrated pH meter (PHS-3E, Shanghai INESA Scientific Instrument Co., Ltd., Shanghai, China). Before measurement, the suspension was thoroughly stirred and allowed to equilibrate, and the pH meter was calibrated with standard buffer solutions.
Soil organic matter was determined using the potassium dichromate oxidation method. Briefly, air-dried soil was oxidized with potassium dichromate under acidic heating conditions, and the residual dichromate was quantified by titration. Alkali-hydrolyzable nitrogen was determined using the alkaline hydrolysis diffusion method, in which released ammonia was absorbed and quantified by acid titration. Available phosphorus was extracted with 0.5 mol L−1 NaHCO3 and determined using the molybdenum–antimony colorimetric method with a UV–visible spectrophotometer (TU-1901, Beijing Purkinje General Instrument Co., Ltd., Beijing, China). Available potassium was extracted with neutral ammonium acetate and determined using a flame photometer (FP640, Shanghai Yidian Analytical Instrument Co., Ltd., Shanghai, China).
Total nitrogen was determined using the Kjeldahl method, including sulfuric acid digestion, distillation, and titration. Total phosphorus was determined after acid digestion using the molybdenum–antimony colorimetric method with a UV–visible spectrophotometer, whereas total potassium was determined after acid digestion by flame photometry. Quality-control procedures included reagent blanks, replicate measurements, and instrument calibration before sample analysis. These indicators were used to characterize soil fertility status and its interannual variation in black soil maize farmland under different biochar application rates.
Because biochar contains a substantial proportion of stable carbon, residual biochar particles may have contributed to the measured soil organic matter content. Accordingly, increases in soil organic matter were interpreted as reflecting both exogenous biochar-derived carbon input and changes in the soil organic matter pool, rather than solely an increase in native soil organic matter.
2.6. Soil DNA Extraction, PCR Amplification, and High-Throughput Sequencing
For each composite soil sample, total genomic DNA was extracted from approximately 0.25 g of soil stored at −80 °C using the DNeasy PowerSoil Pro Kit (QIAGEN, Hilden, Germany), according to the manufacturer’s instructions. DNA integrity was assessed by 1% agarose gel electrophoresis, whereas DNA concentration and purity were determined using a NanoDrop 2000 spectrophotometer (Thermo Fisher Scientific, Waltham, MA, USA). Only DNA samples with adequate purity and intact electrophoretic bands were used for subsequent PCR amplification and sequencing library preparation.
For bacterial community analysis, the V3–V4 hypervariable region of the 16S rRNA gene was amplified using primers 338F (5′-ACTCCTACGGGAGGCAGCA-3′) and 806R (5′-GGACTACHVGGGTWTCTAAT-3′). For fungal community analysis, the ITS1 region was amplified using primers ITS1F (5′-CTTGGTCATTTAGAGGAAGTAA-3′) and ITS2R (5′-GCTGCGTTCTTCATCGATGC-3′).
PCR amplification was performed in 25 μL reaction mixtures containing 12.5 μL of 2× Phusion High-Fidelity PCR Master Mix (New England Biolabs, Ipswich, MA, USA), 0.5 μL each of forward and reverse primers (10 μmol L−1), 10 ng of template DNA, and sterile ddH2O to a final volume of 25 μL. Each sample was amplified in three technical replicates, and the replicate amplicons were pooled after PCR to reduce stochastic amplification bias.
The PCR program for bacterial 16S rRNA gene amplification consisted of an initial denaturation at 98 °C for 30 s; 30 cycles of denaturation at 98 °C for 10 s, annealing at 54 °C for 30 s, and extension at 72 °C for 45 s; followed by a final extension at 72 °C for 10 min. The fungal ITS amplification program consisted of an initial denaturation at 98 °C for 30 s; 30 cycles of denaturation at 98 °C for 10 s, annealing at 52 °C for 30 s, and extension at 72 °C for 45 s; followed by a final extension at 72 °C for 10 min. PCR products were verified by 2% agarose gel electrophoresis, and the target amplicons were purified and quantified.
Qualified amplicons were pooled at equimolar concentrations for sequencing library preparation. Paired-end sequencing was performed on the Illumina MiSeq PE300 platform (Illumina, San Diego, CA, USA). The resulting raw reads were subjected to subsequent bioinformatic analysis.
2.7. Bioinformatic Analysis
Raw sequencing reads were subjected to initial quality control to remove adapter sequences, low-quality reads, and reads containing ambiguous bases. Bacterial and fungal reads were then processed separately using QIIME 2 (version 2023.2). The DADA2 plugin was used for read denoising, paired-end read merging, chimera removal, and generation of amplicon sequence variant (ASV) feature tables. ASVs served as the fundamental analytical units for microbial diversity and community composition analyses.
Before diversity and community composition analyses, each ASV feature table was rarefied to the minimum sequencing depth within the corresponding dataset to minimize bias arising from unequal sequencing effort among samples. This normalization enabled comparisons of alpha diversity, beta diversity, and relative taxonomic composition at comparable sequencing depths.
Representative bacterial ASV sequences were taxonomically classified using the SILVA 138.1 database, whereas representative fungal ASV sequences were annotated using the UNITE 8.2 database. Taxonomic assignments were generated with the q2-feature-classifier plugin in QIIME 2 using a confidence threshold of 0.70. Because the 16S rRNA gene V3–V4 region and fungal ITS1 amplicons generally provide reliable taxonomic resolution from the phylum to genus levels, but do not consistently support confident species-level identification for all taxa, ecological interpretation focused primarily on phylum- and genus-level patterns. Species-level assignments were not used for ecological interpretation unless annotation confidence was sufficiently high. To minimize overinterpretation, ecological inferences focused on dominant and differentially enriched genera supported by the SILVA and UNITE annotations. More reliable species- or strain-level identification would require longer marker regions, full-length amplicon sequencing, metagenomic sequencing, or targeted isolation and verification.
Relative abundances of major bacterial and fungal taxa were calculated at the phylum and genus levels. Phylum-level community composition was visualized using stacked bar plots, whereas dominant genera were visualized using heatmaps.
Bacterial and fungal alpha diversity was evaluated using the Chao1, observed ASVs, Shannon, and Simpson indices. Community dissimilarity among samples was calculated using Bray–Curtis distances, and principal coordinate analysis (PCoA) was used to visualize differences in microbial community structure among treatments and years. Permutational multivariate analysis of variance (PERMANOVA) was conducted with 999 permutations based on Bray–Curtis distances to assess the effects of year, biochar application rate, and their interaction on microbial community structure.
LEfSe (version 1.1.2) was used to identify differentially enriched microbial taxa among biochar treatments. The linear discriminant analysis (LDA) score threshold was set to 3.0, with statistical significance defined as p < 0.05. LEfSe results were used to identify taxa enriched under specific treatments, and heatmaps of key differential genera were used to visualize relative abundance patterns across years and treatments.
2.8. Analysis of Relationships Between Microbial Communities and Environmental Factors
Redundancy analysis (RDA) was performed to examine relationships between soil physicochemical variables and bacterial and fungal community structure. Before RDA, genus-level relative-abundance matrices were Hellinger transformed to reduce the disproportionate influence of highly abundant taxa. To minimize multicollinearity among environmental variables, variance inflation factor (VIF) analysis was used to guide variable selection. In the initial model, the VIF values for organic matter (OM), available potassium (AK), and pH were 55.20, 29.68, and 18.06, respectively. All values exceeded the commonly used threshold of 10, indicating substantial multicollinearity. After removal of OM, which had the highest VIF value, six environmental variables were retained for subsequent RDA: AK, total phosphorus (TP), total potassium (TK), pH, available phosphorus (AP), and alkali-hydrolyzable nitrogen (AN). Their final VIF values were 5.69, 4.57, 3.41, 2.82, 2.77, and 2.55, respectively; all were ≤10.
The significance of the RDA model was assessed using 999 permutations. Spearman correlation analysis was conducted to examine relationships between dominant genera and soil physicochemical variables, and significant correlations were visualized using correlation heatmaps. To control the false-positive risk associated with multiple comparisons, p values were adjusted using the Benjamini–Hochberg false discovery rate (FDR) procedure. Correlations with FDR-adjusted p < 0.05 were considered statistically significant. Associations with raw p < 0.05 but FDR-adjusted p ≥ 0.05 were considered nominally significant before multiple-testing correction, but were not interpreted as statistically significant after FDR adjustment.
2.9. Statistical Analysis
Soil physicochemical properties and microbial alpha diversity indices were expressed as mean ± standard deviation (SD) or mean ± standard error (SE), as specified in the corresponding tables and figures. Linear mixed models (LMMs) were used to evaluate the effects of year, biochar application rate, and their interaction on soil physicochemical properties. Year, biochar application rate, and their interaction were specified as fixed effects, whereas block and plot identity nested within block were included as random effects to account for the randomized complete block design and repeated annual measurements from the same plots. For complementary comparison with a conventional factorial approach, two-way analysis of variance (ANOVA) was also performed using the model: Value ~ Year × Treatment. Tukey’s honestly significant difference (HSD) test was used for post hoc pairwise comparisons when significant effects were detected, with statistical significance defined as p < 0.05. Because the same field experiment was monitored across years, results were interpreted primarily in terms of temporal trends and treatment-associated differences rather than as evidence of simple dose–response causality.
Microbial beta diversity was quantified using Bray–Curtis dissimilarities and visualized by principal coordinate analysis (PCoA). Permutational multivariate analysis of variance (PERMANOVA) was used to assess the effects of year, biochar application rate, and their interaction on bacterial and fungal community structure. General statistical analyses of soil physicochemical properties were conducted using SPSS Statistics 26, R, and Origin 2021. Redundancy analysis was conducted using Canoco 5 and R packages, as appropriate. High-throughput sequencing data were processed using the GeneCloud platform and the QIIME 2-based bioinformatic workflows described above.
3. Results and Analysis
3.1. Effects of Biochar Application on Soil Physicochemical Properties in Black Soil Maize Farmland
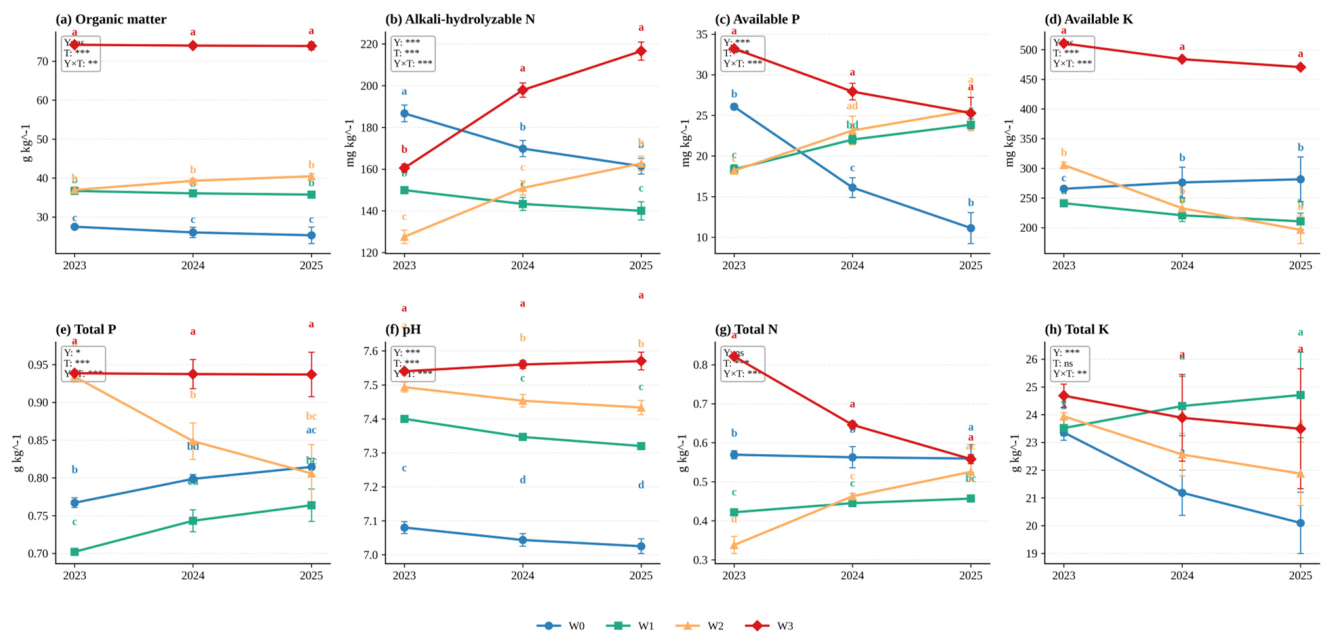
From 2023 to 2025, soil physicochemical properties in black soil maize farmland differed among biochar application rates and exhibited substantial interannual variation (
Figure 1). Linear mixed-model results (
Table 2) showed that biochar application rate had highly significant effects on organic matter, alkali-hydrolyzable nitrogen, available phosphorus, available potassium, total phosphorus, pH, and total nitrogen (
p < 0.001), whereas its effect on total potassium was not significant (
p = 0.734). Year had highly significant effects on alkali-hydrolyzable nitrogen, available phosphorus, pH, and total potassium (
p < 0.001), as well as a significant effect on total phosphorus (
p = 0.022). In contrast, year had no significant effects on organic matter, available potassium, or total nitrogen. The year × biochar application rate interaction was significant or highly significant for all measured soil properties. In particular, the interactions for alkali-hydrolyzable nitrogen, available phosphorus, available potassium, total phosphorus, pH, and total nitrogen were highly significant (
p < 0.001). These results indicate that the effects of biochar application on soil physicochemical properties were dependent on application rate and varied across years during the three-year field experiment.
The two-way ANOVA results were broadly consistent with the linear mixed-model results, showing significant effects of biochar application rate on most measured soil physicochemical properties and significant year × biochar application rate interactions for several nutrient-related variables. These findings further support the conclusion that the effects of biochar application on soil fertility were dependent on application rate, and varied across years. Detailed PERMANOVA results for bacterial and fungal community structures are presented in
Table 3.
For soil organic matter, W3 consistently exhibited the highest measured values across the three-year experiment, reaching 74.23, 74.02, and 73.91 g kg−1 in 2023, 2024, and 2025, respectively. These values were substantially higher than the corresponding W0 values of 27.50, 26.04, and 25.30 g kg−1. Soil organic matter contents under W1 and W2 were also higher than those under W0. Under W2, soil organic matter increased overall from 36.94 g kg−1 in 2023 to 40.46 g kg−1 in 2025. Notably, the large increase in measured soil organic matter under W3 may reflect both direct inputs of stable biochar-derived carbon and changes in the soil organic matter pool. Therefore, this result should be interpreted as an increase in total measured soil organic matter after biochar application, rather than as evidence solely of newly formed native soil organic matter.
Alkali-hydrolyzable nitrogen differed markedly among biochar application rates. W0 and W1 declined overall during the experiment, with W0 decreasing from 186.69 to 161.40 mg kg−1 and W1 from 149.91 to 140.00 mg kg−1. In contrast, W2 and W3 increased overall, with W2 rising from 127.57 to 162.68 mg kg−1 and W3 from 160.51 to 216.55 mg kg−1. These temporal patterns were consistent with treatment-associated increases in alkali-hydrolyzable nitrogen under the medium and high biochar application rates, particularly under W3.
Available phosphorus and available potassium also showed distinct responses to biochar application. Available phosphorus in W0 decreased from 26.08 to 11.13 mg kg−1, whereas concentrations under W1 and W2 increased from 18.37 and 18.20 mg kg−1 to 23.85 and 25.63 mg kg−1, respectively. These patterns indicate that the W1 and W2 treatments were associated with maintained or increased available phosphorus relative to W0. Although available phosphorus under W3 decreased from 33.22 to 25.29 mg kg−1, it remained higher than that under W0 throughout the experiment. For available potassium, W3 consistently exhibited substantially higher values than the other treatments, reaching 510.47, 483.88, and 470.59 mg kg−1 in 2023, 2024, and 2025, respectively. This pattern may partly reflect the relatively high potassium content of the maize-straw-derived biochar.
Soil pH increased across the biochar application rate gradient. In W0, pH decreased slightly from 7.08 to 7.02 over the three-year period, whereas pH in W3 increased from 7.54 to 7.57, and remained highest among the treatments. Soil pH under W1 and W2 remained within the ranges of 7.32–7.40 and 7.43–7.49, respectively. These results indicate that the alkaline biochar application was associated with higher pH in the 0–20 cm plow layer.
Overall, biochar application was associated with higher measured soil organic matter, treatment-specific changes in alkali-hydrolyzable nitrogen, available phosphorus, and available potassium, and elevated soil pH. These changes in soil environmental conditions may provide an important context for the observed shifts in microbial community structure.
3.2. Sequencing Data Quality of Soil Microorganisms
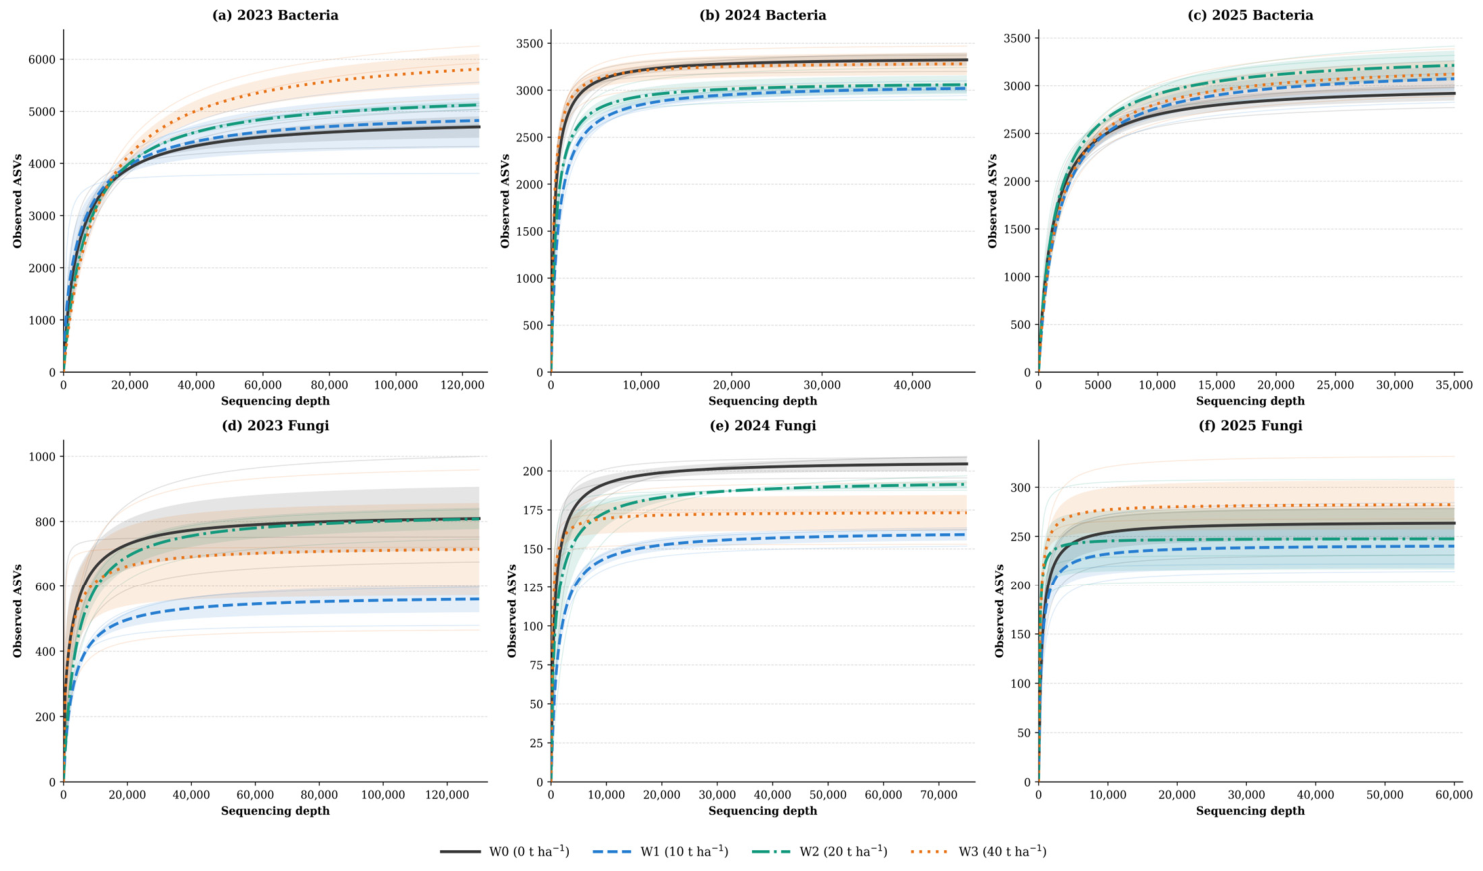
Sequencing data from bacterial and fungal communities across biochar application rates from 2023 to 2025 showed adequate coverage (
Table 4;
Figure 2). Good’s coverage values for bacterial samples were ≥0.98, whereas those for fungal samples were approximately 0.999, indicating that sequencing effort was sufficient to represent the dominant bacterial and fungal taxa in the sampled soils.
Table 4 summarizes bacterial and fungal sequencing characteristics separately for 2023, 2024, and 2025. In 2023, bacterial effective sequence counts ranged from 90,976 to 115,063, and mean ASV richness values ranged from 4654.4 to 5773.9. In 2024, bacterial effective sequence counts ranged from 39,211 to 43,738, with mean ASV richness values ranging from 3016.3 to 3319.1. Following rarefaction in 2025, bacterial sequencing depth was standardized at 34,134 reads per sample, and mean ASV richness values ranged from 2917.3 to 3209.7. Fungal sequencing data also exhibited high coverage, although fungal ASV richness varied among years and biochar application rates. Presenting the sequencing characteristics separately by year allows sequencing output and microbial richness to be interpreted in the context of interannual variation.
Rarefaction curves showed that ASV richness increased with sequencing depth and approached a plateau as the number of reads increased, indicating that additional sequencing would be expected to yield relatively few additional ASVs. These results suggest that sequencing depth was sufficient to capture most detectable bacterial and fungal diversity in the soil samples. Therefore, the sequencing data were adequate for subsequent analyses of microbial community structure in black soil maize farmland across different biochar application rates.
3.3. Effects of Biochar Application on Soil Bacterial Alpha Diversity
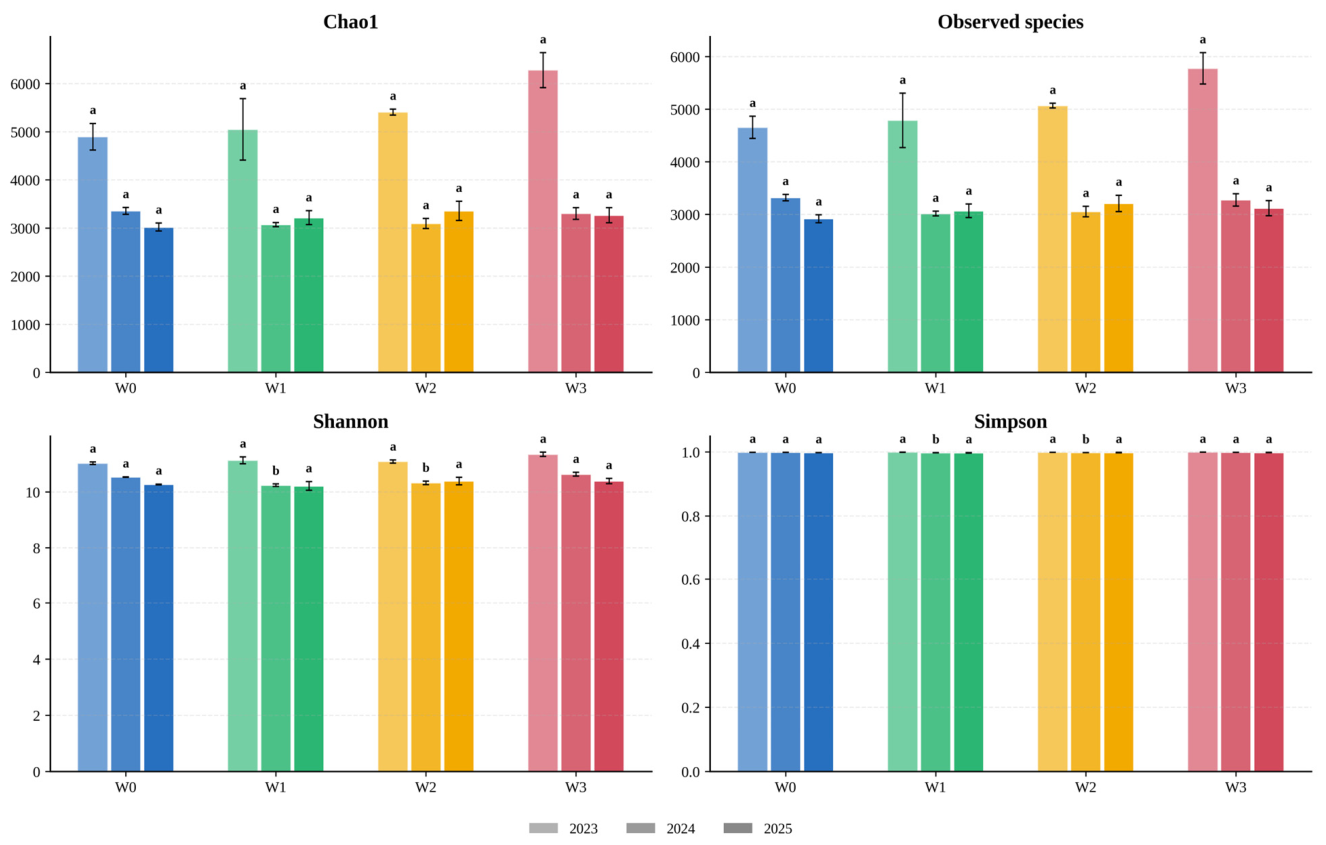
Bacterial alpha diversity patterns differed among biochar application rates and varied across years (
Figure 3). In 2023, bacterial alpha diversity indices were generally high, and Chao1, observed ASVs, Shannon, and Simpson indices were comparatively high under W3. This pattern was consistent with relatively greater bacterial richness and diversity under the high biochar application rate during the first year of the experiment. In 2024, bacterial alpha diversity was generally lower than in 2023, and differences among biochar application rates were less pronounced. Nevertheless, W3 retained comparatively high Shannon and Simpson indices, indicating relatively high bacterial diversity and evenness under the high application rate.
In 2025, bacterial alpha diversity again differed among biochar application rates. Chao1, observed ASVs, and Shannon indices were higher under W2, whereas the Simpson index was higher under W3. These results suggest that, after three years of field application, the medium and high biochar rates were associated with comparatively high bacterial alpha diversity, although the responses differed among diversity indices. Overall, bacterial alpha diversity did not exhibit a linear response to biochar application rate; instead, it varied according to both application rate and year. In the context of the observed changes in soil physicochemical properties, the medium and high biochar rates may have contributed to soil conditions associated with shifts in bacterial diversity. However, the present results do not directly demonstrate the specific mechanisms underlying these associations.
3.4. Effects of Biochar Application on Soil Fungal Alpha Diversity
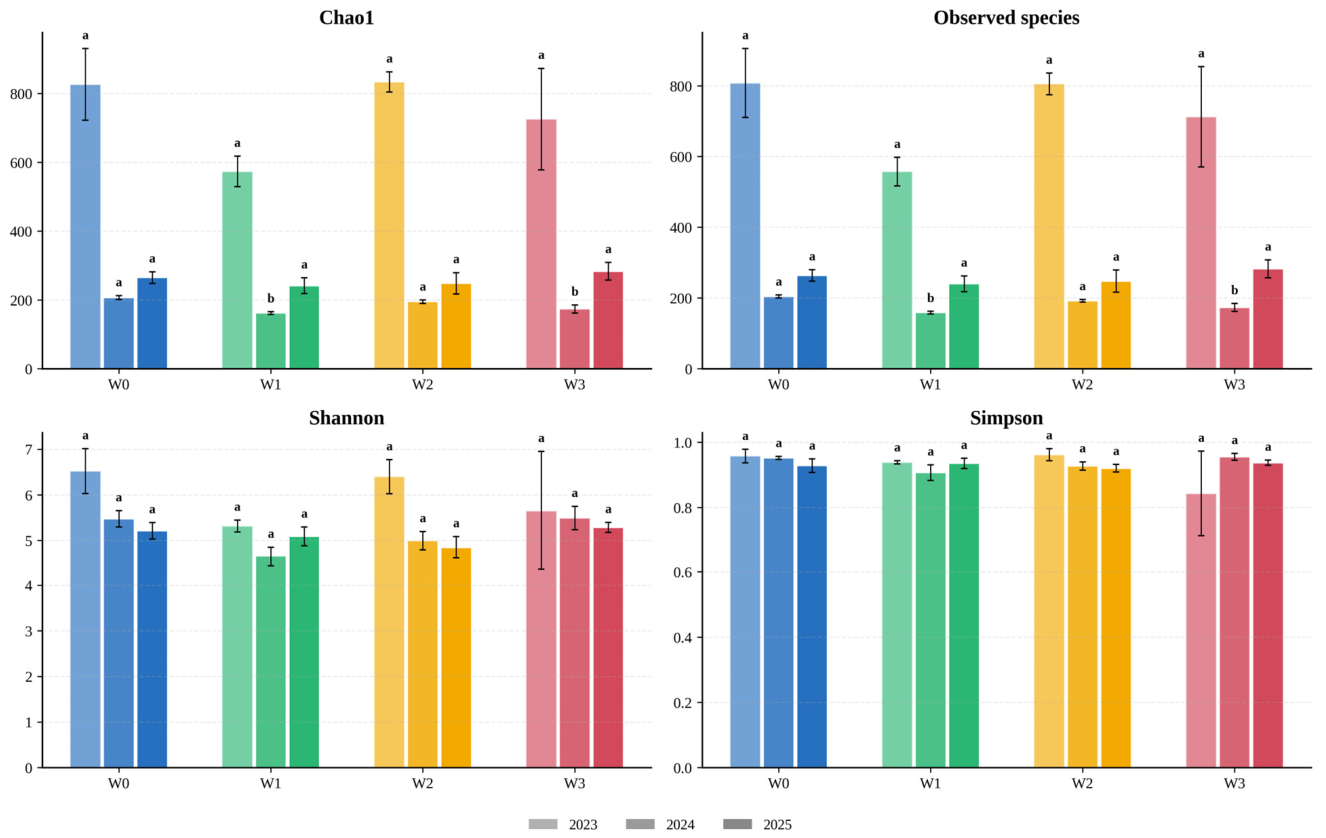
Fungal alpha diversity patterns showed greater interannual variation than bacterial alpha diversity, and differed among biochar application rates (
Figure 4). In 2023, fungal richness was comparatively high, and Chao1 and observed ASV indices were higher under W0 and W2. This pattern was consistent with relatively high fungal richness under the medium biochar application rate during the first year of the experiment. In 2024, fungal alpha diversity was lower across all treatments than in 2023, indicating substantial interannual variation in fungal community diversity. In 2025, fungal richness partially recovered relative to 2024. In particular, W3 exhibited higher Chao1, observed ASV, and Shannon indices, indicating comparatively high fungal richness and diversity under the high biochar application rate in the third year.
Overall, fungal alpha diversity exhibited pronounced interannual variation. The response pattern differed across years: W2 was associated with relatively high fungal richness in the first year, whereas W3 was associated with comparatively high fungal richness and diversity in 2025. These patterns may be related to temporal changes in soil conditions following biochar application. However, because soil carbon fractions, pore characteristics, and rhizosphere processes were not directly measured, the specific mechanisms underlying the observed fungal community responses cannot be determined from the present data.
3.5. Effects of Biochar Application on Soil Bacterial Community Composition
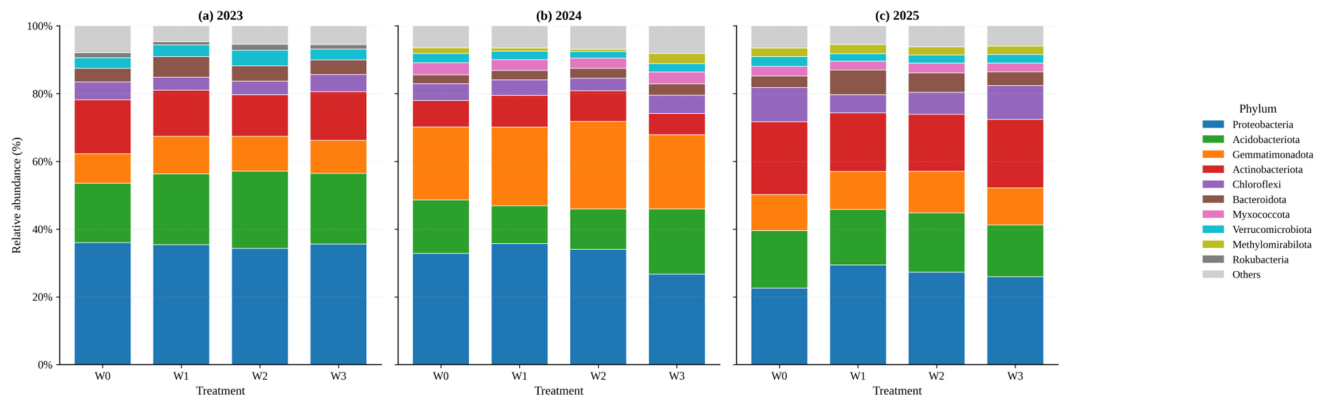
From 2023 to 2025, bacterial communities in black soil maize farmland were dominated by Proteobacteria, Acidobacteriota, Actinobacteriota, Gemmatimonadota, Chloroflexi, and Bacteroidota (
Figure 5). Proteobacteria was the most abundant phylum in all three years, although its mean relative abundance declined over time. In contrast, the mean relative abundances of Actinobacteriota and Chloroflexi were higher in 2025, whereas Gemmatimonadota showed a pronounced increase in 2024. These results indicate that the relative abundances of dominant bacterial phyla varied across years and among biochar application rates. However, because no phylum-level evenness or compositional balance metric was evaluated, the observed patterns should not be interpreted as definitive evidence of a shift toward a more balanced bacterial community.
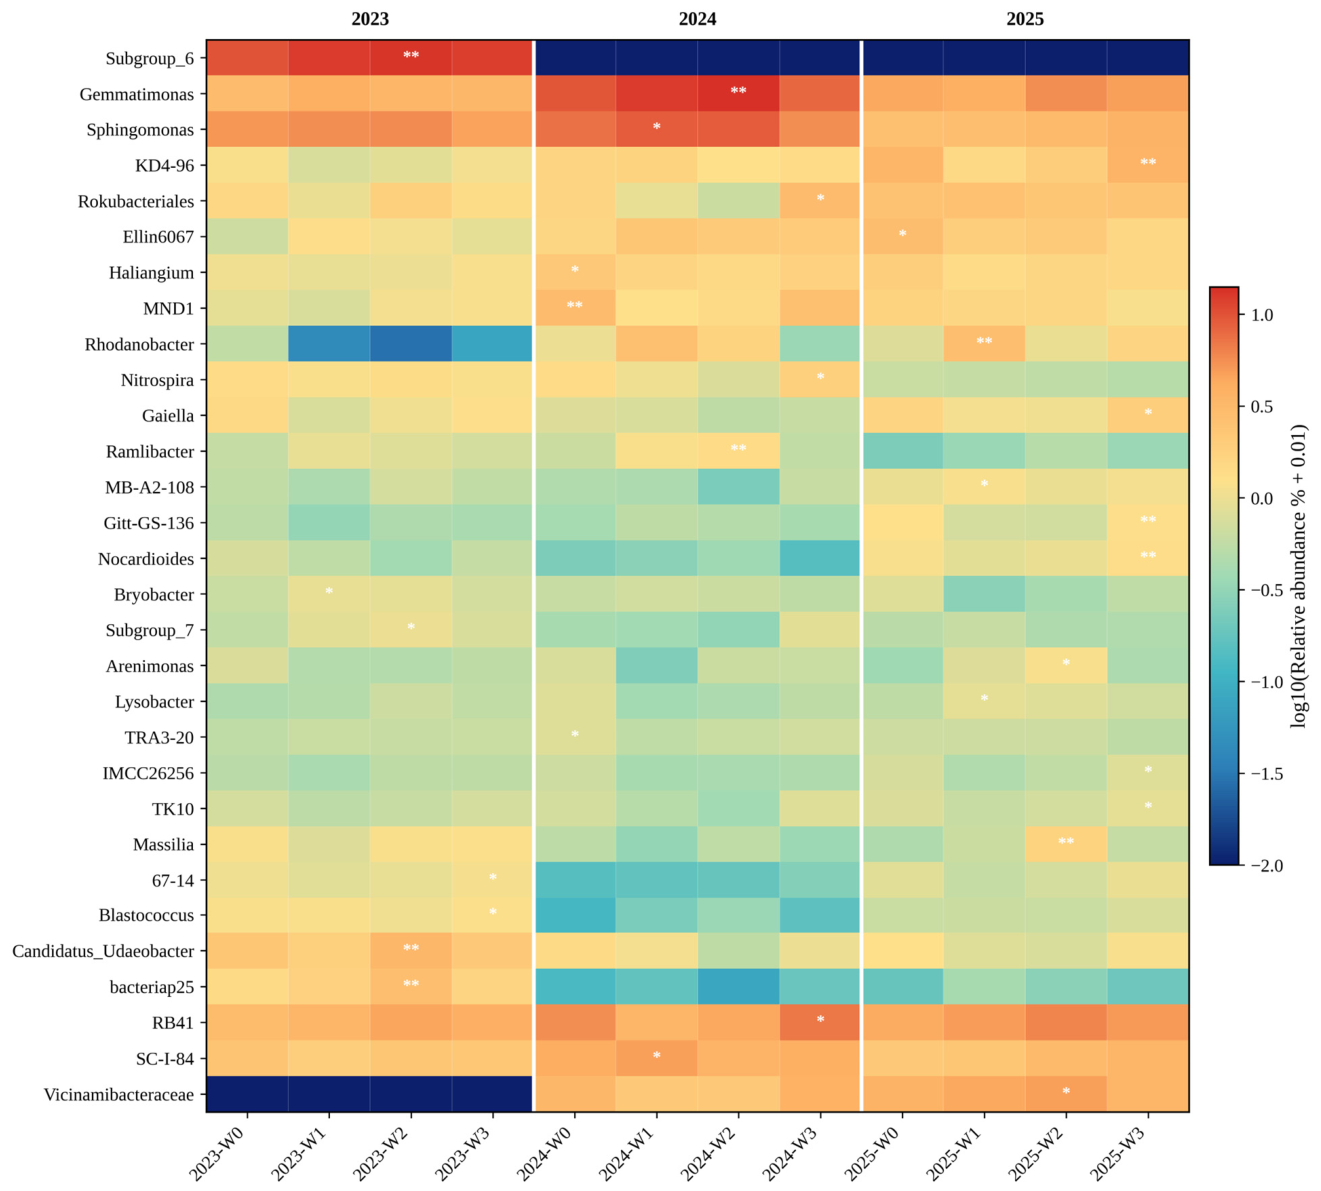
Genus-level heatmaps further indicated that Gemmatimonas, Sphingomonas, RB41, SC-I-84, KD4-96, Rokubacteriales, MND1, Haliangium, Rhodanobacter, Nitrospira, and other dominant bacterial taxa varied across biochar application rates and years (
Figure 6). Gemmatimonas and Sphingomonas exhibited comparatively high relative abundances under W1 and W2 in 2024, whereas RB41 was relatively abundant under W2 in 2025. KD4-96 and Nitrospira showed comparatively high relative abundances under W3 in 2025. These patterns indicate that medium and high biochar application rates were associated with shifts in the relative abundances of several dominant bacterial taxa. The ecological functions of these taxa cannot be directly inferred from 16S rRNA gene amplicon data alone. Functional interpretations based on taxonomic annotations and the published literature should therefore be verified using functional gene analysis, metagenomic sequencing, enzyme activity measurements, or targeted isolation and characterization.
3.6. Effects of Biochar Application on Soil Fungal Community Composition
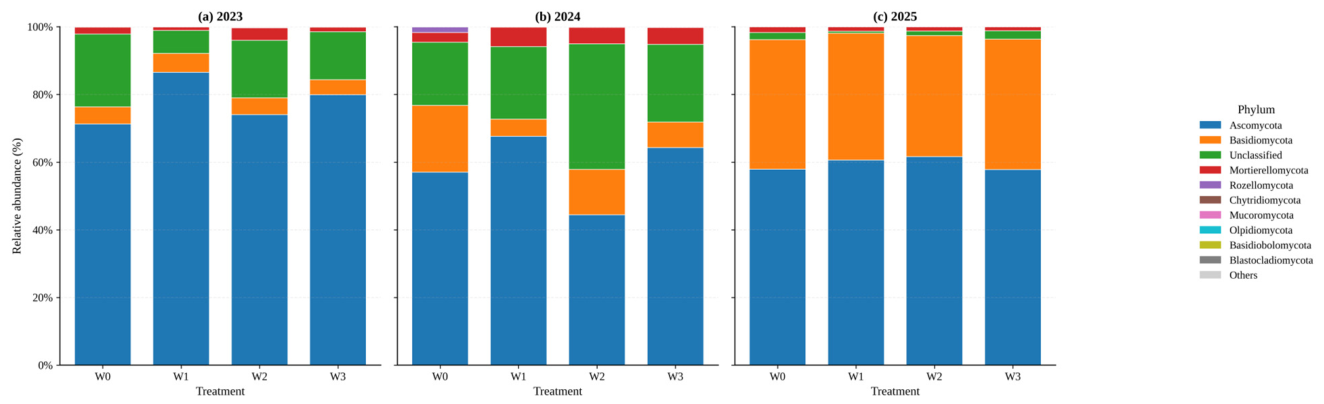
Soil fungal communities were dominated by Ascomycota, Basidiomycota, and Mortierellomycota (
Figure 7). Ascomycota was the most abundant phylum in all three years, although its mean relative abundance was lower in 2024 and 2025 than in 2023. In contrast, the mean relative abundance of Basidiomycota was higher in 2025. These results indicate that the relative abundances of the dominant fungal phyla varied across years and among biochar application rates. However, because no phylum-level evenness or compositional balance metric was evaluated, these patterns should not be interpreted as definitive evidence of a shift toward a more balanced fungal community.
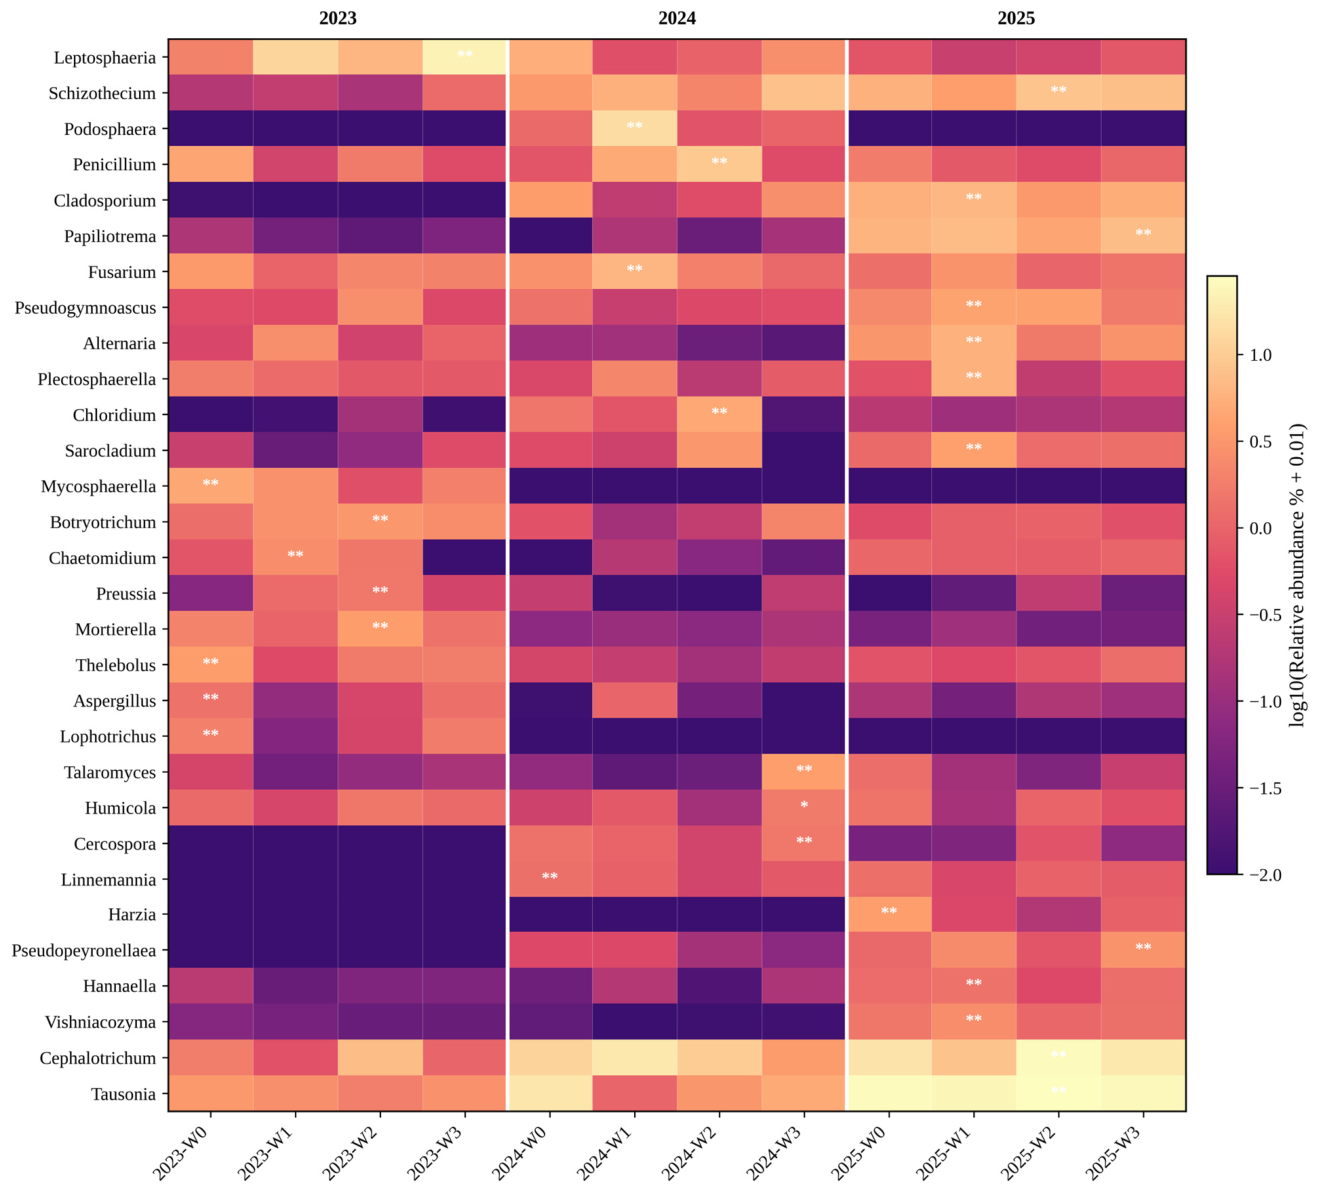
Genus-level heatmaps indicated that several dominant fungal taxa, including Leptosphaeria, Tausonia, Cephalotrichum, Podosphaera, Penicillium, Mortierella, Humicola, Chaetomidium, Mycothermus, Thermomyces, and Solicoccozyma, varied across years and biochar application rates (
Figure 8). In 2023, Leptosphaeria exhibited a comparatively high relative abundance under W3. In 2024 and 2025, Tausonia and Cephalotrichum showed comparatively higher relative abundances in several treatments, consistent with substantial interannual variation in fungal community composition. Mortierella and several taxa assigned to Basidiomycota also showed relatively high abundances in biochar-amended treatments. However, trophic roles and decomposition functions cannot be directly inferred from taxonomic annotations alone. Therefore, potential relationships between these taxa, organic carbon transformation, and fungal niche differentiation require verification using functional gene analysis, metagenomic sequencing, enzyme activity measurements, or targeted isolation and characterization. Species-level and functional-guild interpretations should consequently be made cautiously.
Fungal communities exhibited pronounced compositional variation at the phylum and genus levels across years. The lower relative abundance of Ascomycota and the higher relative abundance of Basidiomycota in later years reflected year-associated shifts in the dominant fungal phyla. However, direct comparison of the magnitude of fungal and bacterial community reorganization would require formal cross-domain statistical testing.
3.7. Effects of Biochar Application on Soil Bacterial and Fungal Beta Diversity
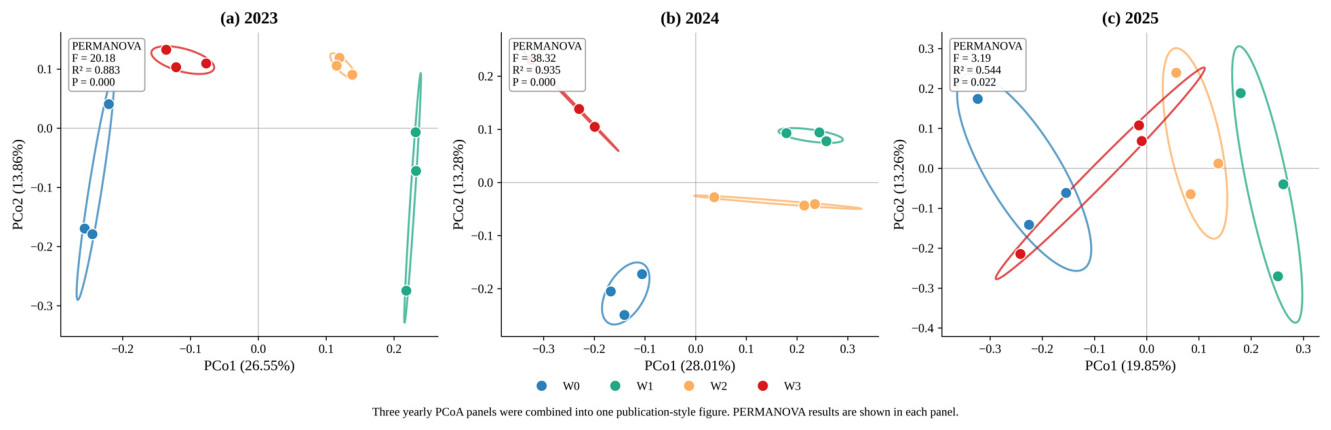
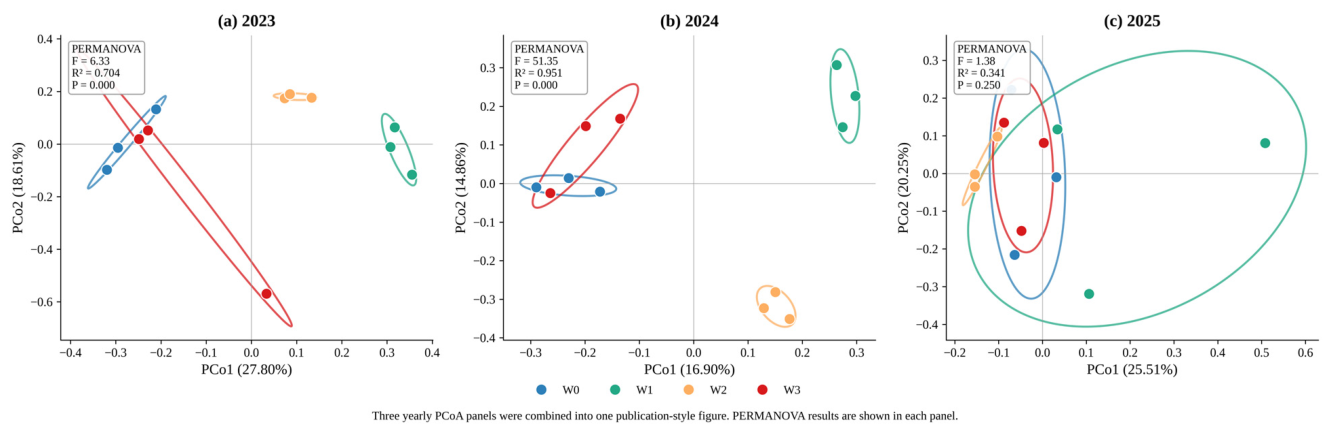
Bray–Curtis-based principal coordinate analysis (PCoA) indicated year- and biochar application-rate-associated differences in bacterial and fungal community composition (
Figure 9 and
Figure 10). Bacterial communities exhibited partial clustering and separation among biochar application rates. In selected year-specific ordinations, W2 and W3 were separated from W0, consistent with treatment-associated differences in bacterial community composition. Sample distributions also differed among years, indicating that bacterial community composition varied across years, as well as among biochar application rates.
PERMANOVA of bacterial Bray–Curtis dissimilarities indicated significant effects of year, biochar application rate, and their interaction on bacterial community composition. Year explained the largest proportion of variation (F = 46.456, R2 = 0.667, p = 0.001). Biochar application rate also had a significant effect (F = 2.809, R2 = 0.060, p = 0.013), as did the year × biochar application rate interaction (F = 2.334, R2 = 0.101, p = 0.004). The significant interaction indicated that treatment-associated differences in bacterial community composition varied among years. In year-specific analyses, biochar application rate significantly affected bacterial community composition in 2023 (F = 2.984, R2 = 0.528, p = 0.001) and 2024 (F = 5.578, R2 = 0.677, p = 0.001), whereas the treatment effect was not significant in 2025 (F = 1.281, R2 = 0.324, p = 0.133).
Fungal PCoA likewise showed differences in sample distribution among years and biochar application rates. PERMANOVA indicated that year significantly affected fungal community composition (F = 31.626, R2 = 0.586, p = 0.001), and biochar application rate also had a significant effect (F = 2.116, R2 = 0.059, p = 0.020). The year × biochar application rate interaction was also significant (F = 2.381, R2 = 0.132, p = 0.004). In year-specific analyses, biochar application rate significantly affected fungal community composition in 2023 (F = 1.932, R2 = 0.420, p = 0.024) and 2024 (F = 3.680, R2 = 0.580, p = 0.001), whereas the treatment effect was not significant in 2025 (F = 1.332, R2 = 0.333, p = 0.165).
Overall, bacterial and fungal beta diversity was significantly associated with year, biochar application rate, and their interaction. In both datasets, year explained a substantially larger proportion of variation than biochar application rate (bacteria: R2 = 0.667 vs. 0.060; fungi: R2 = 0.586 vs. 0.059). Thus, interannual variation represented by year was the dominant source of compositional variation captured by the models, whereas biochar application rate explained a smaller but statistically significant component. Because year may reflect multiple unmeasured temporal factors, its effect should not be attributed to any single environmental driver.
3.8. Analysis of Differential Microbial Taxa Under Different Biochar Treatments
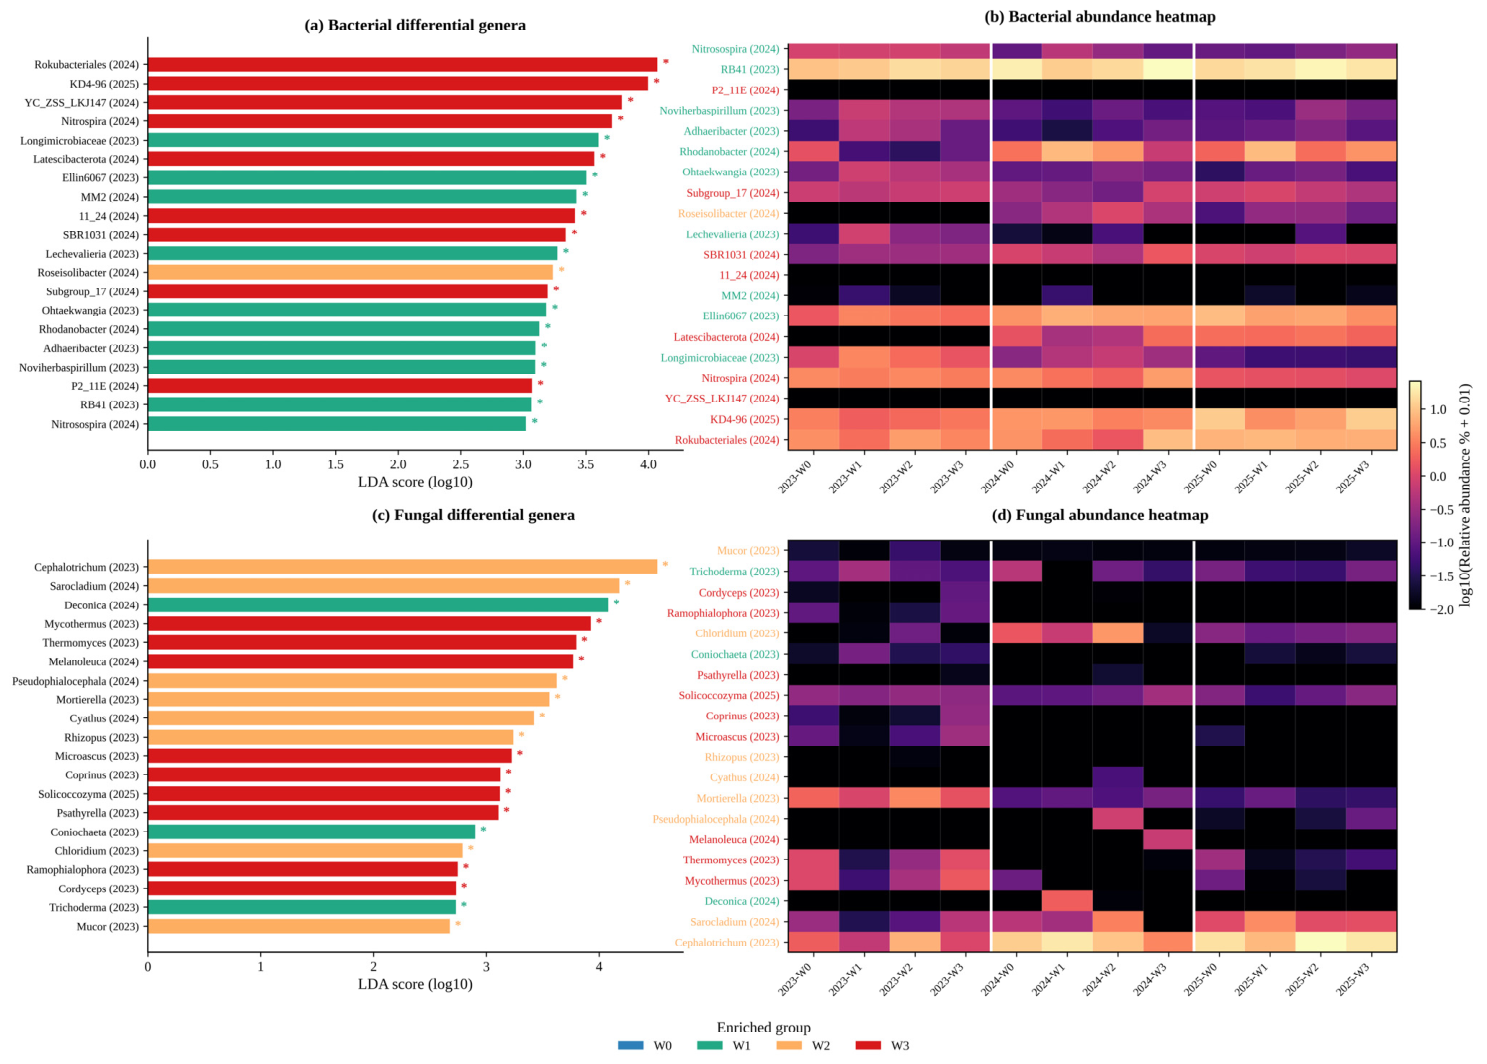
LEfSe analysis identified bacterial and fungal taxa that were differentially enriched among biochar application rates (
Figure 11 and
Supplementary Figures S1–S3), indicating treatment-associated differences in microbial community composition.
Within the bacterial community, W1 was associated with the enrichment of Longimicrobiaceae, Ellin6067, MM2, Lechevalieria, Ohtaekwangia, Rhodanobacter, Adhaeribacter, Noviherbaspirillum, RB41, and Nitrosospira. Roseisolibacter was differentially enriched under W2. W3 was associated with a larger set of discriminatory bacterial taxa, including Rokubacteriales, KD4-96, YC_ZSS_LKJ147, Nitrospira, Latescibacterota, SBR1031, Subgroup_17, and P2_11E. The high LDA scores of Rokubacteriales and KD4-96 under W3 indicate that these taxa made relatively large contributions to treatment discrimination in the LEfSe analysis; however, these scores should not be interpreted as direct measures of overall community dissimilarity.
Within the fungal community, W1 was associated with the enrichment of Deconica, Coniochaeta, and Trichoderma. W2 was associated with the enrichment of Cephalotrichum, Sarocladium, Pseudophialocephala, Mortierella, Cyathus, Rhizopus, Chloridium, and Mucor. W3 was associated with the enrichment of Mycothermus, Thermomyces, Melanoleuca, Microascus, Coprinus, Solicoccozyma, Psathyrella, Ramophialophora, and Cordyceps. Some taxa enriched under W2 have been reported in previous studies as potentially associated with saprotrophic activity or organic matter decomposition. However, their functional roles and in situ activities cannot be confirmed from ITS amplicon data alone.
Overall, the low, medium, and high biochar application rates were associated with distinct sets of discriminatory bacterial and fungal taxa. W3 showed a comparatively broader set of treatment-associated biomarkers in both bacterial and fungal communities. These findings support the conclusion that microbial community composition differed among biochar application rates. However, the specific environmental mechanisms underlying these differences cannot be determined solely from LEfSe results, and require direct measurements of soil environmental variables and microbial functional potential or activity.
3.9. Relationships Between Soil Environmental Factors and Microbial Community Structure
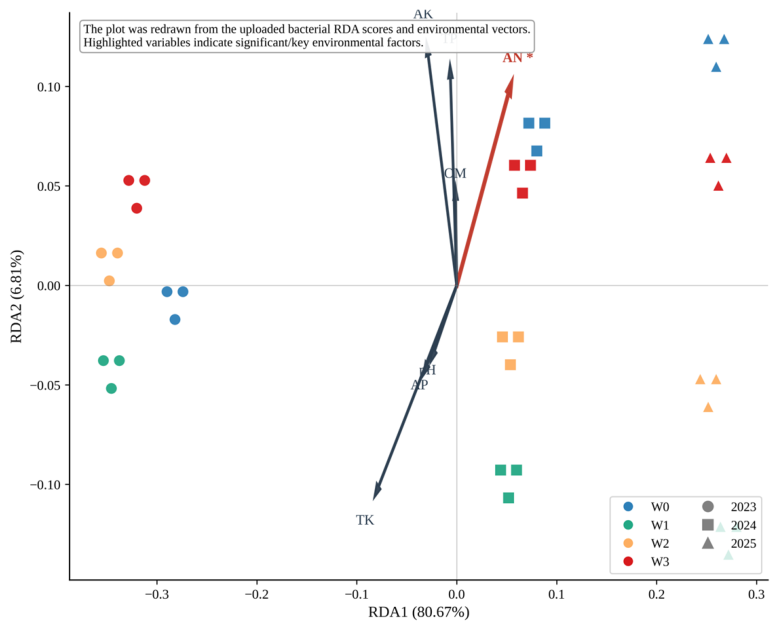
Before RDA, variance inflation factor (VIF) analysis was conducted to assess multicollinearity among the environmental variables. In the initial model, the VIF values for organic matter (OM), available potassium (AK), and pH were 55.20, 29.68, and 18.06, respectively. All values exceeded the commonly used threshold of 10, indicating substantial multicollinearity. After removal of OM, which had the highest VIF value, six environmental variables were retained in the final RDA model: AK, total phosphorus (TP), total potassium (TK), pH, available phosphorus (AP), and alkali-hydrolyzable nitrogen (AN). Their final VIF values were 5.69, 4.57, 3.41, 2.82, 2.77, and 2.55, respectively; all were below 10, indicating that multicollinearity was within an acceptable range in the final model.
The overall bacterial RDA model was significant (F = 1.689,
p = 0.043), and the retained environmental variables collectively explained 25.90% of the variation in bacterial community composition. This result (
Figure 12) indicates that the measured soil nutrient variables and pH were jointly associated with bacterial community variation. In marginal permutation tests, AN was significant before false discovery rate (FDR) adjustment (F = 2.535, R
2 = 0.065,
p = 0.045). However, its Benjamini–Hochberg-adjusted
p value was 0.264, and it was no longer significant after FDR correction. AK, pH, TK, TP, and AP were also not significant after FDR adjustment. Therefore, although the environmental variables collectively explained a significant proportion of bacterial community variation, no individual measured variable remained statistically significant after correction for multiple comparisons.
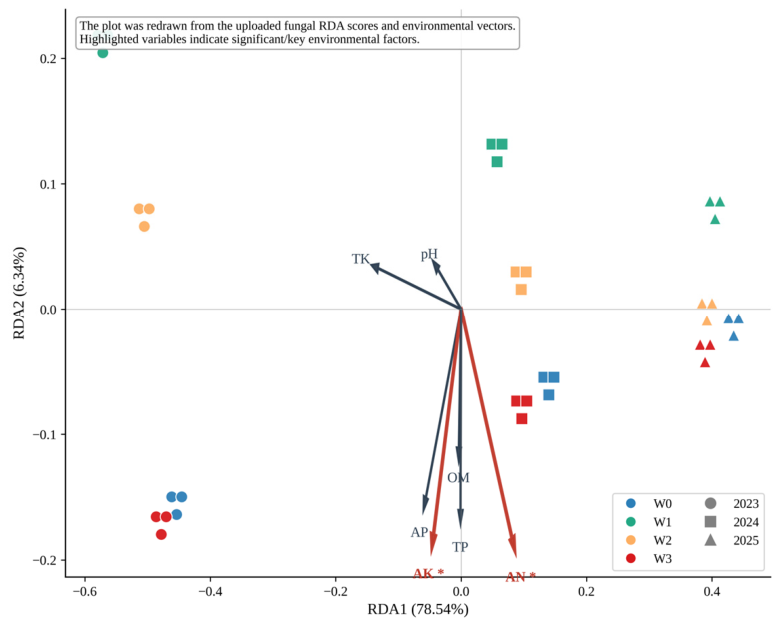
The overall fungal RDA model (
Figure 13) was not significant (F = 1.498,
p = 0.079), although the retained environmental variables collectively explained 23.66% of the variation in fungal community composition. In marginal permutation tests, available potassium (AK) and alkali-hydrolyzable nitrogen (AN) explained relatively large proportions of variation (5.33% and 4.97%, respectively); however, their raw
p values were 0.070 and 0.093, respectively, and neither association was statistically significant. After false discovery rate (FDR) adjustment, no individual environmental variable was significant. Accordingly, the measured soil physicochemical variables did not provide significant evidence for explaining fungal community variation in the present RDA. Potential contributions of unmeasured factors, including soil organic carbon fractions, rhizosphere conditions, interannual climatic variation, and time since biochar application, cannot be evaluated directly from the present dataset and should be examined in future studies.
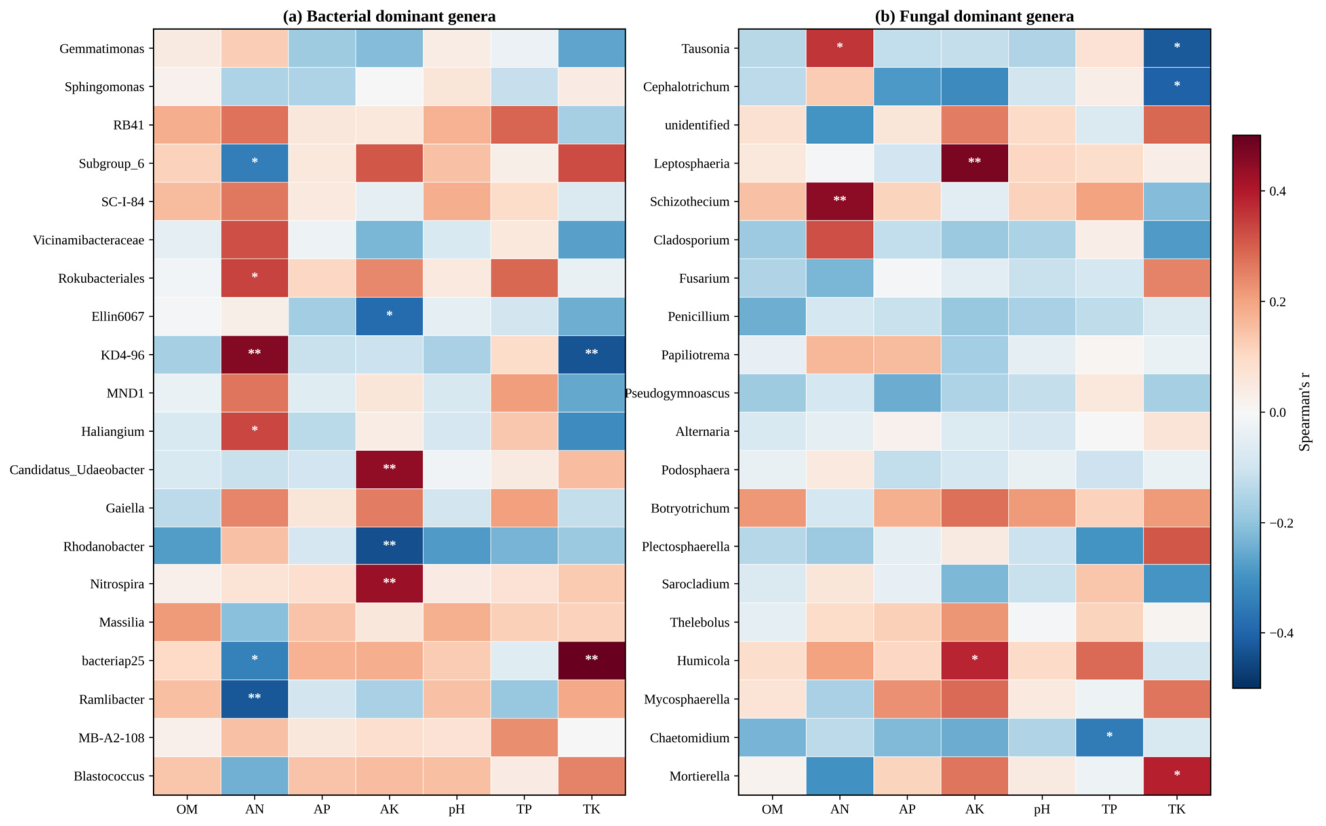
Spearman correlation heatmaps showed statistical associations between dominant microbial genera and soil physicochemical variables (
Figure 14). Among the dominant bacterial genera, KD4-96,
Candidatus Udaeobacter,
Rhodanobacter, and
Nitrospira were significantly correlated with alkali-hydrolyzable nitrogen, available potassium, or total potassium. These results indicate that the relative abundances of several dominant bacterial taxa were associated with soil nitrogen- and potassium-related variables. Among the dominant fungal genera,
Leptosphaeria,
Schizothecium,
Tausonia,
Cephalotrichum,
Mortierella,
Humicola, and
Chaetomidium were significantly correlated with alkali-hydrolyzable nitrogen, available potassium, total phosphorus, or total potassium. These results indicate that the relative abundances of several dominant fungal taxa were associated with measured soil nutrient variables. However, these correlations indicate statistical associations only, and do not establish causal relationships between microbial taxa and soil environmental factors.
Collectively, PERMANOVA, RDA, and correlation analyses indicated that bacterial and fungal community composition varied among biochar application rates and across years. PERMANOVA showed significant effects of year, biochar application rate, and their interaction, whereas year explained a substantially larger proportion of variation than biochar application rate. The bacterial RDA model was significant at the multivariable level, but no individual measured soil variable remained significant after false discovery rate (FDR) adjustment. In contrast, the fungal RDA model was not significant, and no individual measured environmental variable was significant after FDR adjustment.
Accordingly, the present analyses did not identify a single measured soil physicochemical variable that significantly explained microbial community variation after correction for multiple comparisons. Rather, they describe treatment- and year-associated microbial community patterns within the measured soil environmental context. Although correlation analyses identified statistical associations between selected dominant taxa and nutrient-related variables, these associations do not establish causal relationships or confirm the underlying ecological mechanisms. Direct measurements of soil carbon fractions, microhabitat properties, rhizosphere processes, and temporal climatic conditions would be required to clarify the drivers of microbial community variation following biochar application.