Article

Alkaline Soil pH and Phosphorus Depletion Are Associated with Microbial Community Changes Under Long-Term Continuous Cropping of Paeonia ostii


1
College of Agricultural and Biological Engineering, Heze University, Heze 274015, China
2
Heze Academy of Forestry, Heze 274099, China
3
Institute of Ecological Conservation and Restoration, Chinese Academy of Forestry, Beijing 100091, China
4
Tianjin Institute of Forestry Science, Chinese Academy of Forestry, Tianjin 300457, China
5
Comprehensive Experimental Center of Chinese Academy of Forestry in Yellow River Delta, Dongying 257500, China
*
Authors to whom correspondence should be addressed.
Microorganisms 2026, 14(10), 2248; https://doi.org/10.3390/microorganisms14102248
Submission received: 30 July 2026 / Revised: 21 September 2026 / Accepted: 23 September 2026 / Published: 3 October 2026
(This article belongs to the Special Issue Agricultural Microbial Ecology: Plant–Soil–Microbe Interactions)

Abstract

Long-term continuous cropping often degrades soil and reduces productivity, yet how soil properties and microbial communities respond in continuous tree peony monoculture remains poorly understood. Herein, soil physicochemical properties were investigated across a monoculture chronosequence of 1, 3, 5, 8, and 10 years of continuous tree peony cropping, together with rhizobacterial and fungal community diversity, composition, and predicted functions. The contents of soil organic matter, total nitrogen and available nitrogen increased along the chronosequence, whereas the contents of available phosphorus declined sharply after 3 years and remained low thereafter. Bacterial richness declined monotonically, whereas fungal richness reached its lowest level at 8 years. Beta-diversity revealed a clear community succession, with Acidobacteriota suppressed, and fungal communities shifted directionally from Fusarium to Phoma and ultimately to Monographella in the 10-year fields. Predicted functional profiling suggested a potential metabolic shift from energy-intensive pathways to stress-adaptive processes, including enhanced membrane transport. Redundancy analysis and structural equation modelling further indicated that pH and available phosphorus were strongly associated with microbial assemblages, with monoculture duration indirectly linked to communities through alterations in these soil properties. Overall, phosphorus availability, rather than bulk organic matter accumulation, emerged as the primary factor shaping microbial community dynamics and pathogen succession in this alkaline agroecosystem. These findings point to stage-specific pathogen control combined with phosphorus optimization as a potential strategy to mitigate replant disease in tree peony monoculture systems.

1. Introduction

Paeonia ostii ‘Feng Dan’ is a tree peony cultivar valued for its high seed productivity and edible oil production [1,2]. With expanding cultivation and prolonged monoculture, tree peony plants exhibit progressive growth decline, reduced flowering and seed set, heightened susceptibility to pests and diseases, and even widespread mortality. This phenomenon has emerged as a critical constraint to the sustainable development of the tree peony oil industry.
Continuous cropping obstacles (replant disease) are closely linked to soil microenvironment alterations, including microbial community imbalances, root exudate accumulation, and enzyme activity changes [3,4,5,6,7,8]. Microbial imbalances typically involve a decline in beneficial taxa and an enrichment in potential pathogens, which can disrupt key ecosystem functions such as nutrient cycling and disease suppression [4,5,6,7]. For instance, In Paeonia ostii, five phenolic acids—ferulic acid, cinnamic acid, vanillin, coumarin, and paeonol—have been detected in the rhizosphere soil and shown to inhibit seedling growth and root development [3]. The accumulation of such autotoxic compounds can alter root exudate profiles and create a selective pressure that favors pathogenic taxa while suppressing beneficial microbes [4], leading to a dysbiotic rhizosphere microbiome [5,6,7], as root exudates can act as selective carbon sources and signaling molecules that shape microbial community composition [4]. In parallel, continuous cropping has been shown to affect soil enzyme activities, with reduced urease and sucrase activities and increased cellulase activity reported in Astragalus membranaceus, reflecting impaired nutrient cycling and soil functional degradation [8]. These combined effects—shifts in microbial community structure, accumulation of autotoxic compounds, and altered enzyme activities—contribute to nutrient depletion, disruption of microbial ecological balance [9,10], and ultimately, soil degradation and replant problems [8,11]. However, findings from previous studies on microbial responses to continuous cropping remain inconsistent. For example, long-term monoculture of Salvia miltiorrhiza [12] and potato [13] altered rhizosphere fungal and actinomycete communities, while continuous cropping of sweet potato was reported to reduce bacterial diversity [7,14] but increase fungal diversity [6]. In Panax notoginseng, both bacterial and fungal communities differed significantly between healthy and root-rot plants [5,15]. For tree peony, Pan et al. [16] examined soil properties and bacterial communities across 1-, 4-, and 10-year chronosequences, but their three time points and the absence of fungal data leave the co-occurring dynamics of both bacterial and fungal assemblages largely unexplored. Consequently, the successional trajectories of rhizosphere microbial communities under continuous tree peony cropping remain poorly understood. To address these gaps, this study combined high-throughput sequencing with soil physicochemical analyses to characterize bacterial and fungal community dynamics across a chronosequence of 1, 3, 5, 8, and 10 years of Paeonia ostii ‘Feng Dan’ monoculture. Specifically, the objectives of this study were as follows: (i) We aimed to investigate variations in soil physicochemical properties along the chronosequence. (ii) We also aimed to characterize the successional patterns of rhizosphere bacterial and fungal community diversity, structure, and composition using 16S rRNA and ITS amplicon sequencing. (iii) We sought to explore potential shifts in microbial metabolic pathways and functions and to identify the soil factors most strongly associated with these microbial changes.

2. Materials and Methods

2.1. Study Area and Soil Sampling

The experimental soil was collected from the Caozhou Peony Garden (35°14′ N, 115°26′ E) in Heze, Shandong Province, China, a major cultivation area for tree peonies. The site has a contiguous planting area of approximately 106 ha and is characterized by a warm-temperate monsoon climate, with a mean annual temperature of 11–14 °C and annual precipitation of 550–950 mm.
Soils of oil peony (Paeonia ostii ‘Feng Dan’) were collected from fields with different planting durations: established in 2022 (1 year, Y1), 2020 (3 years, Y3), 2018 (5 years, Y5), 2015 (8 years, Y8), and 2013 (10 years, Y10). Sampling was conducted during the seed harvest period in August 2023. All plots were located within the same plantation, with uniform soil parent material (classified as moderately alkaline sandy soil) and consistent water–fertilizer management practices. The fertilization regime for Paeonia ostii ‘Feng Dan’ included an annual application of organic fertilizer derived from fermented peony seed cake, seed hulls, and fruit shells, applied at a rate of approximately 100 kg ha−1.
For each planting duration, three independent composite samples were collected from the field. Each composite sample consisted of five soil cores collected from the 0–20 cm soil layer adjacent to the roots of Paeonia ostii ‘Feng Dan’ within the plot and pooled together. Immediately after collection, large rocks and roots were removed by passing the soil through a 2 mm sieve in the field. In total, fifteen composite samples were analyzed in this study (five cropping durations × three independent composite samples) [7]. The samples were promptly transported to the laboratory, where they were sieved again and divided into two portions. One portion was stored at −80 °C for subsequent DNA extraction, while the other was stored at 4 °C for analyses of soil properties and enzyme activities.

2.2. Chemical Analysis

Soil pH was measured in a suspension of soil and water (1:2.5 w/v) using a glass combination electrode [17]. Total nitrogen (TN) was tested via Kjeldahl digestion [18] followed by quantification using a scalar continuous flow analyzer. The molybdate-blue method was used for colorimetric measurement of total phosphorus (TP) at 440 nm [19]. Flame photometry was used to assess the accessible potassium (AK) and total potassium (TK) contents in soil [17]. Available nitrogen (AN) was measured by a micro-diffusion technique after alkaline hydrolysis [20,21]. Available phosphorus (AP) content was determined using the Olsen-P method following the procedures specified for forest soils (LY/T 1232-2015) [22,23]. The total soil organic matter (SOM) was determined by dichromate oxidation [24]. All chemical analyses were performed in triplicate for each composite sample by a certified commercial laboratory following standard protocols. Quality control parameters (recovery rates, accuracy, LOD, and LOQ) were all within acceptable ranges (Table A1). All soil chemical analyses were performed using standard laboratory equipment (detailed instrument information, including model numbers, manufacturers, and countries of origin, is provided in Table A2).

2.3. DNA Extraction and Amplification

Total soil microbial DNA was extracted using the CTAB method [25]. DNA integrity and concentration were assessed by agarose gel electrophoresis and Qubit 2.0 Fluorometer (Thermo Fisher Scientific, Waltham, MA, USA); soil microbial DNA was stored at −20 °C. PCR amplification of bacterial 16S V4 and fungal ITS1 regions was performed using primer sets 314F (5′-CCTACGGGNGGCWGCAG-3′) and 806R (5′-GGACTACHVGGGTATCTAAT-3′) and ITS1F (5′-CTTGGTCATTTAGAGGAAGTAA-3′) and ITS2R (5′-GCTGCGTTCTTCATCGATGC-3′) [26,27,28]. Each 25 µL reaction contained 12.5 µL of Phusion® Master Mix (New England Biolabs, lpswich, MA, USA), 0.2 µM of each primer, and 10 ng of template DNA. Thermal cycling was 98 °C for 30 s; 30 cycles of 98 °C for 10 s, 55 °C for 30 s, and 72 °C for 30 s; and 72 °C for 5 min. PCR products were confirmed by agarose gel electrophoresis, purified using magnetic beads, and pooled in equimolar concentrations. Libraries were constructed using the TruSeq® DNA PCR-Free Kit (Illumina, San Diego, CA, USA) and sequenced on an Illumina NovaSeq 6000 platform (Illumina, San Diego, CA, USA) following the manufacturer’s protocols.

2.4. Bioinformatics Analysis

Raw reads were filtered and trimmed using QIIME v.1.9.1 [29], and sequences were retained within the 220–500 bp range. High-quality sequences were processed using Mothur v.1.34.4 [30], and chimeras were removed using USEARCH [31]. OTUs were clustered at 97% similarity. Alpha diversity indices were calculated using QIIME v.1.9.1. Taxonomic assignment was performed using SILVA v.138 SSU rRNA database [32] and UNITE databases v.8.2 [33]. All statistical analyses were performed in R v.4.3.1 (R Core Team, 2024) [34]. Prior to analysis of variance (ANOVA), centered log-ratio-transformed (CLR-transformed) data [35] were tested for normality (Shapiro–Wilk test) and homogeneity of variances (Levene’s test) [36,37]. One-way ANOVA with post hoc comparisons using Tukey’s HSD test (for equal variances) or Games–Howell test (for unequal variances) was applied to CLR-transformed relative abundance data [38,39]. PERMANOVA (999 permutations) was performed based on Bray-Curtis dissimilarity matrices calculated from Hellinger-transformed species abundance data to test for differences in community composition among cropping durations [40,41]. Prior to PERMANOVA, homogeneity of multivariate dispersion was tested using PERMDISP (betadisper function in the vegan package) with 999 permutations to confirm that significant PERMANOVA results were not driven by differences in group dispersion [42]. Pearson correlation coefficients were calculated to examine relationships between soil properties and microbial diversity indices. Redundancy analysis (RDA) and distance-based redundancy analysis (db-RDA) were performed to examine the relationships between soil properties and microbial (bacterial and fungal) community composition and functional structure, using the vegan R package (v.2.7.1) [43]. Prior to analysis, species abundance data were Hellinger-transformed, and environmental variables were standardized (centered and scaled). Variance inflation factors (VIFs) were calculated for all soil variables to avoid overparameterization, and variables with VIF > 10 were removed [44]. The significance of the overall models and individual soil variables was assessed using Monte Carlo permutation tests (999 permutations), with individual variable significance evaluated via the envfit function in the vegan package [43]. Functional profiles predicted by PICRUSt2 were used directly in RDA without additional transformation. Venn diagrams were generated using the ggVennDiagram R package [45] to visualize shared and unique taxa among different cropping years. LEfSe (linear discriminant analysis effect size) analysis was performed to identify indicator taxa among cropping durations, and taxa with LDA (linear discriminant analysis) scores > 2 and p < 0.05 were considered significantly enriched [46]. Functional predictions were performed using FUNGuild and PICRUSt2 (KEGG) with default parameters following the recommended pipelines [47,48,49]. The confidence of FUNGuild assignments was recorded for each taxonomic assignment, and the distribution of confidence categories (highly probable, probable, possible, and unassigned) was summarized. SEM was performed using IBM SPSS AMOS (v.21.0), with soil variables selected through an iterative process guided by modification indices; model fit was assessed using CFI > 0.95, RMSEA < 0.05, and GFI > 0.90 [50,51].

3. Results

3.1. Changes in Soil Chemical Properties of Paeonia ostii ‘Feng Dan’ During Different Continuous Cropping Years

ANOVA (Table 1) revealed that cropping duration significantly affected most measured soil parameters (p < 0.01). Soil pH peaked at Y3, which was statistically higher than that in Y5, Y8, and Y10 but remained comparable to that in Y1 (p > 0.05). TN concentrations remained consistently low during the initial three years (0.73–0.75 g kg−1), increased significantly by Y5, and subsequently stabilized at a higher plateau (0.95–1.03 g kg−1) from Y5 to Y10. TP varied significantly with planting duration (F = 9.03, p = 0.002). Post hoc comparisons showed that TP was highest in Y1 and Y8 and significantly lower in Y5 and Y10, with Y3 showing intermediate values that did not differ from either group. TK content showed a modest but significant response to planting duration (F = 8.95, p = 0.002). AN concentration responded significantly to the planting chronosequence (F = 48.05, p < 0.002). The AN decreased significantly from Y1 to Y3 and then increased steadily thereafter, with Y8 and Y10 showing the highest values. In contrast, AP declined by approximately 50% between Y3 and Y5 (Table 1). AK also responded significantly to planting duration (F = 26.48, p < 0.001): AK increased from Y1 to Y5 and Y8 and then stabilized at an intermediate range by Y10. SOM content was significantly influenced by the planting duration (F = 111.18, p < 0.001), remaining low in the first two years, increasing markedly from Y5, and peaking at Y10. Overall, prolonged monoculture was associated with progressive accumulation of SOM, TN, and AN, alongside a marked decline in AP and a transient peak in pH at Y3.

3.2. Sequencing Results and OTUs in the Rhizosphere Soil of Paeonia ostii ‘Feng Dan’ with Different Cropping Durations

High-throughput sequencing of the bacterial 16S rDNA V3-V4 region and fungal ITS region generated 855,133 and 1,203,795 quality-filtered reads, respectively (Table A3). These reads were clustered into 3539 bacterial and 1584 fungal OTUs at a 97% similarity level. Bacterial OTU richness peaked at Y3 (2043 OTUs) and gradually declined thereafter, reaching a minimum at Y10 (1803 OTUs). Fungal richness showed greater variability, with a pronounced decline at Y8 (396 OTUs) followed by recovery at Y10 (546 OTUs).
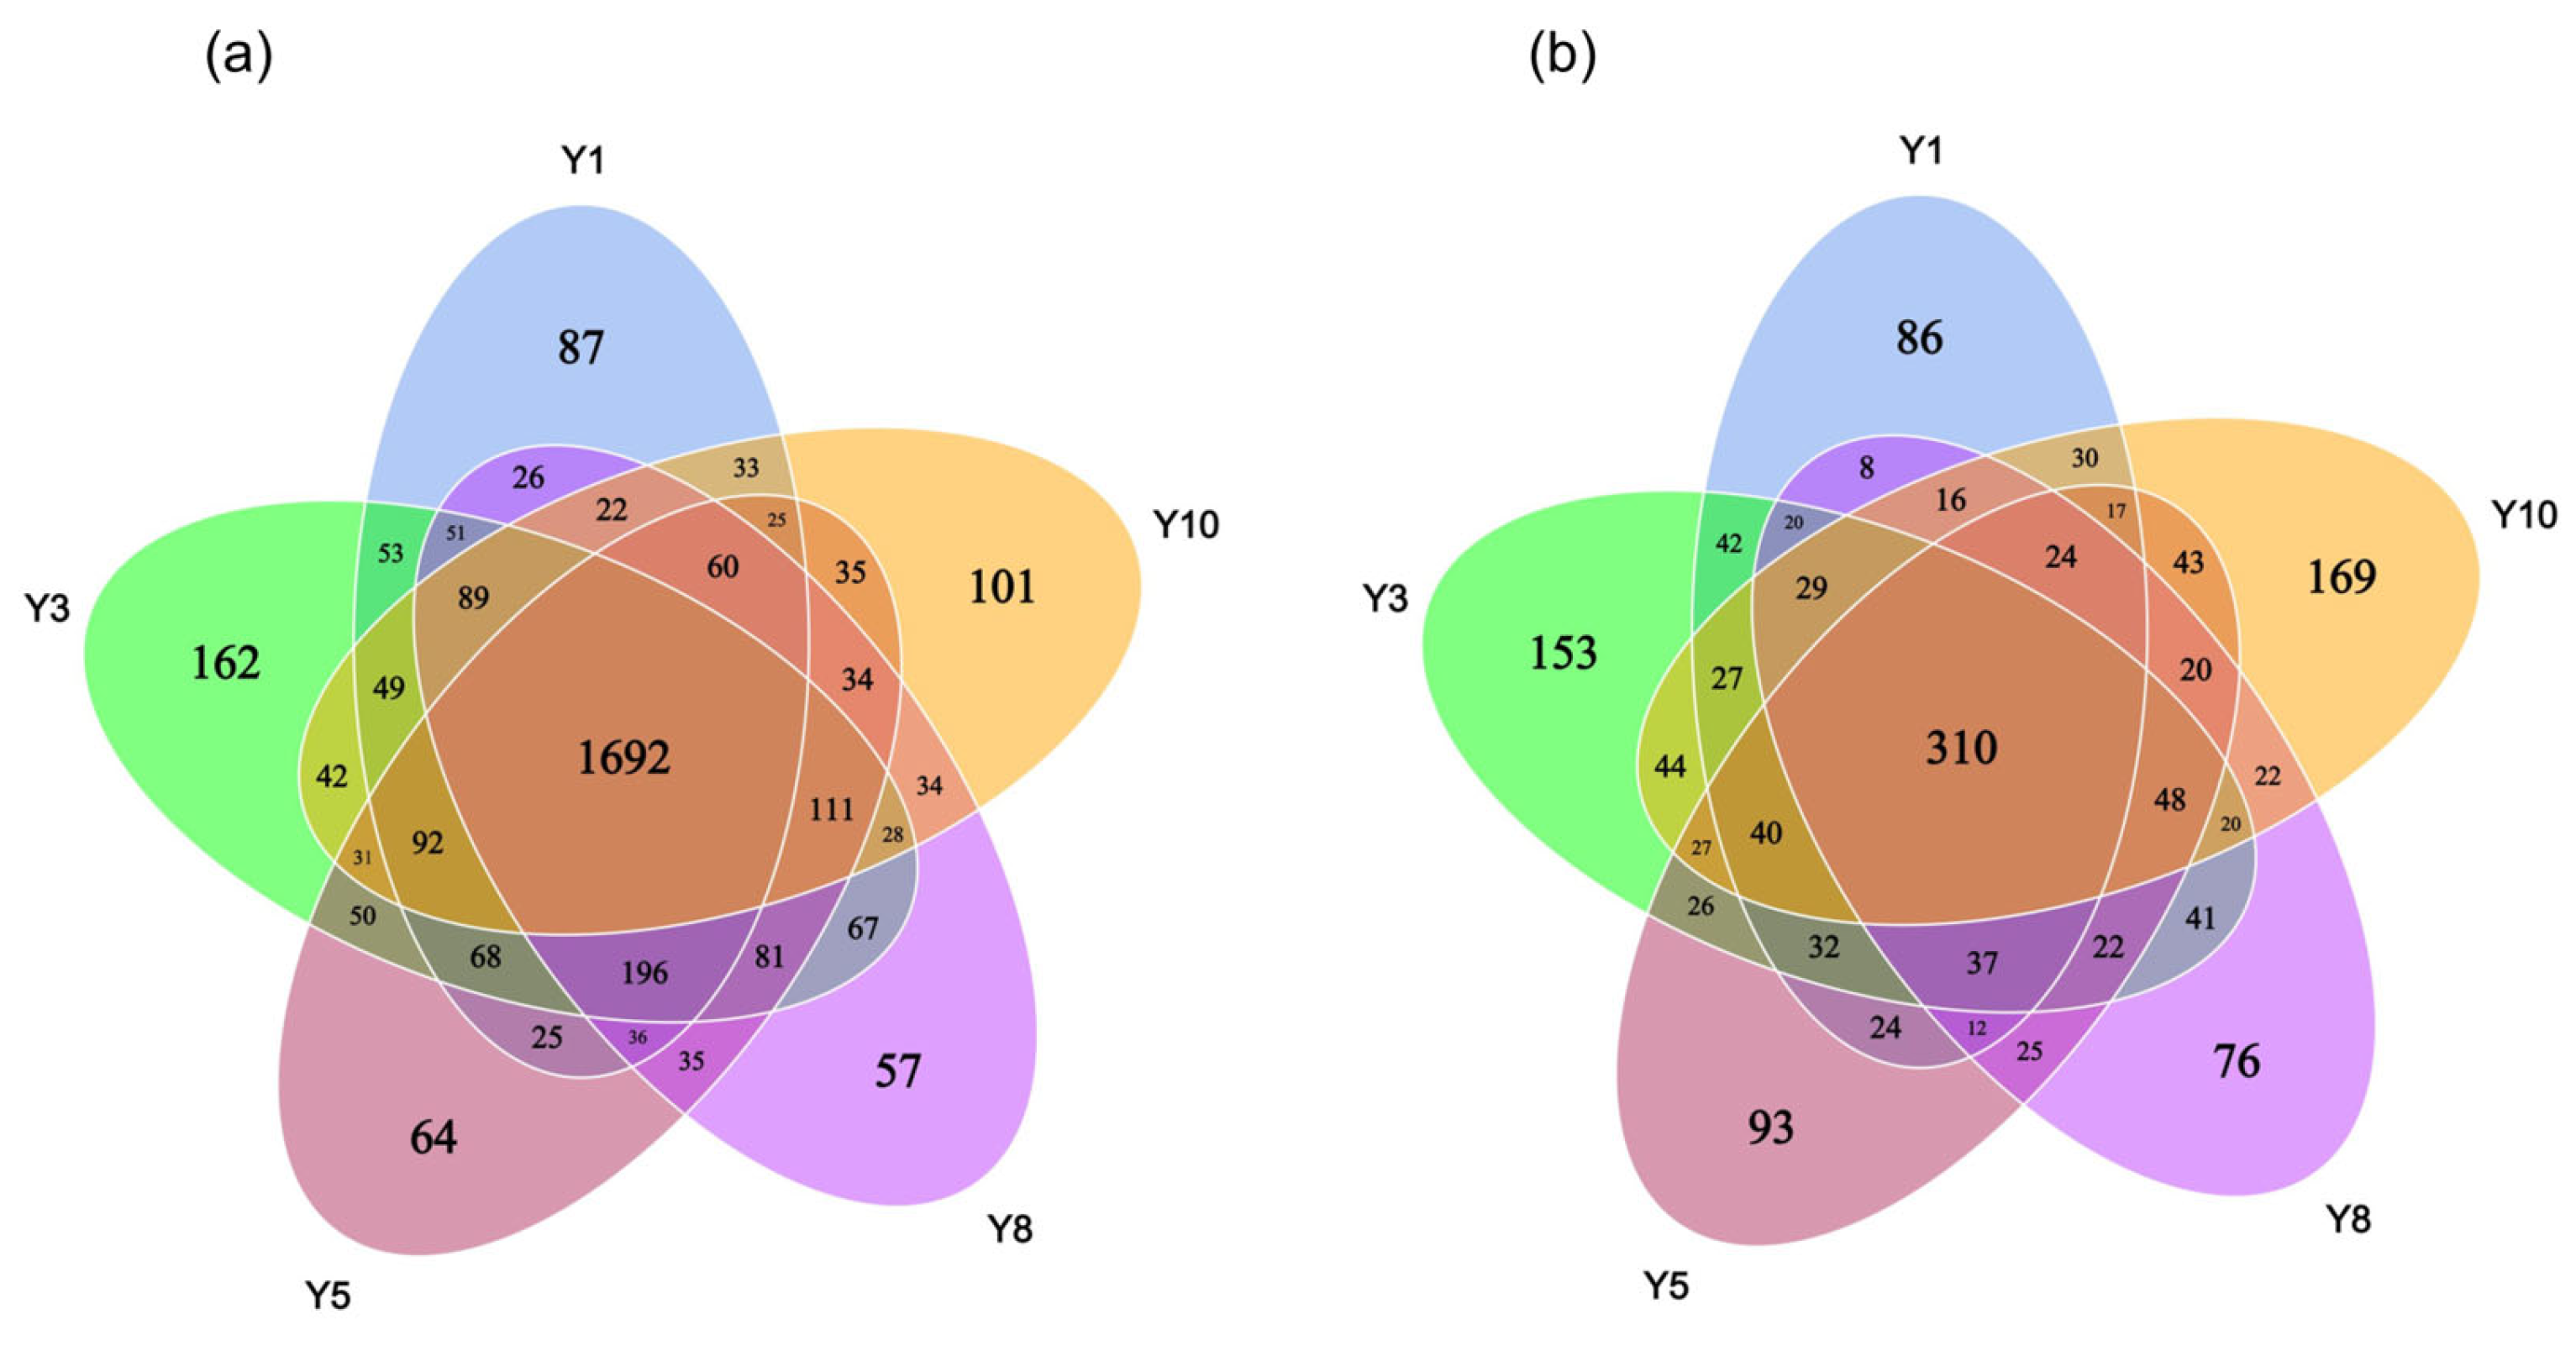
Venn diagrams were used to visualize the distribution of unique and shared OTUs across groups (Figure 1). For bacteria, 1692 OTUs were shared across all five groups (Figure 1a). The number of unique bacterial OTUs for Y1, Y3, Y5, Y8, and Y10 were 87 (4.59%), 162 (7.92%), 64 (3.32%), 57 (3.01%), and 101 (5.60%), respectively. For fungi, 310 OTUs were common to all groups (Figure 1b). The proportions of shared fungal OTUs relative to total OTUs in Y1, Y3, Y5, Y8, and Y10 were 61.75%, 54.86%, 60.42%, 78.28%, and 56.77%, respectively. The numbers of unique fungal OTUs for Y1, Y3, Y5, Y8, and Y10 were 86 (17.13%), 153 (27.07%), 93 (18.12%), 76 (19.19%), and 169 (30.95%), respectively.

3.3. Microbial Community Diversity in the Rhizosphere Soil of Paeonia ostii ‘Feng Dan’ During Different Cropping Durations

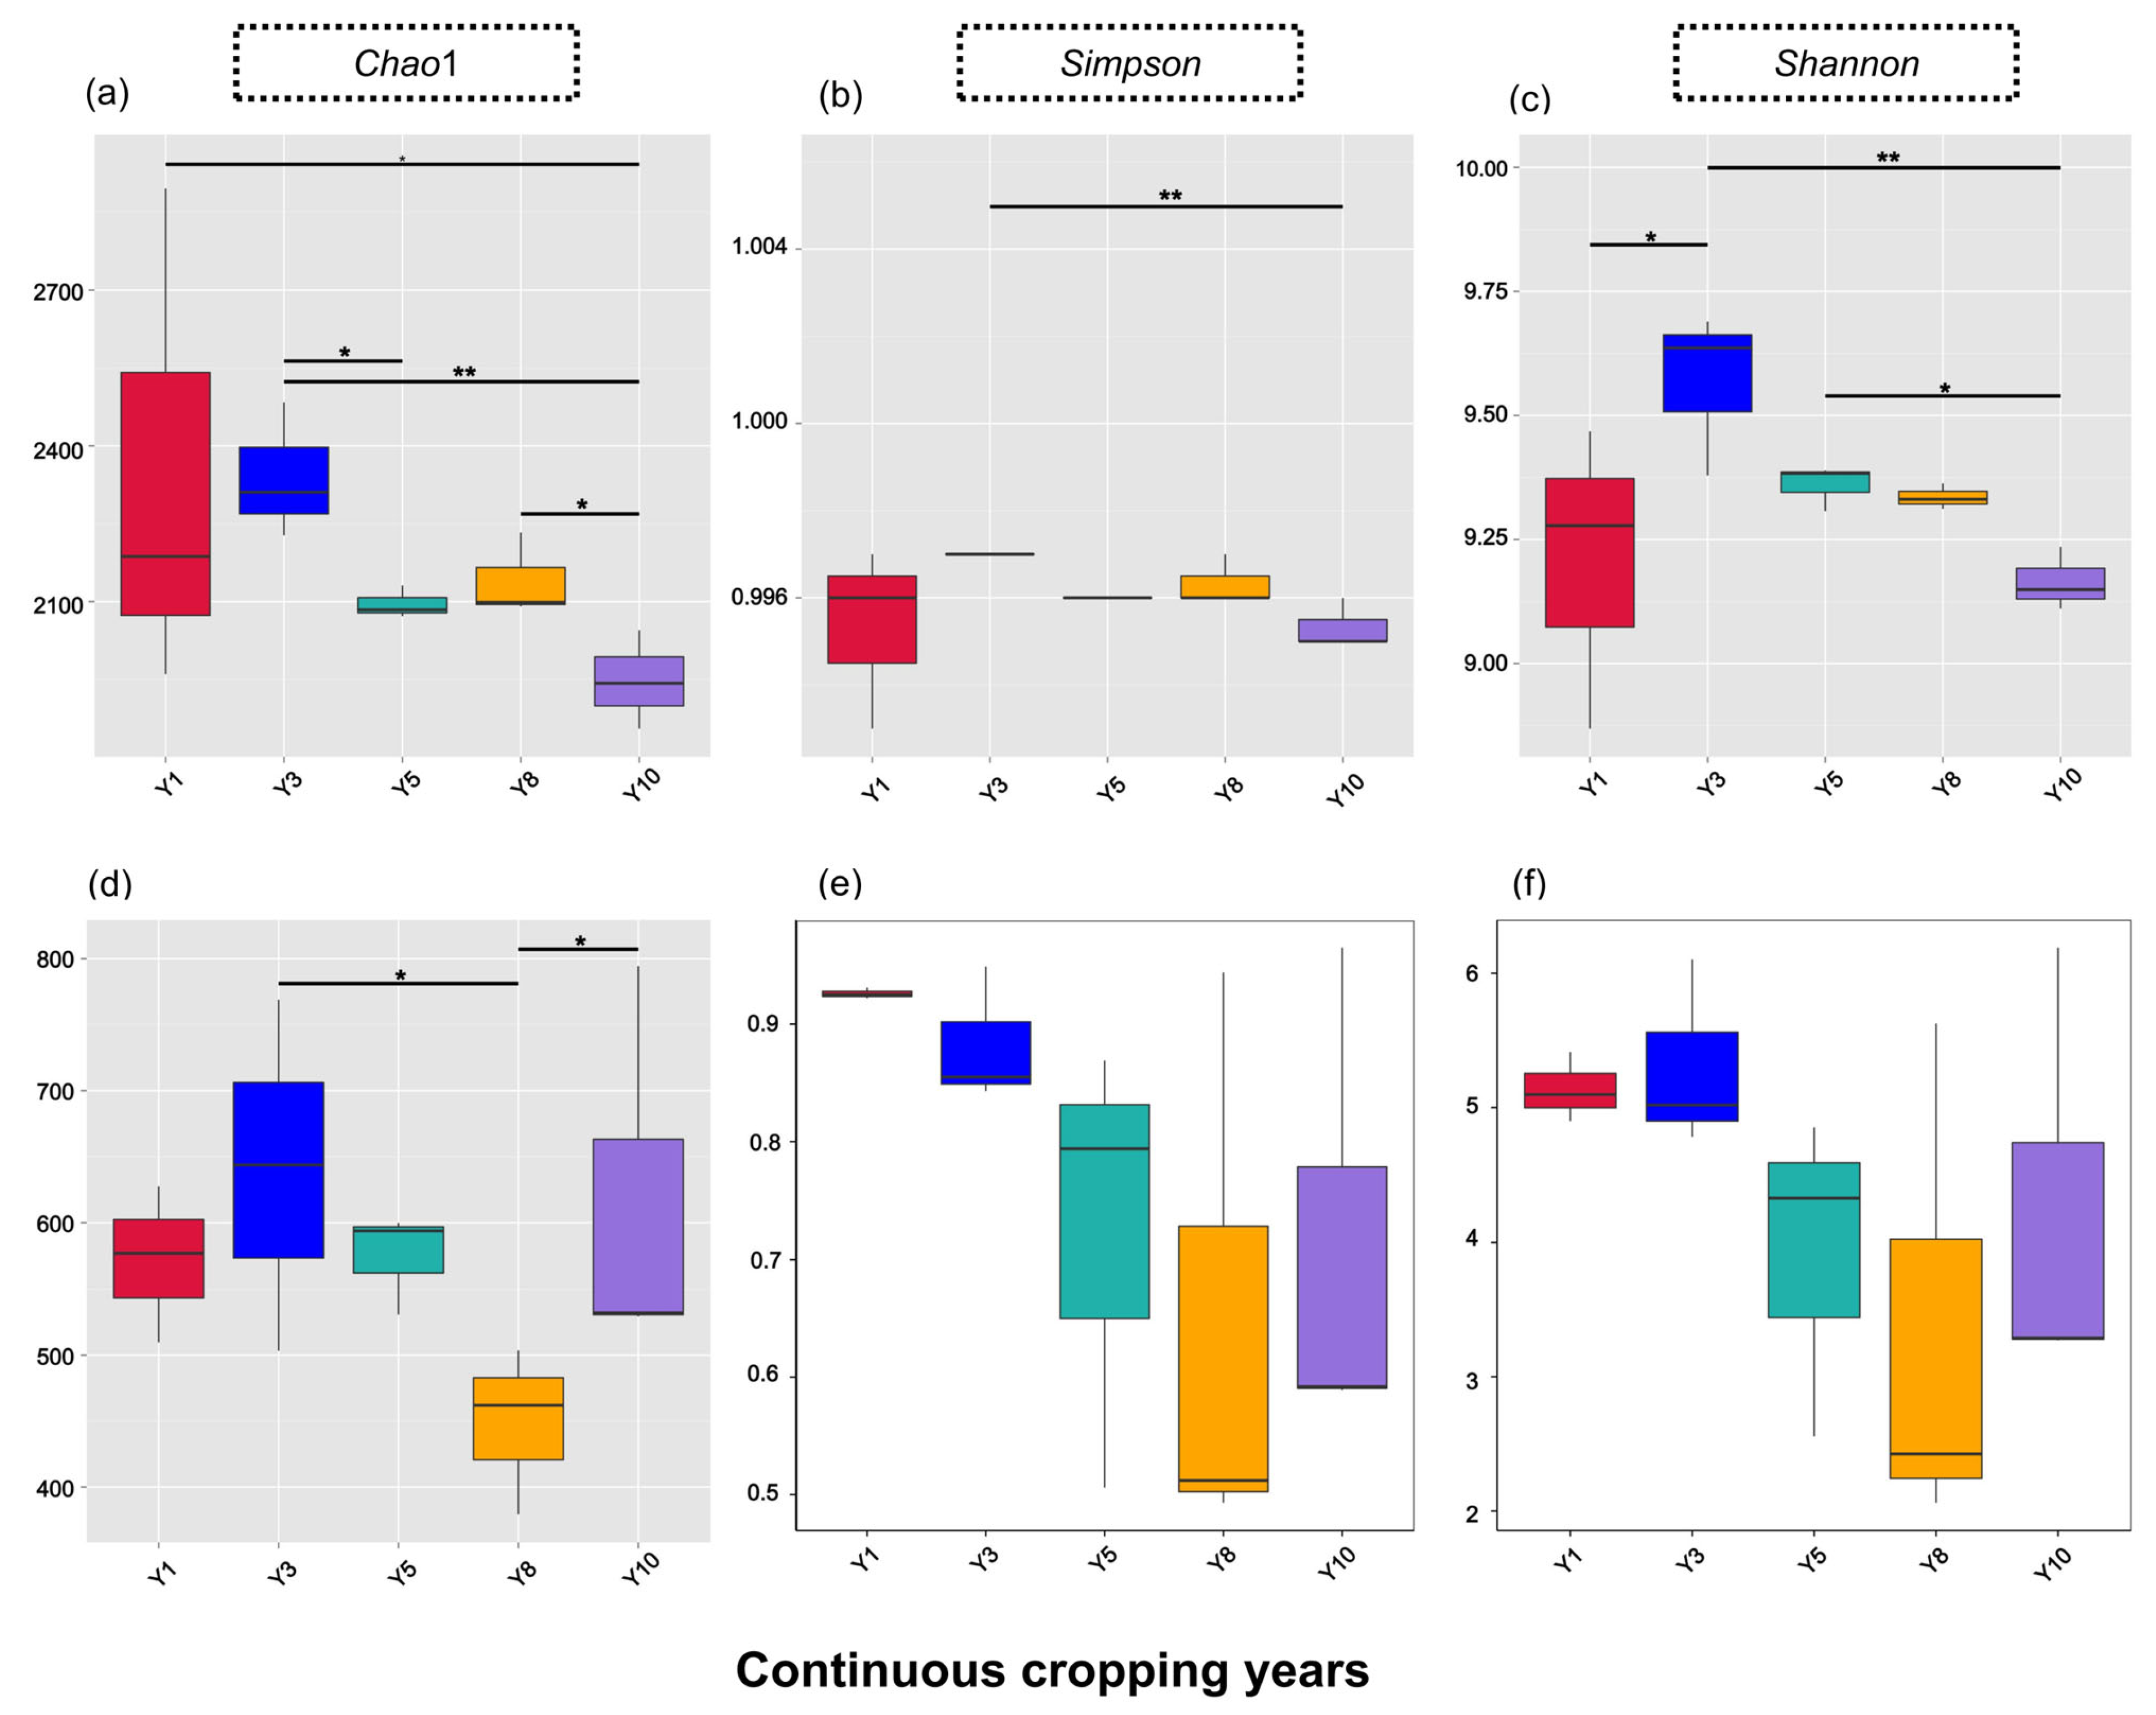
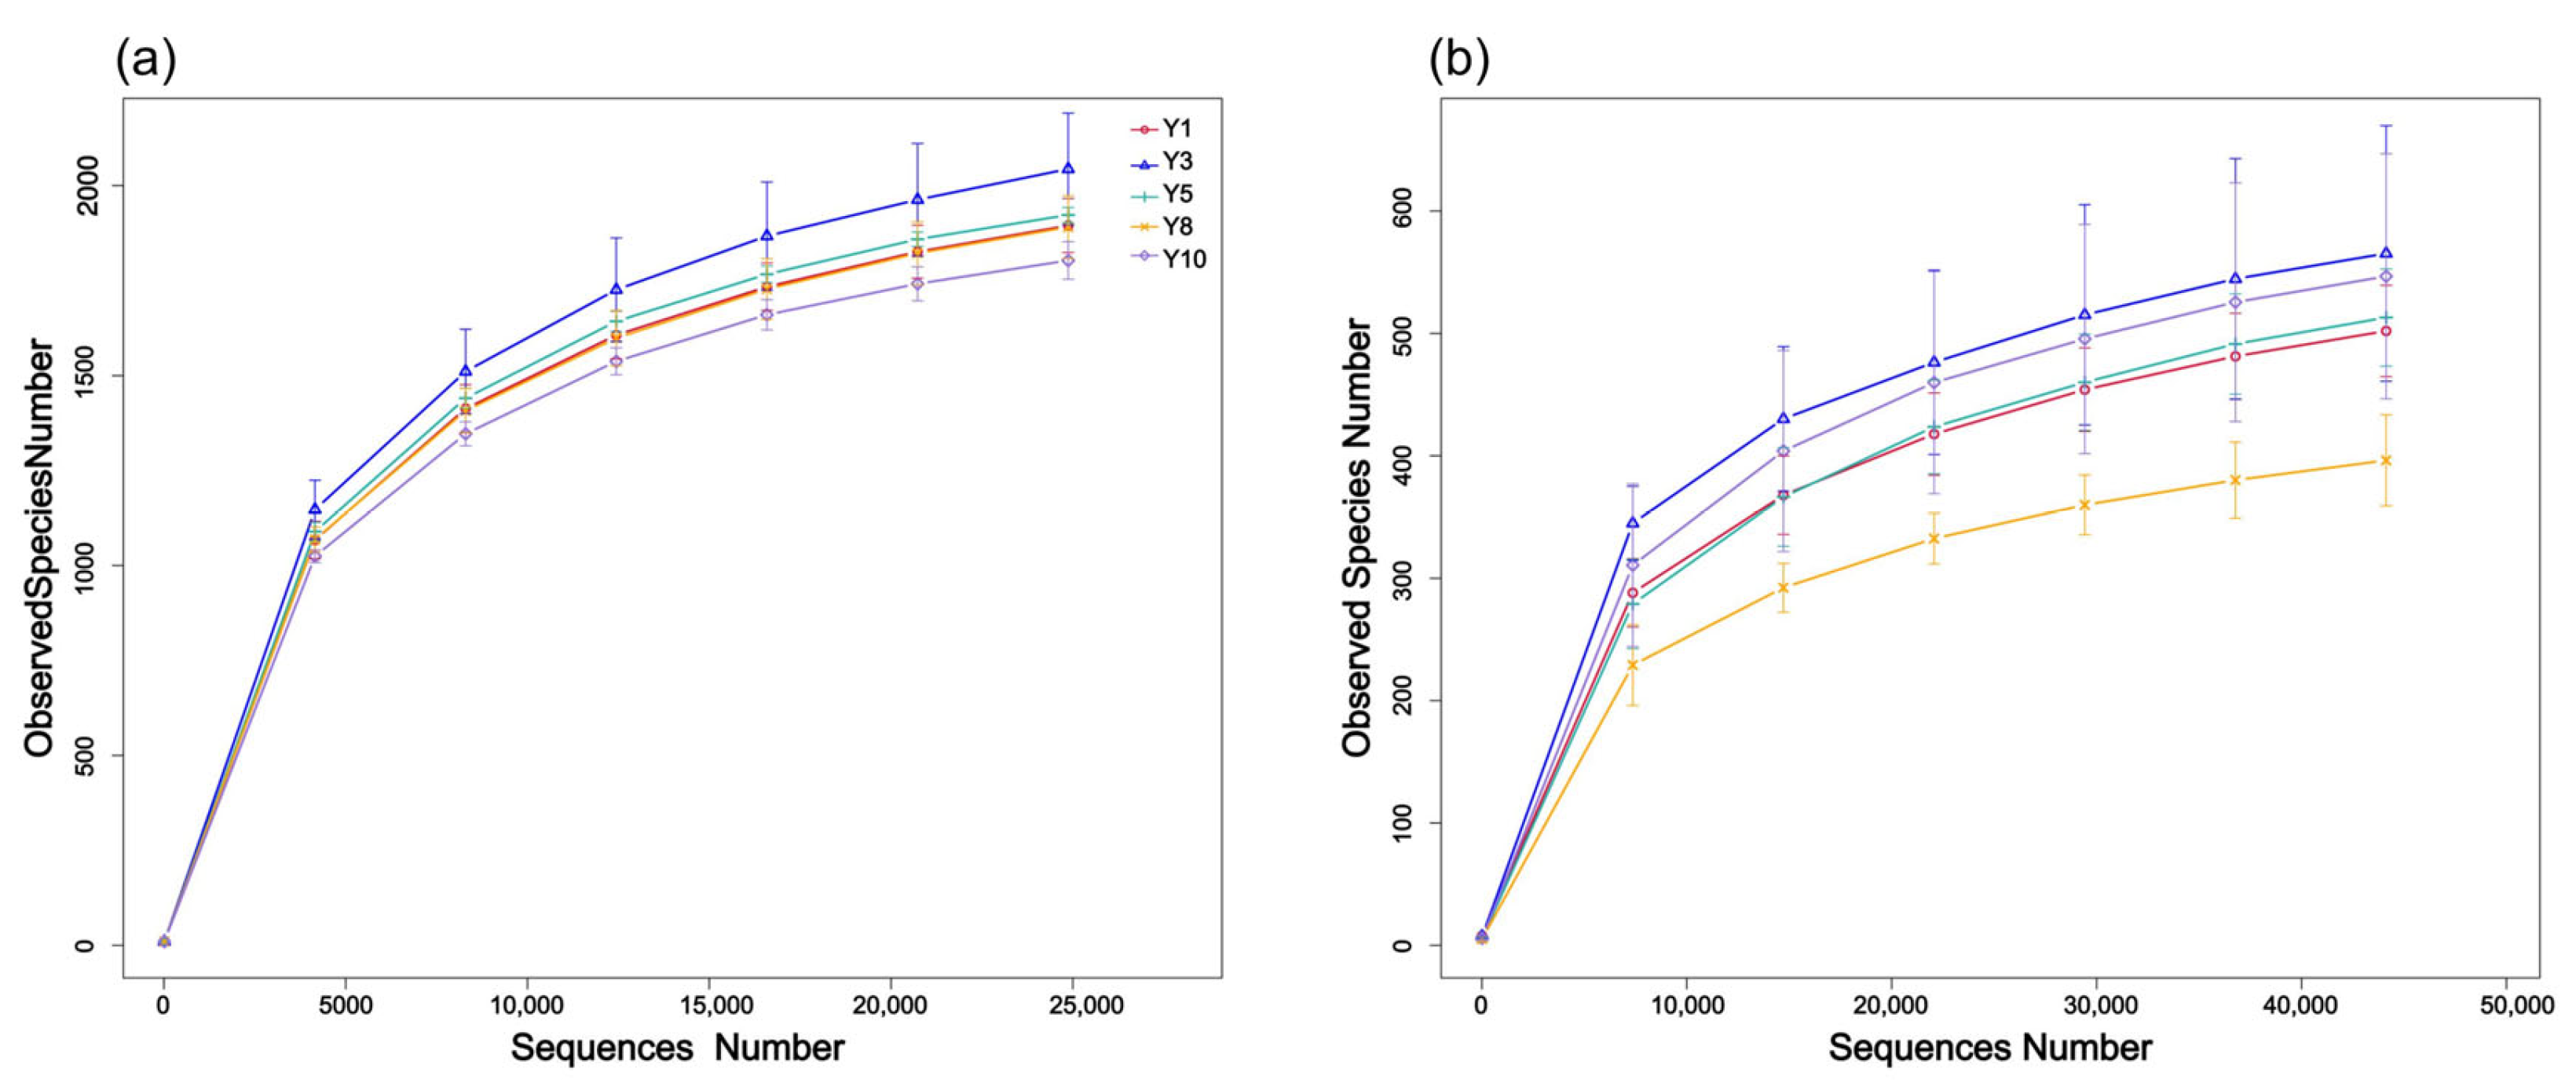
Rarefaction curves confirmed adequate sequencing depth for all samples (Figure A1). For bacterial communities, the Chao1 index decreased after long-term cropping with Y10, showing a 17.04% reduction relative to Y1. The overall trend showed a decline from Y1 to Y5, a slight recovery at Y8, and a further drop at Y10. Significant pairwise differences in Chao1 were detected between Y1 and Y10 (p < 0.05), Y3 and Y10 (p < 0.05), Y3 and Y5 (p < 0.05), and Y8 and Y10 (p < 0.01) (Figure 2a; Table A4). Bacterial Shannon index values varied significantly over time (one-way ANOVA, p < 0.05). Post hoc comparisons revealed that the value at Y3 (9.568 ± 0.16) was significantly higher than at all other time points, while no significant differences were detected among Y1, Y5, Y8 and Y10. In contrast, the Simpson index remained stable throughout the study period, with no significant differences among any time points (Figure 2b,c; Table A4). Fungal Chao1 richness varied significantly over time (one-way ANOVA, p < 0.05) (Figure 2d; Table A4). Post hoc comparisons showed that Y8 (448.33 ± 50.49) had significantly lower richness than all other time points, whereas no significant differences were detected among Y1 (571.51 ± 45.23), Y3 (638.69 ± 134.83), Y5 (574.81 ± 54.41), and Y10 (618.65 ± 164.11). In contrast, fungal Shannon and Simpson remained stable across all sampling years (one-way ANOVA, p > 0.05 for both), with no significant differences among any time points (Figure 2e,f; Table A4).
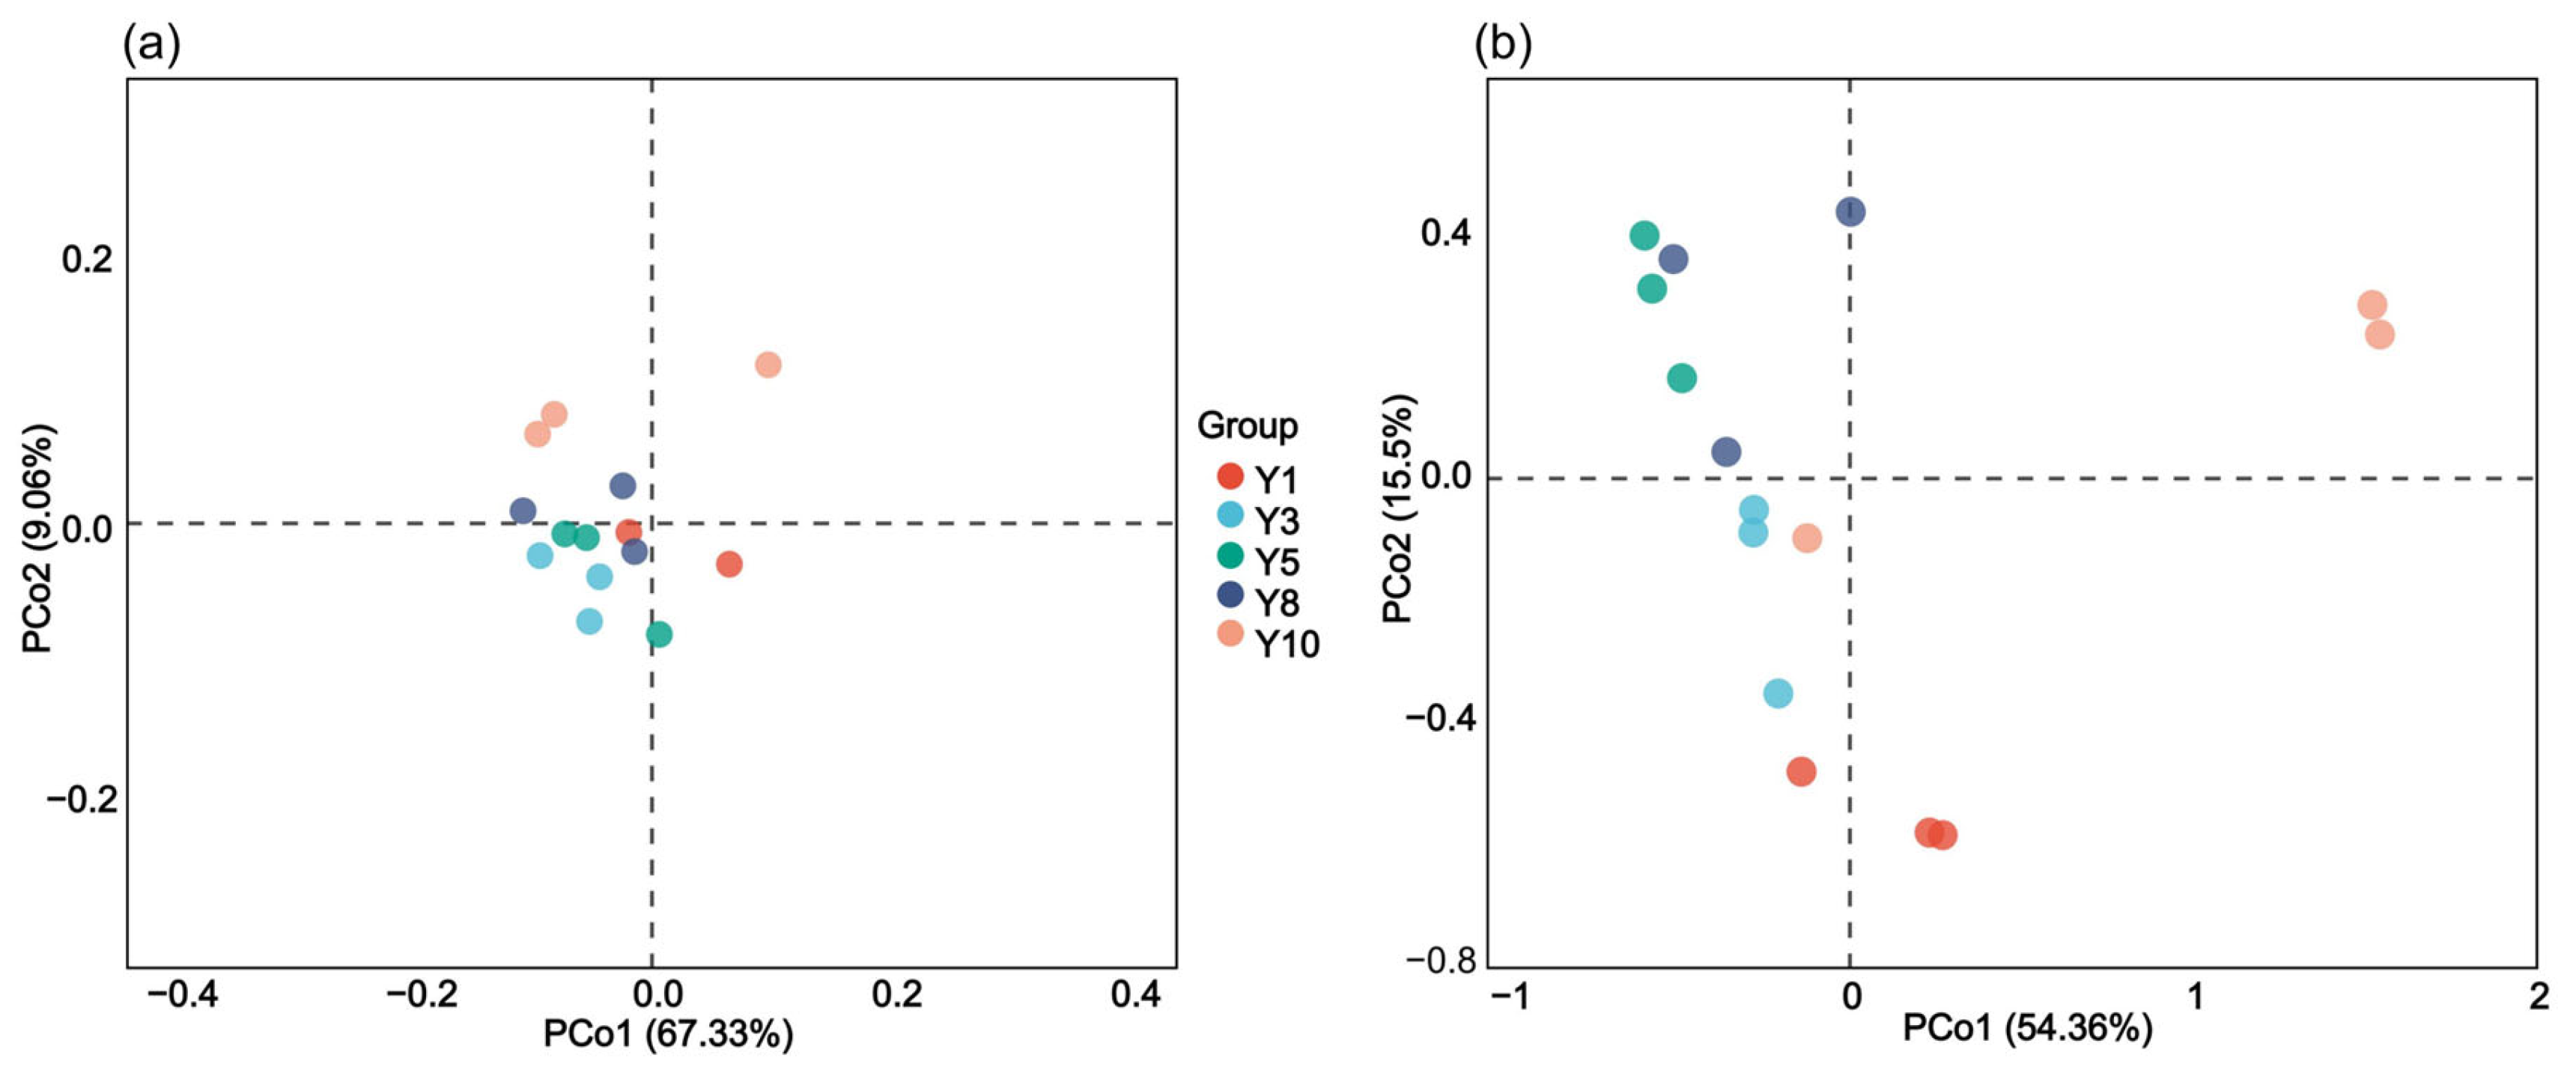
Principal coordinate analysis (PCoA) based on Bray–Curtis distances was used to assess bacterial and fungal community dissimilarities across the continuous cropping chronosequence (Figure 3). For bacteria, PCoA1 explained 67.3% of the bacterial variance and PCoA2 explained 9.1%. Along PCoA2, samples from Y10 and most Y8 showed positive scores while Y1, Y3, and Y5 showed negative scores (Figure 3a). PERMANOVA confirmed that cropping duration significantly affected bacterial community composition (Table A5). PERMDISP analysis confirmed that multivariate dispersion did not differ significantly among cropping durations (F = 0.36, p = 0.834), supporting the validity of the PERMANOVA results. Pairwise comparisons revealed significant differences between Y3 and Y8 (R2 = 0.27, p = 0.001), Y3 and Y10 (R2 = 0.45, p = 0.001), Y5 and Y10 (R2 = 0.43, p = 0.001), and Y8 and Y10 (R2 = 0.35, p = 0.001), whereas no significant differences were detected between Y1 and any other year (all p > 0.05) or between Y5 and Y8 (p = 0.3).
For fungi, PCoA1 explained 54.4% and PCoA2 explained 15.5% of the variation (Figure 3b). Along PCoA2, Y5, Y8, and most Y10 samples had positive scores, while most Y1 and Y3 samples had negative scores; one Y10 sample clustered near two Y3 samples (Figure 3b). PERMANOVA confirmed that cropping duration significantly affected fungal community composition (Table A5). PERMDISP analysis confirmed that multivariate dispersion did not differ significantly among cropping durations (F = 0.64, p = 0.644), supporting the validity of the PERMANOVA results. Pairwise comparisons revealed that Y1 differed significantly from Y3 (R2 = 0.49, p < 0.001), Y8 (R2 = 0.46, p < 0.001), and Y10 (R2 = 0.56, p < 0.001). Y3 also differed significantly from Y10 (R2 = 0.52, p < 0.001), and Y8 differed from Y10 (R2 = 0.31, p < 0.001). No significant differences were detected between Y5 and any other year (all p > 0.05) nor between Y3 and Y5 (p = 0.1), Y3 and Y8 (p = 0.2), or Y5 and Y8 (p = 0.1).

3.4. Soil Microbiome Assembly in the Rhizosphere of Paeonia ostii ‘Feng Dan’ During Different Cropping Durations

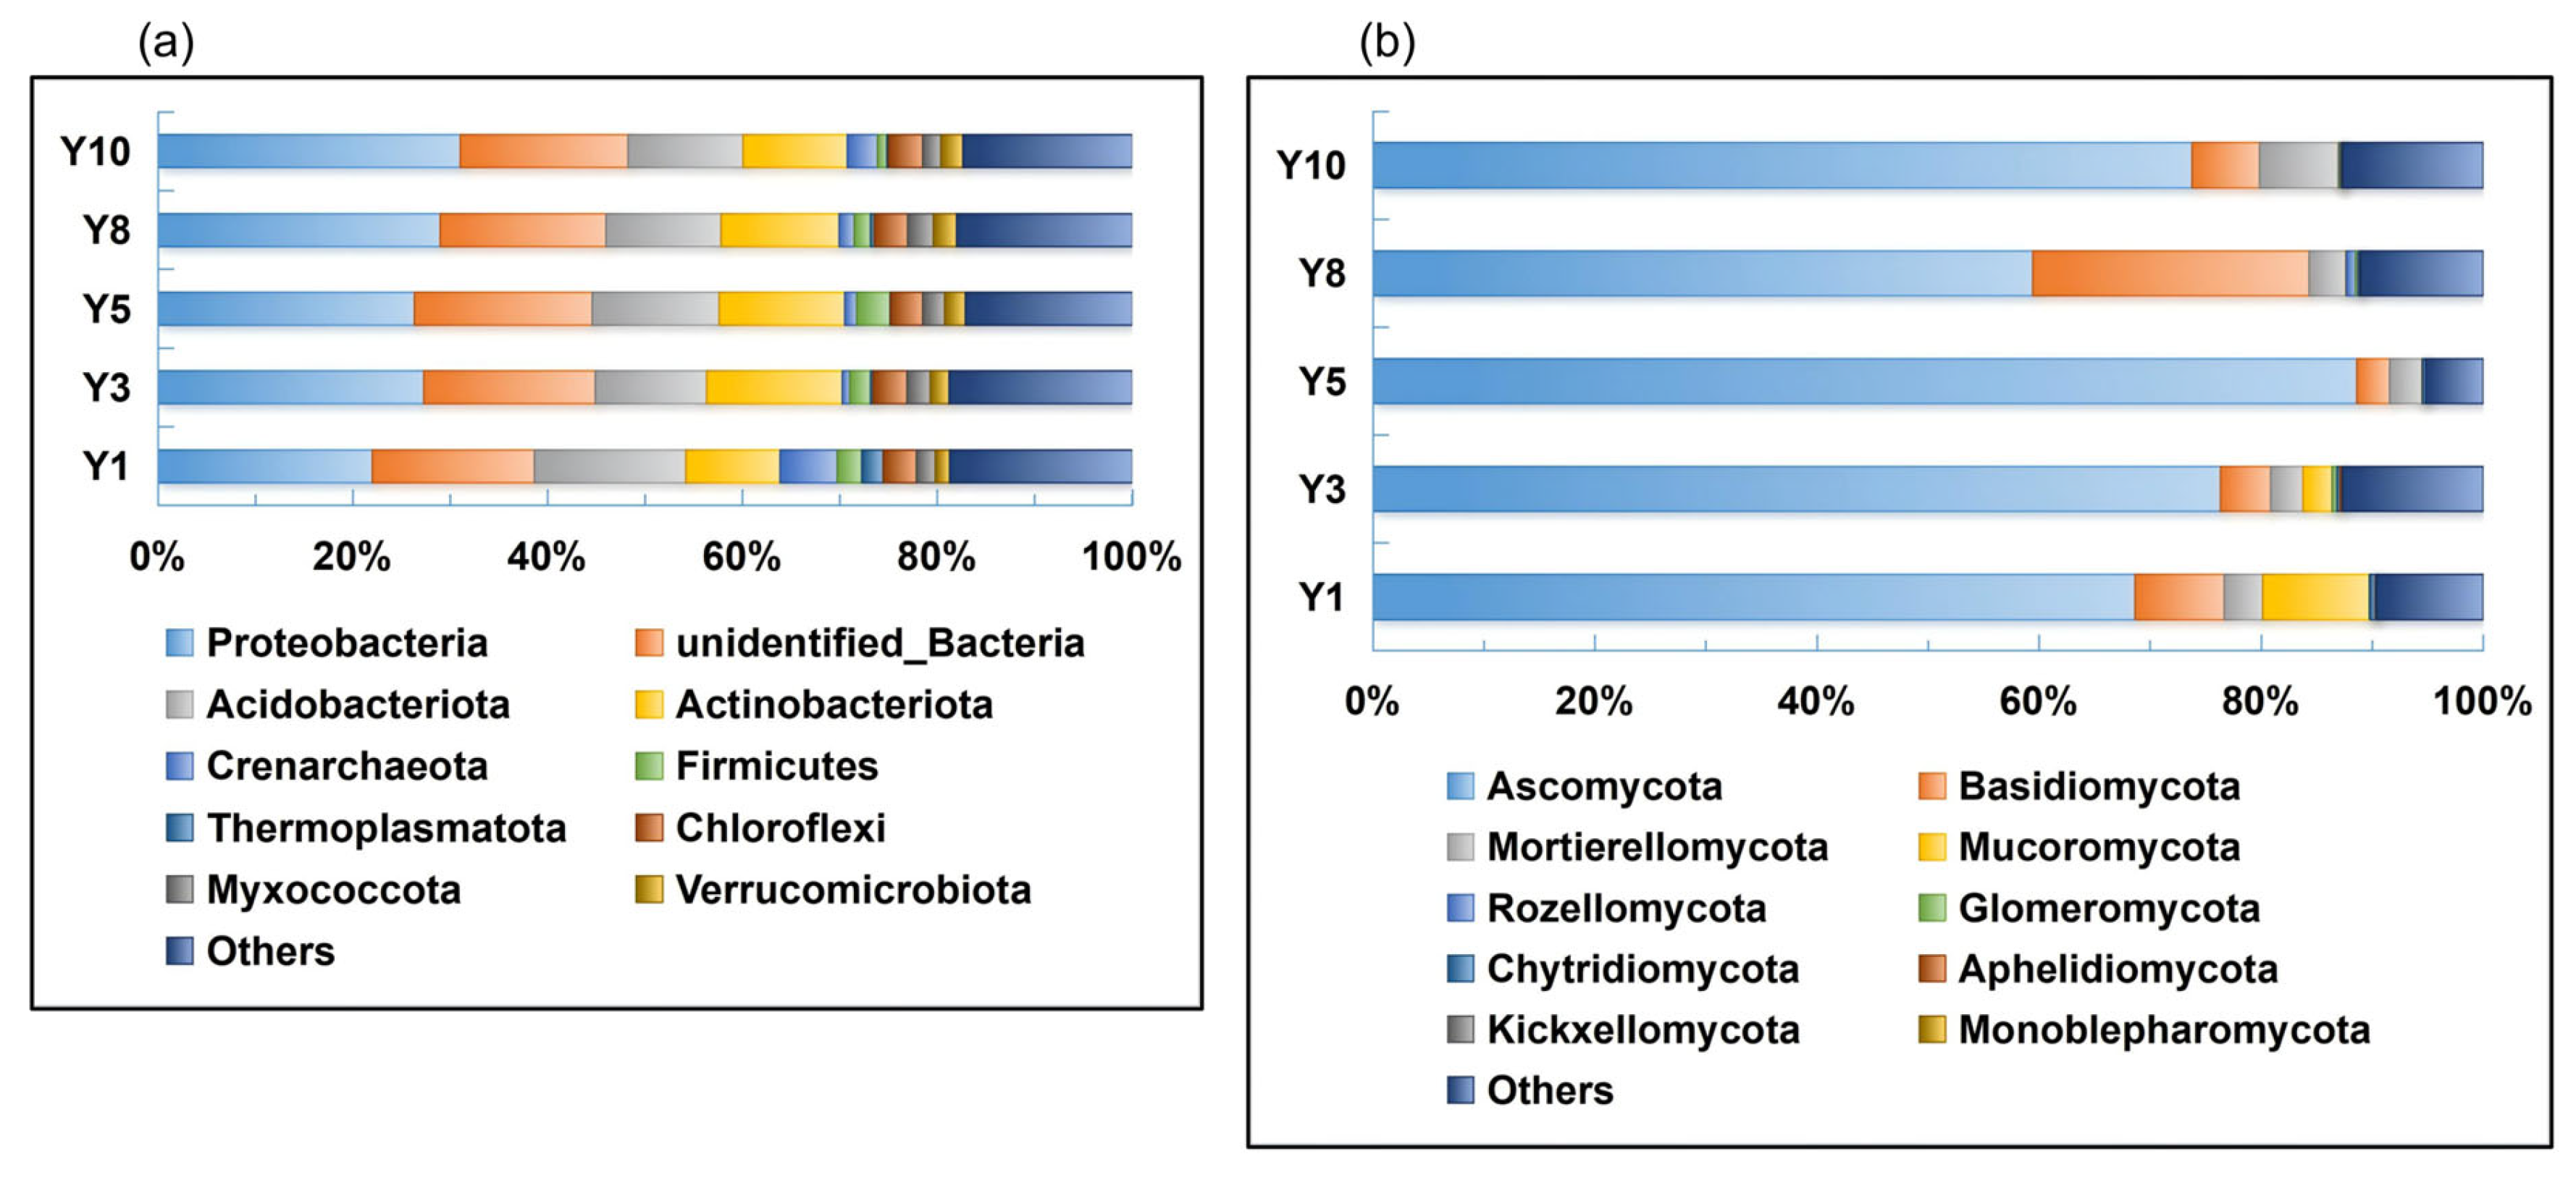
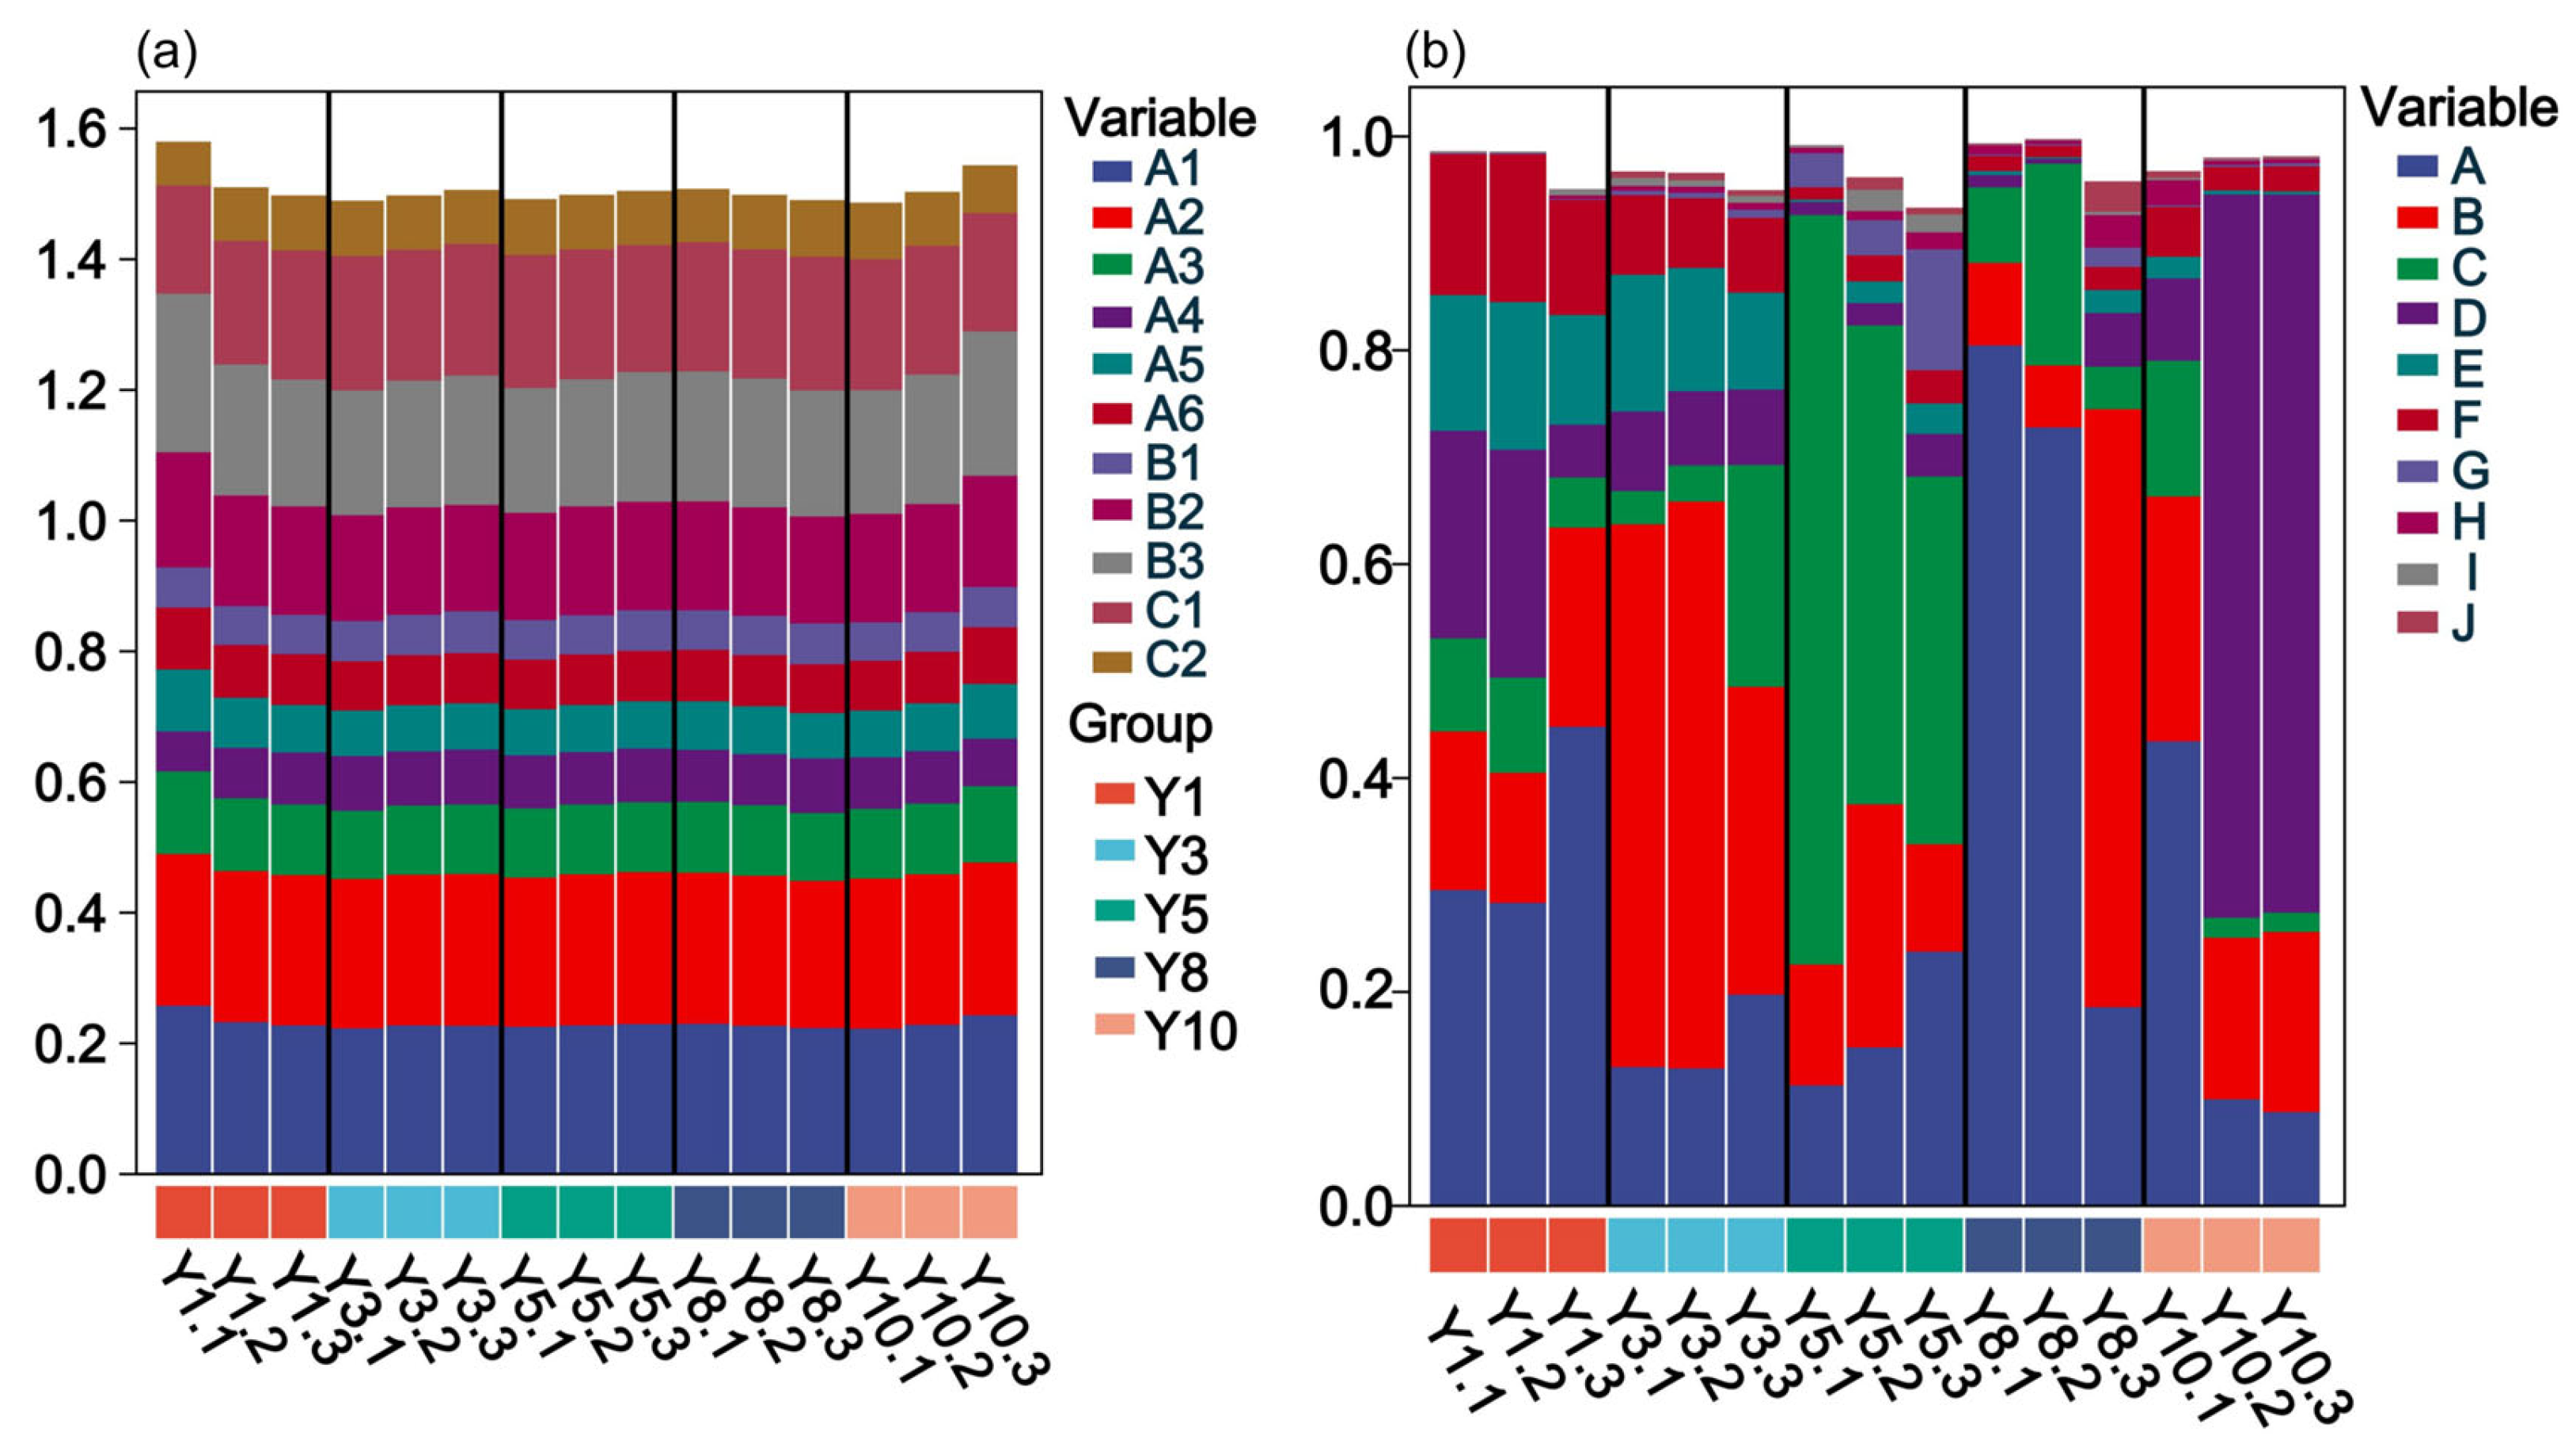
Across all groups, the dominant bacterial phyla (relative abundance > 1%) included were Proteobacteria (21.9–31%), unclassified bacteria (16.6–18.2%), Acidobacteriota (11.7–15.5%), Actinobacteriota (9.7–13.9%), Crenarchaeota (0.7–5.8%), Firmicutes (0.9–3.4%), Thermoplasmatota (0.09–2.1%), Chloroflexi (3.2–3.4%), Myxococcota (1.9–2.6%), Verrucomicrobiota (1.4–2.3%), Bacteroidota (2.0–2.5%), Gemmatimonadota (1.6–2.8%), and Nitrospirota (1.0–1.9%) (Figure 4a). The highest abundance in Thermoplasmatota (2.2%) and Crenarchaeota (5.8%) appeared in Y1, whereas both phyla remained below 1% in all other groups. Among the dominant phyla, significant differences among cropping years were detected for Proteobacteria and Acidobacteriota (one-way ANOVA, p < 0.05). For Proteobacteria, the relative abundance increased significantly in later years: Y8 (0.289 ± 0.01) and Y10 (0.311 ± 0.01) were significantly higher than Y1 (0.219 ± 0.03) (p < 0.05), while Y3 (0.273 ± 0.01) and Y5 (0.263 ± 0.02) showed intermediate values that did not differ significantly from either Y1 or the later groups. For Acidobacteriota, the relative abundance declined after Y1: Y3 (0.114 ± 0.01), Y8 (0.118 ± 0.01), and Y10 (0.117 ± 0.01) were significantly lower than Y1 (0.155 ± 0.01) (p < 0.05), whereas Y5 (0.130 ± 0.01) was not significantly different from Y1. In contrast, Actinobacteriota and all other phyla—including Chloroflexi, Crenarchaeota, Bacteroidota, Myxococcota, Gemmatimonadota, Firmicutes, Verrucomicrobiota, and Nitrospirota—showed no significant changes over time (p > 0.05) (Table A6). For fungi, 11 distinct phyla were detected across all samples (Figure 4b). Ascomycota was the dominant phylum across all treatment groups, accounting for 59.4–88.6% of total sequences, followed by Basidiomycota, Mortierellomycota, and Mucoromycota. One-way ANOVA showed that Ascomycota, Basidiomycota, and Mortierellomycota did not vary significantly along the cultivation chronosequence (all p > 0.05; Table A6), although Ascomycota peaked at Y5 (88.6%) and Basidiomycota increased numerically at Y8 (0.249 ± 0.17). In contrast, Mucoromycota varied significantly with cropping duration (p < 0.05), being highest at Y1 (0.096 ± 0.01), decreasing sharply at Y3 (0.026 ± 0.02), and not being detected at Y5, Y8, and Y10.
Among the 450 bacterial genera detected across all sampling sites, the most abundant (>1%) were Sphingomonas (2.5–4.6%), RB41 (2.4–5.2%), MND1 (2.0–2.6%), Dongia (1.7–3.2%), and Steroidobacter (1.2–1.7%) (Table 2). With increasing cropping duration, RB41 decreased significantly from 5.2% at Y1 to 2.8% at Y10 (a decrease of 46.2%; p < 0.05), while Lysobacter increased significantly from 0.5% at Y1 to 1.7% at Y10 (an increase of 240%; p < 0.05). No significant changes were observed for the other dominant genera (all p > 0.05).
For fungi, 428 genera were identified across all sampling sites. Among the dominant fungal genera, Fusarium decreased significantly with cropping duration, and Monographella increased from 13.1% at Y1 to 43.0% at Y10 (228% increase; p < 0.05). Torula was significantly higher in the early stage (Y1–Y3) than in the later stage (Y5–Y10), while Orbicula and Phoma both peaked at Y5 (p < 0.05). The other dominant fungal genera showed no significant differences (all p > 0.05; Table 2).

3.5. Relationships Between Soil Parameters and Microbial Diversity Indices

Pearson correlation analysis was performed to explore the relationships between soil physicochemical properties and microbial alpha diversity indices (Table 3). For bacterial communities, Shannon, Simpson, and Chao1 indices were positively correlated with soil pH (r = 0.577, 0.692, and 0.774, respectively; p < 0.05, p < 0.01, and p < 0.001) and negatively correlated with AN (r = −0.543, −0.599, and −0.628, respectively; p < 0.05 for all). In addition, bacterial Chao1 was negatively correlated with TN (r = −0.598, p < 0.05) and SOM (r = −0.560, p < 0.05). Fungal Shannon and Simpson indices were negatively correlated with TN (r = −0.536 and −0.556, respectively; p < 0.01) and AK (r = −0.563 and −0.564, respectively; p < 0.01). In addition, Shannon was also negatively correlated with TK (r = −0.514, p < 0.01) and AN (r = −0.521, p < 0.01).
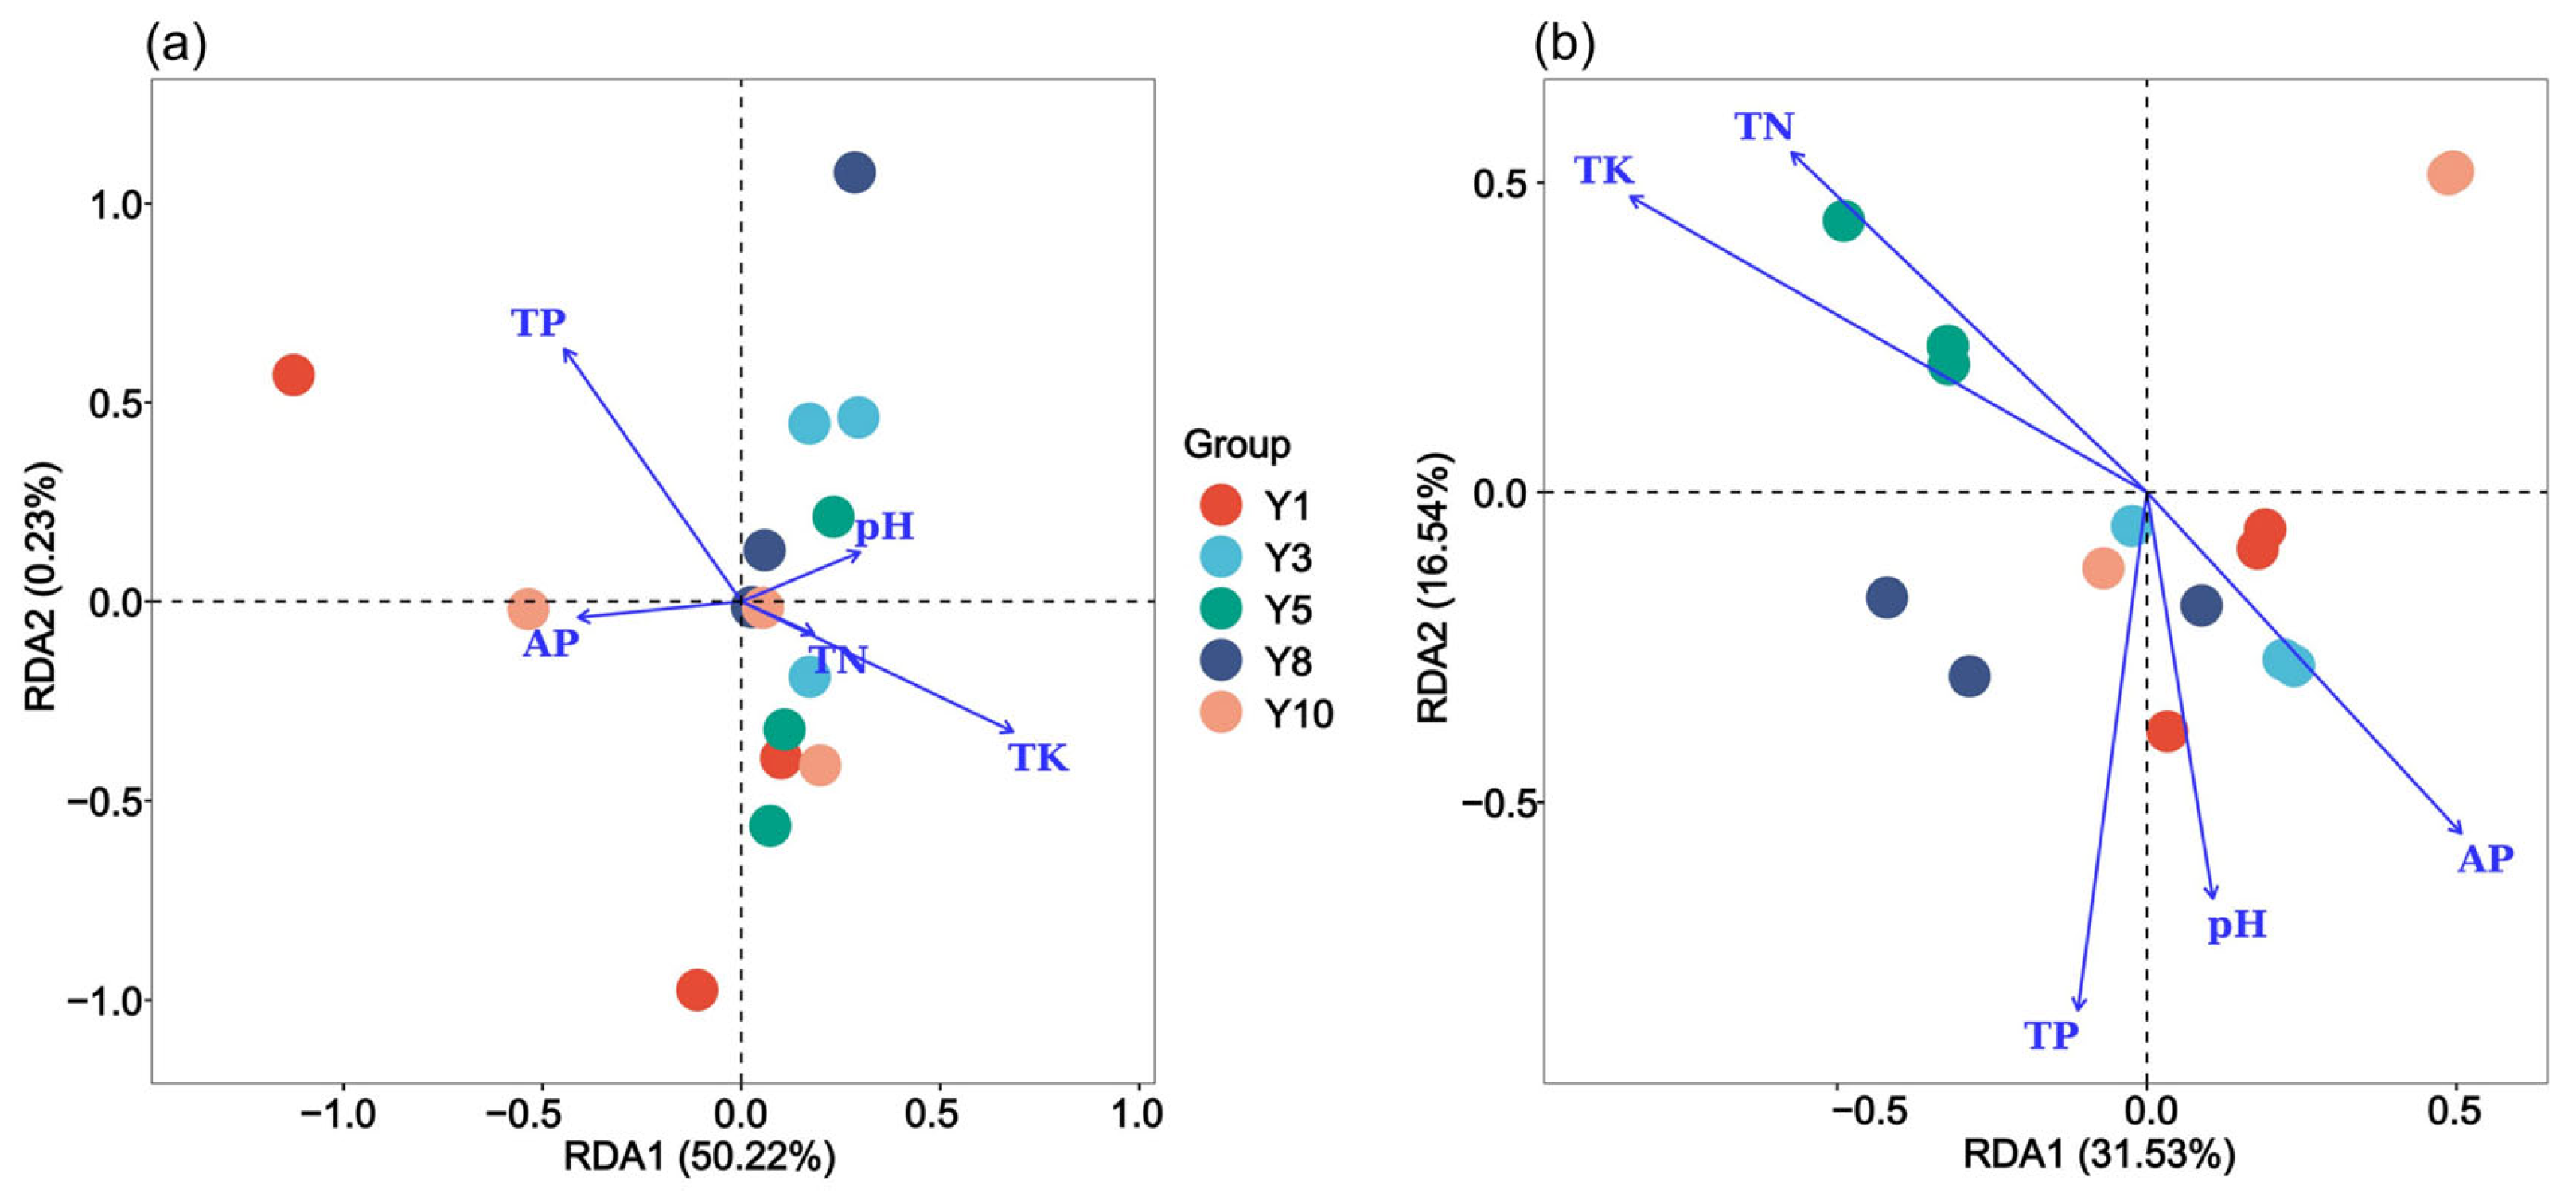
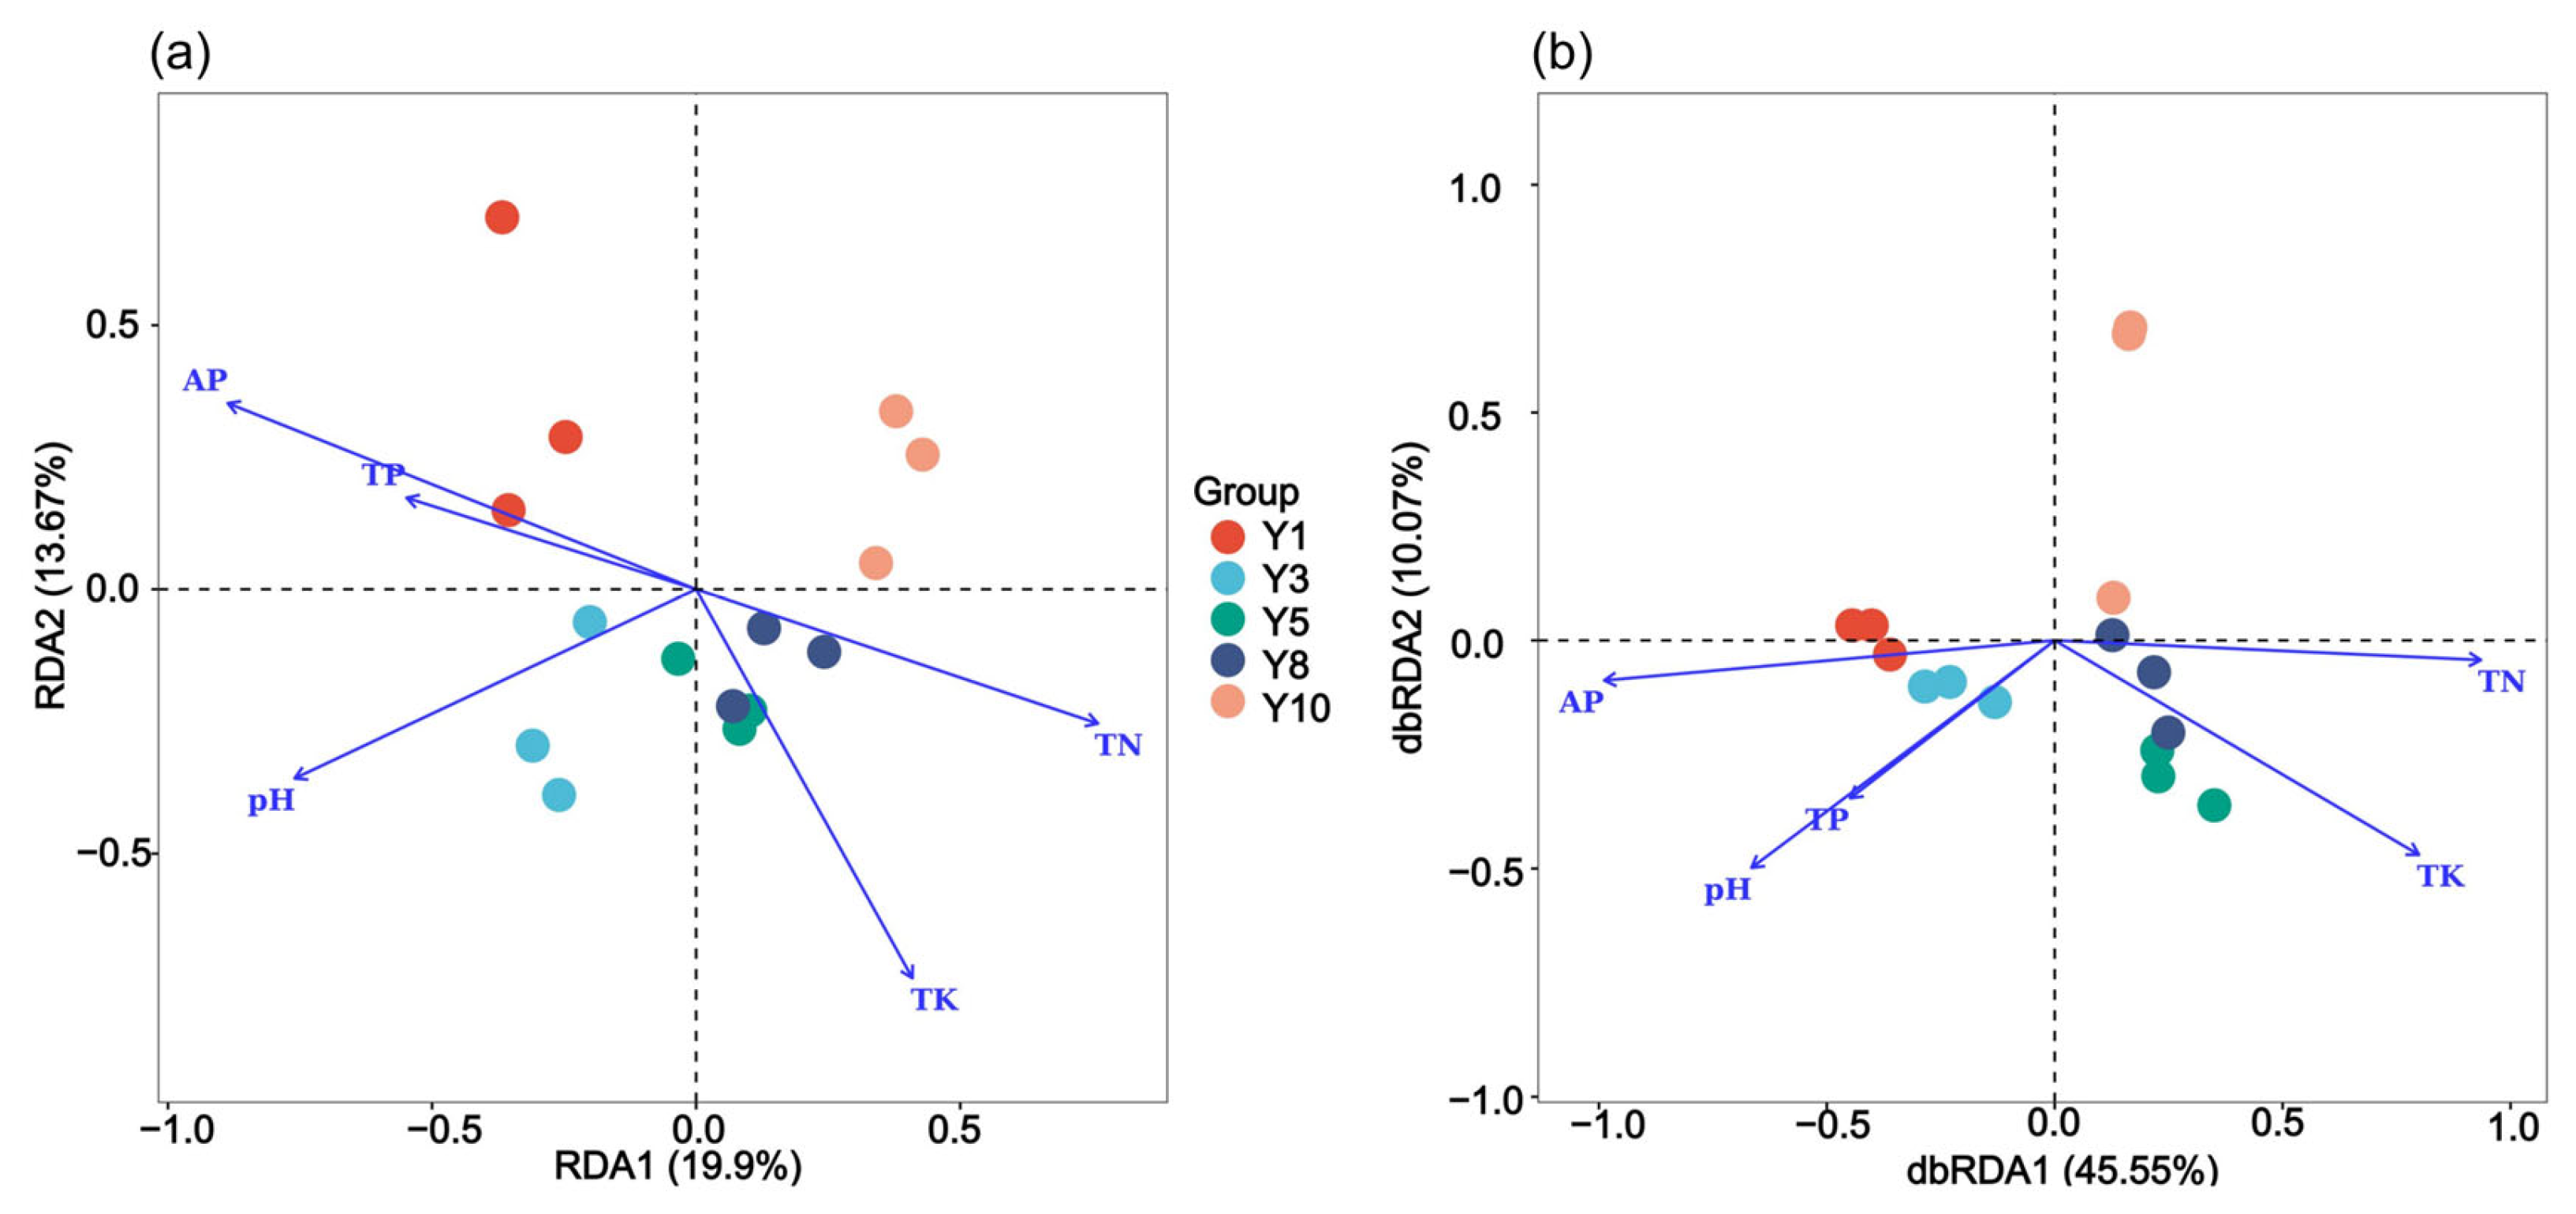
Redundancy analysis (RDA) was performed to examine the relationships between soil properties and bacterial community composition at the genus level (Figure 5a). The five soil variables (TN, TP, TK, AP, and pH) collectively explained 45.55% of the total variation in bacterial community structure, with RDA1 explaining 19.9% and RDA2 explaining 13.67% of the constrained variance. The overall model was highly significant (F = 1.918, p = 0.003). Monte Carlo permutation tests (999 permutations) revealed that among the five variables, only AP showed a marginally significant correlation with the RDA axes (r2= 0.1035, p = 0.050), while TN (p = 0.420), TP (p = 0.290), TK (p = 0.309), and pH (p = 0.143) were not significantly correlated. Along RDA1, the AP and pH vectors pointed toward the negative axis. Y1 and Y3 samples were located on the same (negative) side of these vectors, indicating their association with relatively higher AP and pH conditions during the early stage of continuous cropping. In contrast, Y5, Y8, and Y10 samples projected on the opposite (positive) side, corresponding to lower AP and pH conditions in the later stage.
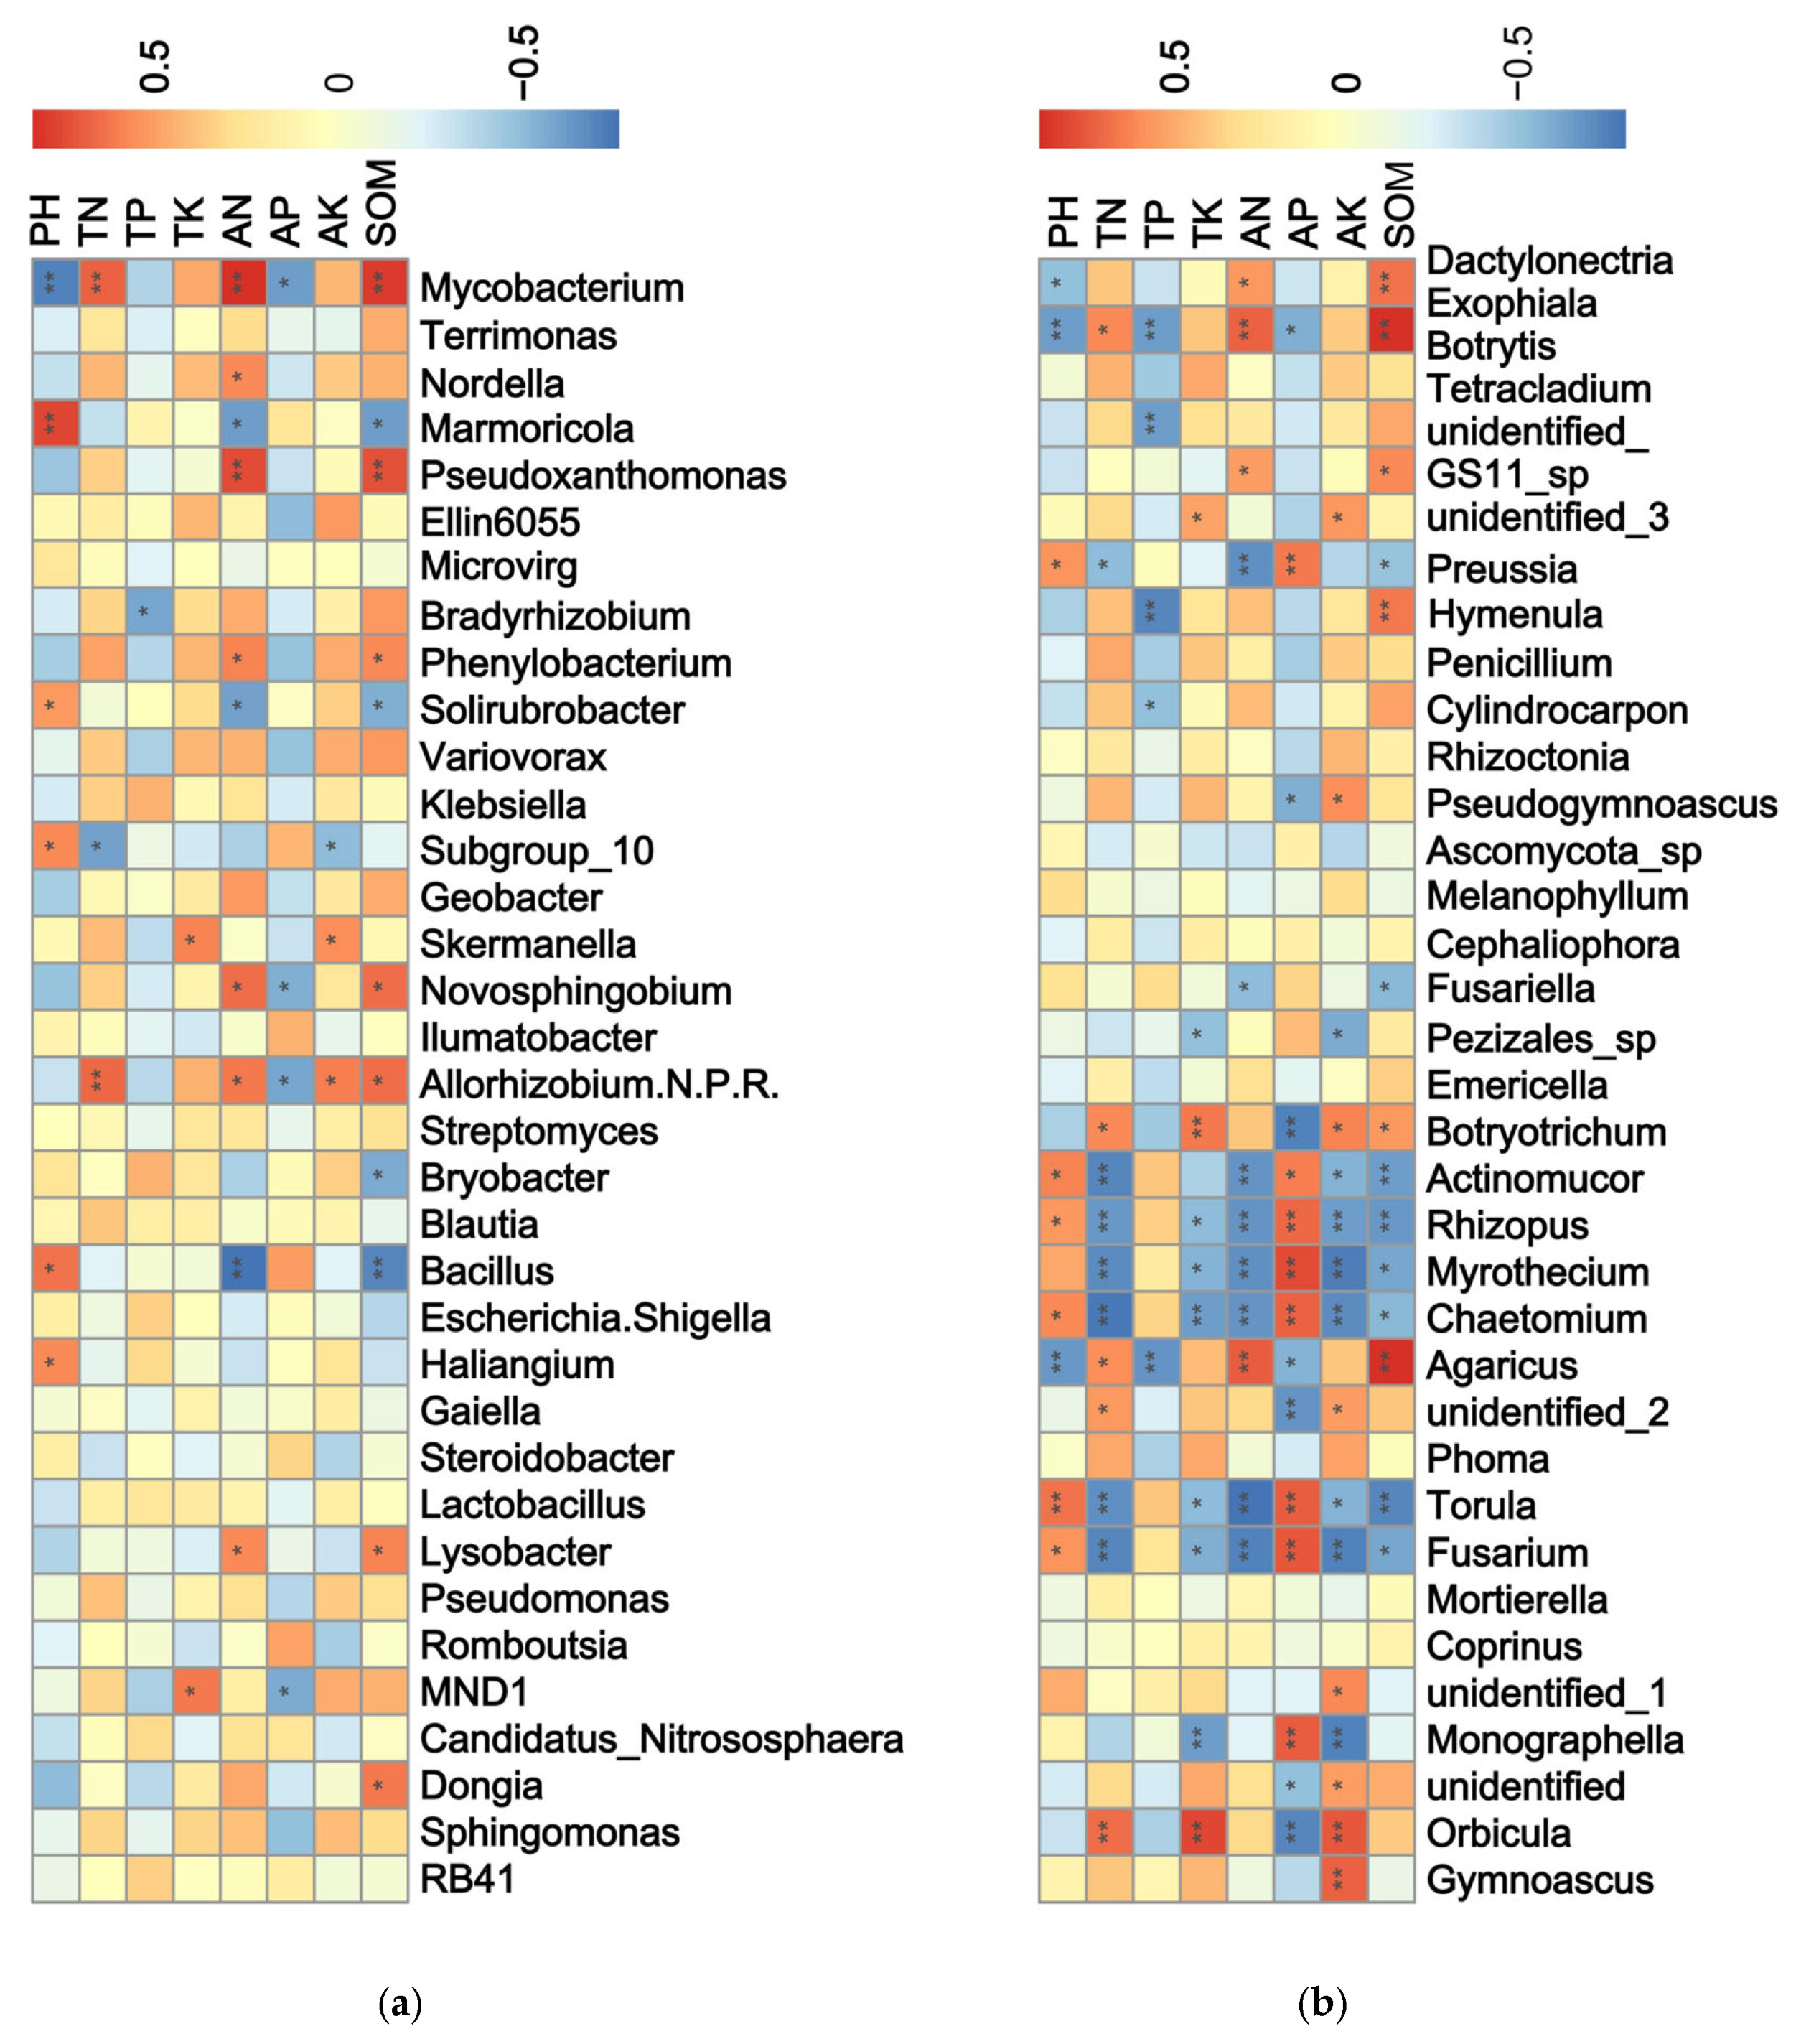
Pearson correlation analysis further revealed the significant positive correlations of SOM and AN with Mycobacterium, Pseudoxanthomonas, Rhizobium, Novosphingobium, Lysobacter, and Phenylobacterium (Figure 6a). In contrast, these soil factors were negatively correlated with Bacillus, Marmoricola, and Solirubrobacter. AP was positively correlated with Bacillus and Romboutsia but negatively correlated with Mycobacterium, Rhizobium, and Novosphingobium. Additionally, pH positively affected Marmoricola, Bacillus, Mycobacterium, and Solirubrobacter abundance.
For fungal communities, db-RDA revealed that the five soil variables (TN, TP, TK, AP, and pH) collectively explained 63.17% of the total variation in fungal community composition, with dbRDA1 and dbRDA2 accounting for 45.55% and 10.07% of the constrained variance, respectively (Figure 5b). The overall model was highly significant (F = 3.086, p = 0.002). Monte Carlo permutation tests (999 permutations) showed that AP (r2 = 0.783, p = 0.001), TK (r2 = 0.760, p = 0.001), TN (r2 = 0.739, p = 0.003) and pH (r2 = 0.520, p = 0.010) were significantly correlated with the db-RDA axes, with AP showing the strongest overall correlation. Along dbRDA1, the AP and pH vectors pointed toward the negative axis. Y1 and Y3 samples were located on the same (negative) side of these vectors, indicating their association with relatively higher AP and pH conditions during the early stage. Conversely, Y5, Y8, and Y10 samples projected on the positive side, corresponding to lower AP and pH conditions in the later stage.
Pearson correlation analysis further revealed that AK and TN were positively correlated with the relative abundances of Orbicula, Botryotrichum, and Phoma but negatively correlated with those of Myrothecium, Fusarium, Chaetomium, Rhizopus, and Torula (Figure 6b). Conversely, AP and pH exhibited opposite trends, being positively associated with the latter five genera and negatively with the former three.
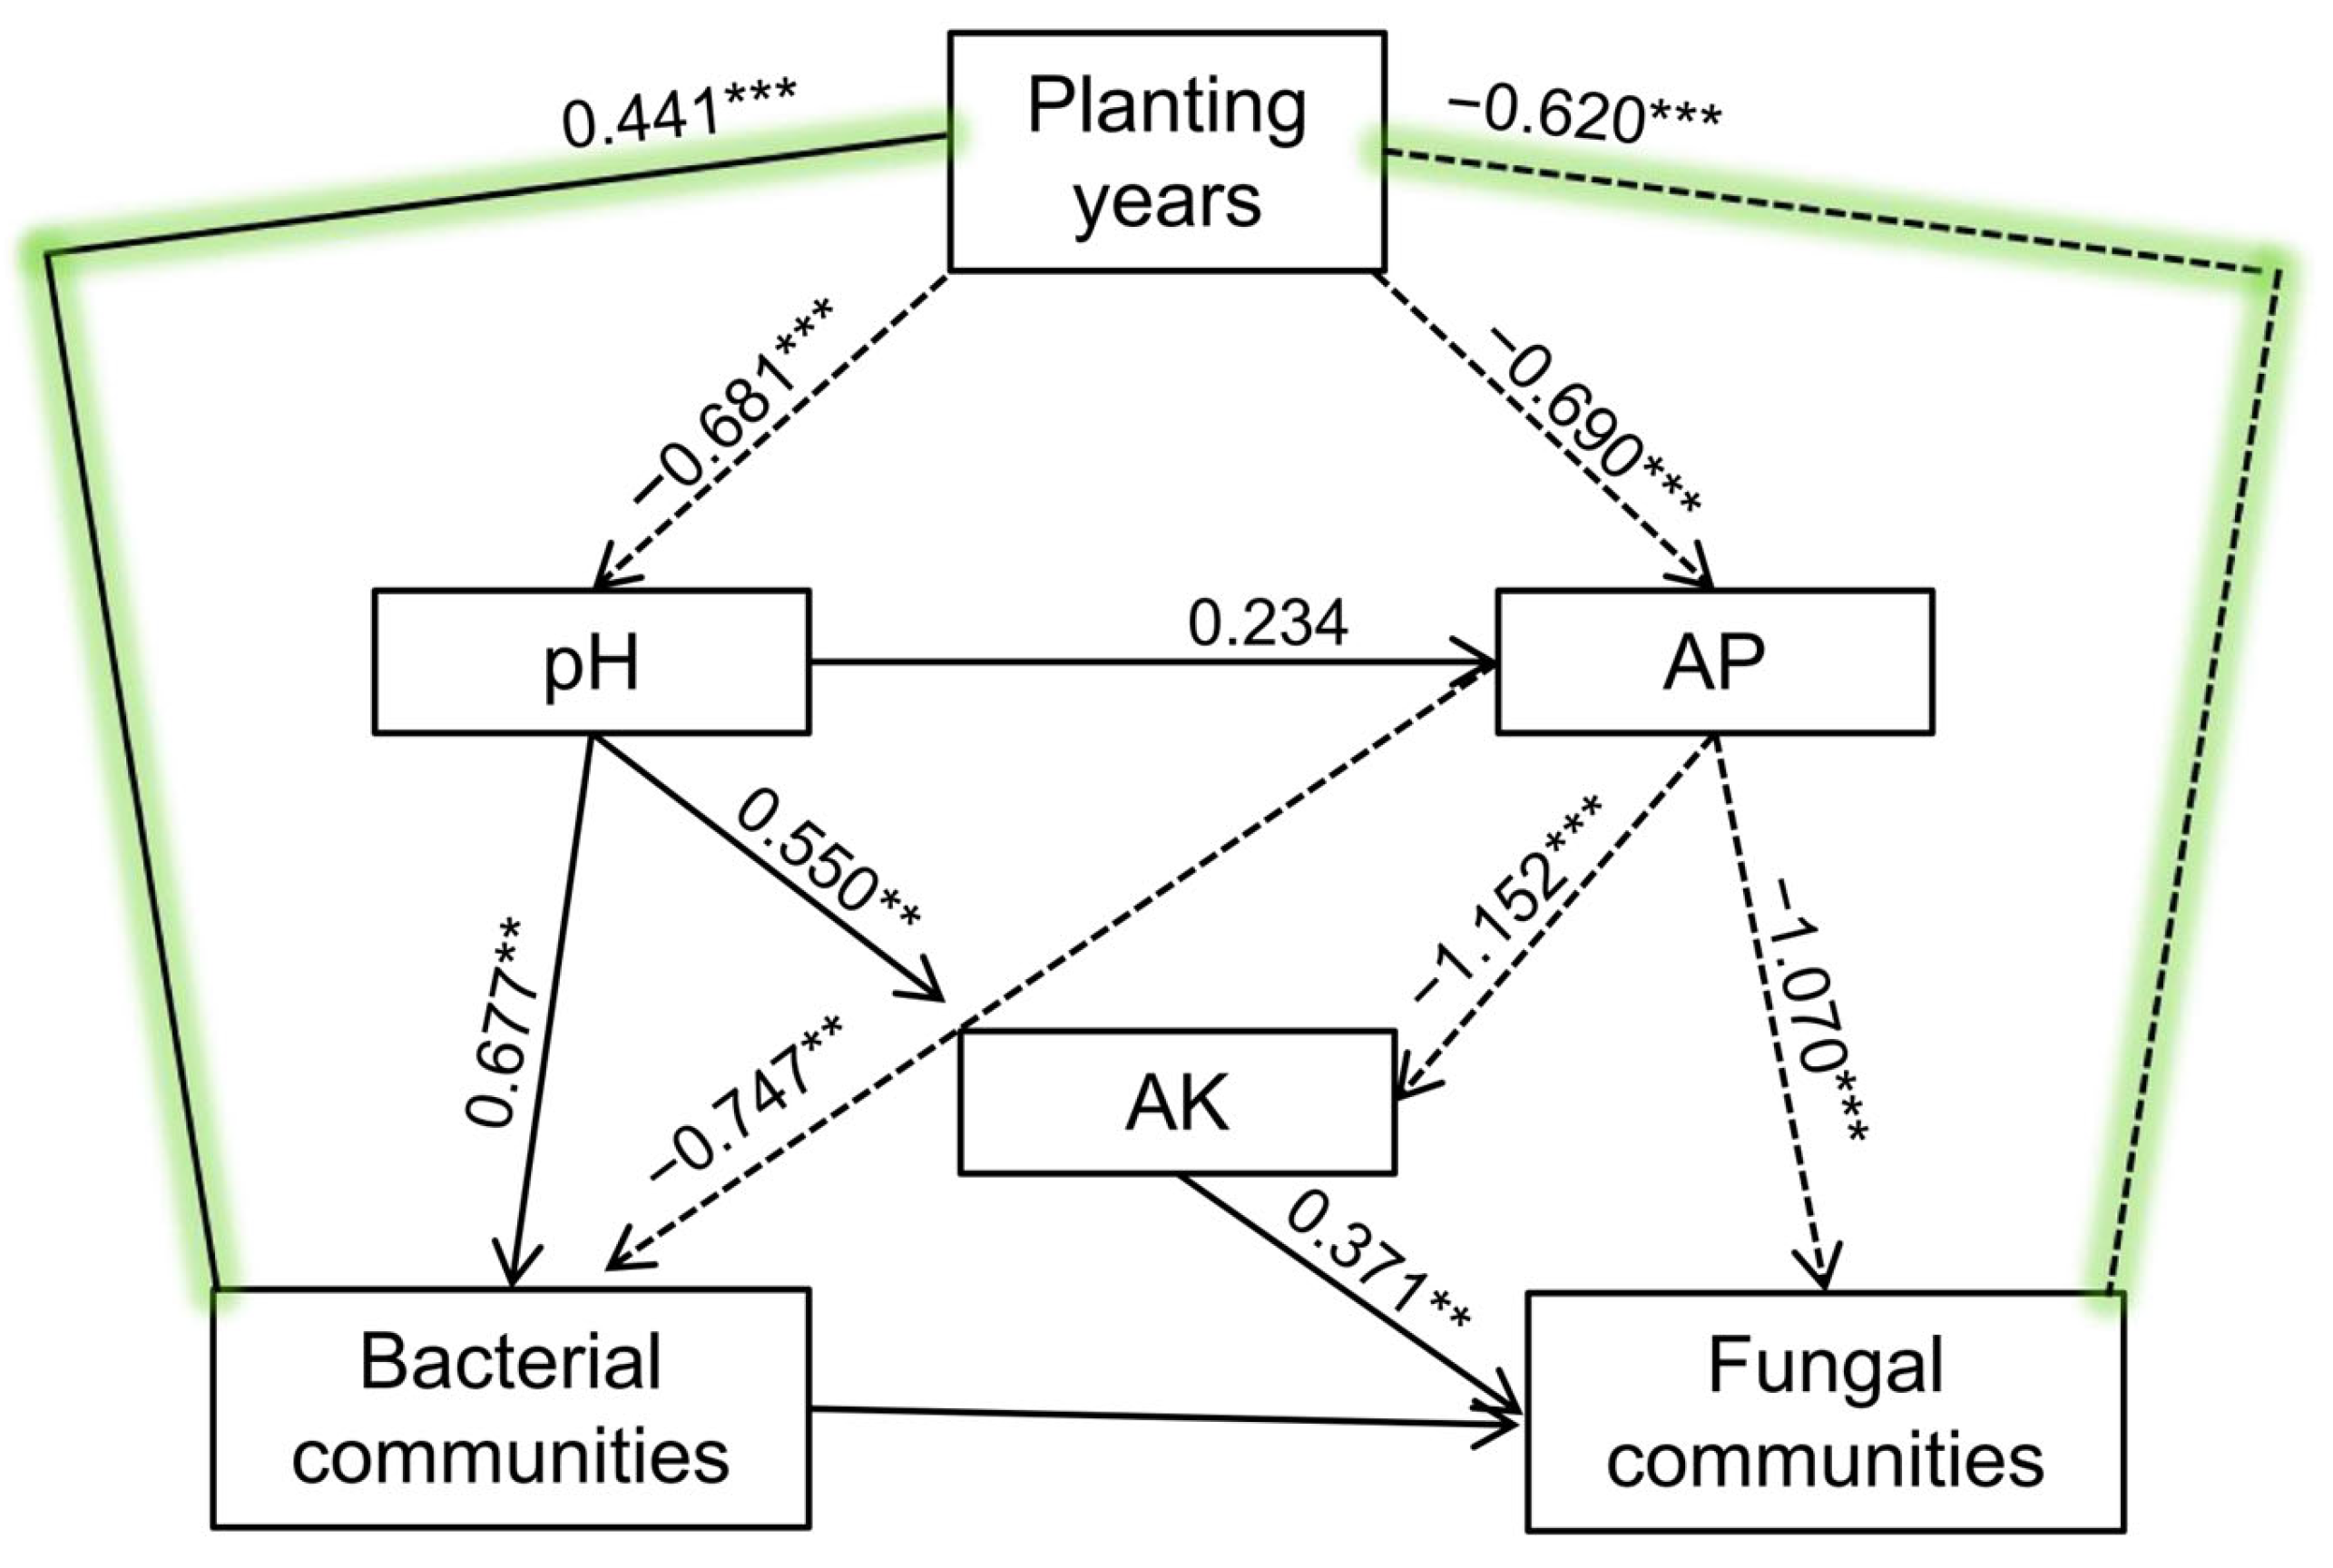
SEM was used to examine potential relationships among cropping duration, soil properties, and microbial communities (Figure A2). The model explained 65.2% and 91.7% of variance in bacterial and fungal communities, respectively. Cropping duration was associated with bacterial and fungal community composition, and these associations may be at least partially mediated through changes in soil pH and AP. The model also indicated potential negative associations between soil AP and both bacterial and fungal community structures. Given the limited sample size n = 15, these exploratory results should be interpreted with caution and require validation in future studies.

3.6. Predictive Functional Annotation of Bacteria and Fungi

Predicted functional classification of bacterial communities was performed by comparing inferred functional gene profiles with the KEGG Orthology (KO) database. Six major predicted biological metabolic functions were observed at the first functional level-1: cellular processes, environmental information processing, genetic information processing, human diseases, metabolism, and organismal systems. Among these, metabolism, genetic information processing, and environmental information processing were the primary first-level functions. At KEGG level-2, 44 predicted secondary functional categories were identified, of which 11 had predicted relative abundances greater than 1% (Figure 7a); only replication and repair, membrane transport, and energy metabolism showed significant changes with cropping duration (p < 0.05); the remaining eight categories remained stable (p > 0.05). Carbohydrate metabolism and amino acid metabolism were the most abundant predicted categories, followed by translation, membrane transport, replication and repair, and energy metabolism. All other secondary categories had predicted relative abundances below 10%.
Predicted fungal trophic modes were classified using FUNGuild (Figure 7b). The dominant predicted nutritional guilds across all samples were saprotrophs (25.84–67.33%), pathotrophs (2.37–48.09%), and pathotrophs-Saprotrophs (3.22–24.56%). ANOVA identified two guilds with significant abundance shifts (>1%) over time: Undefined_Saprotroph (primarily associated with Gymnoascus and Agaricaceae) and Plant_Pathogen-Soil_Saprotroph-Wood_Saprotroph (predominantly linked to Fusarium). The confidence of FUNGuild assignments varied among taxa: an amount of 7.1% (113 OTUs) were classified as “highly probable”, 27.6% (437 OTUs) as “probable”, 8.6% (137 OTUs) as “possible”, and 56.6% (897 OTUs) remained unassigned.
RDA was performed to examine the relationships between soil properties and bacterial functional composition (Figure 8a). The five soil variables collectively explained 50.66% of the variance; however, the overall model was not statistically significant (F = 1.85, p = 0.156). RDA1 separated the early stage (Y1) from the later cropping years (Y3–Y10). Envfit analysis revealed no significant correlations between any measured soil variable and the RDA axes (all p > 0.05). Thus, the measured soil properties did not significantly explain the observed variation in bacterial functional composition.
RDA of fungal functional guilds revealed that the five edaphic variables collectively explained 67.18% of the variance, with the overall model being highly significant (F = 3.68, p = 0.001) (Figure 8b). The first two constrained axes accounted for 31.53% and 16.54% of the explained variance, respectively. RDA1 clearly discriminated Y1, Y3, and Y10 (negative side) from Y5 and Y8 (positive side). Envfit analysis further identified TN (r2 = 0.5225, p = 0.006), TP (r2 = 0.5350, p = 0.014), TK (r2 = 0.7485, p = 0.001), and AP (r2 = 0.4657, p = 0.027) as significantly associated with the ordination axes. Collectively, these findings suggest that TN, TK, and AP are key edaphic factors shaping fungal functional composition along the cropping chronosequence.

4. Discussion

4.1. Soil Chemical Changes and Edaphic Drivers of Microbial Community Differentiation During Long-Term Monoculture of Paeonia ostii ‘Feng Dan’

In this study, continuous cropping of Paeonia ostii ‘Feng Dan’ for up to 10 years induced a striking decoupling in soil chemistry: while SOM, TN, and AN accumulated from Y5 onward, AP plummeted by ~50% after Y3 and remained depleted thereafter. The SOM and TN buildup likely reflects sustained organic residue input [52,53,54], whereas the AP decline suggests transformation of labile P into microbial biomass or stable mineral phases through microbial immobilization and physicochemical sorption [55,56]. This decoupling challenges the conventional assumption that organic matter accumulation automatically improves phosphorus availability [57]. db-RDA identified AP as the strongest predictor associated with bacterial community variation, highlighting the critical role of phosphorus availability in structuring bacterial assemblages in this agroecosystem. For fungi communities, AP, TK, TN, and pH collectively showed significant correlations with community composition. The higher explanatory power of environmental variables for fungi (63.17%) than for bacteria (45.55%) suggests that fungi are more responsive to phosphorus depletion in this alkaline system [58,59], potentially reflecting their distinct ecological strategies under alkaline pH conditions where phosphorus is the primary limiting resource.
Notably, although the average content of AP declined significantly with prolonged monoculture, RDA indicated that AP remained a key factor associated with bacterial community differentiation from Y5 toY10. This reflects that RDA captures relative gradients among samples rather than absolute nutrient status [60]: even under overall AP depletion, the remaining inter-sample variability in AP was sufficient to structure the community. The sharp transition from high to low AP between Y3 and Y5 may therefore constitute a strong environmental filter, selecting for taxa with low-phosphorus adaptation strategies (e.g., Geobacter and Massilia) [61]. Genus-specific correlations supported this: Bacillus was positively associated with AP and pH, and its relative abundance decreased from 0.44% at Y1 to 0.24% at Y10, suggesting adaptation to alkaline, phosphorus-rich conditions and a decline under phosphorus depletion [62,63]. Conversely, Rhizobium and Novosphingobium—key taxa involved in nitrogen fixation [64,65] and phosphate solubilization [66], respectively—were negatively correlated with AP and pH, and their relative abundances increased substantially over time (Rhizobium: from 0.18% to 0.59%; Novosphingobium: from 0.17% to 0.85%). These opposing trends indicate that continuous cropping drove a functional succession from phosphorus-rich-adapted taxa to phosphorus-limited-adapted taxa, with the enriched Rhizobium and Novosphingobium potentially contributing to the maintenance of nitrogen and phosphorus cycling functions under long-term cropping stress.
The Y3–Y5 interval marked a critical transition window, during which the RDA ordination shifted from negative to positive AP associations. Over this period, AP declined by nearly half, while TN, AN, SOM, and AK began to accumulate. This interval is proposed to trigger a regime shift in microbial community assembly, ultimately contributing to replanting syndrome [67]. From a management perspective, these findings highlight that AP [68], not TP or other macronutrients, is the most critical limiting factor in long-term Paeonia ostii ‘Feng Dan’ monoculture. Moreover, the decoupling of AP from SOM/TN accumulation indicates that organic matter buildup does not automatically replenish AP, emphasizing the need for targeted phosphorus management such as phosphate-solubilizing microorganisms or periodic P fertilization [63].

4.2. Divergent Successional Patterns of Bacterial and Fungal Communities Under Continuous Cropping

In this study, bacterial and fungal communities exhibited distinct successional patterns under prolonged monoculture. While bacterial richness (Chao1) showed an overall decline with minor fluctuations along the chronosequence, the concurrent stability of Simpson evenness suggests that the observed species loss did not translate into a major restructuring of community dominance. This decoupling points to the selective elimination of rare taxa rather than a community-wide collapse [69,70,71]. In contrast to the bacterial successional pattern, fungal communities exhibited a distinct response. Fungal richness remained higher than at Y1 at most cropping stages but declined markedly at Y8. The stability of fungal Shannon and Simpson indices throughout the study period suggests that hyphal networks may buffer fungal communities against richness fluctuations by maintaining functional redundancy [72].
Correlation analyses further revealed that bacterial alpha diversity was most strongly associated with pH (positive) and AN (negative), suggesting that shifts in soil pH and nitrogen accumulation under continuous cropping may contribute to bacterial richness decline. This aligns with previous findings that soil pH is a strong predictor of bacterial community composition [73,74] and that bacterial diversity often declines under elevated nitrogen availability [75]. Notably, while fungal richness was unrelated to any measured edaphic factor, fungal evenness exhibited associations with soil nutrients. This differential sensitivity suggests that fungal community evenness, rather than richness, may respond to nutrient accumulation under long-term monoculture, further highlighting the divergent responses of bacterial and fungal communities to soil properties [76].
The decrease in bacterial richness suggests that long-term monoculture creates a selective environment—characterized by altered pH, root exudates, and pesticide residues—that eliminates sensitive taxa [77,78]. In contrast, continuous input of root debris and organic matter provides new niches for saprophytic fungi. These divergent responses reflect fundamental ecological principles: bacterial communities, with faster growth rates and narrower niche preferences, are more vulnerable to selective pressures and changes in pH, nitrogen, and organic matter [79,80], whereas, fungal communities, with broader enzymatic capabilities and extensive hyphal networks, are more resilient and can colonize new niches, maintaining diversity even under nutrient fluctuations [81,82].

4.3. Succession of Fungal Pathogens and the Replanting Syndrome

In this study, Fusarium, Monographella, and Mortierella persisted as the core dominant genera across all stand ages. The first two taxa are recognized plant pathogens [83,84]. Their divergent temporal dynamics suggest a distinct pathogen succession: Fusarium dominated the early stage but declined thereafter, whereas Monographella exhibited a late-stage surge, becoming the dominant pathogen after 8–10 years of continuous cropping. The delayed enrichment in Monographella is particularly significant, as this genus contains species known to cause leaf and stem blight in various crop [85]. A mid-phase outbreak of Phoma—another pathogenic genus [86]—was also observed, indicating a temporal shift in pathogen dominance. In contrast, Torula, often considered a saprophyte or weak opportunist [87], declined over time, suggesting that long-term monoculture favors pathogenic over saprophytic taxa. The late-stage emergence of Monographella, coupled with the decline in other pathogens, implies a narrowing of the pathogen community toward a single dominant taxon, which may exacerbate replanting syndrome in the later years of Paeonia ostii continuous cropping.
This succession is fundamentally linked to the long-term changes in soil chemistry. The positive correlations of Fusarium abundance with AP and pH suggest that the progressive depletion in AP and the modest decline within the persistently alkaline range may have contributed to its suppression after the initial years. In contrast, Monographella abundance was positively associated with TN and SOM but negatively correlated with pH, implying that the accumulation of organic matter and nitrogen from Y5 onward may favor its growth, while the concurrent pH decline may have further facilitated rather than constrained its growth [88]. At the community level, RDA revealed that TN, TK, AP, and pH collectively shaped the fungal community structure in the later years (Y5, Y8, and Y10). These edaphic factors likely facilitated the enrichment of pathogenic genera, including Monographella and Phoma, during this phase [88,89].
The stark contrast in fungal community composition between the early (Y1, Y3) and later (Y5–Y10) years, paralleling the marked shifts in edaphic properties, underscores a fundamental nutritional transition in the soil ecosystem. This pattern is consistent with previous studies reporting increased levels of certain nutrients, including TN and AK, following long-term continuous cropping [77,90]. Notably, AK exhibited a strong negative correlation with early-stage pathogens such as Fusarium and Myrothecium, suggesting that potassium depletion over the cropping sequence may have eroded the soil’s natural suppressiveness against these taxa [90,91]. Collectively, these findings indicate that the progressive alteration of soil nutrient stoichiometry not only restructures the fungal community but also selectively favors the proliferation of pathogenic lineages [88,92].
An apparent paradox emerged: although Fusarium abundance was positively correlated with AP, the overall soil-borne disease risk escalated as AP declined along the cropping chronosequence, culminating in the Monographella dominance at Y10. This discrepancy indicates that pathogen enrichment is not driven by a single nutritional factor but reflects species-specific responses to multiple edaphic stressors. Specifically, while Fusarium thrives under phosphorus-rich conditions [93], persistent alkaline pH condition [94] and potassium depletion [95] characteristic of this system may have created a niche conducive to opportunistic pathogens such as Monographella. Additionally, continuous cropping-induced alterations in root exudate composition may provide alternative carbon and nutrient sources [96,97], decoupling pathogen proliferation from soil phosphorus status. Thus, the net expansion of pathogenic communities persisted despite AP depletion. Importantly, this expansion was not counteracted by the resident biocontrol fungus Mortierella [98], which remained dominant throughout but did not prevent the late-stage surge of Monographella. Its biocontrol functions are primarily mediated through rhizosphere microbiome modulation rather than direct pathogen inhibition [99], and such indirect suppression may be insufficient once pathogen pressure escalates—particularly when pathogens expand through mechanisms that circumvent resource competition [96,97]. It is noteworthy, however, that RDA identified AP as a significant structuring force for the overall microbial community, implying that phosphorus availability primarily governs community assembly rather than the absolute abundance of specific pathogens [100].
Taken together, our results suggest a temporal succession of fungal pathogens under continuous tree peony cropping: Fusarium predominates the early phase, Phoma peaks in the middle phase, and Monographella becomes the dominant taxon in the late phase (Y10). The replanting syndrome of Paeonia ostii may therefore not merely result from pathogen accumulation but may also reflect a shifting pathogen complex, in which the dominant causal agent changes with cropping duration. Accordingly, management strategies should be stage-specific: control Fusarium in early years (e.g., seed treatment or soil disinfestation) [101,102], target Phoma at Y5, and focus on Monographella in later years by reducing excess nitrogen and carbon inputs [54], maintaining near-neutral pH [103,104], and enhancing antagonistic bacteria such as phosphate-solubilizing Bacillus strains associated with AP [105].

4.4. Functional Shifts in the Soil Microbiome Under Continuous Cropping

At the broad functional level, carbohydrate and amino acid metabolism were predicted as the dominant pathways across the chronosequence, consistent with their central role in soil microbial metabolism [106]. Membrane transport and secondary metabolism were also predicted as relatively abundant categories. These inferred patterns broadly tracked the observed taxonomic shifts, with predicted declines in energy metabolism and replication functions in later years alongside a relative increase in membrane transport functions suggesting an adaptive strategy of microbes for coping with these stresses [106]. However, as these are computationally inferred rather than experimentally determined, they are presented here as a putative framework requiring further functional validation.
Predicted functional profiles suggested a differential sensitivity of bacterial and fungal putative functions to edaphic changes along the chronosequence. For bacteria, soil properties explained 50.66% of the inferred functional variance, yet the RDA model was not significant (F = 1.85, p = 0.156), suggesting that the predicted bacterial functional composition was largely decoupled from the measured soil chemical gradients. In contrast, fungal functional guilds showed a stronger predicted association with soil nutrients (67.18% explained variance, F = 3.68, p = 0.001), with TN, TP, TK, and AP significantly correlated with the ordination axes. This inferred fungal pattern aligns with the observed nutrient-driven succession of fungal pathogens (e.g., Monographella) [88], though it should be noted that these are computationally predicted rather than experimentally validated functions. Consequently, the functional shifts described here serve primarily as a putative framework complementary to the taxonomic patterns, and their biological relevance awaits metagenomic or transcriptomic confirmation.
In summary, the predicted functional profiles partially paralleled the observed taxonomic succession: fungal inferred guilds showed significant associations with soil nutrients, whereas bacterial predicted functions were largely decoupled from the measured edaphic gradients. These patterns highlight the multifactorial nature of microbial responses to continuous cropping, though they should be interpreted cautiously because the functional profiles were computationally inferred rather than experimentally measured. Whether such putative functional shifts contribute to replant disease etiology in Paeonia ostii ‘Feng Dan’ remains to be validated through metatranscriptomics, metaproteomics, or targeted enzyme assays.

5. Conclusions

In this study, we demonstrate that continuous cropping of Paeonia ostii ‘Feng Dan’ induces predictable successional dynamics in soil microbiomes. Bacterial richness showed an overall decline with minor fluctuations along the chronosequence, whereas fungal richness displayed a non-monotonic pattern, remaining above the initial level at most stages but showing a pronounced depression at Y8. Fungal communities underwent a directional turnover from Fusarium dominance in early years to Phoma at the middle stage and ultimately to Monographella by year 10. This temporal replacement indicates that replanting syndrome arises from a stage-specific pathogen complex rather than the accumulation of a single pathogen—a shift closely linked to the decoupling of phosphorus availability from organic matter accumulation under alkaline soil conditions. At the functional level, predicted bacterial profiles shifted toward stress-adaptive processes, indicating a metabolic trade-off between growth and maintenance under long-term monoculture stress. Collectively, these findings demonstrate that phosphorus availability—rather than bulk organic matter accumulation—is the primary factor shaping microbial succession and pathogen dynamics in this alkaline agroecosystem. Management should therefore adopt stage-specific interventions targeting each dominant pathogen, coupled with phosphorus optimization, to mitigate replant disease.

Author Contributions

Conceptualization, L.Z. and X.Y.; data curation, X.T. and L.K.; formal analysis, Y.L. and M.G.; validation, X.Y. and L.Z.; investigation, X.T. and Y.L.; methodology, X.T. and L.Z.; resources, L.Z. and Y.L.; writing—original draft preparation, X.T.; writing—review and editing, L.Z., X.Y. and X.T.; visualization, L.K. and R.B.; supervision, Y.L. and R.B.; project administration, L.Z. and R.B.; funding acquisition, X.Y., M.G. and B.W. All authors have read and agreed to the published version of the manuscript.

Funding

This research was funded by the Doctoral Research Fund of Heze University, grant number XY19BS16, and the Natural Science Foundation of Shandong Province, grant number ZR2020QC166.

Institutional Review Board Statement

Not applicable.

Informed Consent Statement

Not applicable.

Data Availability Statement

The dataset is publicly available in the Zenodo repository (DOI: 10.5281/zenodo.17112101).

Acknowledgments

We thank the anonymous reviewers and editors for their helpful comments. During the preparation of this manuscript, the authors used DeepSeek-V4 for the purposes of language refinement, grammatical correction, and logical coherence. All AI-generated suggestions were critically reviewed, revised, and approved by the authors. No AI-generated content was used without human verification, and the final version of the manuscript reflects the intellectual contribution of all named authors. The authors have reviewed and edited the output and take full responsibility for the content of this publication.

Conflicts of Interest

The authors declare no conflicts of interest.

Abbreviations

The following abbreviations are used in this manuscript:
TNTotal nitrogen
TPTotal phosphorus
TKTotal potassium
ANAvailable nitrogen
APAvailable phosphorus
AKAvailable potassium
SOMSoil organic matter
CFIComparative fit i
GFIGoodness of fit
RMSEARoot square mean error of approximation
RDARedundancy analysis

Appendix A

Table A1. Quality control parameters for soil chemical analyses.
ParameterMethodLODLOQAccuracy (Relative Error)Recovery (%)
Total nitrogen (TN)NY/T 1121.24-20120.01 g/kg0.04 g/kg≤±10%85–115
Total phosphorus (TP)LY/T 1232-201510 mg/kg40mg/kg≤±10–±15%80–120
Total potassium (TK)LY/T 1234-201520 mg/kg80 mg/kg≤±10–±15%85–115
Available phosphorus (AP)NY/T 1121.7-20140.5 mg/kg2.0 mg/kg≤±15%80–120
Available potassium (AK)NY/T 889-20045 mg/kg20 mg/kg≤±15%80–120
Available nitrogen (AN)LY/T 1228-20155 mg/kg20 mg/kg≤±15%75–120
Soil organic matter (SOM)NY/T 1121.6-20060.3 g/kg1.0 g/kg≤±10%85–110
Table A2. Equipment and instruments used for soil chemical analyses.
ParameterInstrument/EquipmentModelManufacturerCountry of Origin
pHpH meterPHS-3CLeici (Shanghai INESA)Shanghai, China
TNContinuous flow analyzerAutoAnalyzer IIISEAL AnalyticalNorderstedt, Germany
TPUV–Vis spectrophotometerUV-1800ShimadzuKyoto, Japan
TKFlame photometerFP640Leici (Shanghai INESA)Shanghai, China
APUV–Vis spectrophotometerUV-1800ShimadzuKyoto, Japan
AKFlame photometerFP640Leici (Shanghai INESA)Shanghai, China
ANMicro-diffusion apparatus---
SOMTitration apparatus---
Table A3. Statistical analysis of the OTUs with 97% threshold.
Soil Bacteria Soil Fungi
Sample NamesQualified SeqsEffective TagsAligned Rate (%)OTUs NumberQualified SeqsEffective TagsOTUs NumberAligned Rate (%)
Y1.153,19639,96672.27189582,61266,07950279.87
Y1.251,43534,35773.6480,23963,00477.52
Y1.352,10138,58977.2283,17963,90375.6
Y3.167,90550,98874.7204378,69362,36856578.62
Y3.258,40045,50976.2851,88744,86185.56
Y3.365,44649,97172.3584,77369,89881.89
Y5.150,98139,56871.84192280,50662,92351377.83
Y5.253,64439,88177.1679,16361,11275.83
Y5.354,21840,21776.583,59264,89877.16
Y8.156,55544,09375.73189182,26165,64639679.42
Y8.262,10348,45972.3377,11861,35079.14
Y8.365,72050,23064.9190,90869,34275.8
Y10.155,16440,87873.26180383,59268,17054681.13
Y10.252,36034,83074.3780,67863,66277.94
Y10.355,90542,04065.2584,59465,05876.44
Table A4. Soil microbial α-diversity index of Paeonia ostii ‘Feng Dan’ rhizospheric soil samples.
GroupShannonSimpsonChao1
Bacteria
Y19.205 ± 0.31 a0.995 ± 0.00 a2347.75 ± 567.20 a
Y39.568 ± 0.16 b0.997 ± 0.00 a2340.69 ± 198.25 ab
Y59.360 ± 0.06 a0.996 ± 0.00 a2095.90 ± 40.13 c
Y89.335 ± 0.02 a0.996 ± 0.00 a2140.78 ± 133.79 b
Y109.165 ± 0.06 a0.995 ± 0.00 a1947.70 ± 87.49 d
FungiShannonSimpsonChao1
Y15.14 ± 0.26 a0.93 ± 0.004 a571.51 ± 45.23 a
Y35.30 ± 0.70 a0.88 ± 0.058 a638.69 ± 134.83 a
Y53.91 ± 1.20 a0.72 ± 0.191 a574.81 ± 54.41 a
Y83.37 ± 1.96 a0.65 ± 0.255 a448.33 ± 50.49 b
Y104.25 ± 1.68 a0.72 ± 0.216 a618.65 ± 164.11 a
The value is mean ± standard error (n = 3); different lowercase letters in the same line indicate significant difference between treatments (p < 0.05).
Table A5. Adonis analysis of bacterial and fungal based on Bray–Curtis.
Permutational MANOVANonparametric MANOVA
R2Pr (>F)R2Pr (>F)
Bacteria
Y1–Y30.370.10.630.1
Y1–Y50.41 0.10.590.1
Y1–Y80.380.10.620.1
Y1–Y100.460.10.540.1
Y3–Y50.310.10.690.1
Y3–Y80.270.0010.730.001
Y3–Y100.450.0010.550.001
Y5–Y80.230.30.770.3
Y5-100.430.0010.570.001
Y8–Y100.350.0010.650.001
Fungi
Y1–Y30.490.0010.510.001
Y1–Y50.740.10.260.1
Y1–Y80.460.0010.540.001
Y1–Y100.560.0010.440.001
Y3–Y50.580.10.420.1
Y3–Y80.300.20.690.2
Y3–Y100.520.0010.470.001
Y5–Y80.290.10.700.1
Y5-100.570.10.430.1
Y8–Y100.310.0010.680.001
Table A6. The relative abundance (%) of soil bacterial and fungal community at phylum levels under different treatments.
Dominant Bacteria Phylum1Y3Y5Y8Y10Y
Proteobacteria21.9 ± 3.0 a27.3 ± 1.0 ab26.3 ± 2.0 ab28.9 ± 1.0 b31.0 ± 1.0 b
Actinobacteriota9.7 ± 1.0 a13.9 ± 1.0 a12.9 ± 1.0 a12.1 ± 1.0 a10.6 ± 1.0 a
Acidobacteriota15.5 ± 1.0 a11.4 ± 1.0 b13.0 ± 1.0 ab11.8 ± 1.0 b11.7 ± 1.0 b
Chloroflexi3.4 ± 0.0 a3.4 ± 0.0 b3.3 ± 0.0 ab3.4 ± 0.0 ab3.4 ± 1.0 ab
Crenarchaeota5.9 ± 3.0 a0.7 ± 0.0 a1.2 ± 0.0 a1.5 ± 0.0 a3.1 ± 1.0 a
Bacteroidota2.6 ± 0.0 a2.1 ± 0.0 a2.2 ± 0.0 a2.5 ± 0.0 a2.6 ± 0.0 a
Myxococcota1.9 ± 0.0 a2.4 ± 0.0 a2.3 ± 0.0 a2.7 ± 0.0 a1.9 ± 0.0 a
Gemmatimonadota2.4 ± 0.0 a2.9 ± 0.0 a2.1 ± 0.0 a2.2 ± 0.0 a1.6 ± 0.0 a
Firmicutes2.4 ± 1.0 a2.1 ± 0.0 a3.4 ± 1.0 a1.7 ± 1.0 a0.9 ± 0.0 a
Verrucomicrobiota1.5 ± 0.0 a1.9 ± 0.0 a2.1 ± 0.0 a2.4 ± 0.0 a2.2 ± 0.0 a
Nitrospirota1.9 ± 0.0 a1.0 ± 0.0 a1.2 ± 0.0 a1.3 ± 0.0 a1.1 ± 0.0 a
Dominant Fungal Phylum1Y3Y5Y8Y10Y
Ascomycota68.6 ± 5.0 a76.3 ± 4.0 a88.6 ± 2.0 a59.4 ± 14 a73.8 ± 6 a
Basidiomycota8.0 ± 6.0 a4.6 ± 0.9 a2.9 ± 1.0 a24.9± 17.0 a6.0 ± 3.0 a
Mortierellomycota3.5 ± 0.0 a2.9 ± 1.0 a2.9 ± 0.0 a3.3 ± 1.0 a7.1 ± 3.0 a
Mucoromycota9.6 ± 1.0 a2.6 ± 2.0 b0.0 ± 0.0 b0.0 ± 0.0 b0.0 ± 0.0 b
The value is mean ± standard error (n = 3), and different lowercase letters in the same line indicate significant difference between treatments (p < 0.05).
Table A7. Full names of bacterial KEGG pathways and fungal functional guilds corresponding to the letter codes in Figure 8.
CodeFull Name
Bacterial KEGG pathways (level II)
A1Amino acid metabolism
A2Carbohydrate metabolism
A3Energy metabolism
A4Lipid metabolism
A5Nucleotide metabolism
A6Metabolism of cofactors and vitamins
B1Folding, sorting and degradation
B2Replication and repair
B3Translation
C1Membrane transport
C2Signal transduction
Fungal functional guilds (FUNGuild)
AUndefined saprotroph
BUnassigned
CDung_Saprotroph-Undefined_Saprotroph-Wood_Saprotroph
DPlant_Pathogen
EEndophyte-Plant_Pathogen-Wood_Saprotroph
FPlant pathogen–soil saprotroph–wood saprotroph
GPlant pathogen–wood saprotroph
HAnimal pathogen–soil saprotroph
IEndophyte–plant pathogen
JOrchid mycorrhizal–plant pathogen–wood saprotroph
Figure A1. Rarefaction curve of bacteria (a) and fungi (b) OTUs abundance.
Microorganisms 14 02248 g0a1
Figure A2. SEM showing the effects of soil properties on microbiome interactions. Numbers on arrows are standardized path coefficients (solid, positive; dashed, negative); model fit: chi-square = 0.051 (df = 2, p = 0.975), CFI = 1, RMSEA = 0.000, and GFI = 0.999. ** p < 0.01; *** p < 0.001.
Microorganisms 14 02248 g0a2

References

  1. Hao, Q.; Peng, L.-P.; Li, Z.; Men, S.-Q.; Tong, N.-N.; Shu, Q.-Y.; Liu, Z.-A. Paternal effects on fatty acid composition of tree peony seed oil. Euphytica 2019, 215, 131. [Google Scholar] [CrossRef] [Scilit]
  2. Wang, H.; Wei, S.; He, Y.; Wang, X.; Li, Y.; Wei, D.; Wang, Z.; Guo, L.; Shaaban, M.; Hou, X. Characterization of Agronomic and Seed Oil Features for Different Cultivars of Tree Peony. Plants 2023, 12, 3112. [Google Scholar] [CrossRef] [Scilit] [PubMed]
  3. Qin, Y.; Nie, L.; Huang, Y.; Wang, Q.; Liu, X.; Zhou, K. Detection of autotoxic substances in Paeonia ostii and their mechanism of action. Acta Ecol. Sin. 2009, 29, 1153–1161. [Google Scholar] [CrossRef]
  4. Li, J.; Zuo, Y.; Zhang, J. Rhizosphere Shifts: Reduced Fungal Diversity and Microbial Community Functionality Enhance Plant Adaptation in Continuous Cropping Systems. Microorganisms 2024, 12, 2420. [Google Scholar] [CrossRef] [Scilit] [PubMed]
  5. Wu, Z.; Hao, Z.; Sun, Y.; Guo, L.; Huang, L.; Zeng, Y.; Wang, Y.; Yang, L.; Chen, B. Comparison on the structure and function of the rhizosphere microbial community between healthy and root-rot Panax notoginseng. Appl. Soil. Ecol. 2016, 107, 99–107. [Google Scholar] [CrossRef] [Scilit]
  6. Gao, Z.; Han, M.; Hu, Y.; Li, Z.; Liu, C.; Wang, X.; Tian, Q.; Jiao, W.; Hu, J.; Liu, L. Effects of continuous cropping of sweet potato on the fungal community structure in rhizospheric soil. Front. Microbiol. 2019, 10, 2269. [Google Scholar] [CrossRef] [Scilit] [PubMed]
  7. Gao, Z.; Hu, Y.; Han, M.; Xu, J.; Wang, X.; Liu, L.; Tang, Z.; Jiao, W.; Jin, R.; Liu, M. Effects of continuous cropping of sweet potatoes on the bacterial community structure in rhizospheric soil. BMC Microbiol. 2021, 21, 102, Erratum in BMC Microbiol. 2021, 21, 121. https://doi.org/10.1186/s12866-021-02194-2. [Google Scholar] [CrossRef] [Scilit] [PubMed]
  8. Sun, C. Effects of Continuous Cropping on Quality Formation and Rhizosphere Soil Microorganisms of Astragalus Membranaceus and Studies on Rotation Patterns for Astragalus membranaceus. Ph.D. Thesis, Inner Mongolia University, Inner Mongolia, China, 2017. [Google Scholar]
  9. Gao, D.; Gao, X.; Wang, Y.; Huo, H.; Wu, Y.; Yang, Z.; Zhang, H.; Yang, X.; Li, F.; Li, X. Effects of long-term continuous cultivation on the structure and function of soil bacterial and fungal communities of Fritillaria Cirrhosa on the Qinghai-Tibetan Plateau. Sci. Rep. 2024, 14, 21291. [Google Scholar] [CrossRef] [Scilit] [PubMed]
  10. Chen, X.; Zhao, S.; Yao, J.J.; Ye, Y.P.; Song, A.P.; Chen, F.D.; Chen, S.M.; Dong, X.N. Effects of bio-organic fertilizer and fungicide application on continuous cropping obstacles of cut chrysanthemum. Chin. J. Appl. Ecol./Yingyong Shengtai Xuebao 2015, 26, 1231. [Google Scholar]
  11. Guo, L.L.; Yin, W.L.; Guo, D.L.; Hou, X.G. Variations of bacterial biodiversity in rhizosphere soils of oil tree peony cropping continuously for different years. Sci. Silvae Sin. 2017, 53, 131–141. [Google Scholar] [CrossRef]
  12. Tang, J.; Xue, Z.; Daroch, M.; Ma, J. Impact of continuous Salvia miltiorrhiza cropping on rhizosphere actinomycetes and fungi communities. Ann. Microbiol. 2015, 65, 1267–1275. [Google Scholar] [CrossRef] [Scilit]
  13. Qin, S.; Yeboah, S.; Xu, X.; Liu, Y.; Yu, B. Analysis on fungal diversity in rhizosphere soil of continuous cropping potato subjected to different furrow-ridge mulching managements. Front. Microbiol. 2017, 8, 845. [Google Scholar] [CrossRef] [Scilit] [PubMed]
  14. Li, H.; Wang, J.; Liu, Q.; Zhou, Z.; Chen, F.; Xiang, D. Effects of consecutive monoculture of sweet potato on soil bacterial community as determined by pyrosequencing. J. Basic. Microbiol. 2019, 59, 181–191. [Google Scholar] [CrossRef] [Scilit] [PubMed]
  15. Tan, Y.; Cui, Y.; Li, H.; Kuang, A.; Li, X.; Wei, Y.; Ji, X. Diversity and composition of rhizospheric soil and root endogenous bacteria in Panax notoginseng during continuous cropping practices. J. Basic. Microbiol. 2017, 57, 337–344. [Google Scholar] [CrossRef] [Scilit] [PubMed]
  16. Pan, H.; Zhu, M.; Ding, C.; Wu, J. Soil Physiochemical Property Variations and Microbial Community Response Patterns Under Continuous Cropping of Tree Peony. Agronomy 2025, 15, 2602. [Google Scholar] [CrossRef] [Scilit]
  17. Sparks, D.L.; Page, A.L.; Helmke, P.A.; Loeppert, R.H. Methods of Soil Analysis, Part 3: Chemical Methods; John Wiley & Sons: Hoboken, NJ, USA, 2020. [Google Scholar]
  18. Keeney, D.R.; Nelson, D.W. Nitrogen—Inorganic Forms. In Methods of Soil Analysis, Part 2: Chemical and Microbiological Properties; American Society of Agronomy: Madison, WI, USA, 1982; pp. 643–698. [Google Scholar] [CrossRef] [Scilit]
  19. Murphy, J.; Riley, J.P. A modified single solution method for the determination of phosphate in natural waters. Anal. Chim. Acta 1962, 27, 31–36. [Google Scholar] [CrossRef] [Scilit]
  20. LY/T 1228–2015; Nitrogen Determination Methods of Forest Soils. China Forestry Industry Standard: Beijing, China, 2015.
  21. Stein, S.; Li, L.; Mulvaney, R.; Simmons, F. Determination of nitrogen by microdiffusion in mason jars: III. Nitrogen and nitrogen-15 in Kjeldahl digests. Commun. Soil Sci. Plant Anal. 1993, 24, 2765–2776. [Google Scholar] [CrossRef] [Scilit]
  22. LY/T 1232–2015; Phosphorus Determination Methods of Forest Soils. China Forestry Industry Standard: Beijing, China, 2015.
  23. Olsen, S.; Sommers, E. Phosporus. In Methods of Soil Analysis, Part 2: Chemical and Microbiological Properties; Page, A.L., Ed.; American Society of Agronomy: Madison, WI, USA, 1982; pp. 404–430. [Google Scholar] [CrossRef] [Scilit]
  24. Nelson, D.W.; Sommers, L.E. Total Carbon, Organic Carbon, and Organic Matter. In Methods of Soil Analysis, Part 2: Chemical and Microbiological Properties; American Society of Agronomy: Madison, WI, USA, 1982; Volume 9, pp. 539–579. [Google Scholar] [CrossRef] [Scilit]
  25. Hu, Y.; Liu, Z.; Yan, J.; Qi, X.; Li, J.; Zhong, S.; Yu, J.; Liu, Q. A developed DNA extraction method for different soil samples. J. Basic. Microbiol. 2010, 50, 401–407. [Google Scholar] [CrossRef] [Scilit] [PubMed]
  26. Caporaso, J.G.; Lauber, C.L.; Walters, W.A.; Berg-Lyons, D.; Lozupone, C.A.; Turnbaugh, P.J.; Fierer, N.; Knight, R. Global patterns of 16S rRNA diversity at a depth of millions of sequences per sample. Proc. Natl. Acad. Sci. USA 2011, 108, 4516–4522. [Google Scholar] [CrossRef] [Scilit] [PubMed]
  27. Gardes, M.; Bruns, T.D. ITS primers with enhanced specificity for basidiomycetes-application to the identification of mycorrhizae and rusts. Mol. Ecol. 1993, 2, 113–118. [Google Scholar] [CrossRef] [Scilit] [PubMed]
  28. White, T.J.; Bruns, T.; Lee, S.; Taylor, J. Amplification and direct sequencing of fungal ribosomal RNA genes for phylogenetics. PCR Protoc. A Guide Methods Appl. 1990, 18, 315–322. [Google Scholar] [CrossRef] [Scilit]
  29. Caporaso, J.G.; Kuczynski, J.; Stombaugh, J.; Bittinger, K.; Bushman, F.D.; Costello, E.K.; Fierer, N.; Peña, A.G.; Goodrich, J.K.; Gordon, J.I. QIIME allows analysis of high-throughput community sequencing data. Nat. Methods 2010, 7, 335. [Google Scholar] [CrossRef] [Scilit] [PubMed]
  30. Schloss, P.D.; Westcott, S.L.; Ryabin, T.; Hall, J.R.; Hartmann, M.; Hollister, E.B.; Lesniewski, R.A.; Oakley, B.B.; Parks, D.H.; Robinson, C.J. Introducing mothur: Open-source, platform-independent, community-supported software for describing and comparing microbial communities. Appl. Environ. Microbiol. 2009, 75, 7537–7541. [Google Scholar] [CrossRef] [Scilit] [PubMed]
  31. Edgar, R.C. Search and clustering orders of magnitude faster than BLAST. Bioinformatics 2010, 26, 2460–2461. [Google Scholar] [CrossRef] [Scilit] [PubMed]
  32. Quast, C.; Pruesse, E.; Yilmaz, P.; Gerken, J.; Schweer, T.; Yarza, P.; Peplies, J.; Glöckner, F.O. The SILVA ribosomal RNA gene database project: Improved data processing and web-based tools. Nucleic Acids Res. 2012, 41, D590–D596. [Google Scholar] [CrossRef] [Scilit] [PubMed]
  33. Nilsson, R.H.; Larsson, K.-H.; Taylor, A.F.S.; Bengtsson-Palme, J.; Jeppesen, T.S.; Schigel, D.; Kennedy, P.; Picard, K.; Glöckner, F.O.; Tedersoo, L. The UNITE database for molecular identification of fungi: Handling dark taxa and parallel taxonomic classifications. Nucleic Acids Res. 2019, 47, D259–D264. [Google Scholar] [CrossRef] [Scilit] [PubMed]
  34. R Core Team. R: A Language and Environment for Statistical Computing; R Core Team: Vienna, Austria, 2024. [Google Scholar]
  35. Aitchison, J. The statistical analysis of compositional data. J. R. Stat. Soc. Ser. B (Methodol.) 1982, 44, 139–160. [Google Scholar] [CrossRef] [Scilit]
  36. Shapiro, S.S.; Wilk, M.B. An analysis of variance test for normality (complete samples). Biometrika 1965, 52, 591–611. [Google Scholar] [CrossRef] [Scilit]
  37. Gastwirth, J.L.; Gel, Y.R.; Miao, W. The Impact of Levene’s Test of Equality of Variances on Statistical Theory and Practice. Stat. Sci. 2009, 24, 343–360. [Google Scholar] [CrossRef] [Scilit]
  38. Tukey, J.W. Comparing individual means in the analysis of variance. Biometrics 1949, 5, 99–114. [Google Scholar] [CrossRef] [Scilit]
  39. Games, P.A.; Howell, J.F. Pairwise multiple comparison procedures with unequal n’s and/or variances: A Monte Carlo study. J. Educ. Stat. 1976, 1, 113–125. [Google Scholar] [CrossRef] [Scilit]
  40. Anderson, M.J. A new method for non-parametric multivariate analysis of variance. Austral Ecol. 2001, 26, 32–46. [Google Scholar] [CrossRef]
  41. Bray, J.R.; Curtis, J.T. An ordination of the upland forest communities of southern Wisconsin. Ecol. Monogr. 1957, 27, 326–349. [Google Scholar] [CrossRef] [Scilit] [PubMed]
  42. Anderson, M.J. Distance-based tests for homogeneity of multivariate dispersions. Biometrics 2006, 62, 245–253. [Google Scholar] [CrossRef] [Scilit] [PubMed]
  43. Oksanen, J.; Simpson, G.L.; Blanchet, F.G.; Kindt, R.; Legendre, P.; Minchin, P.R.; O’Hara, R.; Solymos, P.; Stevens, M.; Szoecs, E.; et al. vegan: Community Ecology Package, Version 2.7-1; R Foundation for Statistical Computing: Vienna, Austria, 2022.
  44. Fox, J. Regression diagnostics: An introduction; Sage Publications: Thousand Oaks, CA, USA, 2019. [Google Scholar]
  45. Gao, C.-H.; Yu, G.; Cai, P. ggVennDiagram: An Intuitive, Easy-to-Use, and Highly Customizable R Package to Generate Venn Diagram. Front. Genet. 2021, 12, 706907. [Google Scholar] [CrossRef] [Scilit] [PubMed]
  46. Segata, N.; Izard, J.; Waldron, L.; Gevers, D.; Miropolsky, L.; Garrett, W.S.; Huttenhower, C. Metagenomic biomarker discovery and explanation. Genome Biol. 2011, 12, R60. [Google Scholar] [CrossRef] [Scilit] [PubMed]
  47. Nguyen, N.H.; Song, Z.; Bates, S.T.; Branco, S.; Tedersoo, L.; Menke, J.; Schilling, J.S.; Kennedy, P.G. FUNGuild: An open annotation tool for parsing fungal community datasets by ecological guild. Fungal Ecol. 2016, 20, 241–248. [Google Scholar] [CrossRef] [Scilit]
  48. Douglas, G.M.; Maffei, V.J.; Zaneveld, J.R.; Yurgel, S.N.; Brown, J.R.; Taylor, C.M.; Huttenhower, C.; Langille, M.G. PICRUSt2 for prediction of metagenome functions. Nat. Biotechnol. 2020, 38, 685–688. [Google Scholar] [CrossRef] [Scilit] [PubMed]
  49. Kanehisa, M.; Goto, S. KEGG: Kyoto encyclopedia of genes and genomes. Nucleic Acids Res. 2000, 28, 27–30. [Google Scholar] [CrossRef] [Scilit]
  50. Kline, R.B. Principles and Practice of Structural Equation Modeling, 4th ed.; Guilford: New York, NY, USA, 2016; Volume 10. [Google Scholar]
  51. Hu, L.-T.; Bentler, P.M. Cutoff criteria for fit indexes in covariance structure analysis: Conventional criteria versus new alternatives. Struct. Equ. Model. Multidiscip. J. 1999, 6, 1–55. [Google Scholar] [CrossRef] [Scilit]
  52. Liu, S.; Wang, Z.; Niu, J.; Dang, K.; Zhang, S.; Wang, S.; Wang, Z. Changes in physicochemical properties, enzymatic activities, and the microbial community of soil significantly influence the continuous cropping of Panax quinquefolius L. (American ginseng). Plant Soil 2021, 463, 427–446. [Google Scholar] [CrossRef] [Scilit]
  53. Zheng, J.; Wang, L.; Zhao, J.; Niu, Y.; Xiao, H.; Wang, Z.; Yu, S.; Shi, Z. Forty-year-old orchards promote carbon storage by changing aggregate-associated enzyme activities and microbial communities. Catena 2022, 213, 106195. [Google Scholar] [CrossRef] [Scilit]
  54. Gu, G.; Zeeshan Ul Haq, M.; Sun, X.; Zhou, J.; Liu, Y.; Yu, J.; Yang, D.; Yang, H.; Wu, Y. Continuous cropping of Patchouli alters soil physiochemical properties and rhizosphere microecology revealed by metagenomic sequencing. Front. Microbiol. 2024, 15, 1482904. [Google Scholar] [CrossRef] [Scilit] [PubMed]
  55. Hou, E.; Wen, D.; Kuang, Y.; Cong, J.; Chen, C.; He, X.; Heenan, M.; Lu, H.; Zhang, Y. Soil pH predominantly controls the forms of organic phosphorus in topsoils under natural broadleaved forests along a 2500 km latitudinal gradient. Geoderma 2018, 315, 65–74. [Google Scholar] [CrossRef] [Scilit]
  56. Chen, D.; Cheng, J.-L.; Wang, T.-Y.; Song, L.-Y.; Fang, Q.-L.; Xu, Z.-Z.; Tan, W.-Q.; Zhao, B.; Li, Q.-Q. Spatial variation characteristics and influencing factors of soil available phosphorus in cultivated land in the Sichuan Basin. CABI Digit. Libr. 2024. [Google Scholar] [CrossRef]
  57. Li, T.; Zheng, J.; Li, Y.; Mou, Z.; Zhang, J.; Wu, W.; Wang, T.; Wang, F.; Wang, J.; Hui, D.; et al. Divergent chemical responses of soil carbon and phosphorus to nutrient addition mediated by functional carbon pools in tropical forests. Plant Soil 2026, 518, 1795–1810. [Google Scholar] [CrossRef] [Scilit]
  58. Wang, J.-T.; Zheng, Y.-M.; Hu, H.-W.; Zhang, L.-M.; Li, J.; He, J.-Z. Soil pH determines the alpha diversity but not beta diversity of soil fungal community along altitude in a typical Tibetan forest ecosystem. J. Soils Sediments 2015, 15, 1224–1232. [Google Scholar] [CrossRef] [Scilit]
  59. Barbi, F.; Martinović, T.; Odriozola, I.; Machac, A.; Moravcová, A.; Algora, C.; Ballian, D.; Barthold, S.; Brabcová, V.; Awokunle Hollá, S. Disentangling drivers behind fungal diversity gradients along altitude and latitude. New Phytol. 2025, 247, 295–308. [Google Scholar] [CrossRef] [Scilit] [PubMed]
  60. Ramette, A. Multivariate analyses in microbial ecology. FEMS Microbiol. Ecol. 2007, 62, 142–160. [Google Scholar] [CrossRef] [Scilit] [PubMed]
  61. Samaddar, S.; Chatterjee, P.; Truu, J.; Anandham, R.; Kim, S.; Sa, T. Long-term phosphorus limitation changes the bacterial community structure and functioning in paddy soils. Appl. Soil Ecol. 2019, 134, 111–115. [Google Scholar] [CrossRef] [Scilit]
  62. Yao, X.; Lin, M.; Yan, Y.; Jiang, S.; Zhan, Y.; Su, B.; Zhou, Z.; Wang, J. Genomic functional analysis and cellulase characterization for the enzyme-producing strain Bacillus subtilis Y4X3 isolated from saline–alkaline soil in Xinjiang, China. Microorganisms 2025, 13, 552. [Google Scholar] [CrossRef] [Scilit] [PubMed]
  63. Mani, G.; Senthilkumar, R.; Venkatesan, K.; Mary Leema, J.T.; Rangamaran, V.R.; Balachandran, K.R.S.; Gopal, D. Halophilic Phosphate-Solubilizing Microbes (Priestia megaterium and Bacillus velezensis) Isolated from Arabian Sea Seamount Sediments for Plant Growth Promotion. Curr. Microbiol. 2024, 81, 405. [Google Scholar] [CrossRef] [Scilit] [PubMed]
  64. Chen, W.; Li, Y.; Shi, G.; Fan, G.; Tong, F.; Liu, L.; Li, J.; Gao, Y. The role of symbiotic nitrogen-fixing bacteria, Rhizobium and Sinorhizobium, as “bridges” in the rhizosphere of legumes after fomesafen application. Appl. Soil Ecol. 2025, 209, 106013. [Google Scholar] [CrossRef] [Scilit]
  65. Bizjak, T.; Sellstedt, A.; Gratz, R.; Nordin, A. Presence and activity of nitrogen-fixing bacteria in Scots pine needles in a boreal forest: A nitrogen-addition experiment. Tree Physiol. 2023, 43, 1354–1364. [Google Scholar] [CrossRef] [Scilit] [PubMed]
  66. Chen, J.; Zhao, G.; Wei, Y.; Dong, Y.; Hou, L.; Jiao, R. Isolation and screening of multifunctional phosphate solubilizing bacteria and its growth-promoting effect on Chinese fir seedlings. Sci. Rep. 2021, 11, 9081. [Google Scholar] [CrossRef] [Scilit] [PubMed]
  67. Wang, X.S.; Du, B.H.; Yao, L.T.; Shan, L.; Xu, Z.; Ding, Y.Q. Effects of planting years on microbial community structure in rhizosphere soil of peony. Ournal Shandong Agric. Univ. (Nat. Sci. Ed.) 2012, 43, 508–516. [Google Scholar]
  68. Zhang, J.; Huang, J.; Wen, J.; Peng, Z.; Zhang, N.; Wang, Y.; Zhang, Y.; Su, S.; Zeng, X. Phosphorus fractions and their transformation in coupling with organic carbon cycling after seven-year manure application in subtropical soil. Soil Tillage Res. 2025, 251, 106535. [Google Scholar] [CrossRef] [Scilit]
  69. Gaston, K.J. Biodiversity and extinction: The importance of being common. Prog. Phys. Geogr. 2008, 32, 73–79. [Google Scholar] [CrossRef] [Scilit]
  70. Su, Y.; Hu, Y.; Zi, H.; Chen, Y.; Deng, X.; Hu, B.; Jiang, Y. Contrasting assembly mechanisms and drivers of soil rare and abundant bacterial communities in 22-year continuous and non-continuous cropping systems. Sci. Rep. 2022, 12, 3264. [Google Scholar] [CrossRef] [Scilit] [PubMed]
  71. Lifeng, Z.; Gao, J.; Zhang, W.; Sun, J.; Li, B.; Jiao, H.; Wang, N. Effects of Asarum sieboldii Miq. Monoculture and Its Subsequent Abandonment on Soil Properties, Bacterial Community Assembly, and Functional Potential in Forest Understories. Biol. Bull. 2026, 53, 87. [Google Scholar] [CrossRef] [Scilit]
  72. Fricker, M.D.; Heaton, L.L.; Jones, N.S.; Boddy, L. The mycelium as a network. Fungal Kingd. 2017, 335–367. [Google Scholar] [CrossRef] [Scilit] [PubMed]
  73. Lauber, C.L.; Hamady, M.; Knight, R.; Fierer, N. Pyrosequencing-based assessment of soil pH as a predictor of soil bacterial community structure at the continental scale. Appl. Environ. Microbiol. 2009, 75, 5111–5120. [Google Scholar] [CrossRef] [Scilit] [PubMed]
  74. Xiong, R.; He, X.; Gao, N.; Li, Q.; Qiu, Z.; Hou, Y.; Shen, W. Soil pH amendment alters the abundance, diversity, and composition of microbial communities in two contrasting agricultural soils. Microbiol. Spectr. 2024, 12, e04165-23. [Google Scholar] [CrossRef] [Scilit] [PubMed]
  75. Dai, Z.; Su, W.; Chen, H.; Barberán, A.; Zhao, H.; Yu, M.; Yu, L.; Brookes, P.C.; Schadt, C.W.; Chang, S.X. Long-term nitrogen fertilization decreases bacterial diversity and favors the growth of Actinobacteria and Proteobacteria in agro-ecosystems across the globe. Glob. Change Biol. 2018, 24, 3452–3461. [Google Scholar] [CrossRef] [Scilit] [PubMed]
  76. Zhou, J.; Ning, D. Stochastic community assembly: Does it matter in microbial ecology? Microbiol. Mol. Biol. Rev. 2017, 81. [Google Scholar] [CrossRef] [Scilit] [PubMed]
  77. Liu, Z.; Liu, J.; Yu, Z.; Yao, Q.; Li, Y.; Liang, A.; Zhang, W.; Mi, G.; Jin, J.; Liu, X. Long-term continuous cropping of soybean is comparable to crop rotation in mediating microbial abundance, diversity and community composition. Soil Tillage Res. 2020, 197, 104503. [Google Scholar] [CrossRef] [Scilit]
  78. Wang, C.-N.; Wu, R.-L.; Li, Y.-Y.; Qin, Y.-F.; Li, Y.-L.; Meng, F.-Q.; Wang, L.-G.; Xu, F.-L. Effects of pesticide residues on bacterial community diversity and structure in typical greenhouse soils with increasing cultivation years in Northern China. Sci. Total Environ. 2020, 710, 136321. [Google Scholar] [CrossRef] [Scilit] [PubMed]
  79. Fierer, N.; Bradford, M.A.; Jackson, R.B. Toward an ecological classification of soil bacteria. Ecology 2007, 88, 1354–1364. [Google Scholar] [CrossRef] [Scilit] [PubMed]
  80. de Vries, F.T.; Manning, P.; Tallowin, J.R.B.; Mortimer, S.R.; Pilgrim, E.S.; Harrison, K.A.; Hobbs, P.J.; Quirk, H.; Shipley, B.; Cornelissen, J.H.C.; et al. Abiotic drivers and plant traits explain landscape-scale patterns in soil microbial communities. Ecol. Lett. 2012, 15, 1230–1239. [Google Scholar] [CrossRef] [Scilit] [PubMed]
  81. de Vries, J.; Evers, J.B.; Kuyper, T.W.; van Ruijven, J.; Mommer, L. Mycorrhizal associations change root functionality: A 3D modelling study on competitive interactions between plants for light and nutrients. New Phytol. 2021, 231, 1171–1182. [Google Scholar] [CrossRef] [Scilit] [PubMed]
  82. De Vries, F.T.; Griffiths, R.I.; Bailey, M.; Craig, H.; Girlanda, M.; Gweon, H.S.; Hallin, S.; Kaisermann, A.; Keith, A.M.; Kretzschmar, M. Soil bacterial networks are less stable under drought than fungal networks. Nat. Commun. 2018, 9, 3033. [Google Scholar] [CrossRef] [Scilit] [PubMed]
  83. Xie, J.; Sun, X.; Wen, T.; Bai, Y.; Qian, T.; Hu, S.; Chen, L.; Wang, P.; Miao, Y.; Zhang, R. Metabolite interactions mediate beneficial alliances between Bacillus and Trichoderma for effective Fusarium wilt control. ISME J. 2026, 20, wraf283. [Google Scholar] [CrossRef] [Scilit] [PubMed]
  84. Du, S.; Trivedi, P.; Wei, Z.; Feng, J.; Hu, H.-W.; Bi, L.; Huang, Q.; Liu, Y.-R. The proportion of soil-borne fungal pathogens increases with elevated organic carbon in agricultural soils. Msystems 2022, 7, e01337-21. [Google Scholar] [CrossRef] [Scilit] [PubMed]
  85. Stone, B.W.; Li, J.; Koch, B.J.; Blazewicz, S.J.; Dijkstra, P.; Hayer, M.; Hofmockel, K.S.; Liu, X.-J.A.; Mau, R.L.; Morrissey, E.M. Nutrients cause consolidation of soil carbon flux to small proportion of bacterial community. Nat. Commun. 2021, 12, 3381, Erratum in Nat Commun. 2021, 12, 4052. https://doi.org/10.1038/s41467-021-24314-2. [Google Scholar] [CrossRef] [Scilit] [PubMed]
  86. Chen, X.F.; Guo, Y.S.; Wei, X.H.; Song, Q.Y. Phoma Fungi: Ecological Diversity, Specialized Metabolites, and Biological Activities. Chem. Biodivers. 2025, 22, e00856. [Google Scholar] [CrossRef] [Scilit] [PubMed]
  87. Tian, W.; Su, P.; Chen, Y.; Maharachchikumbura, S.S. Four new species of Torula (Torulaceae, Pleosporales) from Sichuan, China. J. Fungi 2023, 9, 150. [Google Scholar] [CrossRef] [Scilit] [PubMed]
  88. Tong, A.-Z.; Liu, W.; Liu, Q.; Xia, G.-Q.; Zhu, J.-Y. Diversity and composition of the Panax ginseng rhizosphere microbiome in various cultivation modesand ages. BMC Microbiol. 2021, 21, 18. [Google Scholar] [CrossRef] [Scilit] [PubMed]
  89. Dong, L.; Xu, J.; Feng, G.; Li, X.; Chen, S. Soil bacterial and fungal community dynamics in relation to Panax notoginseng death rate in a continuous cropping system. Sci. Rep. 2016, 6, 31802. [Google Scholar] [CrossRef] [Scilit] [PubMed]
  90. Wang, M.; Sun, H.; Xu, L.; Xu, Z. Bacterial diversity in tea plant (Camellia sinensis) rhizosphere soil from Qinling Mountains and its relationship with environmental elements. Plant Soil 2021, 460, 403–415. [Google Scholar] [CrossRef] [Scilit]
  91. Jing, T.; Li, K.; Wang, L.; Eissa, M.A.; Cai, B.; Yun, T.; He, Y.; Baroudy, A.A.E.; Ding, Z.; Wei, Y.; et al. Acidification and Nutrient Imbalances Drive Fusarium Wilt Severity in Banana (Musa spp.) Grown on Tropical Latosols. J. Fungi 2025, 11, 611. [Google Scholar] [CrossRef] [Scilit] [PubMed]
  92. Chen, F.Y.; Yu, G.; Wang, X.F.; Li, T.L.; Sun, Y.B. Response Characteristics of Soil Fungal Community Structure to Long-Term Continuous Cropping of Pepper. Environ. Sci. 2024, 45, 543–554. [Google Scholar] [CrossRef] [Scilit] [PubMed]
  93. Liu, X.; Yang, S.; Xie, P.; Niu, G.; Shen, Q.; Yuan, J. Phosphorus availability drives rhizosphere metabolite-microbial community interactions to modulate cucumber susceptibility to Fusarium wilt. Microbiome 2026, 14, 132. [Google Scholar] [CrossRef] [Scilit] [PubMed]
  94. Yang, X.; Huang, X.T.; Wang, C.; Wang, X.L.; Yin, X.L.; Lin, S.Y.; Wang, W.Q. Comparison of fungal community structure and diversity in typical paddy fields. China Environ. Sci. 2020, 40, 4549–4556. [Google Scholar] [CrossRef]
  95. Amtmann, A.; Troufflard, S.; Armengaud, P. The effect of potassium nutrition on pest and disease resistance in plants. Physiol. Plant. 2008, 133, 682–691. [Google Scholar] [CrossRef] [Scilit] [PubMed]
  96. Zhang, J.; Wang, M.; Chen, C.; Ye, C.; Zhong, S.; Deng, L.; Luo, L.; Liu, H.; Zhu, S.; Yang, M. Density-Driven Root Exudate Remodeling Promotes Pathogen Enrichment and Exacerbates Negative Plant–Soil Feedback in Panax notoginseng Monoculture Systems. Agriculture 2026, 16, 930. [Google Scholar] [CrossRef] [Scilit]
  97. Xing, Y.; Zhang, P.; Zhang, W.; Yu, C.; Luo, Z. Continuous cropping of potato changed the metabolic pathway of root exudates to drive rhizosphere microflora. Front. Microbiol. 2024, 14, 1318586. [Google Scholar] [CrossRef] [Scilit] [PubMed]
  98. Fan, Y.; Liu, J.; Liu, Z.; Hu, X.; Yu, Z.; Li, Y.; Chen, X.; Li, L.; Jin, J.; Wang, G. Chitin amendments eliminate the negative impacts of continuous cropping obstacles on soil properties and microbial assemblage. Front. Plant Sci. 2022, 13, 1067618. [Google Scholar] [CrossRef] [Scilit] [PubMed]
  99. Liu, Y.; Hu, Y.; Li, Y.; Tian, G.; Luo, L.; Zhao, S.; Ye, C.; Mei, X.; Deng, W.; Zhu, S. Mortierella alpina bioinoculant potentiates native microbiota for soil borne disease suppression in Panax notoginseng cultivation. Pestic. Biochem. Physiol. 2025, 106615. [Google Scholar] [CrossRef] [Scilit] [PubMed]
  100. Sun, R.; Zhang, W.; Liu, Y.; Yun, W.; Luo, B.; Chai, R.; Zhang, C.; Xiang, X.; Su, X. Changes in phosphorus mobilization and community assembly of bacterial and fungal communities in rice rhizosphere under phosphate deficiency. Front. Microbiol. 2022, 13, 953340. [Google Scholar] [CrossRef] [Scilit] [PubMed]
  101. Capo, L.; Zappino, A.; Reyneri, A.; Blandino, M. Role of the Fungicide Seed Dressing in Controlling Seed-Borne Fusarium spp. Infection and in Enhancing the Early Development and Grain Yield of Maize. Agronomy 2020, 10, 784. [Google Scholar] [CrossRef] [Scilit]
  102. Hanagasaki, T.; Ajitomi, A.; Kobashikawa, R.; Taniai, N. Applying Awamori Distillery waste for biological soil disinfestation on Shimajiri Mahji soil in Miyako Island, Okinawa, Japan: Identifying the indigenous Fusarium pathogen of green okra. Australas. Plant Pathol. 2026, 55, 58. [Google Scholar] [CrossRef] [Scilit]
  103. Yang, T.Y.; Zhang, L.; Wang, X.J.; Dong, X.N.; Jia, Q.Q. Effect of Phenolic Acid Accumulation and Microbial Community Response in Strawberry Continuous Cropping Soil. Acta Pedol. Sin. 2026, 63. [Google Scholar] [CrossRef]
  104. Lv, H.; Sang, R.; Huang, L.; Long, Y.; Xu, D.; Wang, M.; Zhang, Q.; Jia, L.; Ding, Q.; Yan, C.; et al. Continuous watermelon cropping impairs plant growth by modifying soil biochemistry and rhizosphere microbial communities. Front. Microbiol. 2025, 16, 1648481. [Google Scholar] [CrossRef] [Scilit] [PubMed]
  105. Zhu, F.; Xiao, J.; Zhang, Y.; Wei, L.; Liang, Z. Dazomet application suppressed watermelon wilt by the altered soil microbial community. Sci. Rep. 2020, 10, 21668. [Google Scholar] [CrossRef] [Scilit] [PubMed]
  106. Chen, H.; Ma, K.; Lu, C.; Fu, Q.; Qiu, Y.; Zhao, J.; Huang, Y.; Yang, Y.; Schadt, C.W.; Chen, H. Functional Redundancy in Soil Microbial Community Based on Metagenomics Across the Globe. Front. Microbiol. 2022, 13, 878978. [Google Scholar] [CrossRef] [Scilit] [PubMed]
Figure 1. Venn diagrams showing shared and unique OTUs of soil bacterial (a) and fungal (b) communities across the continuous cropping chronosequence of Paeonia ostii ‘Feng Dan’. Explanations: Same as for Table 1.
Microorganisms 14 02248 g001
Figure 2. Bacterial diversity (a–c) and fungal diversity (d–f) in the rhizosphere soil of Paeonia ostii ‘Feng Dan’ across the continuous cropping chronosequence. Statistical significance was determined using the Wilcoxon rank-sum test. * p < 0.05; ** p < 0.01. Explanations: Same as for Table 1.
Microorganisms 14 02248 g002
Figure 3. Principal coordinate analysis (PCoA) of soil bacterial (a) and fungal (b) communities in the rhizosphere of Paeonia ostii ‘Feng Dan’ across the continuous cropping chronosequence. Explanations: Same as for Table 1.
Microorganisms 14 02248 g003
Figure 4. Distribution characteristics of predominant bacterial (a) and fungal (b) taxa in the rhizosphere soils of Paeonia ostii ‘Feng Dan’ across the continuous cropping chronosequence. Explanations: Same as for Table 1.
Microorganisms 14 02248 g004
Figure 5. RDA of dominating bacteria (a) and fungal (b) taxa across the continuous cropping chronosequence. Explanations: Same as for Table 1.
Microorganisms 14 02248 g005
Figure 6. Pearson’s correlation coefficients between soil physicochemical properties and relative abundance of dominant bacterial (a) and fungal (b) genera across the continuous cropping chronosequence. * p < 0.05; ** p < 0.01.
Microorganisms 14 02248 g006
Figure 7. Effects of continuous cropping duration on the rhizosphere microbiome. Relative abundance of (a) KEGG secondary metabolic pathways (level II) in bacteria, and (b) fungal functional guilds (FUNGuild), across different cropping durations. See Table A7 for full names of pathways and guilds.
Microorganisms 14 02248 g007
Figure 8. RDA of the relationships between soil physicochemical properties and (a) bacterial functional genes and (b) the relative abundance of fungal guilds. Explanations: Same as for Table 1.
Microorganisms 14 02248 g008
Table 1. Soil physicochemical properties across the continuous cropping chronosequence.
Soil FactorY1Y3Y5Y8Y10One-Way ANOVA
pH8.38 ± 0.06 ab8.48 ± 0.04b8.31 ± 0.00 a8.30 ± 0.03 a8.25 ± 0.06 aF = 10.12, p = 0.002
TN (g kg−1)0.75 ± 0.02 b0.73 ± 0.02 b1.03 ± 0.08 a0.99 ± 0.08 a0.95 ± 0.01 aF = 21.69, p = 0.000
TP (g kg−1)1.02 ± 0.08 b0.95 ± 0.02 ab0.87 ± 0.04 a1.02 ± 0.06 b0.84 ± 0.00 aF = 9.03, p = 0.002
TK (g kg−1)20.06 ± 0.48 a20.39 ± 0.34 a21.50 ± 0.241 b20.87 ± 0.26 ab20.61 ± 0.17 aF = 8.95, p = 0.002
AN (mg kg−1)54.21 ± 3.62 b43.03 ± 4.35 a65.73 ± 1.48 c75.83 ± 4.14 d78.71 ± 4.29 dF = 48.05, p = 0.000
AP (mg kg−1)21.07 ± 1.40 b19.40 ± 1.25 b9.78 ± 0.09 a9.15 ± 0.91 a10.08 ± 0.58 aF = 108.29, p = 0.000
AK (g kg−1)0.08 ± 0.00 a0.12 ± 0.01 a0.15 ± 0.01 b0.16 ± 0.02 b0.13 ± 0.00 abF = 26.48, p = 0.000
SOM (g kg−1)11.12 ± 0.57 b10.34 ± 0.28 b15.12 ± 0.29 c15.28 ± 1.10 c19.87 ± 0.52 aF = 111.18, p = 0.000
Y1, Y3, Y5, Y8, and Y10 indicate continuous cropping for 1, 3, 5, 8, and 10 years, respectively. Data are presented as mean ± standard error n = 3. Different lowercase letters within the same row indicate significant differences among cropping durations (p < 0.05, one-way ANOVA followed by LSD post hoc test). Units are indicated in parentheses in the table header. Abbreviations are defined in the Section 2.
Table 2. Relative abundance (%) of dominant bacterial and fungal genera across the continuous cropping chronosequence.
Bacteria GenusY1Y3Y5Y8Y10
Sphingomonas2.5 ± 1.00 a4.0 ± 0.00 a3.5 ± 0.00 a4.6 ± 0.00 a4.2 ± 0.00 a
RB415.2 ± 1.00 a2.4 ± 0.00 ab3.2 ± 0.00 ab3.3 ± 1.00 ab2.8 ± 1.00 b
MND12.1 ± 0.00 a2.0 ± 0.00 a2.6 ± 0.00 a2.5 ± 0.00 a2.3 ± 0.00 a
Dongia1.7 ± 0.00 a1.8 ± 0.00 a2.0 ± 0.00 a1.9 ± 0.00 a3.2 ± 0.00 a
Steroidobacter1.7 ± 0.00 a1.4 ± 0.00 a1.3 ± 0.00 a1.2 ± 0.00 a1.5 ± 0.00 a
Candidatus_Nitrososphaera1.4 ± 1.00 a0.2 ± 0.00 a0.2 ± 0.00 a0.3 ± 0.00 a0.5 ± 1.00 a
Lysobacter0.5 ± 0.00 b0.3 ± 0.00 b0.3 ± 0.00 b0.5 ± 0.00 ab1.7 ± 0.00 a
Romboutsia0.2 ± 0.00 a0.0 ± 0.00 a0.9 ± 0.00 a0.0 ± 0.00 a0.2 ± 0.00 a
Pseudomonas0.0 ± 0.00 a0.7 ± 0.00 a0.9 ± 0.00 a0.5 ± 0.00 a0.6 ± 0.00 a
Fungal GenusY1Y3Y5Y8Y10
Fusarium12.5 ± 5.00 a6.9 ± 4.00 a2.2 ± 2.00 b1.6 ± 3.00 b3.0 ± 6.00 ab
Monographella13.1 ± 6.00 ab5.5 ± 0.90 b0.9 ± 1.00 a1.0 ± 4.00 ab43.0 ± 3.00 ab
Mortierella3.4 ± 0.00 a2.8 ± 1.00 a2.9 ± 0.00 a3.2 ± 1.00 a7.1 ± 3.00 a
Torula11.8 ± 1.00 a11.0 ± 1.00 a1.7 ± 1.00 b0.8 ± 1.00 b0.7 ± 1.00 b
Orbicula0.2 ± 0.00 a6.5 ± 4.00 ab48.9 ± 8.00 b9.0 ± 4.00 ab4.4 ± 3.00 ab
Phoma0.0 ± 0.00 a0.5 ± 0.00 b5.9 ± 5.00 c0.7 ± 0.00 b0.2 ± 0.00 b
Gymnoascus0.0 ± 0.00 a0.1 ± 0.00 a0.4 ± 0.00 a23.6 ± 10.00 a0.0 ± 0.00 a
Coprinus7.6 ± 6.00 a0.0 ± 0.00 a0.0 ± 0.00 a0.0 ± 0.00 a0.0 ± 0.00 a
Data are presented as mean ± standard error (n = 3). Different lowercase letters within the same row indicate significant differences among cropping durations (p < 0.05). Only genera with relative abundance >1% in at least one treatment are shown. Statistical methods are described in the Section 2.
Table 3. Pearson’s correlation coefficients between soil physicochemical properties and alpha diversity indices of bacterial and fungal communities.
GroupIndexpHTNTPTKANAPAKSOM
BacteriaChao 10.77 ***−0.60 *0.30−0.04−0.63 *0.21−0.01−0.56 *
Shannon0.58 *−0.250.090.15−0.54 *0.160.24−0.5
Simpson0.69 **−0.460.23−0.09−0.60 *0.110.04−0.47
FungiChao 10.18−0.20−0.30−0.08−0.310.32−0.17−0.10
Shannon0.41−0.54 **0.08−0.51 **−0.52 **0.33−0.56 **−0.28
Simpson0.32−0.56 **0.11−0.46−0.480.27−0.56 **−0.24
* Values are Pearson’s correlation coefficients (r). Significance levels: * p < 0.05, ** p < 0.01, *** p < 0.001. Abbreviations are defined in the Section 2.
Disclaimer/Publisher’s Note: The statements, opinions and data contained in all publications are solely those of the individual author(s) and contributor(s) and not of MDPI and/or the editor(s). MDPI and/or the editor(s) disclaim responsibility for any injury to people or property resulting from any ideas, methods, instructions or products referred to in the content.