Article

The Impacts of Essential Gcp/TsaD Protein on Cell Morphology, Virulence Expression, and Antibiotic Susceptibility in Staphylococcus aureus

1
School of Life Science, Jilin Normal University, Siping 136000, China
2
Department of Veterinary and Biomedical Sciences, College of Veterinary Medicine, University of Minnesota, Saint Paul, MN 55108, USA
*
Author to whom correspondence should be addressed.
These authors contributed equally to this work.
Microorganisms 2025, 13(9), 2111; https://doi.org/10.3390/microorganisms13092111
Submission received: 12 August 2025 / Revised: 2 September 2025 / Accepted: 8 September 2025 / Published: 10 September 2025
(This article belongs to the Section Medical Microbiology)

Abstract

Our previous studies identified the Gcp/TsaD protein as essential for Staphylococcus aureus survival and implicated it in tRNA modification. Here, we demonstrate its broader role in bacterial physiology. Through a morphological analysis, RNA sequencing, network-based bioinformatics, and antibiotic susceptibility testing, we show that Gcp/TsaD influences cell morphology, cell wall integrity, transcriptional regulation, virulence, and antibiotic response. Gcp/TsaD depletion caused reduced cell size and increased cell wall thickness, suggesting its roles in cell division and peptidoglycan biosynthesis. The kinetic transcriptomic analysis revealed widespread changes in gene expression, particularly in the translation and amino acid biosynthesis pathways, supporting its function in maintaining translational fidelity via tRNA modification. Its depletion also upregulated the genes involved in cell envelope biosynthesis, including capsule formation, enhancing resistance to antimicrobial peptides, while downregulating the key virulence genes, indicating a role in pathogenicity. Functionally, the Gcp/TsaD-deficient cells were more susceptible to fosfomycin, reinforcing its importance in cell wall integrity. Together, these findings highlight the multifaceted contribution of Gcp/TsaD to S. aureus physiology and underscore its potential as a therapeutic target, particularly against antibiotic-resistant strains.

1. Introduction

Staphylococcus aureus is a formidable pathogen capable of causing severe infections in both humans and animals. The increasing prevalence of multidrug-resistant strains, particularly methicillin-resistant S. aureus (MRSA), in clinical settings poses a significant public health concern [1,2]. Consequently, gaining a deeper understanding of MRSA’s physiology is critical for developing alternative strategies to combat antibiotic-resistant infections.
Among the potential targets for novel antibacterial agents is the staphylococcal Gcp protein. Gcp and its homologs are essential for the viability of several bacterial species, including S. aureus [3,4], Streptococcus pneumoniae [3], Escherichia coli [5], Bacillus subtilis [6,7], Francisella novicida [8], Pseudomonas aeruginosa [9], and Mycoplasma genitalium [10]. These homologs possess diverse functions. For example, the Gcp of Mannheimia haemolytica exhibits glycoprotease activity, specifically cleaving O-sialoglycosylated proteins [11]. As members of the ASKHA (acetate and sugar kinases, HSP70, and actin) superfamily, Gcp homologs, such as Pyrococcus abyssi Pa-Kae1, can bind iron and ATP and demonstrate DNA-binding and apurinic endonuclease activity [12]. In yeast, the Gcp homolog Kae1 is a core component of the KEOPS/EKC complex, which plays a role in transcription and chromatin regulation [13,14].
Our previous studies have demonstrated that Gcp, also known as TsaD, is indispensable for S. aureus viability under in vitro conditions and is involved in regulating bacterial autolysis [4] and the N6-threonyl carbamoyl adenosine (t6A) modification of tRNA [15]. Furthermore, our proteomic studies have revealed that Gcp modulates the biosynthesis of branched-chain amino acids (BCAAs), which are vital for bacterial growth and metabolism [15]. In B. subtilis, BCAA biosynthesis is orchestrated by the ilvBHC-leuABCD (ilv-leu) operon and related genes, such as ilvA, ilvD, ybgE, and ywaA [16,17,18]. S. aureus harbors a homologous gene cluster, ilvDBHC-leuABCD-ilvA, with ilvE serving a role analogous to ybgE and ywaA in B. subtilis [15]. Gcp depletion was shown to enhance the production of key enzymes in this pathway, as revealed by a proteomic analysis, and to suppress ilv-leu operon transcription, based on qPCR, promoter–lux fusions, and gel-shift assays [15]. Notably, Gcp depletion also upregulated CcpA, a known activator of ilv-leu expression, without affecting the CodY levels [15].
BCAA metabolism plays a critical role in bacterial physiology, as these hydrophobic amino acids are essential for membrane protein structure and function [19,20]. Their intermediates, branched-chain α-keto acids, contribute to membrane biosynthesis via branched-chain fatty acids [21,22], and serve as precursors for cofactors such as pantothenate and coenzyme A [23,24]. To elucidate whether Gcp’s essentiality is due to its repression of the ILV biosynthesis pathway, we deleted the ilv-leu operon. Surprisingly, this did not alter Gcp’s essential role, suggesting that its function extends beyond ILV regulation [15]. In E. coli, Gcp homologs (TsaD) participate in the synthesis of t6A, a conserved tRNA modification essential for translation fidelity [25,26]. Our research revealed that Gcp is similarly required for t6A biosynthesis in S. aureus [15], and its interaction with YeaZ (TsaB) is crucial for bacterial viability [27,28]. Taken together, these findings indicate that Gcp/TsaD is multifunctional in bacteria.
In this study, we further investigated the role of Gcp/TsaD in S. aureus by assessing its effects on cell morphology using scanning and transmission electron microscopy. We also performed kinetic transcriptomic analyses via RNA sequencing to examine its global transcriptional impact. Together, these approaches provided a comprehensive view of the multifaceted role of Gcp/TsaD in staphylococcal physiology and highlight potential avenues for therapeutic intervention.

2. Materials and Methods

2.1. Bacterial Strains, Plasmids, Antibiotics, and Growth Conditions

S. aureus WCUH29, a methicillin-resistant clinical isolate (MRSA), was used in this study [15]. The control strain JW29011 (WCUH29 attB::pLH1) and the gcp/tsaD conditional expression mutant JW290111 (WCUH29 Δgcp attB::Pspac-gcp, carrying plasmid pYH4-lacI) were cultured in Tryptic Soy Broth (TSB) at 37 °C with shaking at 225 rpm [15]. The antibiotics were purchased from Sigma-Aldrich (St. Louis, MO, USA). Where applicable, the cultures were supplemented with 5 µg/mL erythromycin, 2.5 µg/mL tetracycline, and 100 µM isopropyl β-D-1-thiogalactopyranoside (IPTG, Sigma-Aldrich) to induce gcp/tsaD expression.

2.2. Scanning Electron Microscopy (SEM)

Overnight cultures of JW290111 were diluted 1:100 in fresh TSB with or without 100 µM IPTG and grown to the mid-log phase (OD600 = ~0.5). The cells were fixed in 2.5% glutaraldehyde in 0.1 M sodium cacodylate buffer (Electron Microscopy Sciences, EMS, Hatfield, PA, USA) overnight at 4 °C, washed, and post-fixed in 1% osmium tetroxide (EMS) in the same buffer. After washing, the samples were dehydrated through a graded ethanol series (25 to 100%), treated with hexamethyldisilazane (HMDS; EMS), air-dried on coverslips, and mounted on SEM stubs. The samples were sputter-coated with platinum (Ted Pella Inc., Redding, CA, USA) and visualized using a Hitachi S3500N scanning electron microscope (Hitachi, Tokyo, Japan). The images were acquired using Quartz PCI software Version 8 (Quartz Imaging Corp., Vancouver, BC, Canada), and the cell surface areas were quantified using iTEM software the 2013 version (Olympus SIS, Münster, Germany).

2.3. Transmission Electron Microscopy (TEM)

The bacterial cultures were processed as described for the SEM until the dehydration step, which was performed using an acetone gradient (25 to 100%). The samples were infiltrated with 2:1 acetone–Embed 812 resin (EMS) for 1 h, subsequently transferred to a 1:2 acetone–Embed 812 resin mixture for 1 h, and infiltrated with 100% resin. The resin-embedded samples were polymerized overnight at 58 °C in gelatin capsules. Ultrathin sections (60–70 nm) were prepared using a Leica UC6 ultramicrotome (Deerfield, IL, USA) and mounted on 200-mesh copper grids (EMS). The sections were stained with 5% uranyl acetate and Sato lead citrate, then examined with a JEOL 1200 EX II transmission electron microscope (Peabody, MA, USA) ggplot2. The images were captured using a Veleta 2K × 2K camera (Lakewood, CO, USA) and iTEM software, and measurements of cell area, perimeter, and peptidoglycan thickness were performed using the same software.

2.4. RNA Isolation and Purification

Overnight cultures were diluted 1:100 in fresh TSB, with or without 100 µM IPTG, and harvested at OD600 ≈ 0.2 (early), 0.5 (mid-log), and 1.0 (early stationary phase). The total RNA was isolated using either an SV Total RNA Isolation System (Promega, Madison, WI, USA) or a RiboPure™-Bacteria Kit (Thermo Fisher Scientific, Waltham, MA, USA). The genomic DNA was removed with two rounds of TURBO DNase treatment (Ambion, Austin, TX, USA), and the RNA concentration was measured at 260 nm.

2.5. RNA Sequencing (RNA-Seq) and Data Analysis

2.5.1. RNA Sequencing

The total RNA from three growth phases was purified from three biological replicates. The ribosomal RNA was depleted using a Ribo-off rRNA Depletion Kit (Bacteria), followed by cDNA synthesis and library preparation with a VAHTS™ Stranded mRNA-seq Library Prep Kit for Illumina® (San Diego, CA, USA). The sequencing was performed on the Illumina platform [29].

2.5.2. Differential Gene Expression Analysis

Differential expression was analyzed using DESeq [30], with significance thresholds set at q-value ≤ 0.05 and |log2 fold change| ≥ 1.

2.5.3. Functional Enrichment Analysis

The differentially expressed genes were subjected to a KEGG and Gene Ontology (GO) Biological Process (BP) enrichment analysis using the R language cluster Profiler. Fisher’s exact test was used to evaluate the statistical significance, and visualization was performed using ggplot2.

2.5.4. Protein–Protein Interaction (PPI) Network Analysis

The PPI networks were constructed using the STRING 11.5 database, referencing S. aureus NCTC 8325. A confidence score threshold of ≥0.4 was applied. The network diagrams were generated using Cytoscape v3.6.1.

2.6. Semi-Quantitative Real-Time RT-PCR (qPCR)

To validate RNA-seq results, selected genes were analyzed by qPCR [29]. Cultures were grown to mid-log phase (OD600 = ~0.5), and RNA was isolated as described. cDNA synthesis was carried out with SuperScript III (Invitrogen, Waltham, MA, USA) and random primers. Reactions were run in duplicate using VeriQuest SYBR Green Master Mix (Affymetrix, Santa Clara, CA, USA) on Stratagene Mx3000P system (Stratagene, La Jolla, CA, USA). Primers (Table 1) were designed to yield 100–200 bp amplicons. Relative expression was calculated using ΔΔCt method, with 16S rRNA as internal control.

2.7. Minimum Inhibitory Concentration (MIC) Assays

S. aureus strains were grown overnight in TSB, diluted to ~105 CFU/mL in Mueller–Hinton broth (MHB), and exposed to serial dilutions of test compounds in 96-well microtiter plates as described in [31]. MICs were defined as lowest concentration that inhibited visible growth after 18 h incubation at 37 °C.

3. Results

3.1. Impact of Gcp/TsaD Deletion on Bacterial Cell Morphologies

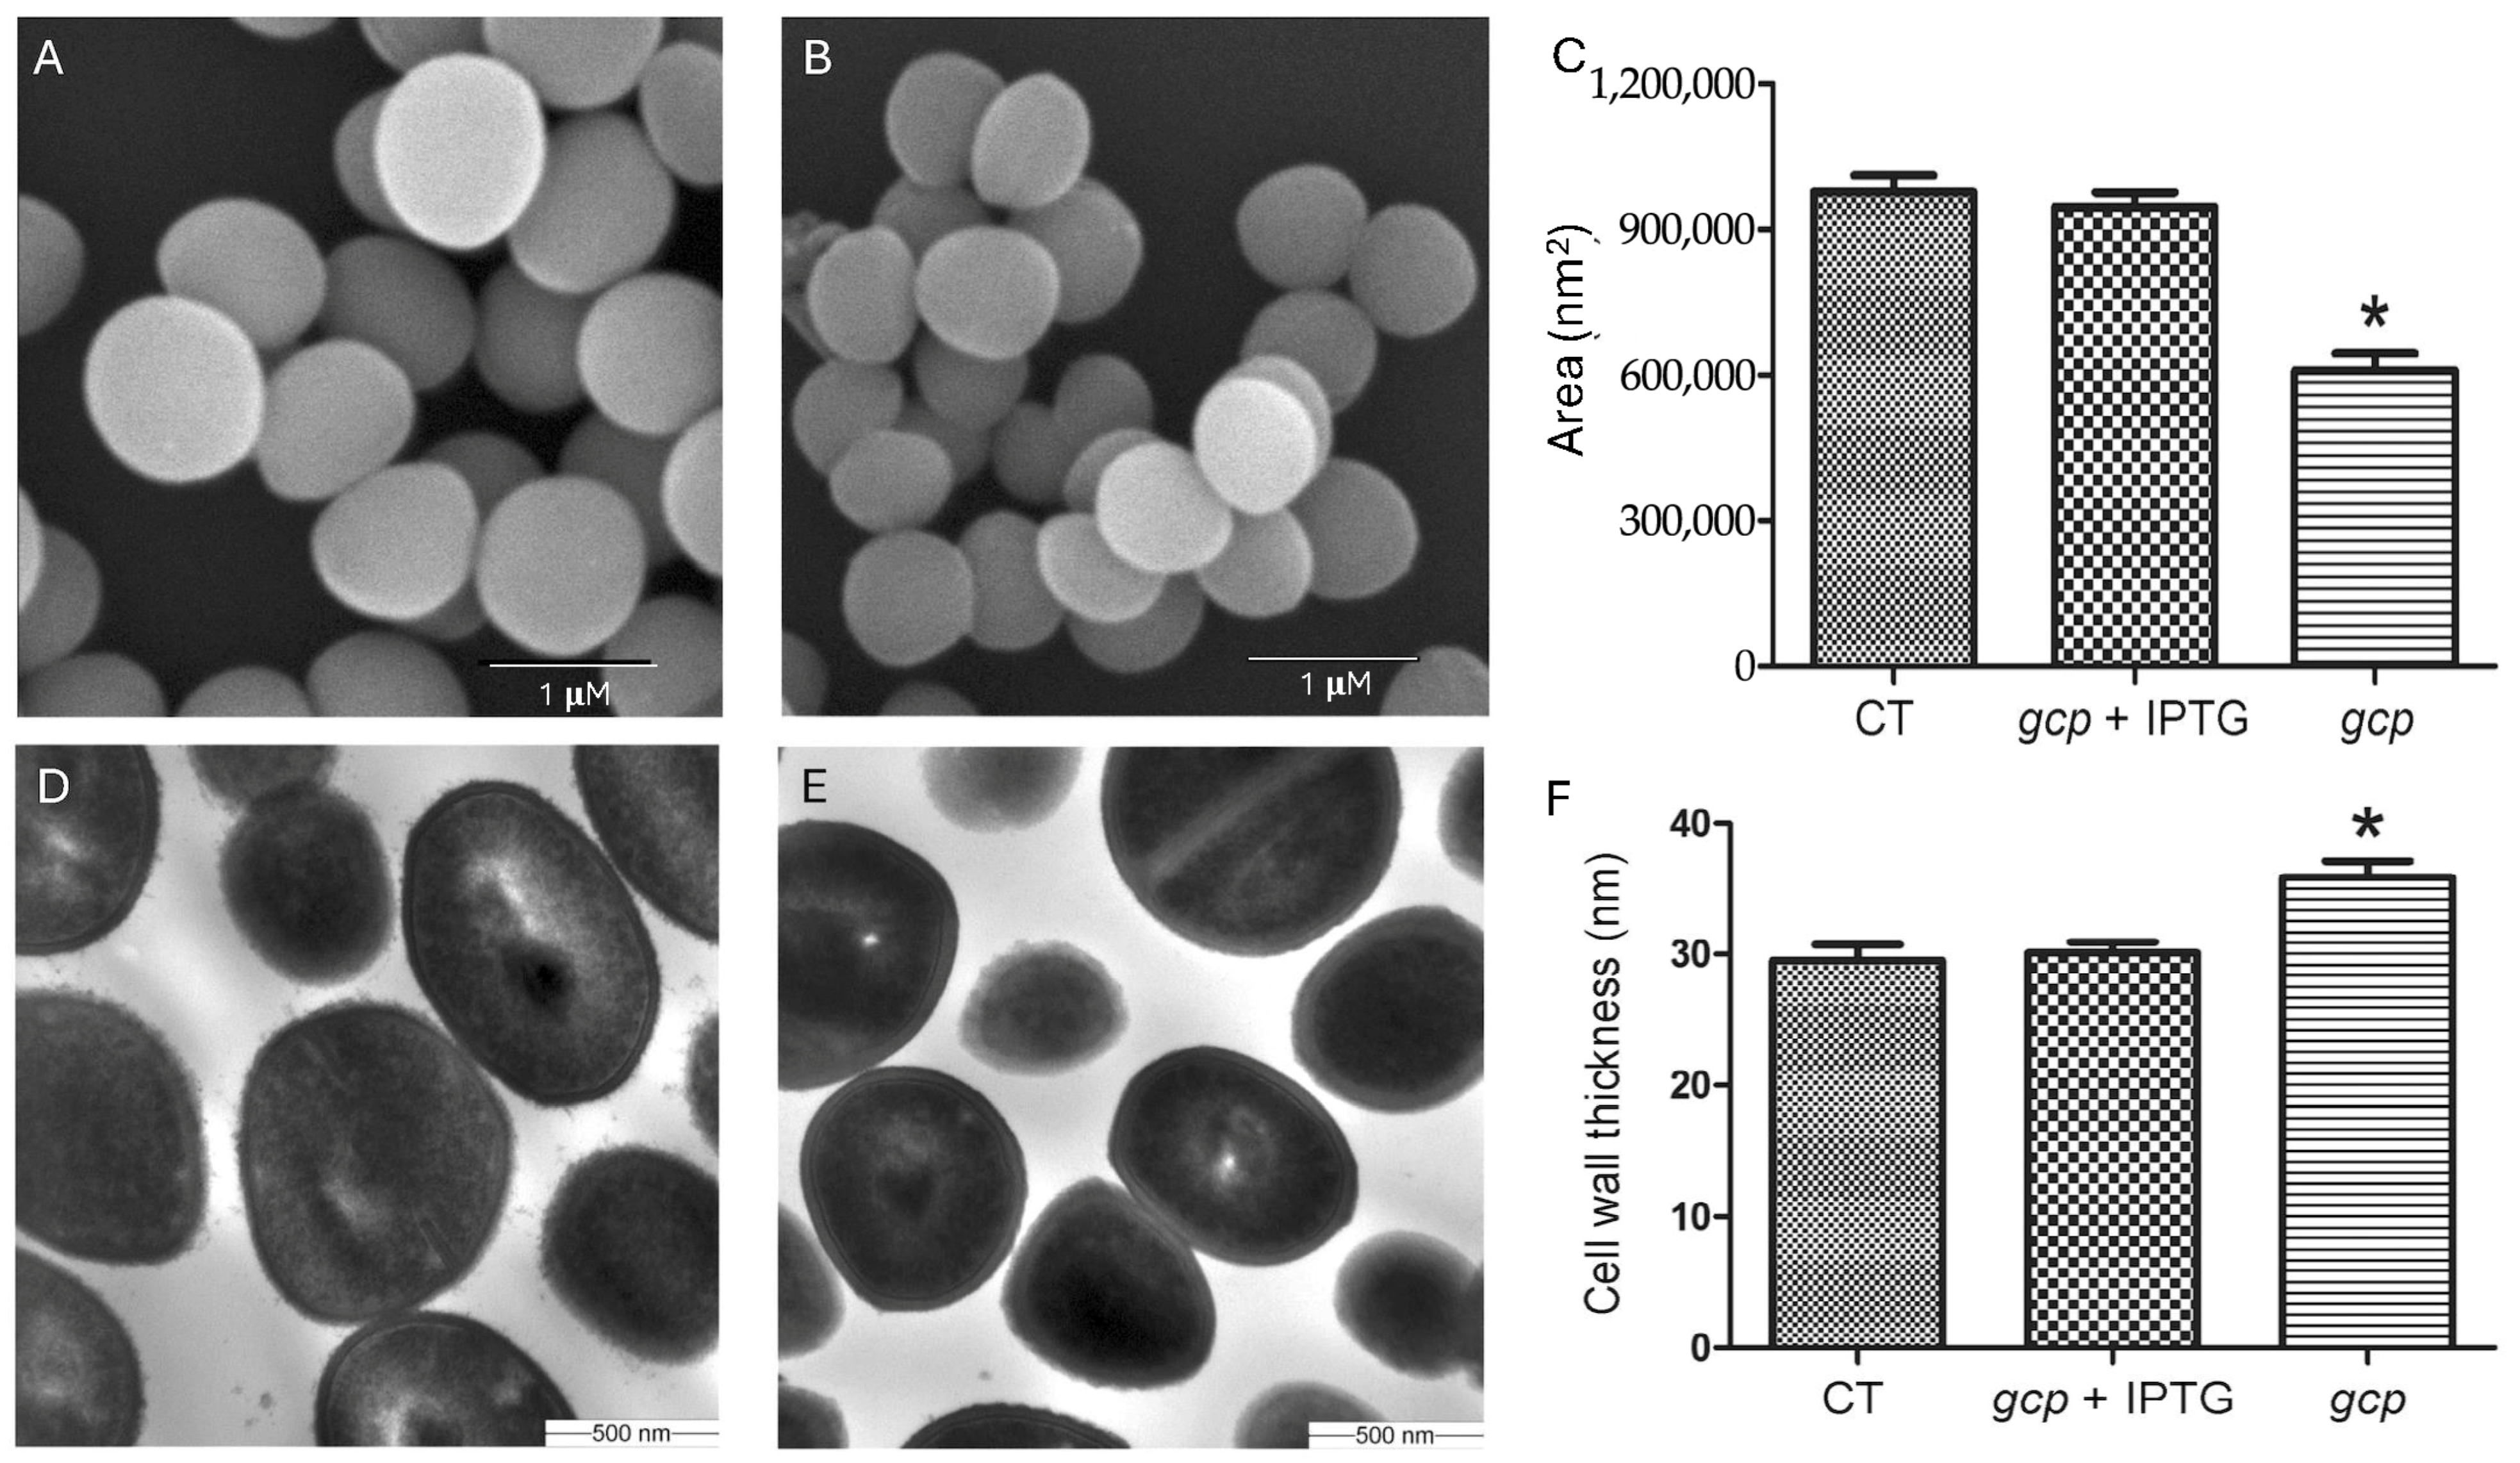
Our previous studies demonstrated that Gcp/TsaD is essential for Staphylococcus aureus growth [4,15]. To further investigate its role, we utilized the previously constructed conditional gcp/tsaD mutant JW290111, in which the gcp/tsaD was placed under the control of IPTG-inducible Pspac promoter. To tightly restrict the leaky activity of Pspac promoter [32], a plasmid-encoded lac I repressor gene was provided to lower the basal transcription of gcp/tsaD. We examined the morphological changes in S. aureus following Gcp/TsaD depletion using scanning electron microscopy (SEM) and transmission electron microscopy (TEM). Compared to the cells with induced Gcp/TsaD expression (100 μM IPTG) (Figure 1A), the conditional mutant JW290111 exhibited a significant reduction in cell size (Figure 1B). A quantitative analysis of 20 randomly selected cells using iTEM software showed a 33.3% decrease in the average cell area, from 9.47 × 10⁵ nm2 in the wild type to 6.10 × 10⁵ nm2 in the mutant (Figure 1C). The TEM analysis revealed additional morphological changes: the Gcp/TsaD-depleted cells displayed a smoother surface and increased cell wall thickness compared to the induced cells, which maintained a rough and textured surface (Figure 1D–F), like their parental control strain [30]. Taken together, these results indicate that Gcp/TsaD plays a critical role in modulating cell morphology and cell wall biosynthesis.

3.2. Identification of Differentially Expressed Genes During Gcp/TsaD Downregulation

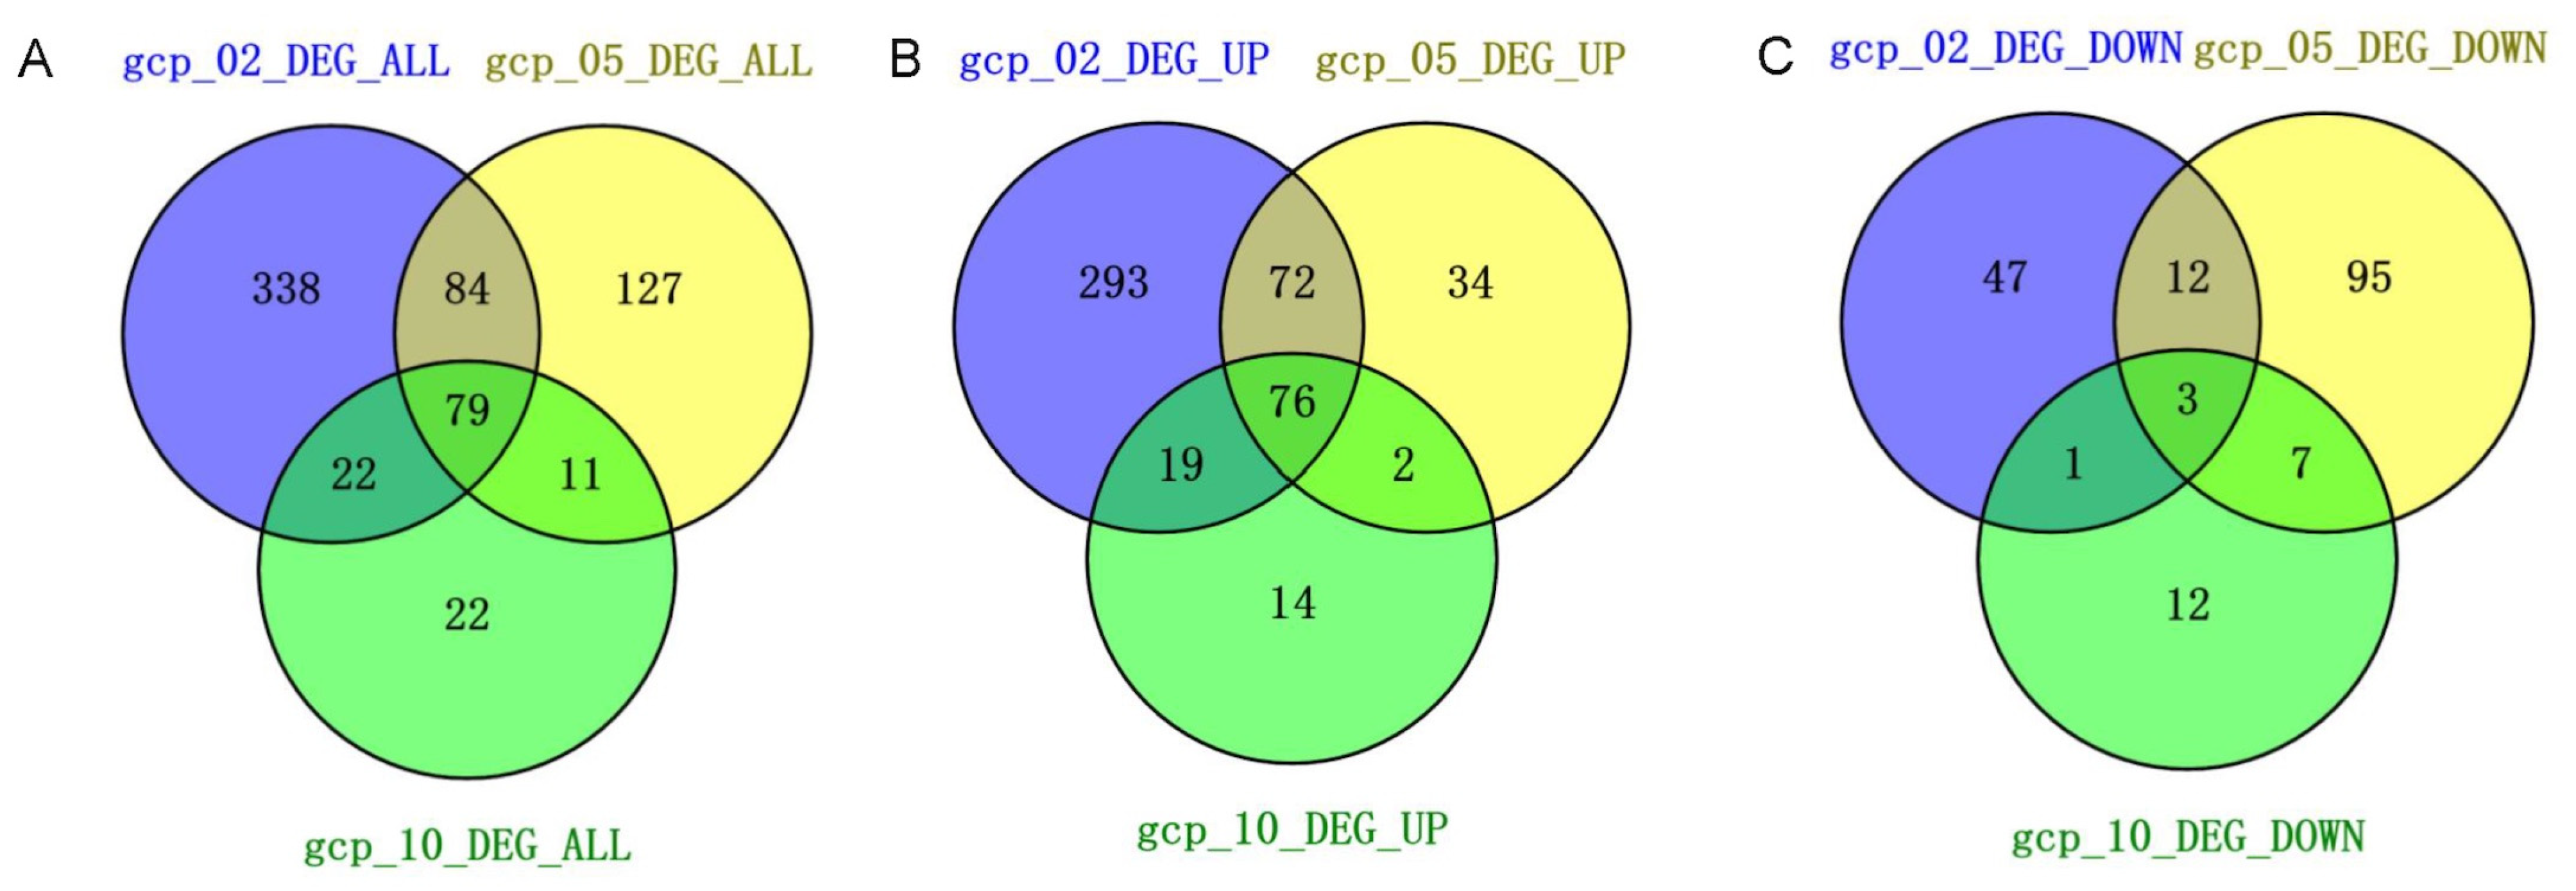
To elucidate the mechanisms underlying the role of Gcp/TsaD in growth and morphology, we performed RNA-seq analyses across the different growth phases (early log, mid-log, and early stationary) in the presence of 100 μM IPTG or absence of IPTG. The gene expression changes were assessed using DESeq, with thresholds of q-value ≤ 0.05 and log2 fold change ≥ 1. The IPTG addition in the control groups had a negligible impact on gene expression [30]. In contrast, the Gcp/TsaD depletion resulted in substantial transcriptomic changes, with 523, 301, and 134 differentially expressed genes (DEGs) identified at the early log, mid-log, and early stationary phases, respectively (Table 2 and Tables S1–S3; Figure 2A). Specifically, 460, 184, and 111 genes were upregulated, while 63, 117, and 23 genes were downregulated during depletion of Gcp/TsaD across the respective growth phases (Table 2 and Tables S1–S3; Figure 2B,C). Using VENN2.1, we identified 76 upregulated and 3 downregulated genes that were consistently differentially expressed across all three growth phases during Gcp/TsaD depletion (Figure 2B,C; Table S4). No overlapping DEGs were detected across the growth phases in the control group [30], indicating that Gcp/TsaD orchestrates a distinct and broad transcriptional program in S. aureus.

3.3. Gcp/TsaD Downregulation Alters the Transcription of tRNA Genes

Gcp/TsaD is essential for tRNA modification, particularly in the biosynthesis of threonylcarbamoyl adenosine (t6A) in tRNA [25,27,33,34]. Our previous studies established the critical role of Gcp/TsaD in t6A modification in S. aureus [15]. Consistent with these findings, our RNA-seq analysis revealed the significant impact of Gcp/TsaD depletion on the transcription of transfer RNAs (tRNAs) during the early log phase of bacterial growth. Specifically, a 2.5-fold reduction in Gcp/TsaD levels resulted in a marked decrease in the transcription of twelve tRNAs essential for protein synthesis, including tRNA-Pro, tRNA-Ile, tRNA-His, tRNA-Gly, tRNA-Lys, tRNA-Leu, tRNA-Gln, tRNA-Glu, tRNA-Arg, tRNA-Asp, tRNA-Trp, and tRNA-Tyr (Table S1). Interestingly, the transcription of tRNA-Ile and tRNA-Ala was induced during the mid-log phase under depletion conditions (Table S2), while no differentially expressed tRNA genes were identified in the early stationary phase (Table S3).

3.4. Gcp/TsaD Downregulation Induces Genes Involved in Cell Wall and Capsulae Biosynthesis

The RNA-seq analysis revealed that Gcp/TsaD depletion upregulated several genes associated with cell wall biosynthesis during the early log phase, including dltA, dltB, and dltD (Table S1), which are key genes in teichoic and lipoteichoic acid production [35]. Additionally, the transcripts for the ssb (single-strand DNA-binding protein) and genes in the capABCDEFGLMN operon, involved in capsule synthesis [36], were significantly increased from the early log through the early stationary phases (Tables S1–S3). The transcription of the ilv-leu operon (ilvABCD-leuBCD), essential for branched-chain amino acid biosynthesis [15], was also elevated. The qPCR confirmed the increased expressions of capA, capG, and capP in the Gcp/TsaD-depleted cells (Table 3), validating the RNA-seq findings.

3.5. Gcp/TsaD Depletion Reduces Virulence Gene Expression

The RNA-seq analysis unveiled the substantial downregulation of multiple virulence genes in the Gcp/TsaD-depleted cells. In the early log phase, transcripts of spa (protein A), coa (staphylocoagulase), clfB (MSCRAMM family adhesin clumping factor, ClfB), sbi (immunoglobulin-binding protein), ecb (complement convertase inhibitor), sph (sphingomyelin phosphodiesterase), hlgA (bi-component gamma-hemolysin HlgAB subunit), and serine proteases genes (splB, splC, splD, and splF, respectively), were significantly reduced (Table S1). The mid-log phase depletion further suppressed expression of spa, sasD (cell-wall-anchored protein), coa, vwb (von Willebrand factor-binding protein), scpA (cysteine protease staphopain A), efb (complement convertase inhibitor), scb (complement inhibitor SCIN-B), ecb, sbi (immunoglobulin-binding protein, Sbi), CHIPS (chemotaxis-inhibiting proteins), lukH (leukotoxin H), hly (alpha-hemolysin), SSL11 (superantigen-like protein), and the two-component sensor saeS, a crucial virulence regulator [37] (Table S2). In the early stationary phase, virulence genes, including lukG, lukH, sbi, hlgG, hlgC, and hyl, were also downregulated (Table S3).

3.6. Gcp/TsaD Influences Multiple Metabolic and Regulatory Pathways

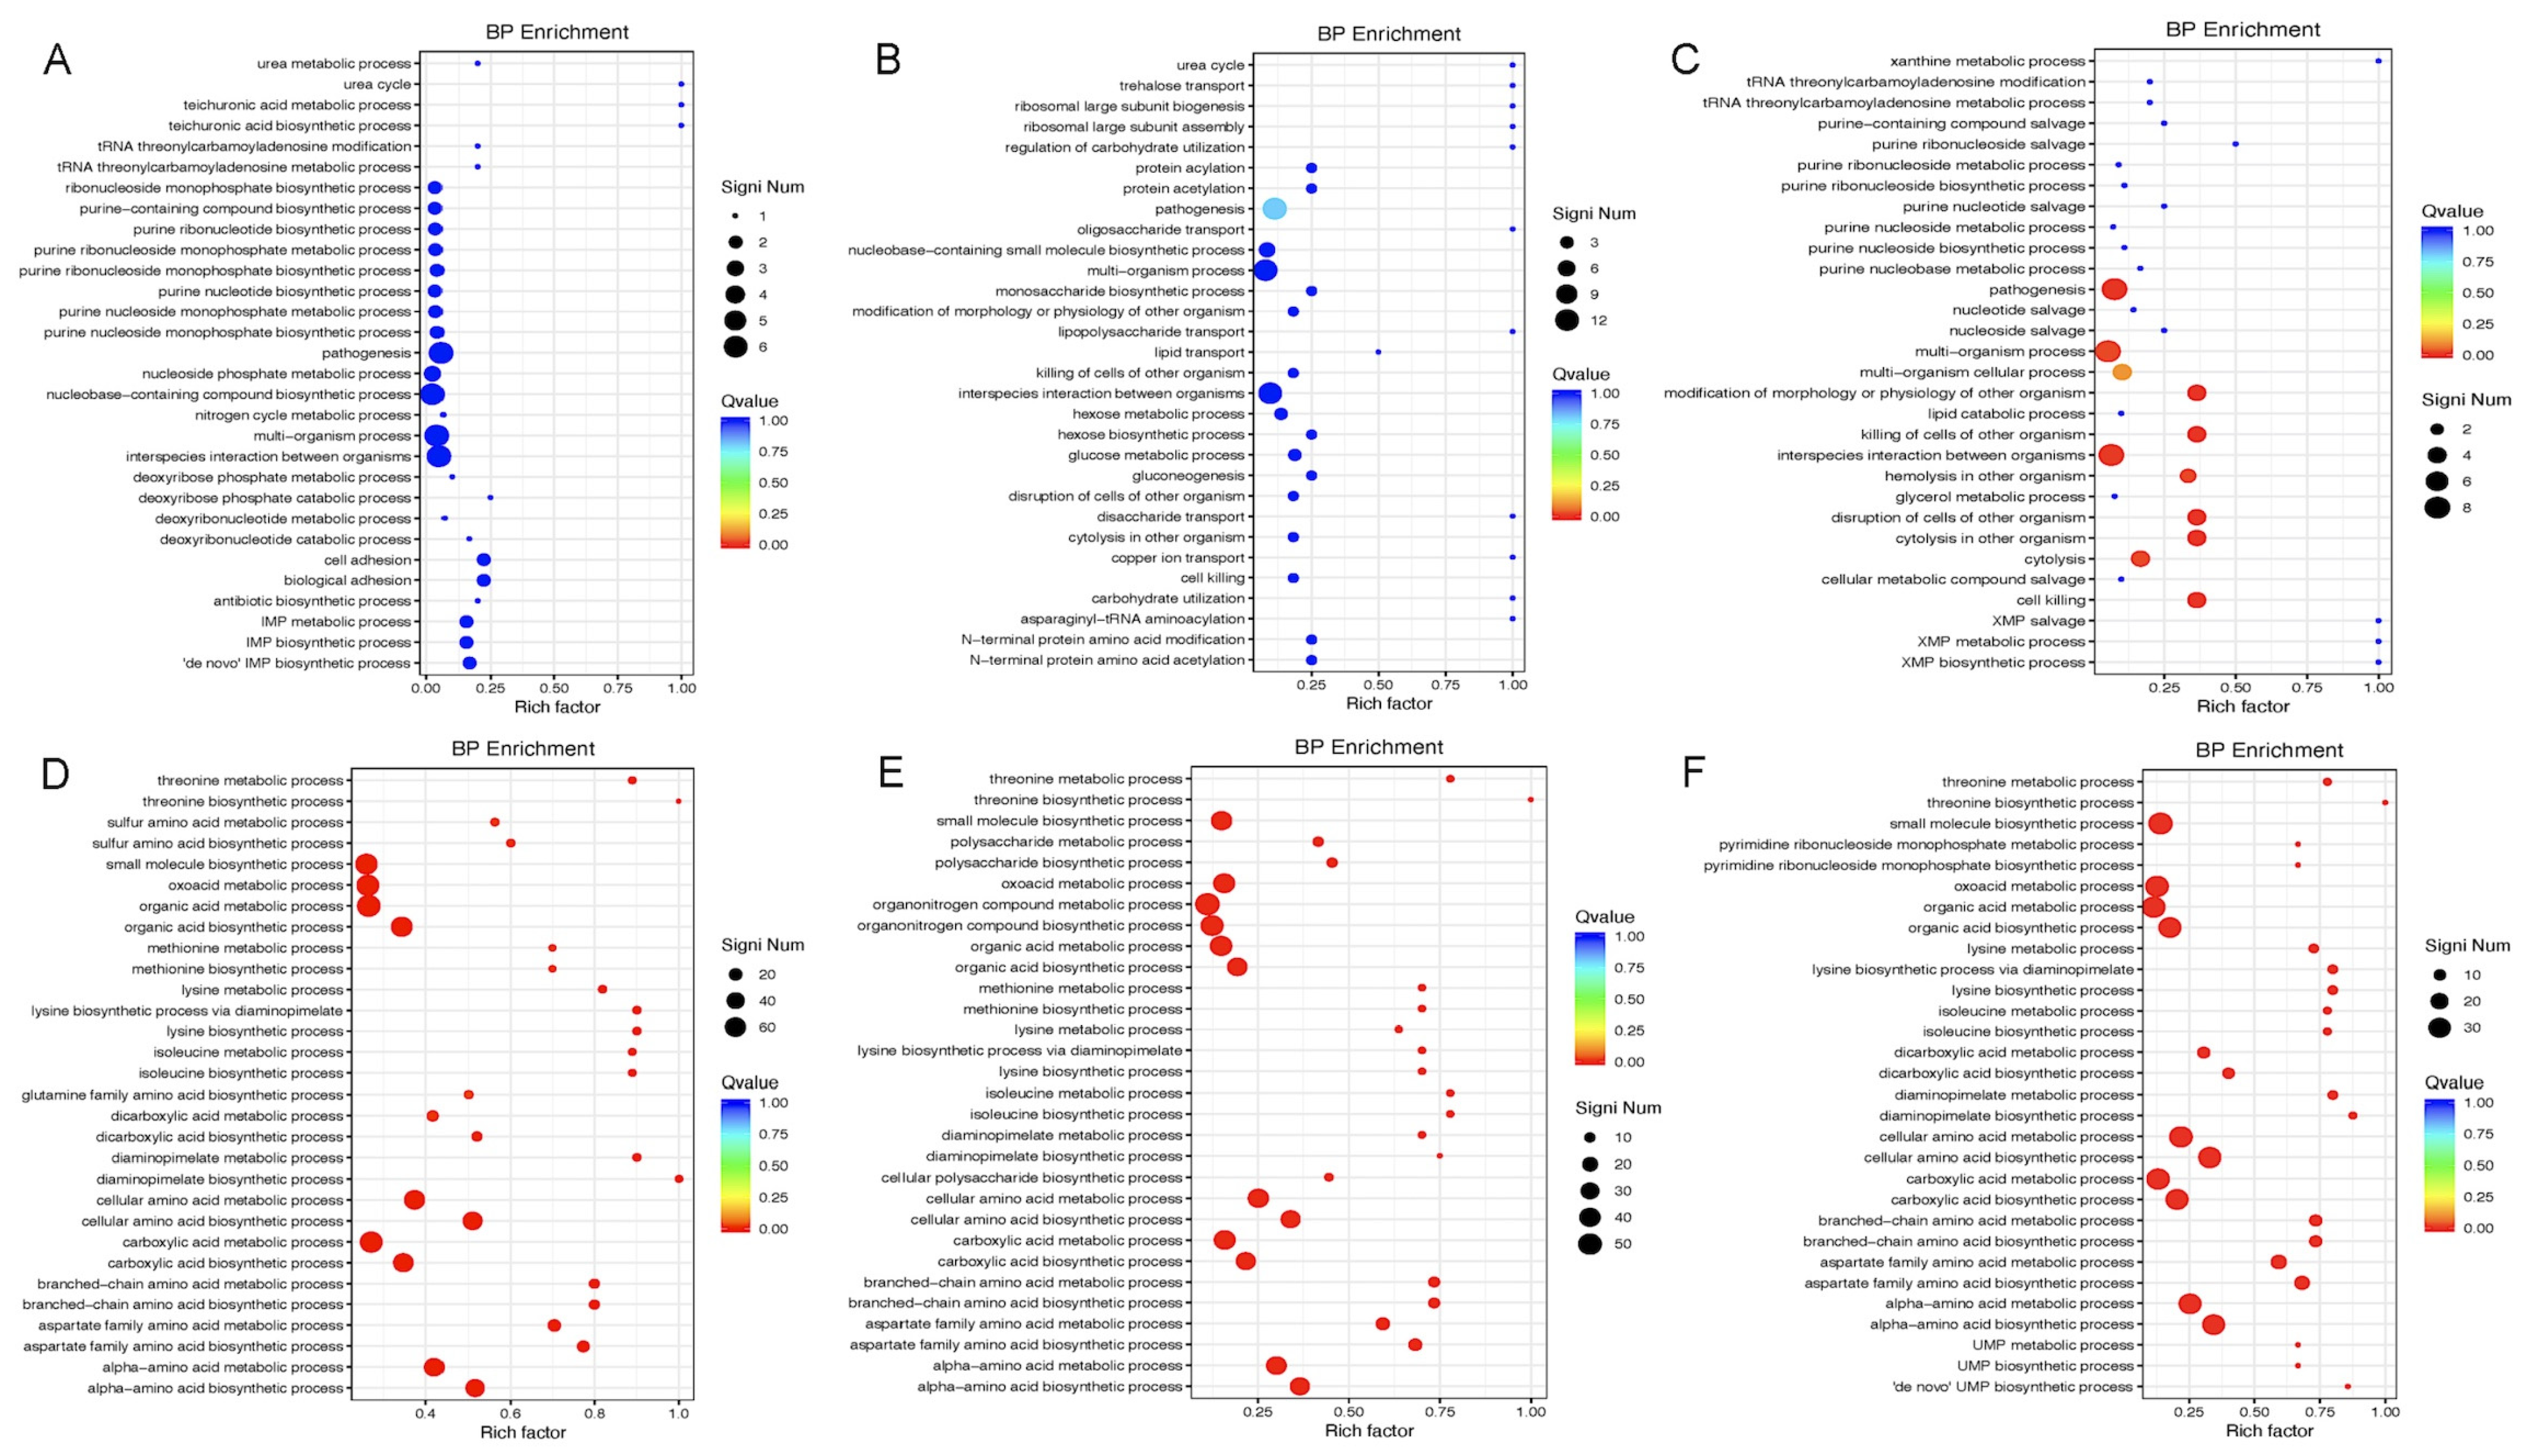
To identify the affected biological pathways, we conducted KEGG and Gene Ontology (GO) enrichment analyses of differentially expressed genes. In the early log phase (OD600nm ≈ 0.2), the downregulated genes were enriched in pathways including the ABC transporters, DNA replication, pentose phosphate pathway, and amino acid and purine metabolism (Figure 3A and Figure 4A). The GO terms included tRNA modification, nucleotide metabolism, pathogenesis, and cell adhesion. Conversely, the upregulated genes were associated with biosynthesis of amino acids (e.g., valine, leucine, and lysine), pantothenate and CoA biosynthesis, and multiple metabolic pathways (Figure 3D and Figure 4D). During the mid-log phase (OD600nm ≈ 0.5), the downregulated genes were enriched in two-component systems, quorum sensing, ribosome biogenesis, DNA repair, and carbon metabolism (Figure 3B and Figure 4B). The upregulated genes again showed enrichment in amino acid biosynthesis and metabolism, as well as ABC transporters and quorum sensing pathways (Figure 3E and Figure 4E). In the early stationary phase (OD600nm ≈ 1.0), the downregulated pathways included two-component systems, sulfur metabolism, purine metabolism, and glycerophospholipid biosynthesis (Figure 3C and Figure 4C), while the upregulated pathways included lysine, glycine, and methionine biosynthesis and ABC transporters (Figure 3F and Figure 4F).
To further investigate the differentially expressed genes associated with Gcp/TsaD downregulation during various growth phases, we performed a trend analysis using the Short Time-series Expression Miner (STEM) [38] software (v1.3.13). The log fold changes (logFC) in the differentially expressed genes from the OD 0.2, 0.5, and 1.0 groups were used for this analysis, resulting in the identification of 15 gene expression trend clusters (profiles 0 to 14), as illustrated in Figure 5 and detailed in Table 4. With 167 genes in the class I trend of interest, the KEGG pathway enrichment analysis highlighted their involvement in lysine, carotenoid, and amino acid biosynthesis, as well as monobactam production (Table 5).

3.7. Identify Proteins That Potentially Interact with Gcp/TsaD in S. aureus

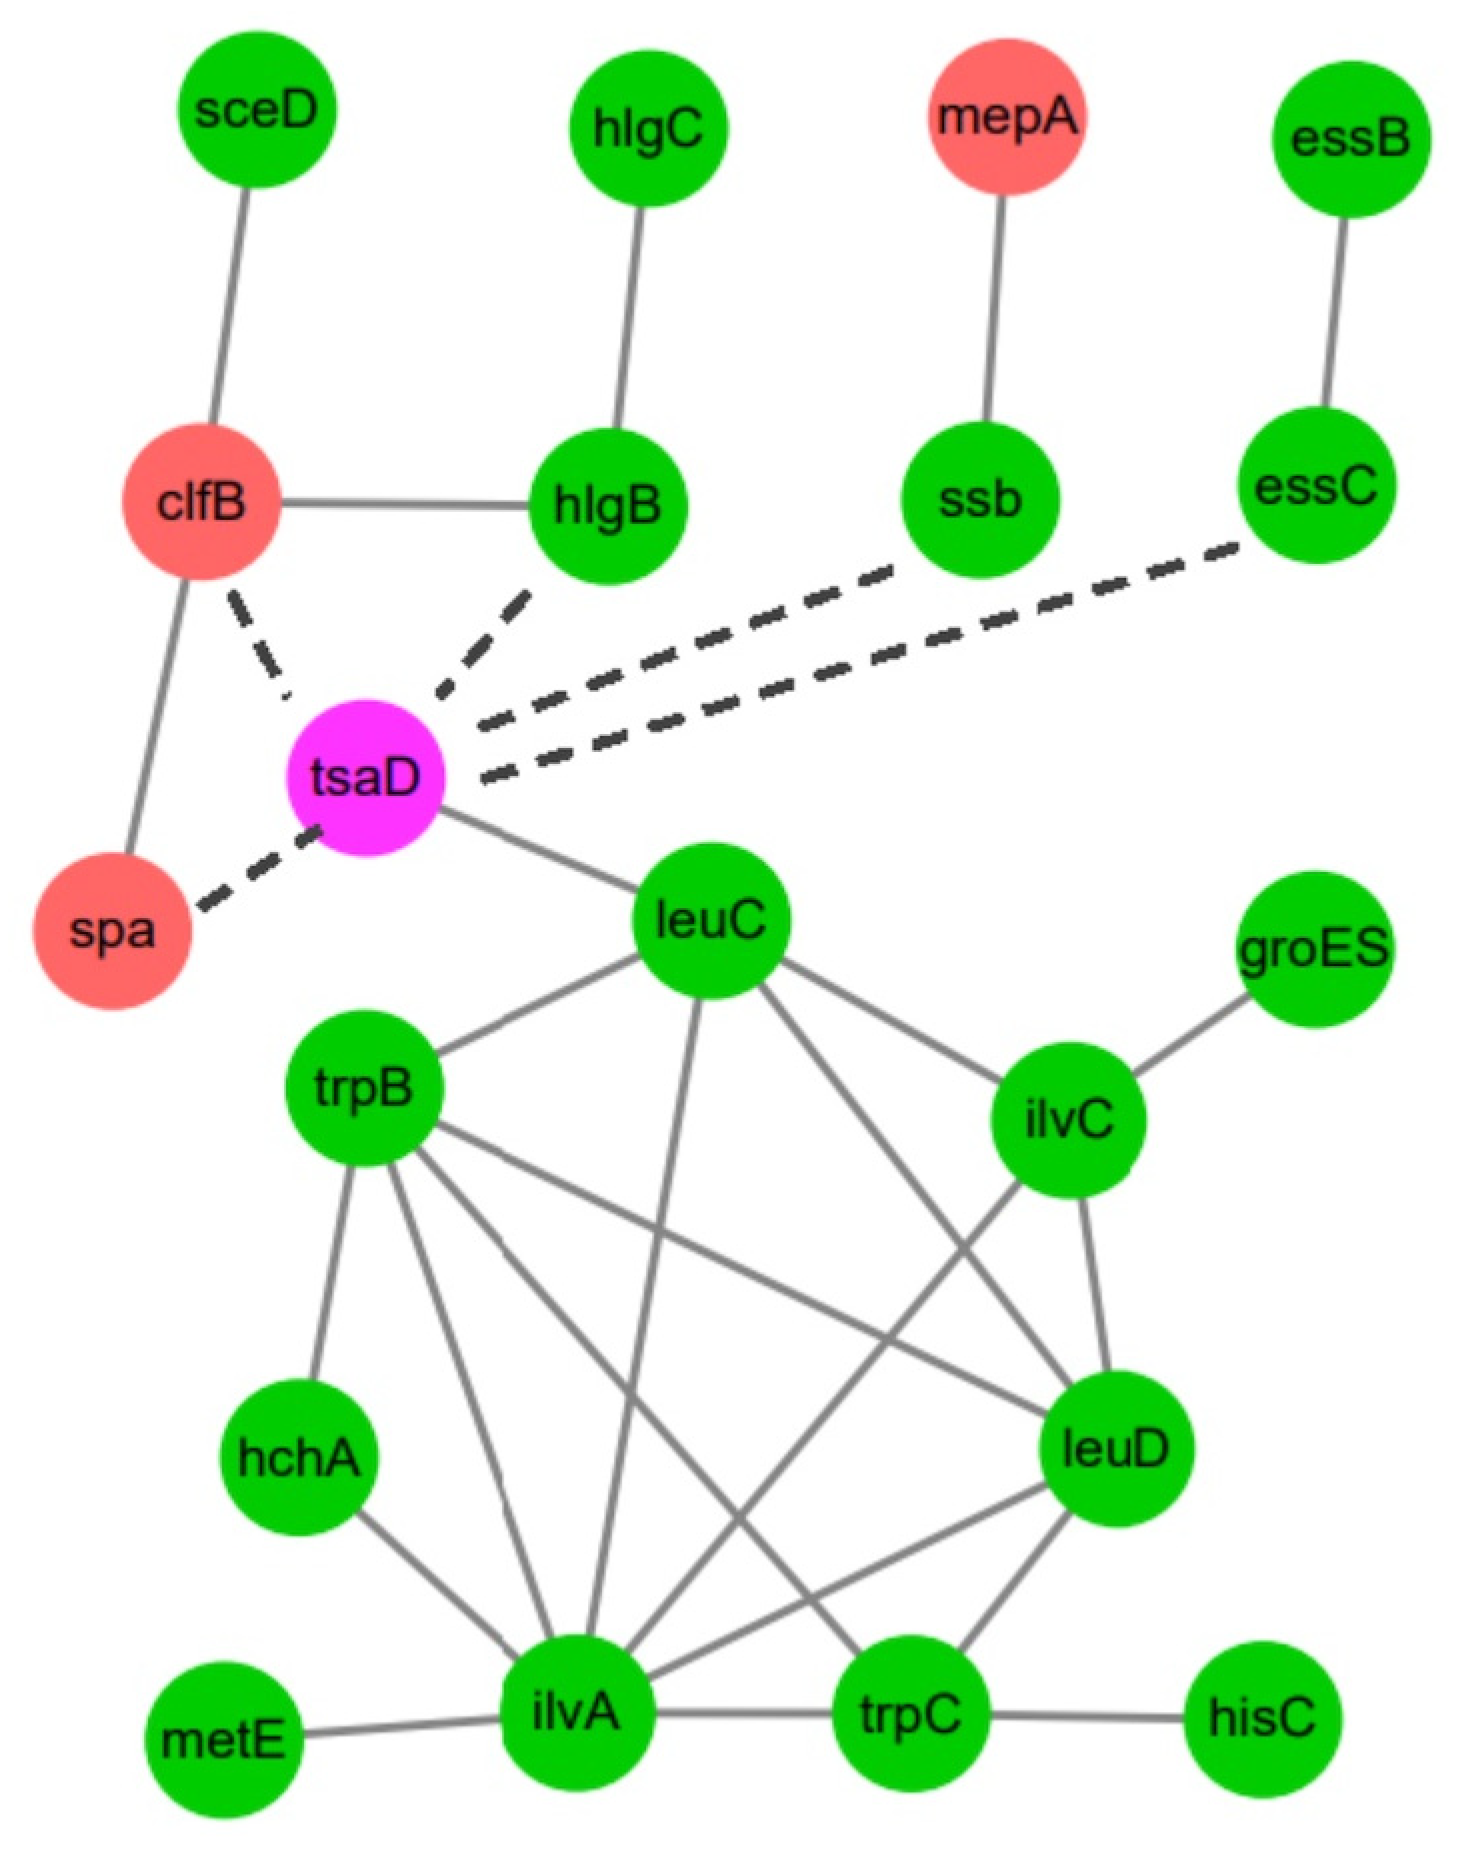
To investigate the protein–protein interaction (PPI) landscape associated with Gcp/TsaD in S. aureus, we utilized the STRING v11.5 database, inputting the gcp/tsaD gene along with the 167 genes identified from the transcriptomic trend cluster of interest. Using a medium confidence interaction threshold (combined score ≥ 0.4), we identified a robust network of predicted protein interactions. Subsequently, we visualized the PPI network using Cytoscape version 3.6.1. The resulting network comprised 20 nodes and 24 edges (Figure 6), representing the genes and their predicted functional associations. The topological analysis revealed that several genes, such as ilvA, trpB, leuC, leuD, and ilvC, exhibited high connectivity degrees, suggesting their roles as potential regulatory or functional hubs.
Of particular interest, leuC (E5491_RS11545), encoding the large subunit of 3-isopropylmalate dehydratase (KO: K01703), demonstrated a direct interaction with the gcp/tsaD gene, indicating a potential central role in Gcp/TsaD-associated pathways. A functional enrichment based on the KEGG annotations linked leuC to multiple metabolism-related pathways, including valine, leucine, and isoleucine biosynthesis (ko00290); biosynthesis of amino acids (ko01230); C5-branched dibasic acid metabolism (ko00660); and 2-oxocarboxylic acid metabolism (ko01210). These interactions are detailed in Table 6.

3.8. Co-Expression Network Analysis of Genes Altered by Gcp/TsaD Depletion

To delineate the transcriptional network impacted by Gcp/TsaD, we constructed a co-expression network using the transcript abundance (TPM) data from the RNA-seq analysis of the gcp/tsaD-depleted mutant. The Pearson correlation coefficients between the gene expression profiles were calculated using the cor.test function in R. The genes with significant expression correlations (|r| > 0.7 and p < 0.05) with gcp/tsaD were defined as co-expressed and potentially co-regulated.
This analysis identified 37 key genes that are significantly co-expressed with gcp/tsaD, all of which were previously assigned to trend cluster I by our STEM clustering analysis. A dynamic regulatory network centered on gcp/tsaD was constructed and visualized using Cytoscape (Figure 7A–C). While the network architecture (nodes and edges) remained consistent across the growth stages (OD600nm ≈ 0.2, 0.5, and 1.0), the node colors are differentiated to reflect the relative expression fold changes between the treated and untreated samples during each stage.
The topological analysis of this co-expression network (summarized in Table 7) identified additional key regulatory genes, including hlg, sdpC, dhaK, idnK, E5491_RS00880, pruA, and TPI. Correlation scatter plots depicting the gene expression relationships between gcp/tsaD and these targets were generated using the ggplot2 package in R (Figure 8), further supporting their tight co-regulation.

3.9. Gcp/TsaD Downregulation Increases Susceptibility to Fosfomycin, a Cell Wall Biosynthesis Inhibitor

Given the transcriptional and morphological changes associated with Gcp/TsaD depletion, we next evaluated its impact on bacterial susceptibility to various classes of antibiotics using standard MIC assays. While downregulation of Gcp/TsaD had no significant effect on the susceptibility to most of the antibiotics tested, it remarkably increased the susceptibility to fosfomycin by 16-fold (Table 8). Fosfomycin is a cell wall biosynthesis inhibitor that targets the MurA enzyme [39].

4. Discussion

Our study provides compelling evidence that Gcp/TsaD is a key contributor to multiple functions of S. aureus biology. Previous work from our group showed that Gcp/TsaD forms a complex with its operon partner YeaZ/TsaB, co-encoded in the tsaBCDE operon in S. aureus [28]. We further demonstrated that YeaZ/TsaB directly binds to the ilv-leu promoter to enhance its transcription [40]. Although Gcp/TsaD does not bind to the promoter, its depletion leads to a significant increase in ilv-leu transcription [15], suggesting that the Gcp-YeaZ complex may have co-functional roles in regulating ILV biosynthesis. Taken together, these observations suggest the possibility that Gcp/TsaD participates in broader regulatory circuits beyond its canonical role in tRNA threonyl-carbamoylation. Through the combination of a morphological analysis, transcriptomic profiling, network-based bioinformatic analysis, and antibiotic susceptibility assays, we demonstrated that Gcp/TsaD is involved in a wide array of physiological processes, including cell morphology, cell wall homeostasis, transcriptional regulation, virulence expression, and antibiotic response.
The transmission and scanning electron microscopy revealed striking morphological defects in the Gcp/TsaD-depleted strain, including reduced cell size and increased cell wall thickness. These findings indicate that Gcp/TsaD plays a crucial role in coordinating proper cell division and peptidoglycan biosynthesis. Our findings are consistent with previous reports that have shown the effects of depleted YgjD (Gcp’s homolog in E. coli) on bacterial cell morphology [41,42,43]. The increased cell wall thickness is likely a compensatory response to cell envelope stress and structural instability, a phenomenon that has also been observed in mutants defective in wall teichoic acid synthesis or penicillin-binding proteins [44,45]. Importantly, cell wall modifications are a common bacterial strategy to counteract environmental stresses, including host immune pressures and exposure to antibiotics [46]. The morphological phenotype in our Gcp/TsaD-depleted strain, therefore, likely reflects broader perturbations in the cell envelope integrity pathway. The changed cell wall structure might contribute to the increased resistance of autolysis and antibiotics-induced cell lysis in Gcp/TsaD-downregulated S. aureus [4].
The RNA-seq analysis revealed widespread changes in gene expression upon Gcp/TsaD depletion. The most dramatic alterations occurred during the early log phase, suggesting that Gcp/TsaD is particularly critical during rapid growth when the biosynthetic and translational demands are high. Notably, 79 genes were consistently differentially expressed across all three growth phases, indicating a core transcriptional response likely tied to Gcp/TsaD function. Among these, the genes involved in translation, energy production, and amino acid biosynthesis were prominently affected, consistent with Gcp/TsaD’s essential role in tRNA modification, specifically in the formation of the universally conserved threonylcarbamoyl adenosine (t6A) at position 37 of ANN-decoding tRNAs [25,33,47]. The t6A modification is essential for proper decoding during translation and for maintaining reading frame fidelity. In organisms ranging from bacteria to humans, loss of this modification results in translational stress, codon misreading, and ribosomal pausing [48,49,50]. The observed downregulation of multiple tRNA genes, including several involved in decoding ANN codons, provides further evidence that Gcp/TsaD depletion induces translational stress in S. aureus, thereby triggering global transcriptional reprogramming.
In response to this stress, we observed a compensatory upregulation of genes involved in cell envelope biosynthesis and modification. This included an increased expression of the dltABCD operon, which mediates D-alanylation of teichoic acids and contributes to resistance to cationic antimicrobial peptides [51], and upregulation of the cap operon, responsible for capsule synthesis. Capsules are known virulence factors that also play protective roles against host immune defenses [52,53]. These findings support the hypothesis that Gcp/TsaD depletion disrupts envelope homeostasis, resulting in the activation of envelope stress response pathways that aim to preserve cellular integrity under hostile conditions.
Interestingly, we observed marked downregulation of several key virulence genes, including spa (encoding protein A), lukH (Panton–Valentine leukocidin component), scpA (staphopain A), and hlgA/B/C (gamma-hemolysin subunits). These genes are under the control of major virulence regulators, such as the SaeRS two-component system and the Agr quorum-sensing network [37,54]. Our data indicate that Gcp/TsaD depletion leads to downregulation of saeS, suggesting that Gcp/TsaD may exert indirect control over virulence gene expression through modulation of regulatory circuits. Similar repression of virulence factors has been documented in S. aureus under oxidative stress or in response to translational arrest [55,56]. Thus, Gcp/TsaD appears to play a dual role in both maintaining basal metabolic functions and enabling the expression of pathogenic traits under favorable conditions.
The perturbation of metabolic genes upon Gcp/TsaD downregulation is also noteworthy. The pathways involving sulfur metabolism, purine biosynthesis, and branched-chain amino acid synthesis were broadly repressed, which is consistent with our previous findings [15]. These pathways are essential for nucleotide production, protein synthesis, and energy generation, especially under nutrient-limited conditions [57,58,59]. The network analysis further identified leuC, ilvA, and trpB as co-regulated hubs associated with Gcp/TsaD. These genes are key enzymes in leucine, isoleucine, and tryptophan biosynthesis, respectively, and have previously been linked to the virulence and persistence of S. aureus [60].
Importantly, our functional assays revealed that Gcp/TsaD depletion significantly increased susceptibility to fosfomycin, an antibiotic that targets the enzyme MurA, which catalyzes the first committed step in peptidoglycan biosynthesis [61,62]. This finding suggests that Gcp/TsaD may play a previously unappreciated role in maintaining cell envelope integrity or in the regulation of peptidoglycan precursor synthesis. The heightened susceptibility to fosfomycin supports a model in which Gcp/TsaD is functionally intertwined with cell wall biosynthetic pathways, potentially through direct or indirect regulation of enzymatic systems involved in precursor synthesis or membrane homeostasis. The precise mechanisms underlying these effects need to be further investigated. The hypersensitivity to fosfomycin likely reflects a compromised cell wall synthesis machinery and altered expression of cell wall biosynthetic genes. Given the increasing interest in adjuvant therapies that sensitize S. aureus to β-lactams and other cell wall-targeting antibiotics, our findings raise the possibility that targeting Gcp/TsaD or its downstream pathways could be a viable therapeutic strategy [63,64].
In conclusion, this study demonstrates that Gcp/TsaD plays a critical role in modulating global gene expression, morphogenesis, virulence, and antibiotic susceptibility in S. aureus. Its essential nature and broad regulatory influence highlight Gcp/TsaD as a promising target for novel antimicrobial development. Future studies will focus on elucidating the molecular mechanisms of Gcp/TsaD-dependent regulation and assessing its potential for therapeutic exploitation against drug-resistant S. aureus infections.
Supplementary Materials

The following supporting information can be downloaded at: https://www.mdpi.com/article/10.3390/microorganisms13092111/s1, Table S1: Differentially expressed genes during Gcp/TsaD downregulation at OD 0.2; Table S2: Differentially expressed genes during Gcp/TsaD downregulation at OD 0.5; Table S3: Differentially expressed genes during Gcp/TsaD downregulation at OD 1.0; Table S4: Common differentially expressed genes across different growth phases following Gcp/TsaD depletion; Table S5: Whole-genome gene expression changes during Gcp/TsaD downregulation at various growth phases.

Author Contributions

Conceptualization: T.L. and Y.J.; Formal analysis: H.G., T.L., J.Y., L.H., Y.W. and Y.J.; Methodology: T.L., H.G., J.Y. and Y.J.; Writing—original draft: H.G., T.L., J.Y. and Y.J.; Writing—review and editing: H.G., T.L., J.Y., L.H., Y.W. and Y.J.; Visualization: T.L. and J.Y.; Data curation: H.G., T.L., J.Y., L.H. and Y.W.; Funding acquisition: H.G., T.L. and Y.J.; Project administration: H.G. and Y.J.; Investigation: T.L. and Y.J.; Supervision: Y.J. All authors have read and agreed to the published version of the manuscript.

Funding

This study was partially supported by grant 31772768 from the National Natural Science Foundation of China, grant 20200801067GH from the Science and Technology Development Program of Jilin Province, and a grant from the University of Minnesota College of Veterinary Medicine.

Institutional Review Board Statement

Not applicable.

Informed Consent Statement

Not applicable.

Data Availability Statement

The original contributions presented in this study are included in the article and Supplementary Materials. Further inquiries can be directed to the corresponding author.

Acknowledgments

We acknowledge the use ChatGPT-4o for assistance in editing grammar and clarity. We reviewed and edited the final version of the manuscript and take full responsibility for the content and scientific accuracy.

Conflicts of Interest

The authors declare no conflicts of interest.

References

  1. Nathan, C.; Cars, O. Antibiotic resistance—Problems, progress, and prospects. N. Engl. J. Med. 2014, 371, 1761–1763. [Google Scholar] [CrossRef] [PubMed]
  2. Tornimbene, B.; Eremin, S.; Escher, M.; Griskeviciene, J.; Manglani, S.; Pessoa-Silva, C.L. WHO Global Antimicrobial Resistance Surveillance System early implementation 2016–17. Lancet Infect. Dis. 2018, 18, 241–242. [Google Scholar] [CrossRef]
  3. Thanassi, J.A.; Hartman-Neumann, S.L.; Dougherty, T.J.; Dougherty, B.A.; Pucci, M.J. Identification of 113 conserved essential genes using a high-throughput gene disruption system in Streptococcus pneumoniae. Nucleic Acids Res. 2002, 30, 3152–3162. [Google Scholar] [CrossRef]
  4. Zheng, L.; Yang, J.; Landwehr, C.; Fan, F.; Ji, Y. Identification of an essential glycoprotease in Staphylococcus aureus. FEMS Microbiol. Lett. 2005, 245, 279–285. [Google Scholar] [CrossRef]
  5. Arigoni, F.; Talabot, F.; Peitsch, M.; Edgerton, M.D.; Meldrum, E.; Allet, E.; Fish, R.; Jamotte, T.; Curchod, M.L.; Loferer, H. A genome-based approach for the identification of essential bacterial genes. Nat. Biotechnol. 1998, 16, 851–856. [Google Scholar] [CrossRef]
  6. Hunt, A.; Rawlins, J.P.; Thomaides, H.B.; Errington, J. Functional analysis of 11 putative essential genes in Bacillus subtilis. Microbiology 2006, 152, 2895–2907. [Google Scholar] [CrossRef]
  7. Kobayashi, K.; Ehrlich, S.D.; Albertini, A.; Amati, G.; Andersen, K.K.; Arnaud, M.; Asai, K.; Ashikaga, S.; Aymerich, S.; Bessieres, P.; et al. Essential Bacillus subtilis genes. Proc. Natl. Acad. Sci. USA 2003, 100, 4678–4683. [Google Scholar] [CrossRef]
  8. Gallagher, L.A.; Ramage, E.; Jacobs, M.A.; Kaul, R.; Brittnacher, M.; Manoil, C. A comprehensive transposon mutant library of Francisella novicida, a bioweapon surrogate. Proc. Natl. Acad. Sci. USA 2007, 104, 1009–1014. [Google Scholar] [CrossRef]
  9. Liberati, N.T.; Urbach, J.M.; Miyata, S.; Lee, D.G.; Drenkard, E.; Wu, G.; Villanueva, J.; Wei, T.; Ausubel, F.M. An ordered, nonredundant library of Pseudomonas aeruginosa strain PA14 transposon insertion mutants. Proc. Natl. Acad. Sci. USA 2006, 103, 2833–2838. [Google Scholar] [CrossRef] [PubMed]
  10. Glass, J.I.; Assad-Garcia, N.; Alperovich, N.; Yooseph, S.; Lewis, M.R.; Maruf, M.; Hutchison, C.A.; Smith, H.O.; Venter, C. Essential genes of a minimal bacterium. Proc. Natl. Acad. Sci. USA 2006, 103, 425–430. [Google Scholar] [CrossRef] [PubMed]
  11. Otulakowski, G.; Shewen, P.; Udoh, E.; Mellors, A.; Wilkie, N. Proteolysis of sialoglycoprotein by Pasteurella haemolytica cytotoxic culture supernatant. Infect. Immun. 1983, 42, 64–70. [Google Scholar] [CrossRef] [PubMed]
  12. Hecker, A.; Leulliot, N.; Gadelle, D.; Graille, M.; Justome, A.; Dorlet, P.; Brochier, C.; Quevillon-Cheruel, S.; Cam, E.L.; van Tilbeurgh, H.; et al. An archaeal orthologue of the universal protein Kae1 is an iron metalloprotein which exhibits atypical DNA-binding properties and apurinic-endonuclease activity in vitro. Nucleic Acids Res. 2007, 35, 6042–6051. [Google Scholar] [CrossRef]
  13. Downey, M.; Houlsworth, R.; Maringele, L.; Rollie, A.; Brehme, M.; Galicia, S.; Guillard, S.; Partington, M.; Zubko, M.K.; Krogan, N.J.; et al. A genome-wide screen identifies the evolutionarily conserved KEOPS complex as a telomere regulator. Cell 2006, 124, 1155–1168. [Google Scholar] [CrossRef]
  14. Kisseleva-Romanova, E.; Lopreiato, R.; Baudin-Baillieu, A.; Rousselle, J.C.; Ilan, L.; Hofmann, K.; Namane, A.; Mann, C.; Libri, D. Yeast homolog of a cancer-testis antigen defines a new transcription complex. EMBO J. 2006, 25, 3576–3585. [Google Scholar] [CrossRef]
  15. Lei, T.; Yang, J.; Zheng, L.; Markowski, T.; Witthuhn, B.A.; Ji, Y. The essentiality of staphylococcal Gcp is independent of its repression of branched-chain amino acids biosynthesis. PLoS ONE 2012, 7, e46836. [Google Scholar] [CrossRef] [PubMed]
  16. Brinsmade, S.R.; Kleijn, R.J.; Sauer, U.; Sonenshein, A.L. Regulation of CodY activity through modulation of intracellular branched-chain amino acid pools. J. Bacteriol. 2010, 192, 6357–6368. [Google Scholar] [CrossRef]
  17. Grandoni, J.A.; Zahler, S.A.; Calvo, J.M. Transcriptional regulation of the ilv-leu operon of Bacillus subtilis. J. Bacteriol. 1992, 174, 3212–3219. [Google Scholar] [CrossRef]
  18. Shivers, R.P.; Sonenshein, A.L. Bacillus subtilis ilvB operon: An intersection of global regulons. Mol. Microbiol. 2005, 56, 1549–1559. [Google Scholar] [CrossRef]
  19. Brosnan, J.T.; Brosnan, M.E. Branched-chain amino acids: Enzyme and substrate regulation. J. Nutr. 2006, 136, 207S–211S. [Google Scholar] [CrossRef] [PubMed]
  20. Roterman, I.; Stapor, K.; Fabian, P.; Konieczny, L. The functional significance of hydrophobic residue distribution in bacterial beta-barrel transmembrane proteins. Membranes. 2021, 11, 580. [Google Scholar] [CrossRef]
  21. Beck, H.C.; Hansen, A.M.; Lauritsen, F.R. Catabolism of leucine to branched-chain fatty acids in Staphylococcus xylosus. J. Appl. Microbiol. 2004, 96, 1185–1193. [Google Scholar] [CrossRef]
  22. Kaneda, T. Iso- and anteiso-fatty acids in bacteria: Biosynthesis, function, and taxonomic significance. Microbiol. Rev. 1991, 55, 288–302. [Google Scholar] [CrossRef] [PubMed]
  23. Amorim Franco, T.M.; Blanchard, J.S. Bacterial branched-chain amino acid biosynthesis: Structures, mechanisms, and drugability. Biochemistry 2017, 56, 5849–5865. [Google Scholar] [CrossRef] [PubMed]
  24. Massey, L.K.; Sokatch, J.R.; Conrad, R.S. Branched-chain amino acid catabolism in bacteria. Bacteriol. Rev. 1976, 40, 42–54. [Google Scholar] [CrossRef] [PubMed]
  25. Deutsch, C.; El Yacoubi, B.; de Crecy-Lagard, V.; Iwata-Reuyl, D. Biosynthesis of threonylcarbamoyl adenosine (t6A), a universal tRNA nucleoside. J. Biol. Chem. 2012, 287, 13666–13673. [Google Scholar] [CrossRef]
  26. El Yacoubi, B.; Hatin, I.; Deutsch, C.; Kahveci, T.; Rousset, J.P.; Iwata-Reuyl, D.; Murzin, A.G.; de Crécy-Lagard, V. A role for the universal Kae1/Qri7/YgjD (COG0533) family in tRNA modification. EMBO J. 2011, 30, 882–893. [Google Scholar] [CrossRef]
  27. Britton, T.A.; Guo, H.; Ji, Y. Interaction between two essential, conserved bacterial proteins YeaZ and glycoprotease as a potential antibacterial target in multi-drug-resistant Staphylococcus aureus. Sci. Prog. 2020, 103, 36850419890521. [Google Scholar] [CrossRef]
  28. Lei, T.; Liang, X.; Yang, J.; Yan, M.; Zheng, L.; Walcheck, B.; Ji, Y. The C-terminal domain of the novel essential protein Gcp is critical for interaction with another essential protein YeaZ of Staphylococcus aureus. PLoS ONE 2011, 6, e20163. [Google Scholar] [CrossRef]
  29. Lei, T.; Yang, J.; Becker, A.; Ji, Y. Identification of target genes mediated by two-component regulators of Staphylococcus aureus using RNA-seq technology. Methods Mol. Biol. 2020, 2069, 125–138. [Google Scholar]
  30. Guo, H.; Lei, T.; Yang, J.; Wang, Y.; Wang, Y.; Ji, Y. New insights into the biological functions of essential TsaB/YeaZ protein in Staphylococcus aureus. Antibiotics 2024, 13, 393. [Google Scholar] [CrossRef]
  31. Yang, J.; Gould, T.J.; Jeon, B.; Ji, Y. Broad-spectrum antibacterial activity of antioxidant octyl gallate and its impact on gut microbiome. Antibiotics 2024, 13, 731. [Google Scholar] [CrossRef]
  32. Yansura, D.G.; Henner, D.J. Use of the Escherichia coli lac repressor and operator to control gene expression in Bacillus subtilis. Proc. Natl. Acad. Sci. USA 1984, 81, 439–443. [Google Scholar] [CrossRef]
  33. Murphy, F.V., 4th; Ramakrishnan, V.; Malkiewicz, A.; Agris, P.F. The role of modifications in codon discrimination by tRNA(Lys)UUU. Nat. Struct. Mol. Biol. 2004, 11, 1186–1191. [Google Scholar] [CrossRef] [PubMed]
  34. Zhang, W.; Collinet, B.; Perrochia, L.; Durand, D.; van Tilbeurgh, H. The ATP-mediated formation of the YgjD-YeaZ-YjeE complex is required for the biosynthesis of tRNA t6A in Escherichia coli. Nucleic Acids Res. 2015, 43, 1804–1817. [Google Scholar] [CrossRef] [PubMed]
  35. Neuhaus, F.C.; Baddiley, J. A continuum of anionic charge: Structures and functions of D-alanyl-teichoic acids in gram-positive bacteria. Microbiol. Mol. Biol. Rev. 2003, 67, 686–723. [Google Scholar] [CrossRef]
  36. Lin, W.S.; Cunneen, T.; Lee, C.Y. Sequence analysis and molecular characterization of genes required for the biosynthesis of type 1 capsular polysaccharide in Staphylococcus aureus. J. Bacteriol. 1994, 176, 7005–7016. [Google Scholar] [CrossRef]
  37. Liang, X.; Yu, C.; Sun, J.; Liu, H.; Landwehr, C.; Holmes, D.; Ji, Y. Inactivation of a two-component signal transduction system, SaeRS, eliminates adherence and attenuates virulence of Staphylococcus aureus. Infect. Immun. 2006, 74, 4655–4665. [Google Scholar] [CrossRef]
  38. Ernst, J.; Bar-Joseph, Z. STEM: A tool for the analysis of short time series gene expression data. BMC Bioinform. 2006, 7, 191. [Google Scholar] [CrossRef]
  39. Kim, D.H.; Lees, W.J. Molecular pharmacology of the antibiotic fosfomycin, an inhibitor of peptidoglycan biosynthesis. Biochemistry 2025, 64, 1720–1727. [Google Scholar] [CrossRef]
  40. Lei, T.; Yang, J.; Ji, Y. Determination of essentiality and regulatory function of staphylococcal YeaZ in branched-chain amino acid biosynthesis. Virulence 2015, 6, 75–84. [Google Scholar] [CrossRef] [PubMed]
  41. Bergmiller, T.; Pena-Miller, R.; Boehm, A.; Ackermann, M. Single-cell time-lapse analysis of depletion of the universally conserved essential protein YgjD. BMC Microbiol. 2011, 11, 118. [Google Scholar] [CrossRef]
  42. Handford, J.I.; Ize, B.; Buchanan, G.; Butland, G.P.; Greenblatt, J.; Emili, A.; Palmer, T. Conserved network of proteins essential for bacterial viability. J. Bacteriol. 2009, 191, 4732–4749. [Google Scholar] [CrossRef] [PubMed]
  43. Katz, C.; Cohen-Or, I.S.; Gophna, U.; Ron, E.Z. The ubiquitous conserved glycopeptidase Gcp prevents accumulation of toxic glycated protein. mBio 2010, 1, e00195-10. [Google Scholar] [CrossRef]
  44. Utaida, S.; Dunman, P.M.; Macapagal, D.; Murphy, E.; Projan, S.J.; Singh, V.K.; Jayaswal, R.K.; Wilkinson, B.J. Genome-wide transcriptional profiling of the response of Staphylococcus aureus to cell-wall-active antibiotics reveals a cell-wall-stress stimulon. Microbiology 2003, 149, 2719–2732. [Google Scholar] [CrossRef]
  45. Weidenmaier, C.; Peschel, A. Teichoic acids and related cell-wall glycopolymers in Gram-positive physiology and host interactions. Nat. Rev. Microbiol. 2008, 6, 276–287. [Google Scholar] [CrossRef]
  46. Brown, S.; Xia, G.; Luhachack, L.G.; Campbell, J.; Meredith, T.C.; Chen, C.; Winstel, V.; Gekeler, C.; Irazoqui, J.E.; Peschel, A.; et al. Methicillin resistance in Staphylococcus aureus requires glycosylated wall teichoic acids. Proc. Natl. Acad. Sci. USA 2012, 109, 18909–18914. [Google Scholar] [CrossRef] [PubMed]
  47. Thiaville, P.C.; Iwata-Reuyl, D.; de Crécy-Lagard, V. Diversity of the biosynthesis pathway for threonylcarbamoyladenosine (t6A), a universal modification of tRNA. RNA Biol. 2014, 11, 1529–1539. [Google Scholar] [CrossRef] [PubMed]
  48. Missoury, S.; Plancqueel, S.; Li de la Sierra-Gallay, I.; Zhang, W.; Liger, D.; Durand, D.; Dammak, R.; Collinet, B.; van Tilbeurgh, H. The structure of the TsaB/TsaD/TsaE complex reveals an unexpected mechanism for the bacterial t6A tRNA-modification. Nucleic Acids Res. 2018, 46, 5850–5860. [Google Scholar] [CrossRef]
  49. Pichard-Kostuch, A.; Zhang, W.; Liger, D.; Daugeron, M.C.; Létoquart, J.; Li de la Sierra-Gallay, I.; Forterre, P.; Collinet, B.; van Tilbeurgh, H.; Basta, T. Structure-function analysis of Sua5 protein reveals novel functional motifs required for the biosynthesis of the universal t6A tRNA modification. RNA 2018, 24, 926–938. [Google Scholar] [CrossRef]
  50. Thiaville, P.C.; Yacoubi, B.E.; Köhrer, C.; Thiaville, J.J.; Deutsch, C.; Iwata-Reuyl, D.; Bacusmo, J.M.; Bessho, Y.; Wetzel, C.; Cao, X.; et al. Essentiality of threonylcarbamoyladenosine (t6A), a university tRNA modification, in bacteria. Mol. Microbiol. 2015, 98, 1199–1221. [Google Scholar] [CrossRef]
  51. Peschel, A.; Otto, M.; Jack, R.W.; Kalbacher, H.; Jung, G.; Götz, F. Inactivation of the dlt operon in Staphylococcus aureus confers sensitivity to defensins, protegrins, and other antimicrobial peptides. J. Biol. Chem. 1999, 274, 8405–8410. [Google Scholar] [CrossRef] [PubMed]
  52. Keinhörster, D.; Salzer, A.; Duque-Jaramillo, A.; George, S.E.; Marincola, G.; Lee, J.C.; Weidenmaier, C.; Wolz, C. Revisiting the regulation of the capsular polysaccharide biosynthesis gene cluster in Staphylococcus aureus. Mol. Microbiol. 2019, 112, 1083–1099. [Google Scholar] [CrossRef]
  53. O’Riordan, K.; Lee, J.C. Staphylococcus aureus capsular polysaccharides. Clin. Microbiol. Rev. 2004, 17, 218–234. [Google Scholar] [CrossRef]
  54. Novick, R.P.; Geisinger, E. Quorum sensing in staphylococci. Annu. Rev. Genet. 2008, 42, 541–564. [Google Scholar] [CrossRef]
  55. Gaupp, R.; Ledala, N.; Somerville, G.A. Staphylococcal response to oxidative stress. Front. Cell. Infect. Microbiol. 2012, 2, 33. [Google Scholar] [CrossRef]
  56. Richardson, A.R.; Libby, S.J.; Fang, F.C. A nitric oxide-inducible lactate dehydrogenase enables Staphylococcus aureus to resist innate immunity. Science 2008, 319, 1672–1676. [Google Scholar] [CrossRef]
  57. Kaiser, J.C.; Sen, S.; Sinha, A.; Wilkinson, B.J.; Heinrichs, D.E. The role of two branched-chain amino acid transporters in Staphylococcus aureus growth, membrane fatty acid composition and virulence. Mol. Microbiol. 2016, 102, 850–864. [Google Scholar] [CrossRef]
  58. Pendleton, A.; Yeo, W.S.; Alqahtani, S.; DiMaggio, D.A., Jr.; Stone, C.J.; Li, Z.; Singh, V.K.; Montgomery, C.P.; Bae, T.; Brinsmade, S.R. Regulation of the Sae two-component system by branched-chain fatty acids in Staphylococcus aureus. mBio 2022, 13, e0147222. [Google Scholar] [CrossRef]
  59. Tuchscherr, L.; Löffler, B.; Proctor, R.A. Persistence of Staphylococcus aureus: Multiple metabolic pathways impact the expression of virulence factors in small-colony variants (SCVs). Front. Microbiol. 2020, 11, 1028. [Google Scholar] [CrossRef] [PubMed]
  60. Somerville, G.A.; Proctor, R.A. At the crossroads of bacterial metabolism and virulence factor synthesis in staphylococci. Microbiol. Mol. Biol. Rev. 2009, 73, 233–248. [Google Scholar] [CrossRef] [PubMed]
  61. Castañeda-García, A.; Blázquez, J.; Rodríguez-Rojas, A. Molecular mechanisms and clinical impact of acquired and intrinsic fosfomycin resistance. Antibiotics 2013, 2, 217–236. [Google Scholar] [CrossRef] [PubMed]
  62. Kahan, F.M.; Kahan, J.S.; Cassidy, P.J.; Kropp, H. The mechanism of action of fosfomycin (phosphonomycin). Ann. N. Y. Acad. Sci. 1974, 235, 364–386. [Google Scholar] [CrossRef] [PubMed]
  63. Haaber, J.; Friberg, C.; McCreary, M.; Lin, R.; Cohen, S.N.; Ingmer, H. Reversible antibiotic tolerance induced in Staphylococcus aureus by concurrent drug exposure. mBio 2015, 6, e02268-14. [Google Scholar] [CrossRef]
  64. Lee, S.H.; Wang, H.; Labroli, M.; Koseoglu, S.; Zuck, P.; Mayhood, T.; Gill, C.; Mann, P.; Sher, X.; Ha, S.; et al. TarO-specific inhibitors of wall teichoic acid biosynthesis restore β-lactam efficacy against methicillin-resistant staphylococci. Sci. Transl. Med. 2016, 8, 329ra32. [Google Scholar] [CrossRef] [PubMed]
Figure 1. Scanning and transmission electron micrographs of S. aureus with Gcp/TsaD depletion. The SEM is of the gcp/tsaD conditional mutant JW290111 grown in TSB with (A) and without (B) 100 µM IPTG. The scale bar in the SEM represents 1 µm. The bacterial cell size is measured as the area of cells under the SEM (C). The cell size is measured for the parental control JW290011 (CT) and the gcp/tsaD conditional mutant JW290111 with (gcp + IPTG) or without (gcp) 100 µM IPTG. The error bars represent the standard errors or the means; n = 20. The star means the statistical difference; p < 0.05. The TEM is of the JW290011 gcp/tsaD conditional mutant JW290111 grown in TSB with (D) and without (E) 100 µM IPTG. The cell wall thickness is measured (F). The parental control JW290011 (CT) and the gcp/tsaD conditional mutant JW290111 with (gcp + IPTG) or without (gcp) 100 µM IPTG. The error bars represent the standard errors or the means; n = 20. The star means the statistical difference; p < 0.05.
Microorganisms 13 02111 g001
Figure 2. The diagram illustrates the overlapping differentially expressed genes at various growth phases during the downregulation of Gcp/TsaD. (A) The total differentially expressed genes for the IPTG-induced gcp/tsaD expression mutant JW290111 (gcp) in the absence and presence of 100 μM IPTG. (B) The differentially upregulated genes for the IPTG-induced gcp/tsaD expression mutant JW290111 (gcp) across the different growth phases in the absence and presence of 100 μM IPTG. (C) The differentially downregulated genes for the IPTG-induced gcp/tsaD expression mutant JW290111 (gcp) across the different growth phases in the absence and presence of 100 μM IPTG. gcp_02, gcp_05, and gcp_10 represent the growth of the IPTG-induced gcp/tsaD expression mutant in TSB without IPTG at OD600 ≈ 0.2, 0.5, and 1.0, respectively.
Microorganisms 13 02111 g002
Figure 3. The significantly enriched pathways affected by downregulating Gcp/TsaD in S. aureus in a KEGG enrichment biological pathway analysis. (A) The significantly downregulated enrichment pathways caused by the depletion of Gcp/TsaD during the early log phase of growth (OD600 ≈ 0.2). (B) The significantly downregulated enrichment pathways caused by the depletion of Gcp/TsaD during the middle log phase of growth (OD600 ≈ 0.5). (C) The significantly downregulated enrichment pathways caused by the depletion of Gcp/TsaD during the early stationary phase of growth (OD600 ≈ 1.0). (D) The significantly upregulated enrichment pathways caused by the depletion of Gcp/TsaD during the early log phase of growth (OD600 ≈ 0.2). (E) The significantly upregulated enrichment pathways caused by the depletion of Gcp/TsaD during the middle log phase of growth (OD600 ≈ 0.5). (F) The significantly upregulated enrichment pathways caused by the depletion of Gcp/TsaD during the early stationary phase of growth (OD600 ≈ 1.0). The Rich Factor is the ratio of the differentially expressed number of genes in the pathway to the total number of genes in the pathway. The higher the Rich Factor, the higher the degree of enrichment. The QValue is the p-value after the multiple hypothesis test correction, and is in the range of 0 to 1; the closer the QValue is to zero, the more significant the enrichment.
Microorganisms 13 02111 g003
Figure 4. The significantly enriched pathways affected by downregulating Gcp/TsaD in S. aureus in a BP enrichment biological pathway analysis. (A) The significantly downregulated enrichment pathways caused by the depletion of Gcp/TsaD during the early log phase of growth (OD600 ≈ 0.2). (B) The significantly downregulated enrichment pathways caused by the depletion of Gcp/TsaD during the middle log phase of growth (OD600 ≈ 0.5). (C) The significantly downregulated enrichment pathways caused by the depletion of Gcp/TsaD during the early stationary phase of growth (OD600 ≈ 1.0). (D) The significantly upregulated enrichment pathways caused by the depletion of Gcp/TsaD during the early log phase of growth (OD600 ≈ 0.2). (E) The significantly upregulated enrichment pathways caused by the depletion of Gcp/TsaD during the middle log phase of growth (OD600 ≈ 0.5). (F) The significantly upregulated enrichment pathways caused by the depletion of Gcp/TsaD during the early stationary phase of growth (OD600 ≈ 1.0). The Rich Factor is the ratio of the differentially expressed number of genes in the pathway to the total number of genes in the pathway. The higher the Rich Factor, the higher the degree of enrichment. The QValue is the p-value after the multiple hypothesis test correction, and is in the range of 0 to 1; the closer the QValue is to zero, the more significant the enrichment.
Microorganisms 13 02111 g004
Figure 5. The interest trend class genes affected by Gcp/TsaD during the early log, middle log, and early stationary phases of growth in TSB. The profiles are ordered based on the number of genes assigned. The top number represents the profile number, and the bottom number represents the gene number in each panel. Different colors were used to distinguish the various classes of genes with distinct expression trend.
Microorganisms 13 02111 g005
Figure 6. Protein–protein interaction network of the trend cluster I gene set. The red nodes represent genes with gradually increasing fold changes across the OD 0.2, 0.5, and 1.0 time points. The green nodes indicate genes with gradually decreasing fold changes across the same time points. The purple node represents the gcp/tsaD gene. Dotted and solid lines represent indirect and direct interactions, respectively.
Microorganisms 13 02111 g006
Figure 7. Dynamic regulatory network of the gcp/tsaD gene. The nodes represent the genes that follow the trend of interest from trend cluster I, and the node colors indicate the logFC values of gene expression differences between the uninduced and induced conditions. The edges represent significant correlations. Panel (A): OD 0.2; Panel (B): OD 0.5; Panel (C): OD 1.0.
Microorganisms 13 02111 g007
Figure 8. Correlation scatter plots between the gcp (tsaD) gene and key genes. The x-axis represents the expression values of the gcp/tsaD gene, while the y-axis represents the expression values of the corresponding key genes. Lines and gray areas highlight key genes that are closely correlated and similarly affected.
Microorganisms 13 02111 g008
Table 1. Primers for qPCR analysis.
GenesPrimers NameOligo Sequences (5′-3′)
capACapARTF435TCCGAAGATTATGAGTGTGGATAAC
CapARTR512TGCACCGATTAGATTCACTACAG
capGCapGRTF876GAAGTTCCCTGGTGTCCTTATT
CapGRTR959CAACGGATTGGATTAGATTGTTATAGG
capPCapPRTF864GCTGACAGATTCTGGTGGTATT
CapPRTR966TGTGCCAATTACTCTCGATGTT
ilvAIlvARTForAAGAGCACTCACACTTAATGCGCC
IlvARTRevGGCGTTGGTGCATCACATCAGTAT
ilvDIlvDRTForCACCCGGTATGATTTAGCAG
IlvDRTRevACAAGTAGGGCAGGCATTTTG
leuALeuARTForACTTCTGCTTGGGCATCAGTACCT
LeuARTRevACTTCTGCTTGGGCATCAGTACCT
rrs16SrRNAFor-RT-JHTCAGCGTCAGTTACAGACCA
16SrRNARev-RT-JHTAATACGACTCACTATAGGG
Table 2. Number of differentially expressed genes during Gcp/TsaD downregulation.
GroupIPTG−IPTG+DEG_UpDEG_DownTotal
gcp/tsaD OD 0.2gcp_02gcp 0246063523
gcp/tsaD OD 0.5gcp_05gcp 05184117301
gcp/tsaD OD 1.0gcp_10gcp 1011123134
gcp/tsaD inducible mutant strain JW290111.
Table 3. qPCR analysis of impact of Gcp/TsaD on transcriptions of genes of interest.
GenesFold Change (Increase) a
ilvD4.36 ± 0.47
leuA79.36 ± 2.33
ilvA124.24 ± 9.13
capA16.56 ± 1.18
capG5.66 ± 1.16
capP17.39 ± 1.19
a The fold change represents the transcription levels of genes with the depletion of Gcp/TsaD compared with those during the induction of gcp/tsaD transcription with IPTG (100 µM) at the exponential phase of growth (OD600 ≈ 0.5). The qPCR was repeated at least three times.
Table 4. The results of Short Time-series Expression Miner (STEM) analysis.
ProfileCountTrendClass
070Down–downInterest trend class I gene
241Down–down
343Down–down
124Up–up
139Up–up
922Up–downInterest trend class II genes
1011Up–down
142Up–down
1119Down–up
573Down–up
630Down–up
4104Down–flatInterest trend class III genes
115Up–flat
818Flat–upInterest trend class IV genes
735Flat–down
Table 5. KEGG enrichment pathways of interest trend class I genes.
GroupDescriptionCountp-Value
ko00300Lysine biosynthesis66.63 × 10−5
ko00261Monobactam biosynthesis40.000109
ko00260Glycine, serine, and threonine metabolism90.000111
ko01230Biosynthesis of amino acids180.000197
ko00270Cysteine and methionine metabolism70.000471
ko00290Valine, leucine, and isoleucine biosynthesis50.000824
ko012102-Oxocarboxylic acid metabolism60.001309
ko00906Carotenoid biosynthesis20.043147
Table 6. The top 10 trend class I genes of interest involved in protein–protein interaction with Gcp/TsaD.
Genes NameGene LocusDegreeProfileTrend Type
ilvAE5491_RS1155572down–down
trpBE5491_RS0713552down–down
leuCE5491_RS1154552down–down
leuDE5491_RS1155052down–down
ilvCE5491_RS1153042down–down
trpCE5491_RS0712540down–down
clfBE5491_RS14740312up–up
hlgBE5491_RS1354523down–down
hchAE5491_RS0289523down–down
mepAE5491_RS01620113up–up
gcp/tsaDE5491_RS114901
Table 7. Degree analysis results of the gcp/tsaD dynamic regulatory network.
GeneGene NameDegreeOD 0.2OD 0.5OD 1.0Profile
E5491_RS11500tsaB37−2.44891−1.90448−1.65545
E5491_RS13535hlg26−0.19841−0.81054−1.422373
E5491_RS13060sdpC250.1316290.9642531.40829412
E5491_RS03405dhaK230.408297−0.8035−1.424730
E5491_RS14030idnK23−0.94863−2.19284−2.635630
E5491_RS00880E5491_RS0088023−0.50701−1.21733−1.631510
E5491_RS14300pruA22−0.17791−1.36565−1.637980
E5491_RS04085TPI220.151122−0.50351−1.018143
E5491_RS00995ganQ21−1.25819−1.78034−2.787742
E5491_RS01000E5491_RS01000210.18232−1.41171−2.50910
E5491_RS00985cycB21−1.12371−2.37355−2.895130
E5491_RS14025E5491_RS1402521−0.70145−1.84441−2.920433
E5491_RS00990ganP21−1.21346−2.40898−3.112670
E5491_RS01005E5491_RS0100521−0.72334−1.43841−2.452492
E5491_RS00745aldH210.105615−0.73549−1.227110
E5491_RS00980msmX21−0.80904−2.56146−3.038860
E5491_RS15205E5491_RS1520520−0.23762−0.92482−2.053232
E5491_RS11755yidC20−0.040670.3515411.04206413
E5491_RS01510E5491_RS0151020−0.28425−1.18093−1.545860
E5491_RS07475norB19−0.66155−1.96156−2.481660
Note: In the title, OD 0.2 refers to the logFC value from the differential gene expression analysis between the uninduced and induced conditions at the OD 0.2 time point. Similarly, OD 0.5 and OD 1.0 also represent the logFC values at their respective time points.
Table 8. MIC of antibiotics against IPTG-induced gcp/tsaD conditional mutant.
CompoundJW290111JW290111
IPTG (100 μM)+
Novobiocin0.030.03
Trimethoprim42
Rifamycin0.060.06
Chloramphenicol1616
Erythromycin>64>64
Kanamycin6464
Ampicillin88
Penicillin-G24
Bacitracin>64>64
Phosphomycin644
Piperacillin11
Vancomycin0.50.5
Polymycin B>64>64
Triclosan0.030.03
Note: All experiments were triplicated. MIC values are expressed in μg/mL.
Disclaimer/Publisher’s Note: The statements, opinions and data contained in all publications are solely those of the individual author(s) and contributor(s) and not of MDPI and/or the editor(s). MDPI and/or the editor(s) disclaim responsibility for any injury to people or property resulting from any ideas, methods, instructions or products referred to in the content.