

Fecal Microbiome and Metabolomic Profiles of Mixed-Fed Infants Are More Similar to Formula-Fed than Breastfed Infants


Abstract
1. Introduction
2. Materials and Methods
2.1. Study Participants
2.2. Questionnaire Data
2.3. Sample Collection
2.4. Shotgun Metagenomic Sequencing and Analysis
2.4.1. DNA Extraction
2.4.2. Construction of Shotgun Genomic Libraries and Sequencing
2.4.3. Sequence Processing and Bioinformatics
2.5. Fecal Metabolomics Analysis
2.5.1. Sample Preparation and UPLC-MS/MS Analysis
2.5.2. Data Extraction, Compound Identification, and Quantification
2.6. Statistical Analysis
3. Results
3.1. Demographics
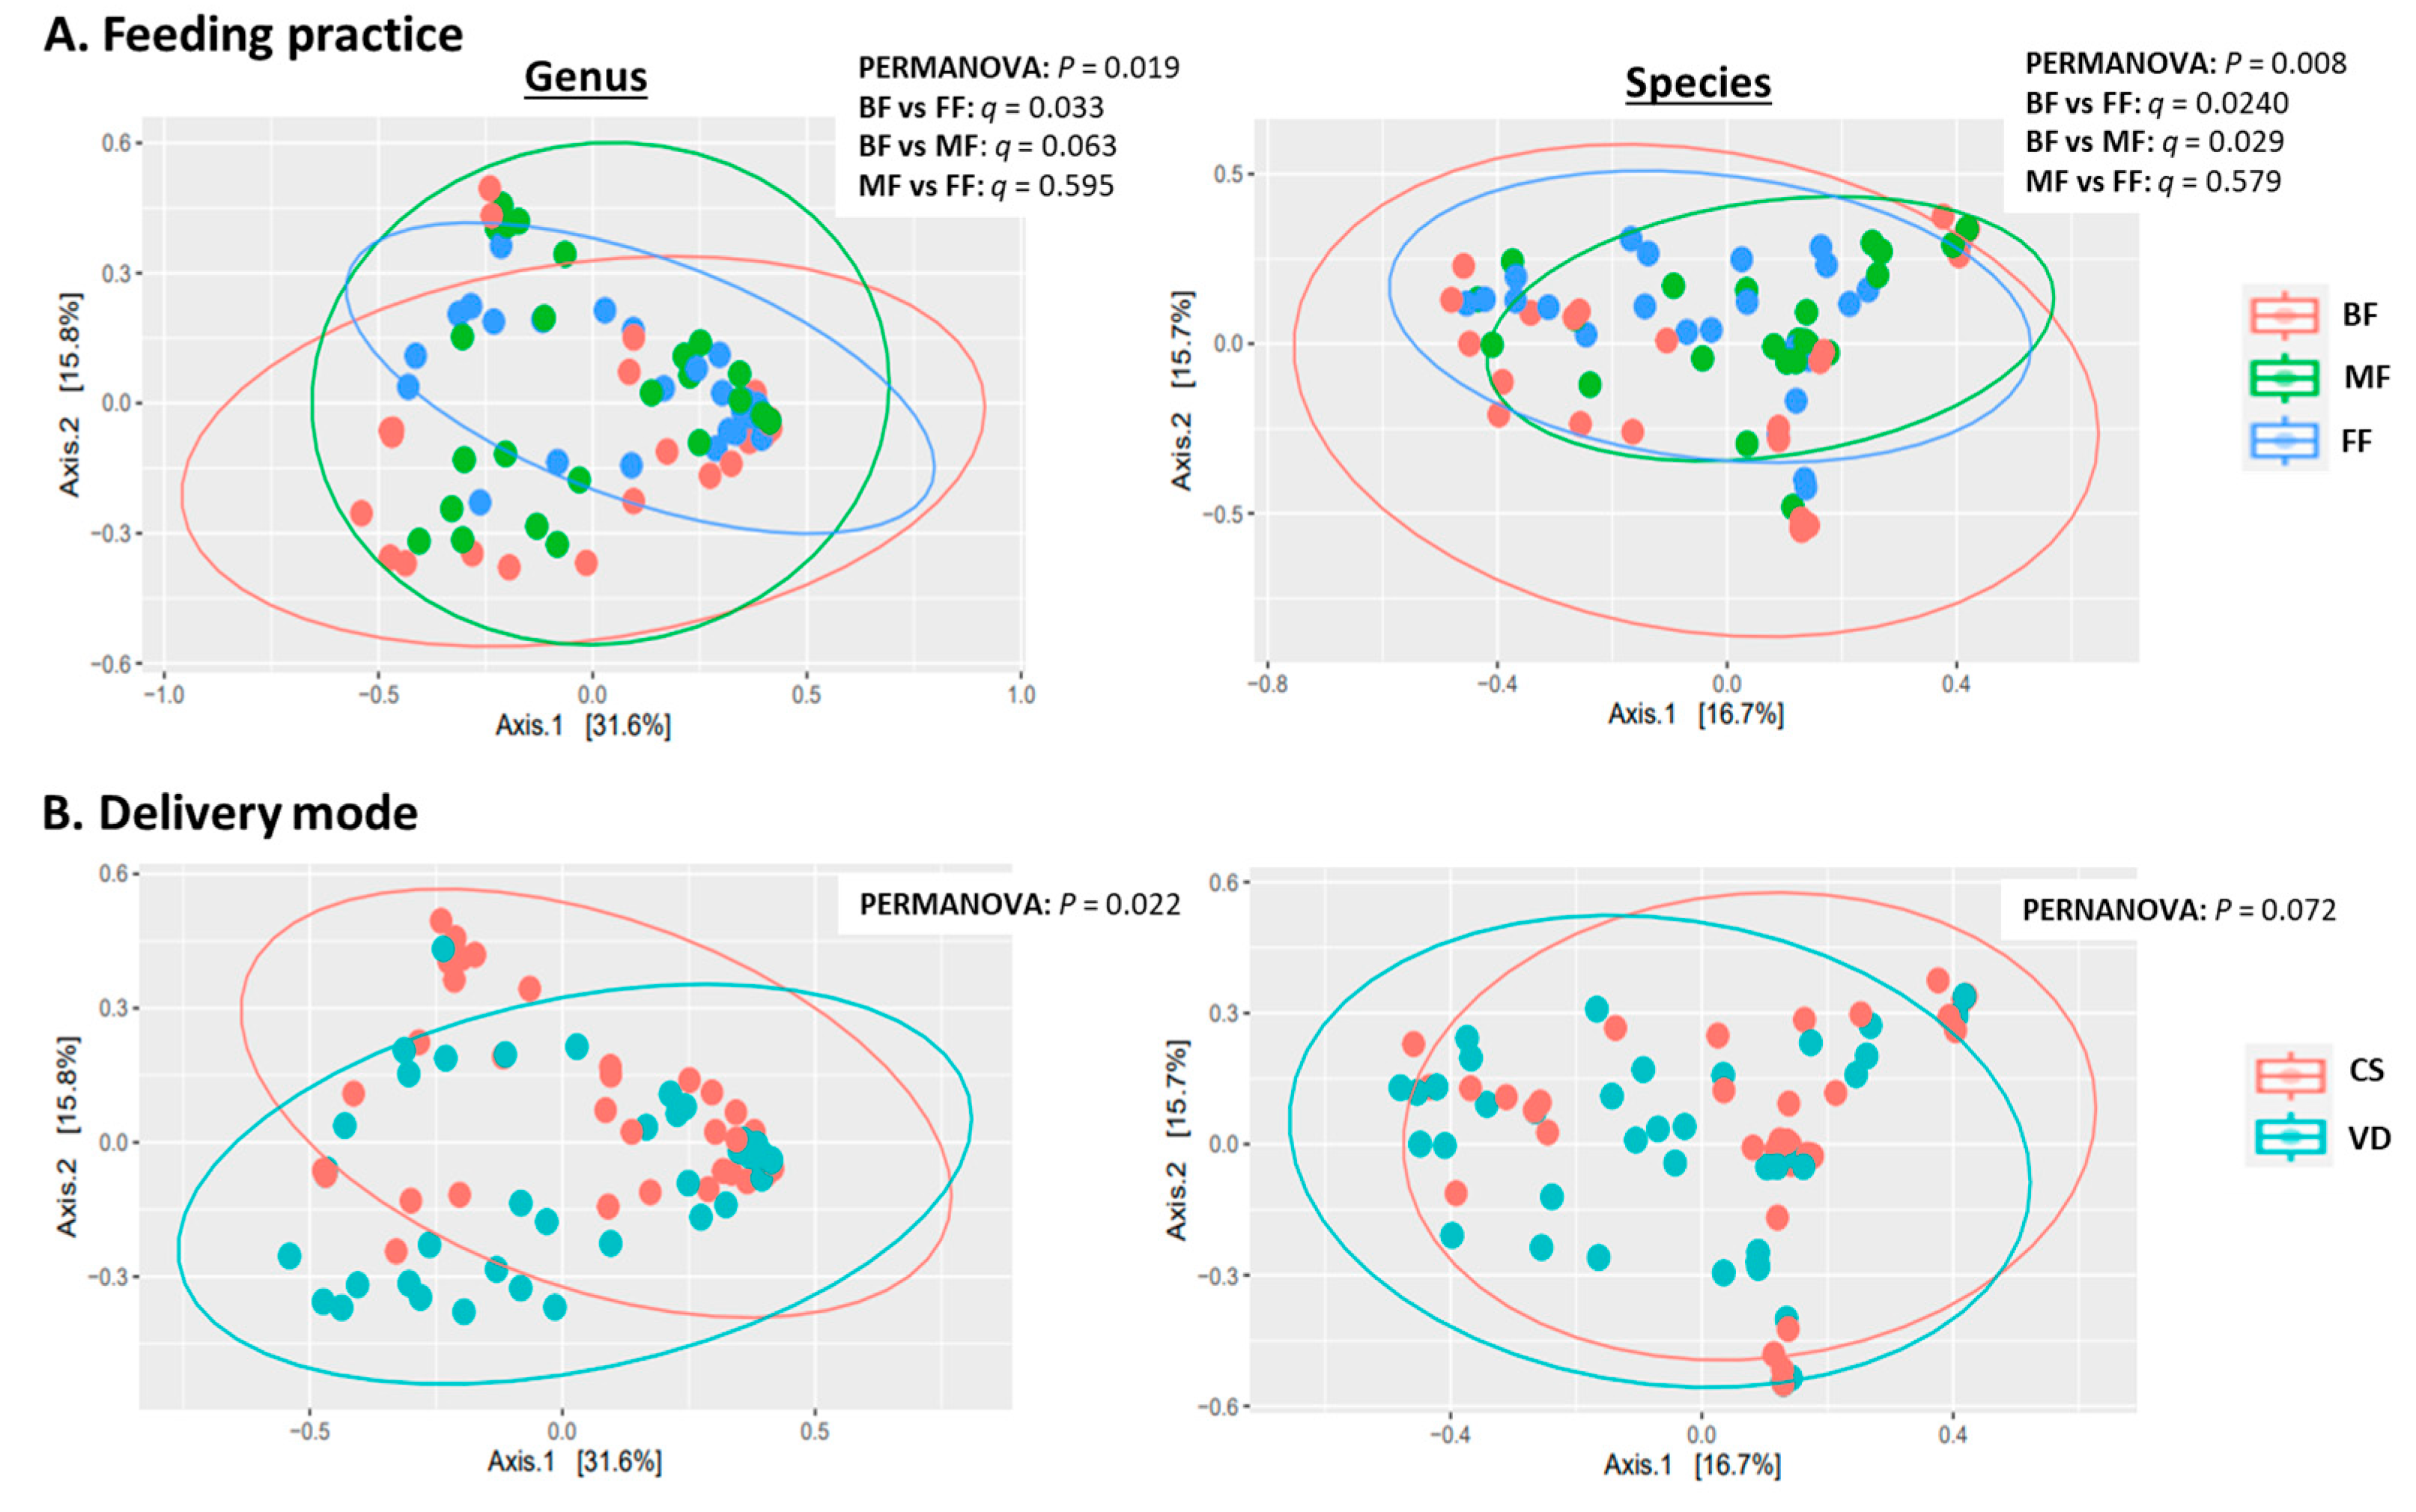
3.2. Feeding Practice and Delivery Mode Affected Infant Fecal Microbiome
3.2.1. General Features of Metagenome
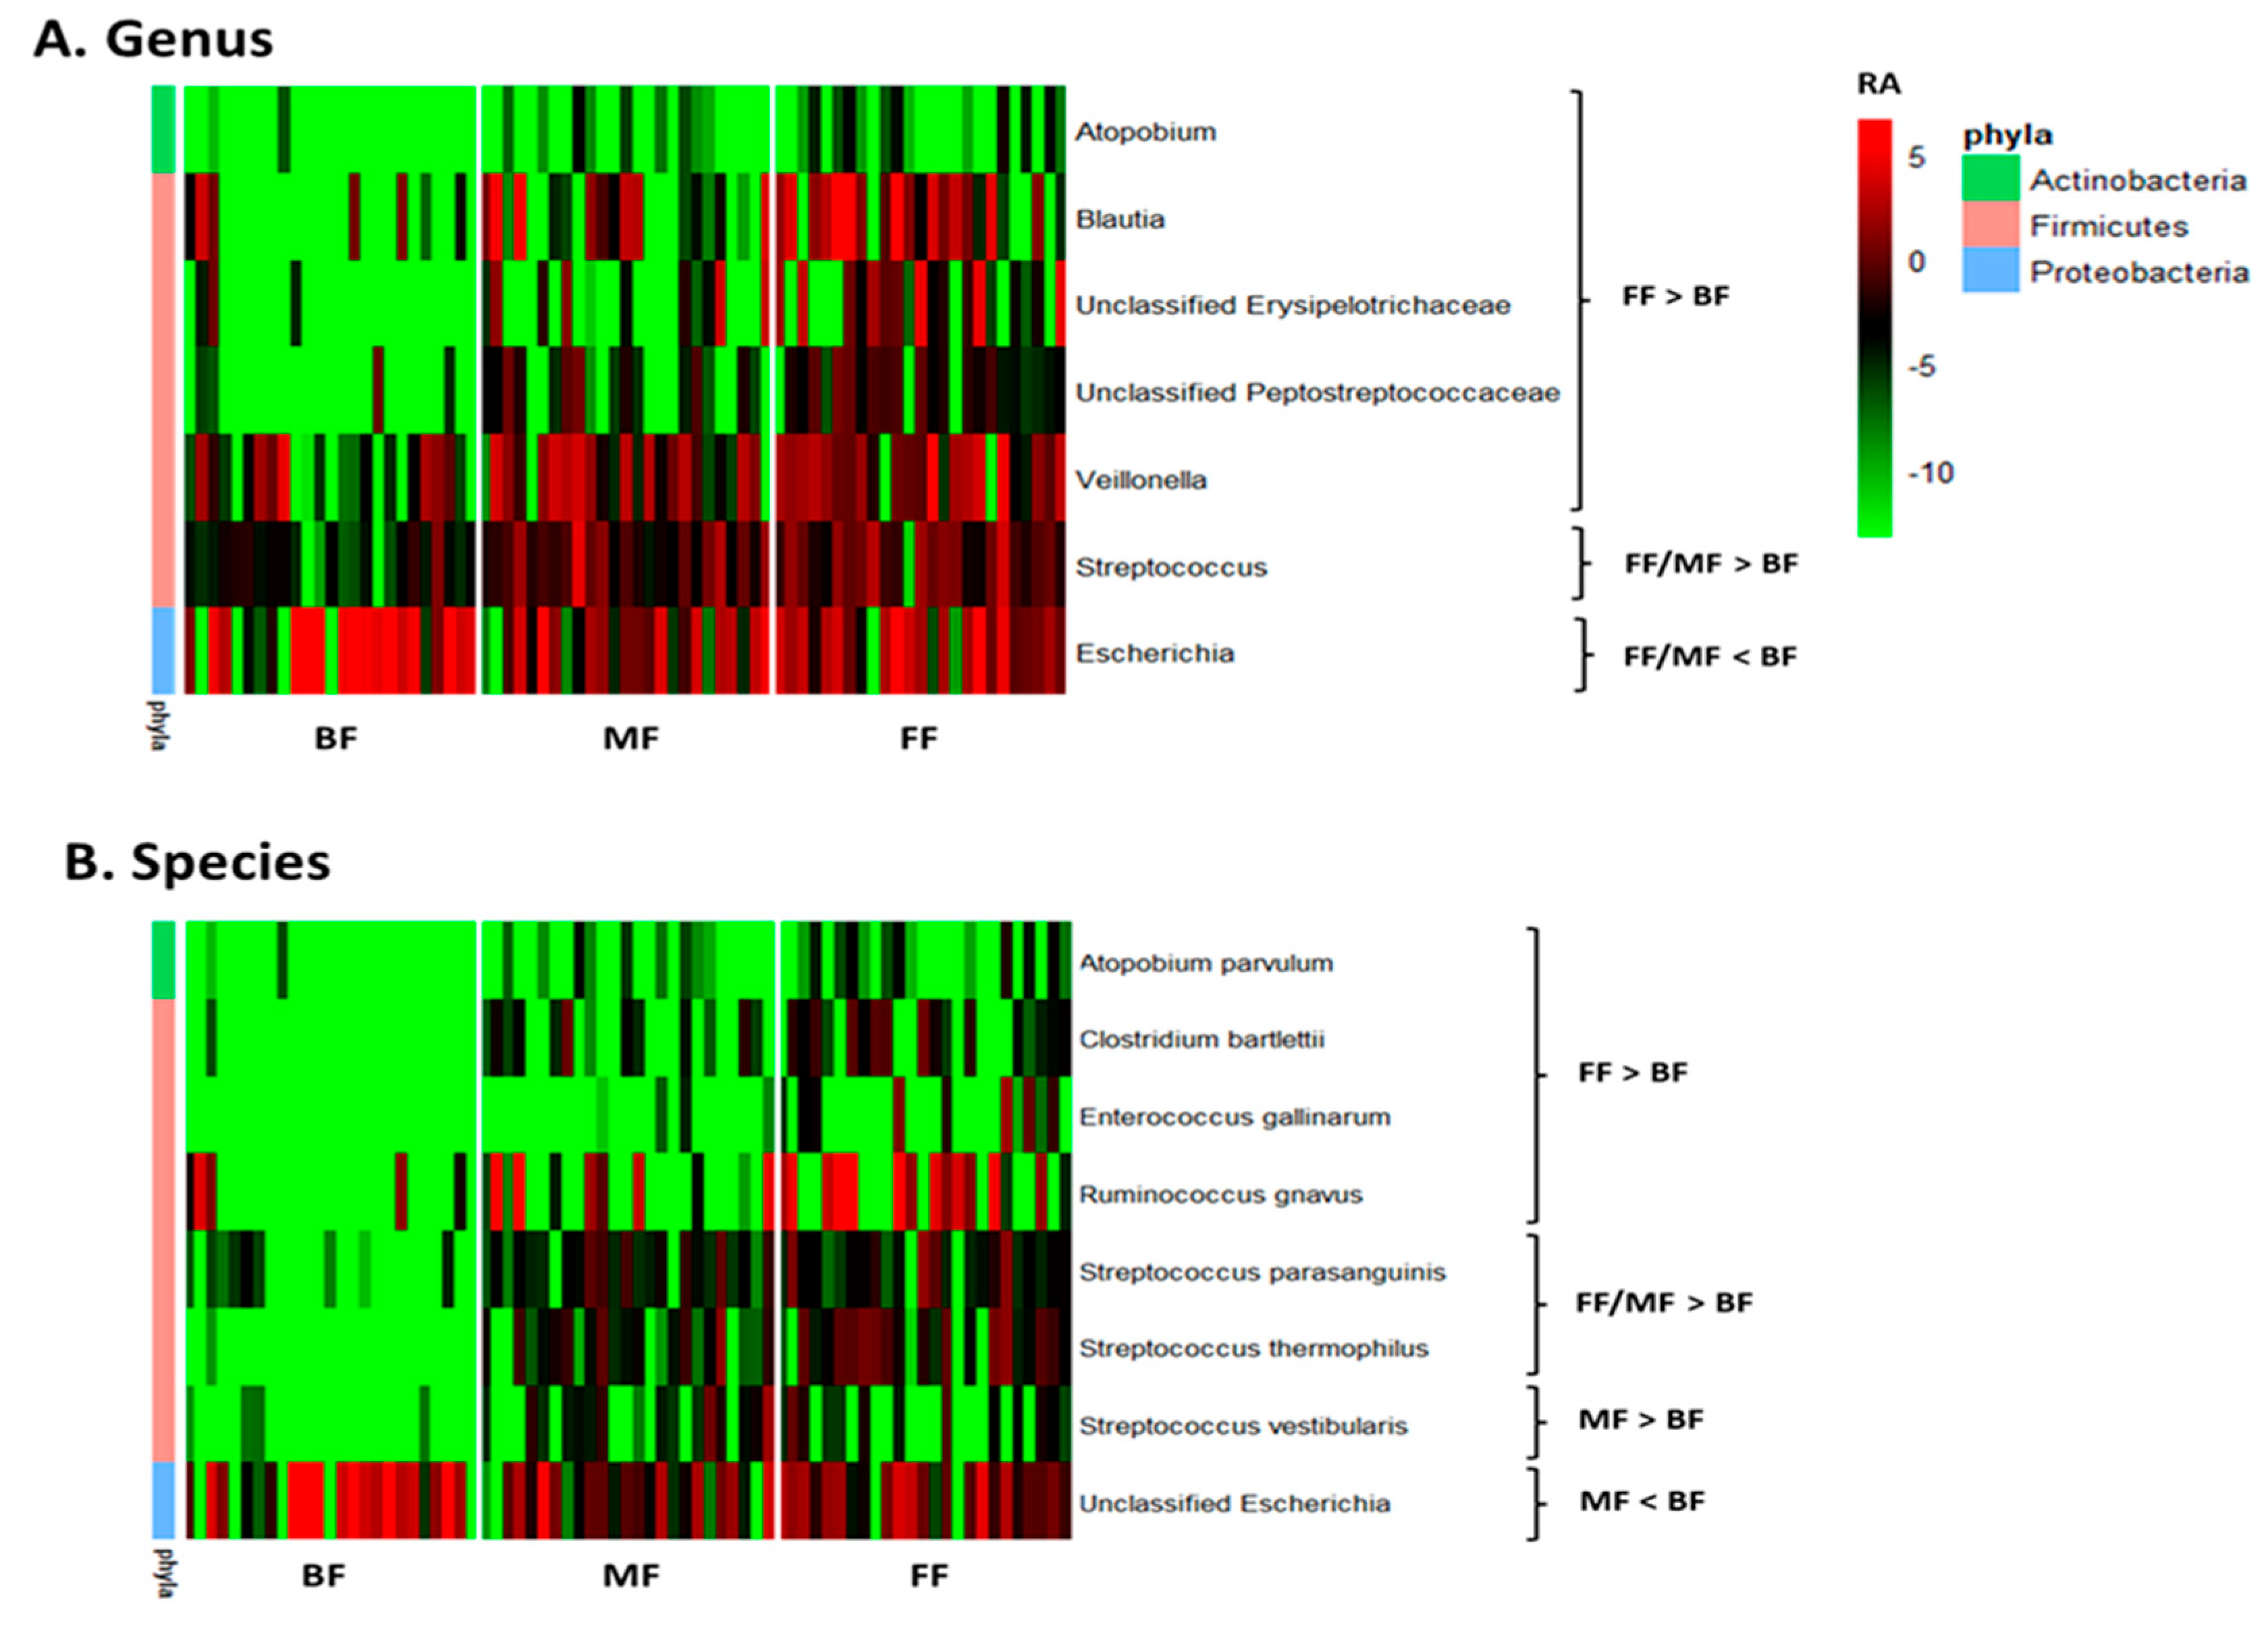
3.2.2. Taxonomic Analysis
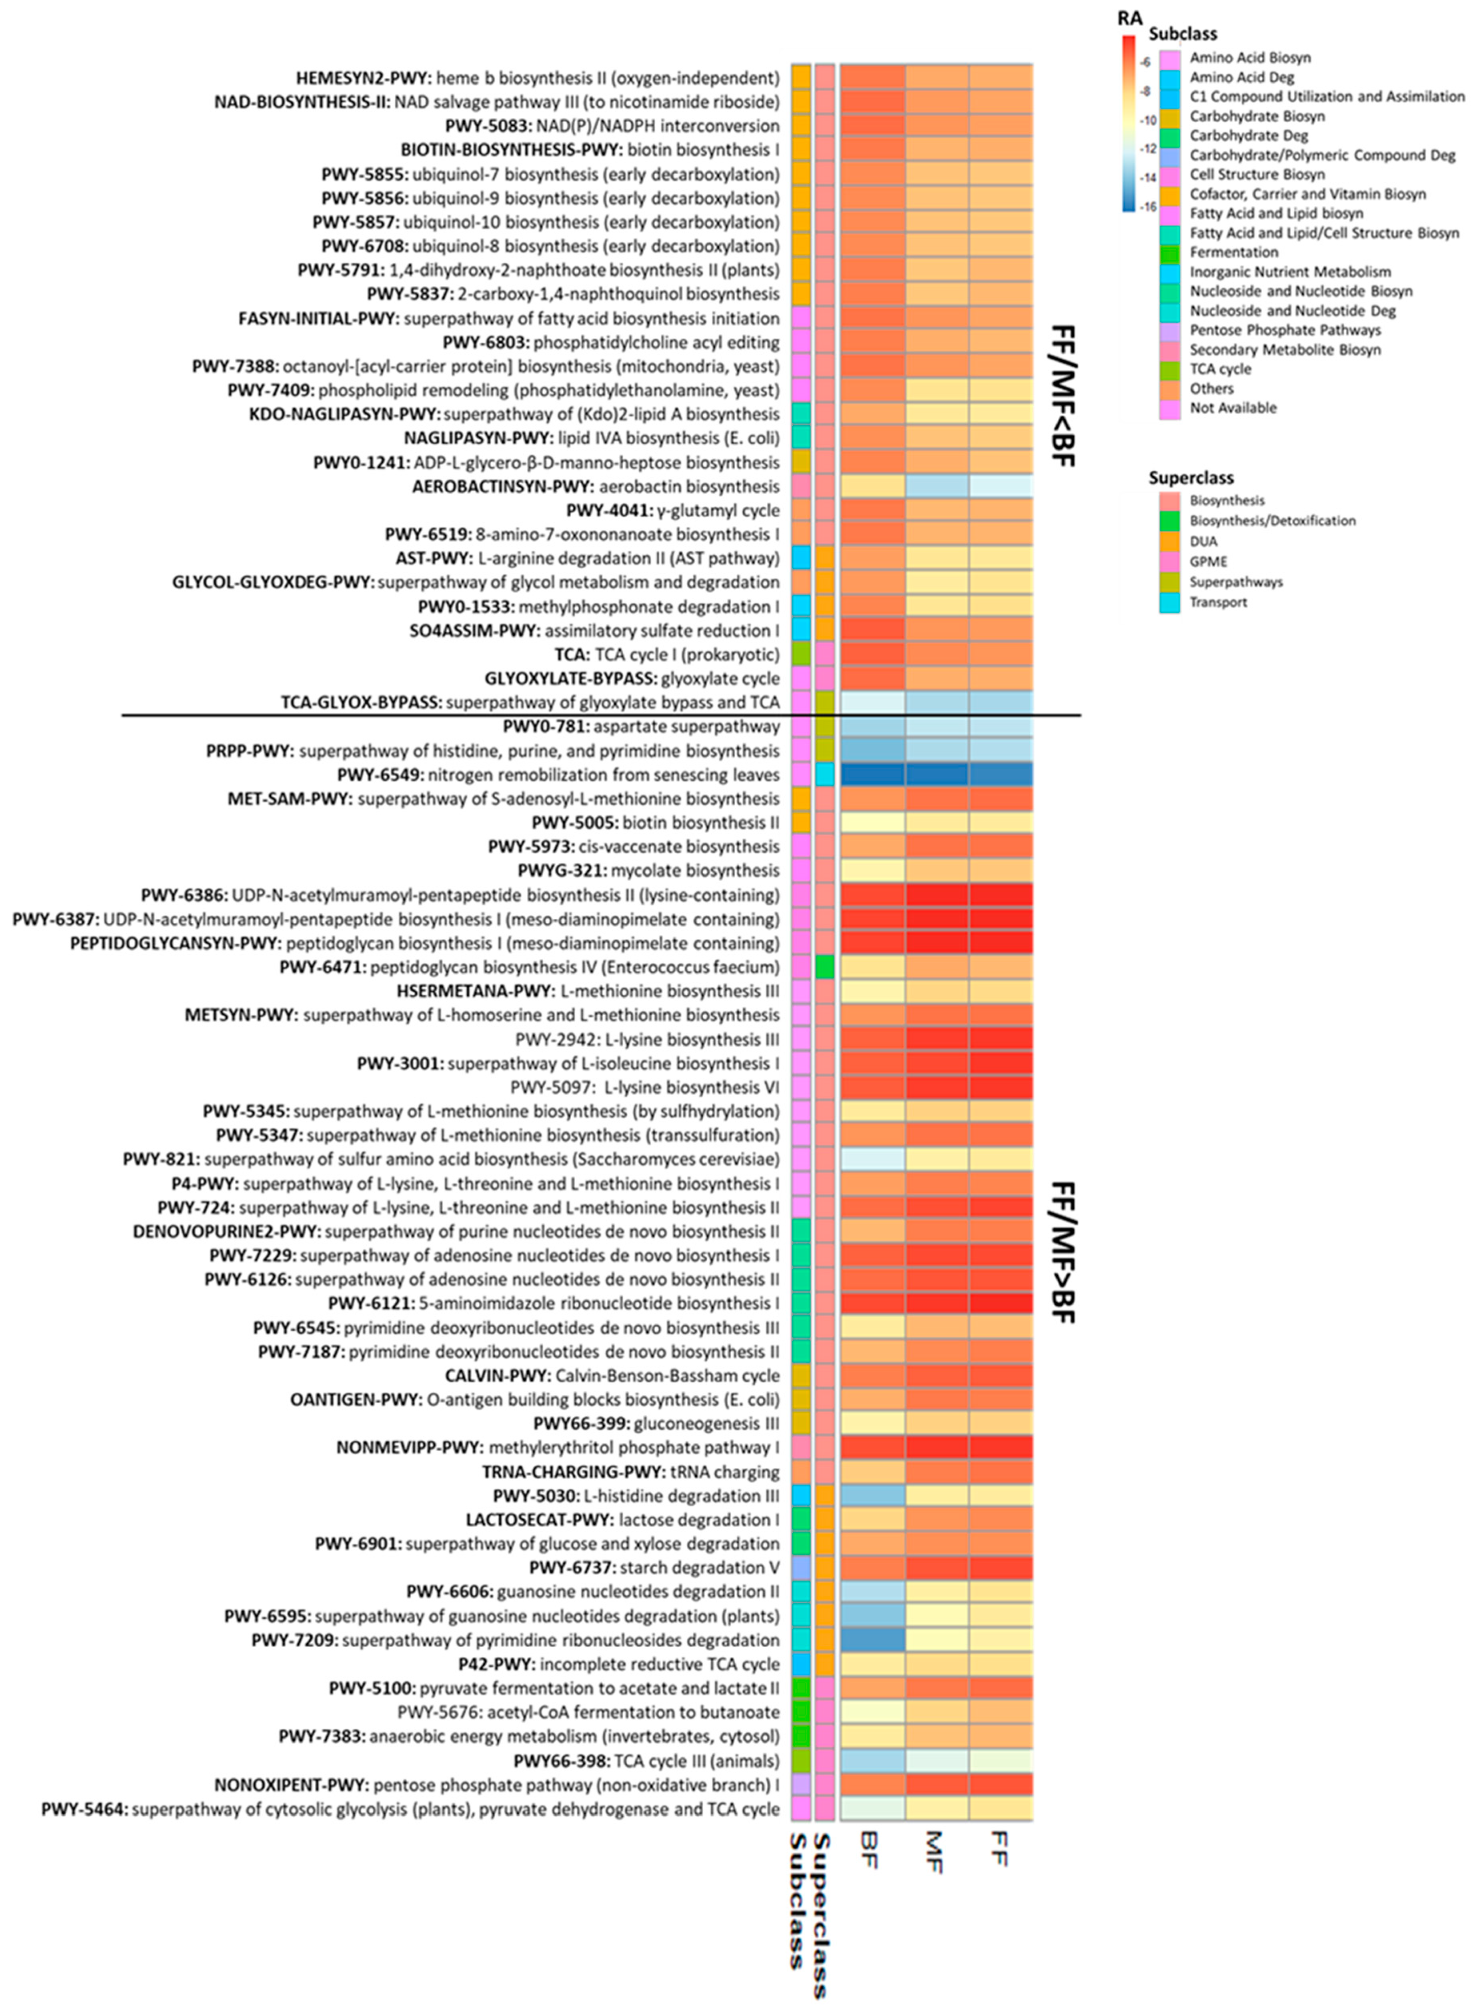
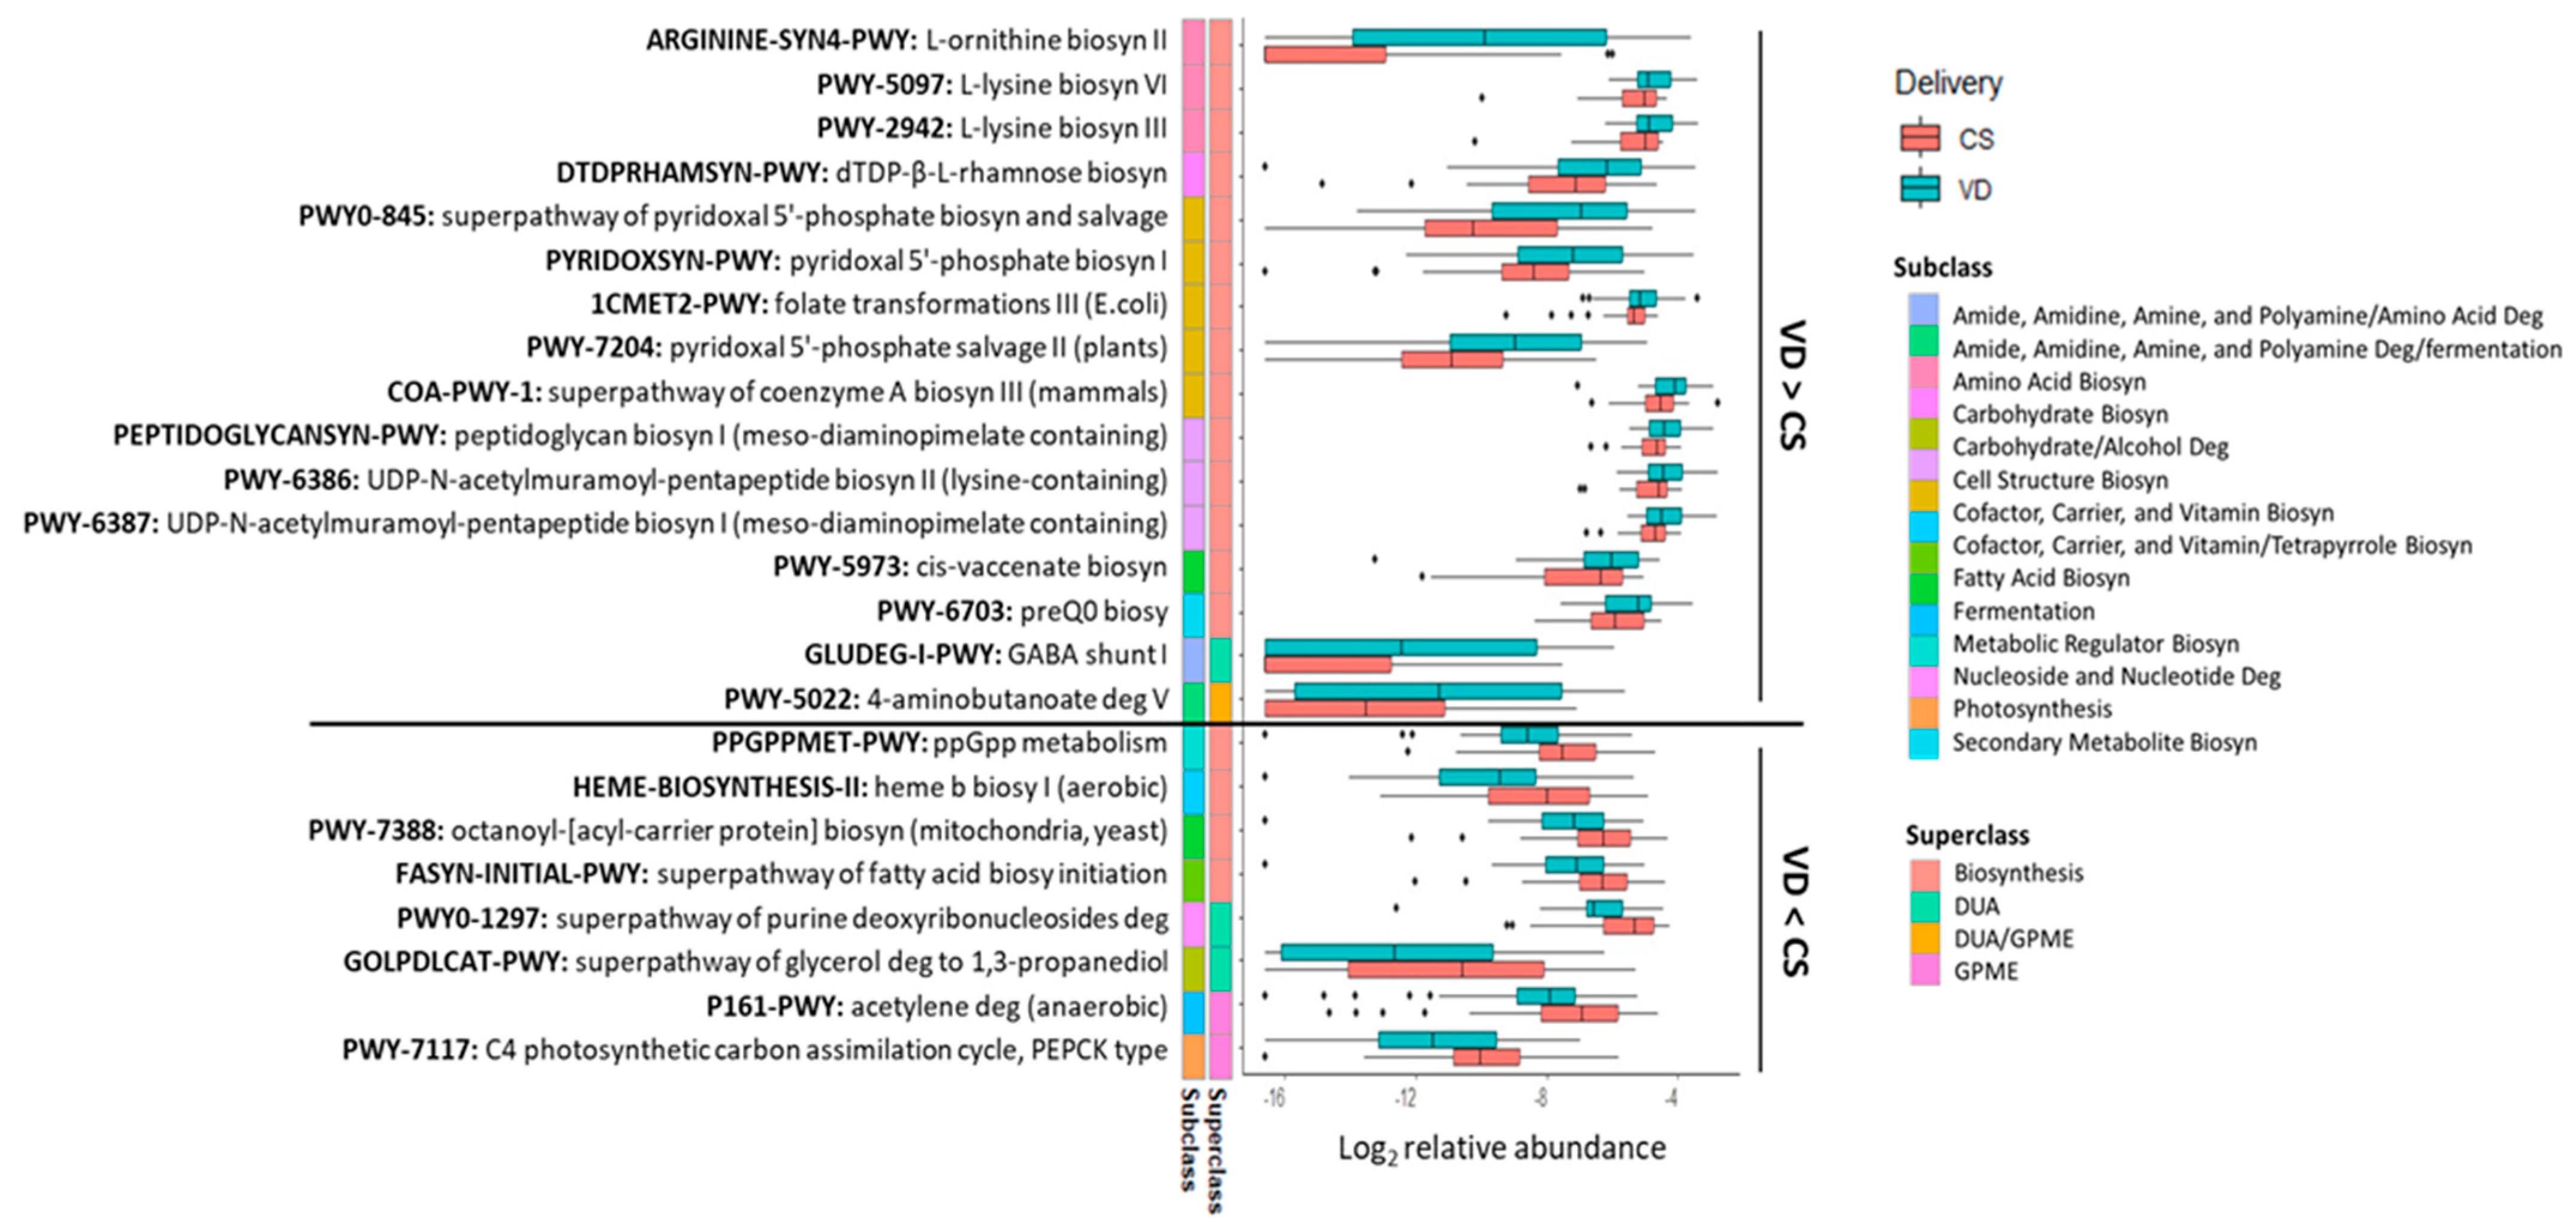
3.2.3. Functional Analysis
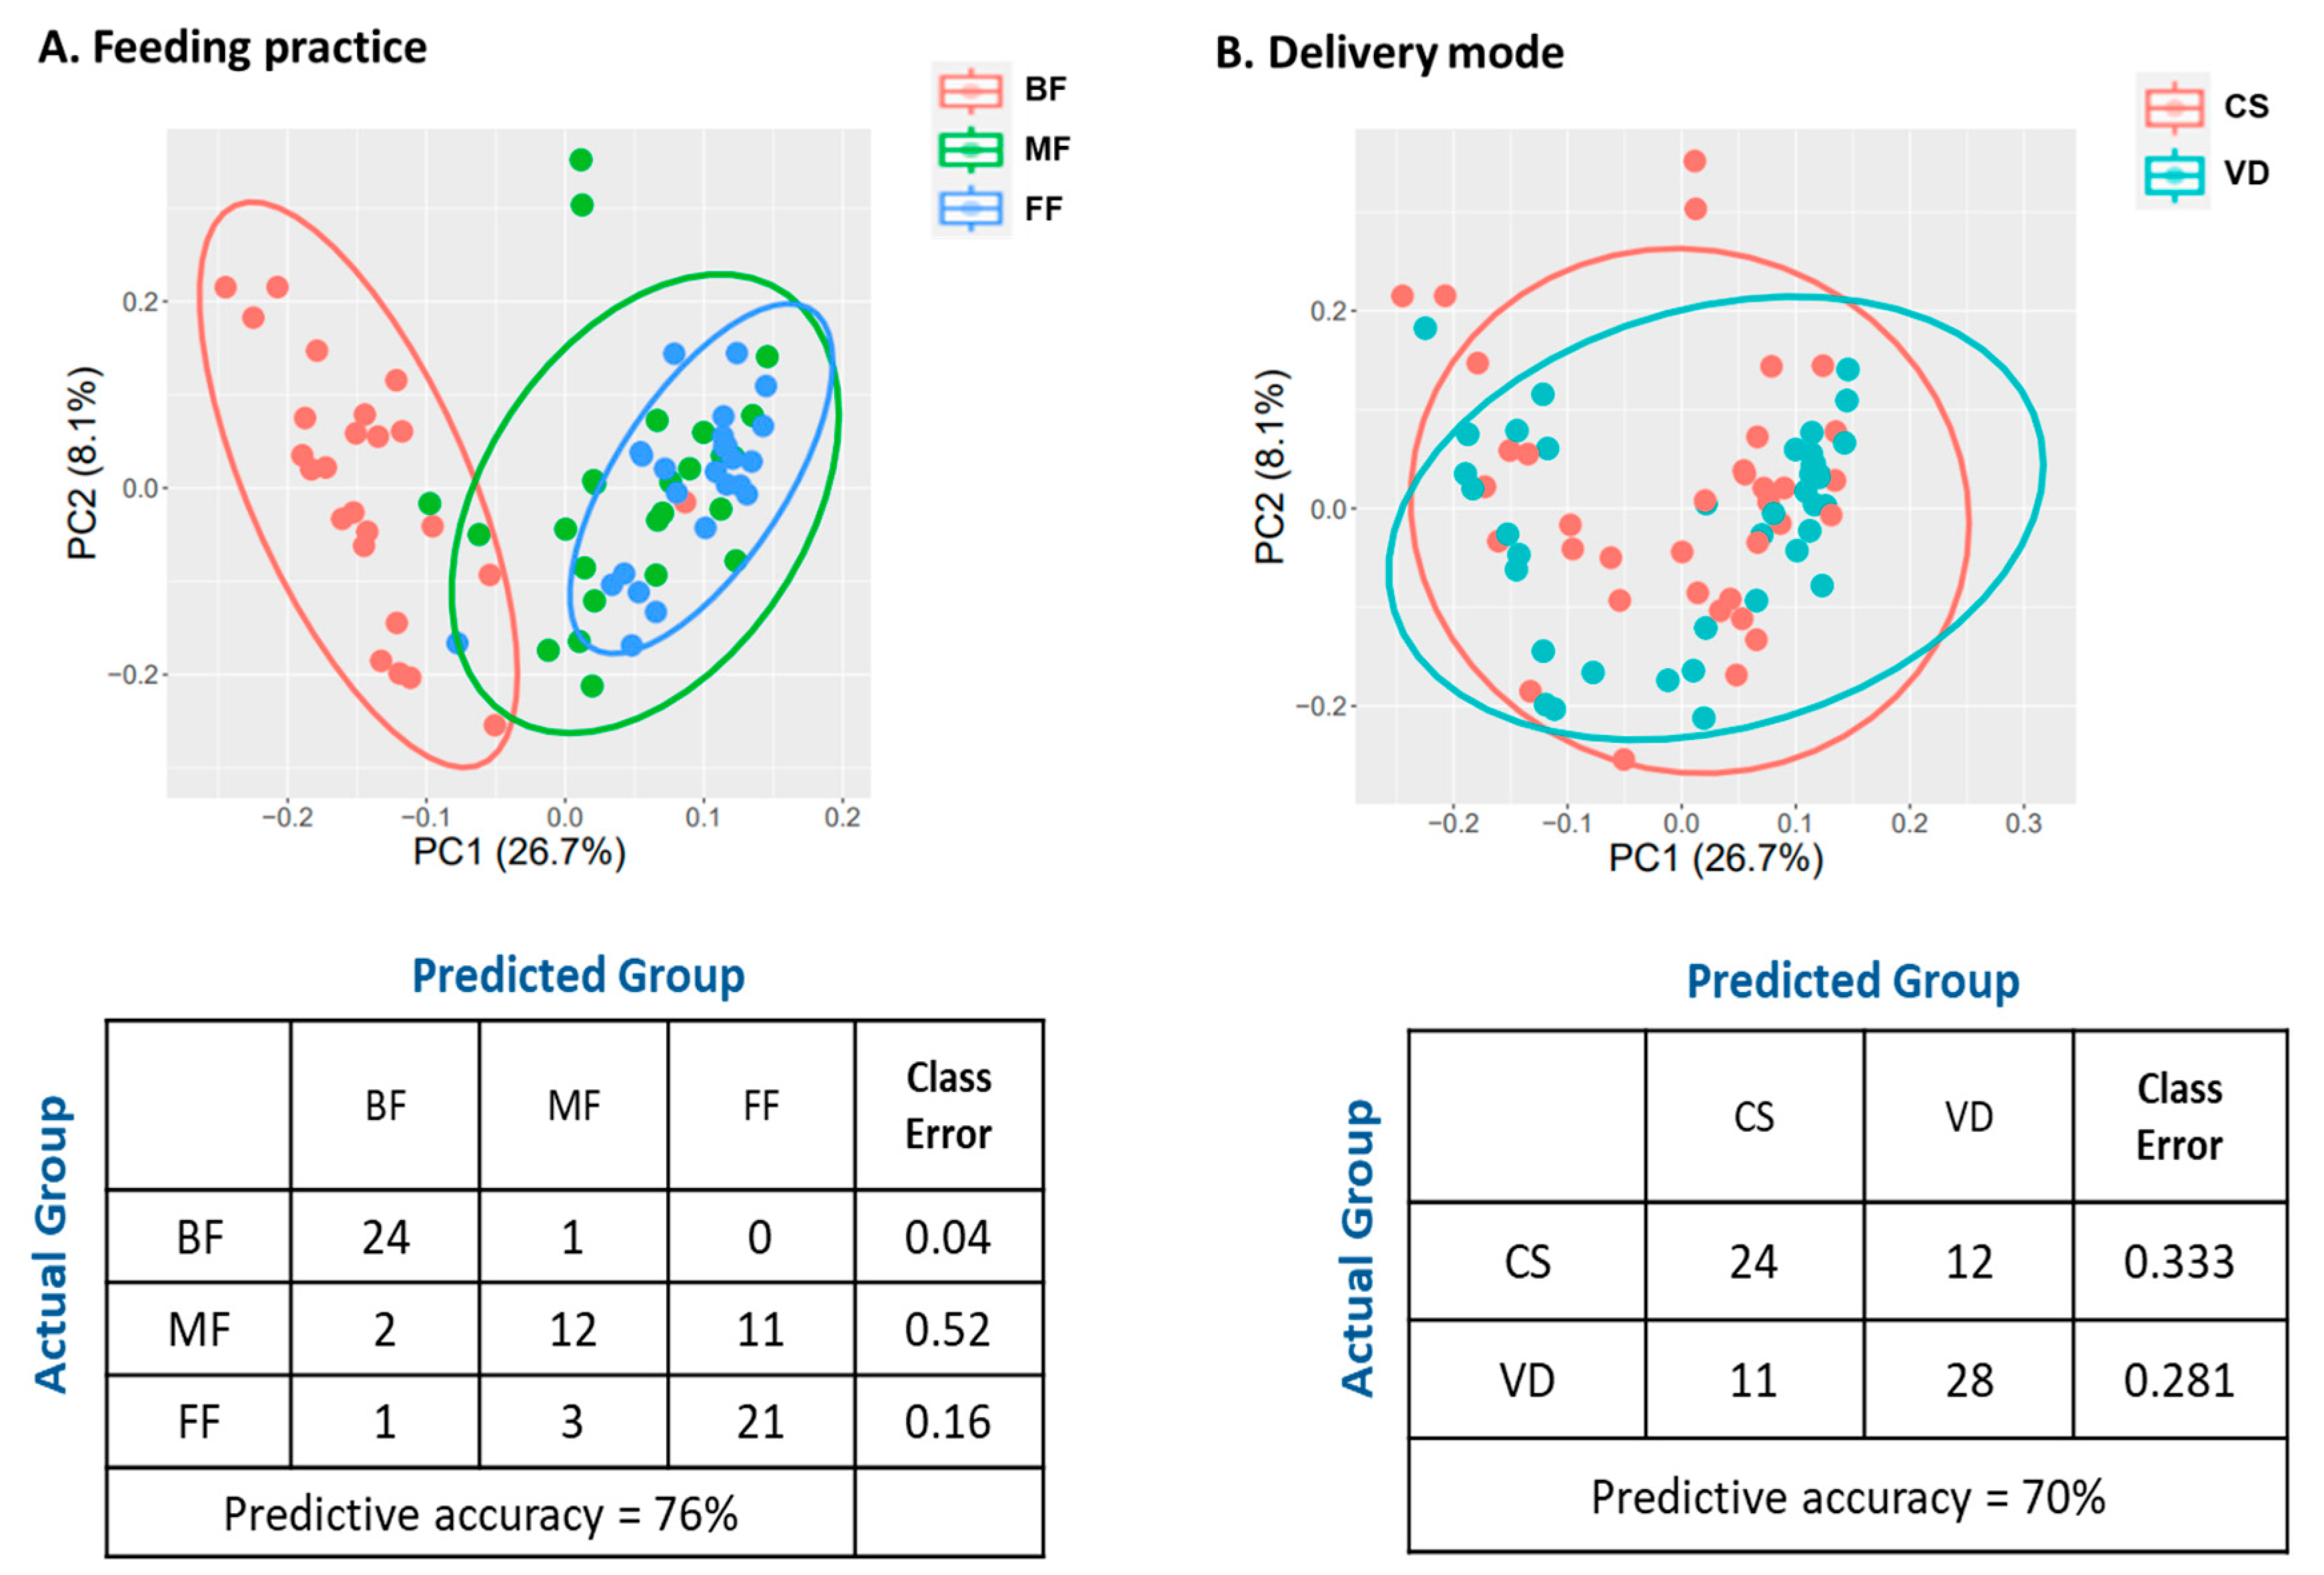
3.3. Feeding Practice and Delivery Mode Influenced Infant Fecal Metabolites
4. Discussion and Conclusions
5. Future Studies
Supplementary Materials
Author Contributions
Funding
Institutional Review Board Statement
Informed Consent Statement
Data Availability Statement
Conflicts of Interest
References
- U.S. Department of Agriculture and U.S. Department of Health and Human Services. Dietary Guidelines for Americans, 2020–2025. Available online: https://www.dietaryguidelines.gov/resources/2020-2025-dietary-guidelines-online-materials (accessed on 9 December 2023).
- Meek, J.Y.; Noble, L. Section on Breastfeeding. Policy Statement: Breastfeeding and the Use of Human Milk. Pediatrics 2022, 150, e2022057988. [Google Scholar] [CrossRef] [PubMed]
- Centers for Disease Control and Prevention. Breastfeeding Report Card–United States. 2022. Available online: https://www.cdc.gov/breastfeeding-data/breastfeeding-report-card/index.html (accessed on 9 December 2023).
- Carr, L.E.; Virmani, M.D.; Rosa, F.; Munblit, D.; Mataze, L.K.S.; Elolimy, A.A.; Yeruva, L. Role of Human Milk Bioactives on Infants’ Gut and Immune Health. Front. Immunol. 2021, 12, 604080. [Google Scholar] [CrossRef] [PubMed]
- Hendricks, G.M.; Guo, M. Bioactive components in human milk. In Human Milk Biochemistry and Infant Formula Manufacturing Technology; Guo, M., Ed.; Elsevier: Amsterdam, The Netherlands, 2014; pp. 33–54. [Google Scholar]
- Yatsunenko, T.; Rey, F.E.; Manary, M.J.; Trehan, I.; Dominguez-Bello, M.G.; Contreras, M.; Magris, M.; Hidalgo, G.; Baldassano, R.N.; Anokhin, A.P.; et al. Human gut microbiome viewed across age and geography. Nature 2012, 486, 222–227. [Google Scholar] [CrossRef] [PubMed]
- Bokulich, N.A.; Chung, J.; Battaglia, T.; Henderson, N.; Jay, M.; Li, H.; D Lieber, A.; Wu, F.; Perez-Perez, G.I.; Chen, Y.; et al. Antibiotics, birth mode, and diet shape microbiome maturation during early life. Sci. Transl. Med. 2016, 8, 343ra82. [Google Scholar] [CrossRef]
- Stewart, C.J.; Ajami, N.J.; O’Brien, J.L.; Hutchinson, D.S.; Smith, D.P.; Wong, M.C.; Ross, M.C.; Lloyd, R.E.; Doddapaneni, H.; Metcalf, G.A.; et al. Temporal development of the gut microbiome in early childhood from the TEDDY study. Nature 2018, 562, 583–588. [Google Scholar] [CrossRef]
- Davis, E.C.; Wang, M.; Donovan, S.M. The role of early life nutrition in the establishment of gastrointestinal microbial composition and function. Gut Microbes 2017, 8, 143–171. [Google Scholar] [CrossRef]
- Wang, M.; Monaco, M.H.; Donovan, S.M. Impact of early gut microbiota on immune and metabolic development and function. Semin. Fetal Neonatal Med. 2016, 21, 380–387. [Google Scholar] [CrossRef]
- Cryan, J.F.; O’Riordan, K.J.; Sandhu, K.; Peterson, V.; Dinan, T.G. The gut microbiome in neurological disorders. Lancet Neurol. 2020, 19, 179–194. [Google Scholar] [CrossRef]
- Xu, D.; Wan, F. Breastfeeding and infant gut microbiota: Influence of bioactive components. Gut Microbes 2024, 17, 2446403. [Google Scholar] [CrossRef]
- García-Mantrana, I.; Selma-Royo, M.; González, S.; Parra-Llorca, A.; Martínez-Costa, C.; Collado, M.C. Distinct maternal microbiota clusters are associated with diet during pregnancy: Impact on neonatal microbiota and infant growth during the first 18 months of life. Gut Microbes 2020, 11, 962–978. [Google Scholar] [CrossRef]
- Suárez-Martínez, C.; Santaella-Pascual, M.; Yagüe-Guirao, G.; Martínez-Graciá, C. Infant gut microbiota colonization: Influence of prenatal and postnatal factors, focusing on diet. Front Microbiol. 2023, 14, 1236254. [Google Scholar] [CrossRef] [PubMed]
- Catassi, G.; Aloi, M.; Giorgio, V.; Gasbarrini, A.; Cammarota, G.; Ianiro, G. The role of diet and nutritional interventions for the infant gut microbiome. Nutrients 2024, 16, 400. [Google Scholar] [CrossRef] [PubMed]
- Jokela, R.; Ponsero, A.J.; Dikareva, E.; Wei, X.; Kolho, K.L.; Korpela, K.; de Vos, W.M.; Salonen, A. sources of gut microbiota variation in a large longitudinal Finnish infant cohort. EBioMedicine 2023, 94, 104695. [Google Scholar] [CrossRef] [PubMed]
- Wang, M.; Radlowski, E.C.; Li, M.; Monaco, M.H.; Donovan, S.M. Feeding mode, but not prebiotics, affects colonic microbiota composition and volatile fatty acid concentrations in sow-reared, formula-fed, and combination-fed piglets. J. Nutr. 2019, 149, 2156–2163. [Google Scholar] [CrossRef]
- Bazanella, M.; Maier, T.V.; Clavel, T.; Lagkouvardos, I.; Lucio, M.; Maldonado-Gòmez, M.X.; Autran, C.; Walter, J.; Bode, L.; Schmitt-Kopplin, P.; et al. Randomized controlled trial on the impact of early-life intervention with bifidobacteria on the healthy infant fecal microbiota and metabolome. Am. J. Clin. Nutr. 2017, 106, 1274–1286. [Google Scholar] [CrossRef]
- Hoen, A.G.; Coker, M.O.; Madan, J.C.; Pathmasiri, W.; McRitchie, S.; Dade, E.F.; Doherty, B.T.; Sumner, S.; Karagas, M.R. Association of cesarean delivery and formula supplementation with the stool metabolome of 6-week-old infants. Metabolites 2021, 11, 702. [Google Scholar] [CrossRef]
- WHO. Caesarean Section Rates Continue to Rise, Amid Growing Inequalities in Access 2021. Available online: https://www.who.int/news/item/16-06-2021-caesarean-section-rates-continue-to-rise-amid-growing-inequalities-in-access (accessed on 12 February 2024).
- WHO. WHO Statement on Caesarean Section Rates. 2015. Available online: https://www.who.int/publications/i/item/WHO-RHR-15.02 (accessed on 12 February 2024).
- Osterman, M.J.K.; Hamilton, B.E.; Martin, J.A.; Driscoll, A.K.; Valenzuela, C.P. Births: Final Data for 2022. National Vital Statistics Reports. 2024. Available online: https://www.cdc.gov/nchs/data/nvsr/nvsr73/nvsr73-02.pdf (accessed on 19 May 2024).
- Milani, C.; Duranti, S.; Bottacini, F.; Casey, E.; Turroni, F.; Mahony, J.; Belzer, C.; Delgado Palacio, S.; Arboleya Montes, S.; Mancabelli, L.; et al. The first microbial colonizers of the human gut: Composition, activities, and health implications of the infant gut microbiota. Microbiol. Mol. Biol. Rev. 2017, 81, e00036-17. [Google Scholar] [CrossRef]
- Zhang, C.; Li, L.; Jin, B.; Xu, X.; Zuo, X.; Li, Y.; Li, Z. The effects of delivery mode on the gut microbiota and health: State of Art. Front. Microbiol. 2021, 12, 724449. [Google Scholar] [CrossRef]
- Angolile, C.M.; Max, B.L.; Mushemba, J.; Mashauri, H.L. Global increased cesarean section rates and public health implications: A call to action. Health Sci. Rep. 2023, 6, e1274. [Google Scholar] [CrossRef]
- Dominguez-Bello, M.G.; Costello, E.K.; Contreras, M.; Magris, M.; Hidalgo, G.; Fierer, N.; Knight, R. Delivery mode shapes the acquisition and structure of the initial microbiota across multiple body habitats in newborns. Proc. Natl. Acad. Sci. USA 2010, 107, 11971–11975. [Google Scholar] [CrossRef]
- Shao, Y.; Forster, S.C.; Tsaliki, E.; Vervier, K.; Strang, A.; Simpson, N.; Kumar, N.; Stares, M.D.; Rodger, A.; Brocklehurst, P.; et al. Stunted microbiota and opportunistic pathogen colonization in caesarean-section birth. Nature 2019, 574, 117–121. [Google Scholar] [CrossRef] [PubMed]
- Mitchell, C.M.; Mazzoni, C.; Hogstrom, L.; Bryant, A.; Bergerat, A.; Cher, A.; Pochan, S.; Herman, P.; Carrigan, M.; Sharp, K.; et al. Delivery mode affects stability of early infant gut microbiota. Cell Rep. Med. 2020, 1, 100156. [Google Scholar] [CrossRef] [PubMed]
- Bäckhed, F.; Roswall, J.; Peng, Y.; Feng, Q.; Jia, H.; Kovatcheva-Datchary, P.; Li, Y.; Xia, Y.; Xie, H.; Zhong, H.; et al. Dynamics and stabilization of the human gut microbiome during the first year of life. Cell Host Microbe 2015, 17, 690–703. [Google Scholar] [CrossRef] [PubMed]
- Makino, H.; Kushiro, A.; Ishikawa, E.; Kubota, H.; Gawad, A.; Sakai, T.; Oishi, K.; Martin, R.; Ben-Amor, K.; Knol, J.; et al. Mother-to-infant transmission of intestinal bifidobacterial strains has an impact on the early development of vaginally delivered infant’s microbiota. PLoS ONE 2013, 8, e78331. [Google Scholar] [CrossRef] [PubMed]
- Yassour, M.; Vatanen, T.; Siljander, H.; Hämäläinen, A.M.; Härkönen, T.; Ryhänen, S.J.; Franzosa, E.A.; Vlamakis, H.; Huttenhower, C.; Gevers, D.; et al. Natural history of the infant gut microbiome and impact of antibiotic treatment on bacterial strain diversity and stability. Sci. Transl. Med. 2016, 8, 343ra81. [Google Scholar] [CrossRef]
- Reyman, M.; van Houten, M.A.; van Baarle, D.; Bosch, A.A.T.M.; Man, W.H.; Chu, M.L.J.N.; Arp, K.; Watson, R.L.; Sanders, E.A.M.; Fuentes, S.; et al. Impact of delivery mode-associated gut microbiota dynamics on health in the first year of life. Nat. Commun. 2019, 10, 4997. [Google Scholar] [CrossRef]
- Li, N.; Liang, S.; Chen, Q.; Zhao, L.; Li, B.; Huo, G. Distinct gut microbiota and metabolite profiles induced by delivery mode in healthy Chinese infants. J. Proteom. 2021, 232, 104071. [Google Scholar] [CrossRef]
- Zierer, J.; Jackson, M.A.; Kastenmüller, G.; Mangino, M.; Long, T.; Telenti, A.; Mohney, R.P.; Small, K.S.; Bell, J.T.; Steves, C.J.; et al. The fecal metabolome as a functional readout of the gut microbiome. Nat. Genet. 2018, 50, 790–795. [Google Scholar] [CrossRef]
- Fiese, B.H.; Musaad, S.; Bost, K.K.; McBride, B.A.; Lee, S.Y.; Teran-Garcia, M.; Donovan, S.M. The STRONG Kids 2 birth cohort study: A cell-to-society approach to dietary habits and weight trajectories across the first 5 years of life. Curr. Dev. Nutr. 2019, 3, nzz007. [Google Scholar] [CrossRef]
- Vogel, M. childsds: Data and Methods Around Reference Values in Pediatrics. R Package Version 0.8.0. 2022. Available online: https://cran.r-project.org/web/packages/childsds/childsds.pdf (accessed on 20 November 2022).
- Reznikov, E.A.; Comstock, S.S.; Hoeflinger, J.L.; Wang, M.; Miller, M.J.; Donovan, S.M. Dietary bovine lactoferrin reduces Staphylococcus aureus in the tissues and modulates the immune response in piglets systemically infected with S. Aureus. Curr. Dev. Nutr. 2017, 2, nzy001. [Google Scholar] [CrossRef]
- Ellis, J.L.; Wang, M.; Fu, X.; Fields, C.J.; Donovan, S.M.; Booth, S.L. Feeding Practice and Delivery Mode Are Determinants of Vitamin K in the Infant Gut: An Exploratory Analysis. Curr. Dev. Nutr. 2022, 6, nzac019. [Google Scholar] [CrossRef] [PubMed]
- Bolger, A.M.; Lohse, M.; Usadel, B. Trimmomatic: A flexible trimmer for Illumina sequence data. Bioinformatics 2014, 30, 2114–2120. [Google Scholar] [CrossRef] [PubMed]
- Andrews, S. FastQC: A Quality Control Tool for High Throughput Sequence Data. 2010. Available online: https://rpkgs.datanovia.com/fastqcr/index.html (accessed on 12 February 2022).
- Ewels, P.; Magnusson, M.; Lundin, S.; Käller, M. MultiQC: Summarize analysis results for multiple tools and samples in a single report. Bioinformatics 2016, 32, 3047–3048. [Google Scholar] [CrossRef] [PubMed]
- Rognes, T.; Flouri, T.; Nichols, B.; Quince, C.; Mahé, F. VSEARCH: A versatile open source tool for metagenomics. PeerJ 2016, 4, e2584. [Google Scholar] [CrossRef]
- Truong, D.T.; Franzosa, E.A.; Tickle, T.L.; Scholz, M.; Weingart, G.; Pasolli, E.; Tett, A.; Huttenhower, C.; Segata, N. MetaPhlAn2 for enhanced metagenomic taxonomic profiling. Nat. Methods 2015, 12, 902–903. [Google Scholar] [CrossRef]
- Franzosa, E.A.; McIver, L.J.; Rahnavard, G.; Thompson, L.R.; Schirmer, M.; Weingart, G.; Lipson, K.S.; Knight, R.; Caporaso, J.G.; Segata, N.; et al. Species-level functional profiling of metagenomes and metatranscriptomes. Nat. Methods 2018, 15, 962–968. [Google Scholar] [CrossRef]
- Caspi, R.; Billington, R.; Fulcher, C.A.; Keseler, I.M.; Kothari, A.; Krummenacker, M.; Latendresse, M.; Midford, P.E.; Ong, Q.; Ong, W.K.; et al. The MetaCyc database of metabolic pathways and enzymes. Nucleic Acids Res. 2018, 46, D633–D639. [Google Scholar] [CrossRef]
- Arrieta, M.C.; Stiemsma, L.T.; Dimitriu, P.A.; Thorson, L.; Russell, S.; Yurist-Doutsch, S.; Kuzeljevic, B.; Gold, M.J.; Britton, H.M.; Lefebvre, D.L.; et al. Early infancy microbial and metabolic alterations affect risk of childhood asthma. Sci. Transl. Med. 2015, 7, 307ra152. [Google Scholar] [CrossRef]
- Do, K.T.; Pietzner, M.; Rasp, D.J.; Friedrich, N.; Nauck, M.; Kocher, T.; Suhre, K.; Mook-Kanamori, D.O.; Kastenmüller, G.; Krumsiek, J. Phenotype-driven identification of modules in a hierarchical map of multifluid metabolic correlations. NPJ Syst. Biol. Appl. 2017, 3, 28. [Google Scholar] [CrossRef]
- Oksanen, J.; Simpson, G.; Blanchet, F.; Kindt, R.; Legendre, P.; Minchin, P.; O’Hara, R.; Solymos, P.; Stevens, M.; Szoecs, E.; et al. Vegan: Community Ecology Package. R Package Version 2.6-4. 2022. Available online: https://CRAN.R-project.org/package=vegan (accessed on 19 July 2022).
- McMurdie, P.J.; Holmes, S. phyloseq: An R package for reproducible interactive analysis and graphics of microbiome census data. PLoS ONE 2013, 8, e61217. [Google Scholar] [CrossRef]
- Bolyen, E.; Rideout, J.R.; Dillon, M.R.; Bokulich, N.A.; Abnet, C.C.; Al-Ghalith, G.A.; Alexander, H.; Alm, E.J.; Arumugam, M.; Asnicar, F.; et al. Reproducible, interactive, scalable and extensible microbiome data science using QIIME 2. Nat. Biotechnol. 2019, 37, 852–857. [Google Scholar] [CrossRef] [PubMed]
- Mallick, H.; Rahnavard, A.; McIver, L.J.; Ma, S.; Zhang, Y.; Nguyen, L.H.; Tickle, T.L.; Weingart, G.; Ren, B.; Schwager, E.H.; et al. Multivariable association discovery in population-scale meta-omics studies. PLoS Comput. Biol. 2021, 17, e1009442. [Google Scholar] [CrossRef] [PubMed]
- Yu, G.; Xu, C.; Zhang, D.; Ju, F.; Ni, Y. MetOrigin: Discriminating the origins of microbial metabolites for integrative analysis of the gut microbiome and metabolome. iMeta 2022, 1, e10. [Google Scholar] [CrossRef] [PubMed]
- Ho, N.T.; Li, F.; Lee-Sarwar, K.A.; Tun, H.M.; Brown, B.P.; Pannaraj, P.S.; Bender, J.M.; Azad, M.B.; Thompson, A.L.; Weiss, S.T.; et al. Meta-analysis of effects of exclusive breastfeeding on infant gut microbiota across populations. Nat. Commun. 2018, 9, 4169. [Google Scholar] [CrossRef]
- Forbes, J.D.; Azad, M.B.; Vehling, L.; Tun, H.M.; Konya, T.B.; Guttman, D.S.; Field, C.J.; Lefebvre, D.; Sears, M.R.; Becker, A.B.; et al. Association of exposure to formula in the hospital and subsequent infant feeding practices with gut microbiota and risk of overweight in the first year of life. JAMA Pediatr. 2018, 172, e181161. [Google Scholar] [CrossRef]
- Fehr, K.; Moossavi, S.; Sbihi, H.; Boutin, R.C.T.; Bode, L.; Robertson, B.; Yonemitsu, C.; Field, C.J.; Becker, A.B.; Mandhane, P.J.; et al. Breastmilk feeding practices are associated with the co-occurrence of bacteria in mothers’ milk and the infant gut: The CHILD cohort study. Cell Host Microbe 2020, 28, 285–297.e4. [Google Scholar] [CrossRef]
- Madan, J.C.; Hoen, A.G.; Lundgren, S.N.; Farzan, S.F.; Cottingham, K.L.; Morrison, H.G.; Sogin, M.L.; Li, H.; Moore, J.H.; Karagas, M.R. Association of cesarean delivery and formula supplementation with the intestinal microbiome of 6-week-old infants. JAMA Pediatr. 2016, 170, 212–219. [Google Scholar] [CrossRef]
- Li, N.; Yan, F.; Wang, N.; Song, Y.; Yue, Y.; Guan, J.; Li, B.; Huo, G. Distinct gut microbiota and metabolite profiles induced by different feeding methods in healthy Chinese infants. Front. Microbiol. 2020, 11, 714. [Google Scholar] [CrossRef]
- Brink, L.R.; Mercer, K.E.; Piccolo, B.D.; Chintapalli, S.V.; Elolimy, A.; Bowlin, A.K.; Matazel, K.S.; Pack, L.; Adams, S.H.; Shankar, K.; et al. Neonatal diet alters fecal microbiota and metabolome profiles at different ages in infants fed breast milk or formula. Am. J. Clin. Nutr. 2020, 111, 1190–1202. [Google Scholar] [CrossRef]
- Kim, G.; Bae, J.; Kim, M.J.; Kwon, H.; Park, G.; Kim, S.J.; Choe, Y.H.; Kim, J.; Park, S.H.; Choe, B.H.; et al. Delayed establishment of gut microbiota in infants delivered by cesarean section. Front. Microbiol. 2020, 11, 2099. [Google Scholar] [CrossRef]
- Coker, M.O.; Laue, H.E.; Hoen, A.G.; Hilliard, M.; Dade, E.; Li, Z.; Palys, T.; Morrison, H.G.; Baker, E.; Karagas, M.R.; et al. Infant feeding alters the longitudinal impact of birth mode on the development of the gut microbiota in the first year of life. Front. Microbiol. 2021, 12, 642197. [Google Scholar] [CrossRef] [PubMed]
- Ma, X.; Ding, J.; Ren, H.; Xin, Q.; Li, Z.; Han, L.; Liu, D.; Zhuo, Z.; Liu, C.; Ren, Z. Distinguishable influence of the delivery mode, feeding pattern, and infant sex on dynamic alterations in the intestinal microbiota in the first year of life. Microb. Ecol. 2023, 86, 1799–1813. [Google Scholar] [CrossRef] [PubMed]
- Nishijima, S.; Suda, W.; Oshima, K.; Kim, S.W.; Hirose, Y.; Morita, H.; Hattori, M. The gut microbiome of healthy Japanese and its microbial and functional uniqueness. DNA Res. 2016, 23, 125–133. [Google Scholar] [CrossRef] [PubMed]
- Jost, T.; Lacroix, C.; Braegger, C.P.; Chassard, C. New insights in gut microbiota establishment in healthy breast fed neonates. PLoS ONE 2012, 7, e44595. [Google Scholar] [CrossRef]
- Marcobal, A.; Barboza, M.; Sonnenburg, E.D.; Pudlo, N.; Martens, E.C.; Desai, P.; Lebrilla, C.B.; Weimer, B.C.; Mills, D.A.; German, J.B.; et al. Bacteroides in the infant gut consume milk oligosaccharides via mucus-utilization pathways. Cell Host Microbe 2011, 10, 507–514. [Google Scholar] [CrossRef]
- Troy, E.B.; Kasper, D.L. Beneficial effects of Bacteroides fragilis polysaccharides on the immune system. Front. Biosci. 2010, 15, 25–34. [Google Scholar] [CrossRef]
- Wang, C.; Zhao, J.; Zhang, H.; Lee, Y.K.; Zhai, Q.; Chen, W. Roles of intestinal Bacteroides in human health and diseases. Crit. Rev. Food. Sci. Nutr. 2021, 61, 3518–3536. [Google Scholar] [CrossRef]
- Cui, Y.; Zhang, L.; Wang, X.; Yi, Y.; Shan, Y.; Liu, B.; Zhou, Y.; Lü, X. Roles of intestinal Parabacteroides in human health and diseases. FEMS Microbiol. Lett. 2022, 369, fnac072. [Google Scholar] [CrossRef]
- Rutayisire, E.; Huang, K.; Liu, Y.; Tao, F. The mode of delivery affects the diversity and colonization pattern of the gut microbiota during the first year of infants’ life: A systematic review. BMC Gastroenterol. 2016, 16, 86. [Google Scholar] [CrossRef]
- Mueller, N.T.; Differding, M.K.; Østbye, T.; Hoyo, C.; Benjamin-Neelon, S.E. Association of birth mode of delivery with infant faecal microbiota, potential pathobionts, and short chain fatty acids: A longitudinal study over the first year of life. BJOG Int. J. Obstet. Gynaecol. 2021, 128, 1293–1303. [Google Scholar] [CrossRef]
- Hammons, J.L.; Jordan, W.E.; Stewart, R.L.; Taulbee, J.D.; Berg, R.W. Age and diet effects on fecal bile acids in infants. J. Pediatr. Gastroenterol. Nutr. 1988, 7, 30–38. [Google Scholar] [CrossRef] [PubMed]
- Sillner, N.; Walker, A.; Lucio, M.; Maier, T.V.; Bazanella, M.; Rychlik, M.; Haller, D.; Schmitt-Kopplin, P. Longitudinal profiles of dietary and microbial metabolites in formula- and breastfed infants. Front. Mol. Biosci. 2021, 8, 660456. [Google Scholar] [CrossRef] [PubMed]
- Łukawska, A.; Mulak, A. Impact of primary and secondary bile acids on Clostridioides difficile infection. Pol. J. Microbiol. 2022, 71, 11–18. [Google Scholar] [CrossRef] [PubMed]
- Collins, S.L.; Stine, J.G.; Bisanz, J.E.; Okafor, C.D.; Patterson, A.D. Bile acids and the gut microbiota: Metabolic interactions and impacts on disease. Nat. Rev. Microbiol. 2023, 21, 236–247. [Google Scholar] [CrossRef]
- Labbé, A.; Ganopolsky, J.G.; Martoni, C.J.; Prakash, S.; Jones, M.L. Bacterial bile metabolising gene abundance in Crohn’s, ulcerative colitis and type 2 diabetes metagenomes. PLoS ONE 2014, 9, e115175. [Google Scholar] [CrossRef] [PubMed] [PubMed Central]
- Ocvirk, S.; O’Keefe, S.J.D. Dietary fat, bile acid metabolism and colorectal cancer. Semin. Cancer Biol. 2021, 73, 347–355. [Google Scholar] [CrossRef]
- Yu, J.; Zhang, H.; Chen, L.; Ruan, Y.; Chen, Y.; Liu, Q. Disease-associated gut microbiota reduces the profile of secondary bile acids in pediatric nonalcoholic fatty liver disease. Front. Cell. Infect. Microbiol. 2021, 11, 698852. [Google Scholar] [CrossRef]


| BF | MF | FF | p Value | ||||||
|---|---|---|---|---|---|---|---|---|---|
| VD | CS | VD | CS | VD | CS | Feeding | Delivery | Interaction | |
| n = | 13 | 12 | 13 | 12 | 13 | 12 | - | - | - |
| Male, n (%) | 6 (46.2) | 6 (50) | 5 (38.5) | 7 (58.3) | 6 (46.2) | 6 (50) | 1 | 0.573 | - |
| Gestational age at birth, wk | 39.5 ± 0.39 | 39.8 ± 0.42 | 39.5 ± 0.39 | 39.6 ± 0.29 | 39.3 ± 0.29 | 39.2 ± 0.41 | 0.520 | 0.696 | 0.783 |
| Weight-for-length z-score | |||||||||
| At birth | −0.12 ± 0.42 | 0.13 ± 0.54 | −0.90 ± 0.34 | −0.67 ± 0.47 | −0.64 ± 0.33 | −0.98 ± 0.39 | 0.091 | 0.898 | 0.732 |
| At 6 wk | 0.76 ± 0.33 | 0.08 ± 0.36 | −0.18 ± 0.18 | 0.26 ± 0.40 | 0.03 ± 0.23 | −0.03 ± 0.41 | 0.378 | 0.713 | 0.247 |
| Antibiotic intake 2 wk prior to sample collection, n | 1 | 0 | 0 | 0 | 0 | 2 | 0.346 | 0.951 | - |
| Infant ethnicity, n | 0.860 | 0.170 | - | ||||||
| Non-Hispanic/Latino white | 11 | 8 | 10 | 6 | 7 | 7 | |||
| Non-Hispanic/Latino non-white | 1 | 3 | 0 | 5 | 4 | 3 | |||
| Hispanic/Latino | 1 | 0 | 1 | 1 | 2 | 1 | |||
| Not reported | 0 | 1 | 2 | 0 | 0 | 1 | |||
| Breastmilk consumed at 6 wk, % | 100 | 100 | 46.4 ± 8.86 # | 61.6 ± 9.99 # | 0 | 0 | - | - | - |
| Maternal age, year | 32.5 ± 0.96 | 32.7 ± 1.33 | 30.7 ± 1.05 | 29.9 ± 1.63 | 28.2 ± 1.53 | 27.0 ± 1.87 | 0.003 | 0.590 | 0.888 |
| Prepregnancy BMI | 27.0 ± 1.50 | 29.5 ± 1.98 | 28.6 ± 2.22 | 31.6 ± 3.54 | 27.8 ± 2.16 | 35.8 ± 2.74 | 0.329 | 0.022 | 0.434 |
| BF | MF | FF | p Value | ||||||
|---|---|---|---|---|---|---|---|---|---|
| VD | CS | VD | CS | VD | CS | Feeding | Delivery | Interaction | |
| Genus | |||||||||
| Shannon | 0.75 ± 0.11 | 0.67 ± 0.16 | 1.33 ± 0.16 | 1.51 ± 0.12 | 1.35 ± 0.13 | 1.47 ± 0.13 | <0.001 | 0.534 | 0.610 |
| Inverse Simpson | 1.85 ± 0.17 | 1.81 ± 0.31 | 3.13 ± 0.42 | 3.55 ± 0.45 | 3.04 ± 0.42 | 3.36 ± 0.71 | <0.001 | 0.619 | 0.619 |
| Evenness | 0.31 ± 0.04 | 0.25 ± 0.06 | 0.43 ± 0.05 | 0.51 ± 0.03 | 0.42 ± 0.04 | 0.47 ± 0.03 | <0.001 | 0.617 | 0.219 |
| Species | |||||||||
| Shannon | 1.11 ± 0.11 | 0.96 ± 0.12 | 1.67 ± 0.17 | 1.89 ± 0.18 | 1.77 ± 0.15 | 2.00 ± 0.11 | <0.001 | 0.411 | 0.330 |
| Inverse Simpson | 2.56 ± 0.29 | 2.18 ± 0.27 | 4.03 ± 0.52 | 5.51 ± 1.00 | 4.70 ± 0.73 | 5.24 ± 0.70 | <0.001 | 0.428 | 0.334 |
| Evenness | 0.40 ± 0.04 | 0.32 ± 0.03 | 0.45 ± 0.04 | 0.53 ± 0.03 | 0.47 ± 0.04 | 0.54 ± 0.02 | <0.001 | 0.533 | 0.076 |
| Total | FF vs. BF | MF vs. BF | MF vs. FF | |
|---|---|---|---|---|
| Numbers of pathways that differed (p <0.05, q < 0.10) | 155 | 117 | 112 | 8 |
| MetaCyc superclass # | ||||
| Biosynthesis | 92 | 70 | 71 | 5 |
| Biosynthesis/detoxification | 3 | 2 | 2 | 0 |
| Degradation/utilization/assimilation (DUA) | 32 | 22 | 22 | 0 |
| Generation of precursor metabolites and energy (GPME) | 17 | 15 | 10 | 1 |
| DUA/GPME | 5 | 3 | 2 | 1 |
| Others | 6 | 5 | 5 | 1 |
| Total | FF vs. BF | MF vs. BF | MF vs. FF | |
|---|---|---|---|---|
| Numbers of metabolites that differed | ||||
| (p < 0.05, q < 0.10) | 577 | 543 (386|157) | 517 (307|210) | 3 (0|3) |
| Super-pathway | ||||
| Amino acid | 97 | 91 (72|19) | 86 (68|18) | 0 |
| Peptide | 15 | 14 (12|2) | 12 (11|1) | 0 |
| Carbohydrate | 21 | 20 (7|13) | 20 (8|12) | 0 |
| Energy | 5 | 5 (3|2) | 3 (2|1) | 0 |
| Lipid | 231 | 222 (144|78) | 206 (142|64) | 2 (0|2) |
| Nucleotide | 21 | 20 (17|3) | 18 (16|2) | 0 |
| Cofactors and vitamins | 34 | 30 (23|7) | 33 (27|6) | 0 |
| Xenobiotics | 47 | 41 (26|15) | 42 (29|13) | 1 (0|1) |
| Unnamed | 106 | 100 (82|18) | 97 (82|15) | 0 |
| Log2 Fold-Change | |||||
|---|---|---|---|---|---|
| Biochemical Name | Super-Pathway | Sub-Pathway | FF/BF | MF/BF | FF/MF |
| lactose | Carbohydrate | Disaccharides and Oligosaccharides | −2.94 | −1.47 | −1.43 |
| lacto-N-fucopentaose II | Carbohydrate | Disaccharides and Oligosaccharides | −7.82 | −5.64 | −2.18 |
| lacto-N-fucopentaose V | Carbohydrate | Disaccharides and Oligosaccharides | −3.47 | −2.18 | −1.29 |
| lacto-N-tetraose | Carbohydrate | Disaccharides and Oligosaccharides | −4.64 | −3.64 | −0.92 |
| 3-sialyllactose | Carbohydrate | Disaccharides and Oligosaccharides | −3.06 | −3.06 | 0.03 |
| 6′-sialyllactose | Carbohydrate | Disaccharides and Oligosaccharides | −4.64 | -4.32 | −0.56 |
| 2-fucosyllactose | Carbohydrate | Disaccharides and Oligosaccharides | −5.06 | −4.06 | −1.12 |
| 3-fucosyllactose | Carbohydrate | Disaccharides and Oligosaccharides | −9.20 | −6.64 | −2.56 |
| sucrose | Carbohydrate | Disaccharides and Oligosaccharides | 2.68 | 2.86 | −0.18 |
| Log2 Fold-Change | |||||
|---|---|---|---|---|---|
| Biochemical Name | Super-Pathway | Sub-Pathway | FF/BF | MF/BF | FF/MF |
| valerate (5:0) | Lipid | Short Chain Fatty Acid | 4.37 | 3.50 | 0.87 |
| pentoic acid | Lipid | Short Chain Fatty Acid | 1.10 | 1.23 | −0.12 |
| caproate (6:0) | Lipid | Medium Chain Fatty Acid | 2.86 | 2.42 | 0.43 |
| heptanoate (7:0) | Lipid | Medium Chain Fatty Acid | 1.08 | 1.88 | −0.79 |
| caprylate (8:0) | Lipid | Medium Chain Fatty Acid | 0.97 | 0.96 | 0.01 |
| caprate (10:0) | Lipid | Medium Chain Fatty Acid | 1.77 | 1.35 | 0.42 |
| laurate (12:0) | Lipid | Medium Chain Fatty Acid | 1.68 | 1.04 | 0.64 |
| 5-dodecenoate (12:1n7) | Lipid | Medium Chain Fatty Acid | −1.36 | −1.40 | 0.04 |
| myristate (14:0) | Lipid | LC-SFA | −1.09 | −0.86 | −0.22 |
| pentadecanoate (15:0) | Lipid | LC-SFA | −2.40 | −1.60 | −0.81 |
| palmitate (16:0) | Lipid | LC-SFA | −0.89 | −0.76 | −0.12 |
| margarate (17:0) | Lipid | LC-SFA | −3.18 | −2.47 | −0.64 |
| stearate (18:0) | Lipid | LC-SFA | −2.12 | −1.74 | −0.42 |
| nonadecanoate (19:0) | Lipid | LC-SFA | −2.64 | −2.00 | −0.62 |
| arachidate (20:0) | Lipid | LC-SFA | −1.25 | −0.94 | −0.34 |
| myristoleate (14:1n5) | Lipid | LC-MUFA | −1.79 | −1.60 | −0.18 |
| palmitoleate (16:1n7) | Lipid | LC-MUFA | −3.47 | −2.84 | −0.74 |
| 10-heptadecenoate (17:1n7) | Lipid | LC-MUFA | −3.06 | −2.18 | −0.89 |
| oleate/vaccenate (18:1) | Lipid | LC-MUFA | −2.00 | −1.51 | −0.47 |
| 10-nonadecenoate (19:1n9) | Lipid | LC-MUFA | −3.84 | −3.06 | −0.71 |
| eicosenoate (20:1) | Lipid | LC-MUFA | −3.47 | −2.74 | −0.74 |
| erucate (22:1n9) | Lipid | LC-MUFA | −5.06 | −3.84 | −1.43 |
| nervonate (24:1n9) | Lipid | LC-MUFA | −5.06 | −3.64 | −1.56 |
| stearidonate (18:4n3) | Lipid | LC-PUFA (n3 and n6) | −3.18 | −2.56 | −0.62 |
| eicosapentaenoate (EPA; 20:5n3) | Lipid | LC-PUFA (n3 and n6) | −4.06 | −3.32 | −0.79 |
| heneicosapentaenoate (21:5n3) | Lipid | LC-PUFA (n3 and n6) | −1.25 | −1.06 | −0.18 |
| docosapentaenoate (n3 DPA; 22:5n3) | Lipid | LC-PUFA (n3 and n6) | −2.94 | −2.94 | 0.00 |
| docosahexaenoate (DHA; 22:6n3) | Lipid | LC-PUFA (n3 and n6) | −2.64 | −2.64 | −0.04 |
| docosatrienoate (22:3n3) | Lipid | LC-PUFA (n3 and n6) | −5.06 | −4.06 | −1.25 |
| hexadecadienoate (16:2n6) | Lipid | LC-PUFA (n3 and n6) | −2.06 | −1.64 | −0.45 |
| linoleate (18:2n6) | Lipid | LC-PUFA (n3 and n6) | −2.18 | −1.69 | −0.49 |
| linolenate [alpha or gamma; (18:3n3 or 6)] | Lipid | LC-PUFA (n3 and n6) | −1.60 | −1.36 | −0.27 |
| dihomo-linoleate (20:2n6) | Lipid | LC-PUFA (n3 and n6) | −4.64 | −3.64 | −0.97 |
| dihomo-linolenate (20:3n3 or n6) | Lipid | LC-PUFA (n3 and n6) | −2.84 | −2.84 | 0.04 |
| arachidonate (20:4n6) | Lipid | LC-PUFA (n3 and n6) | −2.84 | −2.74 | −0.12 |
| adrenate (22:4n6) | Lipid | LC-PUFA (n3 and n6) | −2.47 | −2.12 | −0.36 |
| docosapentaenoate (n6 DPA; 22:5n6) | Lipid | LC-PUFA (n3 and n6) | −4.32 | −3.64 | −0.81 |
| docosadienoate (22:2n6) | Lipid | LC-PUFA (n3 and n6) | −6.64 | −4.64 | −2.84 |
| mead acid (20:3n9) | Lipid | LC-PUFA (n3 and n6) | 1.85 | 2.47 | −0.62 |
| Log2 Fold-Change | |||||
|---|---|---|---|---|---|
| Biochemical Name | Super-Pathway | Sub-Pathway | FF/BF | MF/BF | FF/MF |
| 3-methylhistidine | Amino Acid | Histidine metabolism | −1.69 | −1.40 | −0.29 |
| N-acetyl-1-methylhistidine | Amino Acid | Histidine metabolism | 0.73 | 1.14 | −0.42 |
| hydantoin-5-propionate | Amino Acid | Histidine metabolism | 1.52 | 1.55 | −0.03 |
| imidazole propionate | Amino Acid | Histidine metabolismb | 2.82 | 1.50 | 1.32 |
| formiminoglutamate | Amino Acid | Histidine metabolism | 4.41 | 4.28 | 0.14 |
| carnosine | Amino Acid | Histidine metabolism | −1.74 | −1.40 | −0.36 |
| histamine | Amino Acid | Histidine metabolism | −0.56 | -2.32 | 1.73 |
| 4-imidazoleacetate | Amino Acid | Histidine metabolism | 2.76 | 2.11 | 0.65 |
| N-acetylhistamine | Amino Acid | Histidine metabolism | 1.56 | 0.10 | 1.46 |
| lysine | Amino Acid | Lysine metabolism | 1.95 | 1.23 | 0.72 |
| N2-acetyllysine | Amino Acid | Lysine metabolism | 3.20 | 2.28 | 0.93 |
| N6-acetyllysine | Amino Acid | Lysine metabolism | 1.01 | 1.08 | −0.06 |
| N6-formyllysine | Amino Acid | Lysine metabolism | 3.96 | 3.38 | 0.58 |
| N6-carboxyethyllysine | Amino Acid | Lysine metabolism | 2.65 | 2.30 | 0.34 |
| hydroxy-N6,N6,N6-trimethyllysine | Amino Acid | Lysine metabolism | −2.64 | −1.94 | −0.71 |
| fructosyllysine | Amino Acid | Lysine metabolism | 5.45 | 5.27 | 0.18 |
| saccharopine | Amino Acid | Lysine metabolism | 2.42 | 2.11 | 0.30 |
| 2-aminoadipate | Amino Acid | Lysine metabolism | 0.20 | 1.07 | −0.86 |
| pipecolate | Amino Acid | Lysine metabolism | 4.49 | 3.58 | 0.91 |
| 6-oxopiperidine-2-carboxylate | Amino Acid | Lysine metabolism | 1.54 | 1.81 | −0.27 |
| cadaverine | Amino Acid | Lysine metabolism | 2.31 | 2.08 | 0.24 |
| N-acetyl-cadaverine | Amino Acid | Lysine metabolism | 2.84 | 2.38 | 0.46 |
| 5-aminovalerate | Amino Acid | Lysine metabolism | 5.45 | 3.78 | 1.67 |
| N,N,N-trimethyl-5-aminovalerate | Amino Acid | Lysine metabolism | 3.75 | 3.33 | 0.42 |
| phenylacetate | Amino Acid | Phenylalanine metabolism | 5.10 | 4.17 | 0.93 |
| 4-hydroxyphenylacetate | Amino Acid | Phenylalanine metabolism | 4.18 | 3.26 | 0.92 |
| 4-hydroxyphenylpyruvate | Amino Acid | Tyrosine metabolism | −0.64 | −1.00 | 0.34 |
| 3-(4-hydroxyphenyl)lactate | Amino Acid | Tyrosine metabolism | −1.60 | −1.36 | −0.25 |
| o-Tyrosine | Amino Acid | Tyrosine metabolism | 1.03 | 1.09 | −0.06 |
| dopamine 3-O-sulfate | Amino Acid | Tyrosine metabolism | 0.66 | 1.08 | −0.42 |
| tyramine O-sulfate | Amino Acid | Tyrosine metabolism | 1.72 | 1.58 | 0.14 |
| N-formylphenylalanine | Amino Acid | Tyrosine metabolism | 0.72 | 0.86 | −0.14 |
| C-glycosyltryptophan | Amino Acid | Tryptophan metabolism | −2.12 | −1.60 | −0.51 |
| tryptophan betaine | Amino Acid | Tryptophan metabolism | −4.32 | −2.12 | −2.18 |
| N-formylanthranilic acid | Amino Acid | Tryptophan metabolism | 1.77 | 1.05 | 0.72 |
| xanthurenate | Amino Acid | Tryptophan metabolism | −1.03 | −0.76 | −0.29 |
| picolinate | Amino Acid | Tryptophan metabolism | 2.10 | 1.98 | 0.12 |
| tryptamine | Amino Acid | Tryptophan metabolism | 3.83 | 1.83 | 2.00 |
| indoleacetate | Amino Acid | Tryptophan metabolism | 3.10 | 2.84 | 0.26 |
| indole-3-carboxylate | Amino Acid | Tryptophan metabolism | 1.33 | 1.00 | 0.33 |
| Log2 Fold-Change | |||||
|---|---|---|---|---|---|
| Biochemical Name | Super-Pathway | Sub-Pathway | FF/BF | MF/BF | FF/MF |
| taurocholate | Lipid | Primary Bile Acid Metabolism | −2.47 | −2.32 | −0.10 |
| taurochenodeoxycholate | Lipid | Primary Bile Acid Metabolism | −2.47 | −2.12 | −0.38 |
| ursodeoxycholate | Lipid | Secondary Bile Acid Metabolism | 2.88 | 1.46 | 1.42 |
| isoursodeoxycholate | Lipid | Secondary Bile Acid Metabolism | 2.03 | 0.72 | 1.31 |
| tauroursodeoxycholic acid sulfate | Lipid | Secondary Bile Acid Metabolism | 1.09 | 0.38 | 0.71 |
| 7,12-diketolithocholate | Lipid | Secondary Bile Acid Metabolism | 1.75 | 0.03 | 1.72 |
| 7-ketolithocholate | Lipid | Secondary Bile Acid Metabolism | 1.76 | −0.25 | 2.00 |
| hyocholate | Lipid | Secondary Bile Acid Metabolism | 1.23 | 0.59 | 0.63 |
| 3-dehydrocholate | Lipid | Secondary Bile Acid Metabolism | 1.37 | 0.55 | 0.82 |
| taurocholenate sulfate | Lipid | Secondary Bile Acid Metabolism | −2.18 | −2.40 | 0.25 |
| 7-ketodeoxycholate | Lipid | Secondary Bile Acid Metabolism | 2.18 | 0.52 | 1.67 |
| ursocholate | Lipid | Secondary Bile Acid Metabolism | 3.00 | 1.12 | 1.88 |
| FF vs. BF | MF vs. BF | ||||||
|---|---|---|---|---|---|---|---|
| Match | Match | ||||||
| ID | KEGG Pathway | Status | p Value | Status | p Value | Class | Origin |
| hsa00592 | alpha-Linolenic acid metabolism | 1 in 13 | 0.016 | 1 in 13 | 0.016 | Lipid metabolism | Host |
| ko00130 | Ubiquinone/other terpenoid-quinone biosyn. | 5 in 59 | <0.001 | 5 in 59 | <0.001 | Metabolism of cofactors and vitamins | Microbiota |
| ko00290 | Valine, leucine, and isoleucine biosynthesis | 3 in 23 | 0.002 | 2 in 23 | 0.021 | Amino acid metabolism | Microbiota |
| ko00340 | Histidine metabolism | 3 in 32 | 0.004 | 2 in 32 | 0.039 | Amino acid metabolism | Microbiota |
| ko00310 | Lysine degradation | 3 in 52 | 0.016 | 3 in 52 | 0.014 | Amino acid metabolism | Microbiota |
| ko00040 | Pentose and glucuronate interconversions | 3 in 56 | 0.02 | 3 in 56 | 0.017 | Carbohydrate metabolism | Microbiota |
| ko01040 | Biosynthesis of unsaturated fatty acids | 10 in 36 | <0.001 | 10 in 36 | <0.001 | Lipid metabolism | Co-metab |
| ko00232 | Caffeine metabolism | 7 in 15 | <0.001 | 6 in 15 | <0.001 | Biosynthesis of other secondary metabolites | Co-metab |
| ko00250 | Alanine, aspartate and glutamate metabolism | 8 in 28 | <0.001 | 7 in 28 | <0.001 | Amino acid metabolism | Co-metab |
| ko00240 | Pyrimidine metabolism | 11 in 61 | <0.001 | 10 in 61 | <0.001 | Nucleotide metabolism | Co-metab |
| ko00230 | Purine metabolism | 12 in 86 | <0.001 | 9 in 86 | <0.001 | Nucleotide metabolism | Co-metab |
| ko00430 | Taurine and hypotaurine metabolism | 6 in 22 | <0.001 | 6 in 22 | <0.001 | Biosynthesis of other secondary metabolites | Co-metab |
| ko00330 | Arginine and proline metabolism | 9 in 63 | <0.001 | 8 in 63 | <0.001 | Amino acid metabolism | Co-metab |
| ko00470 | D-Amino acid metabolism | 8 in 56 | <0.001 | 8 in 56 | <0.001 | Metab of other amino acids | Co-metab |
| ko00270 | Cysteine and methionine metabolism | 8 in 58 | <0.001 | 8 in 58 | <0.001 | Amino acid metabolism | Co-metab |
| ko00260 | Glycine, serine, and threonine metabolism | 7 in 47 | <0.001 | 7 in 47 | <0.001 | Amino acid metabolism | Co-metab |
| ko00600 | Sphingolipid metabolism | 5 in 23 | <0.001 | 6 in 23 | <0.001 | Lipid metabolism | Co-metab |
| ko00410 | beta-Alanine metabolism | 5 in 25 | <0.001 | 5 in 25 | <0.001 | Metabolism of other amino acids | Co-metab |
| ko00310 | Lysine degradation | 7 in 52 | <0.001 | 7 in 52 | <0.001 | Amino acid metabolism | Co-metab |
| ko00970 | Aminoacyl-tRNA biosynthesis | 7 in 52 | <0.001 | 7 in 52 | <0.001 | Translation | Co-metab |
| ko00770 | Pantothenate and CoA biosynthesis | 5 in 27 | <0.001 | 5 in 27 | <0.001 | Metabolism of cofactors and vitamins | Co-metab |
| ko00340 | Histidine metabolism | 5 in 33 | 0.003 | 6 in 33 | <0.001 | Amino acid metabolism | Co-metab |
| ko00591 | Linoleic acid metabolism | 3 in 10 | 0.003 | 3 in 10 | 0.002 | Lipid metabolism | Co-metab |
| ko00564 | Glycerophospholipid metabolism | 6 in 50 | 0.003 | 6 in 50 | 0.003 | Lipid metabolism | Co-metab |
| ko00630 | Glyoxylate and dicarboxylate metabolism | 6 in 56 | 0.006 | 5 in 53 | 0.018 | Carbohydrate metabolism | Co-metab |
| ko00480 | Glutathione metabolism | 4 in 32 | 0.014 | 4 in 32 | 0.013 | Metabolism of other amino acids | Co-metab |
| ko00061 | Fatty acid biosynthesis | 5 in 53 | 0.019 | 5 in 53 | 0.018 | Lipid metabolism | Co-metab |
| ko00660 | C5-Branched dibasic acid metabolism | 3 in 22 | 0.026 | 3 in 22 | 0.025 | Carbohydrate metabolism | Co-metab |
| ko00220 | Arginine biosynthesis | 3 in 23 | 0.029 | 4 in 23 | 0.004 | Amino acid metabolism | Co-metab |
| ko00052 | Galactose metabolismb | 4 in 46 | 0.046 | 4 in 46 | 0.043 | Carbohydrate metabolism | Co-metab |
| ko00920 | Sulfur metabolism | 4 in 30 | 0.011 | 2 in 30 | 0.216 | Energy metabolism | Co-metab |
| ko00100 | Steroid biosynthesis | 5 in 49 | 0.014 | 4 in 49 | 0.052 | Lipid metabolism | Co-metab |
| ko00020 | Citrate cycle (TCA cycle) | 3 in 20 | 0.02 | 2 in 20 | 0.113 | Carbohydrate metabolism | Co-metab |
| ko00290 | Valine, leucine and isoleucine biosynthesis | 3 in 23 | 0.029 | 2 in 23 | 0.142 | Amino acid metabolism | Co-metab |
| ko00750 | Vitamin B6 metabolism | 2 in 23 | 0.147 | 3 in 23 | 0.028 | Metabolism of cofactors and vitamins | Co-metab |
| ko00730 | Thiamine metabolism | 3 in 29 | 0.053 | 3 in 29 | 0.05 | Metabolism of cofactors and vitamins | Co-metab |
| ko00261 | Monobactam biosynthesis | 3 in 29 | 0.053 | 3 in 29 | 0.05 | Biosynthesis of other secondary metabolites | Co-metab |
| Biochemical Name | Super-Pathway | Sub-Pathway | Log2 Fold-Change CS/VD |
|---|---|---|---|
| alpha-ketoglutaramate | Amino acid | Glutamate metabolism | −1.50 |
| S-1-pyrroline-5-carboxylate | Amino acid | Glutamate metabolism | −1.28 |
| formiminoglutamate | Amino acid | Histidine metabolism | −1.85 |
| mannose | Carbohydrate | Fructose, mannose, and galactosemetabolism | −1.17 |
| fuculose | Carbohydrate | Fructose, mannose, and galactose metabolism | −1.34 |
| fucose | Carbohydrate | Aminosugar metabolism | −1.43 |
| N-acetylglucosamine/N-acetylgalactosamine | Carbohydrate | Aminosugar metabolism | −1.05 |
| (12 or 13)-methylmyristate (a15:0 or i15:0) | Lipid | Fatty acid, branched | −2.23 |
| 3-hydroxypalmitate | Lipid | Fatty acid, monohydroxy | −1.50 |
| 2S,3R-dihydroxybutyrate | Lipid | Fatty acid, dihydroxy | −1.11 |
| chiro-inositol | Lipid | Inositol metabolism | 1.04 |
| glycerophosphoserine | Lipid | Phospholipid metabolism | −1.22 |
| trimethylamine N-oxide | Lipid | Phospholipid metabolism | −1.36 |
| 1-pentadecanoylglycerol (15:0) | Lipid | Monoacylglycerol | −1.43 |
| 3-ketosphinganine | Lipid | Sphingolipid synthesis | −2.45 |
| taurolithocholate 3-sulfate | Lipid | Secondary bile acidmetabolism | 1.90 |
| taurochenodeoxycholic acid 3-sulfate | Lipid | Secondary bile acid metabolism | 2.63 |
| 2′-deoxyinosine | Nucleotide | Purine metabolism, (hypo)xanthine/inosine containing | −1.34 |
| 1-methyladenine | Nucleotide | Purine metabolism, adenine containing | −1.05 |
| 2′-deoxyguanosine | Nucleotide | Purine metabolism, guanine containing | −1.20 |
| uridine | Nucleotide | Pyrimidine metabolism, uracil containing | −1.06 |
| 2′-deoxyuridine | Nucleotide | Pyrimidine metabolism, uracil containing | −1.11 |
| thymidine | Nucleotide | Pyrimidine metabolism, thymine containing | −1.03 |
| pantoate | Cofactors and vitamins | Pantothenate and coenzyme A metabolism | −1.69 |
| 2-isopropylmalate | Xenobiotics | Food component/plant | −1.11 |
| histidinol | Xenobiotics | Food component/lant | −1.68 |
| tartarate | Xenobiotics | Food component/plant | −1.18 |
| glutamyl-meso-diaminopimelate | Xenobiotics | Bacterial/fungal | −1.34 |
| N-propionylmethionine | Xenobiotics | Chemical | −1.23 |
| X-23734 | N/A | N/A | −2.10 |
| X-24660 | N/A | N/A | 1.29 |
| X-24669 | N/A | N/A | 2.08 |
| X-25185 | N/A | N/A | −2.19 |
| X-25436 | N/A | N/A | 1.12 |
| X-25491 | N/A | N/A | −1.50 |
| ID | KEGG Pathway | Match Status | p Value | Class | Origin |
|---|---|---|---|---|---|
| ko00290 | Valine, leucine and isoleucine biosynthesis | 1 in 23 | 0.041 | Amino acid metabolism | Microbiota |
| ko00770 | Pantothenate and CoA biosynthesis | 1 in 27 | 0.048 | metabolism of cofactors and vitamins | Microbiota |
| ko00620 | Pyruvate metabolism | 1 in 28 | 0.049 | Carbohydrate metabolism | Microbiota |
| ko00600 | Sphingolipid metabolism | 3 in 23 | <0.001 | Lipid metabolism | Co-metabolism |
| ko00240 | Pyrimidine metabolism | 3 in 61 | 0.002 | Nucleotide metabolism | Co-metabolism |
| ko00250 | Alanine, aspartate and glutamate metabolism | 2 in 28 | 0.005 | Amino acid metabolism | Co-metabolism |
| ko00230 | Purine metabolism | 2 in 86 | 0.043 | Nucleotide metabolism | Co-metabolism |
Disclaimer/Publisher’s Note: The statements, opinions and data contained in all publications are solely those of the individual author(s) and contributor(s) and not of MDPI and/or the editor(s). MDPI and/or the editor(s) disclaim responsibility for any injury to people or property resulting from any ideas, methods, instructions or products referred to in the content. |
© 2025 by the authors. Licensee MDPI, Basel, Switzerland. This article is an open access article distributed under the terms and conditions of the Creative Commons Attribution (CC BY) license (https://creativecommons.org/licenses/by/4.0/).
Share and Cite
Wang, M.; Valizadegan, N.; Fields, C.J.; Donovan, S.M. Fecal Microbiome and Metabolomic Profiles of Mixed-Fed Infants Are More Similar to Formula-Fed than Breastfed Infants. Microorganisms 2025, 13, 166. https://doi.org/10.3390/microorganisms13010166
Wang M, Valizadegan N, Fields CJ, Donovan SM. Fecal Microbiome and Metabolomic Profiles of Mixed-Fed Infants Are More Similar to Formula-Fed than Breastfed Infants. Microorganisms. 2025; 13(1):166. https://doi.org/10.3390/microorganisms13010166
Chicago/Turabian StyleWang, Mei, Negin Valizadegan, Christopher J. Fields, and Sharon M. Donovan. 2025. "Fecal Microbiome and Metabolomic Profiles of Mixed-Fed Infants Are More Similar to Formula-Fed than Breastfed Infants" Microorganisms 13, no. 1: 166. https://doi.org/10.3390/microorganisms13010166
APA StyleWang, M., Valizadegan, N., Fields, C. J., & Donovan, S. M. (2025). Fecal Microbiome and Metabolomic Profiles of Mixed-Fed Infants Are More Similar to Formula-Fed than Breastfed Infants. Microorganisms, 13(1), 166. https://doi.org/10.3390/microorganisms13010166