Abstract
A series of in vitro studies were conducted to explore the anti-methanogenic potential of five seaweeds collected from the Indian sea and to optimize the level(s) of incorporation of the most promising seaweed(s) into a straw and concentrate diet to achieve a significant reduction in methane (CH4) production without disturbing rumen fermentation characteristics. A chemical composition analysis revealed a notable ash content varying between 55 and 70% in seaweeds. The crude protein content was highly variable and ranged between 3.25 and 15.3% of dry matter. Seaweeds contained appreciable concentrations of tannins and saponins. Among the seaweeds, Spyridia filamentosa exhibited significantly higher CH4 production, whereas the percentage of CH4 in total gas was significantly lower in the cases of Kappaphycus alvarezii and Sargassum wightii. The ranking of seaweeds in terms of CH4 production (mL/g OM) is as follows: Sargassum wightii < Kappaphycus alvarezii < Acanthophora specifera < Padina gymnospora < Spyridia filamentosa. A remarkable decrease of 31–42% in CH4 production was recorded with the incremental inclusion of Kappaphycus alvarezii at levels of 3–5% of the dry matter in the diet. The addition of Sargassum wightii led to a significant decrease of 36–48% in CH4 emissions when incorporated at levels of 4–5% of dry matter, respectively. The findings of this study revealed a significant decrease in the numbers of total protozoa and Entodinomorphs, coupled with increasing abundances of sulfate-reducing microbes and minor methanogens. Metagenome data revealed that irrespective of the seaweed and treatment, the predominant microbial phyla included Bacteroidota, Bacillota, Pseudomonadota, Actinomycetota, Fibrobacterota, and Euryarchaeota. The prevalence of Methanobrevibacter was similar across treatments, constituting the majority (~79%) of the archaeal community. The results also demonstrated that the supplementation of Kappaphycus alvarezii and Sargassum wightii did not alter the feed fermentation pattern, and therefore, the reduction in CH4 production in the present study could not be attributed to it. Animal studies are warranted to validate the extent of reduction in CH4 production and the key processes involved by supplementation with Kappaphycus alvarezii and Sargassum wightii at the recommended levels.
1. Introduction
Methane (CH4) is a potent greenhouse gas, possessing 25 times more global warming potential than the most common atmospheric carbon dioxide (CO2). The EPA [1] estimates the atmospheric concentration of CH4 to be at 1990 ppb, significantly lower than the 441 ppm of CO2. When the global warming potential of CH4 is evaluated, it turns out to be only 9.38 times less than that of CO2. The global annual emission of CH4 is estimated to be at 558 teragrams (Tg), comprising 407 Tg from anthropogenic activities and 191 Tg from natural sources. Different sinks remove 548 Tg of CH4 annually, leading to a net accumulation of approximately 10 Tg annually [2]. Agricultural waste, with an annual emission of 188 Tg, continues to be one of the largest contributors to global CH4 emissions. In the agriculture sector, livestock are significant contributors to CH4 emissions as a result of enteric fermentation. Enteric fermentation accounts for about 70% of the total CH4 emissions from agriculture [3].
The large livestock population in India is believed to contribute 9.25 Tg of CH4 annually as a result of enteric fermentation. The two greatest species in the context of CH4 emission are cattle and buffaloes, with corresponding contributions of 56 and 29% [4,5]. Besides being a causative factor in global warming, CH4 emissions from livestock also result in a considerable loss of feed energy, which could otherwise be utilized by the host animals for maintenance or productive functions. Approximately 39.5 kilojoules of energy are wasted for every liter of CH4 produced [6].
In light of the facts mentioned above, animal nutrition experts, collaborating closely with biotechnologists and microbiologists, are diligently investigating effective strategies to reduce enteric CH4 emissions. The growing consciousness among consumers regarding the use of safe animal-origin products devoid of chemical residues and hazardous metabolites has heightened concerns about the application of antibiotics and other chemical agents in the context of CH4 mitigation. Since 2000, investigation into the various aspects of CH4 emissions and mitigation has significantly increased [7], leading to the emergence of numerous CH4 mitigation products and technologies across different regions of the globe [8]. The adoption of these options, however, continues to be remarkably low (<10%) [9]. This low adoption may be attributed to several factors, including the high input costs associated with the products, the absence of region- and resource-specific options, inconsistent co-benefits from mitigation efforts, the insufficient demonstration of technologies and their advantages directly to farmers, and a lack of adequate incentivization, such as benefits derived from carbon crediting.
To effectively address enteric CH4, it is essential to concentrate on the development of mitigation products and technologies that are specific to regions and resources. This approach would not only expand the range of anti-methanogenic products available but also enhance the likelihood of broader adoption among livestock farmers. India boasts an extensive coastline of approximately 7500 km, spanning nine states and four union territories, which presents a diverse array of seaweeds. In the Indian sea, approximately 844 species of seaweeds have been documented, comprising 434 red, 194 brown, and 216 green algae, with a potential availability of 58,000 tonnes [10]. Recent studies have confirmed that seaweeds are promising agents for the mitigation of CH4 production [11,12,13,14]. Nonetheless, variation in environmental conditions, geographical features, and ecological factors results in a non-uniform availability of seaweeds across different countries. Halogenated compounds [15,16], alterations in rumen fermentation [17,18], and shifts in the microbial composition [18] are some known mechanisms by which seaweeds lead to a reduction in CH4 emissions. Therefore, the development of a diet based on seaweeds will not only expand the feed stock but also address efficient and economical reduction in CH4 emissions from livestock. In light of the aforementioned facts, a study was undertaken to evaluate certain potentially available seaweeds found in the Indian sea for their ability to mitigate CH4 emissions. Our research also aimed to optimize the inclusion levels of promising seaweeds in straw–concentrate diets and to investigate their effects on feed fermentation characteristics and the diversity of rumen microbiota.
2. Materials and Methods
2.1. Collection of Seaweeds
A total of five seaweeds, including three red seaweeds (Kappaphycus alvarezii-KA, Spyridia filamentosa-SF, and Acanthophora specifera-AS) and two brown seaweeds (Sargassum wightii-SW and Padina gymnospora-PG) were collected by the ICAR-Central Marine Fisheries Research Institute from the Indian Ocean along the Mandapam coast in Tamil Nadu, India. The wet seaweeds were dried in a hot air oven at 80 °C for 24 h and transported to the ICAR-National Institute of Animal Nutrition and Physiology, Bengaluru, for the evaluation of seaweeds. The dried seaweeds were ground in a Cyclotec mill (CT293, FOSS, India) for further analysis. The initial study (Experiment I) was conducted to compare CH4 production potential by using seaweeds as the sole item.
Experiment I
2.1.1. Chemical Composition
The dried seaweeds were analyzed for their chemical constituents following the standard procedures. In brief, the crude protein (CP) was estimated by analyzing the nitrogen using an automatic nitrogen analyzer (Gerhardt, Cäsariusstraße, Germany) and was multiplied by 6.25. The ether extract (EE) content was estimated as per AOAC [19] using a Soxtherm instrument (Gerhardt, Germany), whereas crude fiber (CF) was estimated in accordance with Van Soest et al. [20] using an automatic fiber analyzer (Fibretherm FT12, Gerhardt, Germany). The ash content in the seaweeds was estimated after incineration in a muffle furnace at 550 °C for 4 h, and the organic matter (OM) content was calculated through the subtraction of ash from the initial weight of the sample from which the ash was taken, and the difference in weight was considered the OM, expressed as a percentage. The gross energy (GE) of the seaweeds was determined using a digital bomb calorimeter (make: Rajdhani Scientific Instrument, New Delhi, India; model: RSB 7) by weighing 0.5 g ground samples and converting them into pellets before placing them into the bomb crucible. The GE was determined by incinerating the sample in a closed oxygen-rich environment, and the rise in temperature due to the combustion of the sample was considered for the GE calculation and expressed as MJ/kg.
2.1.2. Microbial Inoculum, Buffer, and Total Gas Production
Rumen fluid consisting of both solid and liquid fractions was collected 3 h post feeding from two cannulated Holstein Friesian male adult cattle. The cannulated animals were fed on a diet comprising finger millet straw and concentrate mixture at 70:30 (DM basis) to meet the nutrient requirement for maintenance as per ICAR [21]. The concentrate mixture was formulated by using maize grain (300 g/kg), soybean meal (150 g/kg), groundnut cake (180 g/kg), wheat bran (340 g/kg), mineral mixture (20 g/kg), and salt (10 g/kg). The feed was offered to the animals in the morning at 08.00 h, and clean drinking water was freely accessible to the animals throughout the day. The rumen digesta including solid and liquid fractions was collected in an anaerobic thermos flask pre-warmed to 39 °C. The solid digesta fraction retained in muslin cloth was mixed with the filtrate rumen fluid to maintain the 1:2 ratio. The rumen fluid consisting of liquid and solid fractions served as a source of microbial inoculum for the in vitro studies. The dried and ground seaweed samples were individually weighed (200 mg) and placed in 100 mL glass syringes (Haberle, Oberer Seesteig, Germany). About 30 mL of the buffered microbial inoculum consisting of rumen fluid and buffer in a 1:2 ratio was dispensed in the glass syringe with the help of an automatic pipette dispenser (Varispenser, Eppendorf, Peter-Henlein-Straße, Germany). The buffer solution [22] including macro and micro mineral solutions of the specific compositions given in subsequent text was prepared one day prior to the setting up of in vitro incubation. The buffer solution was stored at 39 °C, whereas the rumen fluid collected from the cannulated animals as stated above was added to the buffer solution just before the setting up of in vitro incubation. The buffer was prepared by taking NaHCO3 (35.0 g) and NH4HCO3 (4.0 g) and dissolving them in one liter of distilled water. The macro solution was prepared by taking Na2HPO4 (5.7 g), KH2PO4 (6.2 g), and MgSO4.7H2O (0.6 g) and dissolving them into one liter of distilled water, whereas the micro mineral solution was prepared with CaCl2.2H2O (13.2 g), MnCl2.4H2O (10.0 g), COCl2.6H2O (1.0 g), and FeCl3.6H2O (8.0 g) and had a final volume of 100 mL. The gas bubbles were gently removed from the syringe, and the initial piston position of the syringe after placing a known quantity of seaweeds and adding the buffered rumen fluid was recorded. For each seaweed, a total of six replicates were used in two successive in vitro incubations, with three in each incubation. The glass syringes were incubated at 39 °C for 24 h in a Hohenheim-type water bath with the provision of automatic shaking every 6 h. In each incubation, three glass syringes containing the buffered rumen fluid without seaweed samples were used as blanks. The in vitro incubations were terminated exactly after 24 h (the next day) in every case. After the final position of the piston was recorded, the syringes were removed from the Hohenheim water bath and immediately placed on ice in a tray. The volume of total gas (mL) was calculated by the difference between the initial and final piston position of the syringe. The data from all five seaweeds were pooled and categorized as per type (red vs. brown seaweeds) to ascertain the impact on total gas production.
2.1.3. CH4 Production
The gas samples from the glass syringes, with the help of a needle, were transferred to pre-vacuumized serum glass vials of 10 mL capacity closed with a butyl stopper and aluminum crimp. For CH4 analysis, about 1 mL of the gas sample was drawn from the vials with the help of an airtight glass syringe (Hamilton, 1 mL, Darmstadt, Germany), and about 0.1 mL of the gas sample was injected into the gas chromatograph (Agilent 7890B, Santa Clara, CA, USA). The gas chromatograph was equipped with a thermal conductivity detector and a Porapak Q packed column, operated under the following conditions: an injector temperature of 60 °C, a column oven temperature of 100 °C, and a detector temperature of 110 °C [23,24]. The rate of airflow was set to 400 mL per minute, while the flow rates of H2 and N2 were kept at 40 and 30 mL per minute, respectively [24,25,26]. Before the gas samples from the seaweeds were analyzed, a standard of CH4 of a known concentration (Chemix Specialty Gases and Equipment, Bengaluru, India; 21.8%) was injected three times into the gas chromatograph. The % CH4 in the seaweed samples was calculated considering the peak area of the standard and of the test samples (seaweeds), and the concentration of CH4, as given below.
The CH4 volume (mL) was calculated using the total gas volume produced during 24 h of in vitro incubation and the % CH4 in total gas. The CH4 concentration was expressed as mL/200 mg of dry matter (DM) and mL/g of OM in seaweed. The comparative efficacy of red vs. brown seaweeds was ascertained by categorizing the CH4 production (mL/200 mg) data into two categories and performing a statistical analysis.
2.2. Experiment II
Based on the results from Experiment I, the two most promising seaweeds (KA—red; and SW—brown) producing minimum CH4 (mL/200 mg DM; mL/g OM) were selected for further evaluation to investigate the effect of graded levels of each seaweed on total gas production, CH4 production, feed fermentation, and microbial diversity. For each seaweed (KA and SW), using variable supplementation levels, a total six of treatments were formulated, as outlined in the following: 0 (C, without seaweed), 1 (A1), 2 (A2), 3 (A3), 4 (A4), and 5% (A5) of seaweed in the diet. The basal diet used in Experiment II comprised finger millet straw and concentrate in a 70:30 ratio. The concentrate mixture was prepared using maize grain (320 g/kg), soybean meal (130 g/kg), groundnut cake (120 g/kg), wheat bran (400 g/kg), mineral mixture (20 g/kg), and salt (10 g/kg).
2.2.1. Chemical Composition
The chemical composition of the control (C) and treatment (A1–A5) groups for both the seaweeds, i.e., KA and SW, was determined following the procedures stated previously in Section 2.1.1 of Experiment I.
2.2.2. Total Gas and CH4 Production
A total of two in vitro incubations with five treatments (A1, A2, A3, A4, A5) of each seaweed along with a control (C) were performed in succession. In each incubation, three replicates for the individual treatments and the control were used, and therefore, a total of six observations for each treatment, including C, were obtained. Simultaneously, three syringes containing only the buffered rumen fluid without seaweed, serving as blanks, were used in the incubation. The methodologies for in vitro incubation and total gas and CH4 production were described previously in Section 2.1.2 and Section 2.1.3 of Experiment I, respectively.
2.2.3. In Vitro Dry Matter Digestibility (IVDMD)
To determine the IVDMD, a 500 mg sample, as per the experimental layout described in Section 2.1.2 of Experiment I, was placed in a 100 mL glass syringe (Haberle, Germany), and 40 mL of the buffered rumen inoculum containing the buffer, macro and micro mineral solutions, and rumen fluid was dispensed into the syringe with the help of an automatic pipette (Varispenser, Eppendorf, Germany). The collection of rumen fluid, processing and weighing of samples, and incubation followed the same procedures stated above in the Section 2.1.2. For each treatment, a total of six replicates were used and incubated for 24 h in a Hohenheim-type water bath shaker at 39 °C. The fermentation was terminated after 24 h by placing the glass syringes on ice, and after the removal of gas, the remaining content was transferred to a fiber bag (ST 100, Gerhardt GmbH, Germany) through the syringe Luer. The fiber bags were repeatedly rinsed with water until it became clear. The bags were then placed in a hot air oven for 24 h at 80 °C for the drying of content. The IVDMD was calculated by the difference in the initial weight of the sample and the final weight of the residue as given below.
2.2.4. In Vitro Organic Matter Digestibility (IVOMD)
The ash content in seaweed-based treatments and dried residue samples was determined by igniting them in a muffle furnace at 550 °C for 4 h. The IVOMD was calculated based on the difference using the following equation:
2.2.5. Volatile Fatty Acid (VFA) and Ammonia-N
About 20 mL of the individual sample (n = 6 per treatment) obtained from the syringe after the termination of incubation was transferred to a 50 mL tube (Falcon) and placed on ice. The samples were centrifuged at 13,400 rpm for 15 minutes at 4 °C, and the supernatant was collected for the estimation of VFA and ammonia-N. The remaining pellet after supernatant fluid collection was used for DNA isolation to study the microbial diversity. The supernatant was equally divided into two halves, where the first half, after the addition of 25% metaphosphoric acid in a 4:1 ratio (v/v), was used for VFA analysis, and the second half, after the addition of a few drops of saturated HgCl2, was preserved for the estimation of ammonia-N. In brief, the VFA was estimated according to Filípek and Dvořák [27] using a gas chromatograph (Agilent 7890B, Waldbronn, Germany). The GC conditions previously described by Malik et al. [24,26] were maintained for the estimation of VFA. The concentration of VFA was calculated with the following equation:
Ammonia-N was determined by employing the method of Conway [28] as described previously [26,29,30]. The ammonia-N concentration was calculated using the following formula:
2.2.6. Protozoa Enumeration
Individually, the protozoa numbers were enumerated in the incubation fluid (n = 6 per treatment) from each syringe upon the termination of 24 h of fermentation. In brief, 1 mL of rumen fluid was mixed with 1 mL of 37% formaldehyde and kept at room temperature overnight. The protozoa were identified based on the morphology/presence of the cilia, categorized into Entodinimorphs and Holotrichs according to Hungate (1966) [31], and enumerated under a phase-contrast microscope (Nikon Eclipse, Gurgaon, India) as per Kamra and Agarwal [32]. The protozoa numbers were calculated by using the following equation and expressed as 107 cells/mL (total protozoa and Entodinimorphs) or ×106 cells/mL (Holotrichs).
where N is the number of protozoa (×107 cells/mL or ×106 cells/mL of rumen fluid), n is the average cell count per microscopic field, A represents the area of the slide used for the spreading of the diluted rumen fluid, D is the dilution, a is the area of the microscopic field, and v is the volume of rumen fluid in the cavity.
2.3. Statistical Analysis
The data from Experiment I for total gas and CH4 production were categorized as per the type of seaweed, i.e., red vs. brown, and checked for normal distribution before statistical analysis using an unpaired parametric t test in GraphPad prism version 10.2.3 (GraphPad Software, San Diego, CA, USA). The normal distribution (Gaussian) of data was checked using the Kolmogorov–Smirnov test at a 0.05 significance level in GraphPad prism version 10.2.3 (GraphPad Software, San Diego, CA, USA). The data for total gas and CH4 production from five seaweeds were analyzed in a one-way ANOVA with the following mathematical model:
where Yij represents the jth observation (j = 1, 2,…, 6) of the ith seaweed (i = 1, 2,…, 5). µ represents the common effect of the experiment, represents the ith seaweed effect, and ∑ij is the random error due to the jth observation of the ith seaweed.
The data for total gas, CH4 production, in vitro digestibility, ammonia-N, VFA, and protozoa for the selected seaweeds (KA and SW) were analyzed separately with five levels of each seaweed in GraphPad prism version 10.2.3 (GraphPad Software, San Diego, CA, USA) using the one-way ANOVA described above, with a modification to ith, which in this case represents the levels of the selected seaweed. The interaction effects of the source and levels on total gas, CH4 production, and protozoa were analyzed in a two-way ANOVA using the following model:
where μ is the overall mean response, τi is the effect of the ith level of KA, βj is the effect of the jth level of SW, and γij is the effect due to the interaction between the ith level of KA and the jth level of SW.
The correlation coefficient (r) was computed by the Pearson coefficient, two-tailed at a 95% confidence level, using levels of seaweed on the x-axis and total gas and CH4 on the y-axis. The correlation coefficient was computed among levels vs. total gas and CH4 as well as between total gas and CH4.
2.4. DNA Isolation
To allow the settling of feed particles and undissolved salts, the incubation fluid samples (n = 6 per treatment) were initially centrifuged at 1000× g for five minutes, and the supernatant was collected. A two mL supernatant was transferred to an Eppendorf tube and centrifuged at 13,400× g and 4 °C for 10 min. The thick pellet obtained was retained, whereas the supernatant was removed carefully without disturbing the pellet. One mL of a lysis buffer (500 mm NaCl, 50 mm Tris HCl pH 8, 50 mm EDTA, 4% SDS-w/v) was added to the tube containing the pellet, and by gentle pipetting, the pellet was dissolved in the lysis buffer. The content was transferred to a two mL sterile screw cap tube (BioSpec, Bartlesville, OK, USA) containing 0.5 g of 0.1 mm size pre-sterilized zirconia beads. The repeat bead beating plus column (RBB + C) method of Yu and Morrison [33] was employed for the isolation of metagenomic DNA. The QIAamp DNA mini kit (Qiagen, Antonio Santos, Germany), as an integral component in the RBB + C protocol, was used as per the manufacturer’s instructions (https://www.qiagen.com/us/products/discovery-and-translational-research/dna-rna-purification/dna-purification/genomic-dna/qiaamp-dna-kits?catno=51306 accessed on 21 October 2024). The quality of the metagenomic DNA was checked with 0.8% agarose gel electrophoresis, whereas the DNA concentration was quantified by Qubit 4.0 (Invitrogen, Thermofisher, Waltham, MA, USA).
Bioinformatic Analysis
The metagenomic raw reads were screened for quality and adapter contamination using FastQC v0.11.9 [34]. The adapters, low-quality bases (Q < 30), and reads shorter than <100 bp were removed using Trimmomatic v0.39 [35] with the following parameters: ILLUMINACLIP:TruSeq3-PE-2.fa:2:30:10SLIDINGWINDOW:15:30 MINLEN:100 TRAILING:30 AVGQUAL:30. The clean reads obtained after quality filtration in Trimmomatic were screened in BowTie2 v2.5.0 [36] and preconfigured for the removal of contamination with human, mouse, and PhiX reads. Rumen fluid from cattle was used for the in vitro incubation of samples; therefore, host contamination was removed in BowTie2 v2.5.0 using the custom target database ARS-UCD1.2 (RefSeq assembly accession: GCF_002263795.1). The clean reads obtained after the removal of contamination from human, mouse, PhiX, and cattle reads were uploaded in BV-BRC v 3.30.19 [37] and taxonomically classified following the K-mer approach in Kraken2 [38]. The resultant output was parsed into taxonomic levels in Pavian v1.2.0 [39]. The data were normalized using total sum scaling (TSS) and analyzed in MicrobiomeAnalyst v2.2 [40]. The Kraken2 standard database (https://ccb.jhu.edu/software/kraken2/ accessed on 21 October 2024) containing distinct 31-mers, based on completed microbial genomes from NCBI, was used for the taxonomic classification. The annotated data at different taxonomic ranks were analyzed in MicrobiomeAnalyst v2.2 by using the default count filter of four reads. The feature read counts were clustered [41] and presented based on taxonomic ranks, i.e., at the phylum, order, and genus levels. The metagenome data at different taxonomic ranks among the treatments were compared using the Kruskal–Wallis test, and the mean values with significance were ascertained using the Dunn post-hoc test in the rstatix package in R v4.3.1. The alpha diversity was assessed using the Shannon index, whereas the beta diversity was measured through the Bray–Curtis dissimilarity index at the genus level in MicrobiomeAnalyst v2.2 [40].
3. Results
Experiment I
3.1. Chemical Composition
The analysis of the chemical composition of the five seaweeds indicated that organic matter constituted 55–70% (Table 1), while the ash content was significantly higher, ranging from 30 to 45%. The gross energy content of the seaweeds ranged between 7 and 11.6 MJ/kg DM. The crude protein content exhibited significant variability in seaweeds, ranging from 3.25 to 15.3% of dry matter. The crude fiber content in the seaweeds in this study ranged between 4.68 and 8.97%, with KA showing the lowest content and SW exhibiting the highest content. Ether extract content exhibited the least variability among the chemical constituents in the seaweed, reported to be in the range of 0.07–0.73% of dry matter. The chemical analysis indicated that the seaweeds were a rich source of tannin and saponin bioactive compounds, reported to be in the range of 3.5–9.5 and 5–8% of DM, respectively (Table 1).

Table 1.
Chemical composition of seaweeds.
The mineral profiles of the seaweeds are presented in Table 2. Among the minerals, calcium and magnesium were the highest in concentration. The calcium content was highest in PG (4.81%), followed by SF (1.98%), whereas KA contained the lowest concentration of calcium (0.34%). Similarly, the highest and lowest concentrations of the second-most abundant mineral (magnesium) were reported in PG (2.5%) and KA (0.21%), respectively. The phosphorus and iron concentrations in the seaweeds were almost comparable. The iodine content in the seaweeds was highly variable and was reported to be highest in SW (279 mg/kg), followed by SF (137.5 mg/kg). The iodine content in the other seaweeds was less than 50 mg/kg.
Table 2.
Micronutrient and mineral profile of seaweeds.
3.1.1. Total Gas
The results from this study indicated significant (p < 0.0001) variation in total gas production (mL/200 mg DM) among the seaweeds under investigation (Figure 1A). SF, followed by PG, had the highest gas production in the incubation of respective seaweeds as the sole item. The gas production between SF and PG was comparable and did not differ statistically. The total gas production in SW, AS, and KA was significantly lower (p < 0.0001) compared to in SF. The in vitro total gas production in AS and KA was also significantly lower than the gas production in PG. There was no statistically significant difference in gas production between PG and SW, as well as between SW and AS and between SW and KA.
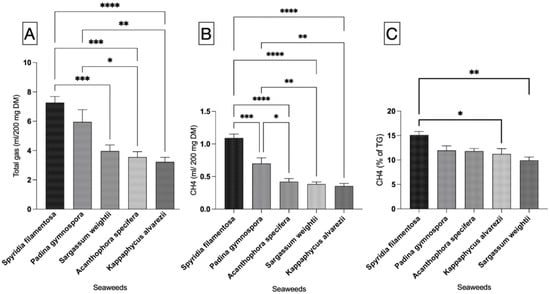
Figure 1.
Total gas, CH4 production, and percent CH4 from five seaweeds. (A) Total gas production, (B) CH4 production, and (C) percent CH4 in total gas. mL/200 mg DM—milliliter per 200 mg of dry matter; %—percent; CH4—methane. Each vertical bar in each individual panel of the figure represents a treatment (seaweed), and the comparison was performed between the bars within each panel. The mean value represented by an individual bar is based on six replicates (n = 6). The p value was calculated using one-way analysis of variance in GraphPad Prism version 10.2.3, and the significance between the mean values represented by bars in panels (A–C) was ascertained employing Tukey post-hoc analysis at a 0.05 alpha threshold and a 95 percent confidence level. Number of star(s) depicts the significance level. * is significant closer to 0.05, whereas **** depicts the significance level < 0.0001.
The total gas production of the seaweeds in this study was also compared on a per-gram-OM basis (Figure 2A), and the results indicated that AS, SW, and KA produce significantly (p < 0.0001) lower levels of gas compared to SF. Similarly, the gas production in AS, SW, and KA was also lower (p < 0.0001) compared to in PG. There was no difference among KA, SW, and AS and between SF and PG in terms of total gas production. A comparison of red vs. brown seaweeds (Figure 3) in the present study did not reveal any difference (p = 0.710) in total gas production (mL/200 mg).
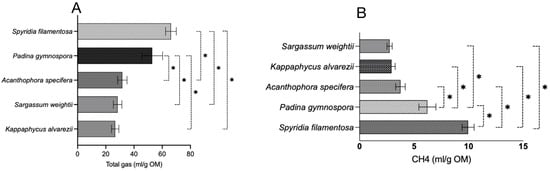
Figure 2.
Total gas and CH4 production from five seaweeds per gram of organic matter. (A) total gas production and (B) CH4 production. mL/g OM—milliliter per gram of organic matter; CH4—methane. Each horizontal bar in the individual panels (A,B) of the figure represents a treatment (seaweed), and the comparison was performed between the bars within each panel. The mean value represented by an individual bar is based on six replicates (n = 6). The p value was calculated using one-way analysis of variance in GraphPad Prism version 10.2.3, and the significance between the mean values represented by bars in panels (A,B) was ascertained employing Tukey post-hoc analysis at a 0.05 alpha threshold and a 95 percent confidence level. * Denotes significance between two seaweeds at 5%.
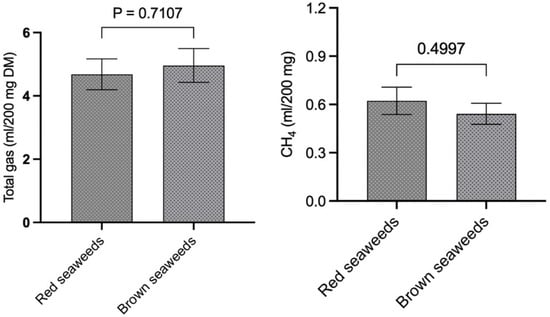
Figure 3.
Comparison of total gas and CH4 production between red and brown seaweeds.
3.1.2. CH4 Production
The data for CH4 production (mL/200 mg DM) shown in Figure 1B reveal that SF, among the seaweeds, produces significantly (p < 0.0001) higher levels of CH4 compared to other seaweeds. In a similar manner, in vitro CH4 production (mL/200 mg DM) in PG was notably greater than that of AS, SW, and KA. We noted similar production of CH4 among AS, SW, and KA (Figure 1B). The adjustment of CH4 production data to align with total gas production from the respective seaweeds revealed that KA and SW exhibited a significantly (p = 0.002) lower percentage of CH4 in total gas when compared to SF (Figure 1C). The variation in CH4 production (as a percentage of total gas) was not statistically significant. The adjustment of CH4 production data to per unit of OM (Figure 2B) exhibited a trend consistent with that of CH4 production (mL/200 mg DM). SF demonstrated a markedly higher (p < 0.0001) CH4 production level in comparison to other seaweeds. In a similar manner, CH4 production in PG (mL/200 mg DM) was found to be significantly higher (p < 0.0001) compared to in the other seaweeds. The ordering of seaweeds based on CH4 production (mL/g OM) from lowest to highest is SW, followed by KA, AS, PG, and SF. Given the anti-methanogenic properties of seaweeds, we selected SW and KA for a further evaluation of CH4 production at varying inclusion levels of the two seaweeds. CH4 production (mL/200 mg DM) was 0.622 and 0.542 in the red and brown seaweeds, respectively, and there was no difference (p = 0.499) between the two categories of seaweeds (Figure 3).
Experiment II
3.2. Effect of Graded Levels of Selected Seaweeds
3.2.1. Chemical Composition
The graded inclusion of KA or SW at variable levels of 1–5% impacted the chemical composition of treatments A1–A5, as illustrated in Table 3. The compositional data showed that adding selected seaweeds at different levels to the straw- and concentrate-based diet led to a difference in the OM content. However, the ash content of the seaweed-supplemented treatment was somewhat higher than that of the control treatment. The percentages of CP and CF in seaweed-supplemented treatments were higher than those in the control treatment.
Table 3.
Chemical composition of control and test diets.
3.2.2. Total Gas Production
The effect of five varying levels of seaweeds (A1, A2, A3, A4, and A5) on total gas production is illustrated in Table 4. The results from in vitro studies revealed a significant decrease in total gas production (mL/200 mg DM) at the 5% inclusion level (A5) of KA and SW compared to in the control treatment. In an identical manner, the total gas production (mL/200 mg DM) in treatments A1, A2, A3, and A4 was significantly greater (p < 0.0001) compared to in treatment A5 in the experiment where KA served as the test source. We did not notice any significant differences in total gas production (mL/200 mg DM) between treatments A4 and A5, which had 4 and 5% levels of supplementation of SW. Total gas production exhibited a significant difference (p = 0.0001) in the A1, A2, and A3 treatments compared to in treatment A5.
Table 4.
Effect of different levels of selected seaweeds on total gas, CH4 production, and in vitro digestibility.
3.2.3. CH4 Production
The inclusion of KA (p = 0.0008) and SW (p = 0.0038) at the graded levels of 1 to 5% (A1–A5) in regimes resulted in a substantial decrease in CH4 production (mL/200 mg DM), as shown in Table 4. KA supplementation resulted in a significant reduction of 31–42% in CH4 production in treatments A3, A4, and A5 compared to the control treatment. There was no effect of KA inclusion on CH4 production in treatments A1 and A2 compared to the control. The incorporation of SW resulted in significant decreases of 36 and 48% in CH4 production at the 4 and 5% supplementation levels, respectively. The inclusion of SW at 3% of the diet did not result in any significant changes in CH4 production. The production of CH4 remained similar among the other treatments.
The adjustment of CH4 production data to per gm of digestible DM revealed a significant reduction (p = 0.0012) of about 41% in treatments A4 and A5 compared to in treatment C. CH4 production (mL/g dig. DM) was comparable among all other treatments. A similar trend of reduction in CH4 production at KA inclusion levels of 4 (A4) and 5% (A5) in the diet was observed in the adjustment of data to per unit of digestible OM (Table 4). The correction of data to CH4 production (mL/g dig. OM) revealed a significant reduction (p = 0.0107) of 44% in treatment A5, where SW was incorporated at 5% of the diet, compared to the control. The CH4 production (mL/g dig. OM) among all other treatments was similar. The results for CH4 production in this study indicated that KA led to a significant reduction in CH4 production (mL/g dig. DM and mL/g dig. OM) at the 4% inclusion level (A4) compared to the control treatment, whereas SW did not affect CH4 production at the 4% inclusion level and proved to be effective in reducing CH4 production (mL/g dig. DM and mL/g dig. OM) at the 5% inclusion level only.
The results from this study revealed the significant impact of the source (seaweed, p < 0.0001) and levels (p < 0.0001) on total gas production (mL/200 mg DM). The interaction of the source x levels was not significant (p = 0.767). On the contrary, the effect of the source (p = 0.196) and levels (p = 0.243) on CH4 production (mL/200 mg DM) was not significant, but the interaction of the source x levels proved to be significant (p = 0.022).
3.2.4. In Vitro Digestibility
The data regarding the impact of varying levels of KA and SW on IVDMD and IVOMD (Table 4) demonstrated comparable digestibility for both DMD and OMD across treatments. The results indicated that the decrease in CH4 production linked to the incorporation of KA and SW was not related to a decline in the digestibility of DM and OM. A significant negative correlation (r = −0.899) was observed between the inclusion levels of KA and total gas production. A strong negative correlation (r = −0.973) was noted between the inclusion levels of KA and CH4 production. Total gas and CH4 production exhibited a positive correlation (r = 0.797) when KA was used as the test source. Significant correlations, r = −0.876 and r = −0.997, were observed between the levels and total gas and the levels and CH4 production, respectively, with the incorporation of SW at graded levels. A positive correlation was observed between total gas and CH4 production (r = 0.878).
3.2.5. VFA Production
TVFA production was significantly higher (p < 0.0001) in treatments A3, A4, and A5, which contained 3, 4, and 5% of KA, in comparison to the control. In the same manner, the production of acetate was significantly higher (p < 0.0001) in treatments A2, A3, A4, and A5, while the production of propionate was significantly decreased in treatments A1, A2, and A5 in comparison to the control. Butyrate production in test treatments was significantly higher (p < 0.0001) than in the control. The production of iso-butyrate in treatments A3 and A4 was significantly higher compared to in treatment C, while valerate production (mM) remained similar among the treatments. TVFA production (mM) in treatments A1, A2, A3, and A5 was similar (p = 0.0058) to in treatment C (Table 5). There was no difference in acetate production among the treatments due to graded supplementation with SW. Similarly, there was no significant difference in propionate production (mM) between the control and the SW-supplemented treatments.
Table 5.
Effect of different levels of selected seaweeds on VFA (mM) production.
3.2.6. Rumen Protozoa
The effect of KA and SW on the numbers of total protozoa, Entodinomorphs, and Holotrichs is summarized in Table 6. The results from this study indicated a significant decrease (p < 0.0001) in the numbers of total protozoa and Entodinomorphs with the graded supplementation of both KA and SW. The number of Holotrichs remained unaffected by the supplementation of selected seaweeds in the present study. The total protozoa numbers in the A3, A4, and A5 treatments were significantly lower (<0.0001) compared to in the control treatment. A similar trend of a significant reduction in the numbers of Entodinomorphs was recorded. The supplementation of SW led to a significant (p < 0.0001) decrease in the numbers of total and Entodinomorph protozoa at 2 (A2), 3 (A3), 4 (A4), and 5% (A5) supplementation levels compared to the control (C).
Table 6.
Effect of different levels of selected seaweeds on protozoal numbers.
There was no difference between treatments C and A1. The interaction (source x levels) for total protozoa and Entodinomorphs was significant (p = 0.008) in treatments A4 and A5, whereas the interaction for the remaining treatments proved to be non-significant (Table 6). Similarly, the interaction between source and levels proved non-significant for Holotrich protozoa.
3.2.7. Microbial Diversity
A total of 245 million reads per treatment (C-A5), with an average of 40.9 million reads per sample, were generated from the rumen fluid sample in the treatments supplemented with Kappaphycus alverezii. On average, 2.37% of the reads per treatment were discarded in Trimmomatic as a result of adapter and quality filtering; furthermore, 0.34% of the reads per treatment were eliminated due to contamination (Supplementary File S1). The rumen fluid sample in SW-supplemented treatments yielded an average of 288 million reads per treatment. The average number of reads per sample, irrespective of the treatment, was 48 million. The contamination of reads resulted in an average loss of 0.28% of reads.
The alpha and beta diversity of KA and SW are illustrated in Figure 4A–D (A & C alpha diversity; B & D beta diversity). The Shannon index reflecting alpha diversity showed no significant differences, suggesting that the microbial species richness at the genus level was comparable in both KA (p = 0.058) and SW (p = 0.982) across the treatments. The beta diversity assessed through Bray–Curtis dissimilarity indicated a significant difference in microbial diversity (p = 0.001) across treatments in KA, while the beta diversity in the SW-supplemented treatment showed no significant difference (p = 0.088).
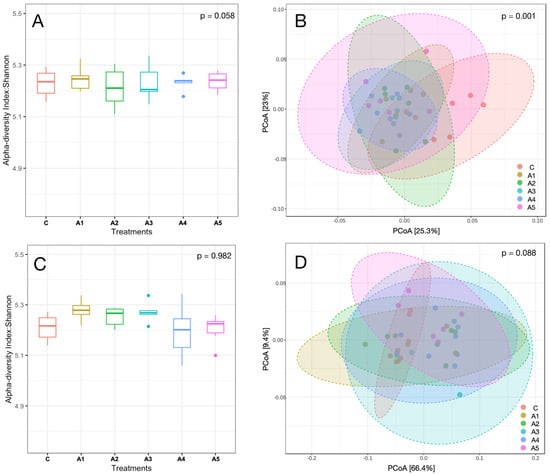
Figure 4.
(A–D): Alpha and beta diversity are represented by the Shannon index and Bray–Curtis, respectively. Panels (A,B) in the figure represent the alpha and beta diversity of the metagenome in Kappaphycus alvarezi—KAi—respectively, whereas panels (C,D) depict the alpha and beta diversity of the metagenome in Sargassum wightii—SW. C, A1, A2, A3, A4, and A5 are treatments that represent the effect of various inclusion levels of SW or KA on microbial diversity at 0, 1, 2, 3, 4, and 5 percent of the straw- and concentrate-based diet, respectively.
The metagenome data indicated that regardless of the treatment, the microbial phyla Bacteroidota, Bacillota, Pseudomonadota, Actinomycetota, Fibrobacterota, and Euryarchaeota were the most prevalent in the KA experiment (Figure 5A; Supplementary File S1). The six phyla collectively made up over 92% of the microbiota, while the distribution of microbes associated with these phyla, excluding Actinomycetota, showed similarities across treatments. The variation in Actinomycetota abundance was significant between treatments C and A1 (p = 0.001), C and A3 (p = 0.0002), and C and A5 (p = 0.00006). The abundance of Euryarchaeota was comparable (p = 0.55) across treatments, making up more than 2.5% of the microbiota. Additional archaeal phyla were also identified in the KA experiment (Figure 6A; Supplementary File S1). Nonetheless, the remaining archaeal phyla collectively made up merely 5–6% of the archaeal community. Figure 5C (Supplementary File S1) illustrates the microbial abundance at the phylum level in the SW experiment. The six most abundant microbial phyla were identical to those observed in the KA experiment. In contrast to KA, the supplementation of SW at graded levels of 1–5 percent (A1–A5) in the diet did not influence the abundance of Actinomycetota. The abundance of Euryarchaeota methanogens showed no significant difference across treatments (p = 0.828; Supplementary File S1). Similarly to KA, other archaeal phyla were also detected in the SW experiment, collectively accounting for 5–6 percent of the overall archaeal community. The results demonstrated that irrespective of the supplementation source and treatment, Euryarchaeota emerged as the most dominant archaeal phylum in both experiments.

Figure 5.
Rumen metagenome composition as affected by the graded supplementation of Kappaphycus alvarezii—KA—at the phylum (panel (A)) and genus (panel (B)) levels. Panels (C,D) depict the effect of graded levels of Sargassum wightii—SW—on metagenome composition at the phylum and genus levels, respectively. C, A1, A1, A3, A4, and A5 are treatments representing the effect of various inclusion levels of KA/SW on microbial diversity at 0, 1, 2, 3, 4, and 5 percent levels in the straw- and concentrate-based diet, respectively.
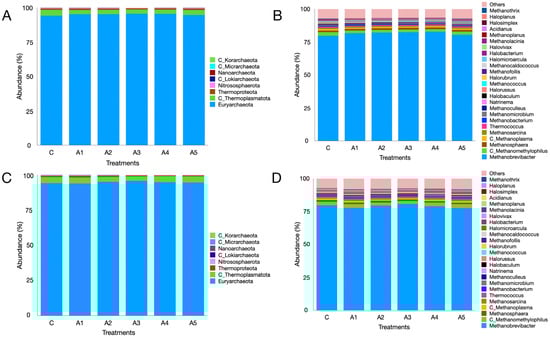
Figure 6.
Archaeal metagenome composition as affected by the graded supplementation of Kappaphycus alvarezii—KA—at the phylum (panel (A)) and genus (panel (B)) levels. Panels (C,D) depict the effect of graded levels of Sargassum wightii—SW—on archaeal metagenome composition at the phylum and genus levels, respectively. C, A1, A2, A3, A4, and A5 are treatments that represent the effect of various inclusion levels of KA/SW on archaeal diversity at 0, 1, 2, 3, 4, and 5 percent levels in straw- and concentrate-based diets, respectively.
Prevotella, with a similar abundance (p = 0.961) among the treatments, was the most prominent genus in the KA experiment and constituted approximately 1/5 of the rumen microbiota (Supplementary File S1; Figure 5B). The second-most abundant genus was Fibrobacter, which constituted approximately 4–6% of the microbiota with a similar distribution among treatments (p = 0.101). In the present study, the graded supplementation of KA at 1–5% of the diet did not induce any significant changes (p = 0.363) in the abundance of the third-largest genus, Methanobrevibacter. Similarly, the effect of KA supplementation at variable levels on the other prominent genera such as Alistipes, Streptomyces, Faecalibacterium, Clostridium, Hymenobacter, and Paenibacillus was not significant (Figure 5B; Supplementary File S1).
At the genus level, Prevotella, Fibrobacter, Methanobrevibacter, Bacteroides, and Alistipes were prominent microbes, constituting 19.9, 4.93, 2.25, 2.23, and 2.34% of the microbiota, respectively (Figure 4C,D). Metagenome data indicated that the abundances of these microbes were not affected (Supplementary File S1) by the supplementation of SW at different levels in the straw- and concentrate-based diet. Though the abundance of Methanobrevibacter was similar among treatments (p = 0.827), it constituted the largest fraction (~79%) of the archaeal community in the SW-supplemented experiment (Figure 6C,D). Similarly, the distribution of other prominent methanogen genera such as Candidatus_Methanomethylophilus (p = 0.248), Methanosphaera (p = 0.28), Candidatus_Methanoplasma (p = 0.204), and Methanosarcina (p = 0.402) was not affected by SW supplementation (Figure 6C,D; Supplementary File S1).
4. Discussion
Traditionally, seaweeds are fed to animals in coastal areas [42]. To avoid negative impacts, the seaweeds are usually mixed with the animal diet. To increase momentum in seaweed farming, the efforts are focused on developing seed banks and planting material through tissue culture [43]. India is rapidly emerging as a major producer of KA, and the production of this particular type of seaweed dry matter has increased to 1490 tonnes from 21 tonnes over a period of 12 years [43]. This study indicated a very high ash content in the seaweeds, ranging between 30 and 45% of dry matter, which is in congruence with previous studies [44,45]. The elevated ash content observed in seaweeds can be attributed to their adaptations to the environment and their unique biochemical properties. The constant absorption of minerals by seaweeds in seawater leads to the accumulation of, overall, a very high concentration of salts in the biomass. Furthermore, the charged polysaccharides present in the cell wall of seaweeds interact with ions, thereby enhancing the uptake of various minerals [44,46]. Some of the polysaccharides found in seaweed are carrageenan, ulvan, and sulfated compounds; these do not add to the organic matter [47]. Seaweeds have less organic matter because they have adapted to take in nutrients quickly and turn them into biomass instead of store them [48]. Additionally, some seaweeds exhibit restricted abilities to utilize bicarbonate as a carbon source, which might also explain the lower organic matter content in these seaweeds [48]. The sulfur content and sulfonated compounds, along with the low organic matter and carbon content, contribute to the lower calorific value of seaweeds compared to terrestrial plants [44]. Our study also indicated that the gross energy value of seaweeds falls within the range of 7–12 MJ/kg, aligning with previous research [49,50]. The energy value demonstrated a linear relationship with the ether extract content of the seaweeds. The seaweed (SF) with the maximum ether extract content also had the highest energy value (11.6 MJ/kg).
The protein content in seaweeds exhibits significant variability, with different species containing protein contents between 3 and 62% on a dry basis. Generally, red seaweeds have a crude protein content ranging from 10 to 30%, while brown seaweeds contain nearly half the amount of crude protein found in red seaweeds. Our research showed that the red seaweeds (SF and AS) had about twice as much crude protein as the brown seaweeds (SW and PG). The crude protein levels corresponded closely with the results reported by Jayasinghe et al. [51] in SW and KA. The protein content in seaweeds fluctuates according to the seasonal cycle and is recorded to be highest during the winter and spring seasons [52,53]. The CH4 output is primary generated from the fermentation of carbohydrates; therefore, the fluctuation in protein content seems to have a minimum impact on CH4 production.
Mitigating enteric CH4 emissions from ruminants globally is a daunting challenge that cannot be addressed effectively with just a handful of anti-methanogenic products. Consequently, it is essential for every country to develop customized strategies for reducing CH4 emissions, considering factors such as livestock production systems, productivity, the cost-effectiveness of inputs, and the accessibility of resources. In developing nations like India, it is crucial to create tailored mitigation strategies due to the significant variation in feeding practices and the seasonal availability of feed resources. Implementing CH4 mitigation strategies utilizing seaweeds could significantly benefit coastal states like Gujarat, Maharashtra, Goa, Karnataka, Kerala, Tamil Nadu, Andhra Pradesh, Odisha, and West Bengal, which collectively account for around 40% of the country’s livestock [54]. The results from this study indicated that SW and KA, among all the seaweeds, produced the least CH4 when incubated in vitro as the sole item in the diet. The reduced CH4 production in SW and KA can be attributed to the higher concentrations of tannins and saponins available in these seaweeds. Tannins are polyphenolic compounds known for their anti-methanogenic properties, which encompass the direct inhibition of methanogens [55,56], alterations in fermentation processes, or indirect effects via partial defaunation [57,58,59]. Similarly, saponin is also known for decreasing CH4 production through its adverse impact on the rumen protozoa and by disrupting the H2 supply to methanogens [60,61,62].
The subsequent in vitro investigations revealed a significant decrease of over 35% in CH4 production compared to the control treatment when KA and SW were added to a straw–concentrate diet at a level of 4–5% of the diet. Adjusting CH4 production data to per gram of digestible organic matter indicated that the inclusion of KA at 4% of the diet resulted in a notable reduction in CH4 production. In contrast, SW at the 4% level did not effectively reduce CH4 production, while a 5% level of inclusion only resulted in a significant decrease in CH4 production compared to treatment C.
Rumen methanogenesis is predominantly the result of the anaerobic fermentation of feed, which involves complex metabolic pathways and microbial interactions. A diet high in fiber content results in a greater production of CH4 as a result of the prolonged fermentation times and H2 production. Conversely, a feed high in starch content produces a relatively lower amount of CH4 [63,64]. The optimization of the inclusion levels of tanniferous sources is a prerequisite for the utilization of this source as a CH4-mitigating agent in the diet, as a high concentration of tannins in a test source can result in a reduction in fiber digestibility [57,65]. Malik et al. [25] reported the adverse impact of a tanniferous anti-methanogenic agent on dry matter digestibility at an inclusion level of 8% in the diet, whilst dry matter digestibility remained unaffected by inclusion at the 2 and 5% levels. Our goal should be to achieve a considerable reduction in CH4 production without interfering with the fiber digestibility of the diet [66,67]. This will allow us to maximize the use of nutrients and increase our output. The findings from this study indicated that incorporating KA and SW at 4–5% levels into a straw–concentrate diet led to a notable reduction in CH4 production, without impacting digestibility. Furthermore, the decrease in CH4 was not linked to any decline in fiber digestibility.
Protozoa are ecto-/endosymbiotically adhered to methanogens and live in a syntrophic fashion [68]. The methanogens provide shelter to the protozoa, whereas the protozoa are responsible for most of the H2 supply to the methanogens, which is later used for the synthesis of ruminal CH4. Rumen protozoa are considered a non-vital group of microbes for animal survival, yet they perform functions such as protein breakdown and bacterial predation [69]. Their presence in the rumen is reported to have negative impacts on the energy efficiency of the rumen ecosystem [68]. Park et al. [70] concluded that the elimination of rumen protozoa was shown to have little effect on feed digestion or fermentation and was mostly associated with increased nitrogen use efficiency [71] and decreased CH4 emission [68]. The significant decrease in protozoa numbers due to the inclusion of tanniferous seaweeds is corroborated by previous studies [12,18,25]. Our results demonstrated that the incorporation of both KA and SW seaweeds selectively inhibits Entodinomorphs, whereas there was no effect on Holotrichs. In congruence with previous reports [58,59,72,73], this study also confirmed the dominance of Entodinomorph protozoa over Holotrichs, which perhaps could be attributed to the nature of incubated feed ingredients. Entodinomorphs are more prevalent in diets consisting of high fiber and protein [74], whereas Holotrichs do not consume fibrous material and their abundance is increased if feed contains a high degree of soluble starch [75].
The sulfur content of selected seaweeds may also contribute to the reduction in CH4 production, alongside its adverse effects on Entodinomorphs protozoa. The findings demonstrated that KA and SW had sulfur concentrations of 9.58 and 6.73 mg/kg, corresponding to 0.08–0.10 and 0.05–0.07 mg of sulfur at inclusion levels of 4 and 5% of the selected seaweeds, respectively. The sulfur concentration in KA and SW in this study concurs with earlier reports [76,77]. The presence of sulfur might trigger a change in H2 utilization, diverting it from the production of CH4 [78]. The sulfur content in a typical diet is inadequate for sulfate reducers to effectively compete with methanogens [79]. The additional sulfur provided through seaweed supplementation in the present study might improve the activity of sulfate-reducing microbes and reduce CH4 production by limiting H2 availability to methanogens. The decrease in CH4 production attributed to sulfur is consistent with earlier findings [80,81,82]. The thermodynamic favorability of sulfate-reducing bacteria surpasses that of hydrogenotrophic methanogens in the utilization of H2 during the dissimilation process [83,84].
Metagenome data indicated a significant increase in the abundances of sulfate-reducing bacteria, including Desulfonema, Fusobacterium, Thermodesulfomicrobium, and sulfurihydrogenibium, at the maximum level of KA supplementation in a straw- and concentrate-based diet. In the same manner, the abundances of Desulfovibrio, Pseudodesulfovibrio, Desulfouromonas, Desulfosarcina, Solidesulfovibrio, Desulfomicrobium, and Desulfobulbus were also higher in the metagenome when compared to the control treatment, attributed to the increased sulfur content from SW supplementation. The increased abundance of certain sulfate-reducing bacteria suggests a shift in the dissimilation process of sulfate reduction, redirecting H2 away from methanogenesis. Paul et al. [85] reported a 62% decrease in in vitro CH4 production by a group of sulfate-reducing bacteria known as Fusobacterium without any H2S accumulation.
Acetate and propionate production exhibited either no significant change or a modest decrease in the KA/SW supplementation treatments. The sulfate-reducing microbes are known to derive energy by using VFA [86]. Sulfate-reducing bacteria, particularly organotrophs, oxidize organic compounds, including organic acids like acetate and propionate [87]. The modest decrease in concentration or the similarity in acetate and propionate concentrations indicated that the shift in these volatile fatty acids was not responsible for the reduction in CH4 production due to the supplementation of selected seaweeds.
The analysis of metagenome data indicated that Bacteroidota, Bacillota, and Pseudomonadota were the predominant microbial phyla noted across the treatments in this study. In the same manner, Euryarchaeota ranked as the fifth-largest microbial phylum, with no significant differences in abundances between the control and the treatments supplemented with seaweeds. At the phylum level, the abundances of Thermodesulfobacteriota showed no significant differences; however, at the genus level, a shift in the abundances of sulfate-reducing bacteria, as previously discussed, was observed. The prevalence of Bacteroidetes (Bacteroidota), Firmicutes (Bacillota), Proteobacteria (Pseudomonadota), and Euryarchaeota aligns with earlier findings [25,30,88]. At the genus level, Prevotella, Fibrobacter, and Methanobrevibacter were notable, exhibiting similar abundances across treatments. Nonetheless, a notable variation was observed in the abundances of minor methanogens such as Methanohalobium, Sulfolobus, Saccharolobus, Sulfurisphaera, Methanothermococcus, Methanothermus, Methanobacterium, etc. across the treatments.
Seaweeds definitely have a foreseen future as supplements/additives for the feeding of livestock. The literature comparing the economics of the production of various seaweeds is scarce. A recent document by the Niti Aayog [43] revealed that four to six cycles of the seaweeds (KA and GE) can be harvested annually, and farmers in the country usually set a price in the range of INR 20–70. We need to focus on the cultivation of native species of seaweeds with established anti-methanogenic potential and ensure maximum in situ utilization for livestock feeding in the coastal states. To make seaweed feeding economically feasible at the farm level, there is a need to offer incentives to dairy farmers based on emission reduction credits obtained through a reduction in carbon emission in strict compliance with the measurement, reporting, and verification (MRV) process. Thus, the adoption of seaweed-based mitigation and feeding practices in the coastal regions will not only ensure less CH4 emissions but also incentivize dairy farmers through carbon credit schemes, allowing for the meeting of the nationally determined contributions (NDC) of the country.
The high concentration of heavy metals in seaweeds could have a potential impact on animal health [89], and therefore, their concentration and threshold levels should be taken into account while formulating diets for different livestock species.
5. Conclusions
From this study, it can be inferred that incorporating Kappaphycus alvarezii (KA) and Sargassum wightii (SW) at supplementation levels of 4–5% in a straw- and concentrate-based diet resulted in a significant decrease of 30–45% in in vitro CH4 production. Entodinomorphs protozoa reduction, sulfate reduction, and alterations to the abundances of sulfate-reducing bacteria and minor methanogens primarily achieved a decrease in CH4 production through the supplementation of KA and SW at recommended levels. The findings of this study indicated that shifts in feed fermentation, including the degradation of dry and organic matter and volatile fatty acids, did not contribute to the reduction in CH4 production upon the supplementation of selected seaweeds. Animal studies are warranted to validate the extent of the decrease in CH4 production and the fundamental processes involved in supplementing KA and SW at recommended levels.
Supplementary Materials
The following supporting information can be downloaded at: https://www.mdpi.com/article/10.3390/microorganisms13010123/s1, Supplementary File S1: Metagenome read statistics; phylum- and genus-level abundance data.
Author Contributions
P.K.M. and R.B. conceived the idea, designed the experiments, performed data analysis, wrote the manuscript, and acquired the funds under the IAEA project D31031. S.T., A.M. and A.P.K. conducted the in vitro experiments, data compilation, DNA isolation, bioinformatic analysis, and data visualization. G.T. and J.B. performed the seaweed collection and sample drying. S.V. analyzed the samples for gross energy content. A.S. and A.G. assisted in manuscript writing. All authors have read and agreed to the published version of the manuscript.
Funding
Financial support received from the International Atomic Energy Agency (IAEA), Vienna, under the project entitled “Utilization of Agro-Industrial Wastes as Animal Feed for Reducing GHG Emissions, Improving Nitrogen Use Efficiency and Livestock Productivity’ under the Coordinated Research Project (CRP) D31031”, by the first and corresponding author is duly acknowledged.
Institutional Review Board Statement
Not applicable.
Informed Consent Statement
Not applicable.
Data Availability Statement
The microbiota datasets presented in this study can be found in online repositories with the accession numbers PRJNA1126025 and PRJNA1125719 for Kappaphycus alvarezii and Sargassum wightii, respectively. The metagenome data with the accession number(s) are available in the repository/repositories and can be found at https://www.ncbi.nlm.nih.gov/bioproject/PRJNA1126025 (accessed on 24 June 2024) and https://www.ncbi.nlm.nih.gov/bioproject/PRJNA1125719 (accessed on 24 June 2024).
Conflicts of Interest
The authors declare no conflict of interest.
References
- EPA Global Methane Initiative. Importance of Methane. 2023. Available online: https://www.epa.gov/gmi/learn-about-global-methane-initiative (accessed on 19 September 2023).
- Friedlingstein, P.; O’sullivan, M.; Jones, M.W.; Andrew, R.M.; Hauck, J.; Olsen, A.; Peters, G.P.; Peters, W.; Pongratz, J.; Sitch, S.; et al. Global Carbon Budget 2020. Earth Syst. Sci. Data Discuss. 2020, 12, 1–3. [Google Scholar] [CrossRef]
- Global Methane Hub. 2024. Available online: https://www.globalmethanehub.org (accessed on 6 November 2024).
- Bhatta, R. Issue of Enteric Methane Emissions from Indian Livestock. Curr. Sci. 2023, 125, 227–228. [Google Scholar]
- Bhatta, R.; Malik, P.K.; Sejian, V. Enteric Methane Emission and Reduction Strategies in Sheep. In Sheep Production Adapting to Climate Change; Sejian, V., Bhatta, R., Gaughan, J., Malik, P.K., Naqvi, S.M.K., Lal, R., Eds.; Springer Nature: Singapore, 2017; pp. 291–305. [Google Scholar]
- Guan, H.; Wittenberg, K.M.; Ominski, K.H.; Krause, D.O. Efficacy of Ionophores in Cattle Diets for Mitigation of Enteric Methane. J. Anim. Sci. 2006, 84, 1896–1906. [Google Scholar] [CrossRef]
- Beauchemin, K.A.; Ungerfeld, E.M.; Eckard, R.J.; Wang, M. Review: Fifty Years of Research on Rumen Methanogenesis: Lessons Learned and Future Challenges for Mitigation. Animal 2020, 14, S2–S16. [Google Scholar] [CrossRef]
- Arndt, C.; Hristov, A.N.; Price, W.J.; McClelland, S.C.; Pelaez, A.M.; Cueva, S.F.; Oh, J.; Dijkstra, J.; Bannink, A.; Bayat, A.R.; et al. Full Adoption of the Most Effective Strategies to Mitigate Methane Emissions by Ruminants Can Help Meet the 1.5 °C Target by 2030 but Not 2050. Proc. Natl. Acad. Sci. USA 2022, 119, e2111294119. Available online: https://www.pnas.org/doi/10.1073/pnas.2111294119 (accessed on 20 October 2024). [CrossRef] [PubMed]
- Herrero, M.; Henderson, B.; Havlík, P.; Thornton, P.K.; Conant, R.T.; Smith, P.; Wirsenius, S.; Hristov, A.N.; Gerber, P.; Gill, M.; et al. Greenhouse Gas Mitigation Potentials in the Livestock Sector. Nat. Clim. Chang. 2016, 6, 452–461. [Google Scholar] [CrossRef]
- DOF, G. Seaweed Cultivation. 2020. Available online: https://dof.gov.in/sites/default/files/2020-07/Seaweed_Cultivation.pdf (accessed on 20 October 2024).
- De Bhowmick, G.; Hayes, M. Potential of Seaweeds to Mitigate Production of Greenhouse Gases during Production of Ruminant Proteins. Glob. Chall. 2023, 7, 2200145. [Google Scholar] [CrossRef]
- Mohapatra, A.; Trivedi, S.; Kolte, A.P.; Tejpal, C.S.; Elavarasan, K.; Vaswani, S.; Malik, P.K.; Ravishankar, C.N.; Bhatta, R. Effect of Padina Gymnospora Biowaste Inclusion on In Vitro Methane Production, Feed Fermentation, and Microbial Diversity. Front. Microbiol. 2024, 15, 1431131. [Google Scholar] [CrossRef]
- McGurrin, A.; Maguire, J.; Tiwari, B.K.; Garcia-Vaquero, M. Anti-Methanogenic Potential of Seaweeds and Seaweed-Derived Compounds in Ruminant Feed: Current Perspectives, Risks and Future Prospects. J. Anim. Sci. Biotechnol. 2023, 14, 1–27. [Google Scholar] [CrossRef]
- Liu, Q.; Lei, S.; Zhao, M.; Li, M.; Cong, Y.; Fang, K.; Gao, X.; Zhang, L.; Zhu, C.; Zheng, L.; et al. Potential to Reduce Methane Production of Using Cultivated Seaweeds Supplementation to Reshape the Community Structure of Rumen Microorganisms. Environ. Res. 2024, 259, 119458. [Google Scholar] [CrossRef]
- Wasson, D.E.; Yarish, C.; Hristov, A.N. Enteric Methane Mitigation through Asparagopsis Taxiformis Supplementation and Potential Algal Alternatives. Front. Anim. Sci. 2022, 3, 999338. [Google Scholar] [CrossRef]
- Machado, L.; Magnusson, M.; Paul, N.A.; Kinley, R.; de Nys, R.; Tomkins, N. Identification of Bioactives from the Red Seaweed Asparagopsis Taxiformis That Promote Antimethanogenic Activity In Vitro. J. Appl. Phycol. 2016, 28, 3117–3126. [Google Scholar] [CrossRef]
- Maia, M.R.G.; Fonseca, A.J.M.; Oliveira, H.M.; Mendonça, C.; Cabrita, A.R.J. The Potential Role of Seaweeds in the Natural Manipulation of Rumen Fermentation and Methane Production. Sci. Rep. 2016, 6, 32321. [Google Scholar] [CrossRef] [PubMed]
- Choi, Y.; Lee, S.J.; Kim, H.S.; Eom, J.S.; Jo, S.U.; Guan, L.L.; Park, T.; Seo, J.; Lee, Y.; Bae, D.; et al. Red Seaweed Extracts Reduce Methane Production by Altering Rumen Fermentation and Microbial Composition In Vitro. Front. Vet. Sci. 2022, 9, 985824. [Google Scholar] [CrossRef]
- Association of Officiating Analytical Chemists. AOAC Official Method of Analysis; Association of Officiating Analytical Chemists: Washington, DC, USA, 2005. [Google Scholar]
- Van Soest, P.J.; Robertson, J.B.; Lewis, B.A. Methods for Dietary Fiber, Neutral Detergent Fiber, and Nonstarch Polysaccharides in Relation to Animal Nutrition. J. Dairy Sci. 1991, 74, 3583–3597. [Google Scholar] [CrossRef]
- ICAR Nutrient Requirements of Cattle and Buffalo. Nutrient Requirements of Animals; Indian Council of Agricultural Research: New Delhi, India, 2013. [Google Scholar]
- Menke, K.H.; Raab, L.; Salewski, A.; Steingass, H.; Fritz, D.; Schneider, W. The Estimation of the Digestibility and Metabolizable Energy Content of Ruminant Feeding Stuffs from the Gas Production When They Are Incubated with Rumen Liquor In Vitro. J. Agric. Sci. 1979, 93, 217–222. [Google Scholar] [CrossRef]
- Malik, P.K.; Uyeno, Y.; Kolte, A.P.; Kumar, R.; Trivedi, S.; Bhatta, R. Screening of Phyto-Sources from Foothill of Himalayan Mountain for Livestock Methane Reduction. SN Appl. Sci. 2019, 1, 232. [Google Scholar] [CrossRef]
- Malik, P.K.; Trivedi, S.; Mohapatra, A.; Kolte, A.P.; Mech, A.; Victor, T.; Ahasic, E.; Bhatta, R. Oat Brewery Waste Decreased Methane Production and Alters Rumen Fermentation, Microbiota Composition, and CAZymes Profiles. Microorganisms 2024, 12, 1475. [Google Scholar] [CrossRef]
- Malik, P.K.; Trivedi, S.; Kolte, A.P.; Mohapatra, A.; Bhatta, R.; Rahman, H. Effect of an Anti-Methanogenic Supplement on Enteric Methane Emission, Fermentation, and Whole Rumen Metagenome in Sheep. Front. Microbiol. 2022, 13, 1048288. [Google Scholar] [CrossRef] [PubMed]
- Malik, P.K.; Trivedi, S.; Kolte, A.P.; Mohapatra, A.; Biswas, S.; Bhattar, A.V.K.; Bhatta, R.; Rahman, H. Comparative Analysis of Rumen Metagenome, Metatranscriptome, Fermentation and Methane Yield in Cattle and Buffaloes Fed on the Same Diet. Front. Microbiol. 2023, 14, 1266025. [Google Scholar] [CrossRef] [PubMed]
- Filípek, J.; Dvořák, R. Determination of the Volatile Fatty Acid Content in the Rumen Liquid: Comparison of Gas Chromatography and Capillary Isotachophoresis. Acta Vet. Brno 2009, 78, 627–633. [Google Scholar] [CrossRef]
- Conway, E.J. Microdiffusion Analysis and Volumetric Error, 4th ed.; Crosby Lockwood and Son Ltd.: London, UK, 1957. [Google Scholar]
- Malik, P.K.; Trivedi, S.; Mohapatra, A.; Kolte, A.P.; Sejian, V.; Bhatta, R.; Rahman, H. Comparison of Enteric Methane Yield and Diversity of Ruminal Methanogens in Cattle and Buffaloes Fed on the Same Diet. PLoS ONE 2021, 16, e0256048. [Google Scholar] [CrossRef]
- Malik, P.K.; Trivedi, S.; Kolte, A.P.; Sejian, V.; Bhatta, R.; Rahman, H. Diversity of Rumen Microbiota Using Metagenome Sequencing and Methane Yield in Indian Sheep Fed on Straw and Concentrate Diet. Saudi J. Biol. Sci. 2022, 29, 103345. [Google Scholar] [CrossRef]
- Hungate, R.E. The Rumen and Its Microbes; Academic Press Inc.: New York, NY, USA, 1966. [Google Scholar]
- Kamra, D.N.; Agarwal, N. Rumen Protozoa. In Techniques in Rumen Microbiology; Centre of Advance Studies in Animal Nutrition, Indian Veterinary Research Institute, Izatnagar: Bareilly, India, 2003; pp. 35–45. [Google Scholar]
- Yu, Z.; Morrison, M. Improved Extraction of PCR-Quality Community DNA from Digesta and Fecal Samples. Biotechniques 2004, 36, 808–812. [Google Scholar] [CrossRef] [PubMed]
- Andrews, S. FastQC: A Quality Control Tool for High Throughput Sequence Data. Available online: http://www.bioinformatics.babraham.ac.uk/projects/fastqc (accessed on 8 November 2023).
- Bolger, A.M.; Lohse, M.; Usadel, B. Trimmomatic: A Flexible Trimmer for Illumina Sequence Data. Bioinformatics 2014, 30, 2114–2120. [Google Scholar] [CrossRef]
- Langmead, B.; Salzberg, S.L. Fast Gapped-Read Alignment with Bowtie 2. Nat. Methods 2012, 9, 357–359. [Google Scholar] [CrossRef]
- Olson, R.D.; Assaf, R.; Brettin, T.; Conrad, N.; Cucinell, C.; Davis, J.J.; Dempsey, D.M.; Dickerman, A.; Dietrich, E.M.; Kenyon, R.W.; et al. Introducing the Bacterial and Viral Bioinformatics Resource Center (BV-BRC): A Resource Combining PATRIC, IRD and ViPR. Nucleic Acids Res. 2023, 51, D678–D689. [Google Scholar] [CrossRef]
- Wood, D.E.; Lu, J.; Langmead, B. Improved Metagenomic Analysis with Kraken 2. Genome Biol. 2019, 20, 257. [Google Scholar] [CrossRef]
- Breitwieser, F.P.; Salzberg, S.L. Pavian: Interactive Analysis of Metagenomics Data for Microbiome Studies and Pathogen Identification. Bioinformatics 2020, 36, 1303–1304. [Google Scholar] [CrossRef] [PubMed]
- Chong, J.; Liu, P.; Zhou, G.; Xia, J. Using MicrobiomeAnalyst for Comprehensive Statistical, Functional, and Meta-Analysis of Microbiome Data. Nat. Protoc. 2020, 15, 799–821. [Google Scholar] [CrossRef]
- Paulson, J.N.; Colin Stine, O.; Bravo, H.C.; Pop, M. Differential Abundance Analysis for Microbial Marker-Gene Surveys. Nat. Methods 2013, 10, 1200–1202. [Google Scholar] [CrossRef] [PubMed]
- Morais, T.; Inácio, A.; Coutinho, T.; Ministro, M.; Cotas, J.; Pereira, L.; Bahcevandziev, K. Seaweed Potential in the Animal Feed: A Review. J. Mar. Sci. Eng. 2020, 8, 559. [Google Scholar] [CrossRef]
- Patel, N.; Banafarr, P.; Ramachandran, P.; Ghosh, A.; Johnson, B.; Dharani, G. Strategy for the Development of Seaweed Value Chain:Fostering Diversified Livelihoods; Government of India: New Delhi, India, 2024.
- Olsson, J.; Toth, G.B.; Albers, E. Biochemical Composition of Red, Green and Brown Seaweeds on the Swedish West Coast. J. Appl. Phycol. 2020, 32, 3305–3317. [Google Scholar] [CrossRef]
- Sánchez-Machado, D.I.; López-Cervantes, J.; López-Hernández, J.; Paseiro-Losada, P. Fatty Acids, Total Lipid, Protein and Ash Contents of Processed Edible Seaweeds. Food Chem. 2004, 85, 439–444. [Google Scholar] [CrossRef]
- Hurd, C.L.; Harrison, P.J.; Bischof, K.; Lobban, C.S. Seaweed Ecology and Physiology, 2nd ed.; Cambridge University Press: Cambridge, UK, 2014. [Google Scholar]
- Widowati, L.L.; Budi Prayitno, S.; Rejeki, S.; Elfitasari, T.; Purnomo, P.W.; Ariyati, R.W.; Bosma, R.H.; Aubin, J. Organic Matter Reduction Using Four Densities of Seaweed (Gracilaria Verucosa) and Green Mussel (Perna Viridis) to Improve Water Quality for Aquaculture in Java, Indonesia. Aquat. Living Resour. 2021, 34, 5. [Google Scholar] [CrossRef]
- Roleda, M.Y.; Hurd, C.L. Seaweed Nutrient Physiology: Application of Concepts to Aquaculture and Bioremediation. Phycologia 2019, 58, 552–562. [Google Scholar] [CrossRef]
- Kustantinah; Hidayah, N.; Noviandi, C.T.; Astuti, A.; Paradhipta, D.H.V. Nutrients Content of Four Tropical Seaweed Species from Kelapa Beach, Tuban, Indonesia and Their Potential as Ruminant Feed. Biodiversitas 2022, 23, 6191–6197. [Google Scholar] [CrossRef]
- Applegate, R.D.; Gray, P.B. Nutritional Value of Seaweed to Ruminants. Rangifer 1995, 15, 15–18. [Google Scholar] [CrossRef][Green Version]
- Jayasinghe, G.D.T.M.; Jinadasa, B.K.K.K.; Chinthaka, S.D.M. Nutritional Composition and Heavy Metal Content of Five Tropical Seaweeds. Open Sci. J. Anal. Chem. 2018, 3, 17–22. [Google Scholar]
- Fleurence, J.; Morançais, M.; Dumay, J. Seaweed Proteins. In Proteins in Food Processing; Yada, R.Y., Ed.; Elsevier: Amsterdam, The Netherlands, 2018; pp. 245–262. [Google Scholar]
- Fleurence, J.L. Seaweed Proteins: Biochemical, Nutritional Aspects and Potential Uses. Trends Food Sci. Technol. 1999, 10, 25–28. [Google Scholar] [CrossRef]
- GOI. 20th Livestock Census: Provisional Key Results; Department of Animal Husbandry and Dairying, Ministry of Fisheries, Animal Husbandry & Dairying, Govt of India: New Delhi, India, 2019.
- Bhatta, R.; Uyeno, Y.; Tajima, K.; Takenaka, A.; Yabumoto, Y.; Nonaka, I.; Enishi, O.; Kurihara, M. Difference in the Nature of Tannins on In Vitro Ruminal Methane and Volatile Fatty Acid Production and on Methanogenic Archaea and Protozoal Populations. J. Dairy Sci. 2009, 92, 5512–5522. [Google Scholar] [CrossRef]
- Gemeda, B.S.; Hassen, A. Effect of Tannin and Species Variation on In Vitro Digestibility, Gas, and Methane Production of Tropical Browse Plants. Asian-Australas J. Anim. Sci. 2015, 28, 188–199. [Google Scholar] [CrossRef]
- Tan, H.Y.; Sieo, C.C.; Abdullah, N.; Liang, J.B.; Huang, X.D.; Ho, Y.W. Effects of Condensed Tannins from Leucaena on Methane Production, Rumen Fermentation and Populations of Methanogens and Protozoa In Vitro. Anim. Feed. Sci. Technol. 2011, 169, 185–193. [Google Scholar] [CrossRef]
- Malik, P.K.; Kolte, A.P.; Baruah, L.; Saravanan, M.; Bakshi, B.; Bhatta, R. Enteric Methane Mitigation in Sheep through Leaves of Selected Tanniniferous Tropical Tree Species. Livest. Sci. 2017, 200, 29–34. [Google Scholar] [CrossRef]
- Malik, P.K.; Kolte, A.P.; Bakshi, B.; Baruah, L.; Dhali, A.; Bhatta, R. Effect of Tamarind Seed Husk Supplementation on Ruminal Methanogenesis, Methanogen Diversity and Fermentation Characteristics. Carbon Manag. 2017, 8, 319–329. [Google Scholar] [CrossRef]
- Malik, P.K.; Singhal, K.K. Influence of Lucerne Fodder Supplementation on Enteric Methane Emission in Crossbred Calves. Indian J. Anim. Sci. 2008, 78, 293. [Google Scholar]
- Malik, P.K.; Singhal, K.K.; Deshpande, S.B. Effect of Saponin Rich Lucerne Fodder Supplementation on Rumen Fermentation, Bacterial and Protozoal Population in Buffalo Bulls. Indian J. Anim. Sci. 2009, 79, 912–916. Available online: https://epubs.icar.org.in/index.php/IJAnS/article/view/2686/800 (accessed on 20 October 2024).
- Malik, P.K.; Singhal, K.K.; Ahlawat, A.; Deshpande, S.B. Effect of Berseem Fodder Supplementation to Wheat Straw Based Diet on In Vitro Total Gas and Methane Production and Fermentation Pattern. Indian J. Anim. Sci. 2010, 80, 551. [Google Scholar]
- Tseten, T.; Sanjorjo, R.A.; Kwon, M.; Kim, S.W. Strategies to Mitigate Enteric Methane Emissions from Ruminant Animals. J. Microbiol. Biotechnol. 2022, 32, 269–277. [Google Scholar] [CrossRef]
- Maweu, A.N.; Bebe, B.O.; Kuria, S.G.; Kashongwe, O.B. In-Vitro Digestibility and Methane Gas Emission of Indigenous and Introduced Grasses in the Rangeland Ecosystems of South Eastern Kenya. Reg. Environ. Chang. 2024, 24, 1–9. [Google Scholar] [CrossRef]
- Chiquettei, J.; Cheng, K.J.; Costerton, J.W.; Milligan, L.P. Effect of Tannins on the Digestibility of Two Isosynthetic Strains of Birdsfoot Trefoil (Lotus corniculatus L.) Using In Vitro and in Sacco Techniques. Cannadian J. Anim. Sci. 1988, 68, 751–760. [Google Scholar] [CrossRef]
- Carulla, J.E.; Kreuzer, M.; Machmüller, A.; Hess, H.D. Supplementation of Acacia Mearnsii Tannins Decreases Methanogenesis and Urinary Nitrogen in Forage-Fed Sheep. Aust. J. Agric. Res. 2005, 56, 961–970. [Google Scholar] [CrossRef]
- Tavendale, M.H.; Meagher, L.P.; Pacheco, D.; Walker, N.; Attwood, G.T.; Sivakumaran, S. Methane Production from In Vitro Rumen Incubations with Lotus Pedunculatus and Medicago Sativa, and Effects of Extractable Condensed Tannin Fractions on Methanogenesis. Anim. Feed. Sci. Technol. 2005, 123–124, 403–419. [Google Scholar] [CrossRef]
- Newbold, C.J.; De la Fuente, G.; Belanche, A.; Ramos-Morales, E.; McEwan, N.R. The Role of Ciliate Protozoa in the Rumen. Front. Microbiol. 2015, 6, 1313. [Google Scholar] [CrossRef]
- Williams, A.G.; Coleman, G.S. Role of Protozoa in the Rumen. In The Rumen Protozoa; Springer: New York, NY, USA, 1992; pp. 317–347. ISBN 978-1-4612-7664-7. [Google Scholar]
- Park, T.; Mao, H.; Yu, Z. Inhibition of Rumen Protozoa by Specific Inhibitors of Lysozyme and Peptidases In Vitro. Front. Microbiol. 2019, 10, 2822. [Google Scholar] [CrossRef]
- Belanche, A.; Abecia, L.; Holtrop, G.; Guada, J.A.; Castrillo, C.; De La Fuente, G.; Balcells, J. Study of the Effect of Presence or Absence of Protozoa on Rumen Fermentation and Microbial Protein Contribution to the Chyme. J. Anim. Sci. 2011, 89, 4163–4174. [Google Scholar] [CrossRef][Green Version]
- Baruah, L.; Malik, P.K.; Kolte, A.P.; Goyal, P.; Dhali, A.; Bhatta, R. Rumen Methane Amelioration in Sheep Using Two Selected Tanniferous Phyto-Leaves. Carbon Manag. 2019, 10, 299–308. [Google Scholar] [CrossRef]
- Poornachandra, K.T.; Malik, P.K.; Dhali, A.; Kolte, A.P.; Bhatta, R. Effect of Combined Supplementation of Tamarind Seed Husk and Soapnut on Enteric Methane Emission in Crossbred Cattle. Carbon Manag. 2019, 10, 465–475. [Google Scholar] [CrossRef]
- Belanche, A.; De la Fuente, G.; Moorby, J.M.; Newbold, C.J. Bacterial Protein Degradation by Different Rumen Protozoal Groups. J. Anim. Sci. 2012, 90, 4495–4504. [Google Scholar] [CrossRef] [PubMed]
- Michaiowski, T. Rumen Protozoa in the Growing Domestic Ruminant. In Biology of Growing Animals; Holzapfel, W.H., Naughton, P.J., Eds.; Elsevier: Amsterdam, The Netherlands, 2005; Volume 2, pp. 54–74. [Google Scholar]
- Kumar, N.J.; Kumar, R.; Patel, K.; Viyol, S.; Bhoi, R. Nutrient Composition and Calorific Value of Some Seaweeds from Bet Dwarka, West Coast of Gujarat, India. Our Nat. 2009, 7, 18–25. [Google Scholar]
- Yang, Y.; Zhang, M.; Alalawy, A.I.; Almutairi, F.M.; Al-Duais, M.A.; Wang, J.; Salama, E.S. Identification and Characterization of Marine Seaweeds for Biocompounds Production. Environ. Technol. Innov. 2021, 24, 101848. [Google Scholar] [CrossRef]
- van Zijderveld, S.M.; Gerrits, W.J.J.; Apajalahti, J.A.; Newbold, J.R.; Dijkstra, J.; Leng, R.A.; Perdok, H.B. Nitrate and Sulfate: Effective Alternative Hydrogen Sinks for Mitigation of Ruminal Methane Production in Sheep. J. Dairy Sci. 2010, 93, 5856–5866. [Google Scholar] [CrossRef] [PubMed]
- National Academy of Sciences Engineering and Medicine. Nutrient Requirement of Beef Cattle, 8th ed.; National Academy Press: Washington, DC, USA, 2016. [Google Scholar]
- Uniyal, S.; Chaudhary, L.C.; Kala, A.; Agarwal, N.; Kamra, D.N. Effect of Sulphur Supplementation on Methane Emission, Energy Partitioning and Nutrient Utilization in Goats. Anim. Nutr. Feed. Technol. 2020, 20, 111–119. [Google Scholar] [CrossRef]
- Li, L.; Silveira, C.I.; Nolan, J.V.; Godwin, I.R.; Leng, R.A.; Hegarty, R.S. Effect of Added Dietary Nitrate and Elemental Sulfur on Wool Growth and Methane Emission of Merino Lambs. Anim. Prod. Sci. 2013, 53, 1195–1201. [Google Scholar] [CrossRef]
- Silivong, P.; Preston, T.R.; Leng, R.A. Effect of Sulphur and Calcium Nitrate on Methane Production by Goats Fed a Basal Diet of Molasses Supplemented with Mimosa (Mimosa Pigra) Foliage. Livest. Res. Rural. Dev. 2011, 23, 2011. [Google Scholar]
- Ungerfeld, E.M. Shifts in Metabolic Hydrogen Sinks in the Methanogenesis-Inhibited Ruminal Fermentation: A Meta-Analysis. Front. Microbiol. 2015, 6, 1–17. [Google Scholar] [CrossRef]
- Kohn, R.A. Thermodynamic and Kinetic Control of Methane Emission from Ruminants. In Livestock Production and Climate Change; Malik, P.K., Bhatta, R., Takahasi, J., Kohn, R.A., Prasad, C.S., Eds.; CABI: Wallingford, UK, 2015; pp. 245–262. ISBN 978-1-78064-432-5. [Google Scholar]
- Paul, S.S.; Deb, S.M.; Singh, D. Isolation and Characterization of Novel Sulphate-Reducing Fusobacterium Sp. and Their Effects on In Vitro Methane Emission and Digestion of Wheat Straw by Rumen Fluid from Indian Riverine Buffaloes. Anim. Feed. Sci. Technol. 2011, 166–167, 132–140. [Google Scholar] [CrossRef]
- Tanji, Y.; Toyama, K.; Hasegawa, R.; Miyanaga, K. Biological Souring of Crude Oil under Anaerobic Conditions. Biochem. Eng. J. 2014, 90, 114–120. [Google Scholar] [CrossRef]
- Liamleam, W.; Annachhatre, A.P. Electron Donors for Biological Sulfate Reduction. Biotechnol. Adv. 2007, 25, 452–463. [Google Scholar] [CrossRef]
- Jami, E.; Mizrahi, I. Composition and Similarity of Bovine Rumen Microbiota across Individual Animals. PLoS ONE 2012, 7, e33306. [Google Scholar] [CrossRef]
- Makkar, H.P.S.; Tran, G.; Heuzé, V.; Giger-Reverdin, S.; Lessire, M.; Lebas, F.; Ankers, P. Seaweeds for Livestock Diets: A Review. Anim. Feed. Sci. Technol. 2016, 212, 1–17. [Google Scholar] [CrossRef]


Disclaimer/Publisher’s Note: The statements, opinions and data contained in all publications are solely those of the individual author(s) and contributor(s) and not of MDPI and/or the editor(s). MDPI and/or the editor(s) disclaim responsibility for any injury to people or property resulting from any ideas, methods, instructions or products referred to in the content. |
© 2025 by the authors. Licensee MDPI, Basel, Switzerland. This article is an open access article distributed under the terms and conditions of the Creative Commons Attribution (CC BY) license (https://creativecommons.org/licenses/by/4.0/).