Abstract
The characterization of Shiga toxin-producing Escherichia coli (STEC) is necessary to assess their pathogenic potential, but isolation of the strain from complex matrices such as milk remains challenging. In previous work, we have shown the potential of long-read metagenomics to characterize eae-positive STEC from artificially contaminated raw milk without isolating the strain. The presence of multiple E. coli strains in the sample was shown to potentially hinder the correct characterization of the STEC strain. Here, we aimed at determining the STEC:commensal ratio that would prevent the characterization of the STEC. We artificially contaminated pasteurized milk with different ratios of an eae-positive STEC and a commensal E. coli and applied the method previously developed. Results showed that the STEC strain growth was better than the commensal E. coli after enrichment in acriflavine-supplemented BPW. The STEC was successfully characterized in all samples with at least 10 times more STEC post-enrichment compared to the commensal E. coli. However, the presence of equivalent proportions of STEC and commensal E. coli prevented the full characterization of the STEC strain. This study confirms the potential of long-read metagenomics for STEC characterization in an isolation-free manner while refining its limit regarding the presence of background E. coli strains.
1. Introduction
Shiga toxin-producing Escherichia coli (STEC) are diarrheic E. coli characterized by the presence of a specific virulence factor: the Shiga toxin [1]. A subset of STEC, known as eae-positive STEC, additionally possesses the ability to adhere to the intestinal epithelium and cause attaching and effacing (A/E) lesions. Adhesion is conferred by the intimin protein encoded by the eae gene located on the locus of enterocyte effacement (LEE) pathogenicity island [2]. EFSA reports showed that eae-positive STEC are most frequently associated with severe human illnesses, especially hemolytic uremic syndrome (HUS) [3].
STEC detection methods in food products involve time-consuming isolation steps to characterize the STEC strain [4]. Isolation-free approaches for STEC characterization in food matrices would circumvent this but imply using metagenomics [5,6]. While short-read metagenomics enables STEC detection from complex matrices, it does not permit full characterization of the strain. In addition, different E. coli strains may be present in the same sample [7,8]. Thus, strain-level metagenomics for the identification of STEC such as eae-positive STEC or carrying other adhesion factors is challenging. Long-read metagenomics have been shown to be applicable for identifying eae-positive STEC in artificially contaminated beef, raw milk, and wastewater using different bio-informatics approaches [9,10,11].
In a previous study, we tested the feasibility of identifying an eae-positive STEC strain from artificially contaminated raw milk samples using long-read metagenomics. Assembly-based methods have the advantage of enabling the characterization of the STEC strain but depend on the contamination level [10,11]. We showed that it was possible to identify eae-positive STEC from 2.59 × 10⁸ copies.mL−1 of STEC in the absence of other interfering E. coli strains. Nevertheless, this study was a proof-of-principle, and the presence of a diverse background flora, as well as the presence of multiple E. coli strains, may hamper the analysis [10]. Since the STEC contamination level can be low (below 100 cells), it is necessary to determine the STEC full characterization limit in the presence of background E. coli using an assembly-based metagenomics approach.
In this study, we artificially co-contaminated pasteurized milk using increasing and known inoculation levels of a commensal E. coli and an eae-positive STEC strain, both originally isolated from raw milk. Because the natural background flora of raw milk and the potential presence of commensal E. coli may affect the growth of STEC, pasteurized milk was used to better control the STEC:commensal ratios [10]. Each contaminated milk sample was enriched in acriflavine-supplemented buffered peptone water (BPW) before sequencing. We used the published STECmetadetector pipeline on MinION-generated data [10] and determined the limit of this approach.
2. Materials and Methods
2.1. E. coli Strains Used for Artificial Co-Contamination
Two E. coli strains were used in this study for artificial contamination of pasteurized milk. One commensal E. coli (stx and eae negative) strain was isolated from cow raw milk in 2021. This strain (BfR-EC-19174, stx- eae-, O2:H10, ST 6527) was isolated following the ISO/TS 13136:2012 method [4]. Its serogroup was determined using seroagglutination [12] and further confirmed with qPCR using primers and probes as described by Delannoy and colleagues [13]. The second strain, 6423-O26, was an eae-positive STEC of serotype O26:H11 as already described [10,14]. Both strains BfR-EC-19174 (referred to as the commensal E. coli) and 6423-O26 (referred to as the eae-positive STEC) were revived from 20–30% glycerol stock on TSA plates. One colony was cultivated in brain heart infusion (BHI) overnight at 37 °C with agitation.
2.2. Artificial E. coli Mixtures
For each strain, one milliliter of overnight pure culture was used as a starting material for eight serial dilutions (1:10) in BHI or BPW. Optical density (OD) was measured at 600 nm using 1 mL BHI or 1 mL of the following: 1 mL BHI in 9 mL BPW, as a blank. For inoculum determination, triplicate cell counting was performed by plating three dilutions on tryptic soy agar (TSA) plates (100 µL) and incubated overnight at 37 °C. Five mixtures of the two E. coli strains were prepared as represented in Table 1.

Table 1.
Commensal E. coli and eae-positive STEC artificial mixtures used for co-contamination of pasteurized milk.
2.3. Co-Contamination of Pasteurized Milk
Pasteurized milk with 3.8% fat was bought from a grocery store in Berlin (Germany), and 1 mL was artificially contaminated with 1 mL of each mixture of commensal (BfR-EC-19174) and eae-positive STEC (6423-O26) prepared as mentioned in Table 1. For artificial contamination, three biological replicates of artificially contaminated milk samples were enriched for 18–20 h at 37 °C in 8 mL of BPW supplemented with acriflavine at a final concentration of 12 mg.L−1 [4].
2.4. DNA Extraction and Quality Control
One milliliter of milk-enriched mixtures was used for DNA extraction using the MasterPure Lucigen protocol as described by Jaudou et al., 2022 [10]. To ensure the feasibility of MinION sequencing, the quality of the extracted DNA was assessed using Nanodrop 1.0 (A260/A280 and A260/A230 ratios), and DNA was quantified using Qubit 3.0 and the broad range kit following the manufacturer’s instructions.
2.5. Detection and Quantification of Commensal and Eae-Positive STEC Strains Using qPCR and qdPCR, Respectively
Real-time PCR was performed to detect the presence of each strain used for the artificial contamination of pasteurized milk after enrichment and quantitative digital PCR (qdPCR) for quantitative estimation (number of copies.mL−1). The wzx gene coding for the O-antigen flippase is serogroup-specific and present in a single copy in the E. coli genome. Genetic markers wzxO2 and wzxO26 were used to detect and quantify the commensal and the eae-positive STEC, respectively, in each milk enrichment. Sequences for primers and probes are given in Table 2. Probes were labeled with 6-carboxyfluorescin (FAM) and black hole quencher (BHQ1) (Eurofins).
Table 2.
Primers and probes sequences for wzxO2 and wzxO26.
For real-time PCR, a mix (20 µL) containing 1X PerfeCTa qPCR ToughMix low ROX (QuantaBio), primers, and probes at a final concentration of 0.3 µM and completed with nuclease-free water was used for each marker. Extracted DNA (2 µL) was added to the mix. Targeted sequences were amplified using the CFX96 system (BioRad) with a first step at 95 °C for 10 min (5 °C.s−1), a second step consisting of 39 cycles at 95 °C for 15 s (2 °C.s−1) and at 60 °C for 1 min, and a final step at 40 °C for 30 s (5 °C.s−1).
Mixes for qdPCR were prepared as follows: 3 µL PerfeCTa 2X qPCR ToughMix low ROX (QuantaBio), 0.6 µL 20X GE sample loading reagent (Fluidigm), 0.3 µL 20X primer stock prepared using 18 µM for each primer (forward and reverse) and 4 µM of probe, and 1.8 µL of extracted DNA, completed to 6 µL with nuclease-free water. Quantitative digital PCR was run on qdPCR 37k IFC digital array microfluidic chips using a Biomark system (Standard BioTools). For amplification, the thermal profile constituted of a first step at 50 °C for 2 min and a second step at 95 °C for 10 min followed by 40 cycles at 95 °C for 15 sec and 60 sec at 60 °C (2 °C s−1). Data analysis was performed with the Fluidigm digital PCR analysis software v4.1.2.
Mixes as well as thermal profiles used for the two PCR methods are also detailed in [10]. Boiled DNA (from 1 mL of overnight culture, boiled at 95 °C for 10 min and centrifuged at 10 000 rpm for 5 min) from CB-16230 and BfR-EC-19174 strains was used as a positive control for wzxO26 and wzxO2, respectively. A non-template control was also included.
2.6. MinION Sequencing of Artificially Co-Contaminated Milk
Two biological replicates of each enrichment were sequenced using the MinION platform except for Mix3 for which all replicates were sequenced. Libraries were prepared using the SLK-SQK109 ligation sequencing and the EXP-NBD104 or EXP-NBD114 barcoding kits, as previously described [10]. Five to six samples were loaded on FLO-MIN106 R9.4.1 flow cells and sequenced using the Mk1C device without live basecalling or demultiplexing.
2.7. Sequencing Data Analysis
Raw data (fast5 files) were basecalled using guppy_basecaller v6.0.1 + 652ffd1 and the super high accuracy model including a q-score filter of 10. Data were demultiplexed using guppy_barcoder v6.0.1 + 652ffd1 and –trim-adapters and –compress-fastq parameters. Basecalled and demultiplexed data were processed using the STECmetadetector pipeline v0.1.2 [10] (https://gitlab.com/bfr_bioinformatics/STECmetadetector, accessed on 26 July 2023). Extracted E. coli reads in fastq format were deposited in NCBI BioProject PRJNA982778. We assumed that the inoculated STEC strain was fully characterized when the two virulence genes stx and eae were co-located on the same contig. The figures were generated using ggplot2 v3.4.0, reshape2 v1.4.4, and patchwork v1.1.2 packages on R v4.1.2 and R studio v2021.9.0.351 [16,17,18]. The O-antigen clusters for O2 and O50 differ by a maximum of 2 potential SNPs [13,19] and are therefore considered identical and treated as a single molecular serogroup [20]. However, wzyO2 and wzyO50 (1 SNP difference, which cannot be reliably differentiated using MinION sequencing) have separate entries in the database included in the STECmetadetector pipeline. On the contrary, there is a single entry for wzxO2/O50. In the mapping analyses, reads mapping on wzyO2 and wzyO50 were thus combined.
3. Results
3.1. Estimation of the Inoculation Level Using Cell Counting and Post-Enrichment Quantification Using qdPCR
In order to determine the STEC:commensal ratio that would prevent the full characterization of the eae-positive STEC strain, we used five mixes to contaminate pasteurized milk samples. In Mix 1, we used an equal ratio of STEC and commensal strain before enrichment. In Mixes 2 and 3, we used a commensal strain 10 times and 100 times in excess compared to the STEC strain, respectively. In Mixes 4 and 5, we used a STEC strain 10 times and 100 times in excess compared to the commensal strain, respectively. Actual STEC and commensal strain inoculation levels used for the five mixes were determined using plate counting on TSA. Results are reported in Table 3. Each mix was used to artificially contaminate pasteurized milk before enrichment at 37 °C in acriflavine-supplemented BPW. To estimate the growth of the two strains during enrichment, we used qdPCR on their respective O-group genetic marker (wzxO26 for the STEC and wzxO2 for the commensal). Quantification of the two strains after enrichment is also reported (Table 3).
Table 3.
Estimated inoculum (CFU.mL−1) and relative quantification (qdPCR, copies.mL−1) of the commensal and eae-positive STEC strain after enrichment of artificially co-contaminated milk.
The results show that the conditions used here for enrichment (37 °C with acriflavine) seemed to favor the growth of the STEC O26 strain compared to the O2 commensal strain (8.62 × 10⁷–5.94 × 10⁸ copies.mL−1, mean = 4.07 × 10⁸ copies.mL−1 for the STEC and 3.74 × 10⁵–2.29 × 10⁸ copies.mL−1, mean = 5.10 × 10⁷ copies.mL−1 for the commensal) regardless of the inoculation level of the commensal O2 strain (1.43 × 10² to 1.39 × 10⁴ CFU.mL−1). The O26 STEC strain always reached the 108 copies.mL−1 threshold previously determined as the minimal quantity required for a single strain assembly [10]. The STEC strain was quantified approximately 1 to 3 logs higher than the commensal strain in all mixtures except Mix 3 (inoculation STEC:commensal ratio of 1:100) (Table 3). In this condition (Mix 3), the commensal strain was inoculated at a concentration 100 times higher than the STEC, but quantification results on O2 and O26 strains were similar post-enrichment (1.66 × 10⁸ and 3.86 × 10⁸ copies.mL−1 for O2 and O26, respectively). Although the O2 inoculation level corresponded to an O26:O2 ratio of 1:221 (Table 3), the STEC strain still appeared to grow to a ratio that reached 2:1 (O26:O2) (Table 3).
3.2. Characterization of the STEC Strain in Presence of Commensal E. coli Using STECmetadetector
Two replicates of each condition and three replicates for the condition with equal levels of STEC:commensal post-enrichment (Mix 3) were sequenced using MinION sequencing, and data were analyzed using the STECmetadetector pipeline.
The STECmetadetector pipeline includes an initial mapping step to detect the presence of multiple O-groups in the set of E. coli reads. Figure 1 represents the read mapping depth on O-groups (wzx and wzy genetic markers) for O26 and O2. Mapping results were in line with quantification results (qdPCR) showing a higher number of reads mapped to O26 compared to O2. When the O2 strain was quantified below 108 copies.mL−1 in the enriched samples (Mixes 1, 2, 4, and 5), only a few reads corresponding to O2 could be detected. The low read count attributable to the O2 strain explains the apparent ratio difference between qdPCR and mapping, especially in Mixes 4 and 5.
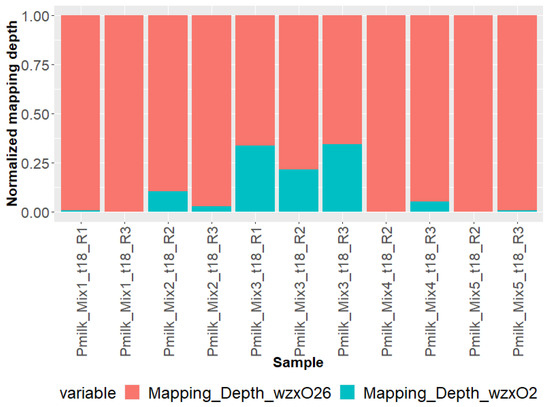
Figure 1.
E. coli reads mapping depth on wzx/wzyO26 and wzx/wzyO2 genetic markers determined using STECmetadetector pipeline.
Assemblies of E. coli reads were performed using Flye included in the STECmetadetector pipeline. The inoculated STEC strain was considered fully characterized when the two virulence genes stx and eae were co-localized on the same contig. Figure 2 shows that the eae-positive O26 STEC was characterized in 7/11 samples of artificially co-contaminated pasteurized milk. For all of those samples, the chromosome was in one contig with stx, eae, and serotype genetic markers (wzx/wzyO26 and fliCH11) co-localized (Figure 2). The STEC strain was successfully characterized using the STECmetadetector pipeline in all samples in which the O26 strain attained 108 copies.mL−1 and the O26:O2 ratio (determined by qdPCR or mapping) was at least 10:1. The only exception was for one replicate of Mix 1 (Pmilk_Mix1_R1) in which O26 was quantified to 8.62 × 10⁷ copies.mL−1 after enrichment (Supplementary File S1).
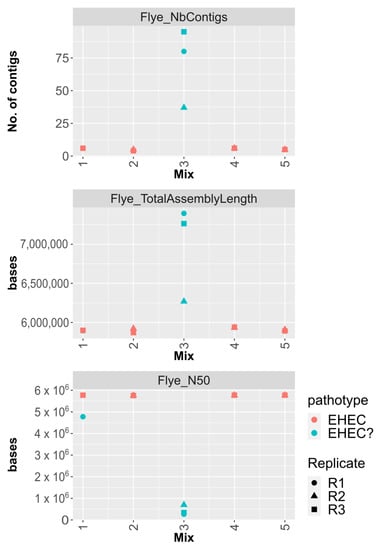
Figure 2.
Metrics of assemblies generated using Flye on extracted E. coli reads obtained from co-contamination of a commensal E.coli and STEC in pasteurized milk. The number of contigs, total assembly length (in bases), and the assembly N50 value are represented for each Mix. Mix 1 corresponds to co-contamination using equal proportions of the two strains and Mixes 2 and 3 to inoculation levels with 10 times and 100 times higher concentration of commensal, while Mixes 4 and 5 corresponds to inoculation levels with 10 times and 100 times higher concentration of STEC, respectively. The biological replicate (R1, R2, and R3) is represented by a specific symbol. A red color represents successful characterization of the STEC strain while a turquoise color represents when stx and eae were not identified on the same contig.
When the STEC and commensal strains were in equivalent quantities post-enrichment (i.e., Mix3), the O26 eae-positive STEC strain could not be characterized, even though it reached 108 copies.mL−1. All assemblies from these samples (Pmilk_Mix3) were highly fragmented (Figure 2). In this condition, the STEC:commensal ratio after enrichment was 2:1 as quantified using qdPCR and below 10:1 as determined using mapping (Table 3 and Supplementary File S2).
4. Discussion
LEE-positive STEC constitute the STEC subgroup most frequently associated with severe human symptoms such as hemorrhagic colitis or HUS. Therefore, methods for detecting STEC in food samples often include the detection of both stx and eae genes by qPCR followed by the characterization of an isolated strain [4]. The characterization of STEC strains detected in contaminated food products is important in order to evaluate their pathogenic potential, but the isolation of a STEC strain from food products is often unsuccessful.
In previous work, we developed long-read metagenomics as an approach to characterize STEC strains from raw milk in an isolation-free manner. We have shown that STEC characterization directly from raw milk is possible but is hindered by the presence of background flora and multiple E. coli strains [10]. Cattle are asymptomatic carriers of STEC and can carry from 10 to 109 CFU of STEC per gram of feces [21,22]. The main source of milk contamination comes from cattle feces in which not only STEC but also different E. coli strains may be present simultaneously [23]. To the best of our knowledge, there is no study that assesses the ratio of STEC to other E. coli in milk samples or cattle feces samples. Although we have shown that long-read metagenomics is suitable for characterizing STEC in complex matrices such as raw milk, it is important to assess the limit of background E. coli that would impede the characterization of the STEC using the STECmetadetector pipeline.
Here, we aimed at determining the ratio of commensal E. coli to STEC that would prevent the characterization of STEC. Background flora may limit the growth of the E. coli strains, which leads to lower output of E. coli reads. In our previous work, we used acriflavine, an antibiotic targeting Gram-positive bacteria, to handle the influence of background flora limiting E. coli strains growth [4,10]. In this study, even though we do not have background flora in pasteurized milk, we used the same enrichment conditions, including the use of acriflavine as it may potentially affect the growth of STEC and non-pathogenic E. coli differently [10,24].
We had previously determined that eae-positive STEC could be characterized using long-read metagenomics and an assembly-based approach from 2.59 × 10⁸ copies.mL−1 post-enrichment in the absence of commensal E. coli flora in the milk [10]. The results obtained in this study were in line with what was determined before and allowed us to refine the characterization threshold. Overall, we estimated that a minimum of 108 copies.mL−1 of STEC is required to achieve STEC characterization. Indeed, here, samples where the eae-positive STEC strain was in a 10 times excess over the commensal strain and quantified above 108 copies.mL−1 post-enrichment were characterized. In addition, samples in which the commensal strain was below 108 copies.mL−1 post-enrichment yielded very few reads corresponding to this strain, which then failed to assemble. The commensal strain reached the characterization threshold only when inoculated 100 times in excess of the STEC strain but resulted in a ratio of 2:1 STEC:commensal post-enrichment. As a consequence, it appears that the STEC:commensal ratio is another important factor to evaluate.
In all pasteurized milk samples artificially co-contaminated, the inoculated eae-positive STEC strain was characterized when it was quantified above 108 copies.mL−1 post-enrichment and at least one log higher than the commensal strain. The exception was for one replicate inoculated with Mix 1 in which the estimated level of STEC determined using qdPCR was slightly below the 108 copies.mL−1 threshold. The limiting condition for characterizing the STEC strain appears to be when the two strains grew to an equivalent ratio post-enrichment.
It is noteworthy that the enrichment conditions seem to affect the growth of the two E. coli strains differently. Indeed, the ratio of STEC:commensal has evolved drastically after enrichment from the inoculated levels. The STEC strain was quantified to higher levels than the commensal strain post-enrichment, even when inoculated 10 times less. Owing to their cell wall structure and the presence of the AcrB efflux pump, E. coli should not be sensitive to acriflavine [25]. In our previous work, we compared the growth of the STEC strain used in this study (6423-O26) in the presence and absence of acriflavine and observed no negative impact of acriflavine on the growth of this strain. It is, however, possible that the acriflavine used during enrichment affected the growth of the commensal E. coli strain (BfR-EC-19174). Some studies have already observed a strain-dependent effect of enrichment conditions [24,26,27]. Another option is a possible competition between the STEC and the commensal E. coli strain, with an advantage for the STEC growth. However, analysis of the genome sequences of both strains indicated the presence of multiple bacteriocins, although the level of expression of these bacteriocins was not examined [28].
Despite the possible influence of the enrichment conditions on the growth of the two strains, the limits that were determined in this study are more related to the post-enrichment steps, including DNA extraction, library preparation, data acquisition, and data processing [29]. It has been shown that the DNA extraction procedure can affect the structure of the population, especially in these particular conditions where high quantities of high-molecular-weight DNA are required (MinION sequencing from complex matrices) [30]. Similarly, according to the properties of the DNA (for example, GC content), the library preparation step performs differently [31,32,33]. Both DNA extraction and the performance of library preparation steps constitute the first bias that may lead to a different population structure compared to the original sample [29,34,35]. The second main bias is introduced by the sequencing technology and the data processing part. MinION sequencing does not provide a homogenous quantity of data, read length, or quality across flow cells and samples. Some studies have demonstrated that high-GC species are under-represented in sequencing reads and contain a higher error rate [36,37]. In addition, the removal of the shortest reads and low-quality data during filtering steps might increase the bias in the population structure.
In this study, we used the depth of read mapping to the O-group genetic markers to estimate the O26:O2 ratio and check whether it differed from the ratio observed using qdPCR post-enrichment. The ratio determined using qdPCR and mapping was in a similar order of magnitude for samples of Mixes 1, 2, and 3, whereas the ratio observed for Mix 4 and Mix 5 were 100 and 10 times higher, respectively, using qdPCR (O26:O2 of 1000:1) than using the mapping approach (ratios of 10:1 and 100:1, respectively, for each mix). Considering the difference in proportion between the two strains, as estimated using qdPCR, the required amount of sequencing data could not be generated to reach a similar ratio of 1000:1. Our results suggest that the different post-enrichment steps performed here did not influence the O26:O2 ratio.
The main limitation of our approach concerns the assembly process. Indeed, when the two strains reached the required level for full characterization but were present at an equivalent ratio (Mix3 O26:O2 ratio below 10:1), the assembler failed to distinguish the STEC from the commensal strain. Current long-read assemblers (even those allowing metagenomics assemblies) are not able to differentiate different strains from the same species (less than 5% ANI divergence) since they share many genomic regions [38,39]. Although different strains will behave differently during the enrichment step, we showed that to be characterized, the amount of STEC data should be at least 10 times in excess compared to the commensal strain. It is important to note that six samples were multiplexed per MinION flow cell. Different multiplexing conditions would lead to different thresholds.
5. Conclusions
Overall, this study refined the limit of the long-read metagenomics approach developed in previous work to characterize eae-positive STEC in raw milk. In the conditions of this study, we observed that an eae-positive STEC strain can be characterized without the need to isolate the strain if the STEC strain can grow at least 10 times in excess compared to background E. coli strains post-enrichment, provided that the background flora does not prevent it from reaching the 108 copies.mL−1. Additionally, this study highlights the need for strain-aware assemblers or alternative approaches that would help identify different strains from a single species.
Under certain conditions, isolation-independent approaches are promising and could be applied in the case of ambiguous results that render decision making difficult, particularly when the STEC strain cannot be isolated. Many studies on STEC prevalence in cattle have been conducted but none on STEC prevalence compared to background E. coli [40,41]. Such studies would give insights into the application of long-read metagenomic approaches to characterize STEC among other E. coli.
Supplementary Materials
The following supporting information can be downloaded at: https://www.mdpi.com/article/10.3390/microorganisms11082043/s1. File S1: Relative quantification (qdPCR, copies.mL−1) of the commensal (O2) and eae-positive STEC (O26) strain after enrichment of artificially co-contaminated milk. File S2: Reads mapping depth on the commensal (O2) and on the eae-positive STEC (O26) genetic marker from the E. coli set of reads.
Author Contributions
S.D., J.G., P.F., B.M., E.S., A.G., F.V., C.D. and S.J. conceptualized the project. Methodology and resources by P.F., B.M., J.G., S.D., F.V., C.D., E.S. and AG. Formal analysis by S.J. and C.D. S.J., M.-L.T. and C.S. conducted investigations. P.F. and B.M. were in charge of funding acquisition. S.J. wrote the original draft reviewed and validated by all authors. All authors have read and agreed to the published version of the manuscript.
Funding
This project was funded by the German Federal Institute for Risk Assessment (BfR) under grant no. 1322–765 and by the French Agency for Food, Environmental and Occupational Health and Safety (ANSES). The study was realized during the Ph.D. of S.J. (shared Ph.D. student between ANSES and BfR).
Data Availability Statement
The STECmetadetector pipeline is freely available at https://gitlab.com/bfr_bioinformatics/STECmetadetector, accessed on 26 July 2023). The extracted Escherichia coli reads from each sample were deposited on NCBI under BioProject PRJNA982778 available at http://www.ncbi.nlm.nih.gov/bioproject/982778, accessed on 26 July 2023.
Conflicts of Interest
The authors declare no conflict of interest.
References
- Kaper, J.B.; Nataro, J.P.; Mobley, H.L. Pathogenic Escherichia coli. Nat. Rev. Microbiol. 2004, 2, 123–140. [Google Scholar] [CrossRef]
- Tobe, T.; Beatson, S.A.; Taniguchi, H.; Abe, H.; Bailey, C.M.; Fivian, A.; Younis, R.; Matthews, S.; Marches, O.; Frankel, G.; et al. An Extensive Repertoire of Type III Secretion Effectors in Escherichia coli O157 and the Role of Lambdoid Phages in Their Dissemination. Proc. Natl. Acad. Sci. USA 2006, 103, 14941–14946. [Google Scholar] [CrossRef]
- EFSA; 2020 EFSA BIOHAZ Panel (EFSA Panel on Biological Hazards); Koutsoumanis, K.; Allende, A.; Alvarez-Ordóñez, A.; Bover-Cid, S.; Chemaly, M.; Davies, R.; De Cesare, A.; Herman, L.; et al. Pathogenicity Assessment of Shiga Toxin-Producing Escherichia coli (STEC) and the Public Health Risk Posed by Contamination of Food with STEC. EFSA J. 2020, 18, 5967. [Google Scholar] [CrossRef]
- ISO/TS 13136; Microbiology of Food and Animal Feed—Real-Time Polymerase Chain Reaction (PCR)—Based Method for the Detection of Food-Borne Pathogens—Horizontal Method for the Detection of Shiga Toxin-Producing Escherichia coli (STEC) and the Determination of O157, O111, O26, O103, and O145 Serogroups. ISO (International Organization for Standardization): Geneva, Switzerland, 2012.
- Leonard, S.R.; Mammel, M.K.; Lacher, D.W.; Elkins, C.A. Application of Metagenomic Sequencing to Food Safety: Detection of Shiga Toxin-Producing Escherichia coli on Fresh Bagged Spinach. Appl. Environ. Microbiol. 2015, 81, 8183–8191. [Google Scholar] [CrossRef]
- Loman, N.J.; Constantinidou, C.; Christner, M.; Rohde, H.; Chan, J.Z.-M.; Quick, J.; Weir, J.C.; Quince, C.; Smith, G.P.; Betley, J.R.; et al. A Culture-Independent Sequence-Based Metagenomics Approach to the Investigation of an Outbreak of Shiga-Toxigenic Escherichia coli O104:H4. JAMA 2013, 309, 1502–1510. [Google Scholar] [CrossRef]
- Leonard, S.R.; Mammel, M.K.; Lacher, D.W.; Elkins, C.A. Strain-Level Discrimination of Shiga Toxin-Producing Escherichia coli in Spinach Using Metagenomic Sequencing. PLoS ONE 2016, 11, e0167870. [Google Scholar] [CrossRef]
- Buytaers, F.E.; Saltykova, A.; Denayer, S.; Verhaegen, B.; Vanneste, K.; Roosens, N.H.C.; Piérard, D.; Marchal, K.; De Keersmaecker, S.C.J. A Practical Method to Implement Strain-Level Metagenomics-Based Foodborne Outbreak Investigation and Source Tracking in Routine. Microorganisms 2020, 8, 1191. [Google Scholar] [CrossRef]
- Buytaers, F.E.; Saltykova, A.; Denayer, S.; Verhaegen, B.; Vanneste, K.; Roosens, N.H.C.; Piérard, D.; Marchal, K.; De Keersmaecker, S.C.J. Towards Real-Time and Affordable Strain-Level Metagenomics-Based Foodborne Outbreak Investigations Using Oxford Nanopore Sequencing Technologies. Front. Microbiol. 2021, 12, 738284. [Google Scholar] [CrossRef]
- Jaudou, S.; Deneke, C.; Tran, M.-L.; Schuh, E.; Goehler, A.; Vorimore, F.; Malorny, B.; Fach, P.; Grützke, J.; Delannoy, S. A Step Forward for Shiga Toxin-Producing Escherichia coli Identification and Characterization in Raw Milk Using Long-Read Metagenomics. Microb. Genom. 2022, 8, mgen000911. [Google Scholar] [CrossRef]
- Maguire, M.; Kase, J.A.; Roberson, D.; Muruvanda, T.; Brown, E.W.; Allard, M.; Musser, S.M.; González-Escalona, N. Precision Long-Read Metagenomics Sequencing for Food Safety by Detection and Assembly of Shiga Toxin-Producing Escherichia coli in Irrigation Water. PLoS ONE 2021, 16, e0245172. [Google Scholar] [CrossRef]
- Ørskov, F.; Ørskov, I. 2 Serotyping of Escherichia Coli The Terminology Used to Describe the Different Classes of Bacterial Antigens Is Explained in the Preface. However, the Authors Would like to Mention That a Different Convention Is Used in Some Laboratories, for Example O:L, K:L, H:7 Is Equivalent to O1:K1:H7. In Methods in Microbiology; Bergan, T., Ed.; Academic Press: London, UK, 1984; Volume 14, pp. 43–112. ISBN 0580-9517. [Google Scholar]
- Delannoy, S.; Beutin, L.; Mariani-Kurkdjian, P.; Fleiss, A.; Bonacorsi, S.; Fach, P. The Escherichia Coli Serogroup O1 and O2 Lipopolysaccharides Are Encoded by Multiple O-Antigen Gene Clusters. Front. Cell. Infect. Microbiol. 2017, 7, 30. [Google Scholar] [CrossRef]
- Sandra, J.; Mai-Lan, T.; Fabien, V.; Patrick, F.; Sabine, D. Hybrid Assembly from 75 E. coli Genomes Isolated from French Bovine Food Products between 1995 and 2016. Microbiol. Resour. Announc. 2023, 12, e01095-22. [Google Scholar] [CrossRef]
- Perelle, S.; Dilasser, F.; Grout, J.; Fach, P. Detection by 5′-Nuclease PCR of Shiga-Toxin Producing Escherichia Coli O26, O55, O91, O103, O111, O113, O145 and O157:H7, Associated with the World’s Most Frequent Clinical Cases. Mol. Cell. Probes 2004, 18, 185–192. [Google Scholar] [CrossRef]
- R Core Team. R: A Language and Environment for Statistical Computing; R Foundation for Statistical Computing: Vienna, Austria, 2018; Available online: https://www.R-Project.Org/ (accessed on 26 July 2023).
- Wickham, H. Ggplot2: Elegant Graphics for Data Analysis; Springer: New York, NY, USA, 2016; ISBN 978-3-319-24277-4. [Google Scholar]
- Wickham, H. Reshaping Data with the Reshape Package. J. Stat. Soft. 2007, 21, 1–20. [Google Scholar] [CrossRef]
- Iguchi, A.; Iyoda, S.; Kikuchi, T.; Ogura, Y.; Katsura, K.; Ohnishi, M.; Hayashi, T.; Thomson, N.R. A Complete View of the Genetic Diversity of the Escherichia coli O-Antigen Biosynthesis Gene Cluster. DNA Res. 2015, 22, 101–107. [Google Scholar] [CrossRef]
- DebRoy, C.; Fratamico, P.M.; Yan, X.; Baranzoni, G.; Liu, Y.; Needleman, D.S.; Tebbs, R.; O’Connell, C.D.; Allred, A.; Swimley, M.; et al. Comparison of O-Antigen Gene Clusters of All O-Serogroups of Escherichia coli and Proposal for Adopting a New Nomenclature for O-Typing. PLoS ONE 2016, 11, e0147434. [Google Scholar] [CrossRef]
- Chase-Topping, M.; Gally, D.; Low, C.; Matthews, L.; Woolhouse, M. Super-Shedding and the Link between Human Infection and Livestock Carriage of Escherichia coli O157. Nat. Rev. Microbiol. 2008, 6, 904–912. [Google Scholar] [CrossRef]
- Stephens, T.P.; McAllister, T.A.; Stanford, K. Perineal Swabs Reveal Effect of Super Shedders on the Transmission of Escherichia coli O157:H7 in Commercial Feedlots. J. Anim. Sci. 2009, 87, 4151–4160. [Google Scholar] [CrossRef][Green Version]
- Cookson, A.L.; Biggs, P.J.; Marshall, J.C.; Reynolds, A.; Collis, R.M.; French, N.P.; Brightwell, G. Culture Independent Analysis Using Gnd as a Target Gene to Assess Escherichia coli Diversity and Community Structure. Sci. Rep. 2017, 7, 841. [Google Scholar] [CrossRef]
- Baylis, C.L. Growth of Pure Cultures of Verocytotoxin-Producing Escherichia coli in a Range of Enrichment Media. J. Appl. Microbiol. 2008, 105, 1259–1265. [Google Scholar] [CrossRef]
- Murakami, S. Multidrug Efflux Transporter, AcrB—The Pumping Mechanism. Curr. Opin Struct. Biol. 2008, 18, 459–465. [Google Scholar] [CrossRef]
- Amagliani, G.; Rotundo, L.; Carloni, E.; Omiccioli, E.; Magnani, M.; Brandi, G.; Fratamico, P. Detection of Shiga Toxin-Producing Escherichia coli (STEC) in Ground Beef and Bean Sprouts: Evaluation of Culture Enrichment Conditions. Food Res. Int. 2018, 103, 398–405. [Google Scholar] [CrossRef]
- Mancusi, R.; Trevisani, M. Enumeration of Verocytotoxigenic Escherichia coli (VTEC) O157 and O26 in Milk by Quantitative PCR. Int. J. Food Microbiol. 2014, 184, 121–127. [Google Scholar] [CrossRef]
- Bosák, J.; Hrala, M.; Micenková, L.; Šmajs, D. Non-Antibiotic Antibacterial Peptides and Proteins of Escherichia coli: Efficacy and Potency of Bacteriocins. Expert Rev. Anti-Infect. Ther. 2021, 19, 309–322. [Google Scholar] [CrossRef]
- Pollock, J.; Glendinning, L.; Wisedchanwet, T.; Watson, M. The Madness of Microbiome: Attempting To Find Consensus “Best Practice” for 16S Microbiome Studies. Appl. Environ. Microbiol. 2018, 84, e02627-17. [Google Scholar] [CrossRef]
- Goussarov, G.; Mysara, M.; Vandamme, P.; Van Houdt, R. Introduction to the Principles and Methods Underlying the Recovery of Metagenome-Assembled Genomes from Metagenomic Data. Microbiologyopen 2022, 11, e1298. [Google Scholar] [CrossRef]
- Browne, P.D.; Nielsen, T.K.; Kot, W.; Aggerholm, A.; Gilbert, M.T.P.; Puetz, L.; Rasmussen, M.; Zervas, A.; Hansen, L.H. GC Bias Affects Genomic and Metagenomic Reconstructions, Underrepresenting GC-Poor Organisms. Gigascience 2020, 9, giaa008. [Google Scholar] [CrossRef]
- Sato, M.P.; Ogura, Y.; Nakamura, K.; Nishida, R.; Gotoh, Y.; Hayashi, M.; Hisatsune, J.; Sugai, M.; Takehiko, I.; Hayashi, T. Comparison of the Sequencing Bias of Currently Available Library Preparation Kits for Illumina Sequencing of Bacterial Genomes and Metagenomes. DNA Res. 2019, 26, 391–398. [Google Scholar] [CrossRef]
- Ross, M.G.; Russ, C.; Costello, M.; Hollinger, A.; Lennon, N.J.; Hegarty, R.; Nusbaum, C.; Jaffe, D.B. Characterizing and Measuring Bias in Sequence Data. Genome Biol. 2013, 14, R51. [Google Scholar] [CrossRef]
- Sevim, V.; Lee, J.; Egan, R.; Clum, A.; Hundley, H.; Lee, J.; Everroad, R.C.; Detweiler, A.M.; Bebout, B.M.; Pett-Ridge, J.; et al. Shotgun Metagenome Data of a Defined Mock Community Using Oxford Nanopore, PacBio and Illumina Technologies. Sci. Data 2019, 6, 285. [Google Scholar] [CrossRef]
- Stevens, B.M.; Creed, T.B.; Reardon, C.L.; Manter, D.K. Comparison of Oxford Nanopore Technologies and Illumina MiSeq Sequencing with Mock Communities and Agricultural Soil. Sci. Rep. 2023, 13, 9323. [Google Scholar] [CrossRef]
- Delahaye, C.; Nicolas, J. Sequencing DNA with Nanopores: Troubles and Biases. PLoS ONE 2021, 16, e0257521. [Google Scholar] [CrossRef]
- Laver, T.; Harrison, J.; O’Neill, P.A.; Moore, K.; Farbos, A.; Paszkiewicz, K.; Studholme, D.J. Assessing the Performance of the Oxford Nanopore Technologies MinION. Biomol. Detect. Quantif. 2015, 3, 1–8. [Google Scholar] [CrossRef]
- Kazantseva, E.; Donmez, A.; Pop, M.; Kolmogorov, M. StRainy: Assembly-Based Metagenomic Strain Phasing Using Long Reads. bioRxiv 2023. [Google Scholar] [CrossRef]
- Luo, X.; Kang, X.; Schönhuth, A. Enhancing Long-Read-Based Strain-Aware Metagenome Assembly. Front. Genet. 2022, 13, 868280. [Google Scholar] [CrossRef]
- Ray, R.; Singh, P. Prevalence and Implications of Shiga Toxin-Producing E. coli in Farm and Wild Ruminants. Pathogens 2022, 11, 1332. [Google Scholar] [CrossRef]
- Dewsbury, D.M.A.; Cernicchiaro, N.; Sanderson, M.W.; Dixon, A.L.; Ekong, P.S. A Systematic Review and Meta-Analysis of Published Literature on Prevalence of Non-O157 Shiga Toxin-Producing Escherichia coli Serogroups (O26, O45, O103, O111, O121, and O145) and Virulence Genes in Feces, Hides, and Carcasses of Pre- and Peri-Harvest Cattle Worldwide. Anim. Health Res. Rev. 2022, 23, 1–24. [Google Scholar] [CrossRef]
Disclaimer/Publisher’s Note: The statements, opinions and data contained in all publications are solely those of the individual author(s) and contributor(s) and not of MDPI and/or the editor(s). MDPI and/or the editor(s) disclaim responsibility for any injury to people or property resulting from any ideas, methods, instructions or products referred to in the content. |
© 2023 by the authors. Licensee MDPI, Basel, Switzerland. This article is an open access article distributed under the terms and conditions of the Creative Commons Attribution (CC BY) license (https://creativecommons.org/licenses/by/4.0/).