Article

Differences in the Shiga Toxin (Stx) 2a Phage Regulatory Switch Region Influence Stx2 Localization and Virulence of Stx-Producing Escherichia coli in Mice

by
Rama R. Atitkar
1,2 and
Angela R. Melton-Celsa
1,*
1
Department of Microbiology and Immunology, Uniformed Services University of the Health Sciences, Bethesda, MD 20814, USA
2
Henry M. Jackson Foundation for the Advancement of Military Medicine, Inc., Bethesda, MD 20817, USA
*
Author to whom correspondence should be addressed.
Microorganisms 2023, 11(8), 1925; https://doi.org/10.3390/microorganisms11081925
Submission received: 14 June 2023 / Revised: 21 July 2023 / Accepted: 26 July 2023 / Published: 28 July 2023

Abstract

:
Shiga toxin (Stx)-producing Escherichia coli (STEC) is a major cause of foodborne illness globally, and infection with serotype O157:H7 is associated with increased risk of hospitalization and death in the U.S. The Stxs are encoded on a temperate bacteriophage (stx-phage), and phage induction leads to Stx expression; subtype Stx2a in particular is associated with more severe disease. Our earlier studies showed significant levels of RecA-independent Stx2 production by STEC O157:H7 strain JH2010 (stx2astx2c), even though activated RecA is the canonical trigger for stx-phage induction. This study aimed to further compare and contrast RecA-independent toxin production in Stx2-producing clinical isolates. Deletion of recA in JH2010 resulted in higher in vitro supernatant cytotoxicity compared to that from JH2016ΔrecA, and the addition of the chelator ethylenediaminetetraacetic acid (EDTA) and various metal cations to the growth medium exacerbated the difference in cytotoxicity exhibited by the two deletion strains. Both the wild-type and ΔrecA deletion strains exhibited differential cytotoxicity in the feces of infected, streptomycin (Str)-treated mice. Comparison of the stx2a-phage predicted protein sequences from JH2010 and JH2016 revealed low amino acid identity of key phage regulatory proteins that are involved in RecA-mediated stx-phage induction. Additionally, other STEC isolates containing JH2010-like and JH2016-like stx2a-phage sequences led to similar Stx2 localization, as demonstrated by JH2010ΔrecA and JH2016ΔrecA, respectively. Deletion of the stx2a-phage regulatory region in the wild-type strains prevented the differential localization of Stx2 into the culture supernatant, a finding that suggests that the stx2a-phage regulatory region is involved in the differential ΔrecA phenotypes exhibited by the two strains. We hypothesize that the amino acid differences between the JH2010 and JH2016 phage repressor proteins (CIs) lead to structural differences that are responsible for differential interaction with RecA. Overall, we discovered that non-homologous stx2a-phage regulatory proteins differentially influence RecA-independent, and possibly RecA-dependent, Stx2 production. These findings emphasize the importance of studying non-homologous regulatory elements among stx2-phages and their influence on Stx2 production and virulence of STEC isolates.

1. Introduction

Shiga toxin (Stx)-producing Escherichia coli (STEC) causes an estimated 265,000 cases of gastrointestinal disease in the U.S. annually [1]. The majority of these cases are sporadic infections, but large, multi-state STEC outbreaks also occur. Almost 40% of the total number of STEC cases are linked to serotype O157:H7 isolates. In addition, serotype O157:H7 STEC are more frequently associated with outbreaks and severe disease progression in the U.S. than other STEC serotypes [2,3]. Mild STEC cases present as diarrhea and abdominal cramps, with most patients experiencing self-limiting and self-resolving symptoms. However, the development of severe gastrointestinal symptoms (including bloody diarrhea and hemorrhagic colitis) is linked to the development of hemolytic uremic syndrome (HUS), a systemic sequela of the STEC infection. Progression to HUS occurs in approximately 3–7% of STEC patients, although some outbreaks have HUS rates as high as 25% [4]. HUS patients suffer kidney damage in addition to hemolytic anemia and thrombocytopenia. Severe HUS cases may result in long-term kidney damage or death.
Severe systemic symptoms of STEC infection are mediated by Stx activity. Stx binds to Gb3 on the surface of susceptible cells and is translocated in a retrograde manner to the cytoplasm, where it targets host cell ribosomes and prevents host cell protein synthesis [5]. Toxin types Stx1 and Stx2 have the same mode of action, but are antigenically distinct. Each toxin type can be further divided into subtypes of varying toxicity; subtypes Stx2a, Stx2c, and Stx2d in particular have been associated with more severe human disease [6]. The Stx-encoding genes (stx) are found on a temperate lambdoid bacteriophage (stx-phage). Typically, the stx phage is integrated within the bacterial chromosome (called lysogeny), but can be induced into the lytic cycle by activated RecA (RecA*). The stx-phage lytic cycle involves the replication and packaging of phage genomes into phage particles that are eventually released from the cell through bacterial lysis. The stx genes are expressed as late genes during the phage lytic cycle; thus, increased stx-phage induction is associated with increased Stx expression and release [7]. In fact, the DNA-damaging antibiotic ciprofloxacin (Cip) increases RecA-dependent stx-phage induction and Stx production, and its use has been linked to more severe disease in STEC-infected children [8].
While RecA* is primarily responsible for lambda phage induction, low levels of induction can still be detected in recA-negative strains, a finding that shows that there are RecA-independent mechanisms of phage induction [9,10]. Due to the lambdoid classification of stx-phages, one would predict that the deletion of recA in stx-phage-containing strains would also reveal RecA-independent mechanisms of phage induction. However, a study on O157:H7 STEC strains EDL933 and 86–24 reported no detectable phage particles or Stx production in vitro in recA mutant strains [11]. In contrast, RecA-independent stx-phage induction was detected in uninduced cultures from E. coli K-12 stx-phage lysogens [12,13]. We previously found that deletion of recA in JH2010, a stx2astx2c O157:H7 STEC strain, led to only a 100-fold reduction of in vitro and in vivo cytotoxicity compared to wild-type JH2010, a result that indicates high levels of recA-independent Stx2 production [14].
This study aimed to further compare and contrast RecA-independent toxin production in Stx2-producing O157:H7 clinical isolates. Overall, we discovered that non-homologous stx2a-phage regulatory proteins differentially influence RecA-independent Stx production, possibly through differences in CI-mediated repression of the stx-phage.

2. Materials and Methods

Bacterial Strains and Plasmids. Bacterial cultures (1–2 mL) were grown overnight in LB-YE (10 g tryptone and 5 g NaCl per liter) at 37 °C, 250 RPM for 16–18 h. Cultures were started from 3 single colonies picked from a plate. When necessary, additional chemicals were added at the start of the culture incubation. Stx localization for cytotoxicity determination was determined by taking 1 mL of the overnight culture (whole culture) and/or centrifuging an aliquot of culture (for 30 s at 13,000 rpm, at room temperature) and collecting the supernatant fraction (supernatant). The remaining cell pellet after centrifugation was resuspended in 1 mL phosphate buffered saline (cell-associated). All samples were stored at −20 °C. Whole culture and cell-associated fractions were sonicated on ice to release intracellular/membrane-associated Stx, then centrifuged (for 30 s at 13,000 rpm, at room temperature), and stored on ice briefly before use of the supernatant in the Vero cell cytotoxicity assay. All bacterial strains used in this study are listed in Table 1.
Mouse Infection Protocol. Mouse experiments were approved by the Institutional Animal Care and Use Committee of the Uniformed Services University and conducted following recommendations from the Guide for the Care and Use of Laboratory Animals [17]. The 14–16 g male BALB/c mice (Jackson Laboratories) were given streptomycin water (Str, 5 g/L) for 48 h prior to infection to promote colonization, as discussed previously [18]. After a 3 h fast, mice were orally gavaged with 1010−11 CFU of STEC per mouse (unless specified otherwise). Infected mice remained on Str water and were monitored for clinical symptoms until 14 days post-infection.
Mice were checked for weight and survival daily from the start of Str water administration through the experiment endpoint, except on the day of infection. Fecal pellets were collected from individual infected mice at days one and three post-infection, and were homogenized in PBS. The debris was allowed to settle for approximately 15 min, then diluted. An aliquot of the diluted supernatant was plated on LB with the appropriate antibiotic selection (either 50 ug/mL Str or 30 ug/mL chloramphenicol) to determine fecal colonization (CFU/g feces). As determined historically over many studies, the colonies that grow on Str of the appropriate size are STEC [14,18,19]. Occasionally, colonies of very small size are also seen on the LB +Str, but these are not STEC. The remaining supernatant was used to determine fecal cytotoxicity (CD50/g feces) by Vero cell cytotoxicity assay.
Bacterial Mutagenesis. Gene deletions in STEC isolates were created using the lambda Red recombinase system for mutagenesis, as previously published [14]. Briefly, STEC isolates containing plasmid pTP1215 [20] were transformed with 500 ng of purified PCR construct containing a chloramphenicol (Cm) resistance gene (cat) flanked by 50 bp of homology to the gene targeted for deletion. Recombinants were selected on LB+Cm and screened for the correct size using PCR, to confirm the intended gene deletion. The primers used to create the mutagenesis PCR constructs and screen for successful deletion are included in Table 2.
Vero Cell Cytotoxicity Assay. The Vero cell cytotoxicity assay was conducted as described previously to determine the cytotoxicity of Stx-containing samples [14]. Briefly, serial dilutions of Stx-containing samples were layered on 96-well plates containing Vero cell monolayers. The plates were incubated for 48 h, then fixed with 10% buffered formalin and stained with crystal violet. The absorbance at 590 nm was read for rinsed and dried plates to calculate the CD50 (1/(sample dilution) needed to kill 50% of untreated Vero cells).
RT-qPCR. The Quick-RNA Miniprep Kit (Zymo Research, Irvine, CA, USA) was used to isolate RNA from overnight bacterial cultures. A total of 100 ng of RNA was converted to cDNA using the Quantitect Reverse Transcription Kit (Qiagen, Hilden, Germany). qPCR reactions and corresponding controls were set up using the SYBR Green qPCR Kit (Qiagen), the designated primer pairs, and 1.5 μg of each cDNA template. The primer pairs and qPCR conditions are listed below, in Table 2. The housekeeping gene gyrB was used as the endogenous control, and data for each reaction were presented as fold change of expression from gyrB (log22−ΔCt).
Genomic and Protein Analyses. The stx2a-phage sequences were aligned with NCBI Nucleotide Blast and visualized using EasyFig [22]. Individual protein sequences were analyzed using Geneious Prime (version 2022.2.2), and percent nucleotide and amino acid identities were determined by the Clustal Omega tool in Geneious Prime. InterProScan (version 92.0) was used to analyze protein sequences for various protein domains within the InterPro database. The Phyre2 algorithm in normal mode predicted the secondary and tertiary structure using protein sequences and reference structures within the PDB database. Predicted protein structures were visualized using the Geneious Prime PDB viewer in Geneious Prime.
Statistical analyses. GraphPad Prism (Version 9.0.2 for Windows) was used to conduct all statistical analyses.

3. Results

3.1. RecA-Independent Production of Stx2 from STEC Strains JH2010 and JH2016

To determine if our previous observation of detectable RecA-independent levels of Stx2 production from O157:H7 strain JH2010 could be extended to another STEC strain, we deleted recA in O157:H7 strain JH2016. Like JH2010, the JH2016 genome contains two independent stx2-phages, one which encodes stx2a and the other stx2c. Wild-type JH2010 and JH2016 exhibited similar whole culture, cell-associated, and supernatant cytotoxicity, Figure 1A–C. Deletion of recA in JH2010 and JH2016 significantly reduced the whole culture cytotoxicity from wild-type levels (2–4 × 10⁵ CD50/mL) to comparable levels between JH2010ΔrecA and JH2016ΔrecA (4–5 × 10³ CD50/mL), Figure 1A. In contrast, the cell-associated cytotoxicity was significantly reduced as compared to wild-type only from JH2016ΔrecA, Figure 1B. Similar to the whole culture samples, the level of cytotoxicity found in the supernatant fraction of the recA mutant strains was reduced by about 100-fold from wild-type, Figure 1C. We were surprised to find that JH2010ΔrecA exhibited significantly higher supernatant cytotoxicity as compared to JH2016ΔrecA, Figure 1C. The observed difference in JH2010ΔrecA and JH2016ΔrecA supernatant cytotoxicity is not due to a difference in growth, because while modest differences in OD600 were observed, there was no significant difference in CFU/mL between cultures of the two recA deletion strains, Figure S1. Complementation of the JH2010ΔrecA deletion strain in transrecA/recA+) restored cytotoxicity to wild-type levels in the JH2010 background, Figure 1. In contrast, complementation of the JH2016ΔrecA strain led to significantly higher whole culture and supernatant cytotoxicity compared to wild-type JH2016, Figure 1A,C, possibly due to strain-specific differences in complementation plasmid copy number.

3.2. Cytotoxicity from Feces of Mice Infected with JH2010ΔrecA or JH2016ΔrecA

To compare the levels of toxin produced in vivo from the recA mutant strains, we infected streptomycin (Str)-treated mice orally with 1010−11 CFU of either strain. As expected, the recA mutant strains were avirulent in the mice, a result we had observed previously with JH2010ΔrecA [14]. However, we detected a modest transient decrease in the weights of JH2010ΔrecA-infected mice during two independent experiments, while JH2016ΔrecA-infected mice did not experience a weight decrease, Figure S2. Unlike JH2016ΔrecA-infected mice, we found that JH2010ΔrecA-infected mice exhibited detectable fecal cytotoxicity on days 1 and 3 post-infection, Figure 2A. A slight, but significant, difference in fecal colonization of the two strains was observed on day 1 post-infection, but not on day 3, Figure 2B. It is unlikely that the roughly 2.5-fold difference in colonization observed on day 1 is responsible for the failure to detect toxin from the JH2016ΔrecA-infected mice, since a similar difference in cytotoxicity was observed on day 3 when there was no significant difference in colonization between the two strains. Taken together, our results indicate that in the absence of RecA, JH2010 releases more Stx2 in vitro and produces more Stx2 in vivo as compared to JH2016.

3.3. Test of Potential Inducers of RecA-Independent Cytotoxicity

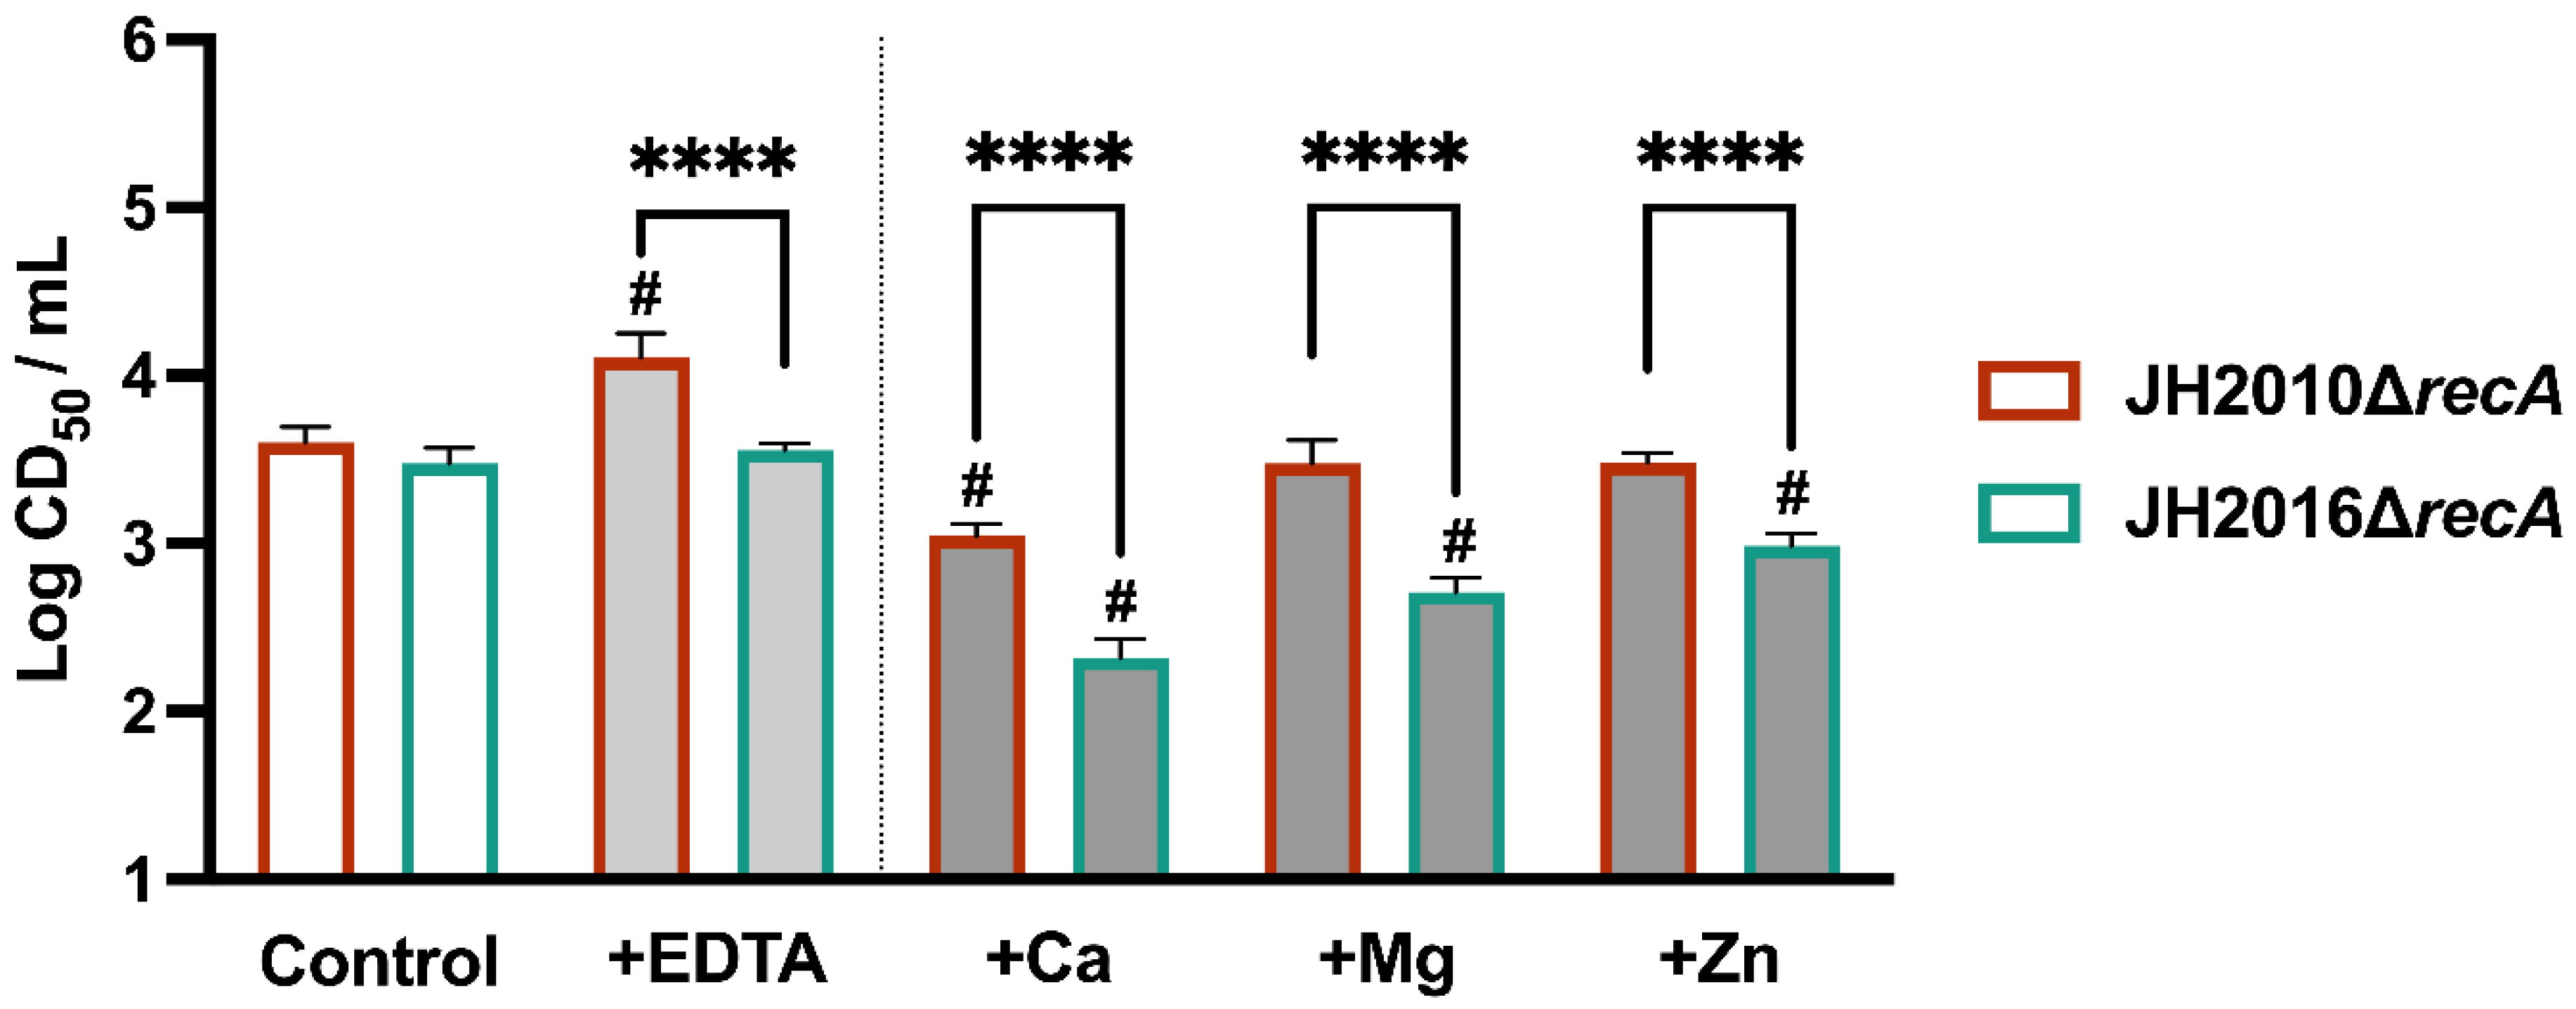
We next explored the effect of previously identified RecA-independent inducers of toxin expression, to determine if they altered toxin expression from JH2010ΔrecA or JH2016ΔrecA. The addition of the RecA-dependent inducer Cip to cultures of either recA deletion strain did not influence the resulting cytotoxicity, as observed previously for JH2010ΔrecA [14]. The chelator EDTA leads to RecA-independent in vitro stx-phage induction and Stx production from E. coli K-12 stx-phage lysogens when included in the growth medium [12]. We found that when incubated with 50 μM EDTA, JH2010ΔrecA cultures exhibited a modest but significant increase in cytotoxicity, as compared to the corresponding control culture, while JH2016ΔrecA cultures did not, Figure 3. The addition of metal salts has been shown to eliminate the RecA-independent influence of EDTA on stx-phage induction [12], and has also been shown to influence RecA-independent induction of phage λimm434 [23], so we next added various divalent cationic salts to cultures of JH2010ΔrecA or JH2016ΔrecA. Compared to control cultures, the addition of each of the three salts reduced the whole culture cytotoxicity of JH2016ΔrecA cultures as compared to the control, while only the addition of CaCl2 decreased the cytotoxicity of JH2010ΔrecA cultures, Figure 3 (see # for significant difference, as compared to the control culture). We were surprised that the cytotoxicity from JH2016ΔrecA cultures was affected by the addition of divalent cations, since we observed that the cytotoxicity from JH2016ΔrecA was not altered by the addition of EDTA, Figure 3. Overall, we found that the addition of EDTA or metal ions differentially influenced the RecA-independent cytotoxicity of JH2010 and JH2016.

3.4. Infection of Mice with an Intermediate Dose of JH2010 or JH2016

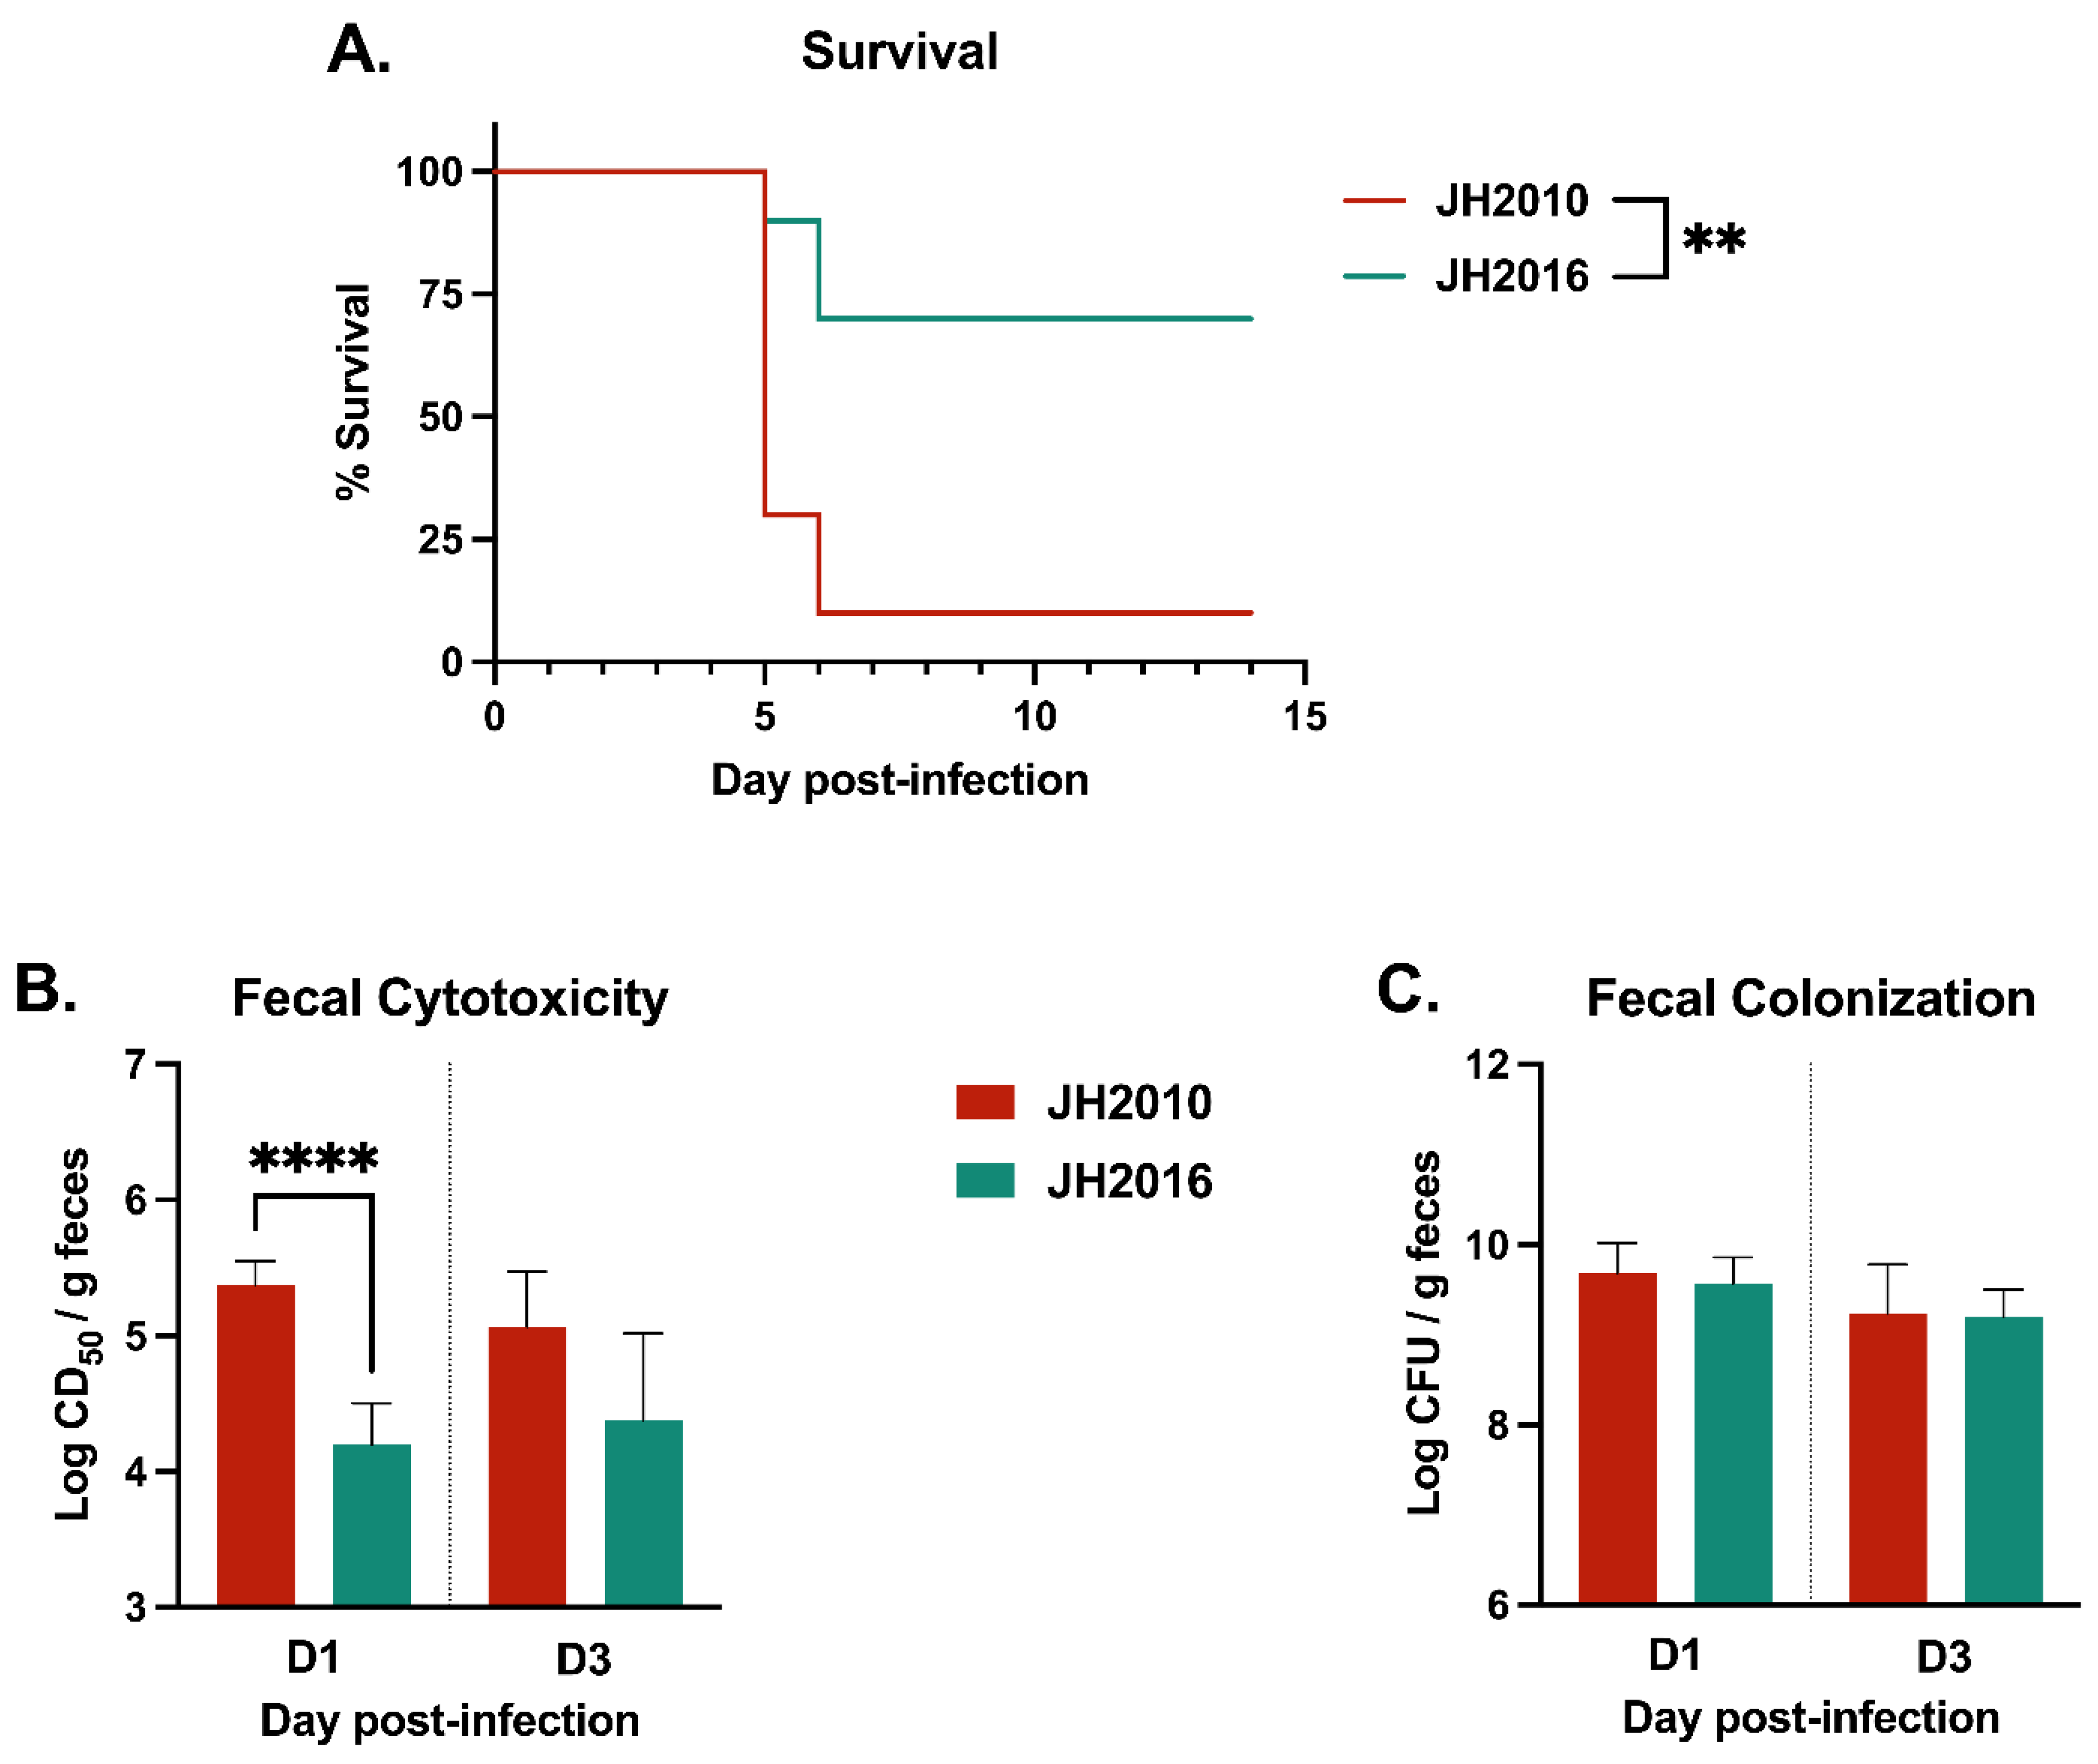
The in vivo data, Figure 2, suggests that JH2010 and JH2016 have strain-specific differences in RecA-independent induction of the stx2-phage. Our previous study showed that at a dose of 1010−11 CFU/mouse, JH2010 and JH2016 had similarly high virulence and fecal cytotoxicity [14]. Therefore, we infected Str-treated mice with an intermediate dose of 106−7 CFU/mouse to determine the influence of a lower infectious dose on the RecA-dependent colonization capacity and virulence of the strains. At the intermediate inoculum, JH2010-infected mice had significantly lower percent survival and higher day-1 fecal cytotoxicity compared to JH2016-infected mice, Figure 4A,B. The reduced virulence and toxin production was not due to differences in colonization, as both JH2010- and JH2016-infected mice had similar colonization on days 1 and 3 post-infection, Figure 4C. Combined, the mouse experiments confirmed that JH2010 has an increased capacity for RecA-independent and RecA-dependent toxin production under in vivo conditions, as compared to JH2016.

3.5. Comparison of the stx2a-Phage Sequences of JH2010 and JH2016

Taken together, our findings indicate that JH2010 and JH2016 respond to the deletion of recA with differential toxin localization and altered toxin production in response to environmental influences. Since we found that Stx2a rather than Stx2c is responsible for the virulence of JH2010 [14], we next compared the nucleotide homology and synteny of the stx2a-phage sequences from strains JH2010 and JH2016 using NCBI Blast, Figure 5. The pairwise alignment showed regions of either high (>90%) or low (<70%) identity between the two stx2a-phage sequences. An insertion element found downstream of the JH2016 stx2a-phage S and R genes was duplicated in JH2010, with one copy located before the S and R genes and the other copy inverted and downstream of the S and R genes. The regions of low homology between the two sequences include a ~4400 bp sequence between the recombination and replication regions and a ~1700 bp sequence between the replication and Stx regions. In particular, the N, cI, and cro genes and their encoded proteins shared low nucleotide and amino acid identity between JH2010 and JH2016, Table S1. We therefore hypothesized that the stx2a-phage regulatory regions of JH2010 and JH2016 may differentially influence downstream Stx2 production.
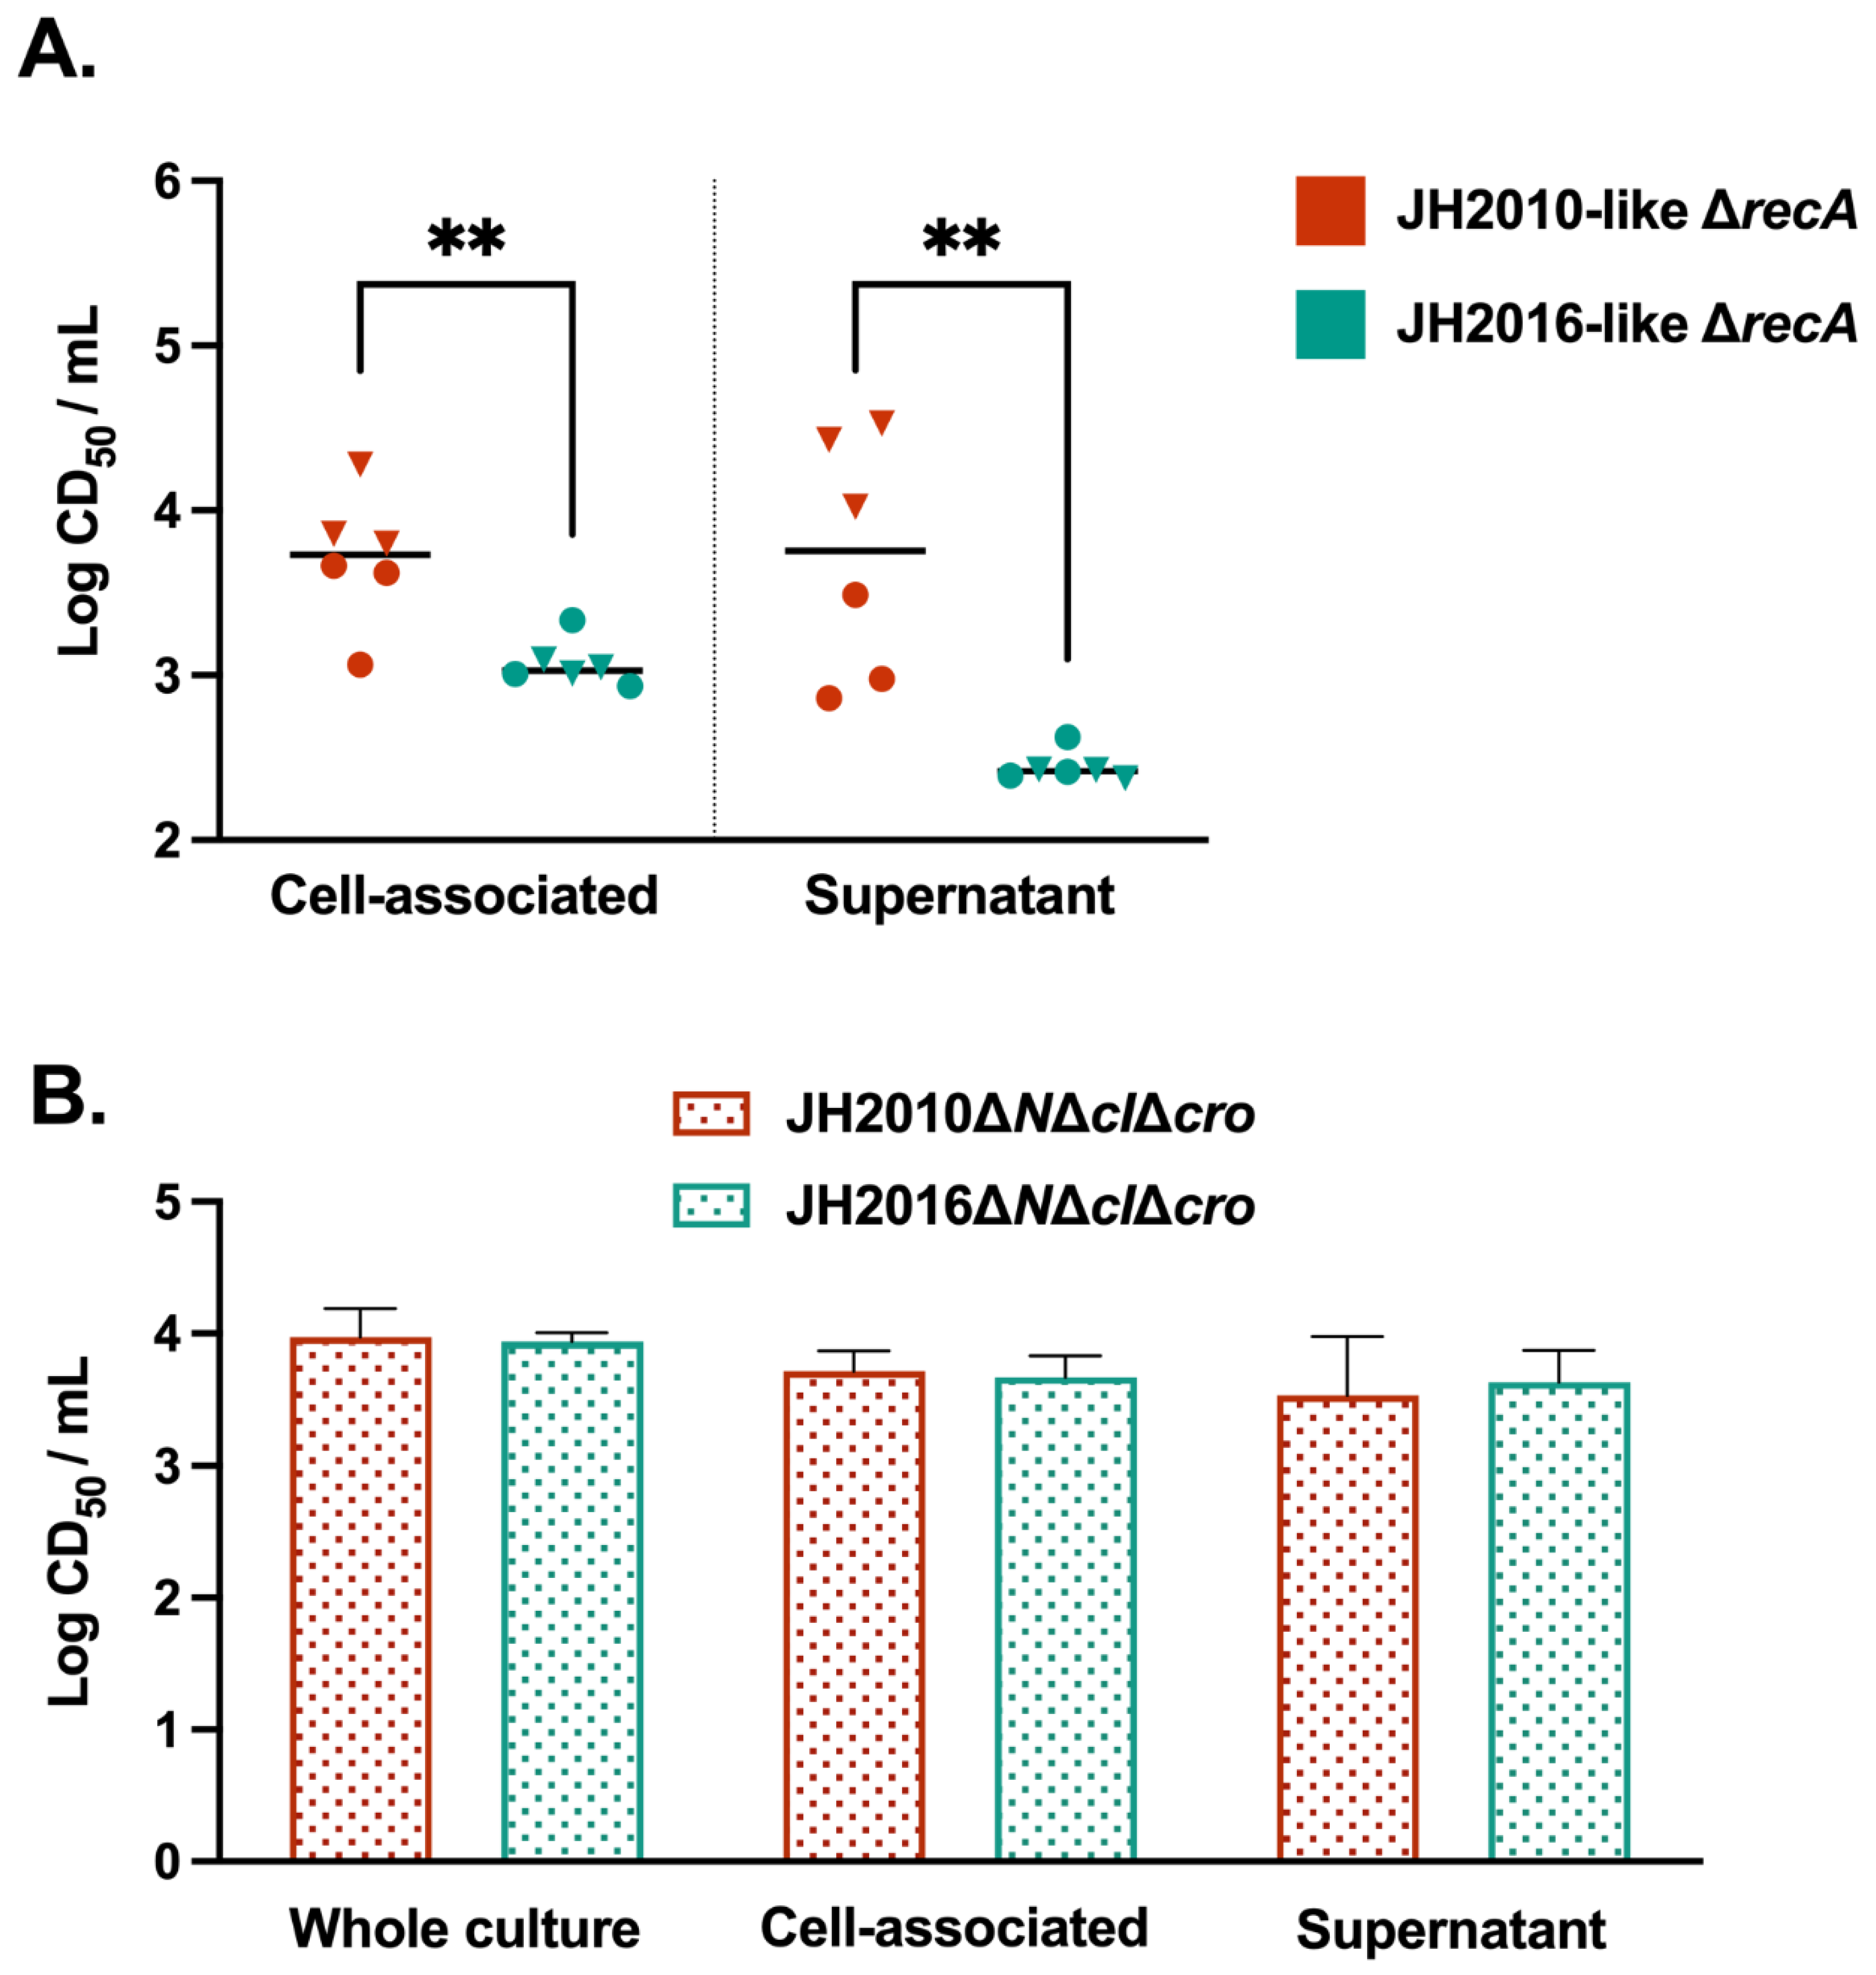
Next, we wanted to see if the difference in RecA-independent cytotoxicity associated with JH2010 and JH2016 could be replicated in other O157:H7 Stx2-producing strains. We identified STEC isolates with stx2a-phage regulatory sequences identical to either the JH2010 or JH2016 stx2a-phage from within the PulseNet STEC Genome Reference Library or from other NCBI BioProjects. The identified isolates encoded stx2a-phages sharing >99% nucleotide identity with the stx2a-phage from either JH2010 (strains 08-3914, PA28) or JH2016 (strains 2010c-3142, TW14359), Figure S3. We created ΔrecA mutant strains in Strr isolates from the NCBI strains, and measured the in vitro cytotoxicity of the mutant strains after overnight growth in LB-YE. We found that the JH2010-like ΔrecA mutant strains exhibited significantly higher cell-associated and supernatant cytotoxicity compared to the JH2016-like recA mutant strains, Figure 6A. These results suggest that differences in the stx2a-phages from JH2010 and JH2016 may be responsible for the observed phenotypes of differential toxin localization and RecA-independent cytotoxicity.
To pursue our hypothesis that differences in the stx2a-phage regulatory region contributes to the differential cytotoxicity between JH2010 and JH2016, we deleted the stx2a-phage region from N to cro in JH2010 and JH2016 (ΔNΔcIΔcro), Figure S4. We reasoned that if the ΔNΔcIΔcro deletion in both strains did not lead to differential supernatant cytotoxicity as observed between JH2010ΔrecA and JH2016ΔrecA, then the N to cro region is required for differences in the RecA-independent localization of toxin into the supernatant. We obtained ΔNΔcIΔcro derivative strains in both strain backgrounds, and confirmed the deletion using PCR. We found that there were no differences in the cytotoxicity of JH2010ΔNΔcIΔcro and JH2016ΔNΔcIΔcro across all culture fractions, Figure 6B, a finding that suggests that the regulatory region is necessary for RecA-independent localization of toxin into the supernatant. Based on these results, we hypothesize that stx2a-phage induction, through the involvement of the regulatory region, differentially influences the RecA-independent in vitro cytotoxicity of strains JH2010 and JH2016.
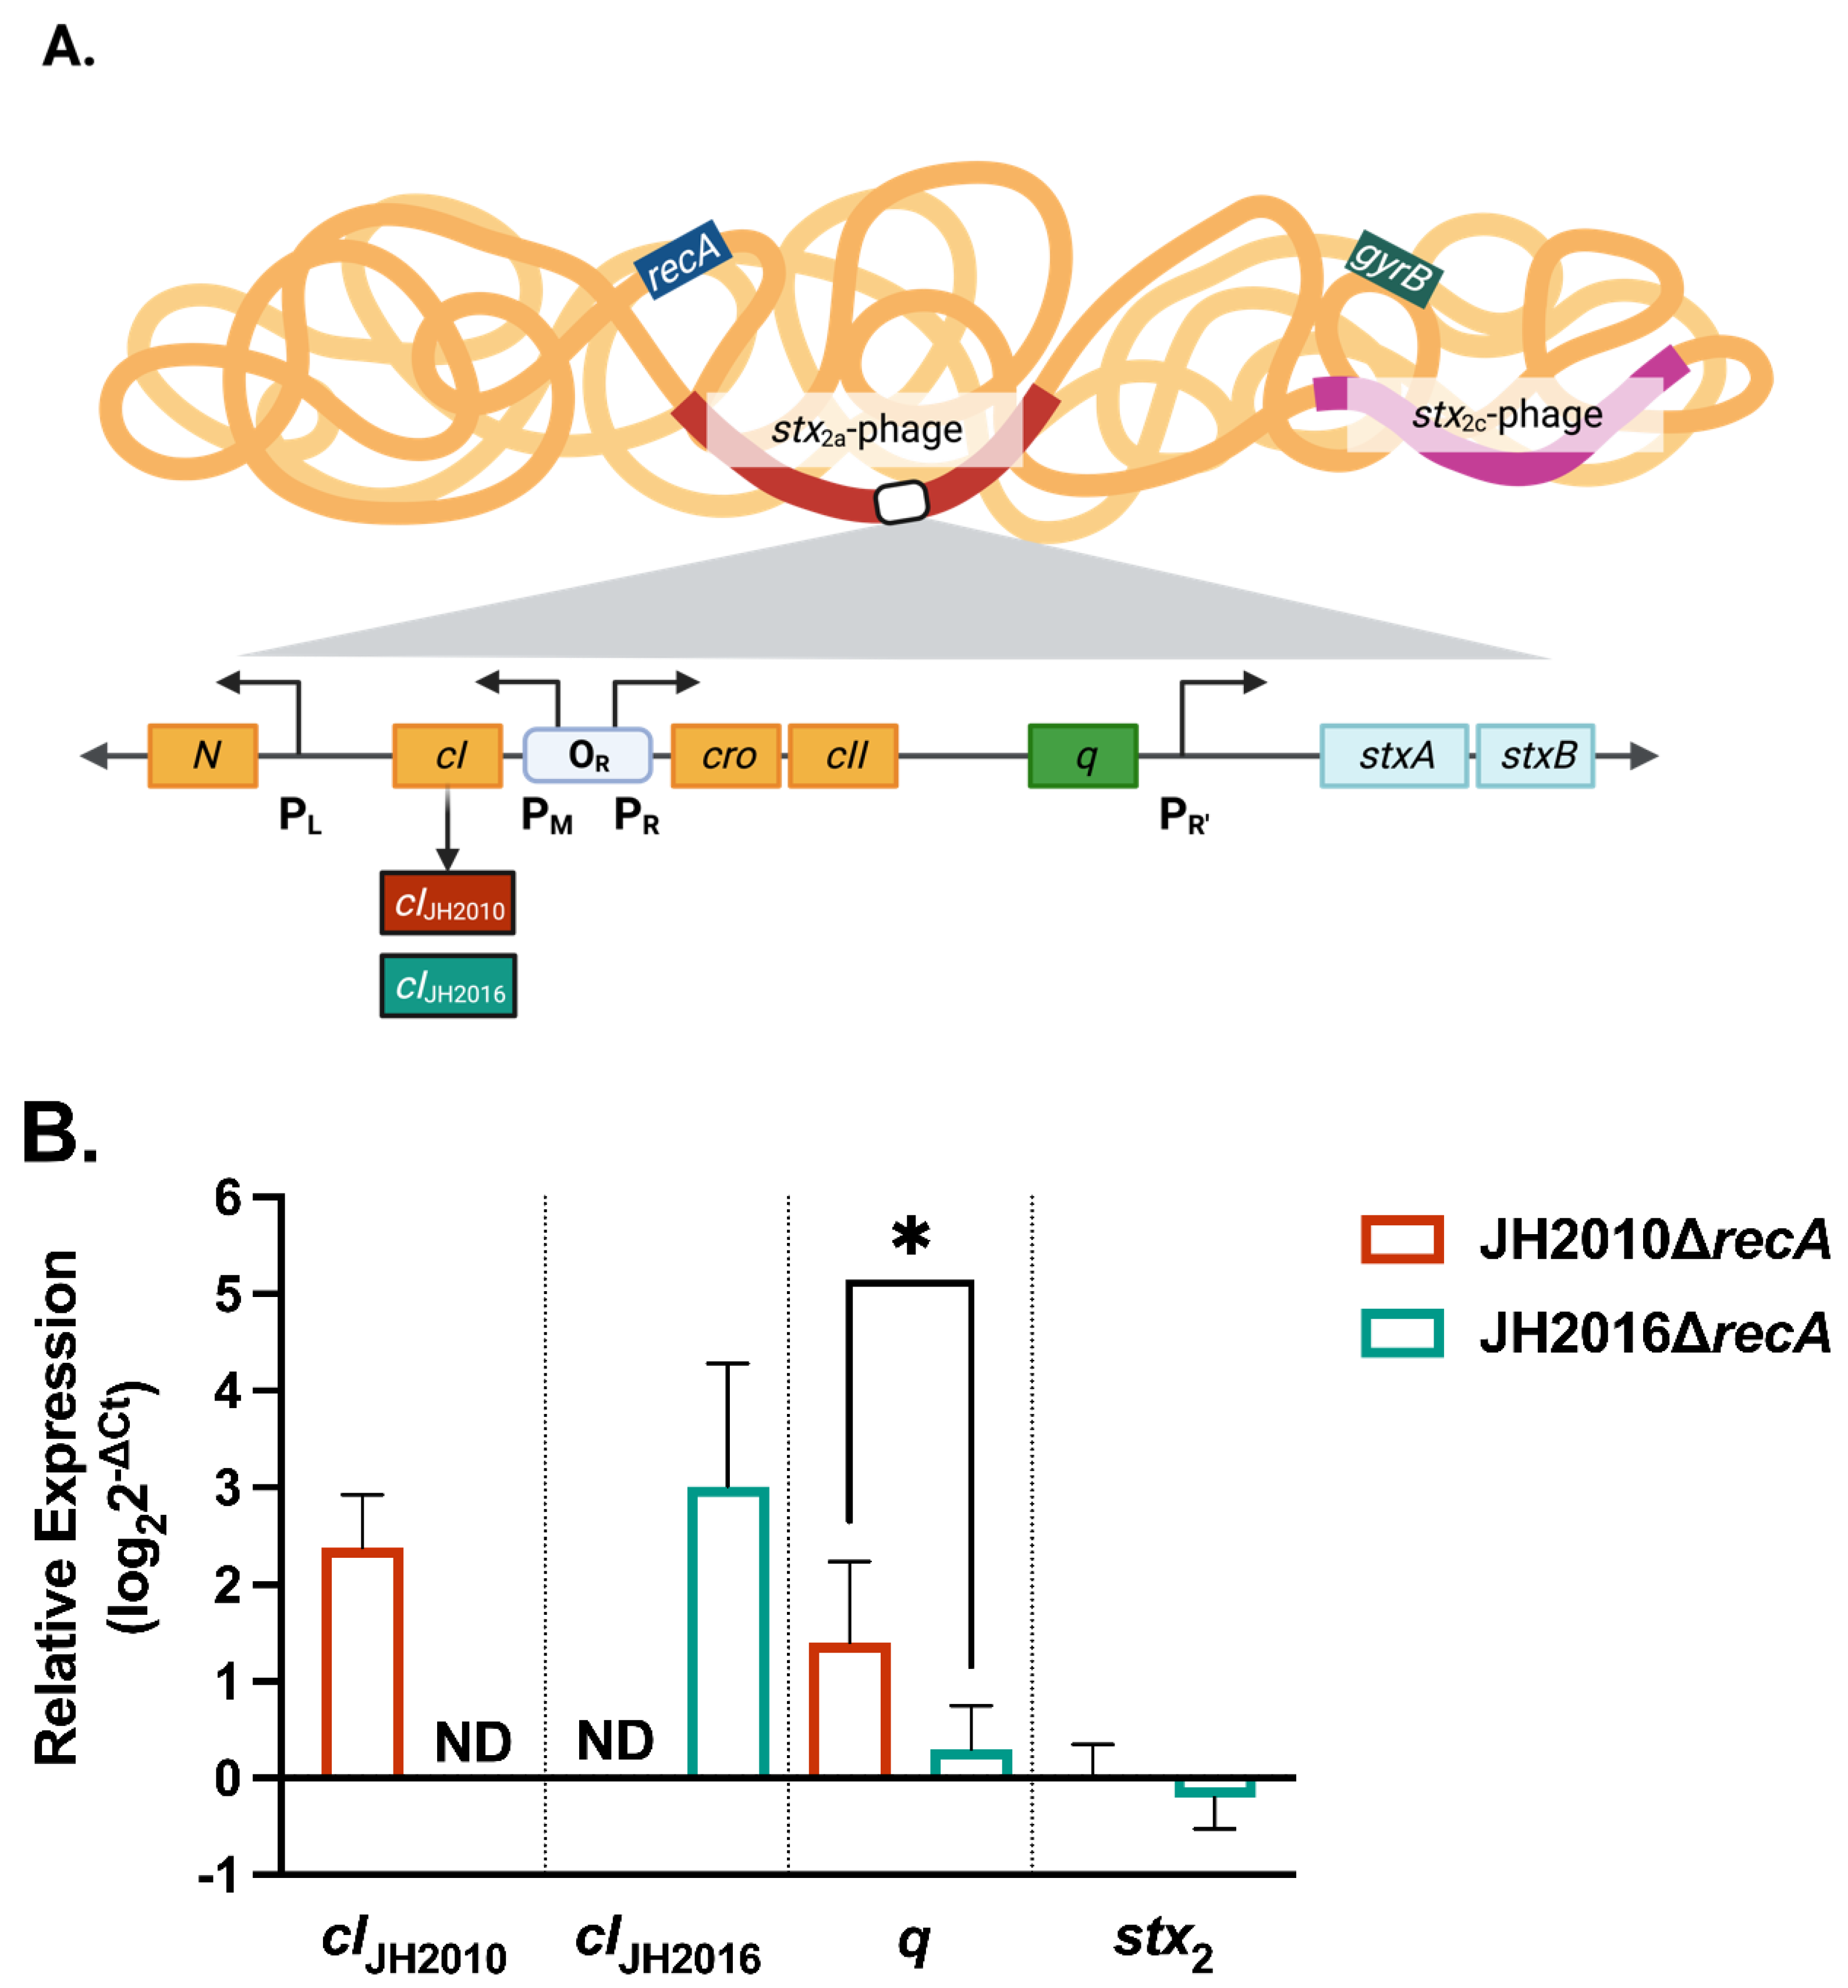
Expression of stx2a-phage transcripts in ΔrecA deletion strains. Attempts to enumerate phage production from bacterial culture supernatants either by plaque assay or qPCR detection of circular phage genomes for JH2010 and JH2016 wild-type and ΔrecA mutant strains were unsuccessful. Therefore, we measured the level of stx2a-phage induction in the ΔrecA mutant strains by conducting qPCR to detect phage transcripts associated with the lytic cycle. We designed primers to detect transcripts for the stx2a-phage repressor (cI, early gene), antiterminator Q (q, late-early gene), and Stx2 (stx2, late gene), Figure 7A. Since the two sequences have low nucleotide identity, two different sets of primers were designed to detect cI transcripts from the JH2010 stx2a-phage (cIJH2010) and JH2016 stx2a-phage (cIJH2016). We adjusted the detected Ct values based on calculated primer efficiencies in order to directly compare the two sets of cI primers (see Table 2). cIJH2010 and cIJH2016 were only detected in JH2010ΔrecA and JH2016ΔrecA, respectively, Figure 7B. We found that q transcript levels were significantly higher in JH2010ΔrecA, Figure 7B, a finding that suggests that there is more stx2a-phage induction in JH2010ΔrecA than in JH2016 ΔrecA, in agreement with our findings of elevated toxin levels in Figure 6. However, both strains had similar levels of stx2 transcript, a result that may mean the stx2 transcript is unstable, or that there is an additional level of regulation at the translational level. Alternatively, because the Vero assay is quite sensitive, we may be able to detect differences in Stx levels that are not identified in the qPCR assay. Finally, the cIJH2016 transcript levels from JH2016ΔrecA trended higher than cIJH2010 levels from JH2010ΔrecA, but the difference was not significant, Figure 7B. The wild-type strains exhibited similar trends in the transcript levels of cIJH2010/cIJH2016 and q to those observed in the ΔrecA mutant strains, but the differences were not significant, Figure S5. Our data suggest that JH2010ΔrecA exhibits transcript levels associated with increased stx2a-phage induction, compared to JH2016ΔrecA. These results support the hypothesis that RecA-independent stx2a-phage induction is responsible for the differential phenotypes exhibited by JH2010ΔrecA and JH2016ΔrecA.
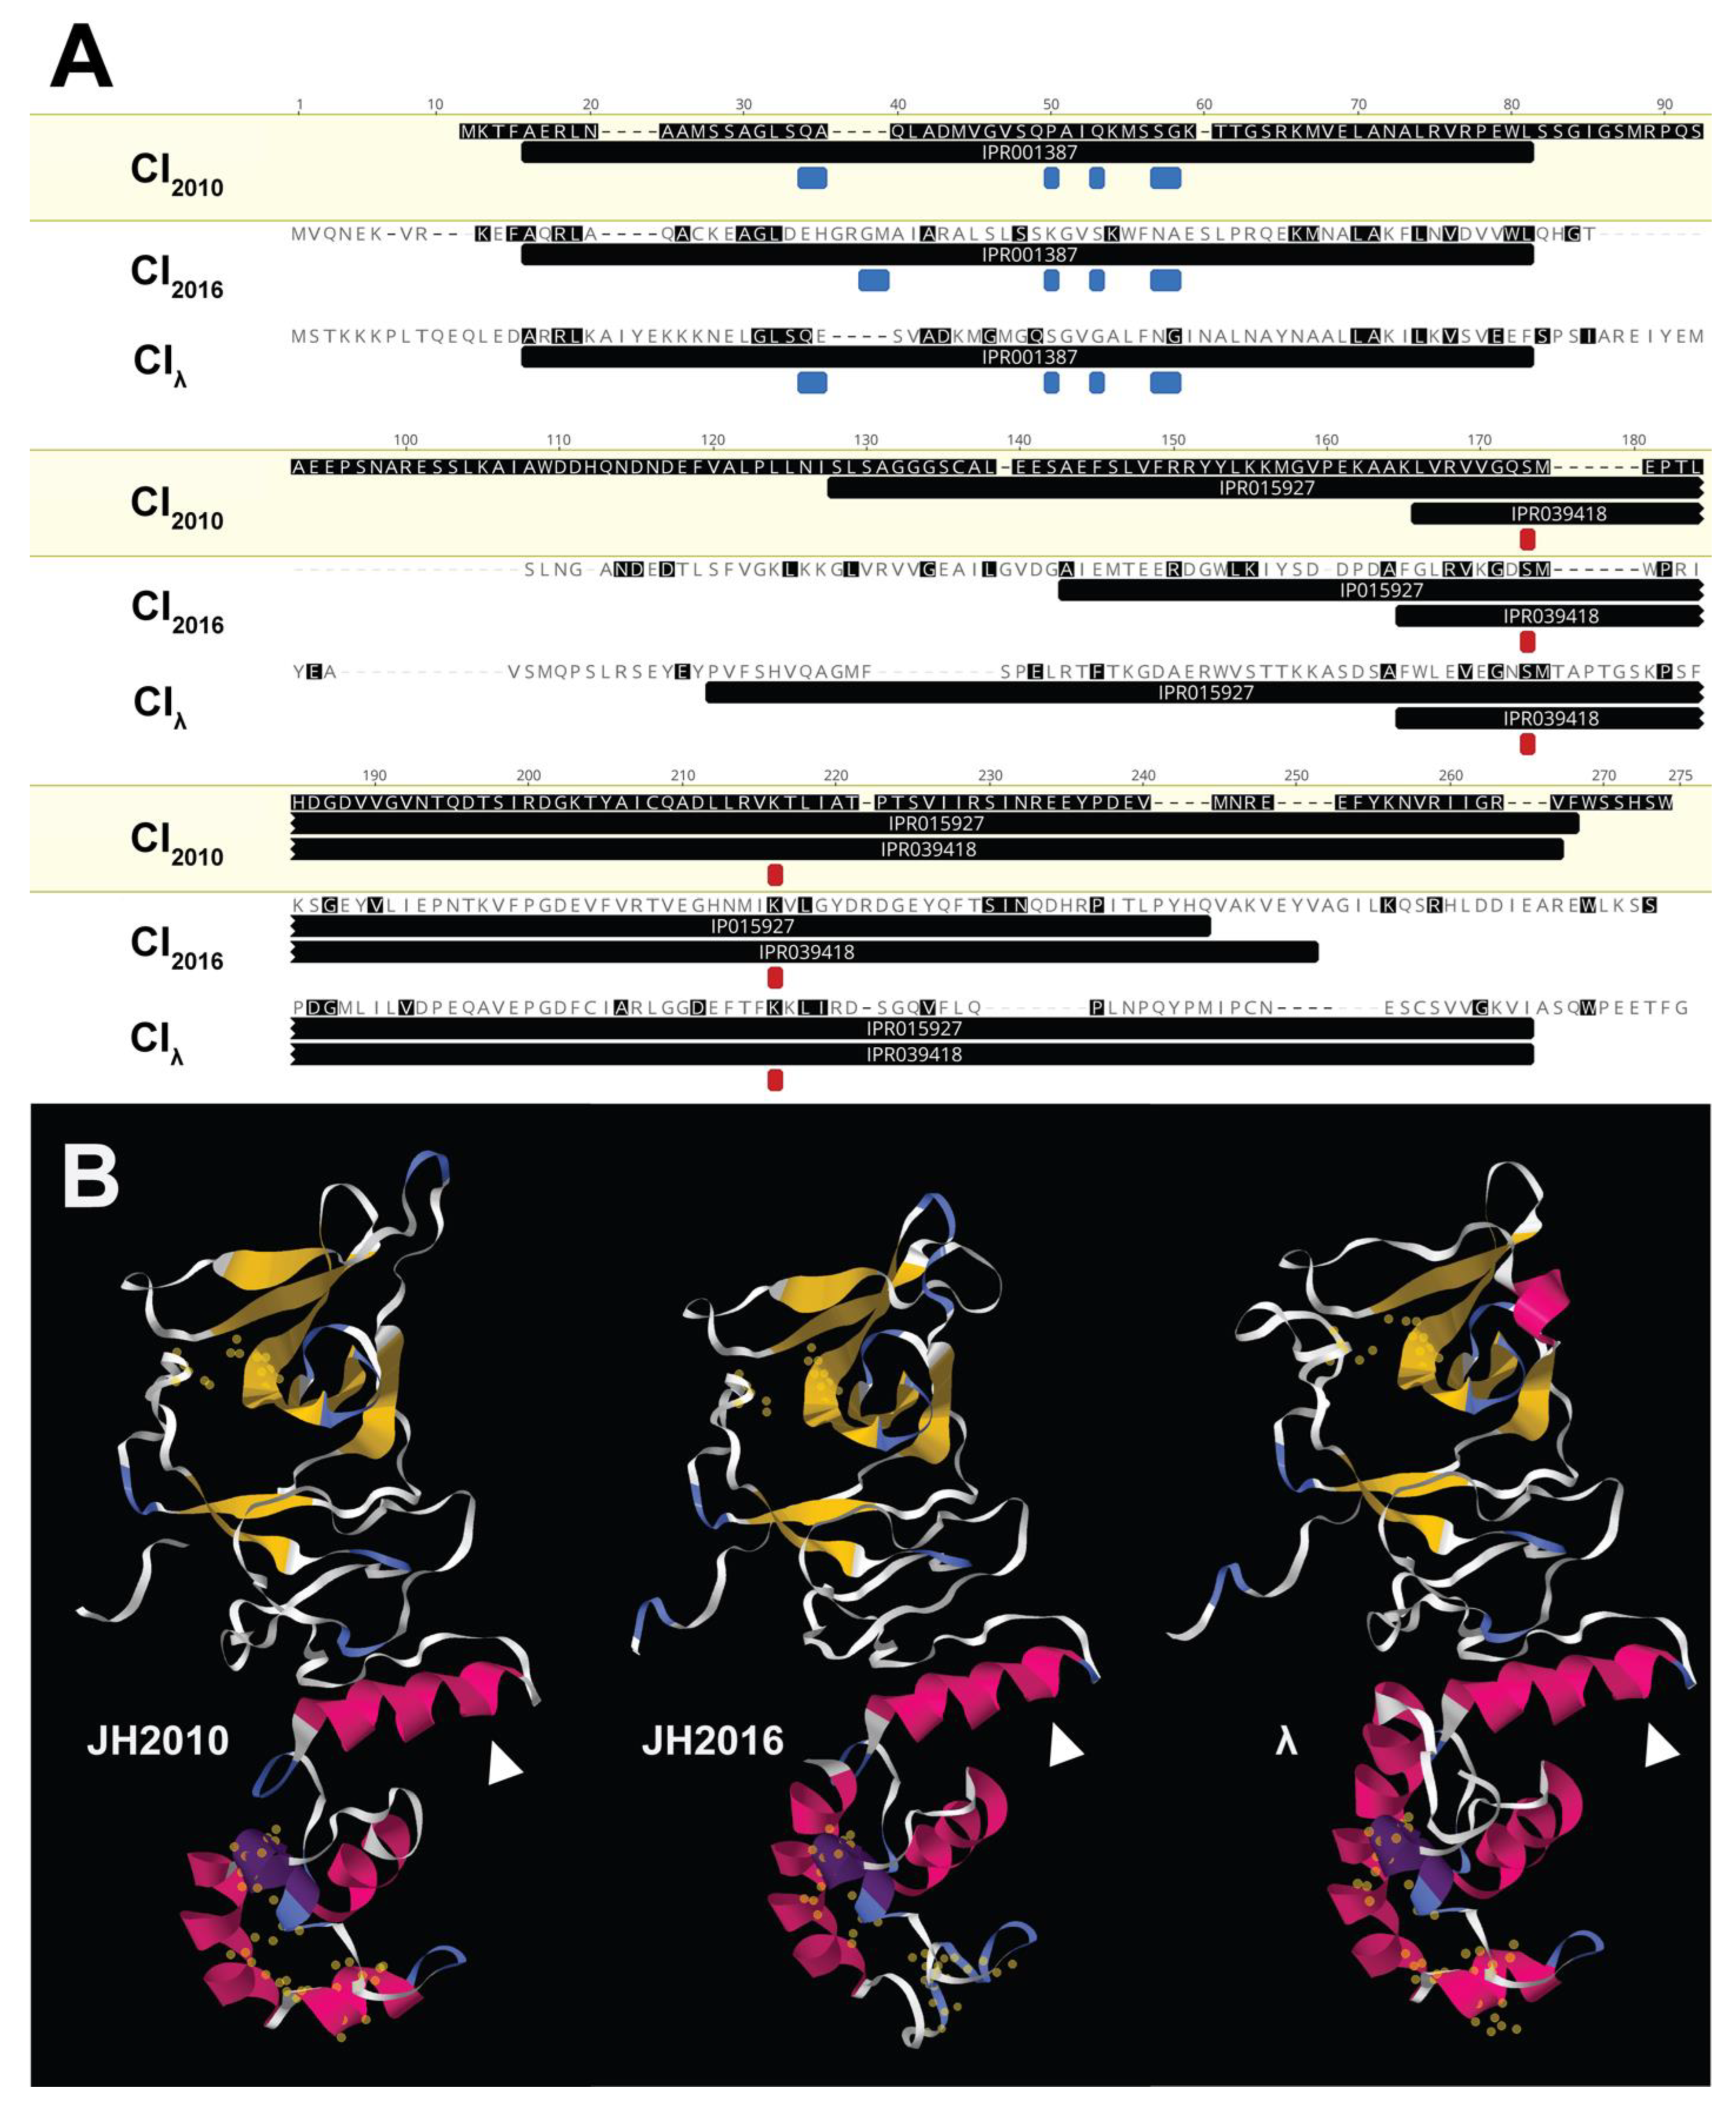
Regulatory protein structure prediction. For lambdoid phages, the proteins encoded within the regulatory region act as switches to regulate the phage life cycle. The organization and predicted NCBI annotations of the proteins encoded within the stx2a-phage regulatory region suggest that the stx2a-phage regulatory proteins identified in this study function similarly to the lambda phage regulatory proteins, despite the low amino acid homology. Since JH2010 and JH2016 exhibited differential cytotoxicity in studies involving the phage regulatory region and recA, we analyzed the amino acid sequence of the phage repressor CI (encoded by cI), which is the only stx-phage regulatory protein known to interact directly with RecA. Based on pairwise alignment by Clustal Omega, the CI protein sequences from the JH2010 stx2a-phage (CI2010), JH2016 stx2a-phage (CI2016), and lambda phage (CIλ) showed little amino acid identity, Figure 8A. Additional protein domain and residue analyses using InterProScan found that all of the CI sequences shared identical functional protein domains, conserved catalytic site residues, and similar localization of DNA-binding residues, despite the divergence in amino acid sequences, Figure 8A. Combined, these data suggest that, despite the low amino acid sequence homology, CIJH2010 and CIJH2016 exhibit similarities in domain organization to each other (and to CIλ) and contain highly conserved residues involved in DNA-binding and autoproteolytic functions.
We next used Phyre2 to predict the secondary and tertiary structure of the three CI proteins. Using the known crystal structure of CIλ as a reference, we generated predicted structures for CIJH2010 and CIJH2016 with greater than 99% confidence. We also analyzed the CIλ sequence as a test for the Phyre2 algorithm, and found that the results were similar to the published CIλ crystal structure [24]. Visualization of these predicted Phyre2 structures showed similarities in the three-dimensional organization for all three CI proteins, Figure 8B. However, there were slight differences in structure within the functional domains of the proteins, including the relative spatial localization of residues important for the two main functions of CI: DNA-binding and auto-proteolysis, Figure 8B. Taken together, these data indicate key functional similarities and structural differences between the stx2a-phage CI proteins from JH2010 and JH2016, leading us to hypothesize that CIJH2010 and CIJH2016 may exhibit the same general function as lambdoid phage repressors, but likely have differential efficacy.

4. Discussion

In this study, we found that O157:H7 STEC strains may produce relatively high levels of Stx2 in the absence of recA, and that strains with different stx2a-phage CI types show differences in RecA-independent Stx2 localization and RecA-dependent virulence in mice. Similar to previous studies, deletion of recA in JH2010 and JH2016 significantly reduced Stx2 production compared to the wild-type strain; however, toxin levels were still above 103 CD50/mL culture [14]. Unexpectedly, JH2010ΔrecA had higher levels of in vitro supernatant cytotoxicity and in vivo fecal cytotoxicity from infected mice, as compared to JH2016ΔrecA. Comparisons of the stx2a-phage regulatory region identified sequence differences in key phage regulatory genes, and our data support a role for this region in differential, RecA-independent Stx2 production in the studied strains. Wild-type strains JH2010 and JH2016 did not exhibit significant differences in Stx2 production in vitro, but did show differences in in vivo Stx2 production. The difference in the amount of in vivo Stx2 production may also implicate the stx2a-phage regulatory region in differential RecA-mediated phage induction. The finding that STEC recA mutant strains are capable of producing enough Stx in vivo to cause modest morbidity in Str-treated mice has implications for potential STEC therapeutics that target RecA-mediated stx-phage induction [13,25].
The stx2a-phage regulatory regions were non-homologous between JH2010 and JH2016. However, the synteny of the genes within the region and the predicted protein domains of the gene products suggested shared a functionality as lambdoid phage regulatory regions. Based on transcript levels and protein structure predictions, we hypothesize that differences in the stx2a-phage repressor CI may differentially influence RecA-independent stx2a-phage induction, and consequently, Stx2 production. Previous work with purified CI proteins from various stx- and non-stx-encoding lambdoid phages show functional differences between the proteins [26,27]. Additional studies with purified stx-phage CI proteins may help us understand how differences in the structure and function of various stx-phage repressors can influence their regulatory activity in vitro and in vivo.
Our results support a recent study on the phylogeny of stx-phage regulatory regions and the encoded proteins. When studying stx-encoded CI sequences from the NCBI virus database and various European STEC bio-projects, eight clades of CI sequences were identified [28]. Based on that clade classification scheme, the stx2a-phage CI protein sequences from JH2010 and JH2016 can be classified as clade V (CIV) or VII (CIVII), respectively. The same study found that CIV was primarily encoded on Stx1-phages, while CIVII was more commonly encoded on Stx2-phages [28]. In our study, we found that CIV and CIVII were both encoded on stx2a-phages. When we interrogated the NCBI PulseNet STEC genome reference library, we found that the CIVII from JH2016 was more prevalent than CIV from JH2010, and, similar to the previous study, found that CIV was usually associated with stx1-phages, Table S2. The findings from this study indicate that the genetic mosaicism and recombination found among many lambdoid phages [29,30] also applies to stx-phages isolated from patients. Finally, our findings suggest that the mosaicism of stx-phage regulatory sequences, and possible differences in CI function, influence downstream Stx production and could be used in the future to predict the virulence of STEC clinical isolates.

Supplementary Materials

The following supporting information can be downloaded at: https://www.mdpi.com/article/10.3390/microorganisms11081925/s1, Figure S1: In vitro growth of wild-type and recA mutant strains. Figure S2: In vivo recA mutant strain mouse weights. Figure S3: Pairwise alignment of JH2010-like and JH2016-like stx2a-phages. Figure S4: Diagrams of the N to q region of the wild-type stx-phage and the deletion mutant strains. Figure S5: Gene expression of wild-type JH2010 and JH2016 by RT-qPCR. Table S1: Identity of stx2a-phage regulatory genes and encoded protein sequences between JH2010 and JH2016. Table S2: Appearance of cIJH2010 and cIJH2016 sequences within the PulseNet reference library.

Author Contributions

Conceptualization, methodology, validation, formal analyses, data curation, R.R.A. and A.R.M.-C.; investigation, R.R.A.; writing—original draft preparation, R.R.A.; writing—review and editing, A.R.M.-C.; funding acquisition, A.R.M.-C. All authors have read and agreed to the published version of the manuscript.

Funding

This research was funded by NIH grant R37 AI020148-34 and USUHS grant R.0731182020.

Data Availability Statement

The data presented in this study are available in the article and Supplementary Material.

Conflicts of Interest

The authors declare no conflict of interest. The funders had no role in the design of the study; in the collection, analyses, or interpretation of data; in the writing of the manuscript; or in the decision to publish the results. The opinions and assertions contained herein are those of the authors and do not reflect the official policy or position of the Uniformed Services University of the Health Sciences, the Department of Defense, or the Henry M Jackson Foundation for the Advancement of Military Medicine, Inc.

References

  1. Scallan, E.; Hoekstra, R.; Angulo, F.; Tauxe, R.; Widdowson, M.; Roy, S.; Jones, J.; Griffin, P. Foodborne illness acquired in the United States—Major pathogens. Emerg. Infect. Dis. 2011, 17, 7–15. [Google Scholar] [CrossRef] [PubMed]
  2. Centers for Disease Control and Prevention. National Outbreak Reporting System Dashboard; U.S. Department of Health and Human Services, CDC: Atlanta, GA, USA, 2021.
  3. Centers for Disease Control and Prevention. National Enteric Disease Surveillance: Shiga Toxin-Producing E. coli (STEC) Annual Report, 2017; U.S. Department of Health and Human Services, CDC: Atlanta, GA, USA, 2021.
  4. Bryan, A.; Youngster, I.; McAdam, A.J. Shiga toxin producing Escherichia coli. Clin. Lab. Med. 2015, 35, 247–272. [Google Scholar] [CrossRef]
  5. Melton-Celsa, A.R. Shiga toxin (Stx) classification, structure, and function. Microbiol. Spectr. 2014, 2, EHEC-0024-2013. [Google Scholar] [CrossRef] [PubMed] [Green Version]
  6. Joseph, A.; Cointe, A.; Kurkdjian, P.; Rafat, C.; Hertig, A. Shiga toxin-associated hemolytic uremic syndrome: A narrative review. Toxins 2020, 12, 67. [Google Scholar] [CrossRef] [PubMed] [Green Version]
  7. Rodríguez-Rubio, L.; Haarmann, N.; Schwidder, M.; Muniesa, M.; Schmidt, H. Bacteriophages of Shiga toxin-producing Escherichia coli and their contribution to pathogenicity. Pathogens 2021, 10, 404. [Google Scholar] [CrossRef]
  8. Wong, C.S.; Jelacic, S.; Habeeb, R.L.; Watkins, S.L.; Tarr, P.I. The risk of the hemolytic-uremic syndrome after antibiotic treatment of Escherichia coli O157:H7 infections. N. Engl. J. Med. 2000, 342, 1930–1936. [Google Scholar] [CrossRef] [Green Version]
  9. Rozanov, D.V.; D’Ari, R.; Sineoky, S.P. RecA-independent pathways of lambdoid prophage induction in Escherichia coli. J. Bacteriol. 1998, 180, 6306–6315. [Google Scholar] [CrossRef]
  10. Yamamoto, K.; Shinagawa, H.; Kondo, S. Induction of prophage lambda in Escherichia coli recA strain by N-methyl-N′-nitro-N-nitrosoguanidine. Mutat. Res. 1983, 107, 33–40. [Google Scholar] [CrossRef]
  11. Fuchs, S.; Mühldorfer, I.; Donohue-Rolfe, A.; Kerényi, M.; Emödy, L.; Alexiev, R.; Nenkov, P.; Hacker, J. Influence of RecA on in vivo virulence and Shiga toxin 2 production in Escherichia coli pathogens. Microb. Pathog. 1999, 27, 12–23. [Google Scholar] [CrossRef]
  12. Imamovic, L.; Muniesa, M. Characterizing RecA-independent induction of Shiga toxin2-encoding phages by EDTA treatment. PLoS ONE 2012, 7, e32393. [Google Scholar] [CrossRef] [Green Version]
  13. Huerta-Uribe, A.; Marjenberg, Z.; Yamaguchi, N.; Fitzgerald, S.; Connolly, J.; Carpena, N.; Uvell, H.; Douce, G.; Elofsson, M.; Byron, O.; et al. Identification and characterization of novel compounds blocking Shiga toxin expression in Escherichia coli O157:H7. Front. Microbiol. 2016, 7, 1930. [Google Scholar] [CrossRef] [Green Version]
  14. Hauser, J.; Atitkar, R.; Petro, C.; Lindsey, R.L.; Strockbine, N.; O’Brien, A.D.; Melton-Celsa, A.R. The virulence of Escherichia coli O157:H7 isolates in mice depends on Shiga toxin type 2a (Stx2a)-induction and high levels of Stx2a in stool. Front. Cell. Infect. Microbiol. 2020, 10, 62. [Google Scholar] [CrossRef] [Green Version]
  15. Xiaoli, L.; Figler, H.; Banerjee, K.; Hayes, C.; Dudley, E. Non-pathogenic Escherichia coli enhance Stx2a production of E. coli O157:H7 through both bamA-dependent and independent mechanisms. Front. Microbiol. 2018, 9, 1325. [Google Scholar] [CrossRef] [Green Version]
  16. Kulasekara, B.; Jacobs, M.; Zhou, Y.; Wu, Z.; Sims, E.; Saenphimmachak, C.; Rohmer, L.; Ritchie, J.; Radey, M.; McKevitt, M.; et al. Analysis of the genome of the Escherichia coli O157:H7 2006 spinach-associated outbreak isolated indicates candidate genes that may enhance virulence. Infect. Immun. 2009, 77, 3713–3721. [Google Scholar] [CrossRef] [Green Version]
  17. National Research Council. Guide for the Care and Use of Laboratory Animals, 8th ed.; National Research Council: Washington, DC, USA, 2011. [Google Scholar]
  18. Wadolkowski, E.A.; Burris, J.A.; O’Brien, A.D. Mouse model for colonization and disease caused by enterohemorrhagic Escherichia coli O157:H7. Infect. Immun. 1990, 58, 2438–2445. [Google Scholar] [CrossRef] [Green Version]
  19. Zangari, T.; Melton-Celsa, A.R.; Panda, A.; Smith, M.A.; Tatarov, I.; De Tolla, L.; O’Brien, A.D. Enhanced virulence of the Escherichia coli O157:H7 spinach-associated outbreak strain in two animal models is associated with higher levels of Stx2 production after induction with ciprofloxacin. Infect. Immun. 2014, 82, 4968–4977. [Google Scholar] [CrossRef] [Green Version]
  20. Poteete, A. Recombination phenotypes of Escherichia coli greA mutants. BMC Mol. Biol. 2011, 12, 12. [Google Scholar] [CrossRef] [PubMed] [Green Version]
  21. Steyert, S.R.; Sahl, J.W.; Fraser, C.M.; Teel, L.D.; Scheutz, F.; Rasko, D.A. Comparative genomics and stx phage characterization of LEE-negative Shiga toxin-producing Escherichia coli. Front. Cell. Infect. Microbiol. 2012, 2, 133. [Google Scholar] [CrossRef] [PubMed] [Green Version]
  22. Sullivan, M.; Petty, N.; Beatson, S. Easyfig: A genome comparison visualizer. Bioinformatics 2011, 27, 1009–1010. [Google Scholar] [CrossRef] [PubMed] [Green Version]
  23. Shkilnyj, P.; Koudelka, G.B. Effect of salt shock on stability of λimm434 lysogens. J. Bacteriol. 2007, 189, 3115–3123. [Google Scholar] [CrossRef] [PubMed] [Green Version]
  24. Stayrook, S.; Jaru-Ampornpan, P.; Ni, J.; Hochschild, A.; Lewis, M. Crystal structure of the λ repressor and a model for pairwise cooperative operator binding. Nature 2008, 452, 1022–1025. [Google Scholar] [CrossRef]
  25. Vareille, M.; de Sablet, T.; Hindré, T.; Martin, C.; Gobert, A.P. Nitric oxide inhibits Shiga-toxin synthesis by enterohemorrhagic Escherichia coli. Proc. Natl. Acad. Sci. USA 2007, 104, 10199–10204. [Google Scholar] [CrossRef]
  26. Colon, M.; Chakraborty, D.; Pevzner, Y.; Koudelka, G.B. Mechanisms that determine the differential stability of Stx+ and Stx lysogens. Toxins 2016, 8, 96. [Google Scholar] [CrossRef]
  27. Chakraborty, D.; Clark, E.; Mauro, S.A.; Koudelka, G.B. Molecular mechanisms governing “hair-trigger" induction of Shiga toxin-encoding prophages. Viruses 2018, 10, 228. [Google Scholar] [CrossRef] [Green Version]
  28. Fagerlund, A.; Aspholm, M.; Węgrzyn, G.; Lindbäck, T. High diversity in the regulatory region of Shiga toxin encoding bacteriophages. BMC Genom. 2022, 23, 230. [Google Scholar] [CrossRef]
  29. de Paepe, M.; Hutinet, G.; Son, O.; Amarir-Bouhram, J.; Schbath, S.; Petit, M.A. Temperate phages acquire DNA from defective prophages by relaxed homologous recombination: The role of Rad52-like recombinases. PLOS Genet. 2014, 10, e1004181. [Google Scholar] [CrossRef] [Green Version]
  30. Moura de Sousa, J.; Pfeifer, E.; Touchon, M.; Rocha, E. Causes and consequences of bacteriophage diversification via genetic exchanges across lifestyles and bacterial taxa. Microb. Evol. Genom. 2021, 38, 2497–2512. [Google Scholar]
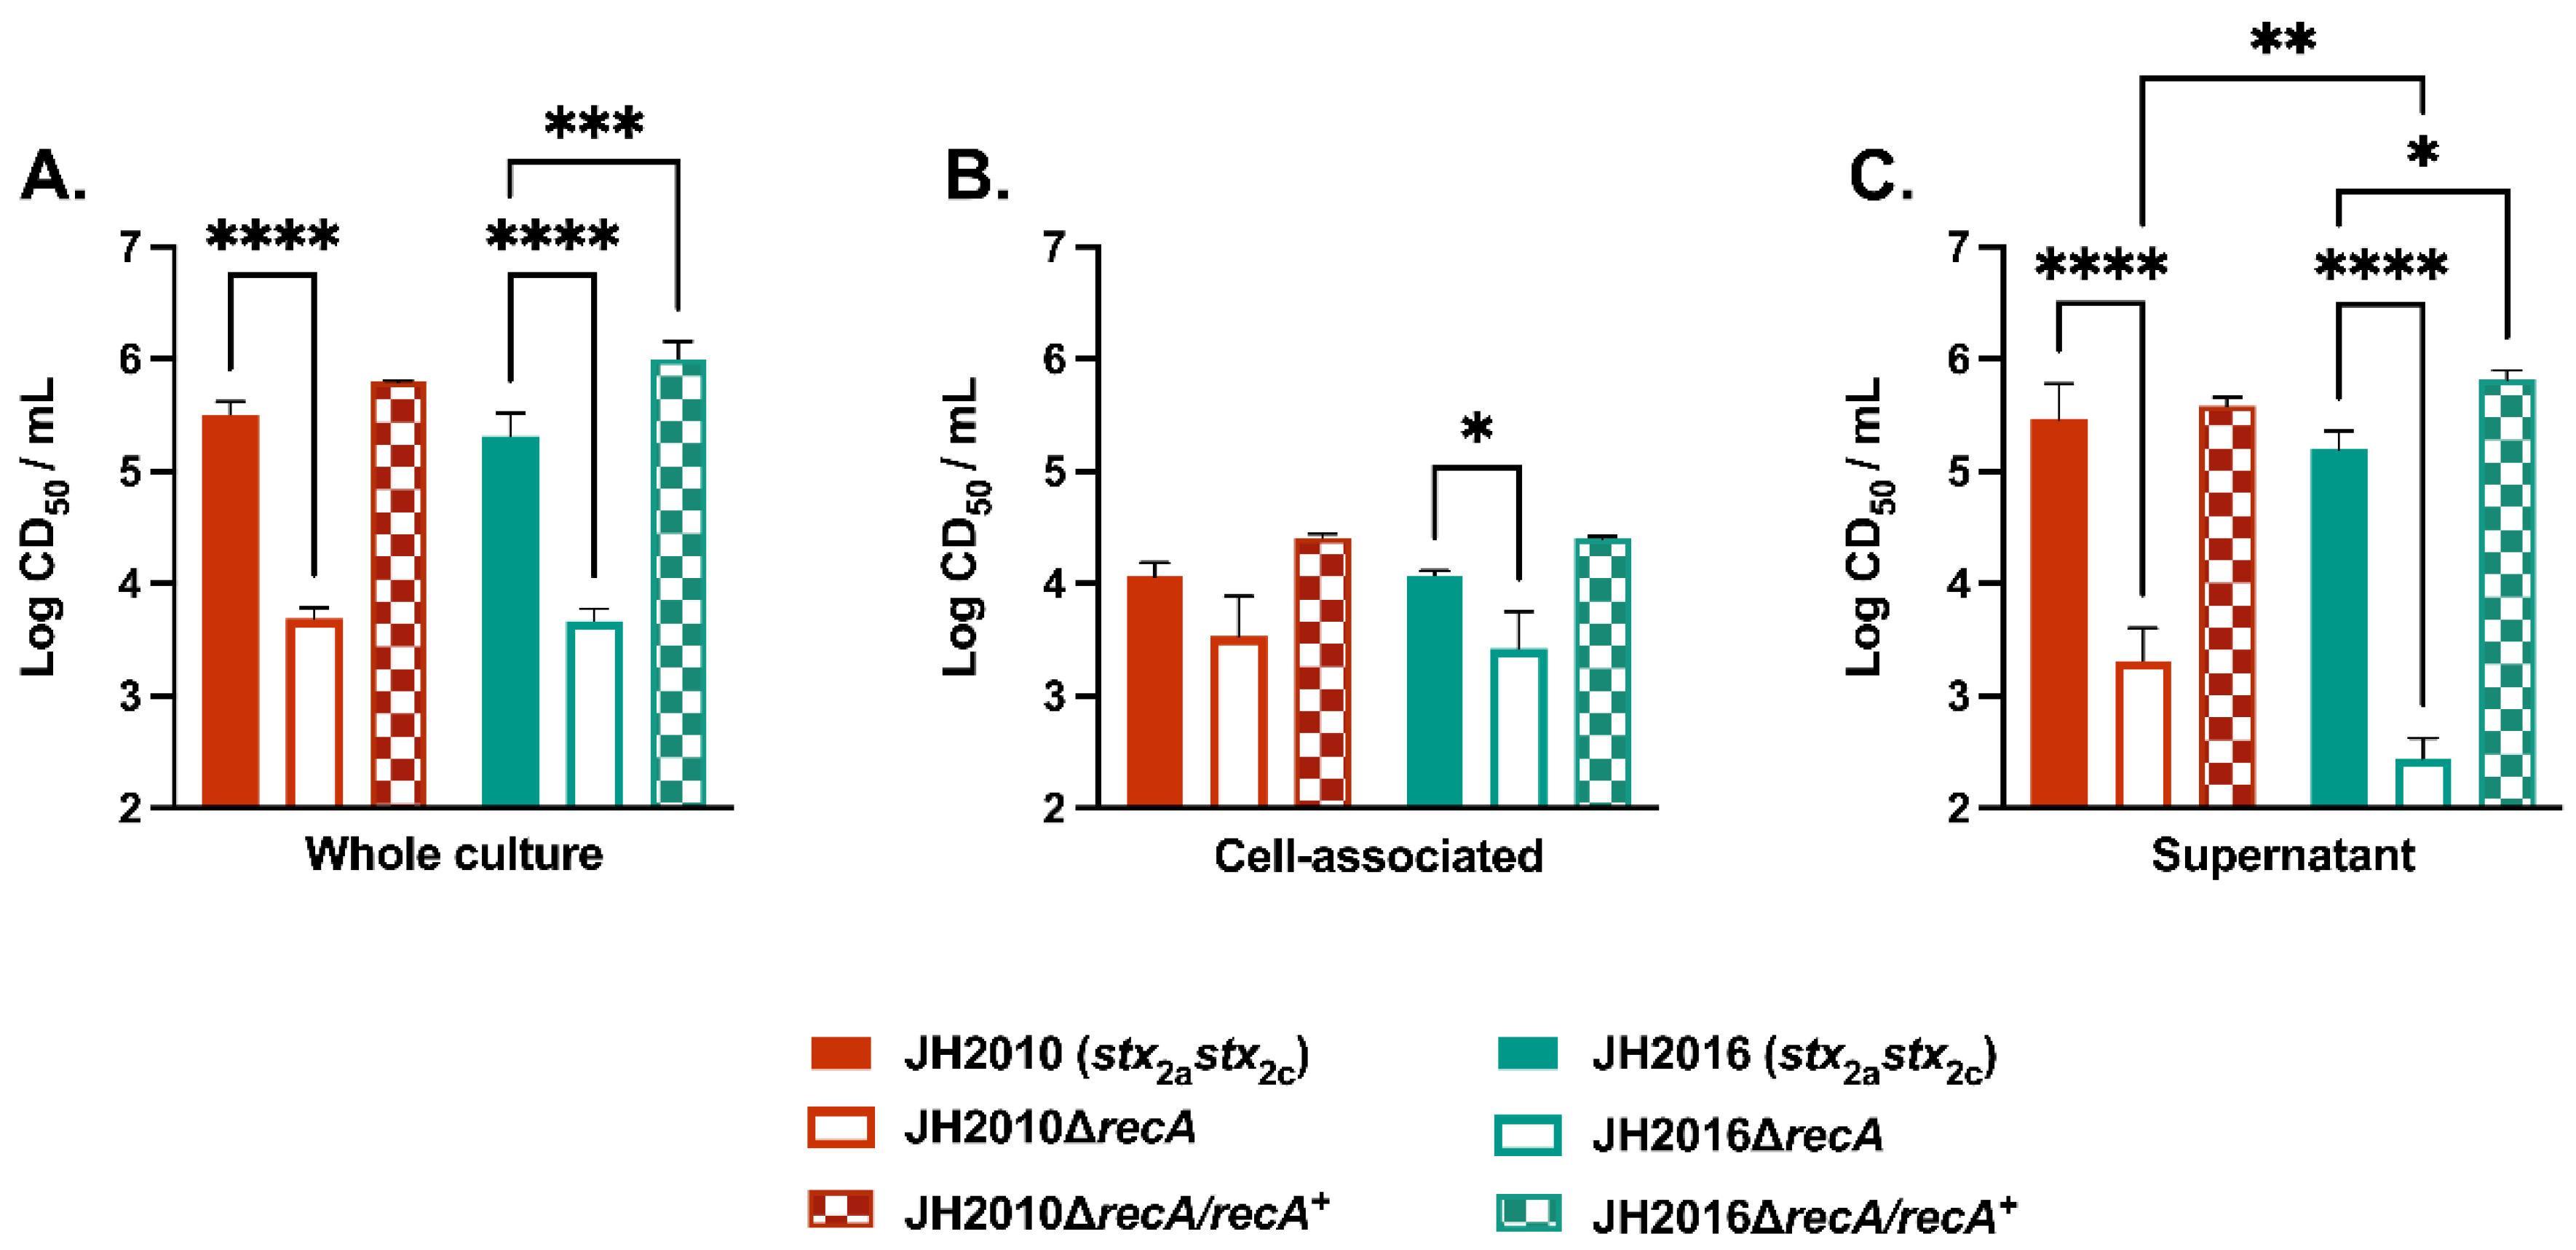
Figure 1. In vitro cytotoxicity of JH2010 and JH2016 wild-type and ΔrecA mutant strains. Samples were taken from overnight cultures grown in LB-YE from (A) the whole culture, or divided into (B) cell-associated or (C) supernatant fractions. Results are shown as mean log (CD50/mL) ± SD (n = 3 biological replicates). Statistical analyses were conducted by one-way ANOVA with Šídák’s test for multiple comparisons for each fraction. * p < 0.05, ** p < 0.01, *** p < 0.001, **** p < 0.0001.
Microorganisms 11 01925 g001
Figure 2. Cytotoxicity and colonization from mice infected with ΔrecA mutant derivative strains of JH2010 or JH2016. Str-treated mice were infected with either JH2010ΔrecA or JH2016ΔrecA. Fecal samples were collected on days 1 and 3 post-infection and assayed for (A) fecal cytotoxicity, shown as mean log10(CD50/g feces) ± SD, and (B) colonization, shown as mean log10(CFU/g feces) ± SD. (n = 5 biological replicates) Statistical analyses were conducted by unpaired t-test for each day post-infection. * p < 0.05, *** p < 0.001, **** p < 0.0001. LOD = limit of detection.
Microorganisms 11 01925 g002
Figure 3. Influence of RecA-independent inducing agents on the cytotoxicity from whole culture samples from JH2010ΔrecA or JH2016ΔrecA. Overnight cultures of JH2010ΔrecA and JH2016ΔrecA were grown in LB-YE media (as control) or LB-YE supplemented with 50 μM EDTA, 20 mM CaCl2, 20 mM MgCl2, or 0.5 mM ZnCl2. Significance was calculated by one-way ANOVA with Šídák’s test for multiple comparisons (n = 3 biological replicates). Comparisons between JH2010ΔrecA and JH2016ΔrecA for each culture condition: **** p < 0.0001. Comparisons between the cytotoxicity of control cultures and cultures with additions for each strain: # p < 0.0001.
Microorganisms 11 01925 g003
Figure 4. Mouse infection with wild-type JH2010 or JH2016 at an intermediate dose. (A) Survival of Str-treated mice infected with 106−7 CFU/mouse of JH2010 or JH2016 (n = 10 mice per strain). Fecal samples collected on days 1 and 3 post-infection (n = 5 mice per strain) were used to determine (B) fecal cytotoxicity, shown as mean log (CD50/g feces) ± SD, and (C) fecal colonization shown as mean log (CFU/g feces) ± SD. Statistical significance was calculated by (A) log-rank test or by (B,C) unpaired t-test on each day post-infection. ** p < 0.05, **** p < 0.0001.
Microorganisms 11 01925 g004
Figure 5. Genomic comparisons of the assembled stx2a-phages from JH2010 and JH2016 using NCBI Nucleotide BLAST. Alignment of the JH2010 and JH2016 stx2a-phage sequences was visualized using Easyfig. Gray arrows represent relevant functional clusters of genes based on gene product annotation within the labelled phage regions. The saturation of the color indicates percent homology between the two sequences; blue blocks represent sequences in the same orientation, while red represents sequences in the opposite orientation. White regions represent areas with less than 70% identity. The JH2010 and JH2016 stx2a phage genome sizes are 61,291 or 63,000 nucleotides, respectively.
Microorganisms 11 01925 g005
Figure 6. Influence of the stx2a-phage regulatory region on Stx2 production in stx2astx2c O157:H7 strains. (A) Overnight cultures of recA mutant strains were divided into cell-associated or supernatant fractions. Parental strains with JH2010-like or JH2016-like stx2a-phage regulatory sequences were identified from either PulseNet (triangles) or other NCBI databases (circles). (B) Samples were taken from the whole culture or divided into cell-associated or supernatant fractions for strains JH2010ΔNΔcIΔcro and JH2016ΔNΔcIΔcro. Results are shown as mean log (CD50/mL) ± SD, (n = 3 biological replicates). Statistical analyses were conducted by (A) unpaired t-test for each fraction or (B) one-way ANOVA with Šídák’s test for multiple comparisons for each fraction. ** p < 0.01.
Microorganisms 11 01925 g006
Figure 7. Gene expression of ΔrecA strains by RT-qPCR. (A) Location and order of genes on a STEC chromosome or stx2a-phage, not to scale. (B) Relative transcription of genes from overnight LB-YE cultures of JH2010ΔrecA and JH2016ΔrecA, as measured by RT-qPCR. Results are graphed as mean log fold change from gyrB transcript ± SD. Significance was calculated by one-way ANOVA with Šídák’s test for multiple comparisons (n = 7 biological replicates). * p < 0.05.
Microorganisms 11 01925 g007
Figure 8. The CIJH2010, and CIJH2016, and CIλ amino acid sequences and predicted protein structures. (A) Multiple sequence alignment of CI sequences by Clustal Omega from the JH2010 stx2a-phage, JH2016 stx2a-phage, and lambda phage. Amino acids highlighted in black show agreement with the reference CIJH2010 sequence. The black annotations below each sequence were determined by InterProScan, and represent the protein domains identified from the InterPro database. DNA-binding residues (blue) and the serine protease catalytic site residues (red) are also marked. (B) Tertiary protein structure predictions of CIJH2010 and CIJH2016 as determined by Phyre2 using CIλ as a reference (PDB #3BDN). The ribbon diagram is color-coded, based on secondary structure. All structures are shown with the C terminal region in the upper half of the image, and were oriented for viewing based on the noted N terminal helix (white arrow). Identified catalytic and DNA-binding residues were highlighted in the C and N terminal regions, respectively (yellow spheres).
Microorganisms 11 01925 g008
Table 1. Bacterial strains used in this study.
Strain NameDescriptionNCBI Accession # (Parental Strs Strain, Unless Noted)Reference
JH2010Strr isolate of CDC #06-3462NZ_CP034794.1, OP797663 *[14]
JH2016Strr isolate of CDC #2009c-4687NZ_CP034799.1[14]
JH2010ΔrecArecA replaced with cat cassette in JH2010N/A[14]
JH2016ΔrecArecA replaced with cat cassette in JH2016N/AThis study
pJH206pACYC177 vector with recA + 500 bp upstreamN/A[14]
JH2010ΔrecA/recA+Complementation of JH2010ΔrecA with pJH206N/A[14]
JH2016ΔrecA/recA+Complementation of JH2016ΔrecA with pJH206N/AThis study
JH2010ΔNΔcIΔcrostx2a-phage region from N to cro replaced with cat cassette in JH2010 N/AThis study
JH2016ΔNΔcIΔcrostx2a-phage region from N to cro replaced with cat cassette in JH2016N/AThis study
JH2011ΔrecArecA replaced with cat cassette in JH2011 (Strr isolate of CDC #08-3914)NZ_CP034808.1This study
JH2017ΔrecArecA replaced with cat cassette in JH2017 (Strr isolate of CDC #2010c-3142)NZ_CP034801.1This study
PA28-StrrΔrecArecA replaced with cat cassette in RA10 (Strr isolate of strain PA28)NC_041935.1 *This study,
parental strain [15]
TW14359-StrrΔrecArecA replaced with cat cassette in RA13 (Strr isolate of strain TW14359)NC_013008.1This study,
parental strain [16]
* stx2a-phage sequence only.
Table 2. Primers used in this study.
Primer/Primer PairsSequenceReference
Primers for mutagenesis and confirmation of deletion strains
recA-KO_FCTCATTTTATGGCTATCGACGAAAACAAACAGAAAGCGTTGGCGGCAGCACTGGGCCAGCACGTAAGAGGTTCCAACTTTCACCATAATG[14]
recA-KO_RACGAACGATTAAAAATCTTCGTTAGTTTCTGCTACGCCTTCGCTGTCATCTACAGAGAAATTACGCCCCGCCCTGCCACTCATC[14]
2010_N-CI-Cro-KO_FTTAACATAAATAGTCTTTTTCACCATAAGCATACTCAATAAGTCCATACGGCACGTAAGAGGTTCCAACTTTCACCATAATGThis study
2010_N-CI-Cro-KO_RTTATTCAGCCTGGTTCGGATGAGGAAACAGGTGCGGTAAGTCCGGGCGAATTACGCCCCGCCCTGCCACTCATCThis study
2016_N-CI-Cro-KO_FTCACCTCGCCGTCAGTTGTTTTGATTTCCGGTAGCCTGCCGCGTAAATGGGCACGTAAGAGGTTCCAACTTTCACCATAATGThis study
2016_N-CI-Cro-KO_RTTATGCAGCCAGAAGGTTCTTTTTGCTTATTTCAAGCATTTCGCTTGCTTTTACGCCCCGCCCTGCCACTCATCThis study
ScreenRecA_upFTAACAACTGCCGAGTCTTGTACCGGThis study
ScreenN_upFCTGTCGCCTGGAATCTCCThis study
ScreenCm_RCACGACGATTTCCGGCAGTTTC[14]
qPCR primers
qPCR was conducted with the following thermocycler conditions: 95 °C for 15 min, followed by 40 cycles of: 94 °C for 15 s, 52 °C for 30 s, and 72 °C for 30 s.
gyrB_rtF/gyrB_rtRF: GGTAGATAACGCTATCGACG
R: GGGTGAATACCGGTCGG
This study
CI-2010_rtF/CI-2010_rtR *F: GAGTCCGCAGAATTCTCTC
R: CAACCCTGACCAACTTTGC
This study
CI-2016_rtF/CI-2016_rtR *F: GCGCTTGCGAAATTTCTAAAC
R: CCATCAACACCAAGAATTGC
This study
Q3_rtF/Q3_rtRF: GACTGATCCCCGAAAAAGTA
R: CAACCAGCAAGTCATGCAG
[21]
stx2_rtF/stx2_rtRF: CGGCGGATTGTGCTAAAG
R: GGTACTGGATTTGATTGTGACAG
This study
* CI-2010 primer efficiency~100%, CI-2016 primer efficiency~94%.
Disclaimer/Publisher’s Note: The statements, opinions and data contained in all publications are solely those of the individual author(s) and contributor(s) and not of MDPI and/or the editor(s). MDPI and/or the editor(s) disclaim responsibility for any injury to people or property resulting from any ideas, methods, instructions or products referred to in the content.