


Effect of Oral Administration of Polyethylene Glycol 400 on Gut Microbiota Composition and Diet-Induced Obesity in Mice
 , ,
, ,  and
and 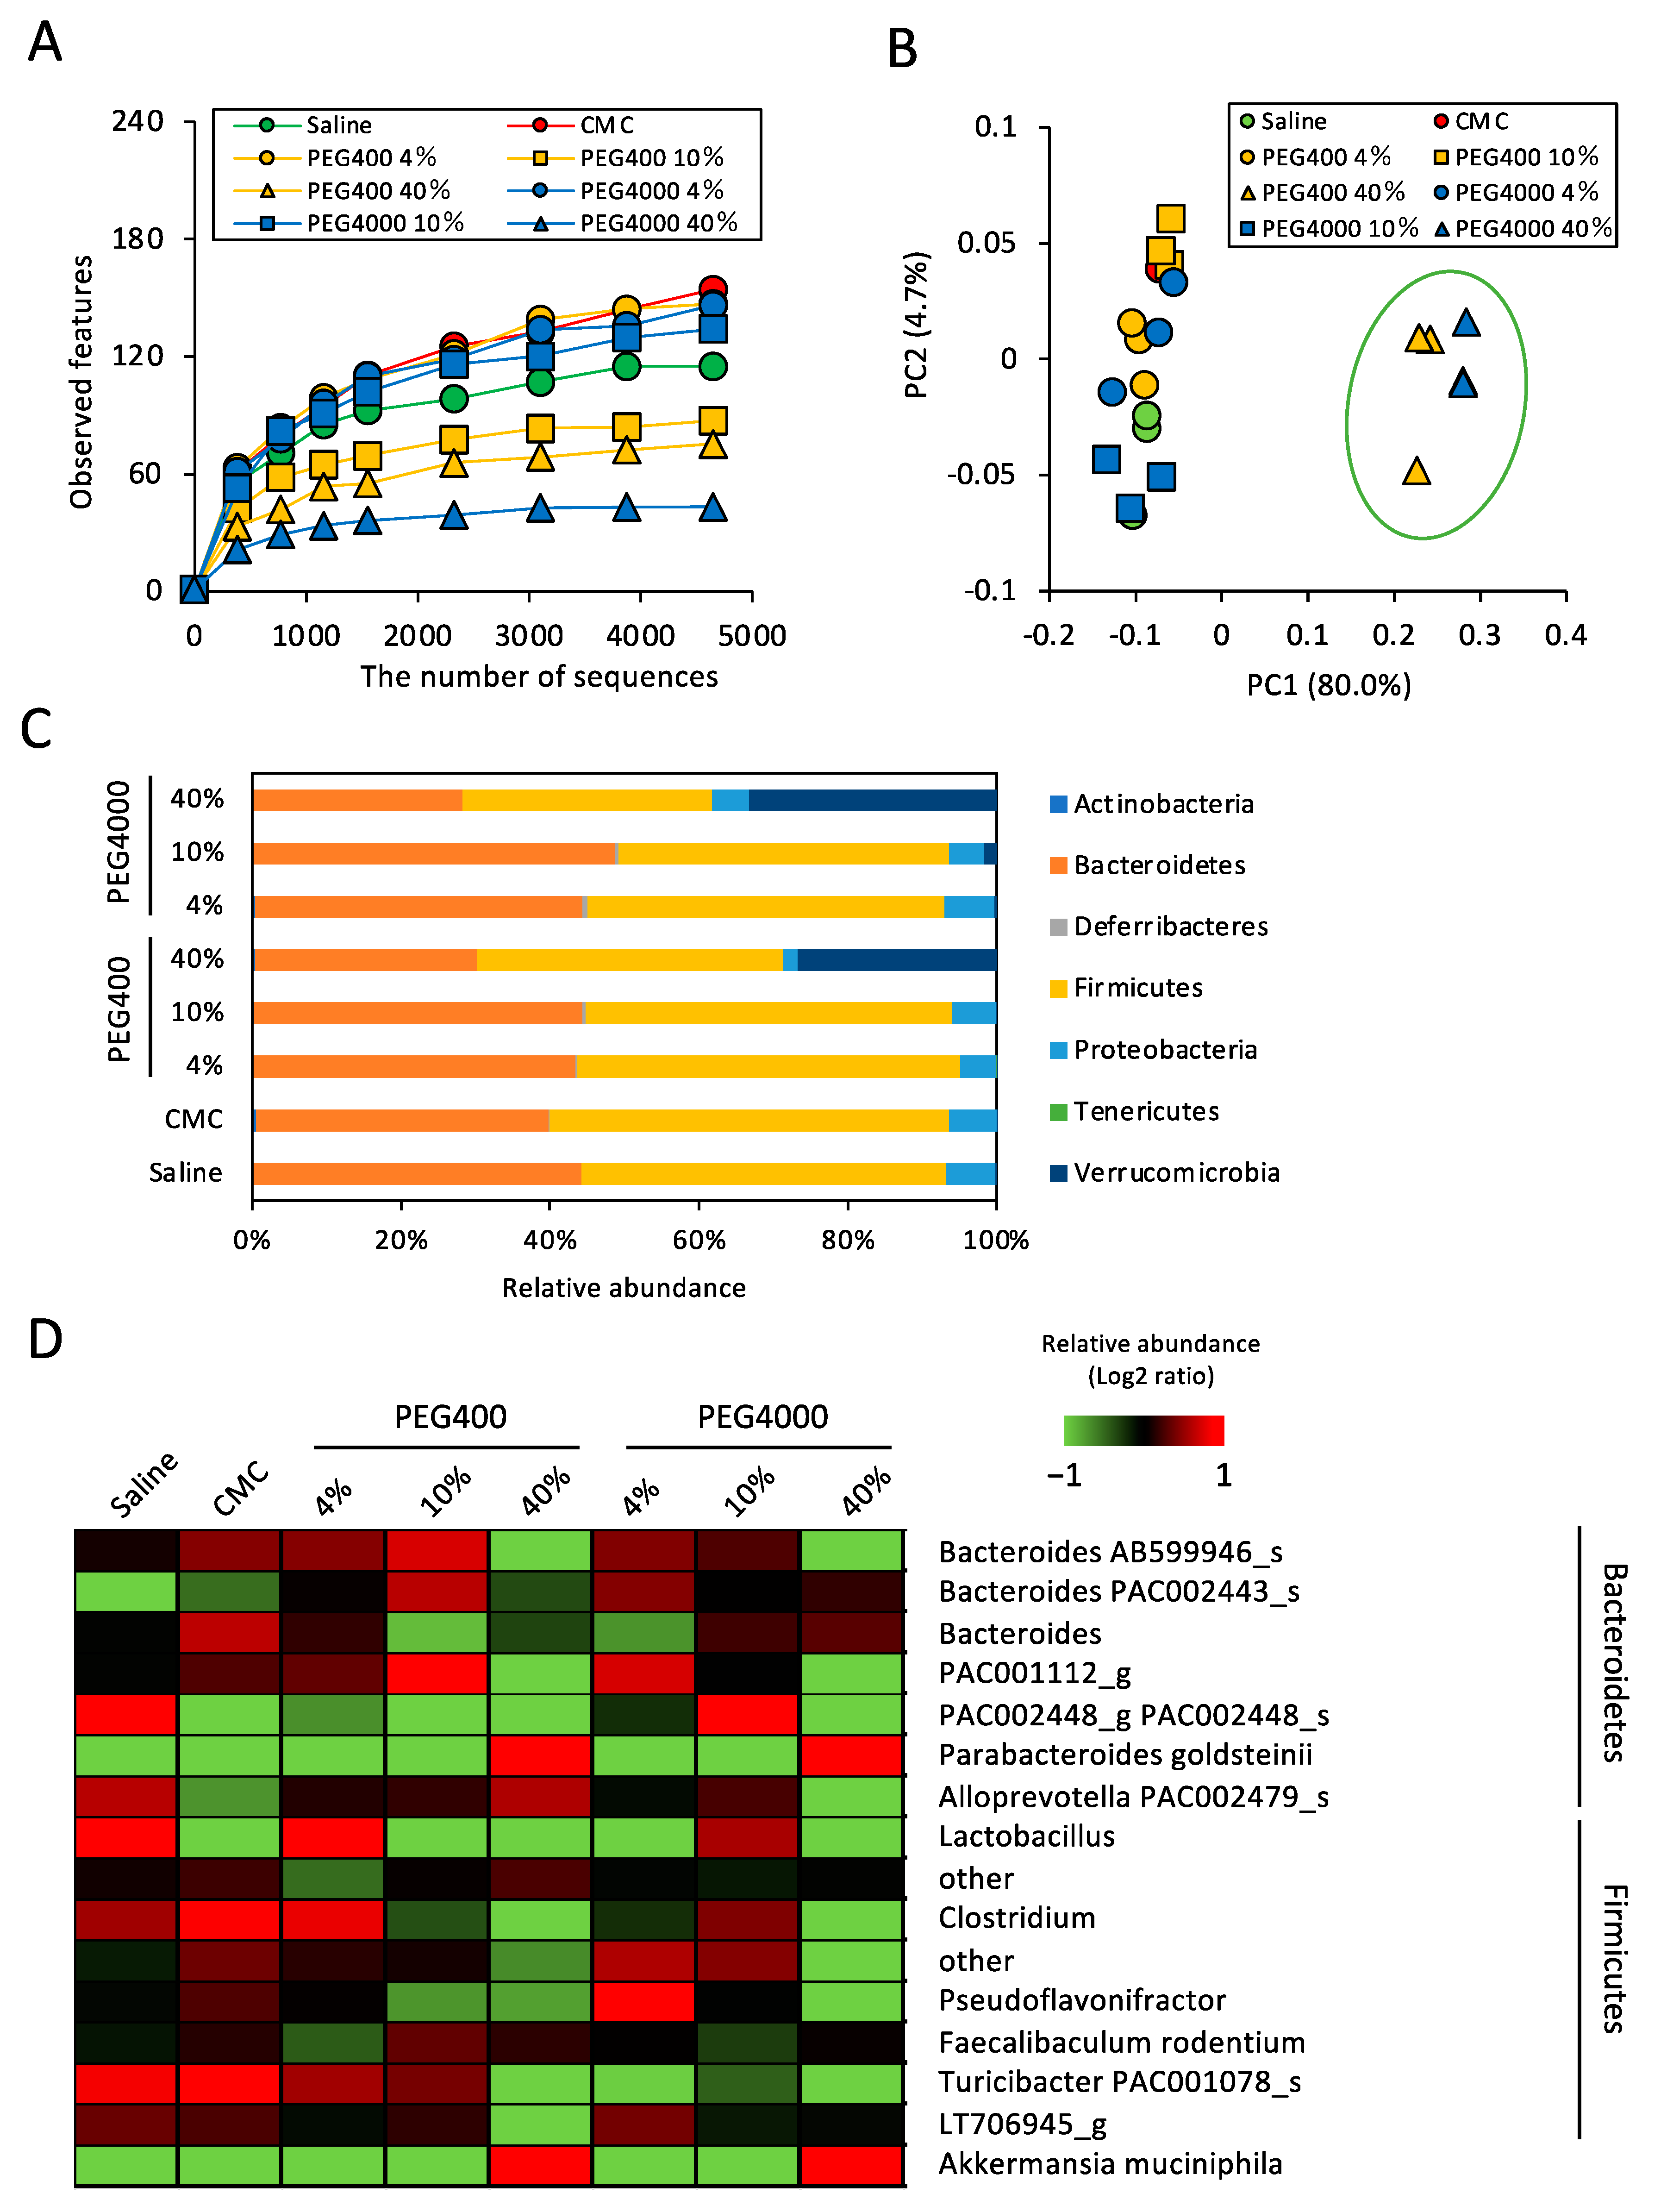
Abstract
1. Introduction
2. Materials and Methods
2.1. Animals and Treatments
2.2. Fecal DNA Isolation
2.3. 16S Ribosomal RNA (rRNA) Gene Amplicon Sequencing
2.4. Bacterial Community Analysis
2.5. RNA isolation and cDNA Preparation
2.6. Reverse Transcription-Quantitative PCR (RT-qPCR)
2.7. Insulin Tolerance Test
2.8. Fecal Microbiome Transplantation (FMT)
2.9. Statistical Analysis
3. Results
3.1. Effects of PEG on Gut Microbiota of ND-Fed Mice
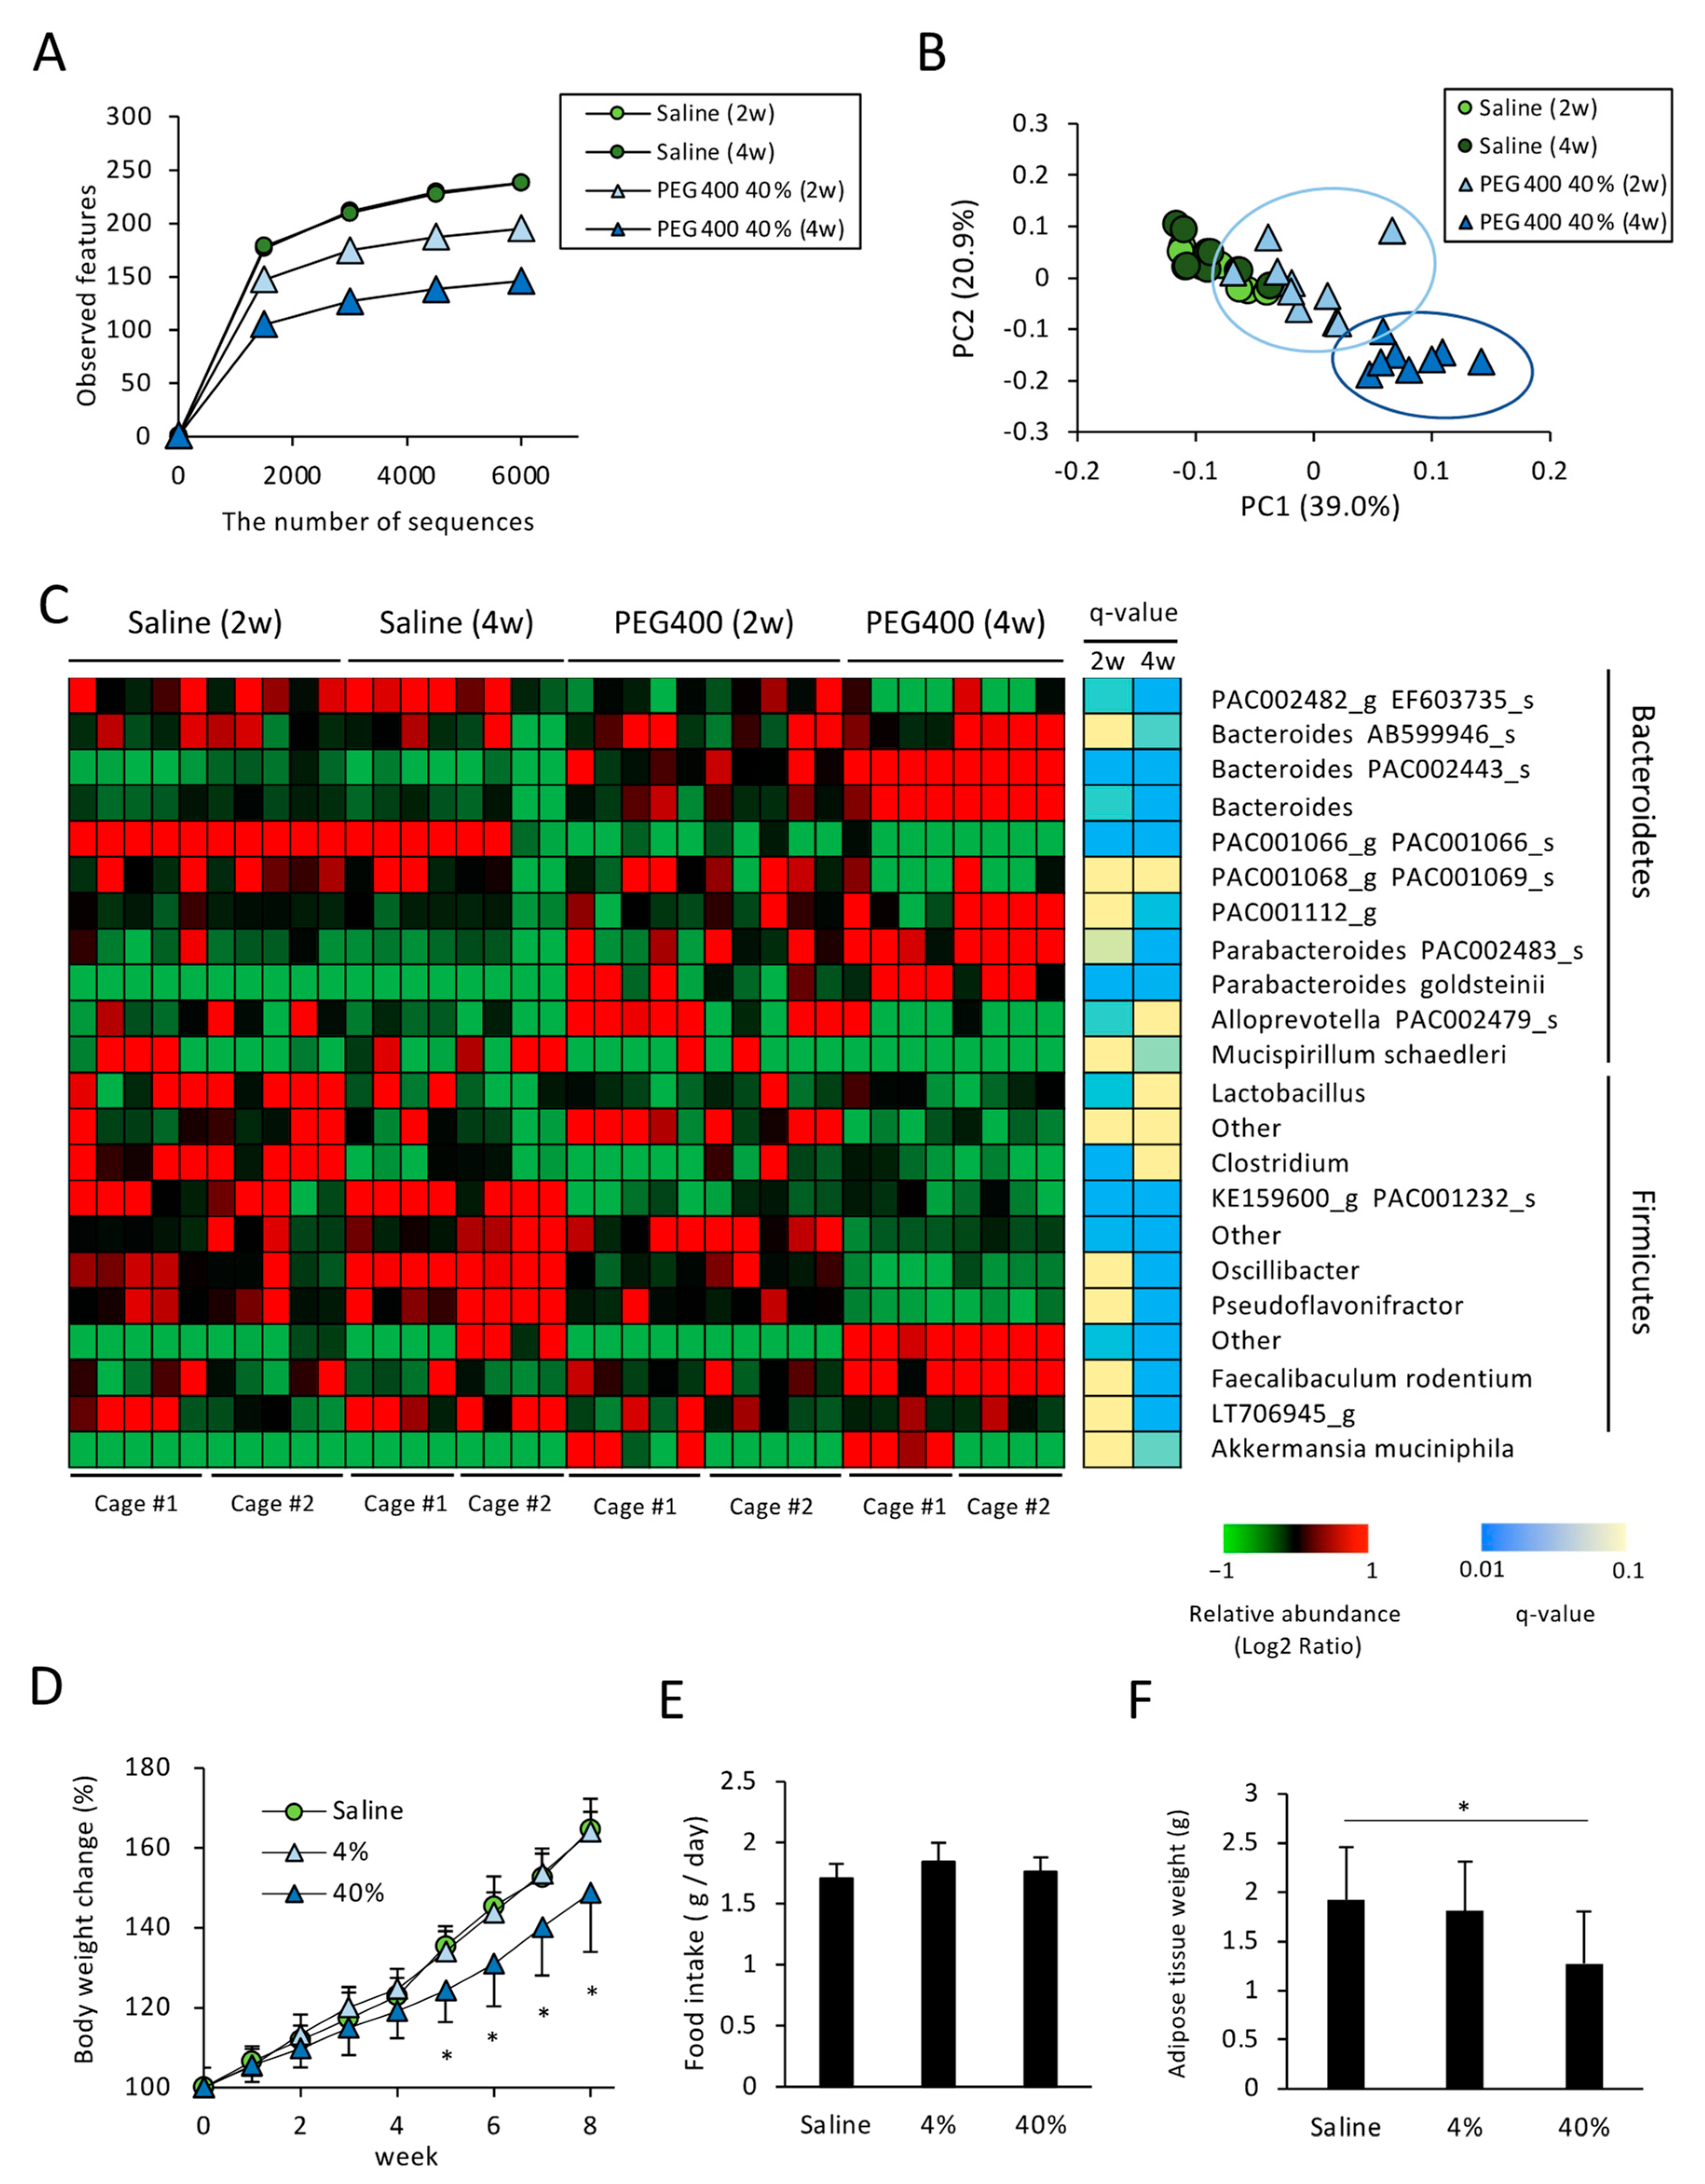
3.2. Effects of PEG on Gut Microbiota of HFD-Fed Mice
3.3. Effects of PEG on Appetite and HFD-Induced Body Weight and eWAT Weight Change
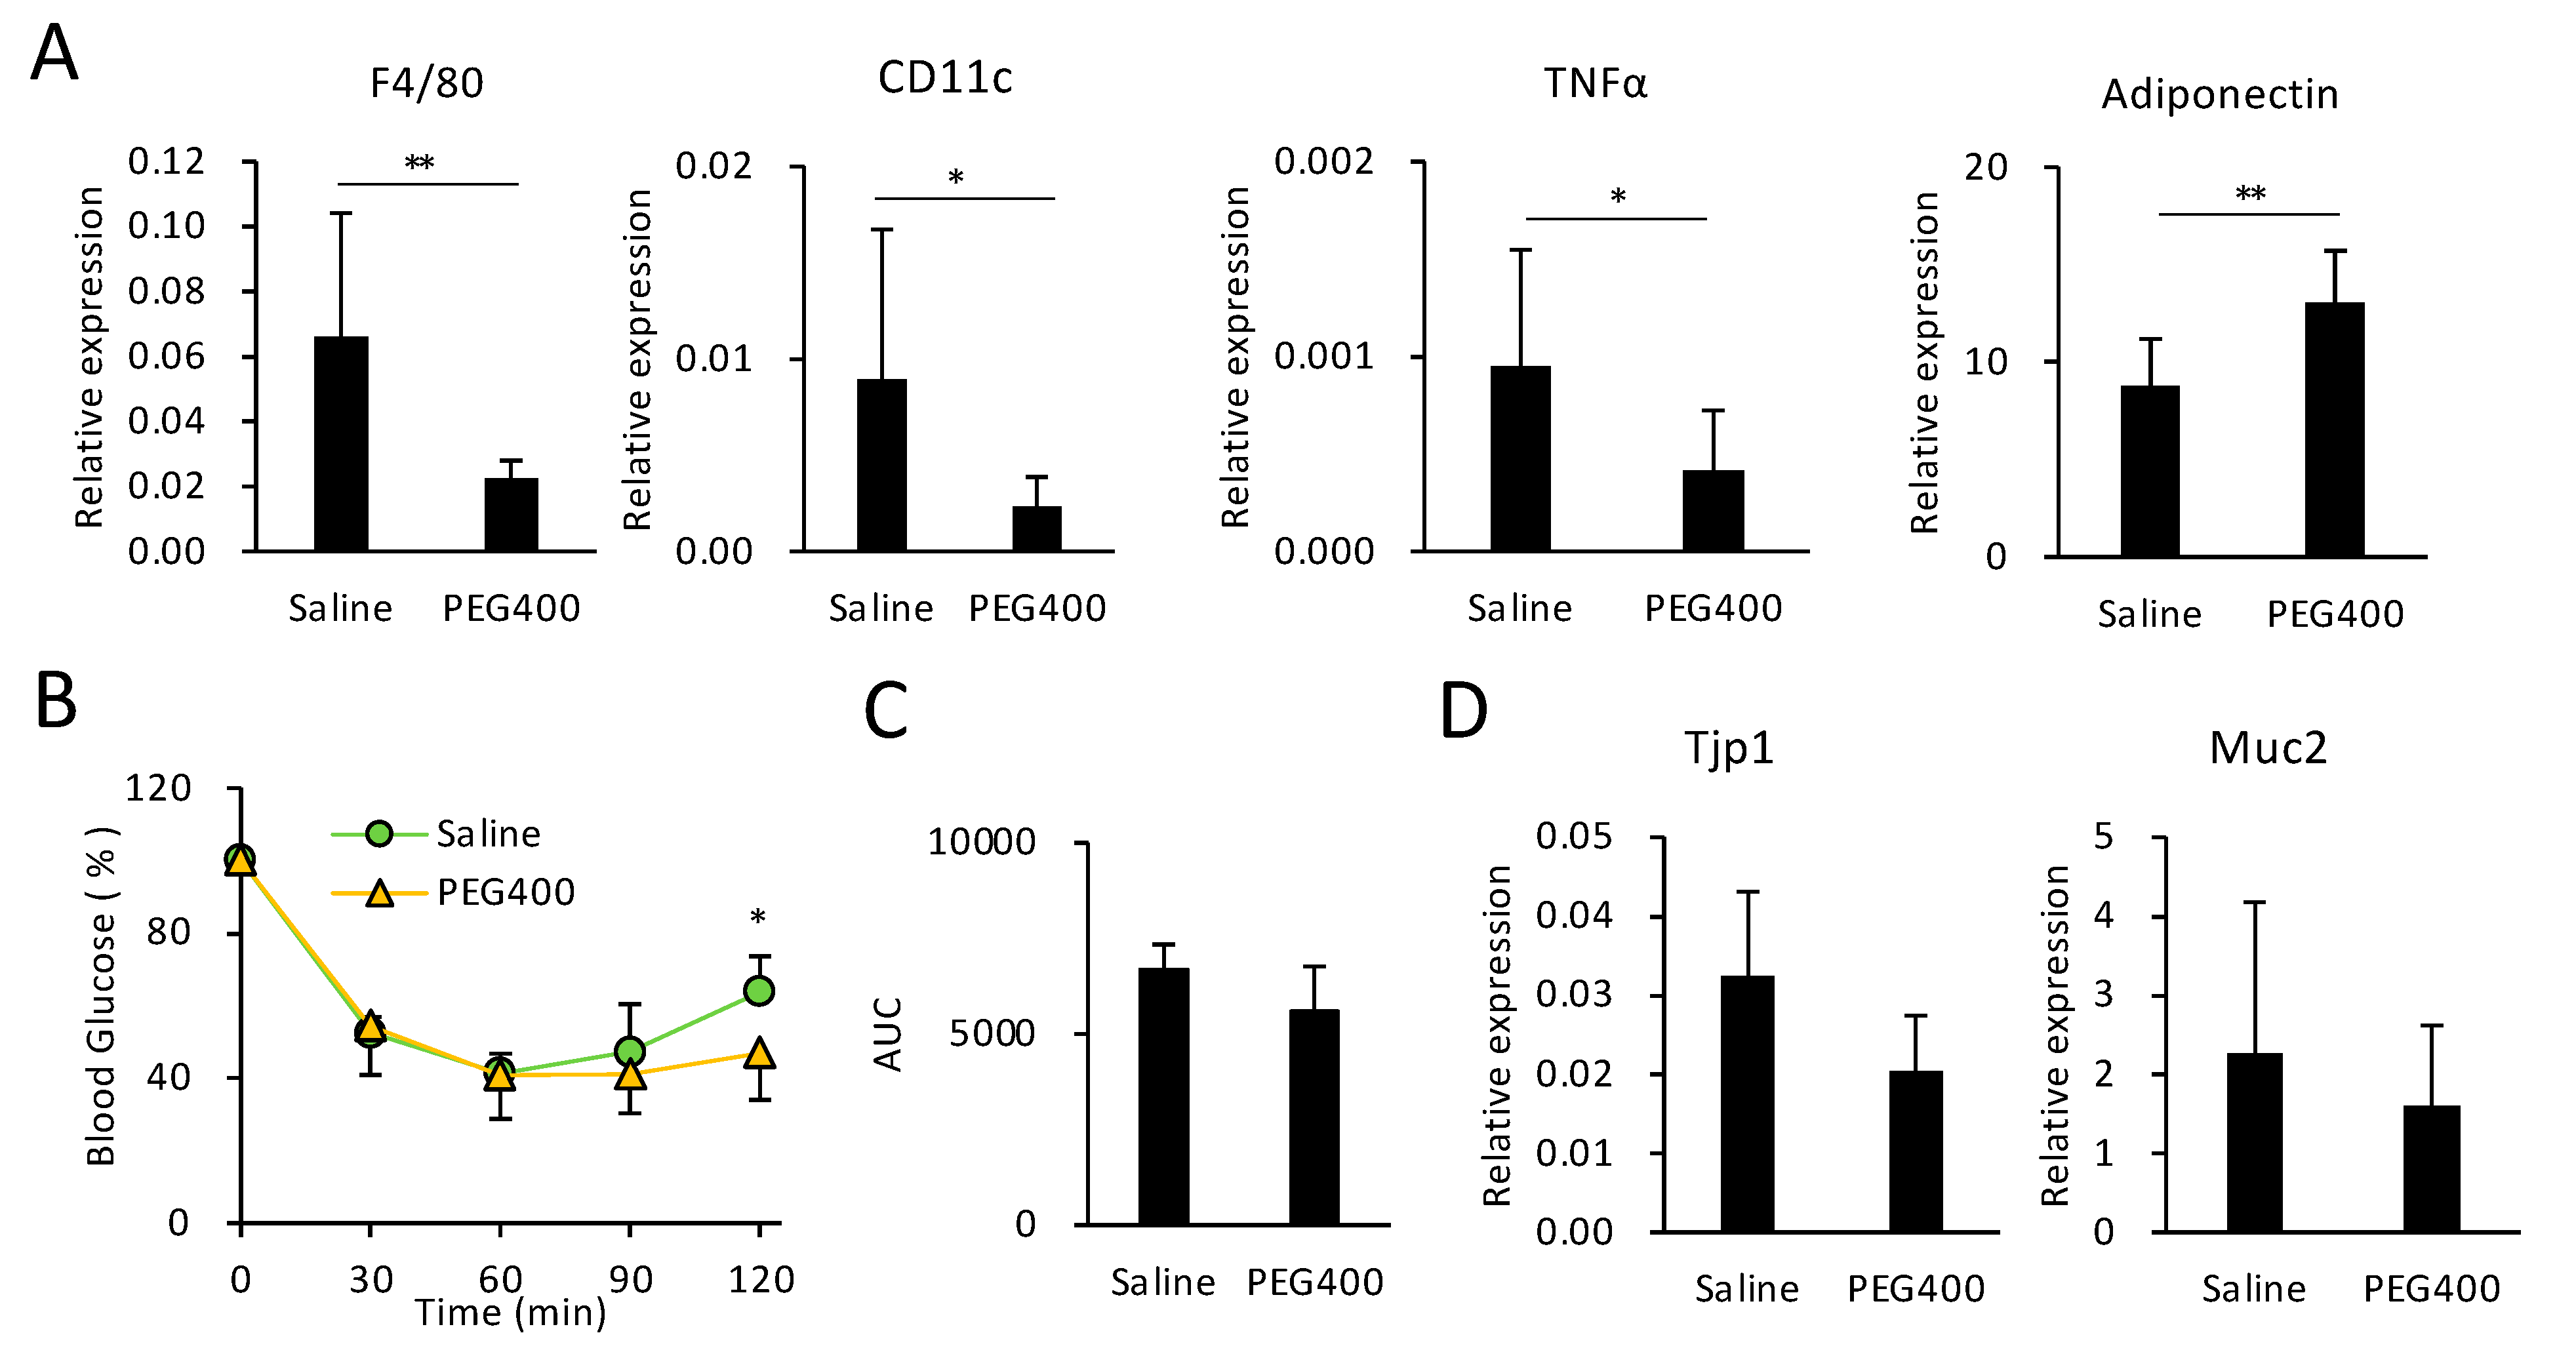
3.4. Effects of PEG on HFD-Induced eWAT Inflammation and Intestinal Barrier Function
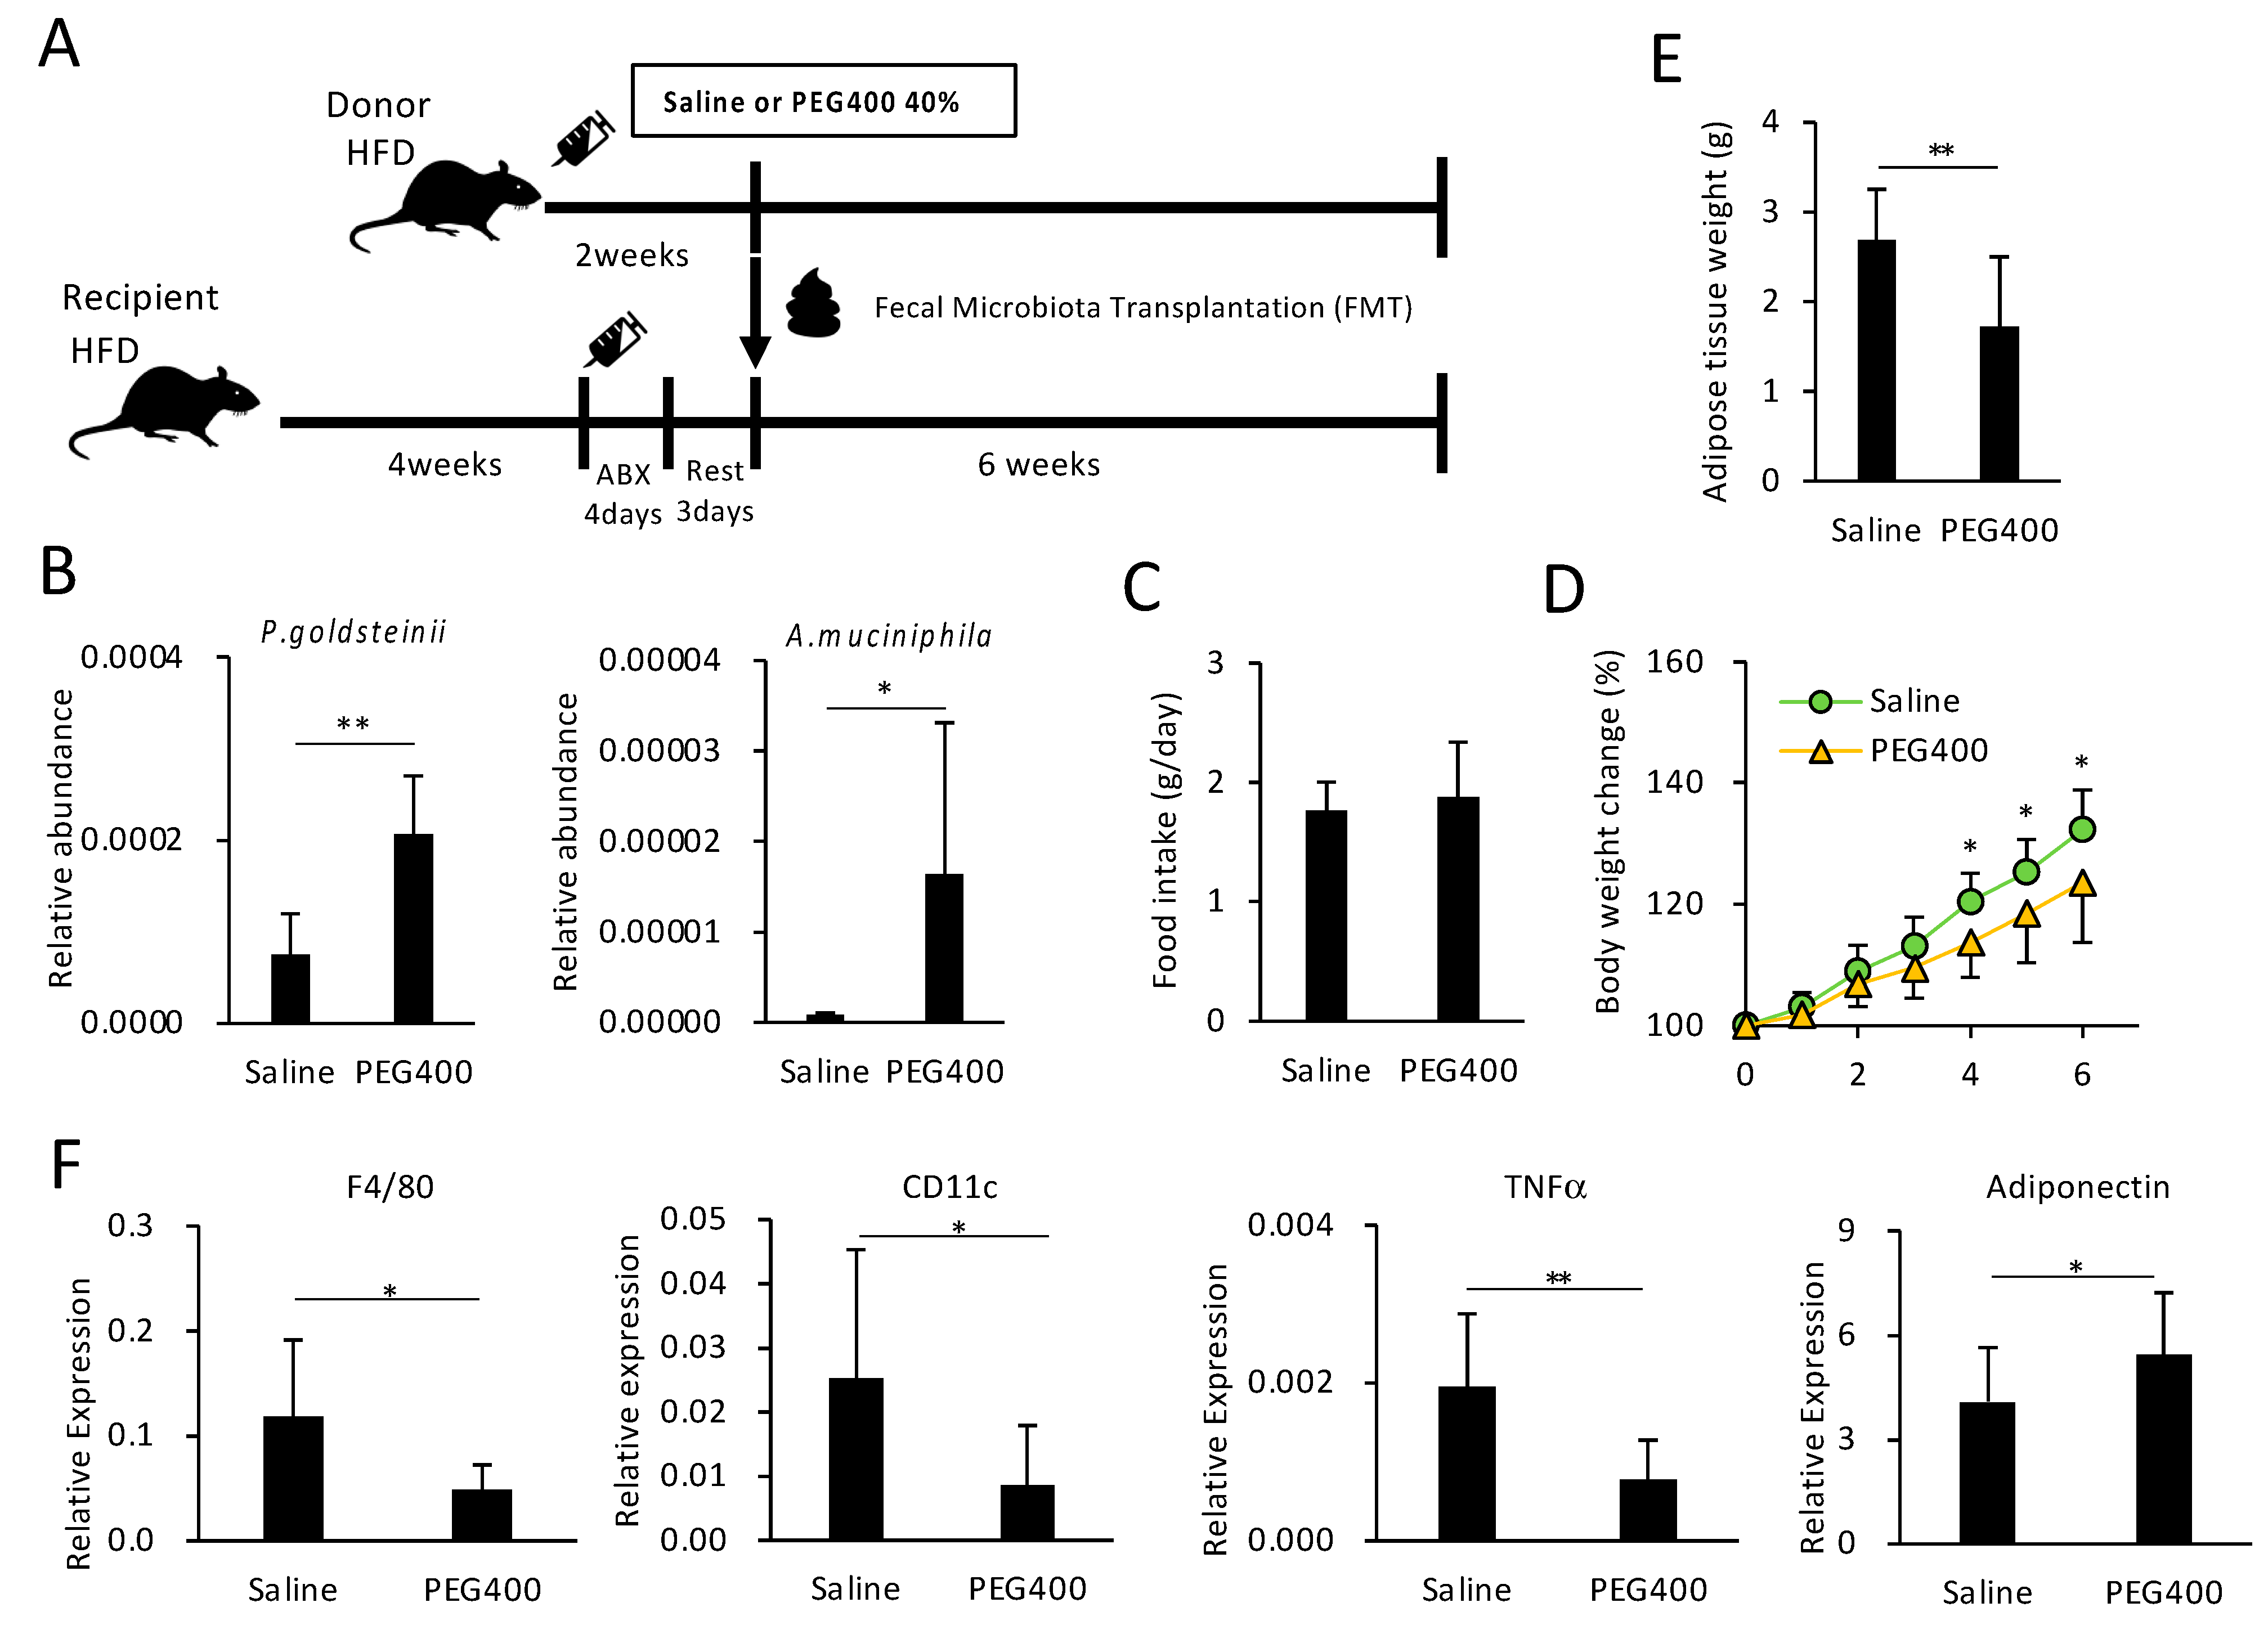
3.5. Effect of Bacterial Transplantation on HFD-Induced Obesity and eWAT Inflammation
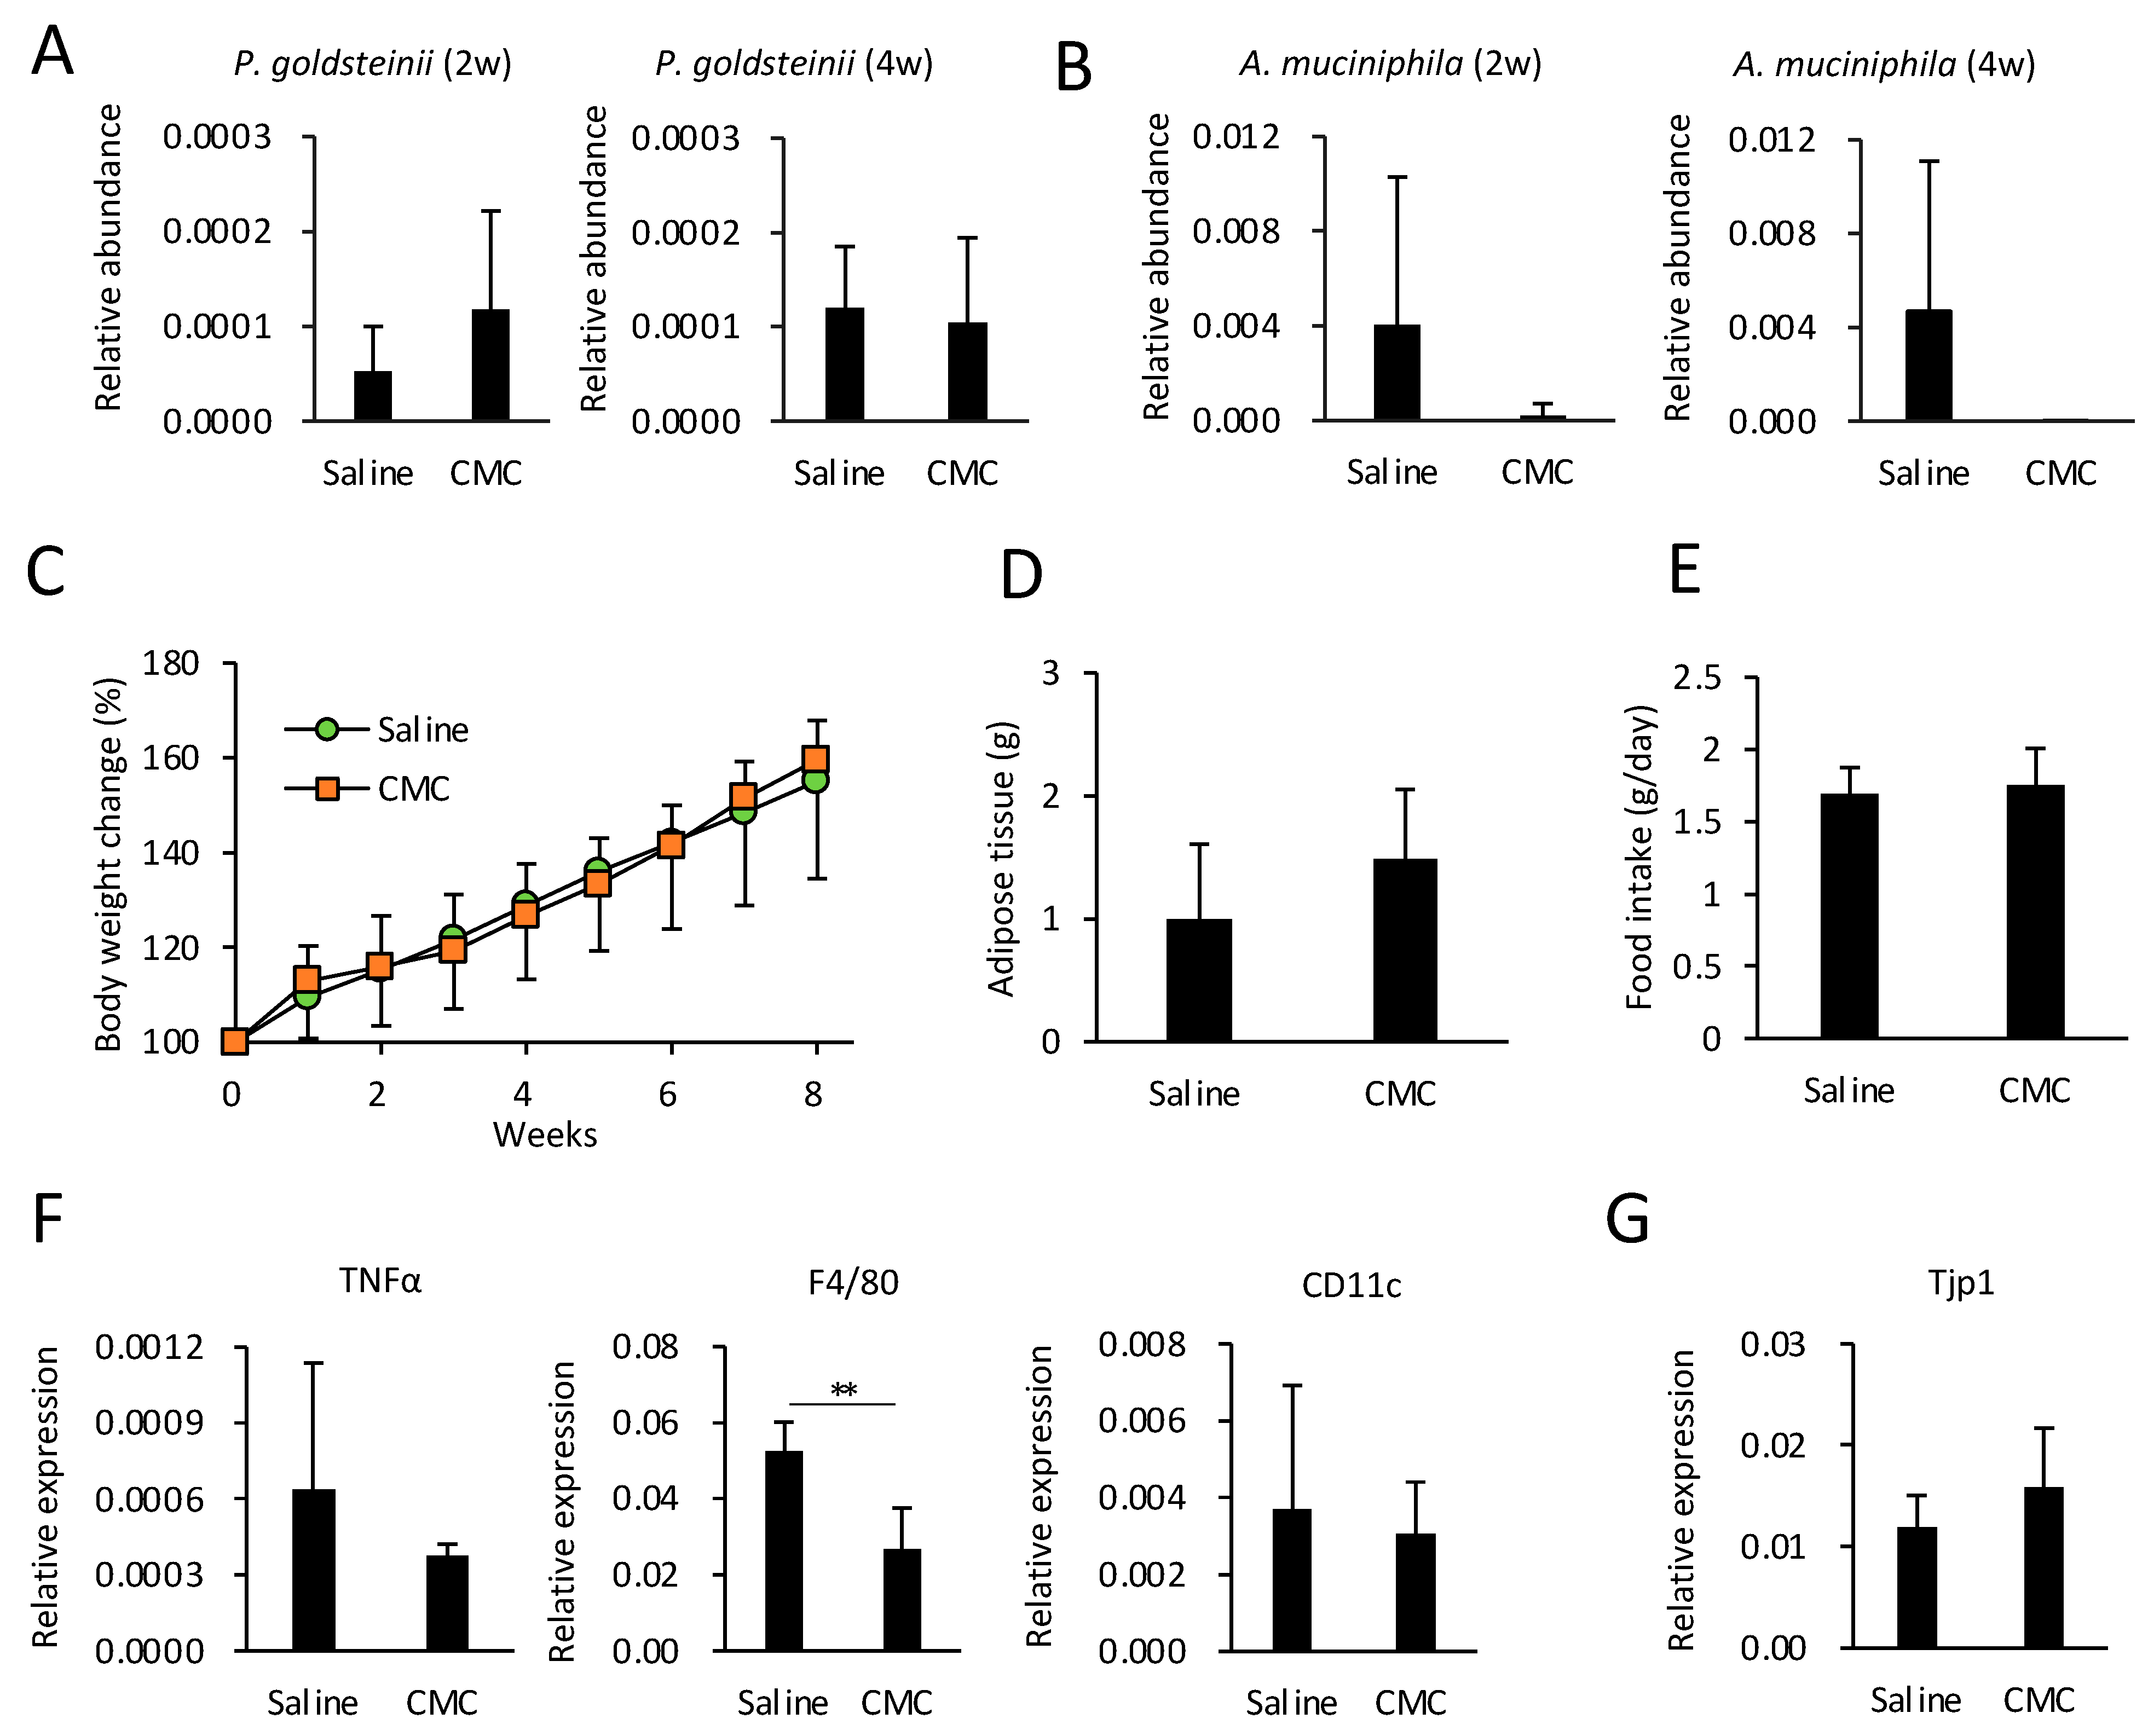
3.6. Effects of CMC on Gut Microbiota, Obesity, and eWAT Inflammation in HFD-Fed Mice
4. Discussion
Supplementary Materials
Author Contributions
Funding
Data Availability Statement
Acknowledgments
Conflicts of Interest
References
- Ma, B.-L.; Yang, Y.; Dai, Y.; Li, Q.; Lin, G.; Ma, Y.-M. Polyethylene glycol 400 (PEG400) affects the systemic exposure of oral drugs based on multiple mechanisms: Taking berberine as an example. RSC Adv. 2017, 7, 2435–2442. [Google Scholar] [CrossRef]
- Johnson, B.M.; Charman, W.N.; Porter, C.J. An in vitro examination of the impact of polyethylene glycol 400, Pluronic P85, and vitamin E d-alpha-tocopheryl polyethylene glycol 1000 succinate on P-glycoprotein efflux and enterocyte-based metabolism in excised rat intestine. AAPS Pharm. Sci. 2002, 4, E40. [Google Scholar] [CrossRef]
- Mudra, D.R.; Borchardt, R.T. Absorption barriers in the rat intestinal mucosa. 3: Effects of polyethoxylated solubilizing agents on drug permeation and metabolism. J. Pharm. Sci. 2010, 99, 1016–1027. [Google Scholar] [CrossRef]
- Fan, Y.; Pedersen, O. Gut microbiota in human metabolic health and disease. Nat. Rev. Microbiol. 2021, 19, 55–71. [Google Scholar] [CrossRef]
- Pantzar, N.; Bergqvist, P.B.; Bugge, M.; Olaison, G.; Lundin, S.; Jeppsson, B.; Westrom, B.; Bengtsson, F. Small intestinal absorption of polyethylene glycol 400 to 1,000 in the portacaval shunted rat. Hepatology 1995, 21, 1167–1173. [Google Scholar]
- Hu, X.; Fukutani, A.; Liu, X.; Kimbara, K.; Kawai, F. Isolation of bacteria able to grow on both polyethylene glycol (PEG) and polypropylene glycol (PPG) and their PEG/PPG dehydrogenases. Appl. Microbiol. Biotechnol. 2007, 73, 1407–1413. [Google Scholar] [CrossRef]
- Turnbaugh, P.J.; Ley, R.E.; Mahowald, M.A.; Magrini, V.; Mardis, E.R.; Gordon, J.I. An obesity-associated gut microbiome with increased capacity for energy harvest. Nature 2006, 444, 1027–1031. [Google Scholar] [CrossRef]
- Louis, P.; Flint, H.J. Formation of propionate and butyrate by the human colonic microbiota. Environ. Microbiol. 2017, 19, 29–41. [Google Scholar] [CrossRef]
- Portincasa, P.; Bonfrate, L.; Vacca, M.; De Angelis, M.; Farella, I.; Lanza, E.; Khalil, M.; Wang, D.Q.; Sperandio, M.; Di Ciaula, A. Gut Microbiota and Short Chain Fatty Acids: Implications in Glucose Homeostasis. Int. J. Mol. Sci. 2022, 23, 1105. [Google Scholar] [CrossRef]
- Li, W.Z.; Stirling, K.; Yang, J.J.; Zhang, L. Gut microbiota and diabetes: From correlation to causality and mechanism. World J. Diabetes 2020, 11, 293–308. [Google Scholar] [CrossRef]
- Wu, T.R.; Lin, C.S.; Chang, C.J.; Lin, T.L.; Martel, J.; Ko, Y.F.; Ojcius, D.M.; Lu, C.C.; Young, J.D.; Lai, H.C. Gut commensal Parabacteroides goldsteinii plays a predominant role in the anti-obesity effects of polysaccharides isolated from Hirsutella sinensis. Gut 2019, 68, 248–262. [Google Scholar] [CrossRef]
- Yang, J.Y.; Lee, Y.S.; Kim, Y.; Lee, S.H.; Ryu, S.; Fukuda, S.; Hase, K.; Yang, C.S.; Lim, H.S.; Kim, M.S.; et al. Gut commensal Bacteroides acidifaciens prevents obesity and improves insulin sensitivity in mice. Mucosal Immunol. 2017, 10, 104–116. [Google Scholar] [CrossRef]
- Wang, K.; Liao, M.; Zhou, N.; Bao, L.; Ma, K.; Zheng, Z.; Wang, Y.; Liu, C.; Wang, W.; Wang, J.; et al. Parabacteroides distasonis Alleviates Obesity and Metabolic Dysfunctions via Production of Succinate and Secondary Bile Acids. Cell Rep. 2019, 26, 222–235. [Google Scholar] [CrossRef]
- Everard, A.; Belzer, C.; Geurts, L.; Ouwerkerk, J.P.; Druart, C.; Bindels, L.B.; Guiot, Y.; Derrien, M.; Muccioli, G.G.; Delzenne, N.M.; et al. Cross-talk between Akkermansia muciniphila and intestinal epithelium controls diet-induced obesity. Proc. Natl. Acad. Sci. USA 2013, 110, 9066–9071. [Google Scholar] [CrossRef]
- Plovier, H.; Everard, A.; Druart, C.; Depommier, C.; Van Hul, M.; Geurts, L.; Chilloux, J.; Ottman, N.; Duparc, T.; Lichtenstein, L.; et al. A purified membrane protein from Akkermansia muciniphila or the pasteurized bacterium improves metabolism in obese and diabetic mice. Nat. Med. 2017, 23, 107–113. [Google Scholar] [CrossRef]
- Chelakkot, C.; Choi, Y.; Kim, D.K.; Park, H.T.; Ghim, J.; Kwon, Y.; Jeon, J.; Kim, M.S.; Jee, Y.K.; Gho, Y.S.; et al. Akkermansia muciniphila-derived extracellular vesicles influence gut permeability through the regulation of tight junctions. Exp. Mol. Med. 2018, 50, e450. [Google Scholar] [CrossRef]
- Wang, L.J.; Tang, L.; Feng, Y.M.; Zhao, S.Y.; Han, M.; Zhang, C.; Yuan, G.H.; Zhu, J.; Cao, S.Y.; Wu, Q.; et al. A purified membrane protein from Akkermansia muciniphila or the pasteurised bacterium blunts colitis associated tumourigenesis by modulation of CD8(+) T cells in mice. Gut 2020, 69, 1988–1997. [Google Scholar] [CrossRef]
- Xu, Y.; Wang, N.; Tan, H.Y.; Li, S.; Zhang, C.; Feng, Y.B. Function of Akkermansia muciniphila in Obesity: Interactions With Lipid Metabolism, Immune Response and Gut Systems. Front. Microbiol. 2020, 11, 219. [Google Scholar] [CrossRef]
- Gorzelak, M.A.; Gill, S.K.; Tasnim, N.; Ahmadi-Vand, Z.; Jay, M.; Gibson, D.L. Methods for Improving Human Gut Microbiome Data by Reducing Variability through Sample Processing and Storage of Stool. PLoS ONE 2015, 10, e0134802. [Google Scholar] [CrossRef]
- Ishibashi, R.; Furusawa, Y.; Honda, H.; Watanabe, Y.; Fujisaka, S.; Nishikawa, M.; Ikushiro, S.; Kurihara, S.; Tabuchi, Y.; Tobe, K.; et al. Isoliquiritigenin Attenuates Adipose Tissue Inflammation and Metabolic Syndrome by Modifying Gut Bacteria Composition in Mice. Mol. Nutr. Food Res. 2022, 66, e2101119. [Google Scholar] [CrossRef]
- Yamanouchi, Y.; Chudan, S.; Ishibashi, R.; Ohue-Kitano, R.; Nishikawa, M.; Tabuchi, Y.; Kimura, I.; Nagai, Y.; Ikushiro, S.; Furusawa, Y. The Impact of Low-Viscosity Soluble Dietary Fibers on Intestinal Microenvironment and Experimental Colitis: A Possible Preventive Application of Alpha-Cyclodextrin in Intestinal Inflammation. Mol. Nutr. Food Res. 2022, 66, 2200063. [Google Scholar] [CrossRef]
- Chudan, S.; Ishibashi, R.; Nishikawa, M.; Tabuchi, Y.; Nagai, Y.; Ikushiro, S.; Furusawa, Y. Effect of soluble oat fiber on intestinal microenvironment and TNBS-induced colitis. Food Funct. 2023, 14, 2188–2199. [Google Scholar] [CrossRef]
- Chudan, S.; Ishibashi, R.; Nishikawa, M.; Tabuchi, Y.; Nagai, Y.; Ikushiro, S.; Furusawa, Y. Effect of Wheat-Derived Arabinoxylan on the Gut Microbiota Composition and Colonic Regulatory T Cells. Molecules 2023, 28, 3079. [Google Scholar] [CrossRef]
- Hall, M.; Beiko, R.G. 16S rRNA Gene Analysis with QIIME2. Methods Mol. Biol. 2018, 1849, 113–129. [Google Scholar]
- Yoon, S.H.; Ha, S.M.; Kwon, S.; Lim, J.; Kim, Y.; Seo, H.; Chun, J. Introducing EzBioCloud: A taxonomically united database of 16S rRNA gene sequences and whole-genome assemblies. Int. J. Syst. Evol. Microbiol. 2017, 67, 1613–1617. [Google Scholar] [CrossRef]
- Jimeno, R.; Brailey, P.M.; Barral, P. Quantitative Polymerase Chain Reaction-based Analyses of Murine Intestinal Microbiota After Oral Antibiotic Treatment. Jove-J. Vis. Exp. 2018, 17, e58481. [Google Scholar] [CrossRef]
- Hussain, A.; Afzal, O.; Yasmin, S.; Haider, N.; Altamimi, A.S.A.; Martinez, F.; Acree, W.E., Jr.; Ramzan, M. Preferential Solvation Study of Rosuvastatin in the PEG400 (1) + Water (2) Cosolvent Mixture and GastroPlus Software-Based In Vivo Predictions. ACS Omega 2023, 8, 12761–12772. [Google Scholar] [CrossRef]
- Singh, G.; Brass, A.; Cruickshank, S.M.; Knight, C.G. Cage and maternal effects on the bacterial communities of the murine gut. Sci. Rep. 2021, 11, 9841. [Google Scholar] [CrossRef]
- Russell, A.; Copio, J.N.; Shi, Y.; Kang, S.; Franklin, C.L.; Ericsson, A.C. Reduced housing density improves statistical power of murine gut microbiota studies. Cell Rep. 2022, 39, 110783. [Google Scholar] [CrossRef]
- Achari, A.E.; Jain, S.K. Adiponectin, a Therapeutic Target for Obesity, Diabetes, and Endothelial Dysfunction. Int. J. Mol. Sci. 2017, 18, 1321. [Google Scholar] [CrossRef]
- Stolfi, C.; Maresca, C.; Monteleone, G.; Laudisi, F. Implication of Intestinal Barrier Dysfunction in Gut Dysbiosis and Diseases. Biomedicines 2022, 10, 289. [Google Scholar] [CrossRef]
- Ueda, Y.; Tsuboi, M.; Ota, Y.; Makita, M.; Aoshima, T.; Nakajima, M.; Narama, I. Gastric mucosal changes induced by polyethylene glycol 400 administered by gavage in rats. J. Toxicol. Sci. 2011, 36, 811–815. [Google Scholar] [CrossRef][Green Version]
- Donovan, M.D.; Flynn, G.L.; Amidon, G.L. Absorption of polyethylene glycols 600 through 2000: The molecular weight dependence of gastrointestinal and nasal absorption. Pharm. Res. 1990, 7, 863–868. [Google Scholar] [CrossRef]
- Videla, S.; Lugea, A.; Vilaseca, J.; Guarner, F.; Treserra, F.; Salas, A.; Crespo, E.; Medina, C.; Malagelada, J.R. Polyethylene glycol enhances colonic barrier function and ameliorates experimental colitis in rats. Int. J. Colorectal Dis. 2007, 22, 571–580. [Google Scholar] [CrossRef]
- Nalawade, T.M.; Bhat, K.; Sogi, S.H. Bactericidal activity of propylene glycol, glycerine, polyethylene glycol 400, and polyethylene glycol 1000 against selected microorganisms. J. Int. Soc. Prev. Community Dent. 2015, 5, 114–119. [Google Scholar] [CrossRef]
- Pabst, O.; Slack, E. IgA and the intestinal microbiota: The importance of being specific. Mucosal Immunol. 2020, 13, 12–21. [Google Scholar] [CrossRef]
- Masahata, K.; Umemoto, E.; Kayama, H.; Kotani, M.; Nakamura, S.; Kurakawa, T.; Kikuta, J.; Gotoh, K.; Motooka, D.; Sato, S.; et al. Generation of colonic IgA-secreting cells in the caecal patch. Nat. Commun. 2014, 5, 3704. [Google Scholar] [CrossRef]
- Suzuki, K.; Kawamoto, S.; Maruya, M.; Fagarasan, S. GALT: Organization and dynamics leading to IgA synthesis. Adv. Immunol. 2010, 107, 153–185. [Google Scholar]
- Dzharullaeva, A.S.; Tukhvatulin, A.I.; Erokhova, A.S.; Bandelyuk, A.S.; Polyakov, N.B.; Solovyev, A.I.; Nikitenko, N.A.; Shcheblyakov, D.V.; Naroditsky, B.S.; Logunov, D.Y.; et al. Stimulation of Dectin-1 and Dectin-2 during Parenteral Immunization, but Not Mincle, Induces Secretory IgA in Intestinal Mucosa. J. Immunol. Res. 2018, 2018, 3835720. [Google Scholar] [CrossRef]
- Derrien, M.; Vaughan, E.E.; Plugge, C.M.; de Vos, W.M. Akkermansia muciniphila gen. nov. sp. nov. a human intestinal mucin-degrading bacterium. Int. J. Syst. Evol. Microbiol. 2004, 54, 1469–1476. [Google Scholar] [CrossRef]
- Taira, T.; Yamaguchi, S.; Takahashi, A.; Okazaki, Y.; Yamaguchi, A.; Sakaguchi, H.; Chiji, H. Dietary polyphenols increase fecal mucin and immunoglobulin A and ameliorate the disturbance in gut microbiota caused by a high fat diet. J. Clin. Biochem. Nutr. 2015, 57, 212–216. [Google Scholar] [CrossRef]
- Rahman, M.S.; Hasan, M.S.; Nitai, A.S.; Nam, S.; Karmakar, A.K.; Ahsan, M.S.; Shiddiky, M.J.A.; Ahmed, M.B. Recent Developments of Carboxymethyl Cellulose. Polymers 2021, 13, 1345. [Google Scholar] [CrossRef]
- Holscher, H.D. Dietary fiber and prebiotics and the gastrointestinal microbiota. Gut Microbes 2017, 8, 172–184. [Google Scholar] [CrossRef]
- Kim, Y.; Hwang, S.W.; Kim, S.; Lee, Y.S.; Kim, T.Y.; Lee, S.H.; Kim, S.J.; Yoo, H.J.; Kim, E.N.; Kweon, M.N. Dietary cellulose prevents gut inflammation by modulating lipid metabolism and gut microbiota. Gut Microbes 2020, 11, 944–961. [Google Scholar] [CrossRef]


Disclaimer/Publisher’s Note: The statements, opinions and data contained in all publications are solely those of the individual author(s) and contributor(s) and not of MDPI and/or the editor(s). MDPI and/or the editor(s) disclaim responsibility for any injury to people or property resulting from any ideas, methods, instructions or products referred to in the content. |
© 2023 by the authors. Licensee MDPI, Basel, Switzerland. This article is an open access article distributed under the terms and conditions of the Creative Commons Attribution (CC BY) license (https://creativecommons.org/licenses/by/4.0/).
Share and Cite
Ishibashi, R.; Matsuhisa, R.; Nomoto, M.; Chudan, S.; Nishikawa, M.; Tabuchi, Y.; Ikushiro, S.; Nagai, Y.; Furusawa, Y. Effect of Oral Administration of Polyethylene Glycol 400 on Gut Microbiota Composition and Diet-Induced Obesity in Mice. Microorganisms 2023, 11, 1882. https://doi.org/10.3390/microorganisms11081882
Ishibashi R, Matsuhisa R, Nomoto M, Chudan S, Nishikawa M, Tabuchi Y, Ikushiro S, Nagai Y, Furusawa Y. Effect of Oral Administration of Polyethylene Glycol 400 on Gut Microbiota Composition and Diet-Induced Obesity in Mice. Microorganisms. 2023; 11(8):1882. https://doi.org/10.3390/microorganisms11081882
Chicago/Turabian StyleIshibashi, Riko, Rio Matsuhisa, Mio Nomoto, Seita Chudan, Miyu Nishikawa, Yoshiaki Tabuchi, Shinichi Ikushiro, Yoshinori Nagai, and Yukihiro Furusawa. 2023. "Effect of Oral Administration of Polyethylene Glycol 400 on Gut Microbiota Composition and Diet-Induced Obesity in Mice" Microorganisms 11, no. 8: 1882. https://doi.org/10.3390/microorganisms11081882
APA StyleIshibashi, R., Matsuhisa, R., Nomoto, M., Chudan, S., Nishikawa, M., Tabuchi, Y., Ikushiro, S., Nagai, Y., & Furusawa, Y. (2023). Effect of Oral Administration of Polyethylene Glycol 400 on Gut Microbiota Composition and Diet-Induced Obesity in Mice. Microorganisms, 11(8), 1882. https://doi.org/10.3390/microorganisms11081882