Article

Development of an Extraction Method to Detect Hepatitis A Virus, Hepatitis E Virus, and Noroviruses in Fish Products

by
Catherine Hennechart-Collette
,
Océane Dehan
,
Audrey Fraisse
,
Sandra Martin-Latil
and
Sylvie Perelle
*
Laboratory for Food Safety, Université Paris-Est, ANSES, 14 rue Pierre et Marie Curie, CEDEX, F-94701 Maisons-Alfort, France
*
Author to whom correspondence should be addressed.
Microorganisms 2023, 11(3), 624; https://doi.org/10.3390/microorganisms11030624
Submission received: 13 December 2022 / Revised: 16 February 2023 / Accepted: 24 February 2023 / Published: 28 February 2023
(This article belongs to the Special Issue Seafood-Borne Pathogens)

Abstract

:
Viruses are a leading cause of foodborne disease worldwide. Hepatitis viruses (hepatitis A (HAV) and hepatitis E (HEV)) and human norovirus are recognized as the main viruses of public health concern in food hygiene. ISO 15216 approved procedures are not validated for detection of HAV and human norovirus in foodstuffs, such as fishes, leading to an inability to ensure the safety of these products. This study aimed to provide a rapid and sensitive method for detecting these targets in fish products. An existing method that includes proteinase K treatment was selected for further validation using artificially contaminated fish products, according to the recent international standard ISO 16140-4. Recovery efficiencies in pure RNA extracts of viruses ranged from 0.2% to 66.2% for HAV, 4.0% to 100.0% for HEV, 2.2% to 100.0% for norovirus GI, and 0.2% to 12.5% for norovirus GII. LOD50 values were between 144 and 8.4 × 10⁴ genome copies/g for HAV and HEV, and 104 and 2.0 × 10³ copies/g for norovirus GI and norovirus GII, respectively. LOD95 values were between 3.2 × 10³ and 3.6 × 10⁵ genome copies/g for HAV and HEV, and between 8.8 × 10³ and 4.4 × 10⁴ genome copies/g for norovirus GI and norovirus GII, respectively. The method developed here was successfully validated in various fish products and can be applied for routine diagnostic needs.

1. Introduction

Enteric viruses, such as hepatitis viruses (hepatitis A (HAV) and hepatitis E (HEV)) and human norovirus, in fish and shellfish are a health concern worldwide. A significant number of foodborne illnesses have been reported after ingestion of raw shellfish and fish products [1,2,3]. Virus contamination occurs via consumption of contaminated food, direct person-to-person contact, contact with contaminated environmental surfaces [4,5], and for hepatitis E virus, via direct contact with infected animals [6,7,8]. Foodborne outbreak investigations have also revealed that food contamination mainly occurs in restaurants and in catering services [3,9,10,11,12,13].
Bivalves mollusks such as oysters are known to bioaccumulate pathogens that are the major etiological agents of gastroenteritis and have been involved in foodborne disease outbreaks [2]. In France, in addition to high-risk food categories such as bivalve mollusks, fishes are responsible for 8% of foodborne illnesses and about 4% of foodborne disease outbreaks due to viral agents [3]. In the United States, norovirus was implicated in 4% of seafood-associated infections between 1998 and 2015 [1].
Prevalence studies have shown that canned and processed seafood samples, such as fish fillets, and fresh or frozen fish have tested positive for norovirus in Italy [14] and in semi-processed fishery products in Belgium [15]. Noroviruses were detected in fresh and lightly cooked fishes collected during food handler-associated foodborne outbreaks in Tokyo, Japan [16]. A frozen tuna sample and tuna salad served in sandwiches have tested positive for hepatitis A (https://www.fda.gov/safety/recalls-market-withdrawals-safety-alerts/fda-investigates-findings-hepatitis-linked-frozen-tuna-fda-announcement#recall-announcement (accessed on 9 February 2018)) [17].
ISO 15216 procedures [18,19] propose molecular methods for detecting HAV and norovirus in high-risk food categories, such as bivalves mollusks, soft fruit, leaf, stem and bulb vegetables, bottled water, and on food surfaces. These methods are not validated for the detection of the targeted viruses in other foodstuffs, such as fishes, nor for the detection of other viruses, such as HEV in foodstuffs, leading to an inability to ensure the safety of these products.
To monitor the efficiency of a virus extraction procedure and to validate analyses, the ISO 15216 method advises the use of a process control virus and external amplification controls (EACs) as external control RNA to assess the inhibition of PCR amplification [18,19]. The process control used should exhibit similar morphological and physiochemical properties and environmental persistence to the target viruses, thus providing comparable extraction efficiency. The murine norovirus (MNV-1) has already been used successfully as a process control for HAV, HEV, and norovirus detection in shellfish, composite foodstuffs, dairy products or meat [20,21,22,23], and as a surrogate of enteric viruses [24].
The ISO 16140 procedure establishes the general principle as well as the technical protocol for the validation of alternative methods in the field of microbiological analysis of food. The recent international standard ISO 16140-4:2018 (microbiology of the food chain, method validation, part 4: protocol for single-laboratory method validation) [25] describes experimental designs to take into account the effect of various factors and their interactions, and reflects the variation within a single laboratory under routine conditions.
The aim of this study was (i) to select a method for the detection of MNV-1, used as a surrogate virus in artificially contaminated fish products; and (ii) to validate the selected method for detecting HAV, HEV, and norovirus in different fish samples according to the experimental guidelines of the ISO 15216 procedure and the recent international standard ISO 16140-4 to ensure the safety of these products.

2. Materials and Methods

2.1. Viruses

HAV, HEV, norovirus, and MNV-1 stocks were obtained and titrated as described previously [26]. The genomic titers of viruses were determined using an RT-qPCR standard curve obtained with the 10-fold diluted in vitro HAV, HEV, norovirus GI, norovirus GII, and MNV-1 RNA transcripts. The in vitro RNA transcripts were quantified by measuring absorbance at 260/280 nm with a NanoDrop™. Virus titers were 2.90 × 10⁹ genome copies/mL for HAV, 1.00 × 10⁷ genome copies/mL for HEV, 1.60 × 10⁷ for norovirus GI, 1.30 × 10⁷ genome copies/mL for norovirus GII, and 8.90 × 10¹¹ genome copies/mL for MNV-1, respectively.

2.2. Artificial Contamination of Fish Products

All samples were purchased from a local market. The selection of samples described in Table 1 takes account of different food processing factors (freezing, vacuum packaging, or canning).
The experimental design from ISO 16140-4:2018 was applied (Table 2), and fish samples were artificially contaminated at four contamination levels for four viruses (HAV, HEV, norovirus GI, and norovirus GII) as described previously [26]. Concentration levels for viruses were achieved by using different dilution levels of the inoculum to obtain four rounded inoculation levels ranging from 2.9 × 10³ to 2.9 × 10⁶ genome copies for HAV, 103 to 106 genome copies for HEV, 1.6 × 10³ to 1.6 × 10⁶ for norovirus GI, and 1.3 × 10³ to 1.3 × 10⁶ for norovirus GII.
Each separate portion of sample was contaminated with one virus of the four viruses and was co-inoculated with 8.9 × 10⁸ genome copies of MNV-1 (process control virus), just before adding elution buffer. For each sample, one uninoculated food sample spiked with sterile water was used as a negative control during the entire sample processing and viral detection procedure.

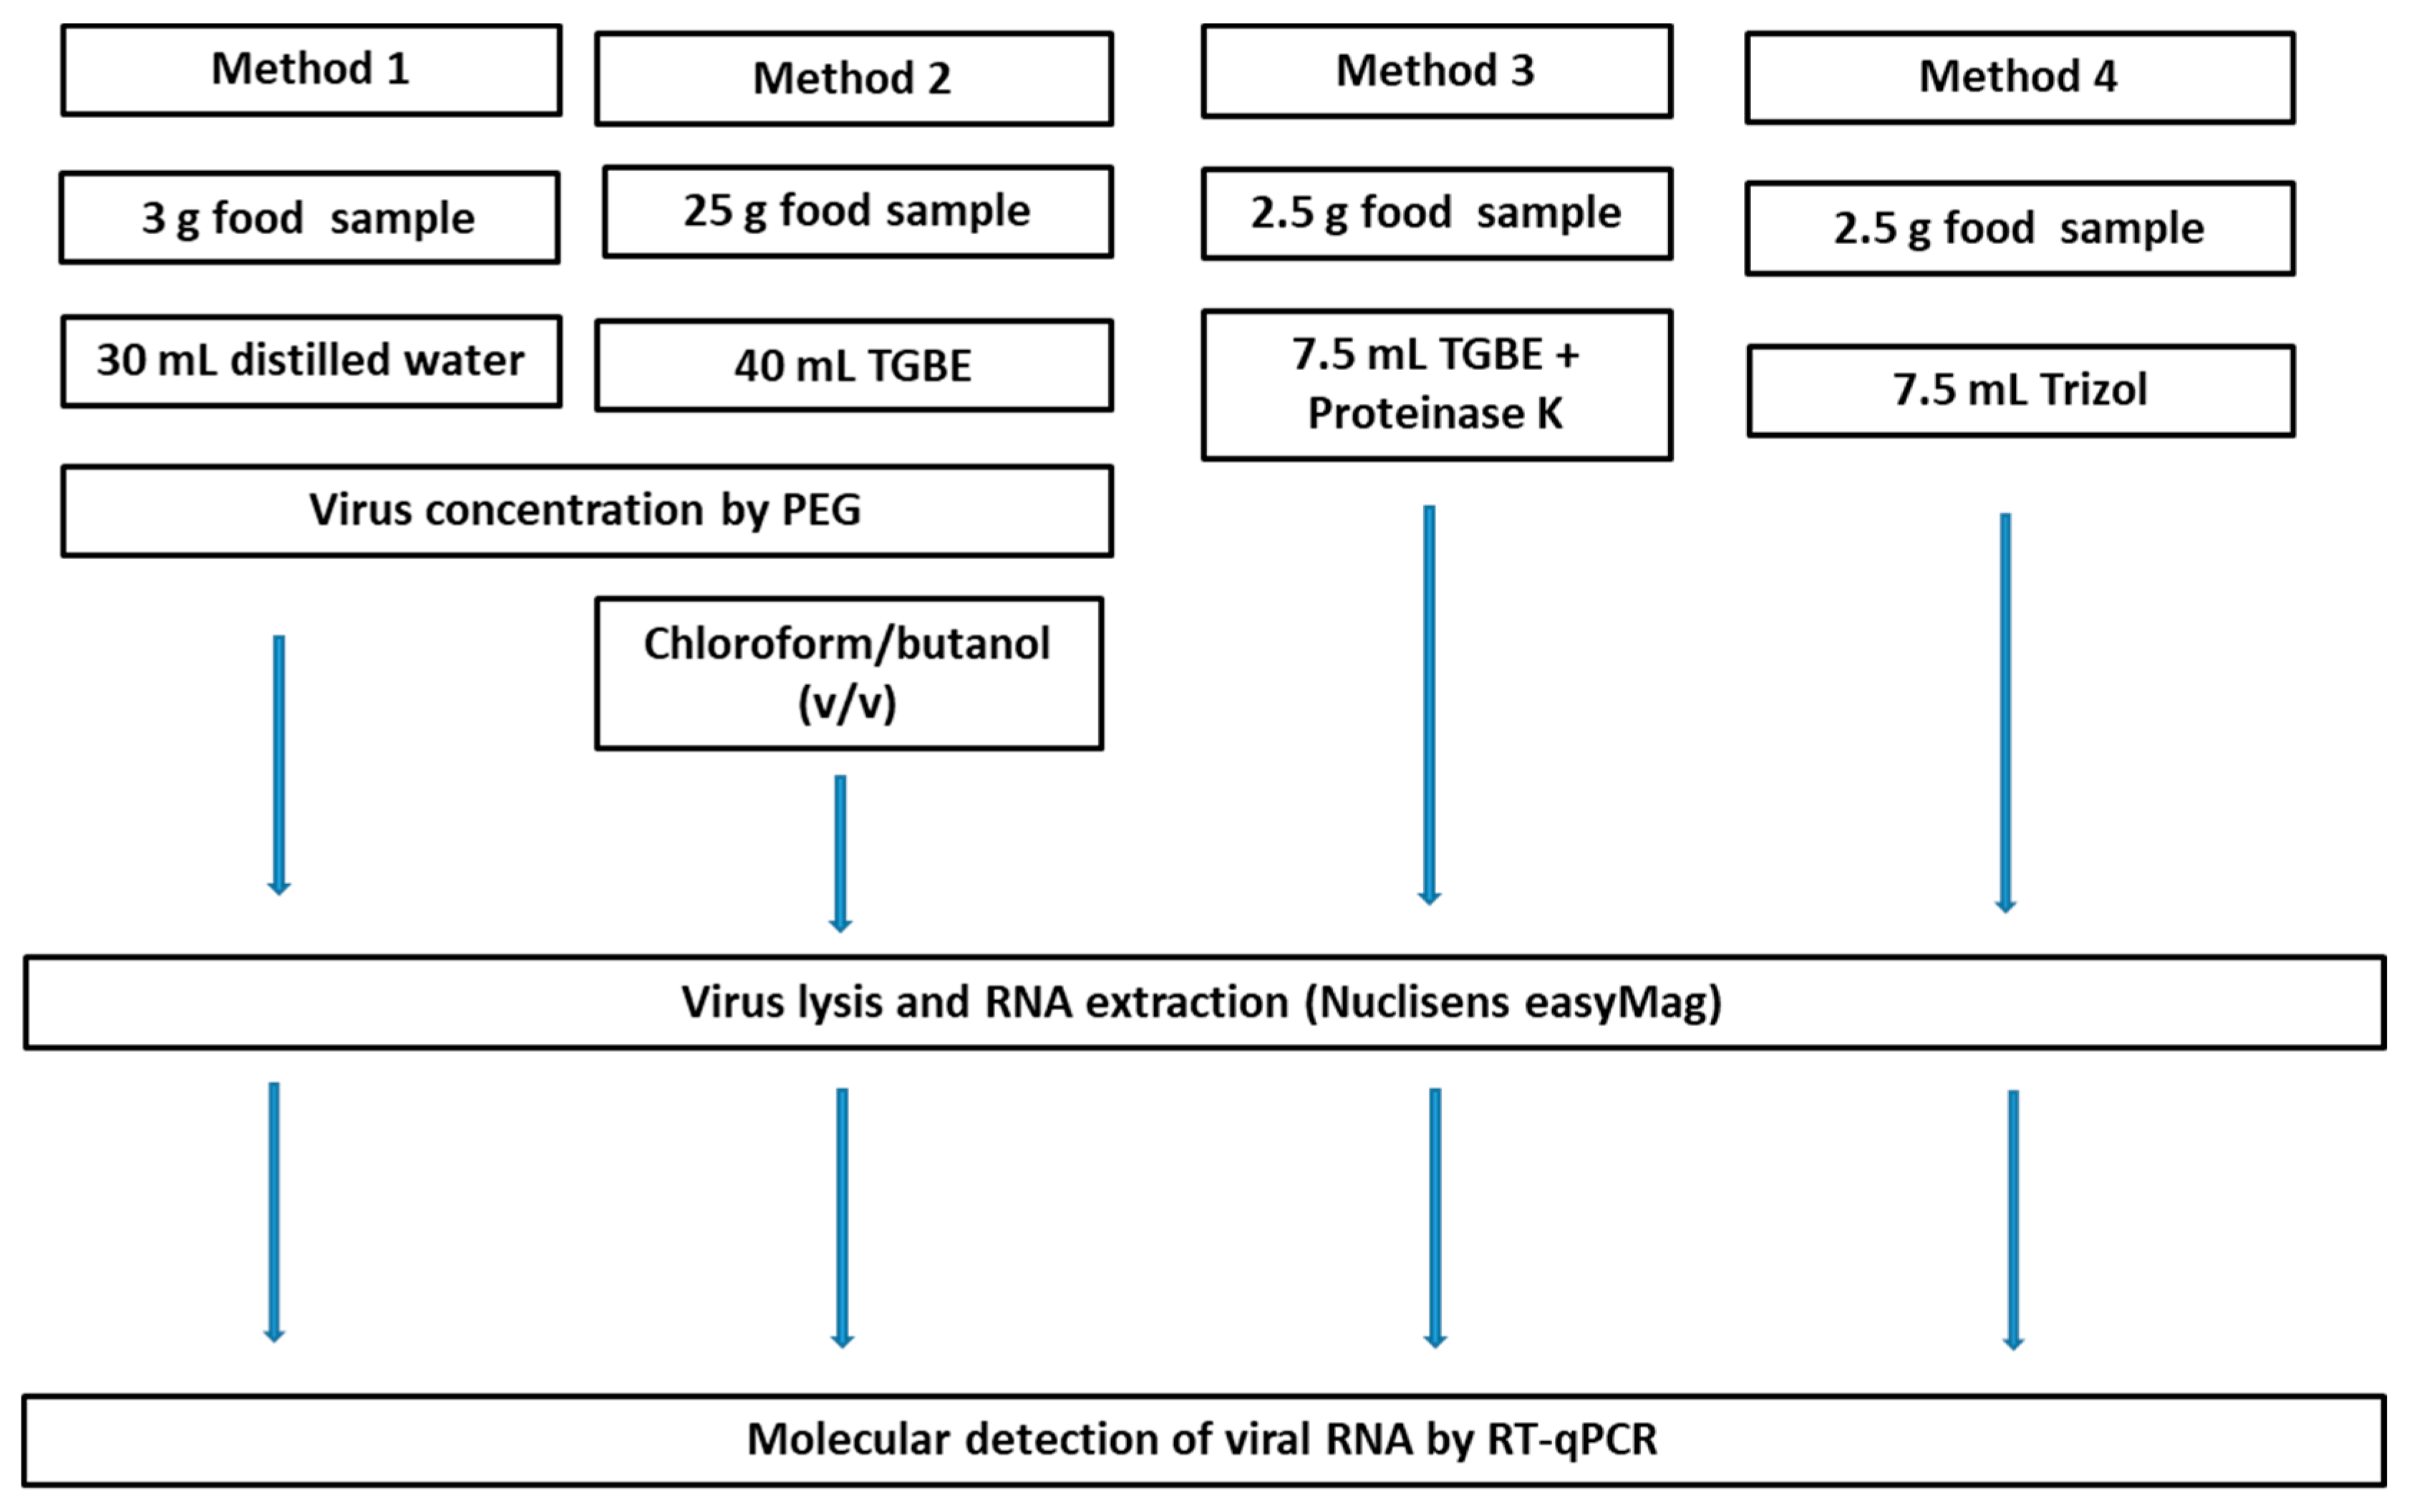
2.3. Sample Processing for Recovery of Viruses

Four methods for recovering viruses from raw salmon and smoked herring were evaluated and performed three times. Figure 1 gives an overview of these four methods, and the details of the extraction methods are described below.
Method 1 was performed as previously described by Martin-Latil et al. [27] for the detection of viruses in foodstuffs of animal origin. Method 2 was adapted from the elution-concentration method described in the ISO 15216 procedure [18,19] for the detection of HAV and norovirus on soft fruits. Method 3 is a method adapted from standard ISO 15216 [18,19] for the detection of viruses in shellfish, and was implemented as previously described by Hennechart-Collette et al. [28] for norovirus detection in milk products. Method 4 is based on the use of TRIzol reagent, which has already been described for detecting enteric viruses in the dressed vegetables [29].
The RNA extracts were analyzed in duplicate with the RT-qPCR assays as described below. Uninoculated food samples were used as negative controls.

2.4. Viral RNA Extraction and RT-qPCR Conditions

The viral RNA extraction, primers, and probe used as well as the one-step RT-qPCR amplifications assay have been described in [26].
A known amount of HAV, HEV, norovirus GI, or norovirus GII RNA transcript was used as an EAC to monitor RT-PCR inhibition in samples as described in [26,29,30].

2.5. Calculation and Interpretation of Results

HAV, HEV, norovirus GI, norovirus GII, and MNV-1 recovery rate percentages in spiked samples were calculated with reference to the corresponding standard curve.
For methods 1 and 2, the MNV-1 recovery rates in spiked samples were calculated with reference to the corresponding standard curve and the following formula: quantity of virus recovered after spiking experiments/quantity of viral inoculum × 100.
For methods 3 and 4, virus recovery rates in spiked samples were calculated with reference to the corresponding standard curve and the following formula: quantity of virus recovered after spiking experiments × (volume of elution buffer)/quantity of viral inoculum × 100.
The comparison of the results obtained for EAC added to an aliquot of sample RNA with the results of EAC in the absence of sample RNA (i.e., in water) provides the percentage of RT-qPCR inhibition in each tested sample, as described in ISO 15216 procedures. HAV, HEV, norovirus GI, and norovirus GII inhibition rates in extracted RNA were calculated using the following formula: 100 − (quantity of external control RNA detected in sample/quantity of external control RNA detected in ultrapure water × 100).

2.6. Statistical Analysis

Statistical analyses were performed using Statgraphics Centurion XVII version 17.1.04 software. Significance of results differences were determined with one-way analysis of variance (ANOVA, p value < 0.01) and a multiple comparison procedure (Fisher’s least-significant-differences (LSD)). The estimated probability of detection with 50% and 95% confidence (LOD50 and LOD95) was calculated by using the Wilrich POD LOD calculation software program (version 9, dated 23 September 2017) as in [26,30,31]. (www.wiwiss.fu-berlin.de/fachbereich/vwl/iso/ehemalige/wilrich/index.html (accessed on 23 September 2017)).

3. Results

3.1. Comparison of Four Methods to Recover MNV-1 from Artificially Contaminated Fish Products

To develop a method for detecting enteric viruses in fish products, four methods were evaluated on raw salmon and smoked herring artificially contaminated by MNV-1 (which was used as a process control virus). The mean extraction yields obtained for MNV-1 by RT-qPCR are reported in Table 3.
The MNV-1 mean extraction yields calculated with pure RNA extracts ranged from 8.37% to 55.85% for method 1, from 3.03% to 36.77% for method 2, from 26.48% to 82.22% for method 3, and from 86.17% to 97.02% for method 4.
Testing 10-fold diluted RNA extracts showed that extraction yields for MNV-1 in salmon improved by a factor of 1.34 using method 3, and in herring by a factor of 1.47 and 3.11 using methods 2 and 1, respectively. The dilution of RNA extracts did not enhance recovery rates of MNV-1 for salmon with methods 1, 2, and 4, nor for herring with methods 3 and 4.
To identify whether these four methods influenced the extraction yield of MNV-1, we compared the mean recovery rates of MNV-1 from artificially contaminated raw salmon and smoked herring samples. The method used did affect the extraction yield (one-way ANOVA; p = 0.000). A multiple comparison test showed that methods 3 and 4 had significantly higher extraction yields compared with methods 1 and 2.
For each of these two methods (methods 3 and 4), the statistical analyses were performed to determine whether the dilution of RNA extracts enhanced recovery rates of MNV-1. Results showed that the average extraction efficiencies with pure RNA extracts compared to diluted RNA extracts for methods 3 and 4 were similar (one-way ANOVA; p = 0.8217 for method 3 and p = 0.8670 for method 4).
On the whole, methods 3 and 4 showed the highest average extraction efficiencies and no relevant amplification inhibition. Method 3 was preferred as the volume of eluate taken for RNA extraction is 10 times greater compared to method 4 and has the advantage of not using TRIzol reagent.

3.2. Validation of the Selected Method for the Detection of HAV, HEV, and Norovirus in Samples

To characterize the selected method, the influence of experimental factors on the extraction yields of pathogenic viruses was assessed.

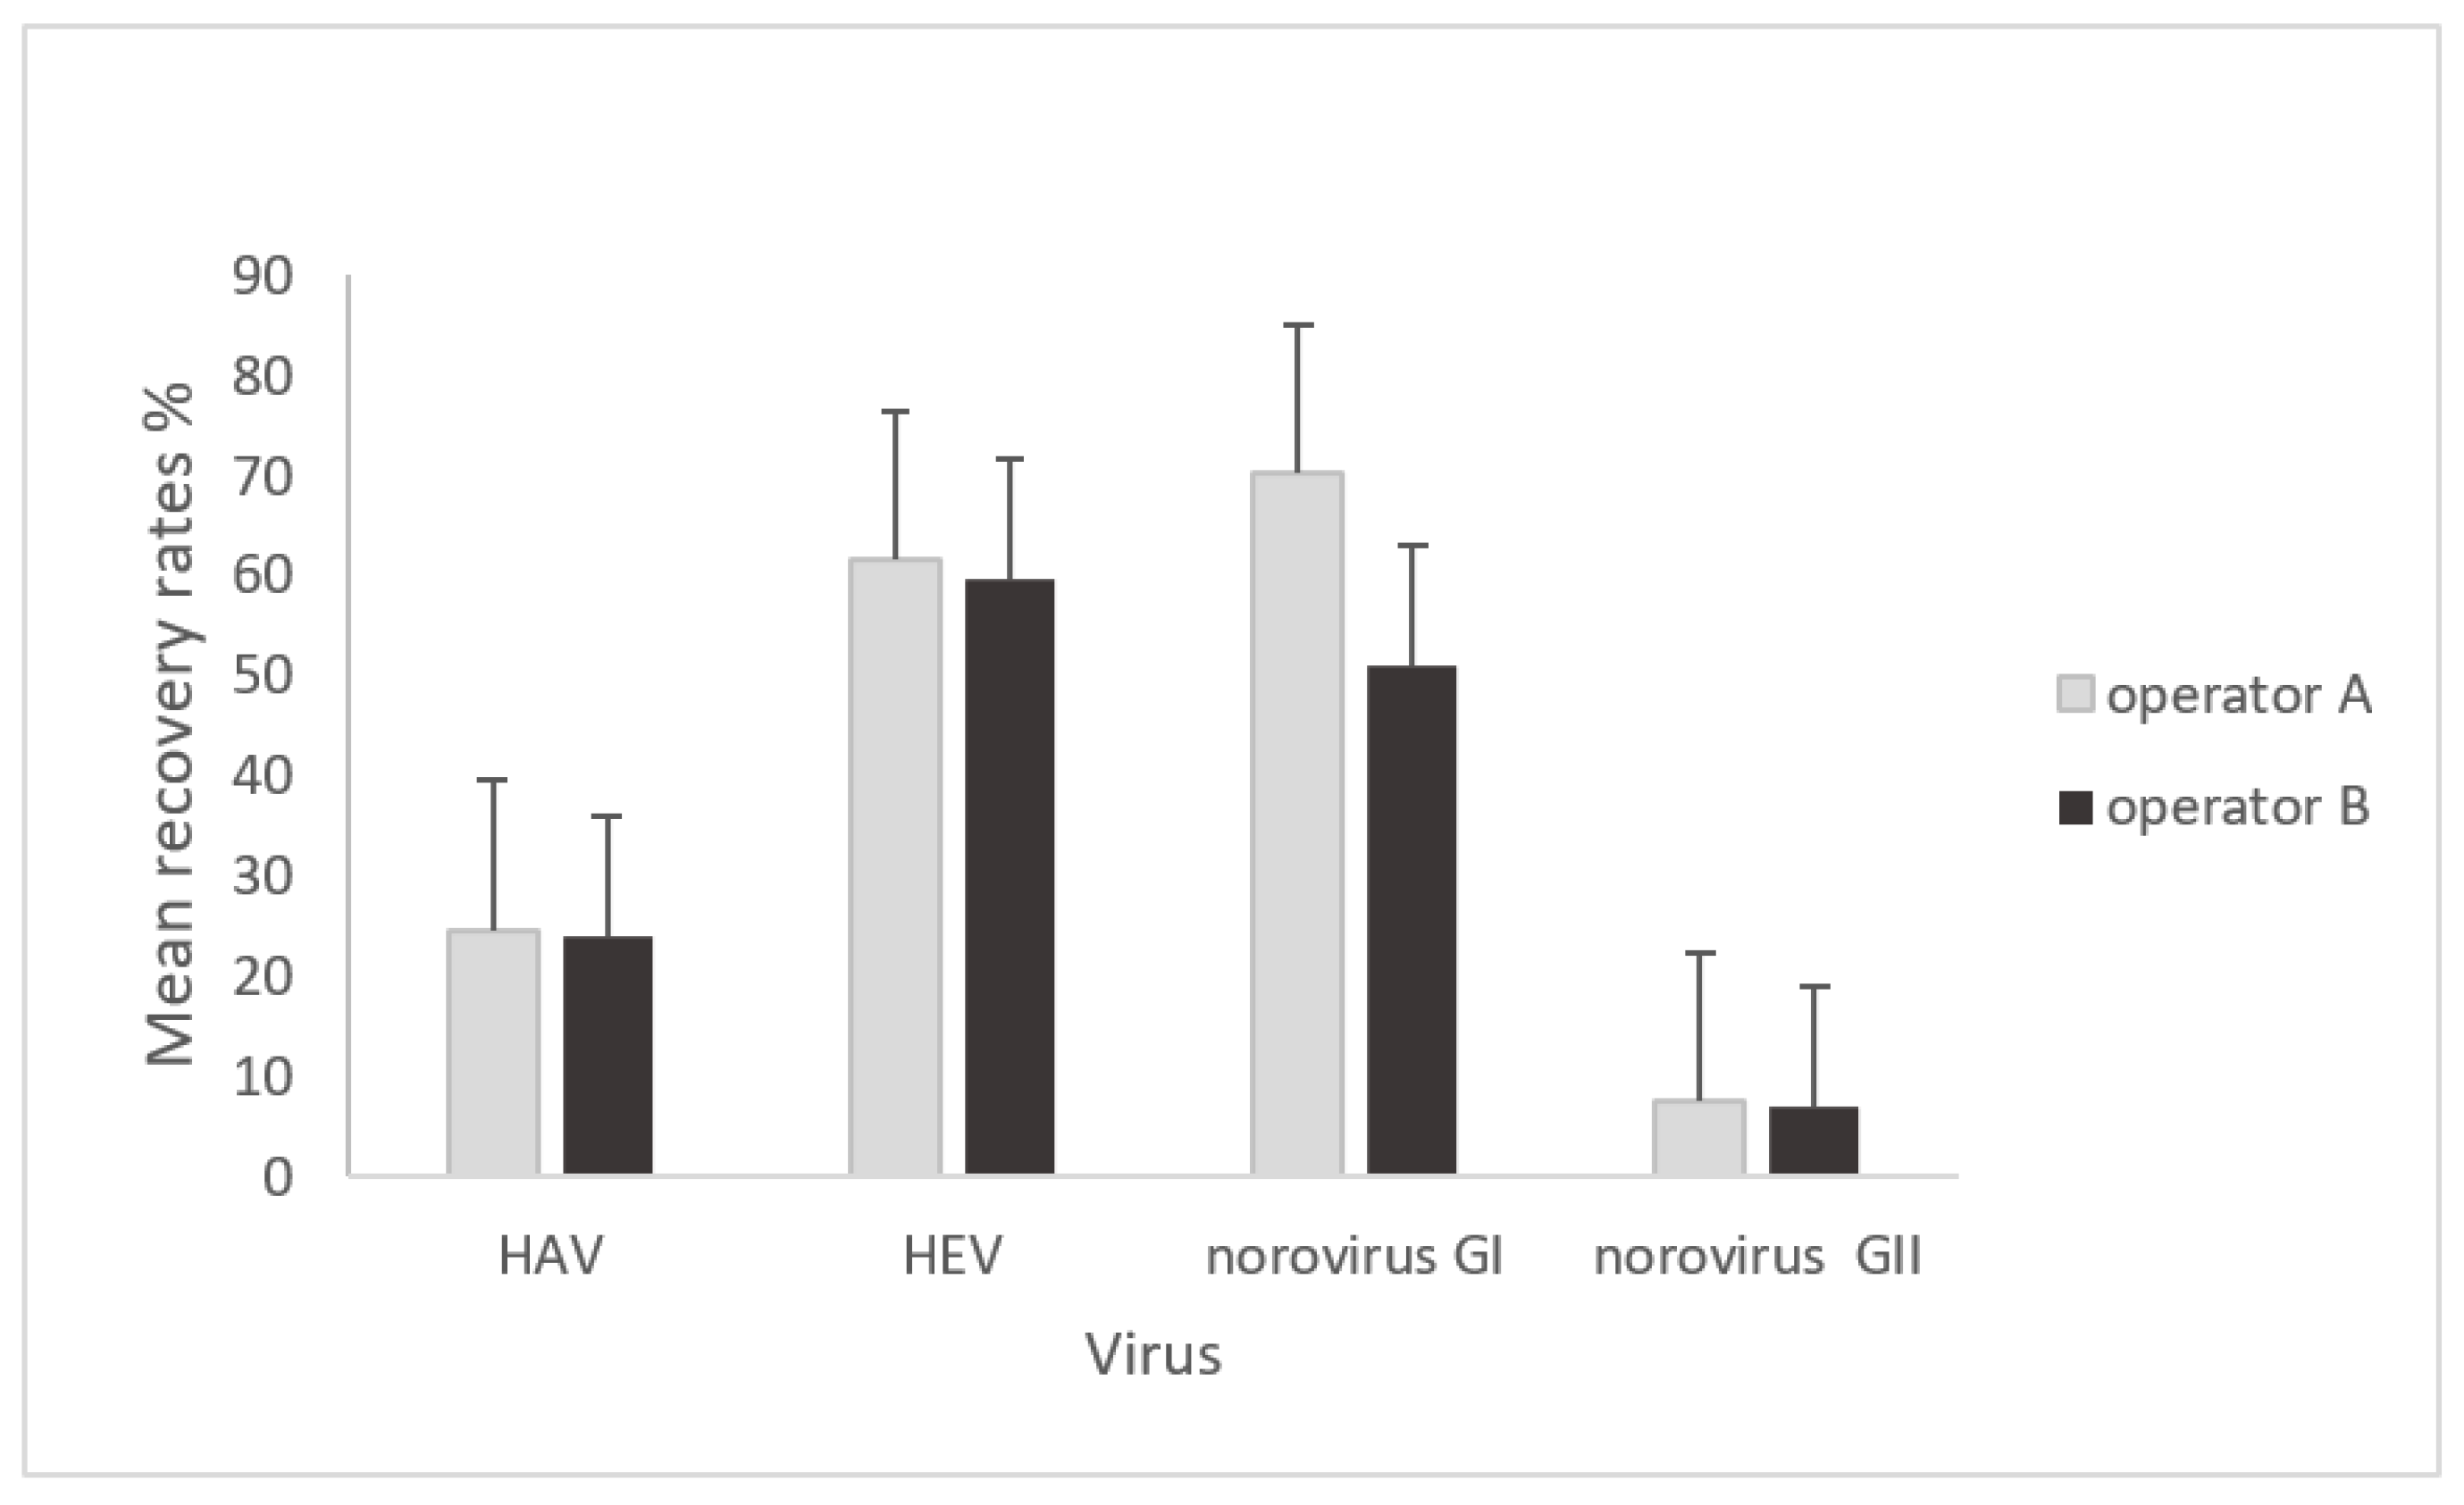
3.2.1. Mean Virus Recoveries of HAV, HEV, and Norovirus by Operator

The mean virus recoveries of HAV, HEV, norovirus, and MNV-1 obtained for all settings were compared for each operator (operator A and operator B), and statistical analyses were performed to identify whether the operator factor influenced the extraction recovery rates of viruses. Comparisons of mean recovery rates of HAV, HEV, norovirus GI, and norovirus GII according to the operator factor are reported in Figure 2.
For operator A, the means of recovery rates for all settings were 24.64%, 61.49%, 70.25%, and 7.67% for HAV, HEV, norovirus GI, and norovirus GII, respectively. For operator B, the means of recovery rates were 24.00%, 59.59%, 50.91%, and 6.95% for HAV, HEV, norovirus GI, and norovirus GII, respectively.
The statistical analysis revealed that the operator factor did not influence virus recoveries from fish meal (one-way ANOVA; p = 0.0826).
From now on, given this finding, the mean recoveries obtained for each virus are considered the mean recovery results obtained by the two operators (A and B).

3.2.2. MNV-1 Recovery Rates and Recovery Rates of the EAC

According to the ISO 15216 procedure, the process control should be higher than 1%, and rates of inhibition in RNA extracted from food samples should be lower than 75%.
MNV-1 was used as a process control to monitor the efficiency of the virus extraction method from fish products, and the data are presented in Table 4. MNV-1 was detected in 98% of RNA extracts analyzed (125 out of 128 extracts) and was recovered with an efficiency of between 14.76% (min) and 100% (max) for all allocated food settings and all targeted viruses. The process controls were less than 1% for the detection of HEV in the albacore tuna sample and for HAV detection in the tuna rillette samples.
Implementation of the EAC corresponding to each viral target was used to examine RT-qPCR inhibition. Table 5 shows the inhibition rates of the RT-qPCR reaction for each sample, which varied from 12.93% to 84.50%. Higher rates of inhibition were observed for the tuna rillette sample.

3.2.3. Viral Recovery Rates and Limits of Detection

The recovery rates obtained for HAV, HEV, norovirus GI, and norovirus GII according to the inoculum level and repeated experiments (R1 to R4) are presented in Table 4.
For all inoculum levels, the mean recovery rates with pure RNA extracts ranged from 0.18% to 66.19% for HAV, 4.04% to 100% for HEV, 2.18% to 100% for norovirus GI, and 0.17% to 12.49% for norovirus GII. As expected, for each sample, no viral RNA was detected in the uninoculated samples. The viral extraction yields from fish matrices were modified by a factor ranging from 0.1 to 8.9 by 10-fold dilution of RNA extracts (Table 4). Statistical analysis showed no differences between the average extraction efficiencies with pure RNA extracts and diluted RNA extracts (one-way ANOVA, p = 0.2296).
The limit of detection (LOD) of the method was calculated for each virus and for each setting with the 12 samples. The LOD was estimated with pure RNA extracts. The LOD50 and LOD95 for HAV, HEV, norovirus GI, and norovirus GII are shown in Table 6.
The LOD50 for all settings was 144 genome copies/g for HAV, between 7.20 × 10³ and 8.40 × 10⁴ genome copies/g for HEV, 1.00 × 10⁴ genome copies/g for norovirus GI, and 2.00 × 10³ genome copies/g for norovirus GII.
The LOD95 for all settings was 6.40 × 10³ genome copies/g for HAV, between 3.20 × 10³ and 3.60 × 10⁵ genome copies/g for HEV, and between 8.80 × 10³ and 4.40 × 10⁴ genome copies/g for norovirus GI and norovirus GII.

3.3. Influence of Experimental Factors on Extraction Yield of Viruses

The statistical analysis revealed that the viral recovery rates varied according to the inoculated virus (one-way ANOVA; p < 0.001). More specifically, the multiple comparison tests showed that the recovery rates of HAV and norovirus GII were lower than the recovery rates obtained for norovirus GI and HEV.
To determine whether the inoculation levels or the repeated experiments (R1 to R4) exhibited an impact on HAV, HEV, and norovirus recovery rates from food samples, statistical analyses were also performed according to the inoculation levels and repeated experiments used. Results of the one-way ANOVA showed that the recovery rates of viruses were not statistically different among the inoculation levels (one-way ANOVA; p = 0.5190 for HAV, p = 0.0712 for HEV, p = 0.1312 for norovirus GI, and p = 0.2955 for norovirus GII). However, the recovery rates of viruses were significantly different in the four repeated experiments (one-way ANOVA; p = 0.0002 for HAV, p < 0.001 for HEV, p = 0.0169 for norovirus GI, and p = 0.0015 for norovirus GII).

4. Discussion

Among the enteric viruses implicated in foodborne outbreaks, hepatitis viruses (HAV and HEV) and human norovirus represent a serious public health risk. A wide variety of foodstuffs has been implicated in viral outbreaks, including some high-risk foods such as shellfish. Water contaminated with fecal waste is the main transmission pathway of viruses in shellfish [32]. For fish immersed in contaminated water, it has been suggested that various organisms, such as viruses, penetrate into the organs and muscle [33] and could be responsible for virus transmission to humans. One study reported the presence of HEV RNA (genotype 3) in the sera and liver of bottlenose dolphins, which could result from environmental contamination of the dolphins’ food or from wastewater as a source of HEV exposure and infection [34].
Moreover, the most frequent route of virus transmission in foodborne outbreaks is secondary contamination via infected food handlers. Asymptomatic individuals shedding the virus play an important role in virus transmission, especially for raw and cooked products [13], and various fish products should be implicated in outbreak investigations. Fish types most often implicated in foodborne outbreaks were tuna [1], fish fillet, and raw salmon [16]. These high-risk matrices were selected in our study, with other foodstuffs that are consumed in a variety of forms and that are major components of almost all fish meal.
Few methods have been developed to recover viruses from fish products to date [14,35,36]. The general strategy for the detection of enteric viruses in food samples consists of three steps: virus extraction, purification of viral RNA, and molecular detection of the purified RNA. ISO 15216 offers validated methods for the detection and quantification of HAV and norovirus in seven food matrices, such as Pacific oysters (Crassostrea gigas) and common mussels (Mytilus edulis) [37]. However, to our knowledge, there are no data reporting the characterization of a method for detecting enteric viruses from fishes and fish meals.
The experimental design from ISO 16140-4 was applied in this study for characterization of the method used to detect viruses in fish products. Another study including fresh or frozen seafood should be performed to assess the developed method. Studying the influence of the operator and of virus inoculation levels on virus recoveries improves the evaluation of method performance applied to fish samples. Analyzing a high number of samples, and taking into account different food processing factors and different matrix conditions (fat or presence of inhibitors), provides information on the variability of virus recoveries under different measurement conditions. In our study, 12 different fish product samples were tested. The number of samples tested is very important to characterize the method and to provide information on the variability of the results under different matrix measurements and to assess method performance. In this study, four methods for recovering viruses from fish products were evaluated, and a method based on proteinase K (method 3) was selected for validation. Method 4 presented the highest extraction efficiency for both salmon and smoked herring samples, while method 3 showed a low extraction efficiency for the salmon sample. The volume of eluate taken for RNA extraction with method 3 is 10 times greater compared to method 4. For all of these reasons, a routine method without TRIzol reagent was preferred. Method 3 with proteinase K treatment was selected for the detection of viruses from fish samples, but the discrimination between infectious and non-infectious viruses detected could not be evaluated. Methods using intercalating agent propidium monoazide (PMAxx™) pre-treatment with molecular assay allowed for assessing differences between infectious and non-infectious particles [38,39]. However, a PMAxx™-RT-qPCR method developed to selectively detect infectious murine norovirus particles in mussels showed that the approach is not sustainable with proteinase K treatment [39]. The proteinase K treatment coupled with heat treatment may damage the viral capsid [40,41,42].
The methods based on PEG precipitation (methods 1 and 2) showed mean recovery rates of MNV-1 ranging from 3.03% to 55.85% for pure RNA extracts. These data are consistent with those reported for PEG-based methods. MNV-1 recovered from figatelli and sausages ranged from 1.2% to 15.8% [27] and from 3.83% to 50.22% for multicomponent foods [26]. The proteinase K method selected had already been validated for virus detection in milk products [28,43]. The mean recovery of MNV-1 from milk products was between 51% and 81%, and between 5% and 100% for norovirus. Noroviruses and mengovirus were recovered at 3% and 1%, respectively, in shellfishes with a method based on proteinase K treatment [40,44]. This method is suitable for fish and milk products because they are both high-protein foods.
The LOD95 values of the proteinase K method used to detect viruses from fish products were between 103 and 105 genome copies/g for HAV and HEV, and between 103 and 104 genome copies/g for norovirus GI and norovirus GII. These LOD values are higher than those obtained for oyster, lettuce, or raspberries [37,45]. However, the LOD values for norovirus GI and norovirus GII in milk products were 105 genome copies and 103 genome copies/g, respectively [28], and are consistent with our results.
In this study, the viral recovery rates varied depending on the inoculated virus and in the four repeated experiments. The origin of the inoculum, the quality of the fecal samples used, and the viral genotype may be important in explaining our virus recovery rates. Our result could also be explained by the study’s experimental design with the use of different fish food samples with different inoculation levels. The fish matrices might explain to some extent the differences in results between repeats.
Use of various controls, such as the virus process control (MNV-1) and the EAC, which are described in the ISO 15216 procedure, was necessary to validate the results. MNV-1 was detected in 98% of RNA extracts and was successfully tested as a process control virus for detecting HAV, HEV, and norovirus in fish products. According to the recommendations of ISO 15216, the rates of RT-qPCR inhibition calculated with RNA extracted from food samples should be lower than 75%. In our study, RT-qPCR inhibition was higher than 75% with only one fish sample (tuna rillette). It is well known that the range of inhibition is the result of the different composition of food products, which can affect virus extraction [46,47,48,49,50].
To conclude, the method described herein can be used in addition to the method described in ISO 15216 for the detection of viruses in food matrices and can be applied for the detection of enteric viruses in fish products for routine diagnostic needs.

Author Contributions

Methodology, O.D.; Writing—original draft, C.H.-C.; Writing—review & editing, A.F. and S.P.; Supervision, S.M.-L. All authors have read and agreed to the published version of the manuscript.

Funding

This research received no external funding.

Institutional Review Board Statement

Not applicable.

Informed Consent Statement

Not applicable.

Data Availability Statement

The datasets generated during the current study are available from the corresponding author on reasonable request.

Acknowledgments

We would like to thank P. Pothier and A. de Rougemont (French National Reference Center for Gastroenteritis Viruses, Dijon, France) for providing contaminated stool samples. We are also grateful to N. Pavio (ANSES, Animal Health Laboratory, Unité Mixte de Recherche (UMR) 1161 Virology, Institut National de la Recherche Agronomique (INRA), École Nationale Vétérinaire d’Alfort (ENVA), Maisons-Alfort, France) for providing HEV-contaminated pig feces.

Conflicts of Interest

The authors declare no conflict of interest.

References

  1. Barrett, K.A.; Nakao, J.H.; Taylor, E.V.; Eggers, C.; Gould, L.H. Fish-Associated Foodborne Disease Outbreak: United States, 1998–2015. Foodborne Pathog. Dis. 2017, 14, 537–543. [Google Scholar] [CrossRef]
  2. EFSA, European Food Safety Authority; European Centre for Disease Prevention and Control. The European union one health 2019 Zoonoses Report. EFSA J. 2021, 27, 19. [Google Scholar]
  3. Santé Publique France, Surveillance des Toxi-Infections Alimentaires Collectives. Données de la Déclaration Obligatoire. 2020. Available online: https://www.santepubliquefrance.fr/maladies-et-traumatismes/maladies-infectieuses-d-origine-alimentaire/toxi-infections-alimentaires-collectives/documents/bulletin-national/surveillance-des-toxi-infections-alimentaires-collectives.-donnees-de-la-declaration-obligatoire-2020 (accessed on 21 December 2021).
  4. Kotwal, G.; Cannon, J.L. Environmental persistence and transfer of enteric viruses. Curr. Opin. Virol. 2014, 4, 37–43. [Google Scholar] [CrossRef]
  5. Matthews, J.E.; Dickey, B.W.; Miller, R.D.; Felzer, J.R.; Dawson, B.P.; Lee, A.S.; Rocks, J.J.; Kiel, J.; Montes, J.S.; Moe, C.L. The epidemiology of published norovirus outbreaks: A review of risk factors associated with attack rate and genogroup. Epidemiol. Infect. 2012, 140, 1161–1172. [Google Scholar] [CrossRef] [Green Version]
  6. Dalton, H.R.; Hunter, J.G.; Bendall, R.P. Hepatitis E. Curr. Opin. Infect. Dis. 2013, 26, 471–478. [Google Scholar] [CrossRef]
  7. Meng, X.J. Hepatitis E virus: Animal reservoirs and zoonotic risk. Vet. Microbiol. 2010, 140, 256–265. [Google Scholar] [CrossRef] [PubMed] [Green Version]
  8. Pavio, N.; Meng, X.J.; Doceul, V. Zoonotic origin of hepatitis E. Curr. Opin. Virol. 2015, 10, 34–41. [Google Scholar] [CrossRef]
  9. Baert, L.; Uyttendaele, M.; Debevere, J. Evaluation of viral extraction methods on a broad range of ready-to-eat foods with conventional and real-time RT-PCR for Norovirus GII detection. Int. J. Food Microbiol. 2008, 123, 101–108. [Google Scholar] [CrossRef] [PubMed]
  10. Barrabeig, I.; Rovira, A.; Buesa, J.; Bartolome, R.; Pinto, R.; Prellezo, H.; Dominguez, A. Foodborne norovirus outbreak: The role of an asymptomatic food handler. BMC Infect. Dis. 2010, 10, 269. [Google Scholar] [CrossRef] [PubMed] [Green Version]
  11. Franck, K.T.; Lisby, M.; Fonager, J.; Schultz, A.C.; Bottiger, B.; Villif, A.; Absalonsen, H.; Ethelberg, S. Sources of Calicivirus contamination in foodborne outbreaks in Denmark, 2005-2011-the role of the asymptomatic food handler. J. Infect. Dis. 2015, 211, 563–570. [Google Scholar] [CrossRef] [Green Version]
  12. Rönnqvist, M.; Aho, E.; Mikkela, A.; Ranta, J.; Tuominen, P.; Ratto, M.; Maunula, L. Norovirus transmission between hands, gloves, utensils, and fresh produce during simulated food handling. Appl. Environ. Microbiol. 2014, 80, 5403–5410. [Google Scholar] [CrossRef] [PubMed] [Green Version]
  13. Stals, A.; Uyttendaele, M.; Baert, L.; Van Coillie, E. Norovirus transfer between foods and food contact materials. J. Food Prot. 2013, 76, 1202–1209. [Google Scholar] [CrossRef] [PubMed] [Green Version]
  14. Pavoni, E.; Consoli, M.; Suffredini, E.; Arcangeli, G.; Serracca, L.; Battistini, R.; Rossini, I.; Croci, L.; Losio, M.N. Norovirus in seefood: A 9-year monitoring in Italy. Foodborne Pathog. Dis. 2013, 10, 533–539. [Google Scholar] [CrossRef] [PubMed]
  15. Li, D.; Stals, A.; Tang, Q.J.; Uyttendaele, M. Detection of noroviruses in shellfish and semiprocessed fishery products from a Belgian seafood company. J. Food Prot. 2014, 77, 1342–1347. [Google Scholar] [CrossRef] [PubMed]
  16. Somura, Y.; Nagano, M.; Kimoto, K.; Oda, M.; Mori, K.; Shinkai, T.; Sadamasu, K. Detection of norovirus in food samples collected during suspected food-handler-involved foodborne outbreaks in Tokyo. Lett. Appl. Microbiol. 2019, 69, 175–180. [Google Scholar] [CrossRef] [PubMed]
  17. Istre, G.R.; Hopkins, R.S. An outbreak of foodborne hepatitis A showing a relationship between dose and incubation period. Am. J. Public Health 1985, 75, 280–281. [Google Scholar] [CrossRef] [PubMed] [Green Version]
  18. EN ISO 15216-1:2017; Microbiology of the Food Chain–Horizontal Method for Determination of Hepatitis A Virus and Norovirus Using Real-Time RT-PCR—Part1: Method for Quantification. International Organization for Standardization: Geneva, Switzerland, 2017.
  19. EN ISO 15216-2:2019; Microbiology of the Food Chain-Horizontal Method for Determination of Hepatitis A Virus and Norovirus Using Real-Time RT-PCR—Part2: Method for Detection. International Organization for Standardization: Geneva, Switzerland, 2019.
  20. Hennechart-Collette, C.; Martin-Latil, S.; Guillier, L.; Perelle, S. Determination of which virus to use as a process control when testing for the presence of hepatitis A virus and norovirus in food and water. Int. J. Food Microbiol. 2015, 202, 57–65. [Google Scholar] [CrossRef] [PubMed]
  21. Hennechart-Collette, C.; Martin-Latil, S.; Guillier, L.; Perelle, S. Multiplex real-time RT-qPCR for the detection of Norovirus in bottled and tap water using murine norovirus as a process control. J. Appl. Microbiol. 2014, 116, 179–190. [Google Scholar] [CrossRef] [PubMed]
  22. Kingsley, D.H. An RNA extraction protocol for shellfish-borne viruses. J. Virol. Methods 2007, 141, 58–62. [Google Scholar] [CrossRef]
  23. Martin-Latil, S.; Hennechart-Collette, C.; Guillier, L.; Perelle, S. Duplex RT-qPCR for the detection of hepatitis E virus in water, using a process control. Int. J. Food Microbiol. 2012, 157, 167–173. [Google Scholar] [CrossRef]
  24. Wobus, C.E.; Thackray, L.B.; Virgin, H.W. Murine norovirus: A model system to study norovirus biology and pathogenesis. J. Virol. 2006, 80, 5104–5112. [Google Scholar] [CrossRef] [Green Version]
  25. PR ISO/DIS 16140-4: 2018-01; Microbiology of the Food Chain-Method Validation-Part 4: Protocol for Single-Laboratory (In-House) Method Validation. International Organization for Standardization: Geneva, Switzerland, 2018.
  26. Hennechart-Collette, C.; Dehan, O.; Laurentie, M.; Fraisse, A.; Martin-Latil, S.; Perelle, S. Detection of norovirus, hepatitis A and hepatitis E viruses in multicomponent foodstuffs. Int. J. Food Microbiol. 2021, 337, 108931. [Google Scholar] [CrossRef] [PubMed]
  27. Martin-Latil, S.; Hennechart-Collette, C.; Guillier, L.; Perelle, S. Method for HEV detection in raw pig liver products and its implementation for naturally contaminated food. Int. J. Food Microbiol. 2014, 176, 1–8. [Google Scholar] [CrossRef] [PubMed]
  28. Hennechart-Collette, C.; Martin-Latil, S.; Fraisse, A.; Perelle, S. Comparison of three extraction methods to detect noroviruses in dairy products. Food Microbiol. 2017, 61, 113. [Google Scholar] [CrossRef] [PubMed]
  29. Hennechart-Collette, C.; Niveau, F.; Martin-Latil, S.; Fraisse, A.; Perelle, S. Development of an extraction method to detect enteric viruses in dressed vegetables. Int. J. Food Microbiol. 2019, 311, 108349. [Google Scholar] [CrossRef]
  30. Hennechart-Collette, C.; Dehan, O.; Laurentie, M.; Fraisse, A.; Martin-Latil, S.; Perelle, S. Method for detecting norovirus, hepatitis A and hepatitis E viruses in tap and bottled drinking water. Int. J. Food Microbiol. 2022, 377, 109757. [Google Scholar] [CrossRef]
  31. Wilrich, C.; Wilrich, P.T. Estimation of the POD function and the LOD of a qualitative microbiological measurement method. J. AOAC Int. 2009, 92, 1763–1772. [Google Scholar] [CrossRef] [Green Version]
  32. Murchie, L.W.; Cruz-Romero, M.; Kerry, J.P.; Linton, M.; Patterson, M.F.; Smiddy, M.; Kelly, A.L. High pressure processing of shellfish: A review of microbiological and other quality aspects. Food Sci. Emerg. Technol. 2005, 6, 257–270. [Google Scholar] [CrossRef]
  33. Buras, N.; Duek, L.; Niv, S. Reactions of fish to microorganisms in wastewater. Appl. Environ. Microbiol. 1985, 50, 989–995. [Google Scholar] [CrossRef] [Green Version]
  34. Montalvo Villalba, M.C.; Cruz Martínez, D.; Ahmad, I.; Rodriguez Lay, L.A.; Bello Corredor, M.; Guevara March, C.; Martínez, L.S.; Martínez-Campo, L.S.; Jameel, S. Hepatitis E virus in bottlenose dolphins Tursiops truncatus. Dis. Aquat. Organ. 2017, 123, 13–18. [Google Scholar] [CrossRef] [Green Version]
  35. Anbazhagi, S.; Kamatchiammal, S. Contamination of seefood by norovirus in India. Int. J. Virol. 2010, 6, 138–149. [Google Scholar] [CrossRef]
  36. Lekshmi, M.; Das, O.; Kumar, S.; Nayak, B.B. Occurrence of human enterovirus in tropical fish and shellfish and their relationship with fecal indicator bacteria. Vet. World 2018, 11, 1285–1290. [Google Scholar] [CrossRef] [PubMed]
  37. Lowther, J.A.; Bosch, A.; Butot, S.; Ollivier, J.; Mäde, D.; Rutjes, S.A.; Hardouin, G.; Lombard, B.; in’t Veld, P.; Leclercq, A. Validation of ISO 15216 part 1—Quantification of hepatitis A virus and norovirus in food martrices. Int. J. Food Microbiol. 2017, 288, 82–90. [Google Scholar] [CrossRef] [PubMed]
  38. Fraisse, A.; Niveau, F.; Hennechart-Collette, C.; Coudray-Meunier, C.; Martin-Latil, S.; Perelle, S. Discrimination of infectious and heat-treated norovirus by combining platinum compounds and real-time RT-PCR. Int. J. Food Microbiol. 2018, 269, 64–74. [Google Scholar] [CrossRef] [PubMed]
  39. Razafimahefa, R.M.; Ludwig-Begall, L.F.; Le Guyader, F.S.; Farnir, F.; Mauroy, A.; Thiry, E. Optimisation of a PMAxx™-RT-qPCR assay and the preceding extraction method to selectively detect infectious murine norovirus particles in mussels. Food Environ. Virol. 2021, 13, 93–106. [Google Scholar] [CrossRef] [PubMed]
  40. Comelli, H.L.; Rimstad, E.; Larsen, S.; Myrmel, M. Detection of norovirus genotype I.3b and II.4 in bioaccumulated blue mussels using different virus recovery methods. Int. J. Food Microbiol. 2008, 127, 53–59. [Google Scholar] [CrossRef] [PubMed]
  41. Langlet, J.; Kaas, L.; Croucher, D.; Hewitt, J. Effect of the Shellfish Proteinase K Digestion Method on Norovirus Capsid Integrity. Food Environ. Virol. 2018, 10, 151–158. [Google Scholar] [CrossRef]
  42. Nuanualsuwan, S.; Cliver, D.O. Pretreatment to avoid positive RT-PCR results with inactivated viruses. J. Virol. Methods 2002, 104, 217–225. [Google Scholar] [CrossRef]
  43. Hennechart-Collette, C.; Gonzalez, G.; Fourniol, L.; Fraisse, A.; Beck, C.; Moutailler, S.; Bournez, L.; Dheilly, N.M.; Lacour, S.A.; Lecollinet, S.; et al. Method for tick-borne encephalitis virus detection in raw milk products. Food Microbiol. 2022, 104, 104003. [Google Scholar] [CrossRef]
  44. Uhrbrand, K.; Myrmel, M.; Maunula, L.; Vainio, K.; Trebbien, R.; Nørrung, B.; Schultz, A.C. Evaluation of a rapid method for recovery of norovirus and hepatitis A virus from oysters and blue mussels. J. Virol. Methods 2010, 169, 70–78. [Google Scholar] [CrossRef]
  45. Le Guyader, F.S.; Parnaudeau, S.; Schaeffer, J.; Bosch, A.; Loisy, F.; Pommepuy, M.; Atmar, R.L. Detection and quantification of noroviruses in shellfish. Appl. Environ. Microbiol. 2009, 75, 618–624. [Google Scholar] [CrossRef] [Green Version]
  46. Blaise-Boisseau, S.; Hennechart-Collette, C.; Guillier, L.; Perelle, S. Duplex real-time qRT-PCR for the detection of hepatitis A virus in water and raspberries using the MS2 bacteriophage as a process control. J. Virol. Methods 2010, 166, 48–53. [Google Scholar] [CrossRef]
  47. Butot, S.; Putallaz, T.; Sanchez, G. Procedure for rapid concentration and detection of enteric viruses from berries and vegetables. Appl. Environ. Microbiol. 2007, 73, 186–192. [Google Scholar] [CrossRef] [PubMed] [Green Version]
  48. Summa, M.; von Bonsdorff, C.H.; Maunula, L. Evaluation of four virus recovery methods for detecting noroviruses on fresh lettuce, sliced ham, and frozen raspberries. J. Virol. Methods 2012, 183, 154–160. [Google Scholar] [CrossRef] [PubMed]
  49. Yavarmanesh, M.; Abbaszadegan, M.; Alum, A.; Mortazavi, A.; Habibi Najafi, M.B.; Bassami, M.R.; Nassiri, M.R. Impact of milk components on recovery of viral RNA from MS2 bacteriophage. Food Environ. Virol. 2013, 5, 103–109. [Google Scholar] [CrossRef] [PubMed]
  50. Yavarmanesh, M.; Abbaszadegan, M.; Mortazavi, A.; Najafi, M.B.; Bassami, M.R.; Nassiri, M.R. Impact of milk components in recovery of the MS2 bacteriophage as an indicator of enteric viruses. J. Virol. Methods 2010, 168, 103–107. [Google Scholar] [CrossRef] [PubMed]
Figure 1. Flowchart of method 1 to method 4 evaluated for the detection of MNV-1 in raw salmon and smoked herring.
Microorganisms 11 00624 g001
Figure 2. Comparison of mean recovery rates of HAV, HEV, norovirus GI, and norovirus GII according to the operator factor (operator A and operator B). For each virus, 8 analyses were performed by each operator (4 foodstuffs for all settings with all levels of inoculation) and pure RNA extracts were analyzed in duplicate with the RT-qPCR assay. Results are expressed as mean recovery rates (%) ± standard deviation (SD). one-way ANOVA; p = 0.0826.
Microorganisms 11 00624 g002
Table 1. Selected food samples according to matrix type and processing factor.
Processing FactorMatrix Types
Tin canFish dumpling
Tuna
Tuna rillette
Salmon
Ready to eat mealSalmon sorrel sauce
Raw and smoked (+4 °C)Tuna albacore
Cod
Halibut
Kipper
Haddock
Fresh (+4 °C)Shelled pink shrimp
Surimi
Table 2. Experimental design for detection of enteric viruses (HAV, HEV, and noroviruses) in fish products adapted from the ISO 16140-4 procedure.
Repeat Experiments
Virus contamination levels R1R2R3R4
HighFish dumplingTunaTuna rilletteKipper
MediumTuna albacoreShelled pink shrimpSurimiHaddock
LowCodHalibutSalmon sorrel sauceSalmon
Very lowShelled pink shrimpSurimiHaddockTuna albacore
Table 3. Comparison of mean recovery rates of MNV-1 from artificially contaminated salmon and herring samples processed using four study methods.
SalmonHerring
MethodRNA ExtractsMNV-1 Extraction Yield (% ± SD)Factor (F)
(Diluted/Undiluted)
MNV-1 Extraction Yield (% ± SD)Factor (F)
(Diluted/Undiluted)
Method 1Undiluted55.85 ± 19.091.048.37 ± 7.183.11
10-fold diluted58.17 ± 24.9326.10-± 13.51
Method 2Undiluted3.03 ± 2.090.8836.77 ± 28.161.47
10-fold diluted2.68 ± 1.2954.28 ± 28.49
Method 3Undiluted26.48 ± 13.461.3482.22 ± 27.710.97
10-fold diluted35.57 ± 10.2979.45 ± 27.93
Method 4Undiluted97.02 ± 7.300.9486.17 ± 21.431.05
10-fold diluted91.62 ± 13.0093.50 ± 16.88
Results are expressed as means of MNV-1 extraction yields (%) ± standard deviations (SD). The ratio (F) between the mean of extraction yields obtained with pure RNA extracts and those obtained with 10-fold diluted RNA extracts was calculated to determine whether the dilution of RNA extracts enhances mean extraction yields.
Table 4. Mean percent recovery calculated for four inoculum levels of HAV, HEV, and noroviruses in the presence of MNV-1.
VirusNumber of Genome Copies/SampleRNA ExtractsRepeated Experiment R1
(% ± SD)
(F)Repeated Experiment R2
(% ± SD)
(F)Repeated Experiment R3
(% ± SD)
(F)Repeated Experiment R4
(% ± SD)
(F)
HAV2.9 × 106pure32.06 ± 11.10 (4/4)1.145.39 ± 10.06 (4/4)1.10.18 ± 0.01 (2/4)4.236.85 ± 5.50 (4/4)1.34
10-fold diluted36.56 ± 10.86 (4/4) 49.48 ± 6.65 (4/4) 0.75 ± 0.62 (4/4) 49.36 ± 4.82 (4/4)
2.9 × 10⁵pure3.93 ± 0.63 (4/4)1.723.89 ± 6.16 (4/4)1.266.19 ± 6.38 (4/4)>1.515.17 ± 3.14 (4/4)3.08
10-fold diluted6.52 ± 1.49 (4/4) 28.73 ± 10.78 (4/4) 100.00 (4/4) 46.86 ± 36.07 (4/4)
2.9 × 10⁴pure12.13 ± 9.04 (4/4)0.72.25 ± 2.55 (2/4)5.440.52 ± 9.17 (4/4)2.26.34 ± 3.34 (4/4)1.1
10-fold diluted8.16 ± 6.75 (3/4) 12.09 ± 12.52 (2/4) 88.06 ± 61.91 (4/4) 7.03 ± 1.2 (2/4)
2.9 × 10³pure6.06 ± 5.21 (3/4)0.121.13 ± 27.82 (4/4)-24.73 ± 25.49 (4/4)4.024.51 ± 22.96 (4/4)4.1
10-fold diluted0.40 (1/4) nd (0/4) 100.00 (1/4) 100.00 (1/4)
MNV-1MNV 77.58 ± 31.29 71.21 ± 32.47 68.07 ± 52.74 43.25 ± 22.23
Total samples with recovery rates > 1% 30/32
HEV1.0 × 106pure100 (4/4)1.055.48 ± 13.42 (4/4)0.9719.69 ± 4.83 (4/4)0.594.59 ± 10.82 (4/4)0.73
10-fold diluted100 (4/4) 54.09 ± 18.35 (4/4) 9.93 ± 7.05 (4/4) 69.40 ± 33.75 (4/4)
1.0 × 10⁵purend (0/4)-34.46 ± 24.41 (4/4)-100 (4/4)-100 (4/4)0.48
10-fold dilutednd (0/4) nd (0/4) 0.99 (1/4) 48.06 ± 41.98 (3/4)
1.0 × 10⁴pure100 (1/4)-nd (0/4)-4.04 ± 6.21 (4/4)-87.15 (1/4)-
10-fold dilutednd (0/4) 10.08 ± 0.55 (2/4) nd (0/4) nd (0/4)
1.0 × 10³purend (0/4)-nd (0/4)-4.39 (1/4)-nd (0/4)-
10-fold dilutednd (0/4) nd (0/4) nd (0/4) nd (0/4)
MNV-1MNV 61.18 ± 36.35 58.04 ± 24.79 45.40 ± 38.41 48.29 ± 27.67
Total samples with recovery rates > 1% 31/32
norovirus GI1.6 × 106pure82.48 ± 13.79 (2/4)1.2197.30 ± 3.83 (4/4)1.04.79 ± 3.07 (4/4)8.963.01 ± 21.77 (4/4)1.4
10-fold diluted100.00 (2/4) 100.00 (4/4) 42.51 ± 31.69 (4/4) 88.58 ± 13.24 (4/4)
1.6 × 10⁵pure49.27 ± 1.17 (2/4)1.0671.87± 32.51 (4/4)0.9368.60 ± 61.29 (4/4)1.1100.00 (4/4)0.8
10-fold diluted52.47 ± 62.22 (2/4) 66.92 ± 54.90 (3/4) 77.11 ± 14.90 (4/4) 83.50 ± 32.93 (4/4)
1.6 × 10⁴pure2.18 (1/4)-nd (0/4)-97.32 (1/4)-34.41 ± 27.98 (3/4)-
10-fold dilutednd (0/4) nd (0/4) nd (0/4) nd (0/4)
1.6 × 10³purend (0/4)-nd (0/4)-nd (0/4)-nd (0/4)-
10-fold dilutednd (0/4) nd (0/4) nd (0/4) nd (0/4)
MNV-1MNV 100 100 100 80.29 ± 56.88
Total samples with recovery rates > 1% 32/32
norovirus GII1.3 × 106pure11.34 ± 2.43 (4/4)2.35.77 ± 1.30 (4/4)1.00.17 ± 0.06 (4/4)1.212.49 ± 1.21 (4/4)1.1
10-fold diluted26.14 ± 33.00 (4/4) 5.67 ± 1.36 (4/4) 1.96 ± 0.37 (4/4) 14.09 ± 1.60 (4/4)
1.3 × 10⁵pure8.00 ± 1.23 (4/4)1.06.51 ± 1.88 (4/4)1.04.65 ± 0.51 (4/4)0.77.66 ± 2.76 (4/4)1.2
10-fold diluted8.45 ± 2.78 (4/4) 6.55 ± 3.68 (4/4) 3.31 ± 1.23 (3/4) 8.98 ± 5.29 (4/4)
1.3 × 10⁴pure9.09 ± 5.35 (4/4)1.95.11 ± 5.22 (3/4)2.110.43 ± 4.05 (4/4)0.48.32 ± 2.04 (2/4)-
10-fold diluted17.38 ± 20.49 (3/4) 10.77 ± 8.29 (2/4) 4.21 ± 5.91 (2/4) nd (0/4)
1.3 × 10³pure6.92 ± 4.12 (2/4)5.03.96 ± 0.33 (2/4)-nd (0/4)-nd (0/4)-
10-fold diluted34.41 ± 19.47 (2/4) nd (0/4) nd (0/4) nd (0/4)
MNV-1MNV 55.73 ± 8.56 51.00 ± 14.69 14.76 ± 11.79 46.42 ± 30.50
Total samples with recovery rates > 1% 32/32
The mean percent recovery of operator A and B replicates was used for each inoculation level sample. RNA extracts were tested twice for each operator. nd: not detected. The ratios between the means of extraction yields obtained with undiluted RNA extracts and those obtained with 10-fold diluted RNA extracts were calculated to determine whether the dilution of RNA extracts enhanced the mean extraction yields (F). The mean percent recovery of viruses > 100% was reduced to 100%.
Table 5. Mean inhibition rates for HAV, HEV, and norovirus according to fish samples analyzed.
Sample AnalyzedMean Inhibition Recoveries (% ± SD)
Fish dumpling26.46 ± 33.77 (N = 8)
Albacore tuna39.03 ± 32.27(N = 16)
Cod26.60 ± 33.84 (N = 8)
Tuna30.10 ± 30.26 (N = 8)
Shelled pink shrimp36.83 ± 32.58 (N = 16)
Halibut12.93 ± 16.12 (N = 8)
Tuna rillette84.50 ± 34.35 (N = 8)
Surimi25.82 ± 29.19 (N = 16)
Salmon sorrel sauce20.56 ± 33.94 (N = 8)
Kipper15.40 ± 34.47 (N = 8)
Haddock15.73 ± 25.58 (N = 16)
Salmon20.12 ± 19.57 (N = 8)
Table 6. Limit of detection (LOD50 and LOD95) for HAV, HEV, and norovirus according to the setting.
Target VirusGenome Copies/gR1R2R3R4All Settings
HAVLOD506003.8 × 103<1.2 × 10³ *<1.2 × 103 *144
LOD952.5 × 1031.7 × 104<1.2 × 10³ *<1.2 × 103 *6.4 × 103
HEVLOD508.4 × 1041.2 × 1027.2 × 1027.6 × 103Between 7.2 × 10² and 8.4 × 10⁴ **
LOD953.6 × 1055.2 × 1043.2 × 1033.3 × 104Between 3.2 × 10³ and 3.6 × 10⁵ **
norovirus GILOD507.2 × 1031.9 × 1041.2 × 1043.5 × 1031 × 104
LOD953.1 × 1048.4 × 1045.2 × 1041.2 × 1044.4 × 104
norovirus GIILOD505202.2 × 1031.5 × 1035.6 × 1032.0 × 103
LOD952.2 × 1039.6 × 1036.4 × 1032.5 × 1048.8 × 103
* LOD50 and LOD95 were estimated. It was not possible to determine values because the LOD was not reached. ** LOD50 and LOD95 were estimated. It was not possible to calculate the LOD for all settings because determination of the zero failed during POD LOD calculation.
Disclaimer/Publisher’s Note: The statements, opinions and data contained in all publications are solely those of the individual author(s) and contributor(s) and not of MDPI and/or the editor(s). MDPI and/or the editor(s) disclaim responsibility for any injury to people or property resulting from any ideas, methods, instructions or products referred to in the content.

