


Influence of Probiotic Feed Supplement on Nosema spp. Infection Level and the Gut Microbiota of Adult Honeybees (Apis mellifera L.)


Abstract
:1. Introduction
2. Materials and Methods
2.1. Apiary Conditions
2.1.1. Field Test Design, Feed Treatments, and Bee Sampling
2.1.2. Sampling of Adult Honeybees’ Guts
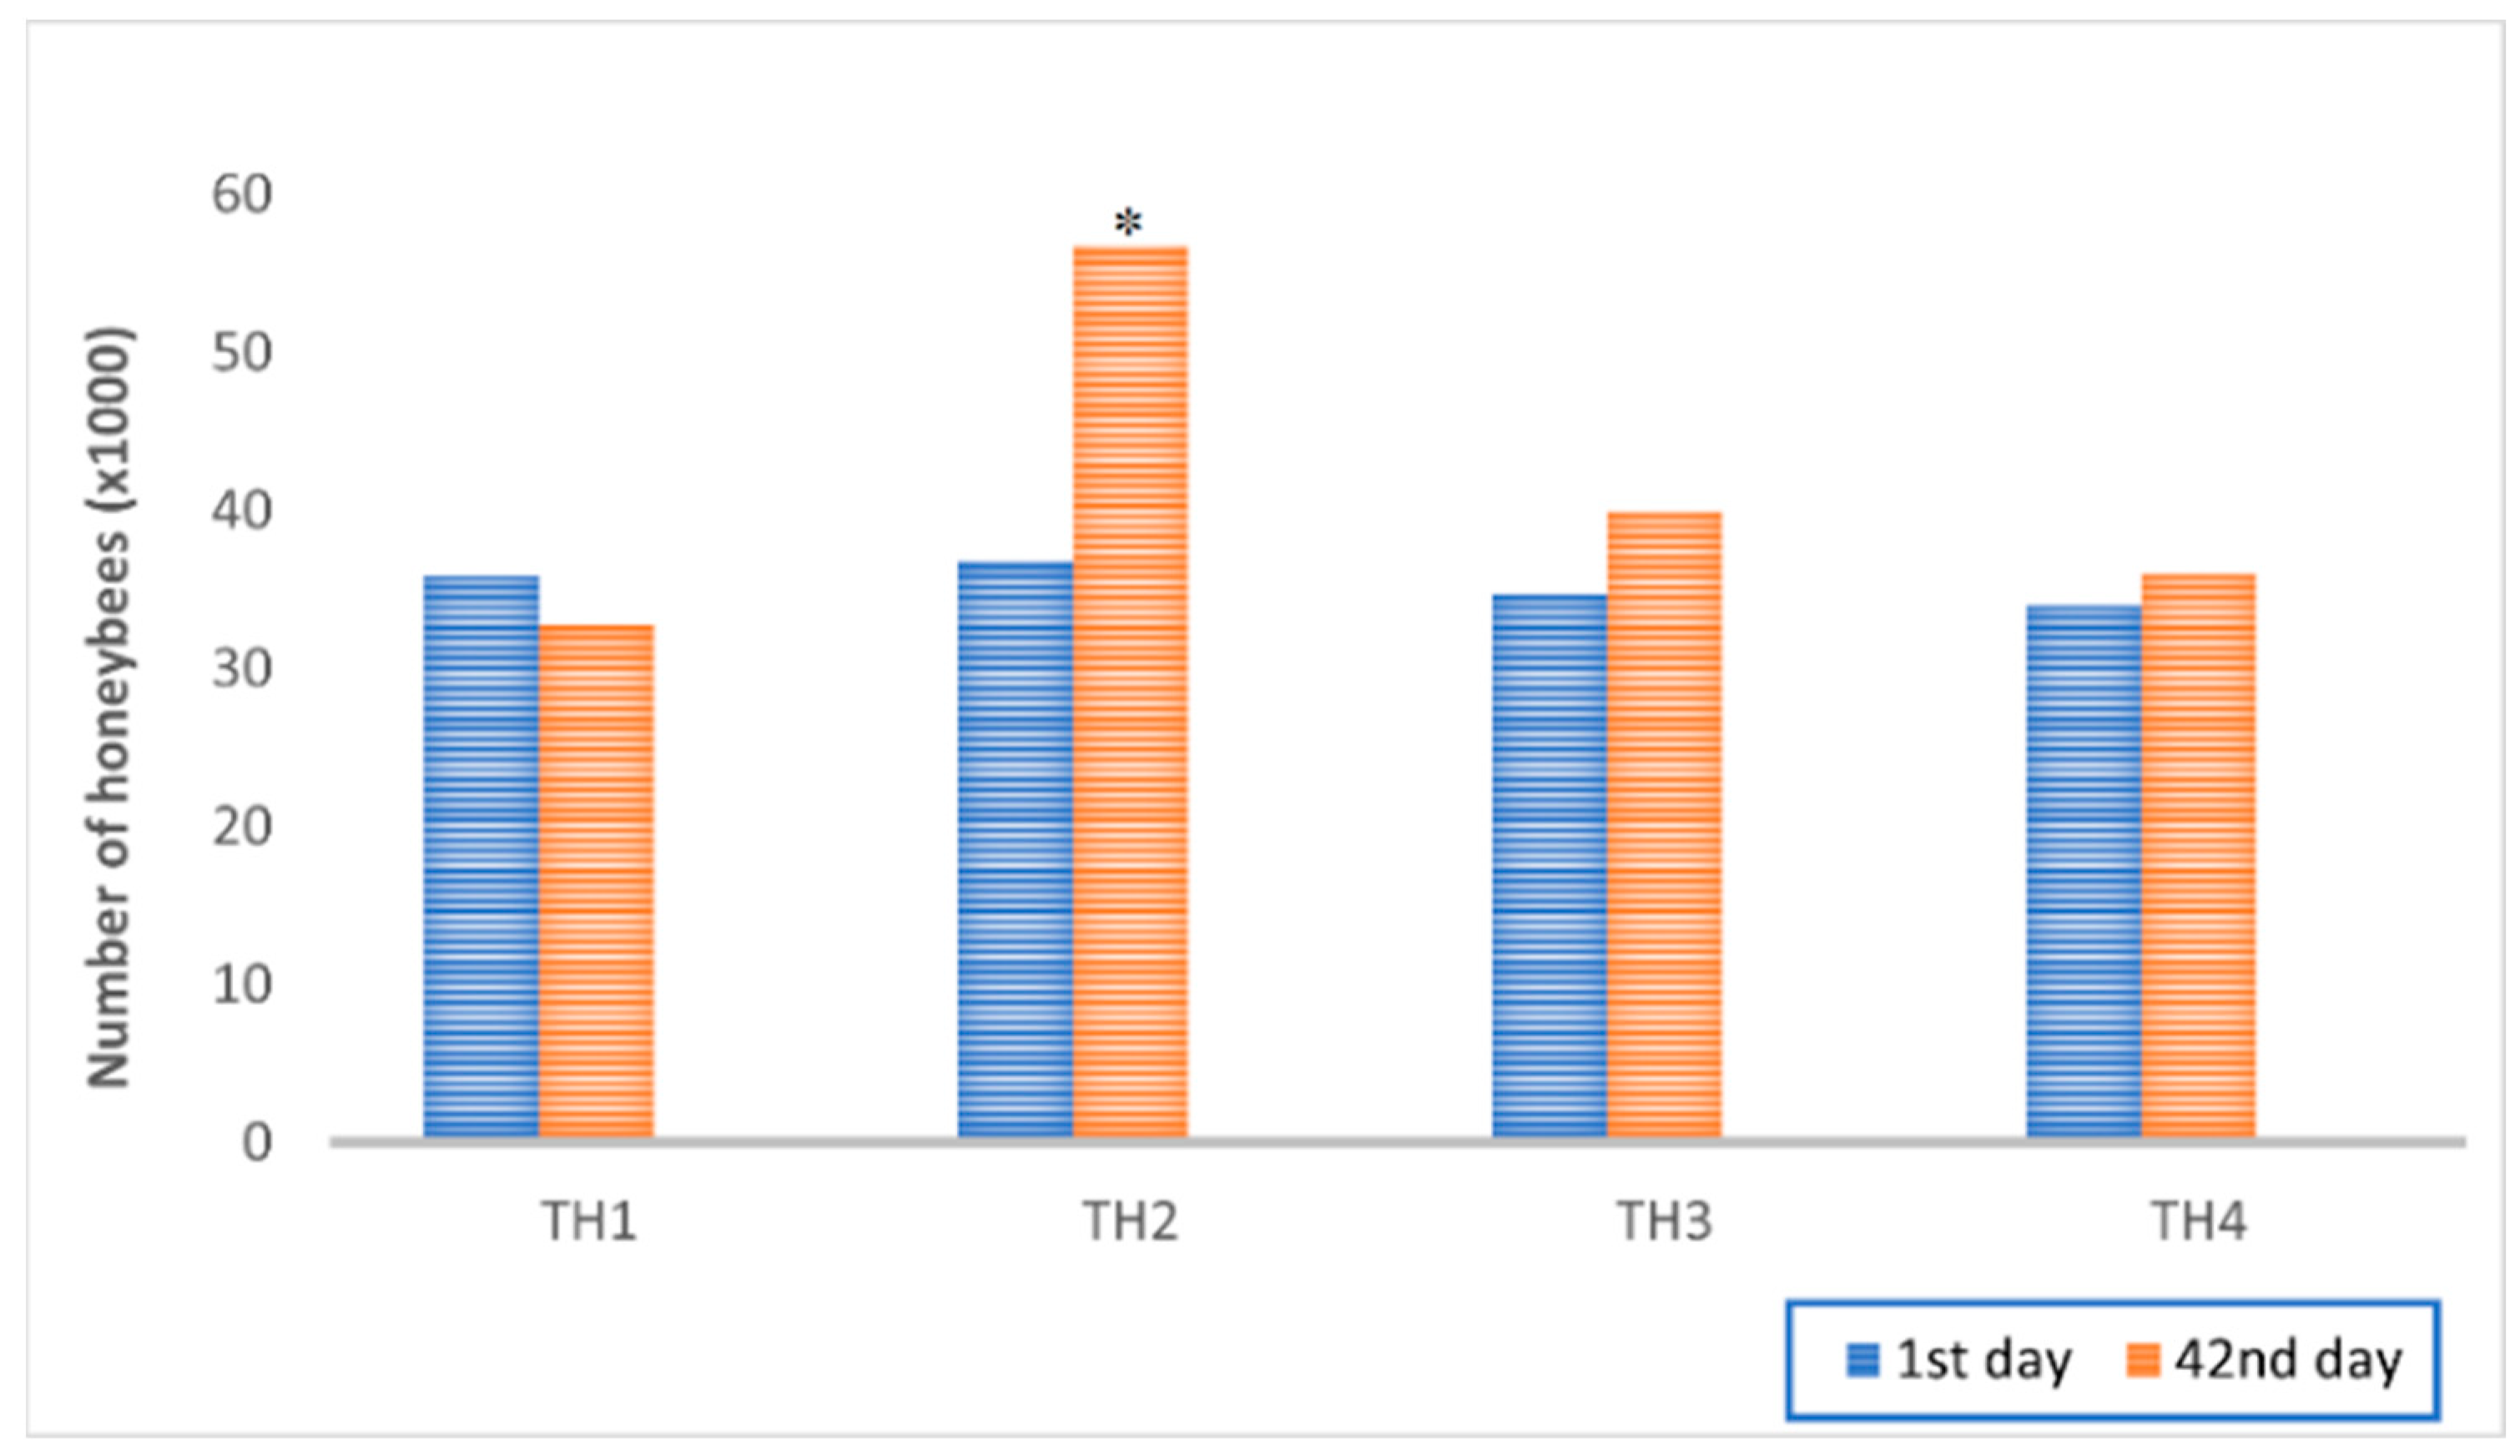
2.1.3. Clinical Inspections of Honeybee Colonies and Strength Estimation
2.2. Laboratory Examinations
2.2.1. Presence Determination and Quantification of Nosema spp. Spore Levels
2.2.2. Gut microbiota Processing and Analysis
Extraction
Amplicon Sequencing by NGS
Sequence Analyses
2.3. Statistical Analyses of Colonies’ Strength and Nosema spp. Infection Levels
3. Results
3.1. Apiary Conditions
Estimated Strength of Honeybee Colonies
3.2. Laboratory Examinations
3.2.1. Determination of Nosema spp. Infection Levels in Adult Bee Samples
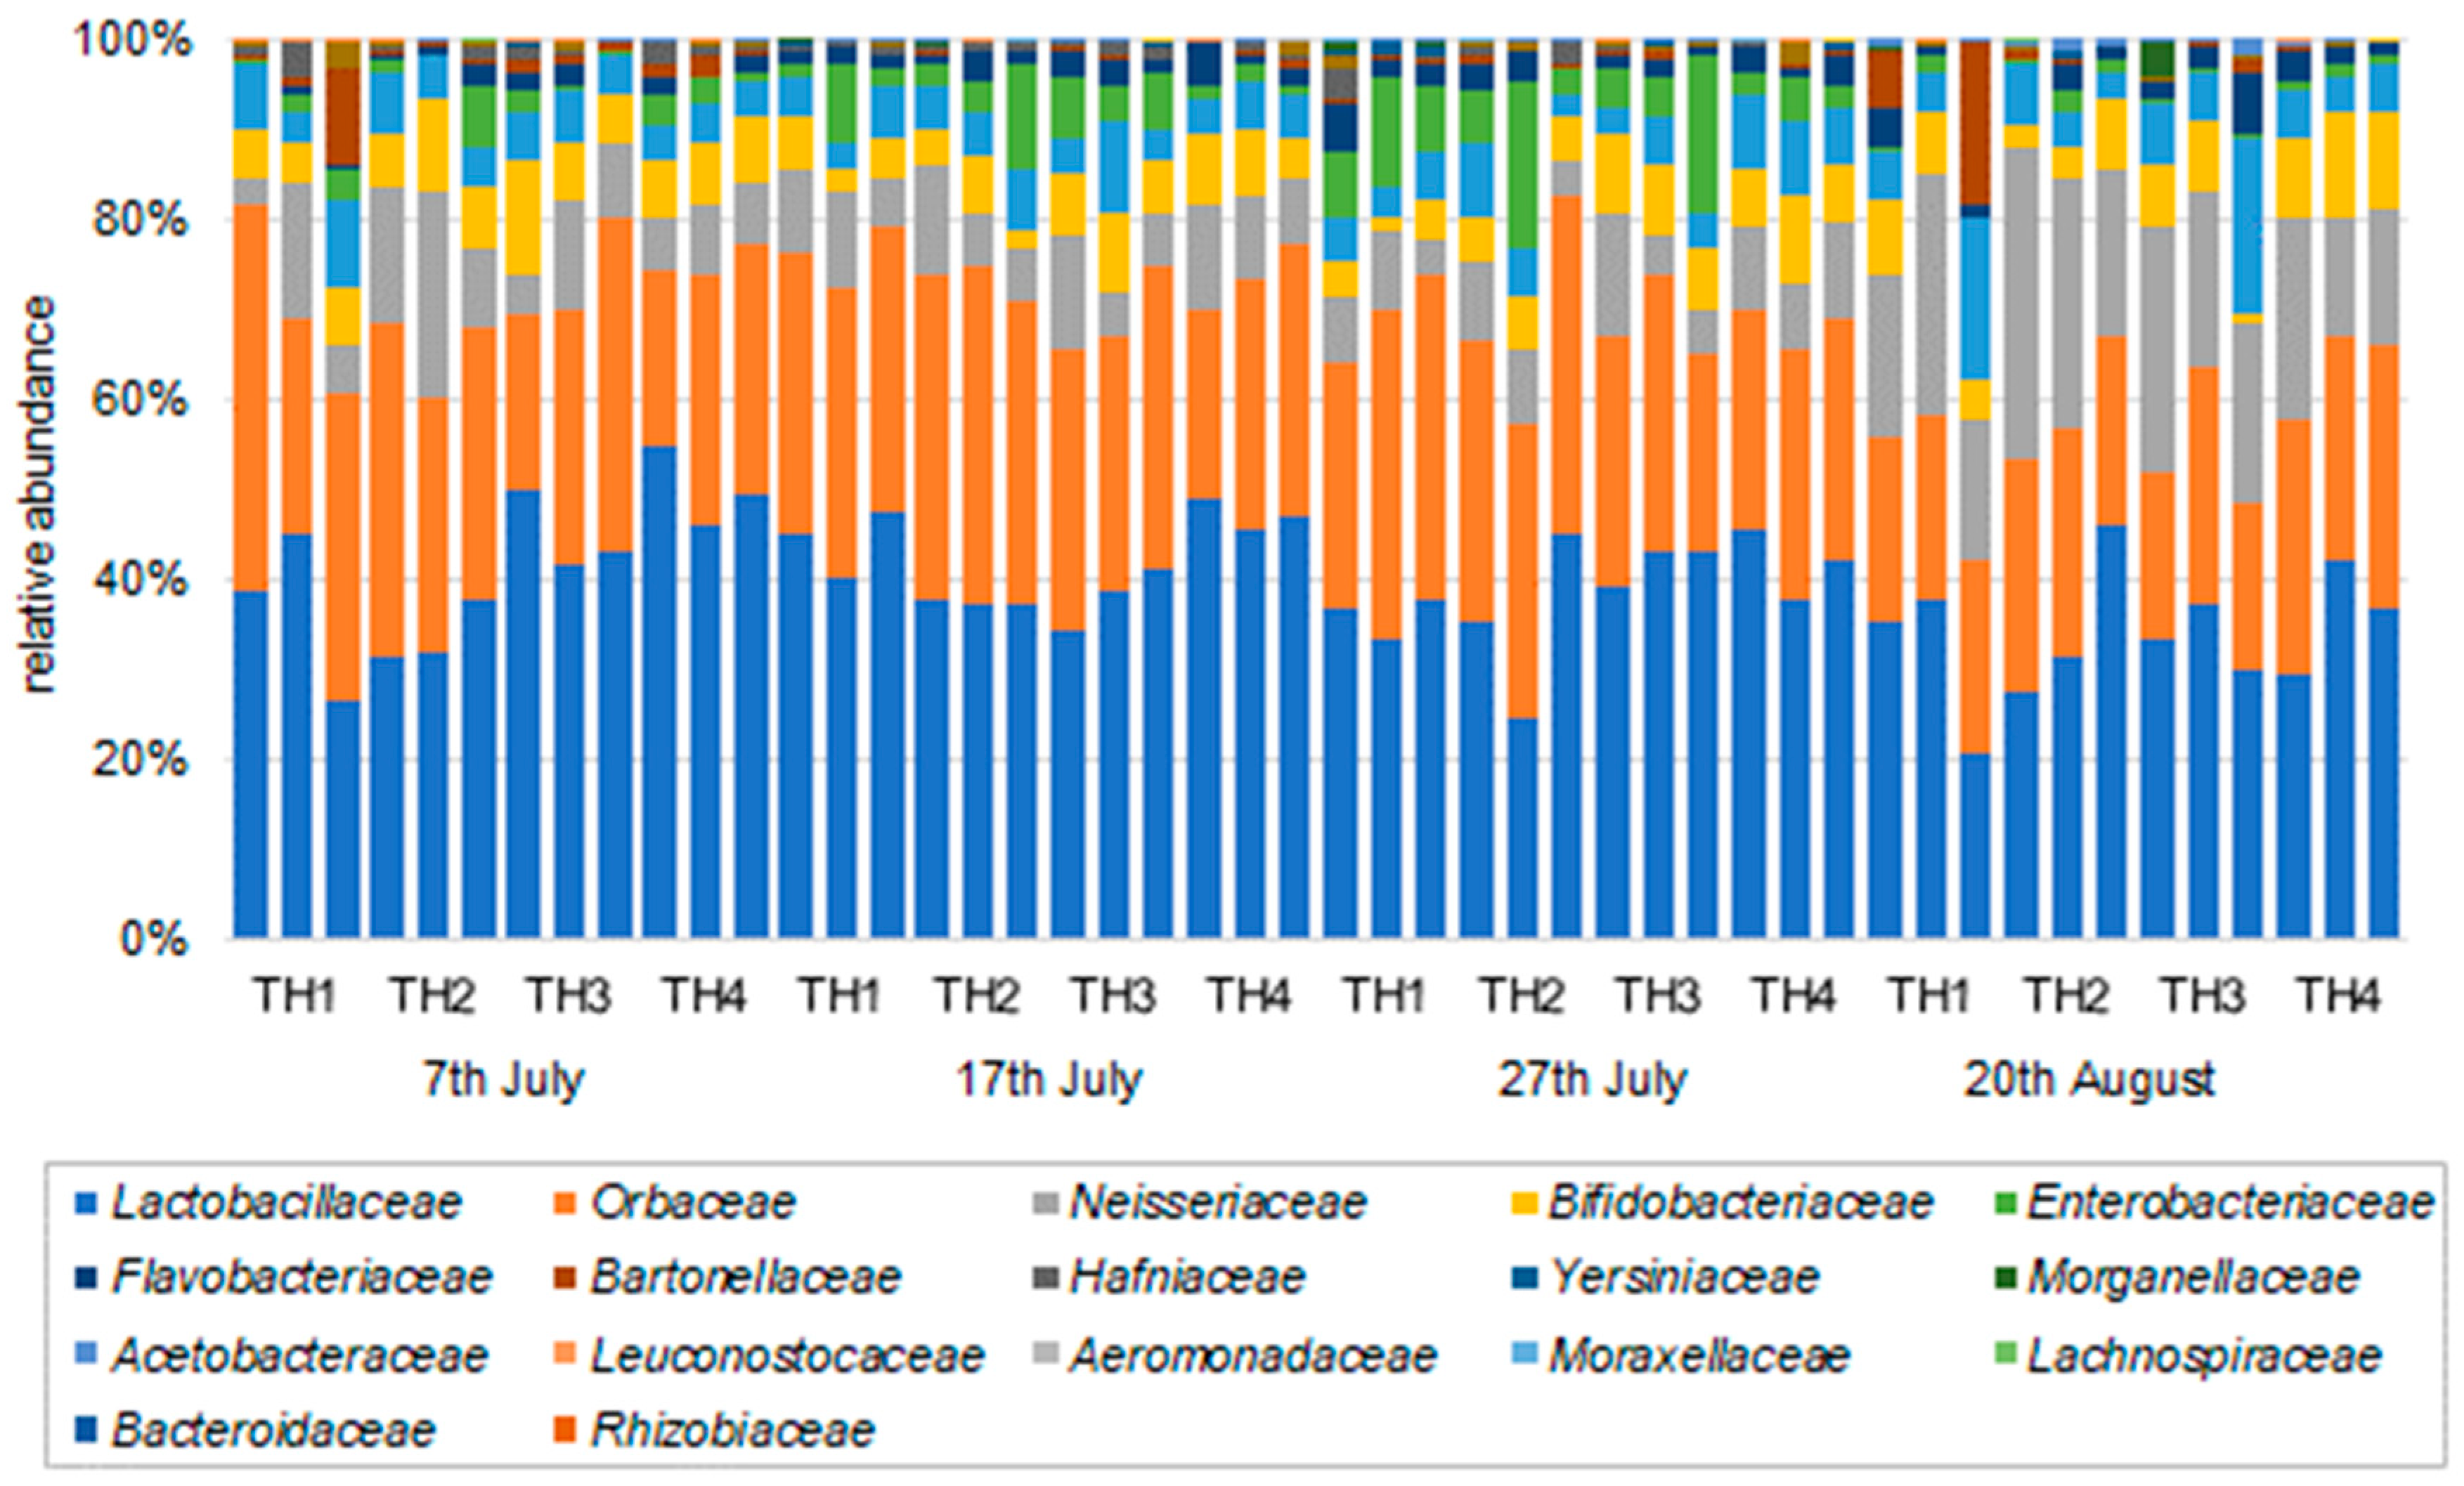
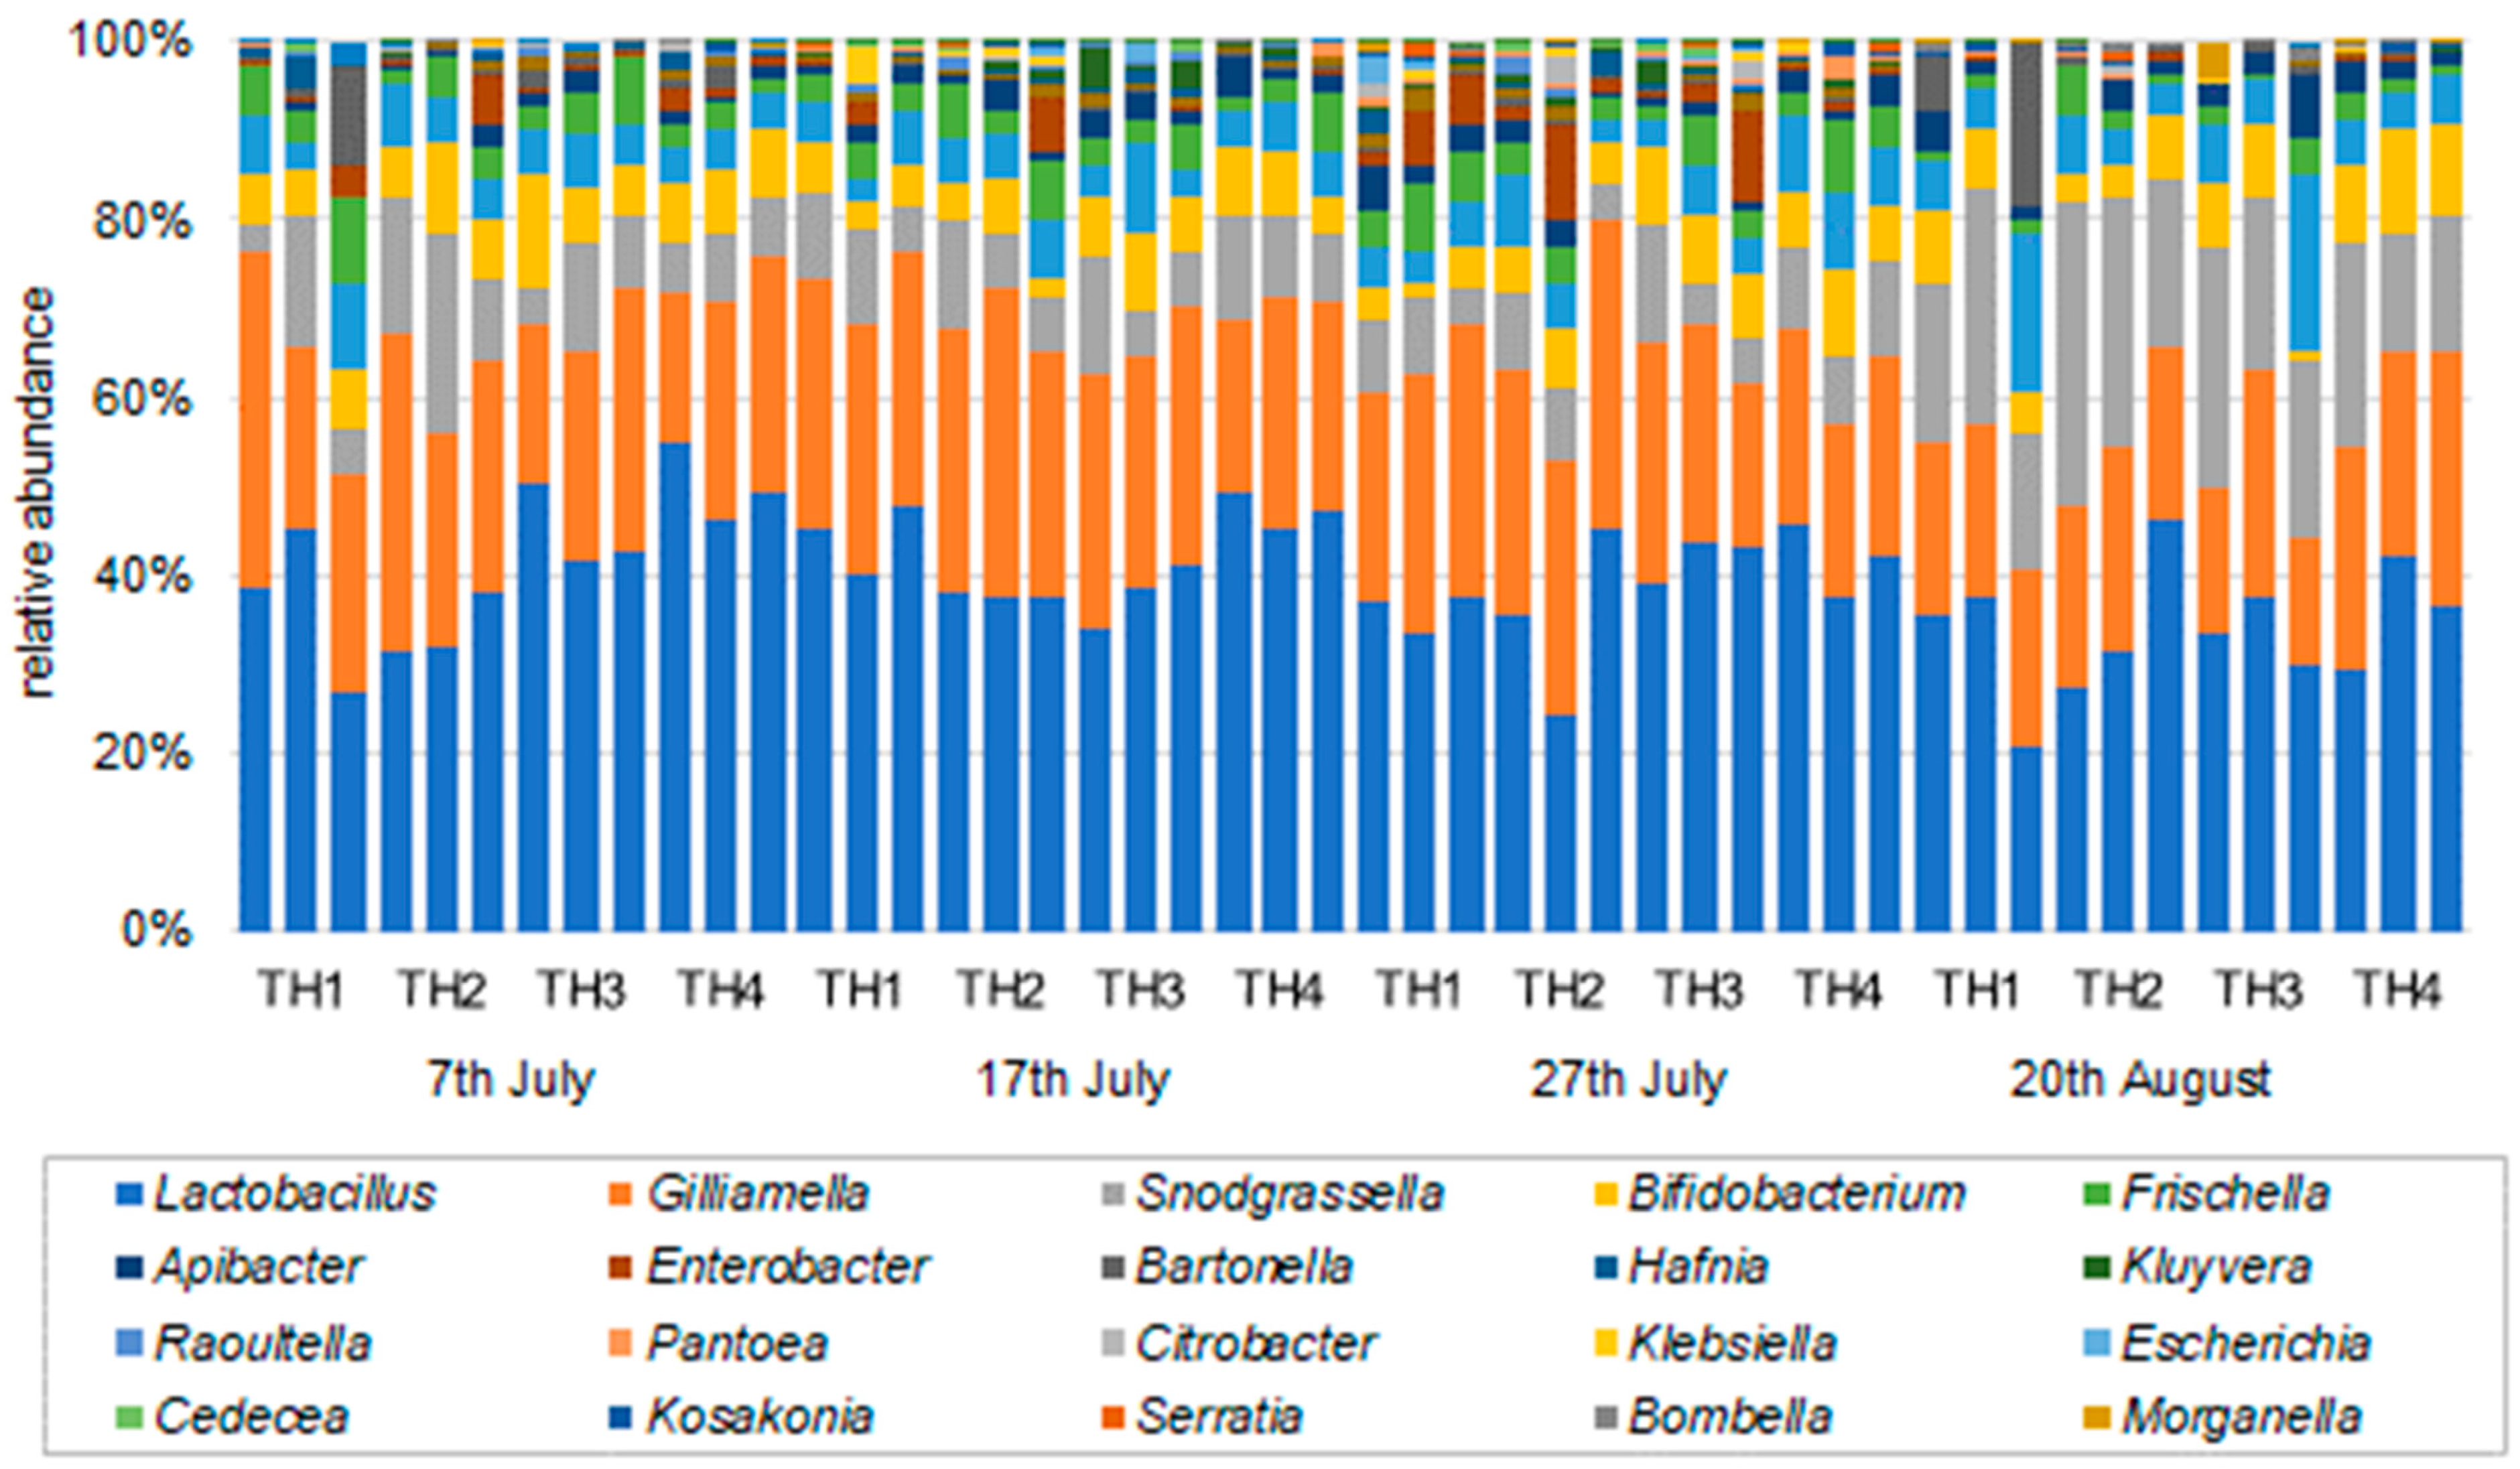
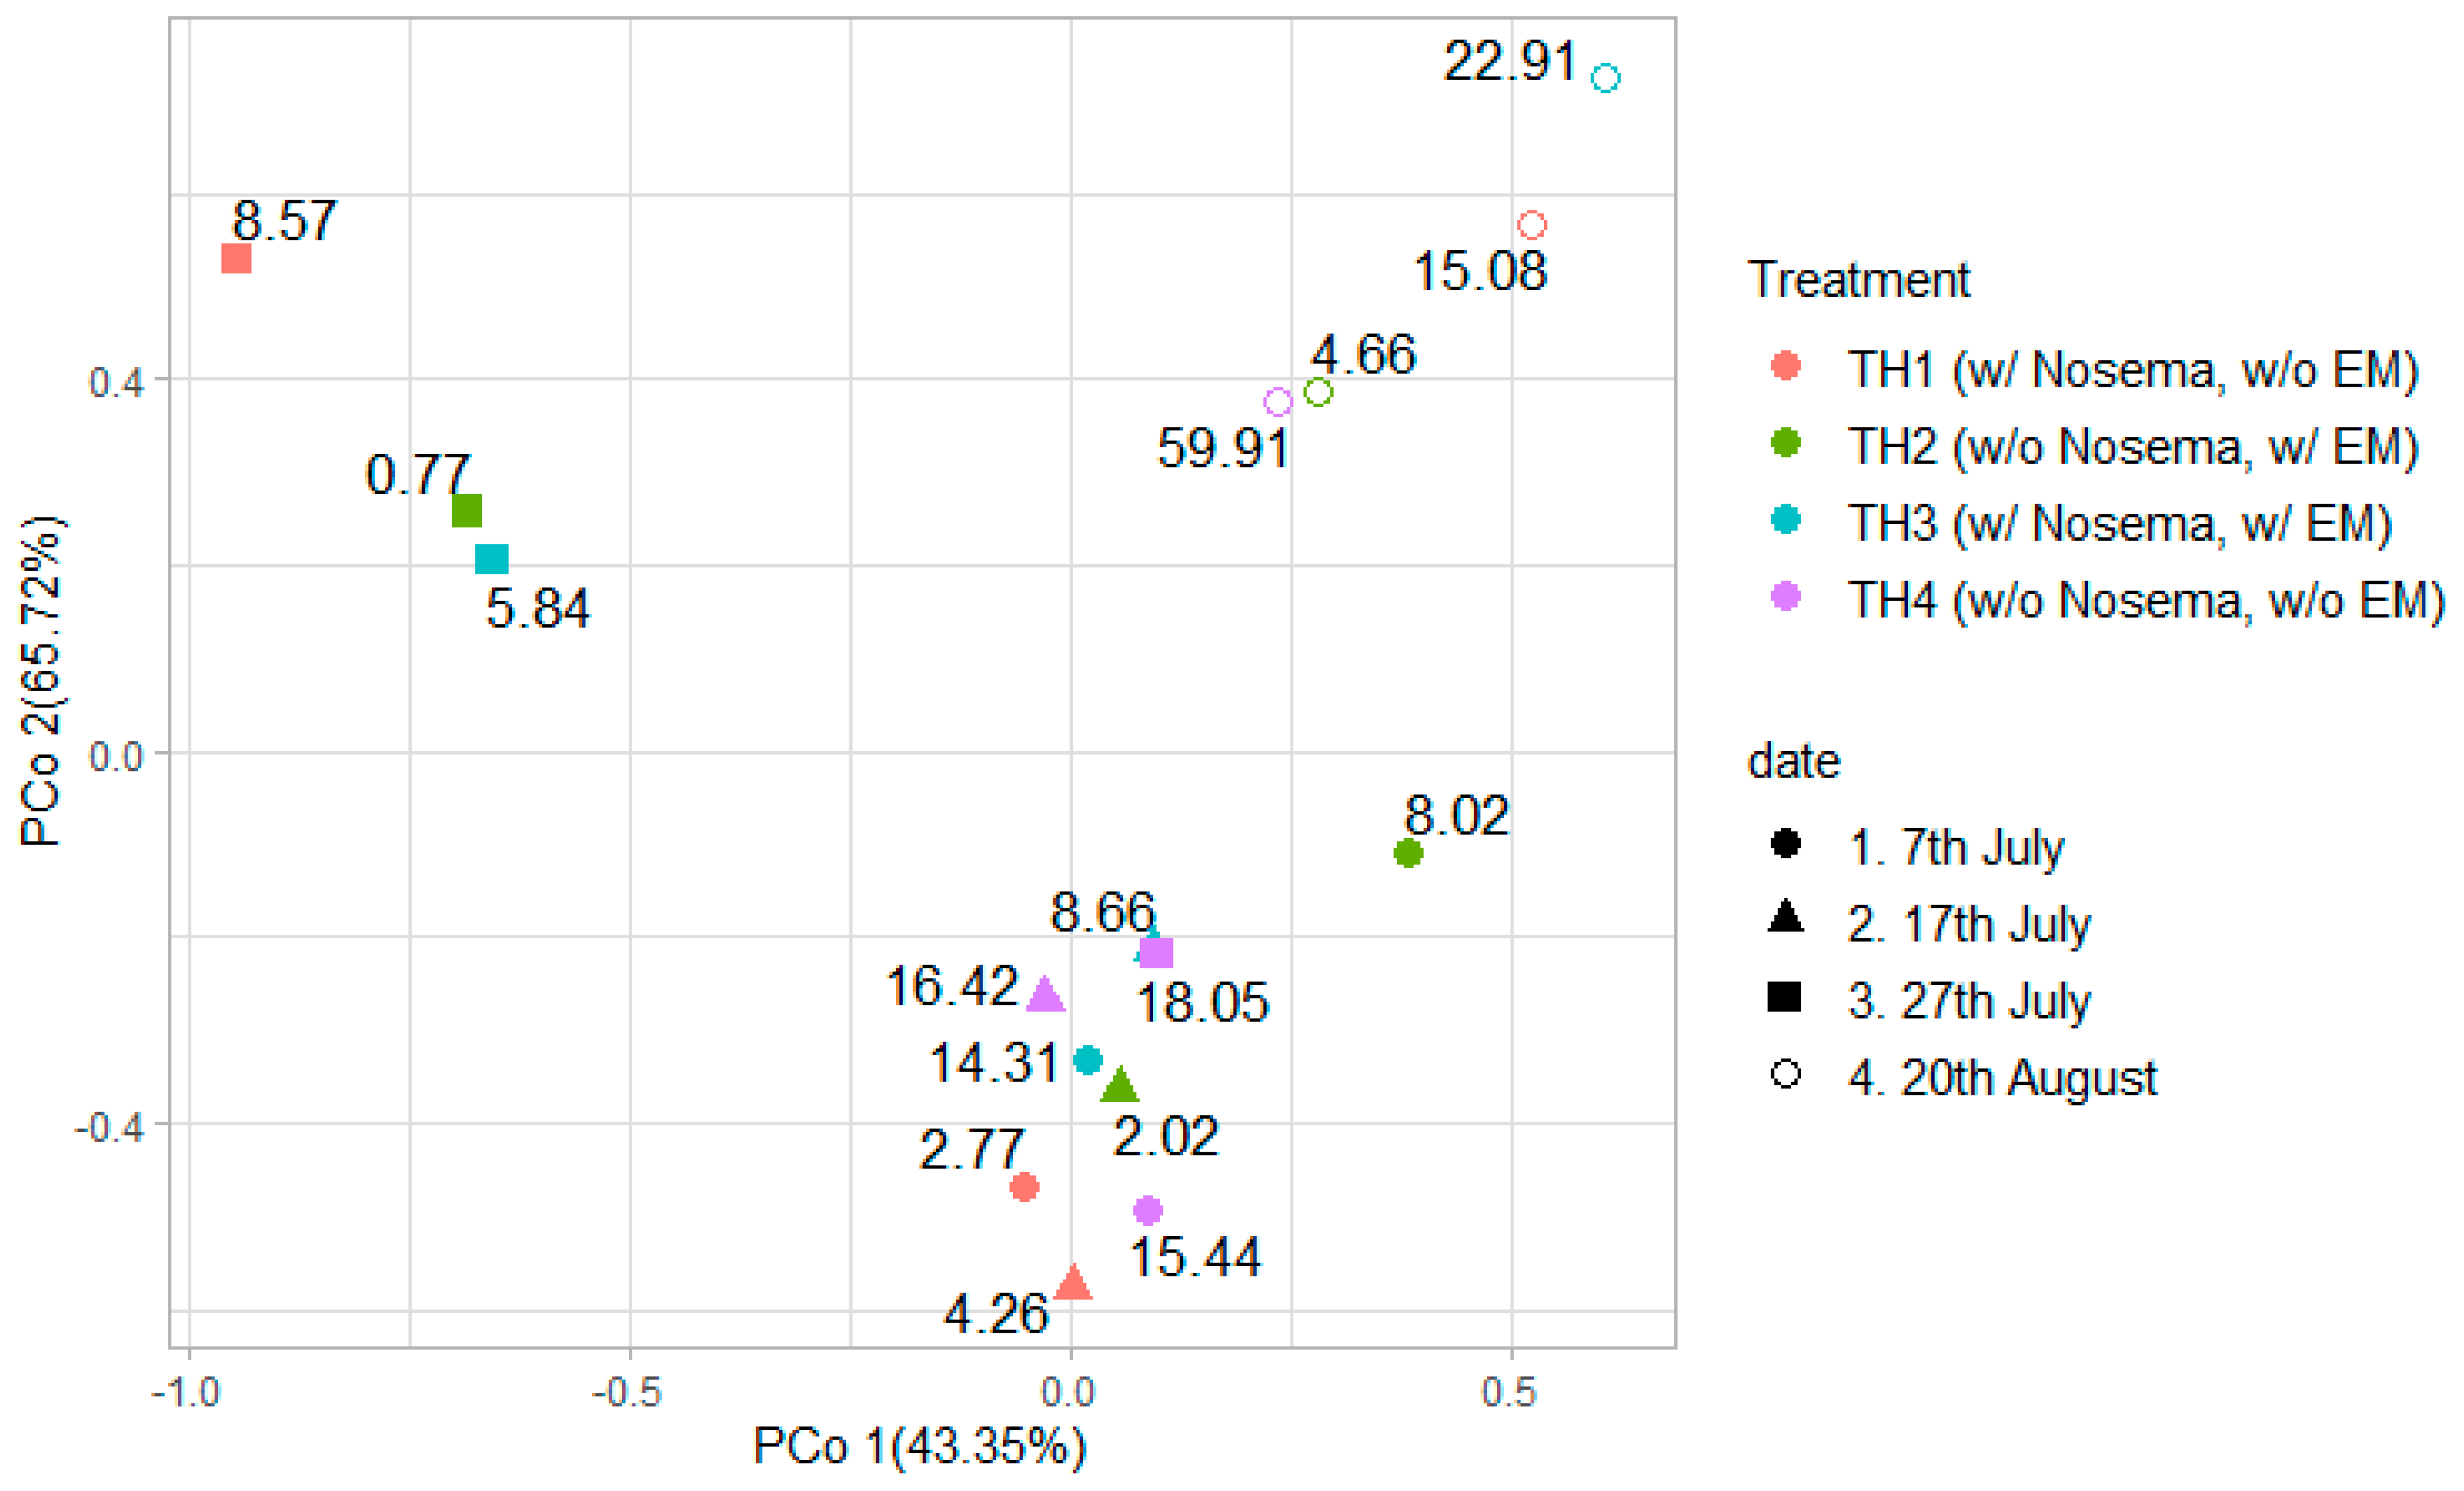
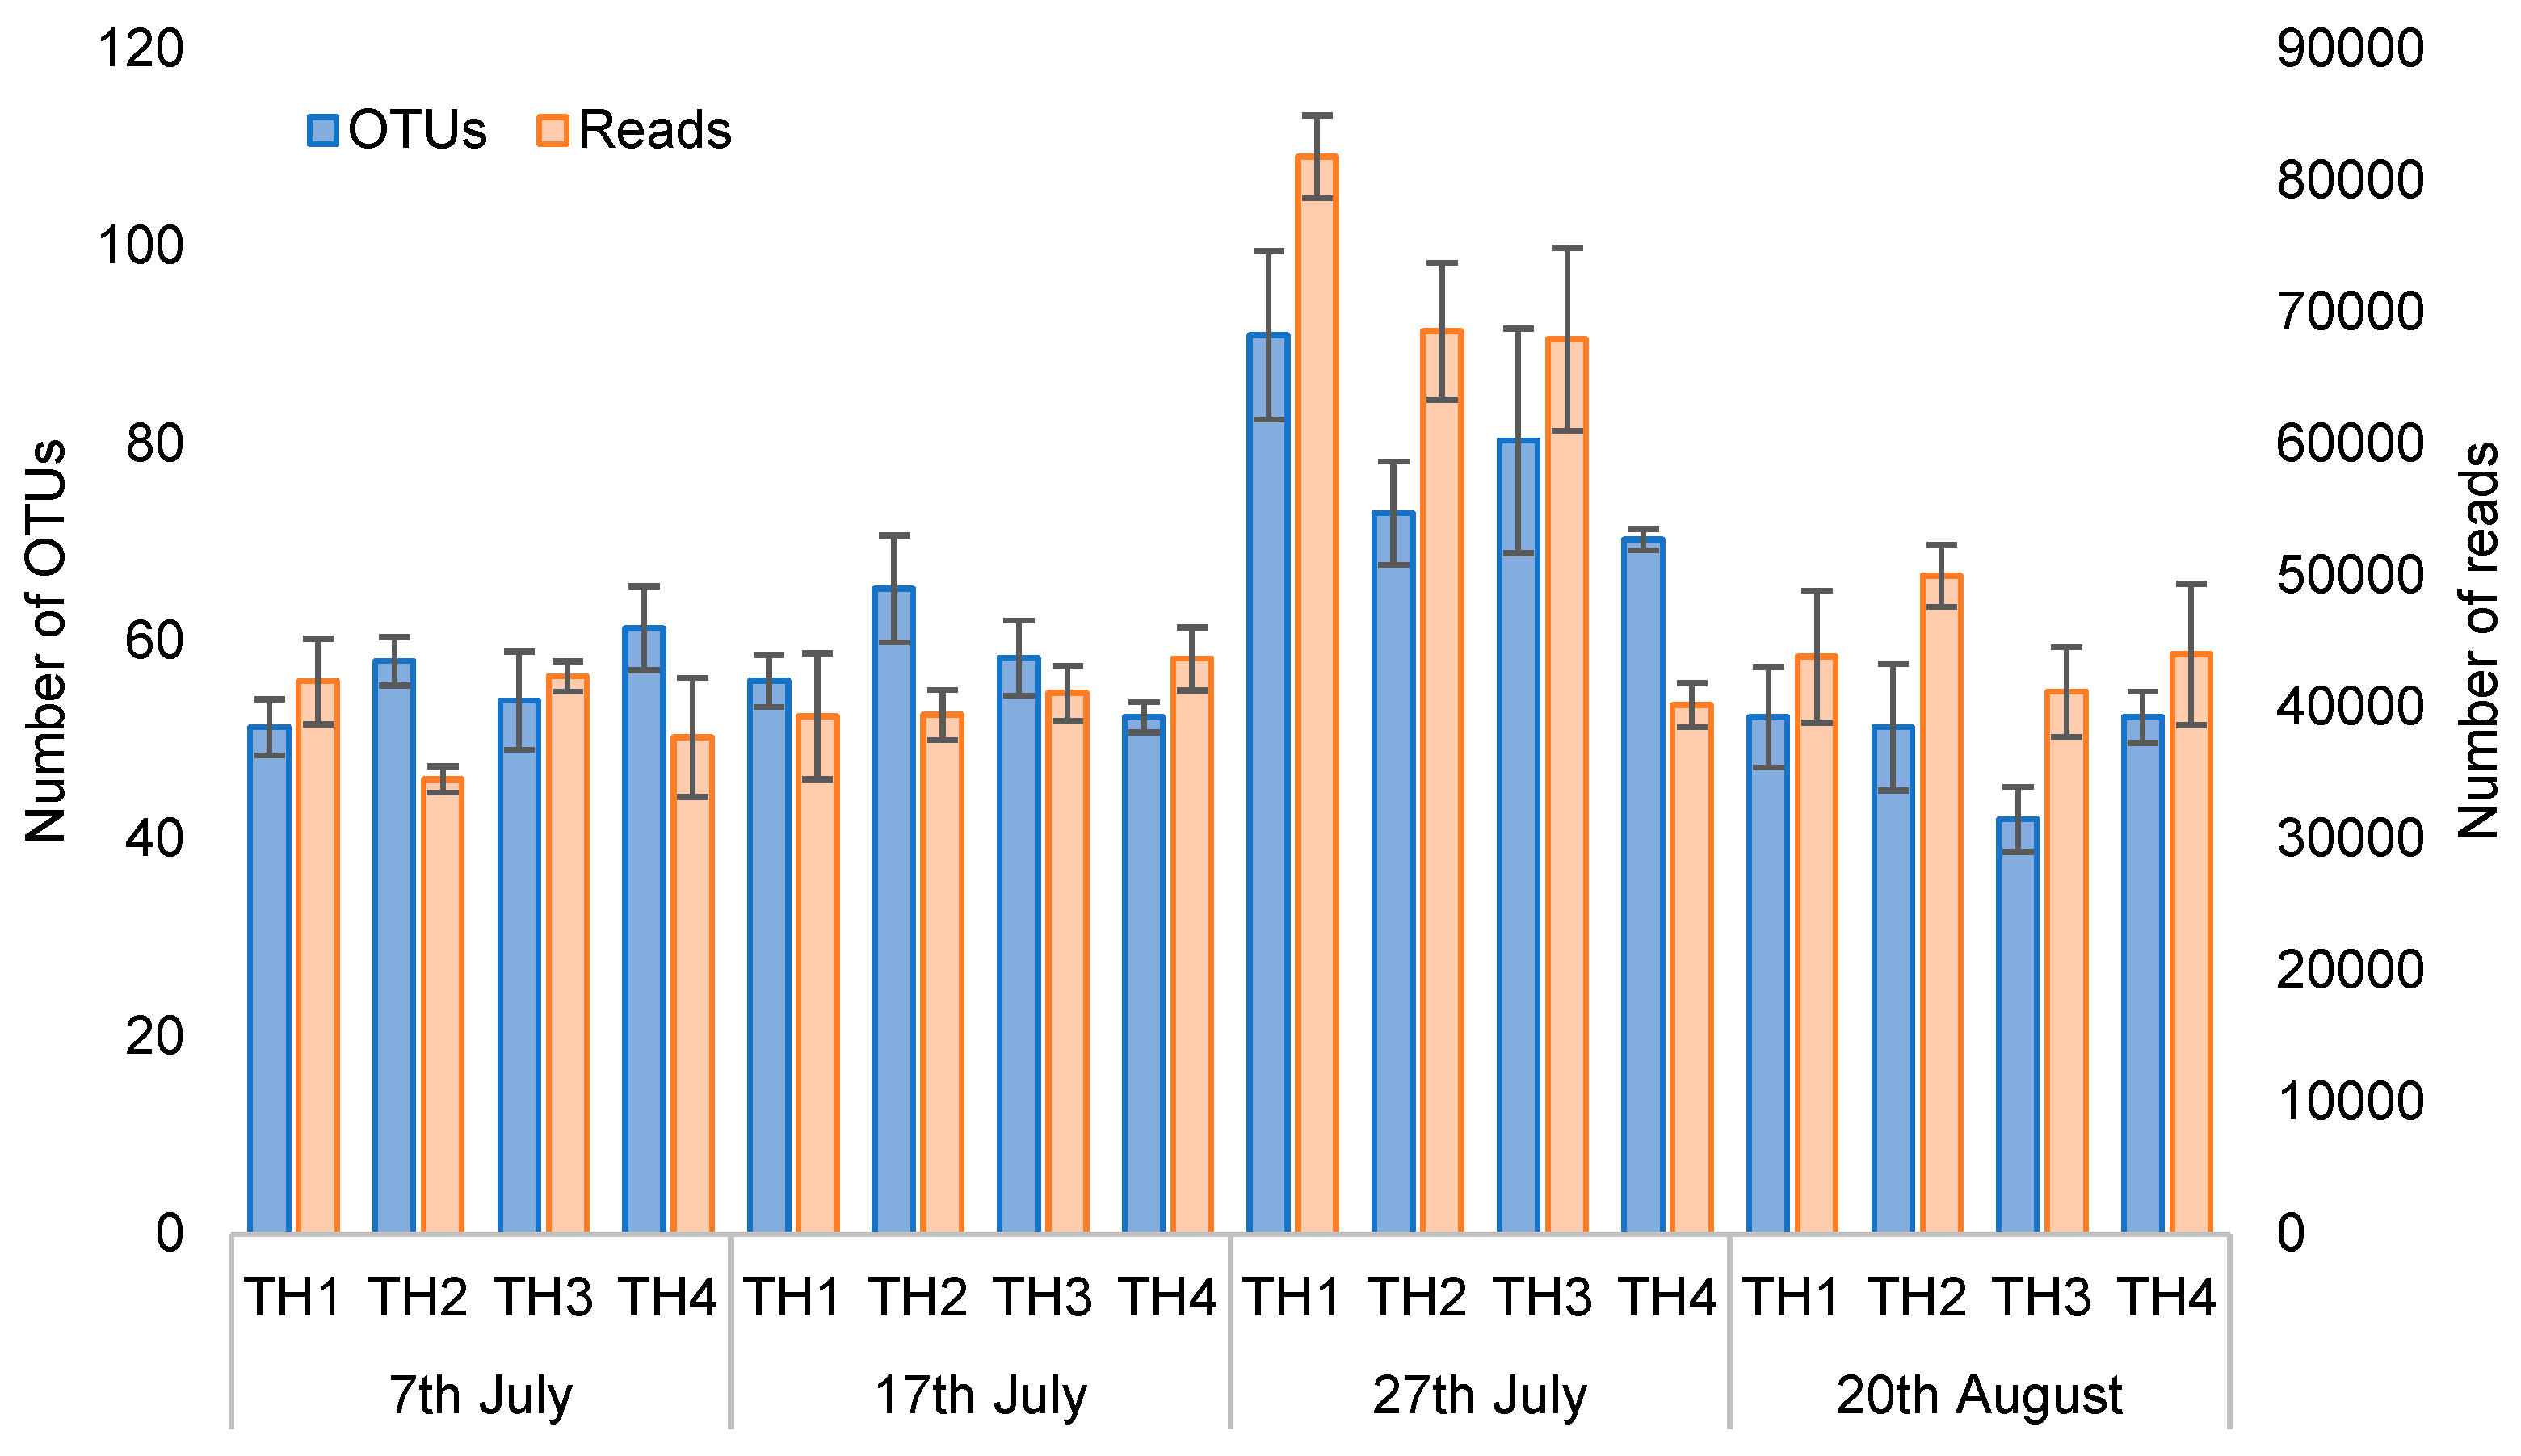
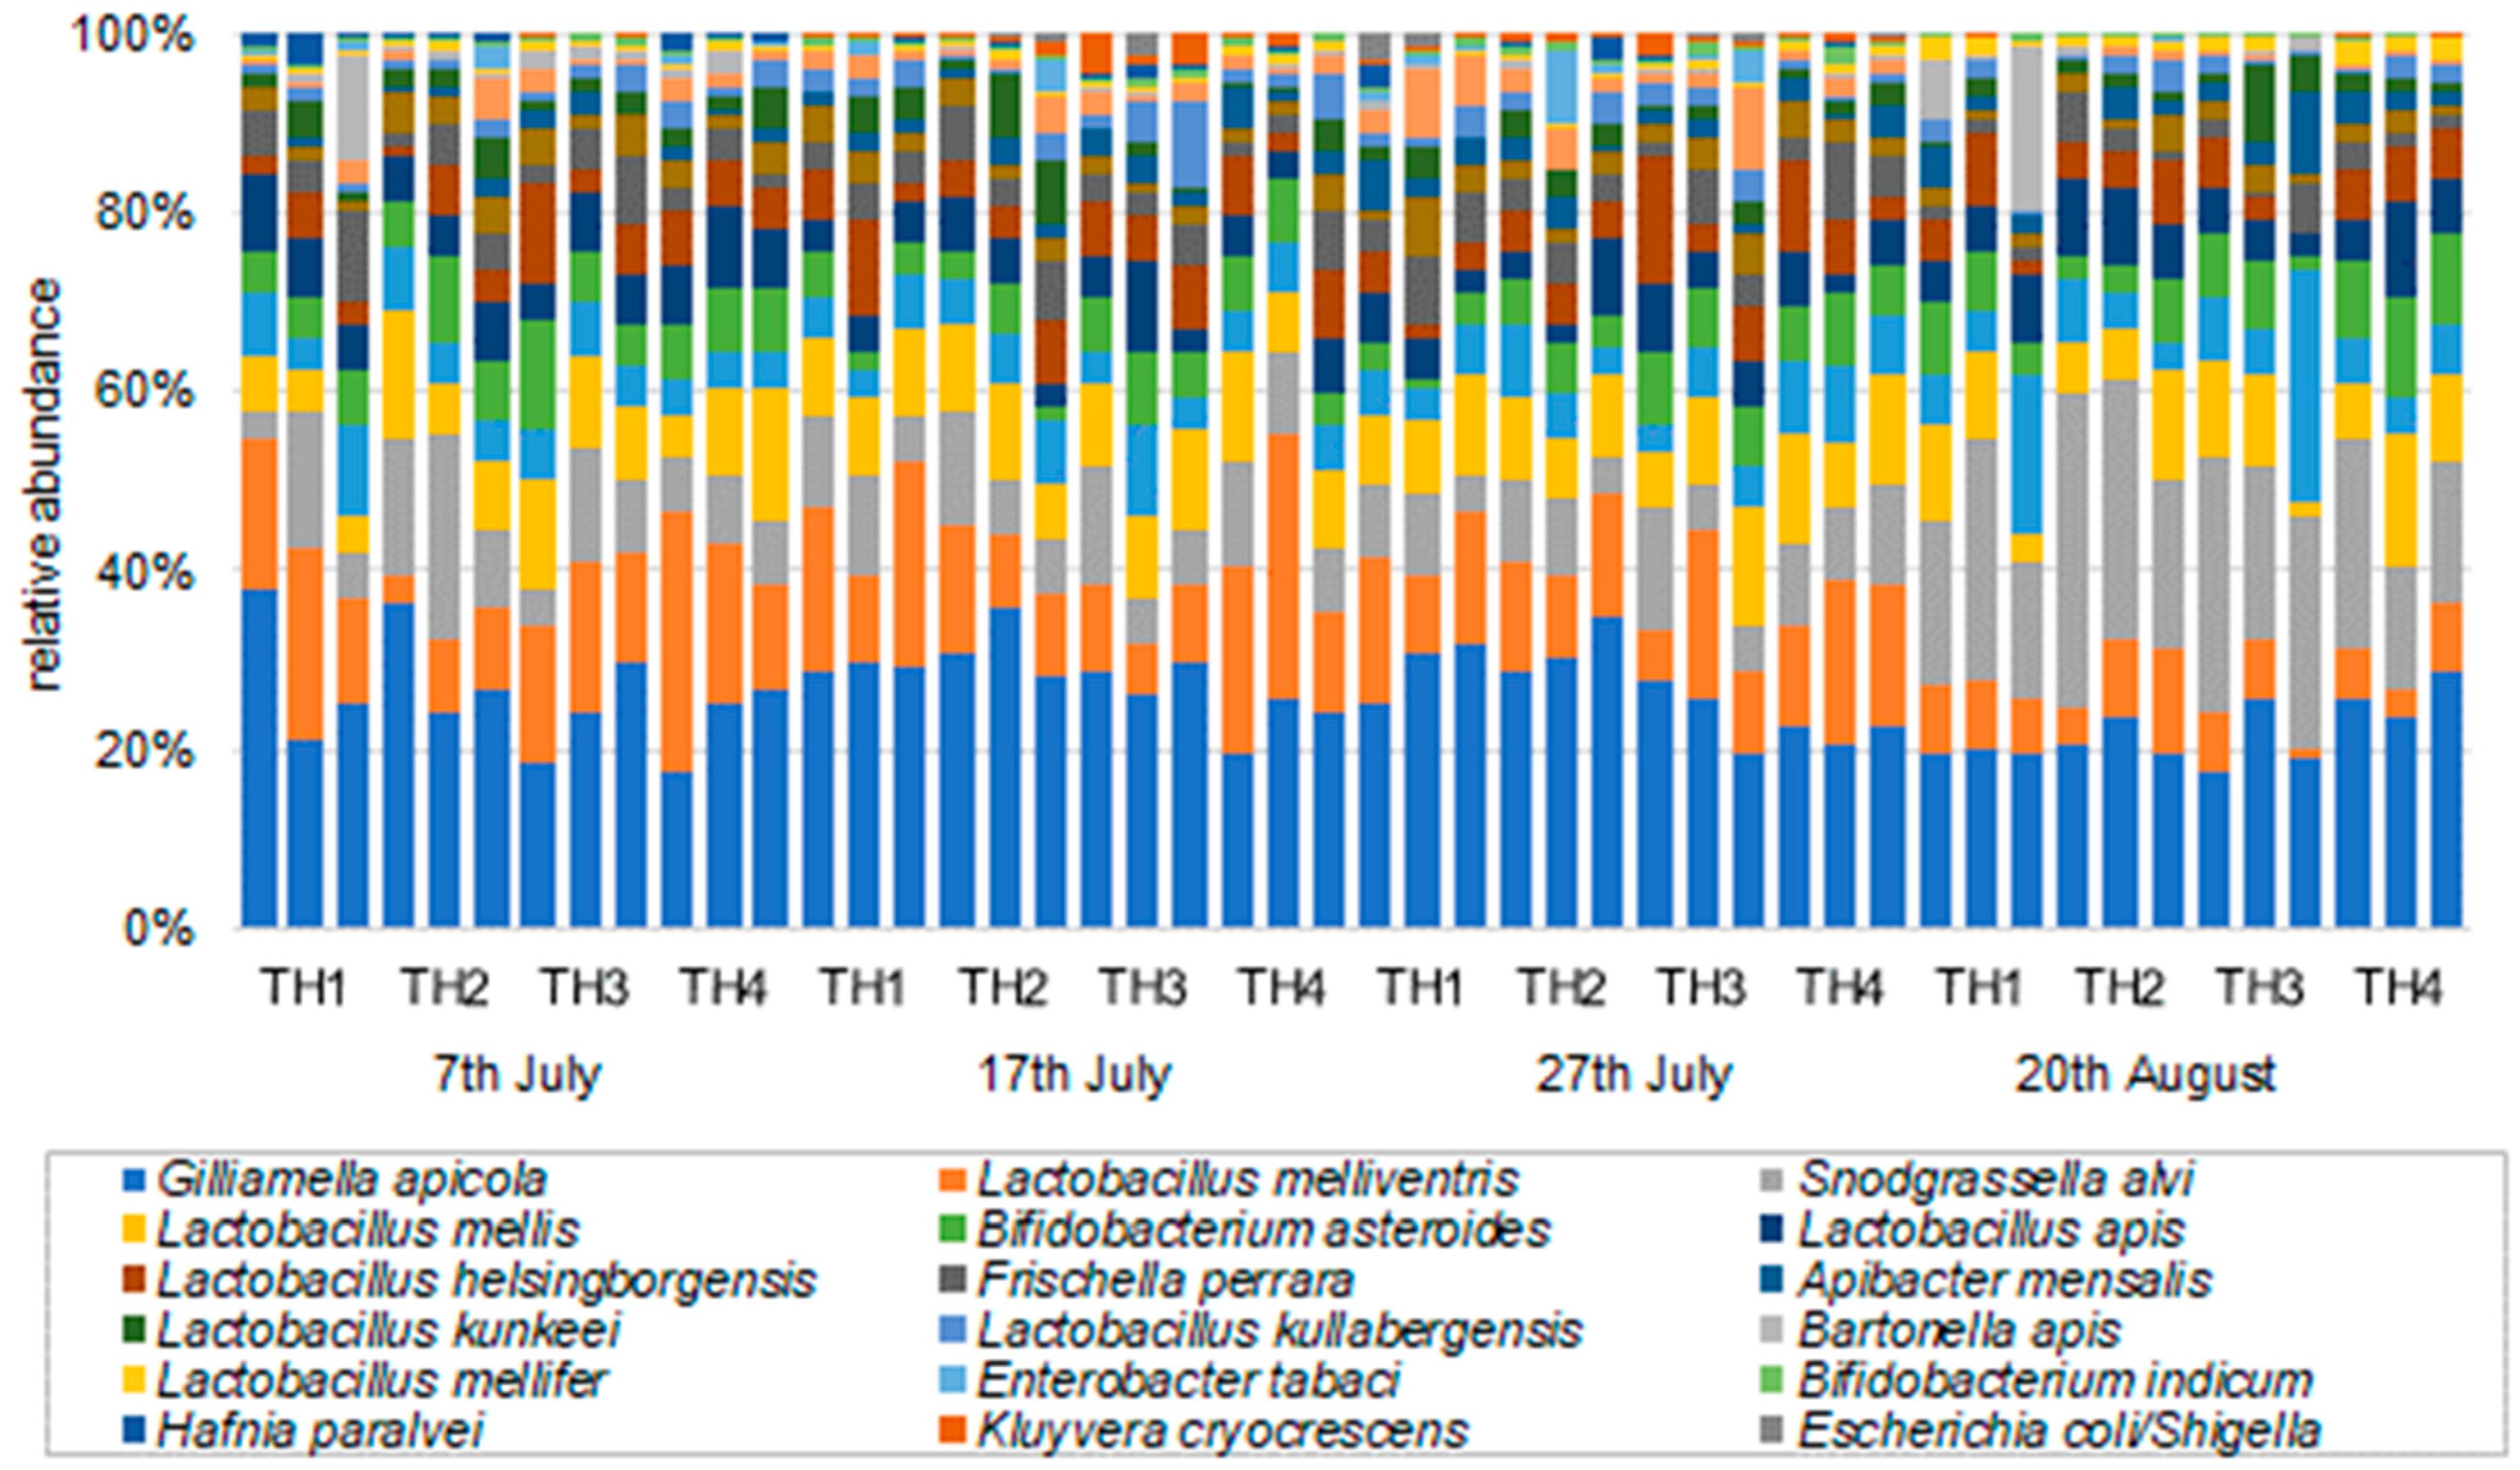
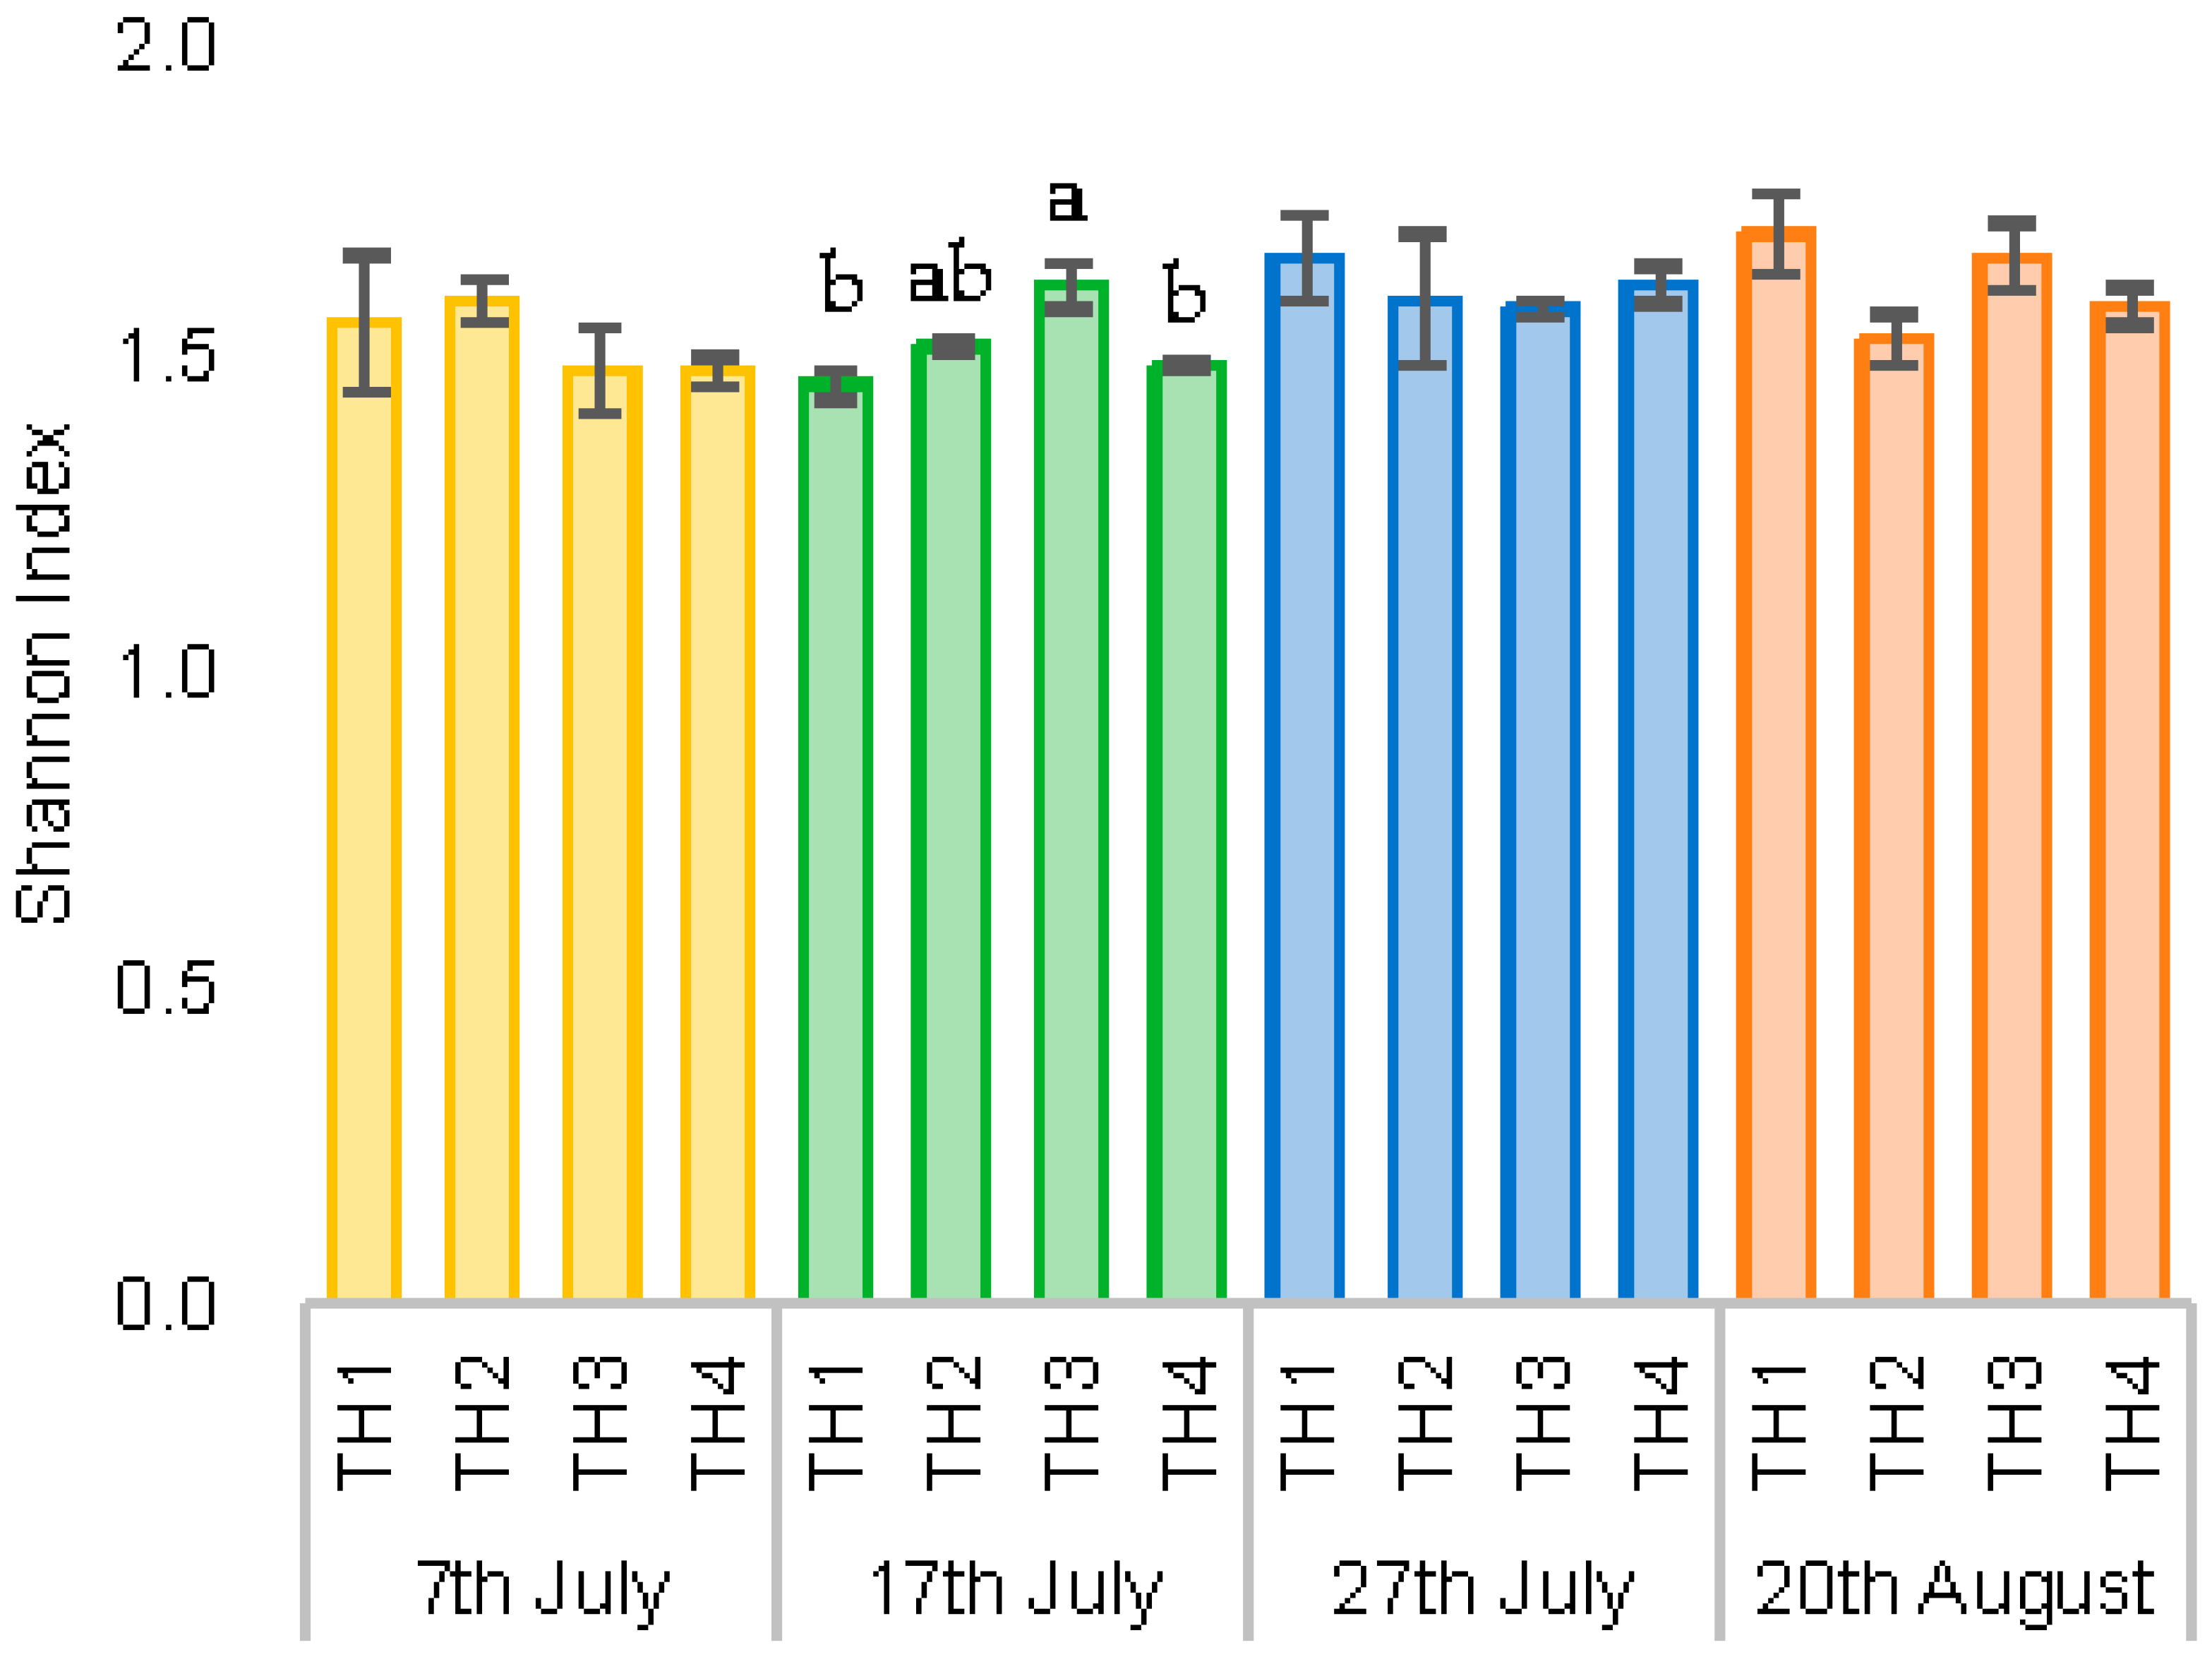
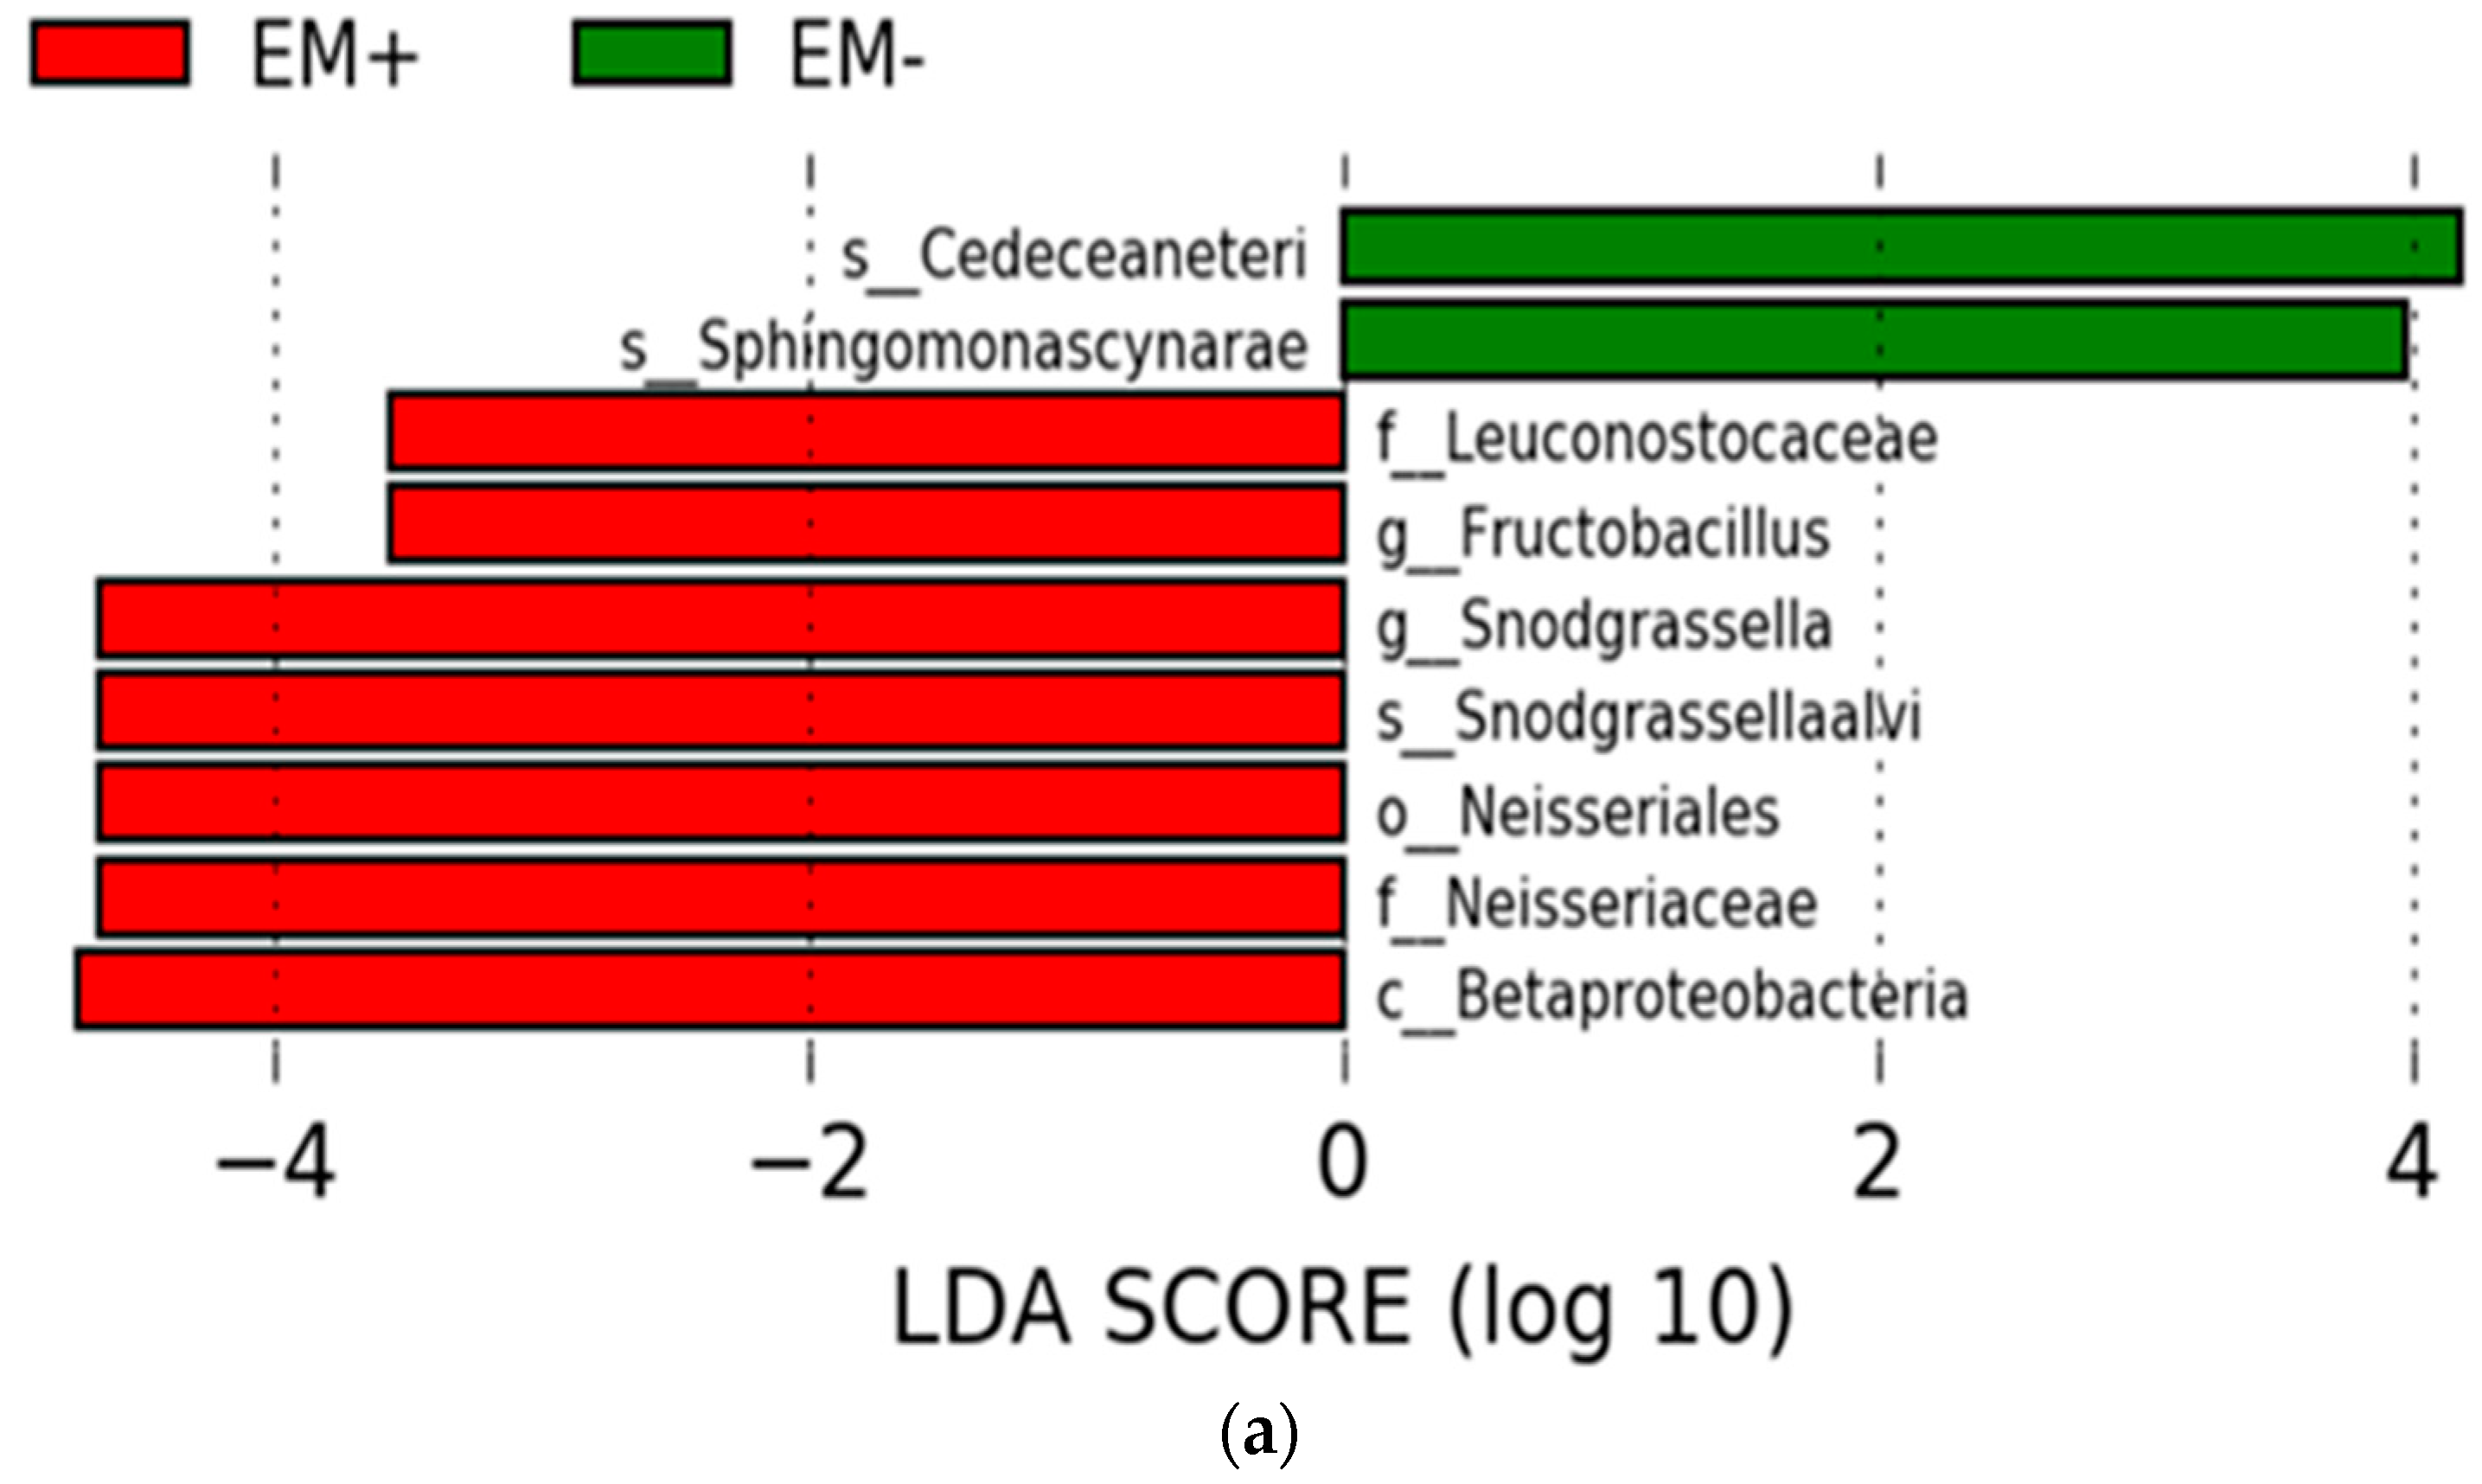
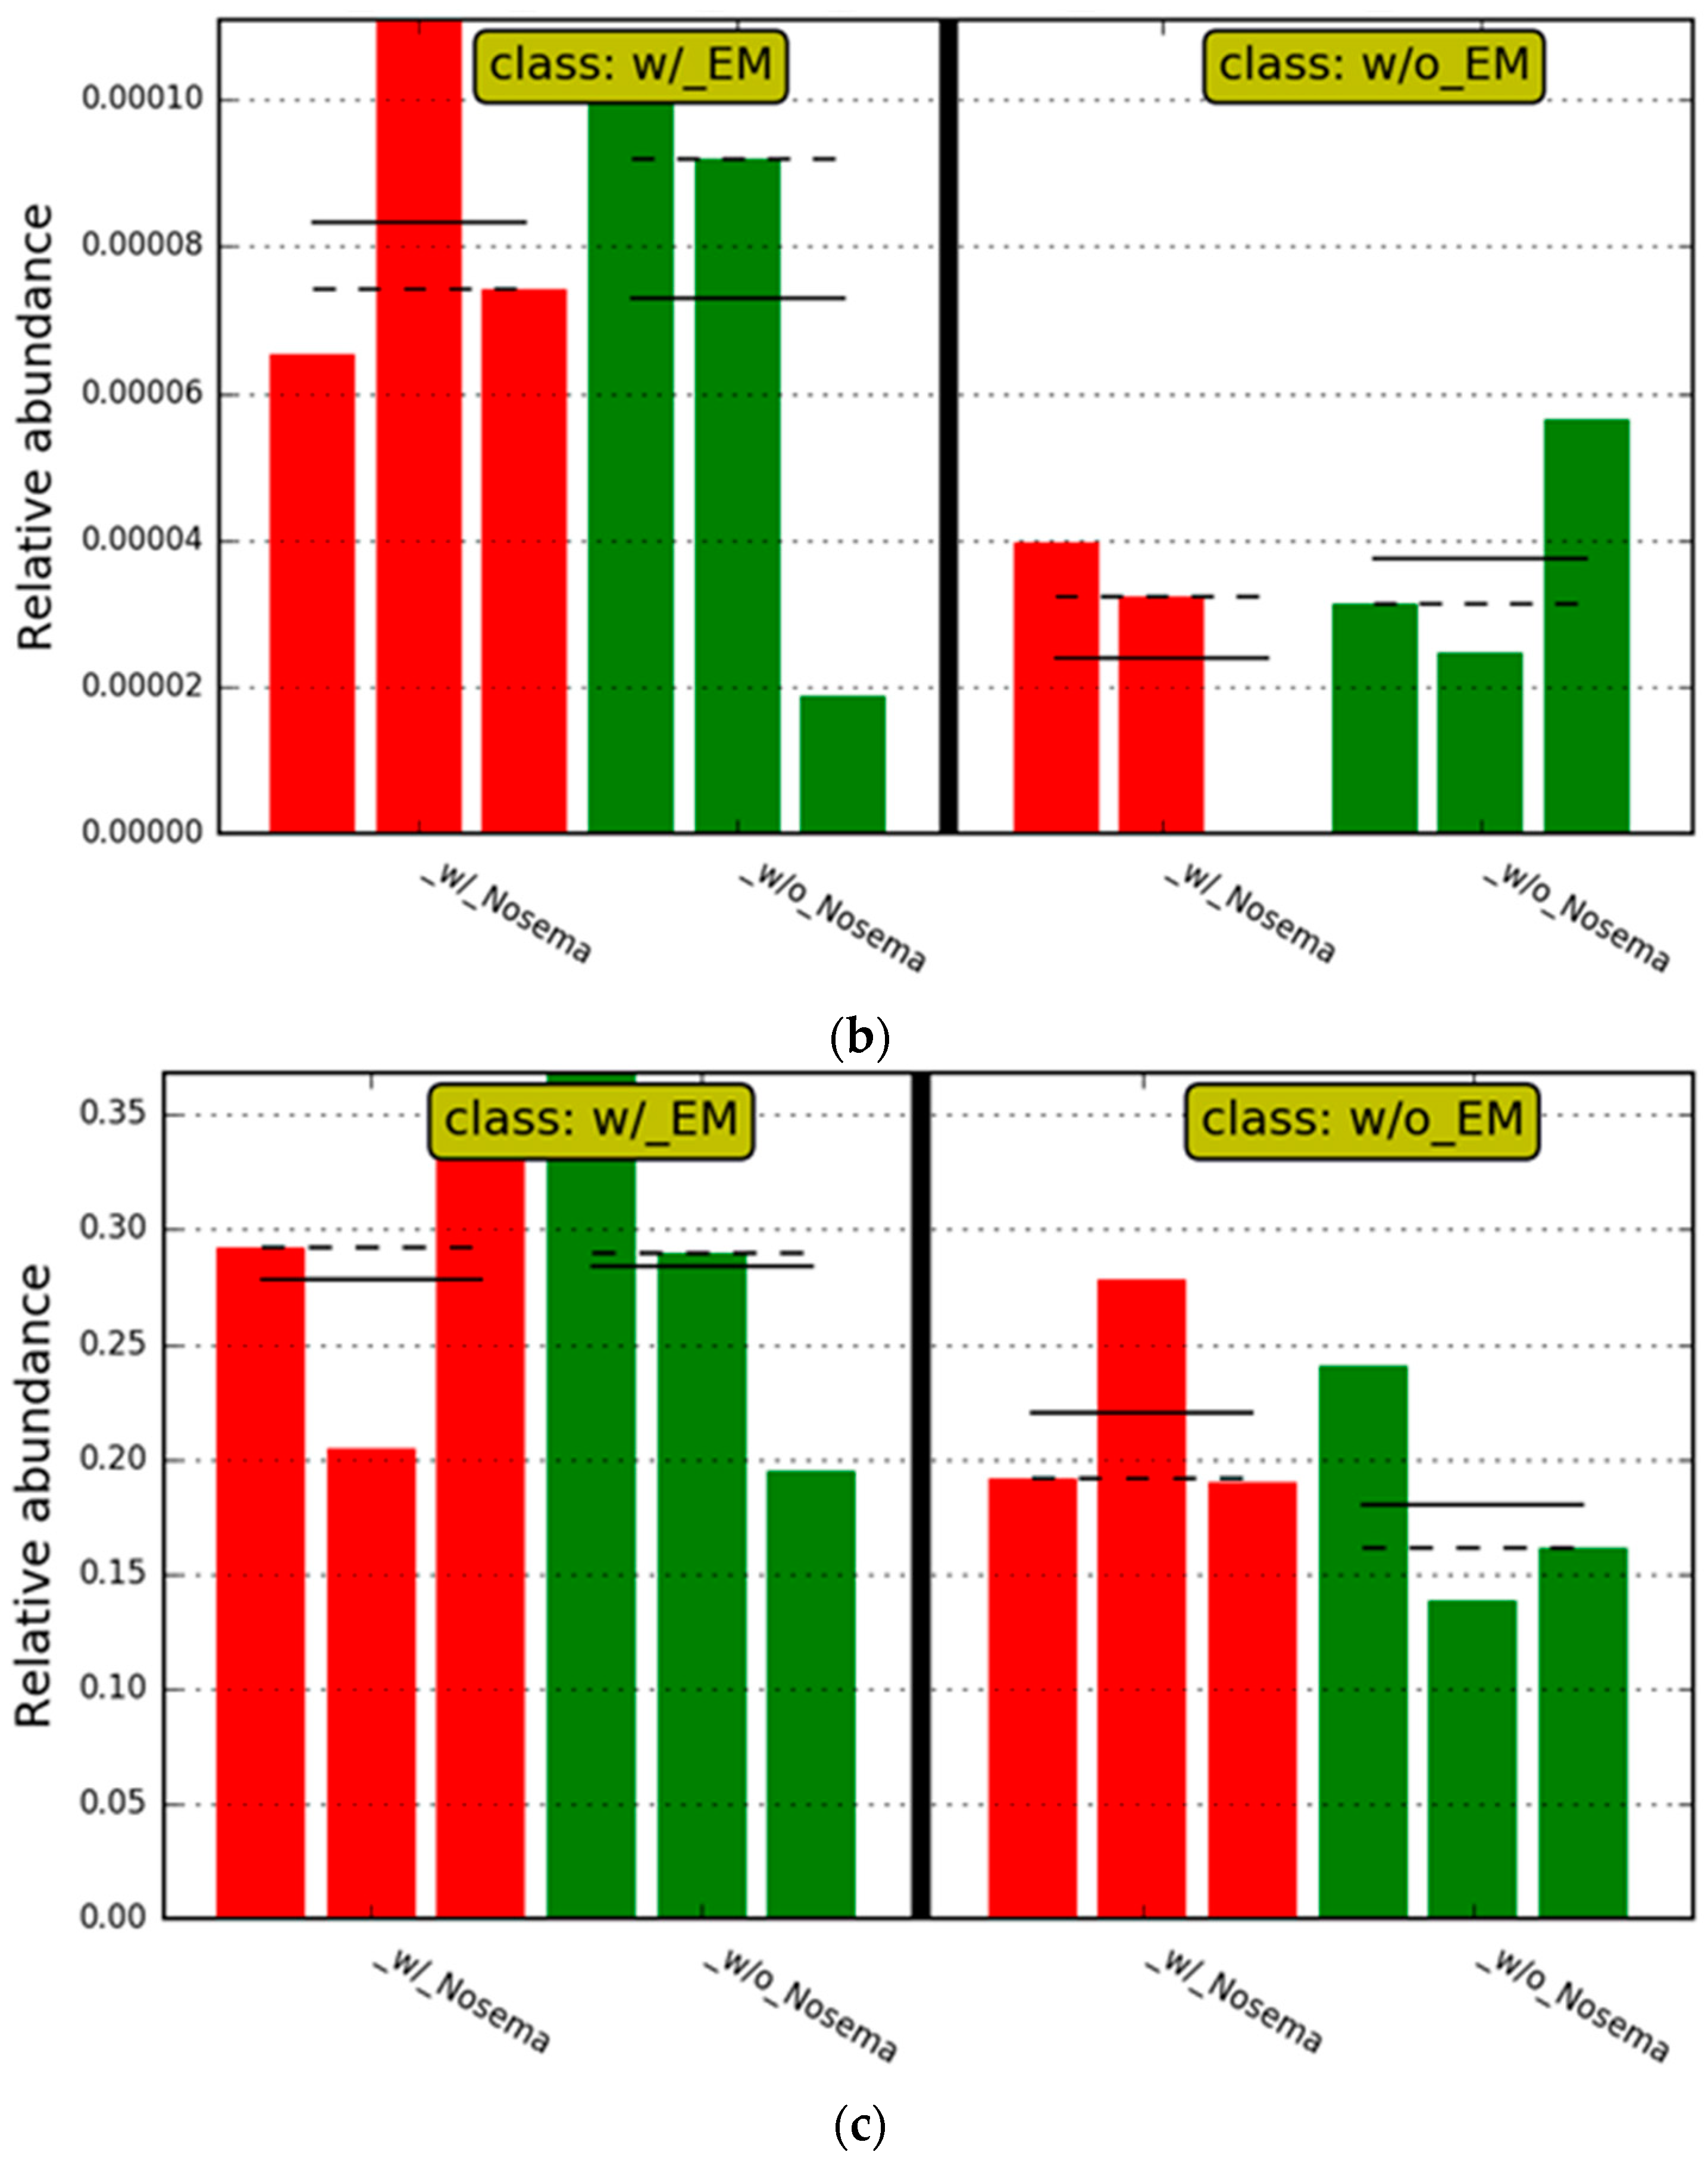
3.2.2. The Estimation of Intestinal Microbiota Composition, Richness, and Diversity
4. Discussion
5. Conclusions
Supplementary Materials
Author Contributions
Funding
Data Availability Statement
Acknowledgments
Conflicts of Interest
References
- Klein, A.M.; Vaissiere, B.E.; Cane, J.H.; Steffan-Dewenter, I.; Cunningham, S.A.; Kremen, C.; Tscharntke, T. Importance of pollinators in changing landscapes for world crops. Proc. R. Soc. B Biol. Sci. 2007, 274, 303–313. [Google Scholar] [CrossRef] [PubMed] [Green Version]
- Fontaine, C.; Dajoz, I.; Meriguet, J.; Loreau, M. Functional Diversity of Plant–Pollinator Interaction Webs Enhances the Persistence of Plant Communities. PLoS Biol. 2006, 4, e1. [Google Scholar] [CrossRef] [PubMed]
- Rollin, O.; Benelli, G.; Benvenuti, S.; Decourtye, A.; Wratten, S.D.; Canale, A.; Desneux, N. Weed-insect pollinator networks as bioindicators of ecological sustainability in agriculture. A review. Agron. Sustain. Dev. 2016, 36, 8. [Google Scholar] [CrossRef] [Green Version]
- Ellegaard, K.M.; Engel, P. Genomic diversity landscape of the honey bee gut microbiome. Nat. Commun. 2019, 10, 446. [Google Scholar] [CrossRef] [Green Version]
- Tlak Gajger, I.; Sakač, M.; Gregorc, A. Impact of Thiamethoxam on Honey Bee Queen (Apis mellifera carnica) Reproductive Morphology and Physiology. Bull. Environ. Contam. Toxicol. 2017, 99, 297–302. [Google Scholar] [CrossRef]
- Goulson, D.; Nicholls, E.; Botías, C.; Rotheray, E.L. Bee declines driven by combined stress from parasites, pesticides, and lack of flowers. Science 2015, 347, 6229. [Google Scholar] [CrossRef] [PubMed]
- Raymann, K.; Moran, N.A. The role of the gut microbiome in health and disease of adult honey bee workers. Curr. Opin. Insect Sci. 2018, 26, 97–104. [Google Scholar] [CrossRef] [PubMed]
- Alaux, C.; Brunet, J.L.; Dussaubat, C.; Mondet, F.; Tchamitchan, S.; Cousin, M.; Brillard, J.; Baldy, A.; Belzunces, L.P.; Le Conte, Y. Interactions between Nosema microspores and a neonicotinoid weaken honeybees (Apis mellifera). Environ. Microbiol. 2010, 12, 774–782. [Google Scholar] [CrossRef] [Green Version]
- Di Pasquale, G.; Salignon, M.; Le Conte, Y.; Belzunces, L.P.; Decourtye, A.; Kretzschmar, A.; Suchail, S.; Brunet, J.-L.; Alaux, C. Influence of Pollen Nutrition on Honey Bee Health: Do Pollen Quality and Diversity Matter? PLoS ONE 2013, 8, e72016. [Google Scholar] [CrossRef] [Green Version]
- Gilioli, G.; Sperandio, G.; Hatjina, F.; Simonetto, A. Towards the development of an index for the holistic assessment of the health status of a honey bee colony. Ecol. Indic. 2019, 101, 341–347. [Google Scholar] [CrossRef]
- Sperandio, G.; Simonetto, A.; Carnesecchi, E.; Costa, C.; Hatjina, F.; Tosi, S.; Gilioli, G. Beekeeping and honey bee colony health: A review and conceptualization of beekeeping management practices implemented in Europe. Sci. Total Environ. 2019, 696, 133795. [Google Scholar] [CrossRef]
- Tlak Gajger, I.; Mañes, A.M.; Formato, G.; Mortarino, M.; Toporcak, J. Veterinarians and beekeeping: What roles, expectations and future perspectives?—A review paper. Vet. Arhiv 2021, 91, 437–443. [Google Scholar] [CrossRef]
- Zheng, H.; Steele, M.I.; Leonard, S.P.; Motta, E.V.S.; Moran, N.A. Honey bees as models for gut microbiome research. Lab. Anim. 2018, 47, 317–325. [Google Scholar] [CrossRef] [PubMed]
- Engel, P.; Martinson, V.G.; Moran, N.A. Functional diversity within the simple gut microbiome of the honey bee. Proc. Natl. Acad. Sci. USA 2012, 109, 11002–11007. [Google Scholar] [CrossRef] [PubMed] [Green Version]
- Vásquez, A.; Forsgren, E.; Fries, I.; Paxton, R.J.; Flaberg, E.; Szekely, L.; Olofsson, T.C. Symbionts as major modulators of insect health: Lactic acid bacteria and honeybees. PLoS ONE 2012, 7, e33188. [Google Scholar] [CrossRef]
- Nowak, A.; Szczuka, D.; Górczyńska, A.; Motyl, I.; Kręgiel, D. Characterization of Apis mellifera Gastrointestinal Microbiome and Lactic Acid Bacteria for Honeybee Protection—A Review. Cells 2021, 10, 701. [Google Scholar] [CrossRef]
- Callegari, M.; Crotti, E.; Fusi, M.; Marasco, R.; Gonella, E.; Denoni, I.; Romano, D.; Borin, S.; Tsiamis, G.; Cherif, A.; et al. Compartmentalization of bacterial and fungal microbiomes in the gut of adult honeybees. npj Biofilms Microbiomes 2021, 7, 42. [Google Scholar] [CrossRef]
- Anderson, K.E.; Ricigliano, V.A.; Copeland, D.C.; Mott, B.M.; Maes, P. Social Interaction is Unnecessary for Hindgut Microbiome Transmission in Honey Bees: The Efect of Diet and Social Exposure on Tissue-Specifc Microbiome Assembly. Microbial Ecol. 2022. [Google Scholar] [CrossRef]
- Kešnerová, L.; Mars, R.A.T.; Ellegaard, K.M.; Troilo, M.; Sauer, U.; Engel, P. Disentangling metabolic functions of bacteria in the honey bee gut. PLoS Biol. 2017, 15, e2003467. [Google Scholar] [CrossRef] [Green Version]
- Kwong, W.K.; Zheng, H.; Moran, N.A. Convergent evolution of a modified, acetate-driven TCA cycle in bacteria. Nat. Microbiol. 2017, 2, 17067. [Google Scholar] [CrossRef] [Green Version]
- Lee, F.J.; Miller, K.I.; McKinlay, J.B.; Newton, I.L.G. Differential carbohydrate utilization and organic acid production by honey bee symbionts. FEMS Microbiol. Ecol. 2018, 94, 1–10. [Google Scholar] [CrossRef] [PubMed] [Green Version]
- Kwong, W.K.; Moran, N.A. Gut microbial communities of social bees. Nat. Rev. Microbiol. 2016, 14, 374–384. [Google Scholar] [CrossRef] [PubMed] [Green Version]
- Wang, S.; Wang, L.; Fan, X.; Yu, C.; Feng, L.; Yi, L. An insight into diversity and functionalities of gut microbiome in insects. Curr. Microbiol. 2020, 77, 1976–1986. [Google Scholar] [CrossRef] [PubMed]
- Pernice, M.; Simpson, S.J.; Ponton, F. Towards an integrated understanding of gut microbiome using insects as model systems. J. Insect Physiol. 2014, 69, 12–18. [Google Scholar] [CrossRef] [PubMed]
- Jing, T.-Z.; Qi, F.-H.; Wang, Z.-Y. Most dominant roles of insect gut bacteria: Digestion. detoxification or essential nutrient provision? Microbiome 2020, 8, 38. [Google Scholar] [CrossRef] [PubMed] [Green Version]
- Shi, W.; Syrenne, R.; Sun, J.-Z.; Yuan, J.S. Molecular approaches to study the insect gut symbiotic microbiome at the “omics” age. Insect Sci. 2010, 17, 199–219. [Google Scholar] [CrossRef]
- Lee, F.J.; Rusch, D.B.; Stewart, F.J.; Mattila, H.R.; Newton, I.L.G. Saccharide breakdown and fermentation by the honey bee gut microbiome. Environ. Microbiol. 2015, 17, 796–815. [Google Scholar] [CrossRef] [PubMed]
- Parker, A.; Lawson, M.A.E.; Vaux, L.; Pin, C. Host-microbe interaction in the gastrointestinal tract. Environ. Microbiol. 2018, 20, 2337–2353. [Google Scholar] [CrossRef] [Green Version]
- Dillon, R.J.; Vennard, C.T.; Charnley, A.K. A note: Gut bacteria produce components of a locust cohesion pheromone. J. Appl. Microbiol. 2002, 92, 759–763. [Google Scholar] [CrossRef]
- Maes, P.W.; Rodrigues, P.A.P.; Oliver, R.; Mott, B.M.; Anderson, K.E. Diet-related gut bacterial dysbiosis correlates with impaired development, increased mortality and Nosema disease in the honeybee (Apis mellifera). Mol. Ecol. 2016, 25, 5439–5450. [Google Scholar] [CrossRef]
- Anderson, K.E.; Ricigliano, V.A. Honey bee gut dysbiosis: A novel context of disease ecology. Curr. Opin. Insect Sci. 2017, 22, 125–132. [Google Scholar] [CrossRef] [PubMed]
- Morimoto, T.; Kojima, Y.; Toki, T.; Komeda, Y.; Yoshiyama, M.; Kimura, K.; Nirasawa, K.; Kadowaki, T. The habitat disruption induces immune-suppression and oxidative stress in honey bees. Ecol. Evol. 2011, 1, 201–217. [Google Scholar] [CrossRef] [PubMed]
- Paris, L.; Peghaire, E.; Moné, A.; Diogon, M.; Debroas, D.; Delbac, F.; El Alaoui, H. Honeybee gut microbiome dysbiosis in pesticide/parasite co-exposures is mainly induced by Nosema ceranae. J. Invertebr. Pathol. 2020, 172, 107348. [Google Scholar] [CrossRef]
- Rouzé, R.; Moné, A.; Delbac, F.; Belzunces, L.; Blot, N. The Honeybee Gut Microbiome Is Altered after Chronic Exposure to Different Families of Insecticides and Infection by Nosema ceranae. Microbes Environ. 2019, 34, 226–233. [Google Scholar] [CrossRef] [Green Version]
- Panjad, P.; Yongsawas, R.; Sinpoo, C.; Pakwan, C.; Subta, P.; Krongdang, S.; In-on, A.; Chomdej, S.; Chantawannakul, P.; Disayathanoowat, T. Impact of Nosema Disease and American Foulbrood on Gut Bacterial Communities of Honeybees Apis mellifera. Insects 2021, 12, 525. [Google Scholar] [CrossRef] [PubMed]
- Castelli, L.; Balbuena, S.; Branchiccela, B.; Zunino, P.; Liberti, J.; Engel, P.; Antúnez, K. Impact of Chronic Exposure to Sublethal Doses of Glyphosate on Honey Bee Immunity, Gut Microbiome and Infection by Pathogens. Microorganisms 2021, 9, 845. [Google Scholar] [CrossRef] [PubMed]
- Cuesta-Mate, A.; Renelies-Hamilton, J.; Kryger, P.; Jansen, A.B.; Sinotte, V.M.; Poulsen, M. Resistance and vulnerability of honeybee (Apis mellifera) gut bacteria to commonly used pesticides. Front. Microbol. 2021, 12, 717990. [Google Scholar] [CrossRef]
- Pătruică, S.; Mot, D. The effect of using prebiotic and probiotic products on intestinal micro-flora of the honeybee (Apis mellifera carpatica). Bull. Entomol. Res. 2012, 102, 619–623. [Google Scholar] [CrossRef]
- Pătruică, S.; Dumitrescu, G.; Stancu, A.; Bura, M.; Dunea, I.B. The Effect of Prebiotic and Probiotic Feed Supplementation on the Wax Glands of Worker Bees (Apis mellifera). Anim. Sci. Biotechnol. 2012, 45, 268–271. [Google Scholar]
- Pătruică, S.; Hutu, I. Economic benefits of using prebiotic and probiotic products as supplements in stimulation feeds administered to bee colonies. Turk. J. Vet. Anim. Sci. 2013, 37, 259–263. [Google Scholar]
- Andrearczyk, S.; Kadhim, M.J.; Knaga, S. Influence of a probiotic on mortality, sugar syrup ingestion and infection of honeybees with Nosema spp. under laboratory assessment. Med. Weter. 2014, 70, 762–765. [Google Scholar]
- Arredondo, D.; Castelli, L.; Porrini, M.P.; Garrido, P.M.; Eguaras, M.J.; Zunino, P.; Antunez, K. Lactobacillus kunkeei strains decreased the infection by honey bee pathogens Paenibacillus larvae and Nosema ceranae. Benef. Microbes 2018, 9, 279–290. [Google Scholar] [CrossRef] [PubMed]
- Ptaszyńska, A.A.; Borsuk, G.; Mułenko, W.; Wilk, J. Impact of vertebrate probiotics on honeybee yeast microbiome and on the course of nosemosis. Med. Weter 2016, 72, 430–434. [Google Scholar]
- Daisley, B.A.; Pitek, A.P.; Chmiel, J.A.; Al, K.F.; Chernyshova, A.M.; Faragalla, K.M.; Burton, J.P.; Thompson, G.J.; Reid, J. Novel probiotic approach to counter Paenibacillus larvae infection in honey bees. ISME J. 2020, 14, 476–491. [Google Scholar] [CrossRef] [Green Version]
- Stephan, J.G.; Lamei, S.; Pettis, J.S.; Riesbeck, K.; De Miranda, J.R.; Forsgren, E. Honeybee-specific lactic acid bacterium supplements have no effect on American Foulbrood-infected honeybee colonies. Appl. Environ. Microbiol. 2019, 85, e00606-19. [Google Scholar] [CrossRef] [Green Version]
- Dussaubat, C.; Brunet, J.-L.; Higes, M.; Colbourne, J.K.; López, J.; Choi, J.-H.; Martin-Hernandez, R.; Botías, C.; Cousin, M.; Mcdonnell, C.; et al. Gut pathology and responses to the microsporidium Nosema ceranae in the honey bee Apis mellifera. PLoS ONE 2012, 7, e37017. [Google Scholar] [CrossRef] [Green Version]
- Tlak Gajger, I.; Vugrek, O.; Pinter, L.; Petrinec, Z. “Nozevit patties” treatment of honeybees (Apis mellifera) for the control of Nosema ceranae disease. Am. Bee J. 2009, 149, 1053–1056. [Google Scholar]
- Tlak Gajger, I.; Kozaric, Z.; Berta, D.; Nejedli, S.; Petrinec, Z. Effect of the herbal preparation Nozevit on the mid-gut structure of honeybees (Apis mellifera) infected with Nosema spp. spores. Vet. Med. 2011, 56, 343–350. [Google Scholar] [CrossRef] [Green Version]
- Tlak Gajger, I. Nozevit aerosol application for Nosema ceranae disease treatment. Am. Bee J. 2011, 151, 1087–1090. [Google Scholar]
- Tlak Gajger, I.; Smodiš Škerl, M.I.; Šoštarić, P.; Šuran, J.; Sikirić, P.; Vlainić, J. Physiological and Immunological Status of Adult Honeybees (Apis mellifera) Fed Sugar Syrup Supplemented with Pentadecapeptide BPC 157. Biology 2021, 10, 891. [Google Scholar] [CrossRef]
- Tlak Gajger, I.; Ribarić, J.; Smodiš Škerl, I.M.; Vlainić, J.; Sikirić, P. Stable gastric pentadecapeptide BPC 157 in honeybee (Apis mellifera) therapy, to control Nosema ceranae invasions in apiary conditions. J. Vet. Pharmacol. Therap. 2018, 41, 614–621. [Google Scholar] [CrossRef] [PubMed]
- Tlak Gajger, I.; Ribaric, J.; Matak, M.; Svecnjak, L.; Kozaric, Z.; Nejedli, S.; Smodis Skerl, I.M. Zeolite clinoptilolite as a dietary supplement and remedy for honeybee (Apis mellifera L.) colonies. Veternarni Med. 2015, 60, 696–705. [Google Scholar] [CrossRef] [Green Version]
- Tlak Gajger, I.; Vlainić, J.; Šoštarić, P.; Prešern, J.; Bubnič, J.; Smodiš Škerl, M.I. Effects on Some Therapeutical, Biochemical, and Immunological Parameters of Honey Bee (Apis mellifera) Exposed to Probiotic Treatments, in Field and Laboratory Conditions. Insects 2020, 11, 638. [Google Scholar] [CrossRef] [PubMed]
- Delaplane, K.S.; Van Der Steen, J.; Guzman-Novoa, E. Standard methods for estimating strength parameters of Apis mellifera colonies. J. Apic. Res. 2013, 52, 1–12. [Google Scholar] [CrossRef]
- OIE—Office International des Epizooties. Chapter 2.2.4., Nosemosis of Honey Bees. In Manual of Diagnostic Tests and Vaccines for Terrestrial Animals; OIE: Pairs, France, 2013; Available online: http://www.oie.int/international-standard-setting/terrestrial-manual/access-online (accessed on 20 May 2022).
- Takahashi, S.; Tomita, J.; Nishioka, K.; Hisada, T.; Nishijima, M. Development of a Prokaryotic Universal Primer for Simultaneous Analysis of Bacteria and Archaea Using Next-Generation Sequencing. PLoS ONE 2014, 9, e105592. [Google Scholar] [CrossRef] [Green Version]
- Nguyen, N.P.; Warnow, T.; Pop, M.; White, B. A perspective on 16S rRNA operational taxonomic unit clustering using sequence similarity. npj Biofilms Microbiomes 2016, 2, 16004. [Google Scholar] [CrossRef] [Green Version]
- Hisada, T.; Endoh, K.; Kuriki, K. Inter-and intra-individual variations in seasonal and daily stabilities of the human gut microbiome in Japanese. Arch. Microbiol. 2015, 197, 919–934. [Google Scholar] [CrossRef] [Green Version]
- Aronesty, E. Comparison of sequencing utility programs. Open Bioinform. J. 2013, 7, 1–8. [Google Scholar] [CrossRef] [Green Version]
- Gordon, A.; Hannon, G.J. FASTX-Toolkit FASTQ/A Short-Reads Preprocessing Tools. Available online: http://hannonlab.cshl.edu/fastx_toolkit/index.html (accessed on 30 January 2023).
- Caporaso, J.G.; Kuczynski, J.; Stombaugh, J.; Bittinger, K.; Bushman, F.D.; Costello, E.K.; Fierer, N.; Peña, A.G.; Goodrich, J.K.; Gordon, J.I.; et al. QIIME allows analysis of high-throughput community sequencing data. Nat. Methods 2010, 7, 335336. [Google Scholar] [CrossRef] [Green Version]
- Edgar, R.C.; Haas, B.J.; Clemente, J.C.; Quince, C.; Knight, R. UCHIME improves sensitivity and speed of chimera detection. Bioinformatics 2011, 27, 2194–2200. [Google Scholar] [CrossRef] [Green Version]
- Wang, Q.; Garrity, G.M.; Tiedje, J.M.; Cole, J.R. Naive bayesian classifier for rapid assignment of rRNA sequences into the new bacterial taxonomy. Appl. Environ. Microbiol. 2007, 73, 5261–5267. [Google Scholar] [CrossRef] [PubMed] [Green Version]
- Kasai, C.; Sugimoto, K.; Moritani, I.; Tanaka, J.; Oya, Y.; Inoue, H.; Tameda, M.; Shiraki, K.; Ito, M.; Takei, Y.; et al. Comparison of the gut microbiome composition between obese and non-obese individuals in a Japanese population, as analyzed by terminal restriction fragment length polymorphism and next-generation sequencing. BMC Gastroenterol. 2015, 15, 100. [Google Scholar] [CrossRef] [Green Version]
- Horthorn, T.; Bretz, F.; Westfall, P. Simultaneous inference in general parametric models. Biom. J. 2008, 50, 346–363. [Google Scholar] [CrossRef] [Green Version]
- Audisio, M.C.; Benítez-Ahrendts, M.R. Lactobacillus johnsonii CRL1647, isolated from Apis mellifera L. bee-gut, exhibited a beneficial effect on honeybee colonies. Benef. Microbes 2011, 2, 29–34. [Google Scholar] [CrossRef] [PubMed]
- Sabate, D.C.; Cruz, M.S.; Benitez-Ahrendts, M.R.; Audisio, M.C. Beneficial effects of Bacillus subtilis subsp. subtilis Mori2, a honey-associated strain, on honeybee colony performance. Probiot. Antimicrob. Proteins 2012, 4, 39–46. [Google Scholar] [PubMed]
- Audisio, M.C.; Sabate, D.C.; Benitez-Ahrendts, M.R. Effect of Lactibacillus johansonii CRL1647 on different parameters of honeybee colonies and bacterial populations of the bee gut. Benef. Microbes 2015, 25, 1–10. [Google Scholar]
- Alberoni, D.; Baffoni, L.; Gaggìa, F.; Ryan, P.M.; Murphy, K.; Ross, P.R.; Stanton, C.; Di Gioia, D. Impact of beneficial bacteria supplementation on the gut microbiota, colony development and productivity of Apis mellifera L. Benef. Microbes 2018, 9, 9269–9278. [Google Scholar] [CrossRef] [PubMed]
- Huang, S.K.; Ye, K.T.; Huang, W.F.; Ying, B.H.; Li, X.S.; Lin, H.; Li, J.H.; Chen, Y.P.; Li, J.L.; Bao, X.L.; et al. Influence of Feeding Type and Nosema ceranae Infection on the Gut Microbiota of Apis cerana Workers. mSystems 2018, 3, e00177-18. [Google Scholar] [CrossRef] [PubMed] [Green Version]
- Baffoni, L.; Gaggìa, F.; Alberoni, D.; Cabbri, R.; Nanetti, A.; Biavati, B.; Di Gioia, D. Effect of dietary supplementation of Bifidobacterium and Lactobacillus strains in Apis mellifera L. against Nosema ceranae. Benef. Microbes 2016, 7, 45–51. [Google Scholar] [CrossRef]
- Wu, Y.; Zheng, Y.; Chen, Y.; Chen, G.; Zheng, H.; Hu, F. Apis Cerana Gut Microbiota Contribute to Host Health Though Stimulating Host Immune System and Strengthening Host Resistance to Nosema ceranae. R. Soc. Open Sci. 2020, 7, 192100. [Google Scholar] [CrossRef]
- Corby-Harris, V.; Snyder, L.; Meador, C.; Naldo, R.; Mott, B.; Andersom, K. Parasaccharibacter apium, gen. Nov., sp. Nov., improves honey bee (Hymenoptera: Apidae) resistance to Nosema. J. Econ. Entomol. 2016, 109, 537–543. [Google Scholar] [CrossRef] [PubMed] [Green Version]
- Audisio, M.C. Gram-positive bacteria with probiotic potential for the Apis mellifera L. honey bee: The experiance in the northwest of Argentina. Probiot. Antimicrob. Proteins 2017, 9, 22–31. [Google Scholar] [CrossRef] [PubMed]
- Yoshiyama, M.; Wu, M.; Sugimura, Y.; Takaya, N.; Kimoto-Nira, H.; Suzuki, C. Inhibition of Paenibacillus larvae by lactic acid bacteria isolated from fermented materials. J. Invertebr. Pathol. 2013, 112, 62–67. [Google Scholar] [CrossRef] [PubMed]
- Fanciotti, M.N.; Tejerina, M.; Benítez Ahrendts, M.; Audisio, M.C. Honey yield of different commercial apiaries treated with Lactobacillus salivarius A3iob, a new bee-probiotic strain. Benef. Microbes 2018, 9, 291–298. [Google Scholar] [CrossRef]
- Motta, E.V.S.; Raymann, K.; Moran, N.A. Glyphosate perturbs the gut microbiota of honey bees. App. Biol. Sci. 2018, 115, 10305–10310. [Google Scholar] [CrossRef] [Green Version]
- Wang, B.; Habermehl, C.; Jiang, L. Metabolomic analysis of honey bee (Apis mellifera L.) response to glyphosate exposure. Mol. Omics. 2022, 18, 635–642. [Google Scholar] [CrossRef]
- Zeid, A.A.A.; Khattaby, A.M.; El-Khair, I.A.A.; Gouda, H.I.A. Detection Bioactive Metabolites of Fructobacillus fructosus Strain HI-1 Isolated from Honey Bee’s Digestive Tract Against Paenibacillus larvae. Probiot. Antimicrob. Proteins 2022, 14, 476–485. [Google Scholar] [CrossRef]


| Group | Spores of Nosema spp. (×106) | ||||
|---|---|---|---|---|---|
| 7th July | 17th July | 27th July | 20th August | ||
| TH1 (1N = 9) | Mean | 2.77 | 4.26 | 8.57 | 15.08 |
| SD | 1.23 | 2.67 | 6.19 | 3.65 | |
| TH2 (1N = 9) | Mean | 8.02 | 2.02 | 0.77 | 4.66 |
| SD | 10.19 | 2.88 | 0.42 | 3.02 | |
| TH3 (1N = 9) | Mean | 14.31 | 8.66 | 5.84 | 22.91 |
| SD | 8.71 | 5.68 | 4.71 | 11.88 | |
| TH4 (1N = 9) | Mean | 15.44 | 16.42 | 18.05 | 59.91 |
| SD | 12.38 | 10.62 | 10.53 | 65.53 | |
| p (Kruskall–Wallis) | 0.001 | 0.0005 | 0.0001 | 0.0001 | |
| TH | z | p | TH | z | p | TH | z | p | TH | z | p |
|---|---|---|---|---|---|---|---|---|---|---|---|
| 1:2 | −0.581781 | 0.2804 | 1:2 | 1.354283 | 0.0878 | 1:2 | 3.214710 | 0.0007 | 1:2 | 2.350559 | 0.0094 |
| 1:3 | −3.020785 | 0.0013 | 1:3 | −1.544554 | 0.0612 | 1:3 | 0.705668 | 0.2402 | 1:3 | −1.387949 | 0.0826 |
| 1:4 | −3.199795 | 0.0007 | 1:4 | −2.585449 | 0.0049 | 1:4 | −1.680162 | 0.0465 | 1:4 | −2.350559 | 0.0094 |
| 2:3 | −2.439005 | 0.0074 | 2:3 | −2.898836 | 0.0019 | 2:3 | −2.509042 | 0.0061 | 2:3 | −3.738509 | 0.0001 |
| 2:4 | −2.618014 | 0.0044 | 2:4 | −3.939731 | 0.0000 | 2:4 | −4.894872 | 0.0000 | 2:4 | −4.701119 | 0.0000 |
| 3:4 | −0.179010 | 0.4290 | 3:4 | −1.040895 | 0.1490 | 3:4 | −2.385830 | 0.0085 | 3:4 | −0.962610 | 0.1679 |
| (a) | (b) | (c) | (d) |
| GenBank Identification | 7th July | 17th July | 27th July | 20th August | ||||||||||||
|---|---|---|---|---|---|---|---|---|---|---|---|---|---|---|---|---|
| TH1 | TH2 | TH3 | TH4 | TH1 | TH2 | TH3 | TH4 | TH1 | TH2 | TH3 | TH4 | TH1 | TH2 | TH3 | TH4 | |
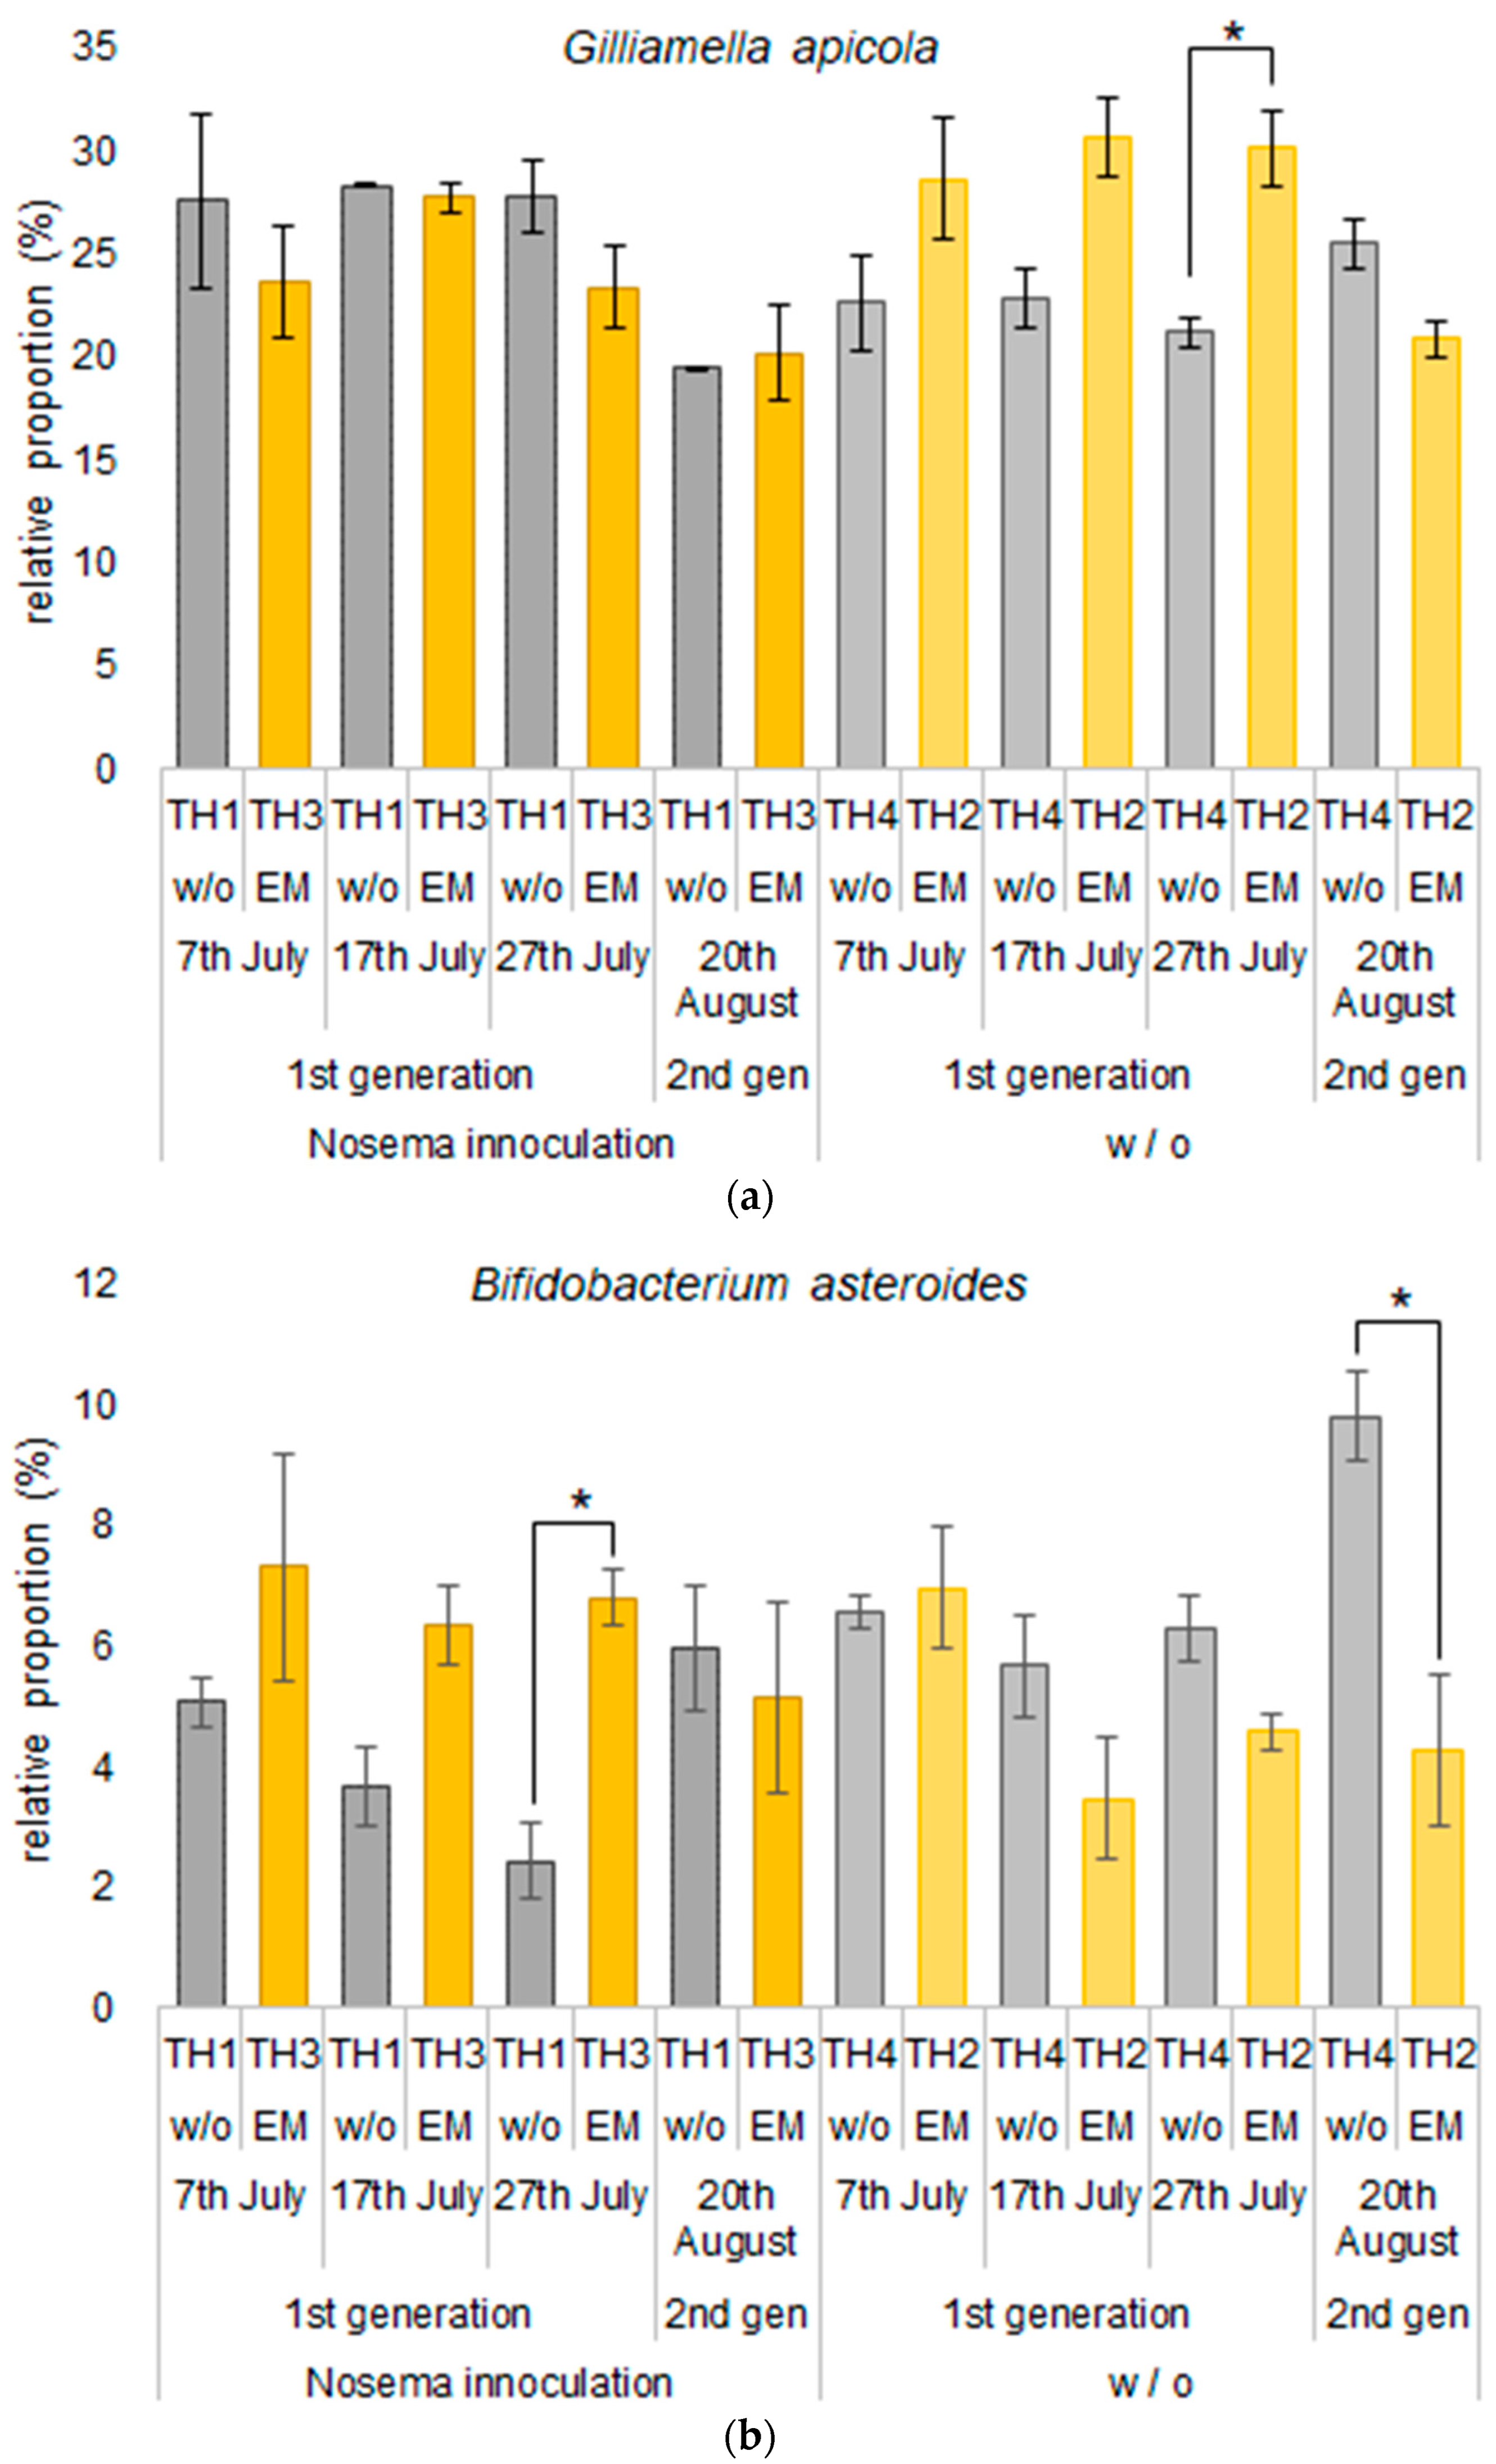
| Gilliamella apicola | 27.6 | 28.7 | 23.6 | 22.7 | 28.3 | 30.7 | 27.7 | 22.9 | 27.8 | 30.1 | 23.3 | 21.2 | 19.4 | 20.9 | 20.2 | 25.5 |
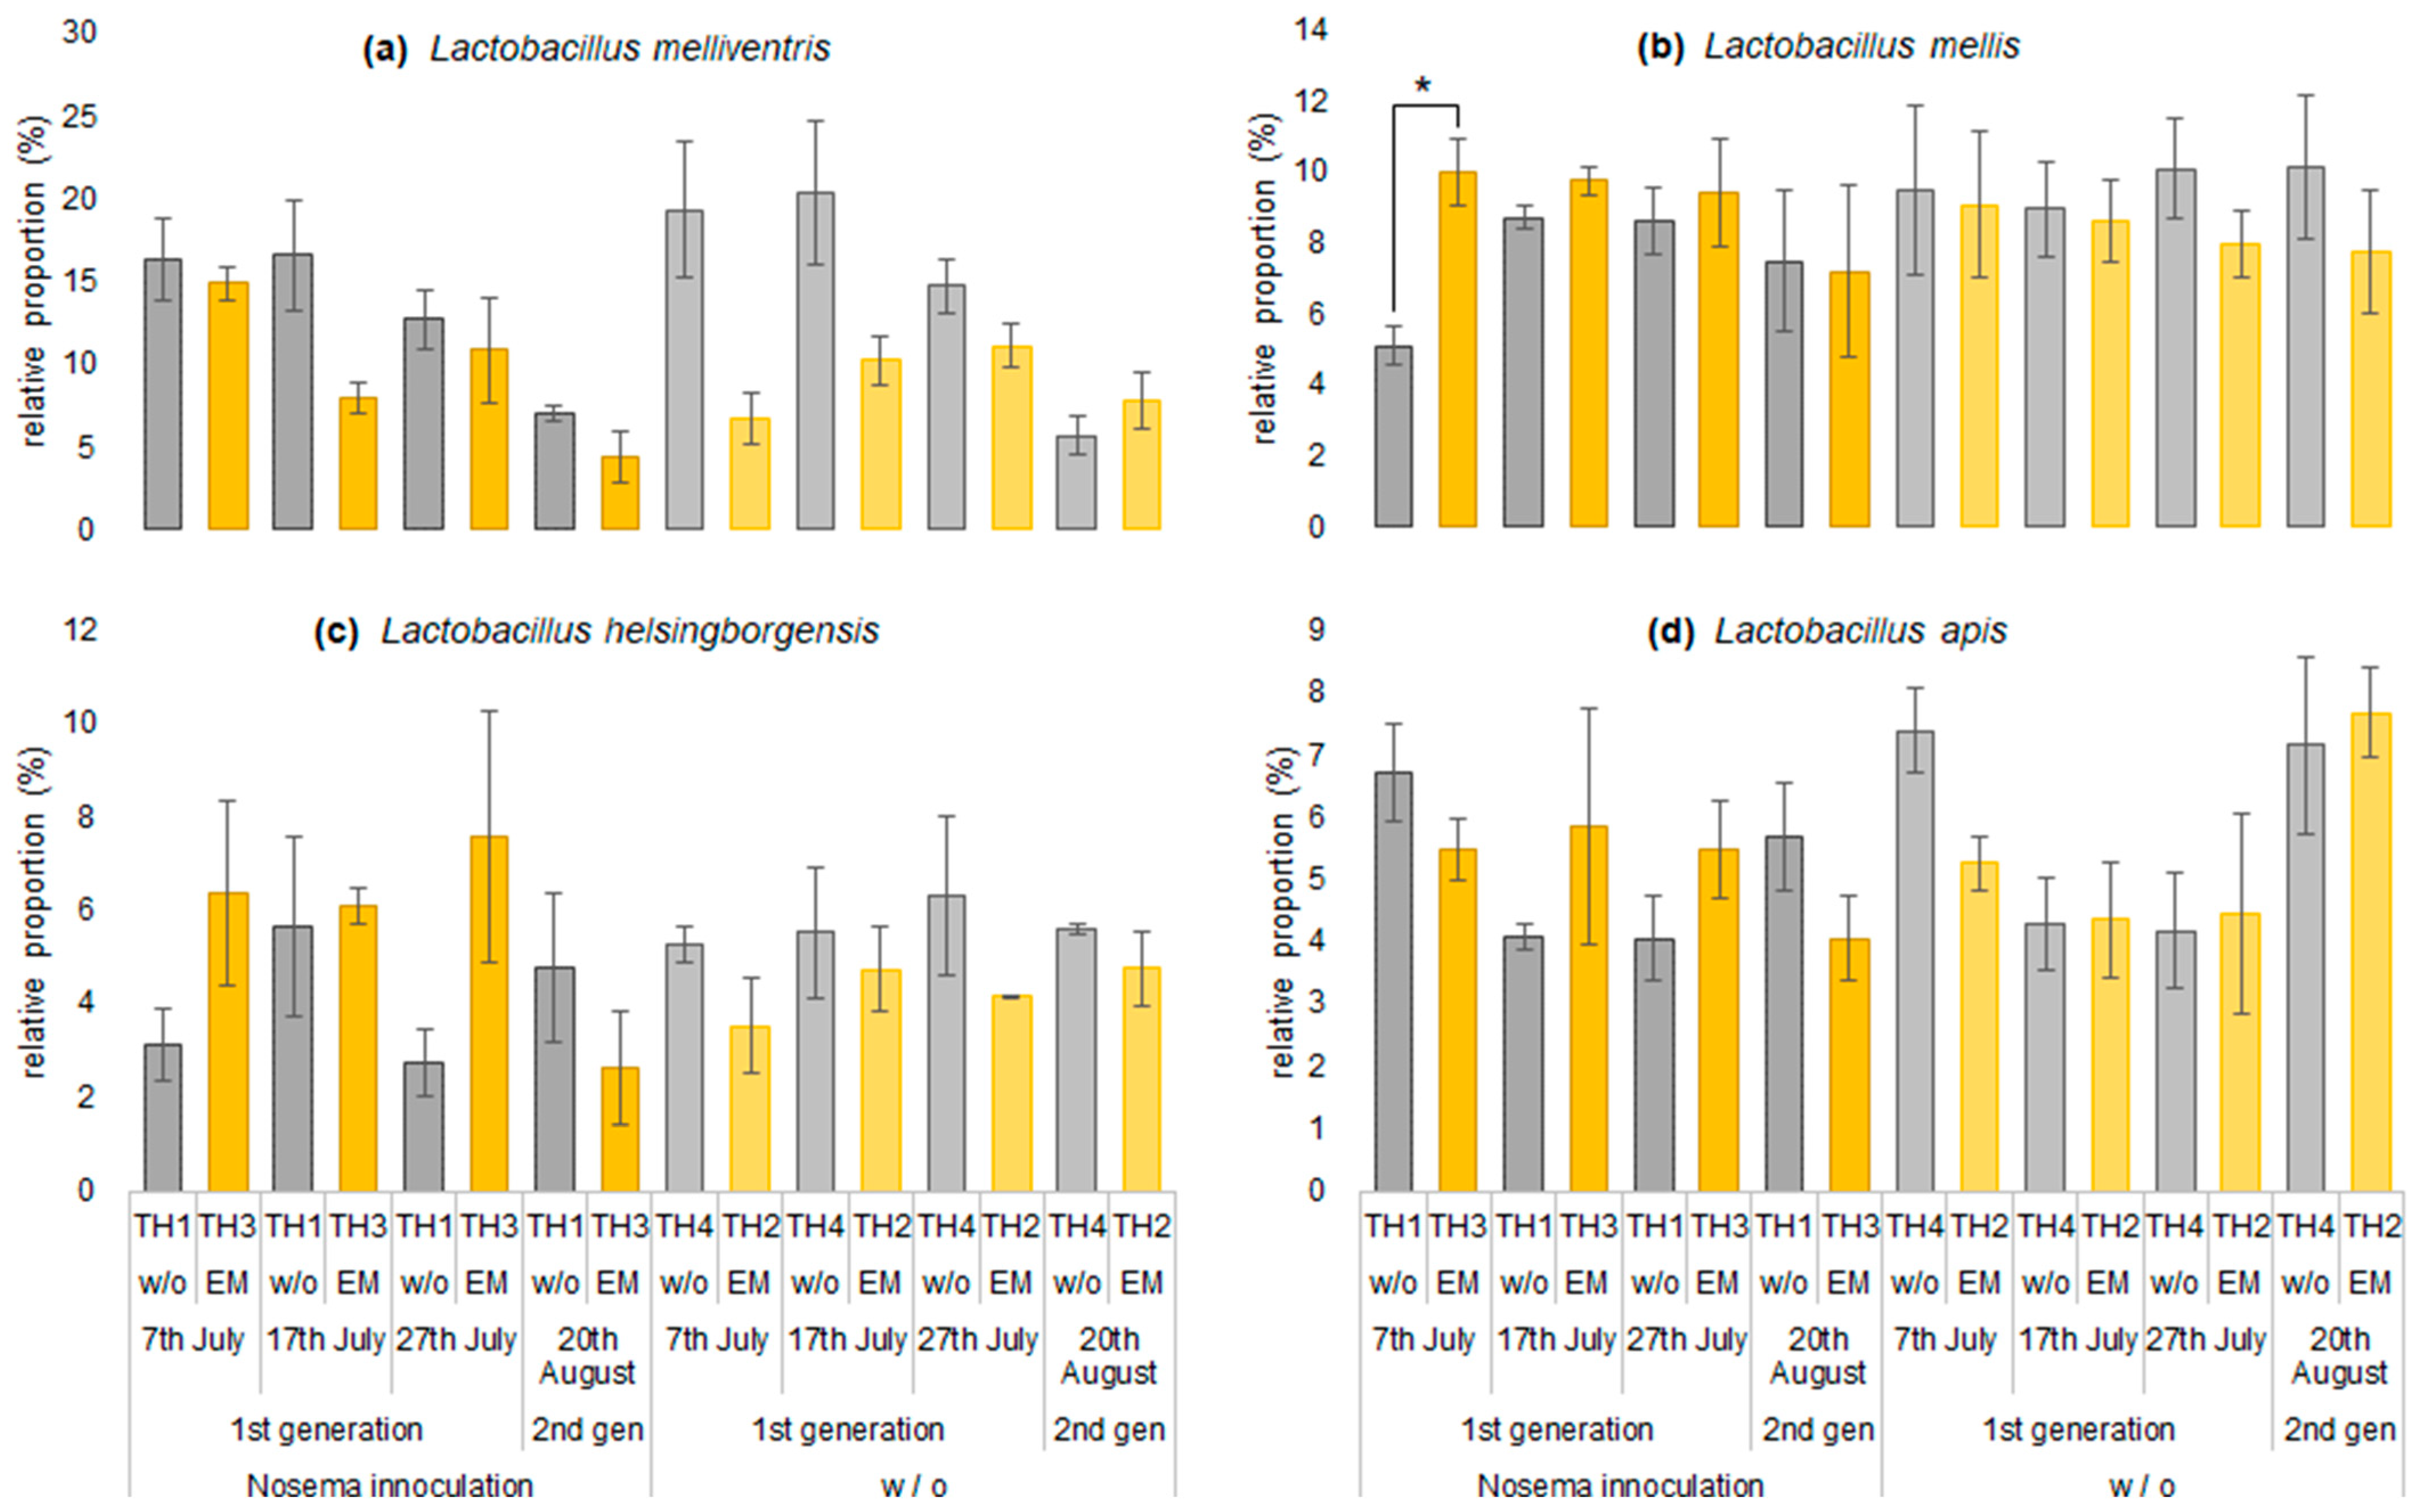
| Lactobacillus melliventris | 16.4 | 6.7 | 14.9 | 19.3 | 16.6 | 10.2 | 8.0 | 20.4 | 12.7 | 11.1 | 10.8 | 14.7 | 7.0 | 7.9 | 4.4 | 5.7 |
| Snodgrassella alvi | 7.5 | 15.6 | 8.2 | 6.8 | 8.5 | 7.9 | 7.9 | 9.4 | 6.8 | 7.0 | 7.7 | 9.2 | 20.1 | 27.0 | 23.9 | 17.1 |
| Lactobacillus mellis | 5.1 | 9.1 | 10.0 | 9.5 | 8.7 | 8.6 | 9.7 | 8.9 | 8.6 | 8.0 | 9.4 | 10.1 | 7.5 | 7.7 | 7.2 | 10.1 |
| Bifidobacterium asteroides | 5.1 | 7.0 | 7.3 | 6.6 | 3.7 | 3.5 | 6.3 | 5.7 | 2.4 | 4.6 | 6.8 | 6.3 | 6.0 | 4.3 | 5.2 | 9.8 |
| Lactobacillus apis | 6.7 | 5.3 | 5.5 | 7.4 | 4.1 | 4.4 | 5.9 | 4.3 | 4.0 | 4.4 | 5.5 | 4.2 | 5.7 | 7.7 | 4.0 | 7.2 |
| Lactobacillus helsingborgensis | 3.1 | 3.5 | 6.4 | 5.3 | 5.7 | 4.7 | 6.1 | 5.5 | 2.7 | 4.1 | 7.6 | 6.3 | 4.8 | 4.8 | 2.6 | 5.6 |
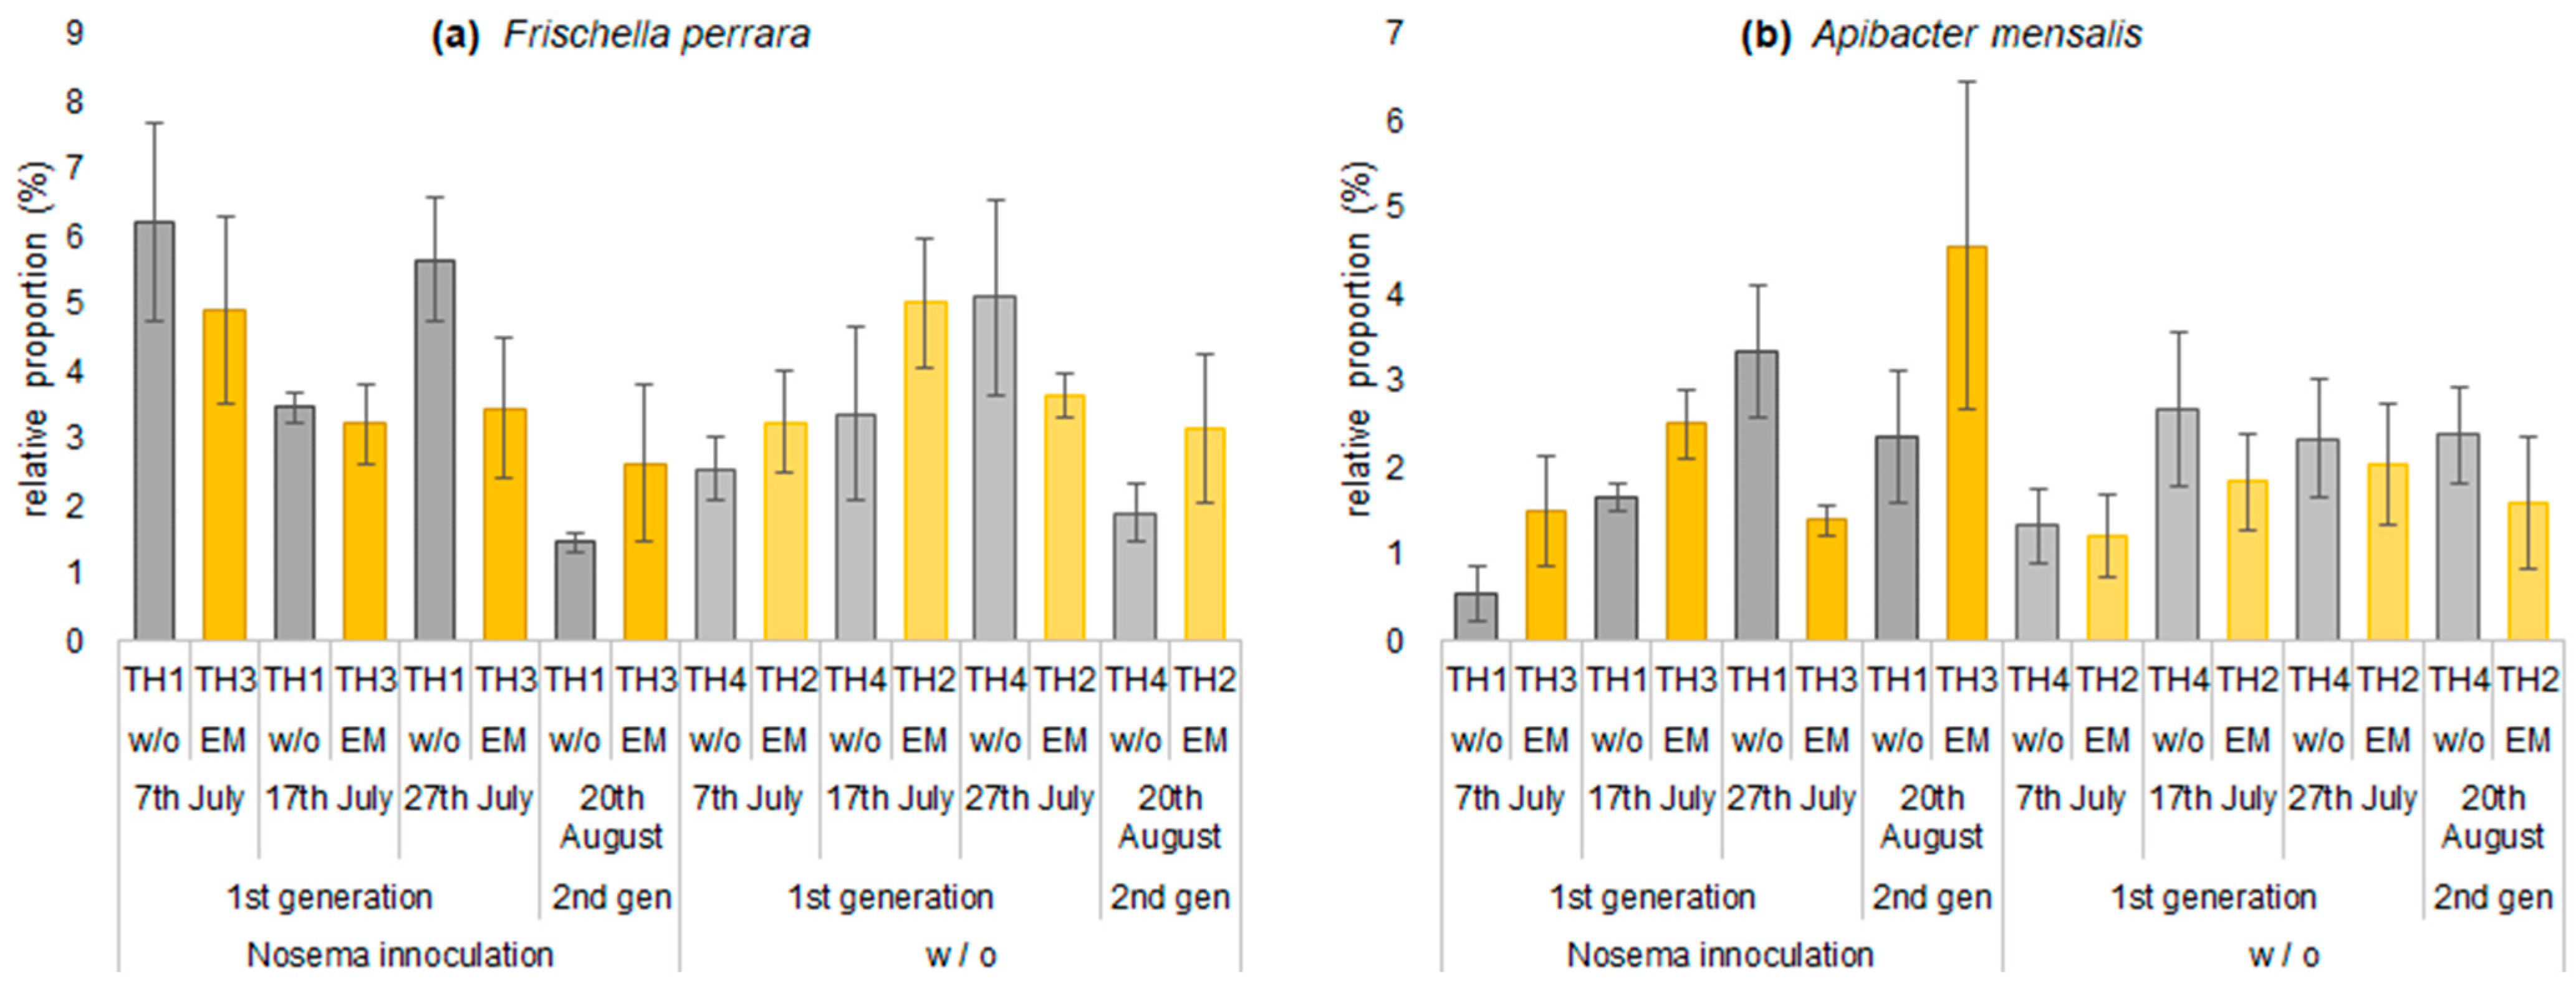
| Frischella perrara | 6.2 | 3.2 | 4.9 | 2.6 | 3.5 | 5.0 | 3.2 | 3.4 | 5.7 | 3.6 | 3.5 | 5.1 | 1.5 | 3.2 | 2.6 | 1.9 |
| Lactobacillus kimbladii | 1.4 | 3.8 | 3.3 | 2.5 | 3.1 | 2.4 | 1.7 | 2.4 | 3.4 | 1.9 | 3.5 | 2.7 | 1.7 | 2.4 | 1.9 | 1.9 |
| Apibacter mensalis | 0.5 | 1.2 | 1.5 | 1.3 | 1.7 | 1.8 | 2.5 | 2.7 | 3.3 | 2.0 | 1.4 | 2.3 | 2.4 | 1.6 | 4.6 | 2.4 |
| Lactobacillus kunkeei | 2.2 | 2.7 | 1.7 | 2.5 | 2.4 | 4.9 | 0.8 | 1.6 | 1.8 | 2.6 | 1.4 | 1.5 | 1.1 | 1.4 | 4.4 | 1.6 |
| Lactobacillus kullabergensis | 1.1 | 1.5 | 1.9 | 2.4 | 2.5 | 1.5 | 4.9 | 2.7 | 1.9 | 2.1 | 2.5 | 0.8 | 1.6 | 1.7 | 1.0 | 1.6 |
Disclaimer/Publisher’s Note: The statements, opinions and data contained in all publications are solely those of the individual author(s) and contributor(s) and not of MDPI and/or the editor(s). MDPI and/or the editor(s) disclaim responsibility for any injury to people or property resulting from any ideas, methods, instructions or products referred to in the content. |
© 2023 by the authors. Licensee MDPI, Basel, Switzerland. This article is an open access article distributed under the terms and conditions of the Creative Commons Attribution (CC BY) license (https://creativecommons.org/licenses/by/4.0/).
Share and Cite
Tlak Gajger, I.; Nejedli, S.; Cvetnić, L. Influence of Probiotic Feed Supplement on Nosema spp. Infection Level and the Gut Microbiota of Adult Honeybees (Apis mellifera L.). Microorganisms 2023, 11, 610. https://doi.org/10.3390/microorganisms11030610
Tlak Gajger I, Nejedli S, Cvetnić L. Influence of Probiotic Feed Supplement on Nosema spp. Infection Level and the Gut Microbiota of Adult Honeybees (Apis mellifera L.). Microorganisms. 2023; 11(3):610. https://doi.org/10.3390/microorganisms11030610
Chicago/Turabian StyleTlak Gajger, Ivana, Srebrenka Nejedli, and Luka Cvetnić. 2023. "Influence of Probiotic Feed Supplement on Nosema spp. Infection Level and the Gut Microbiota of Adult Honeybees (Apis mellifera L.)" Microorganisms 11, no. 3: 610. https://doi.org/10.3390/microorganisms11030610
APA StyleTlak Gajger, I., Nejedli, S., & Cvetnić, L. (2023). Influence of Probiotic Feed Supplement on Nosema spp. Infection Level and the Gut Microbiota of Adult Honeybees (Apis mellifera L.). Microorganisms, 11(3), 610. https://doi.org/10.3390/microorganisms11030610