
Arsenic Exposure Causes Global Changes in the Metalloproteome of Escherichia coli
 , ,
, ,  and
and 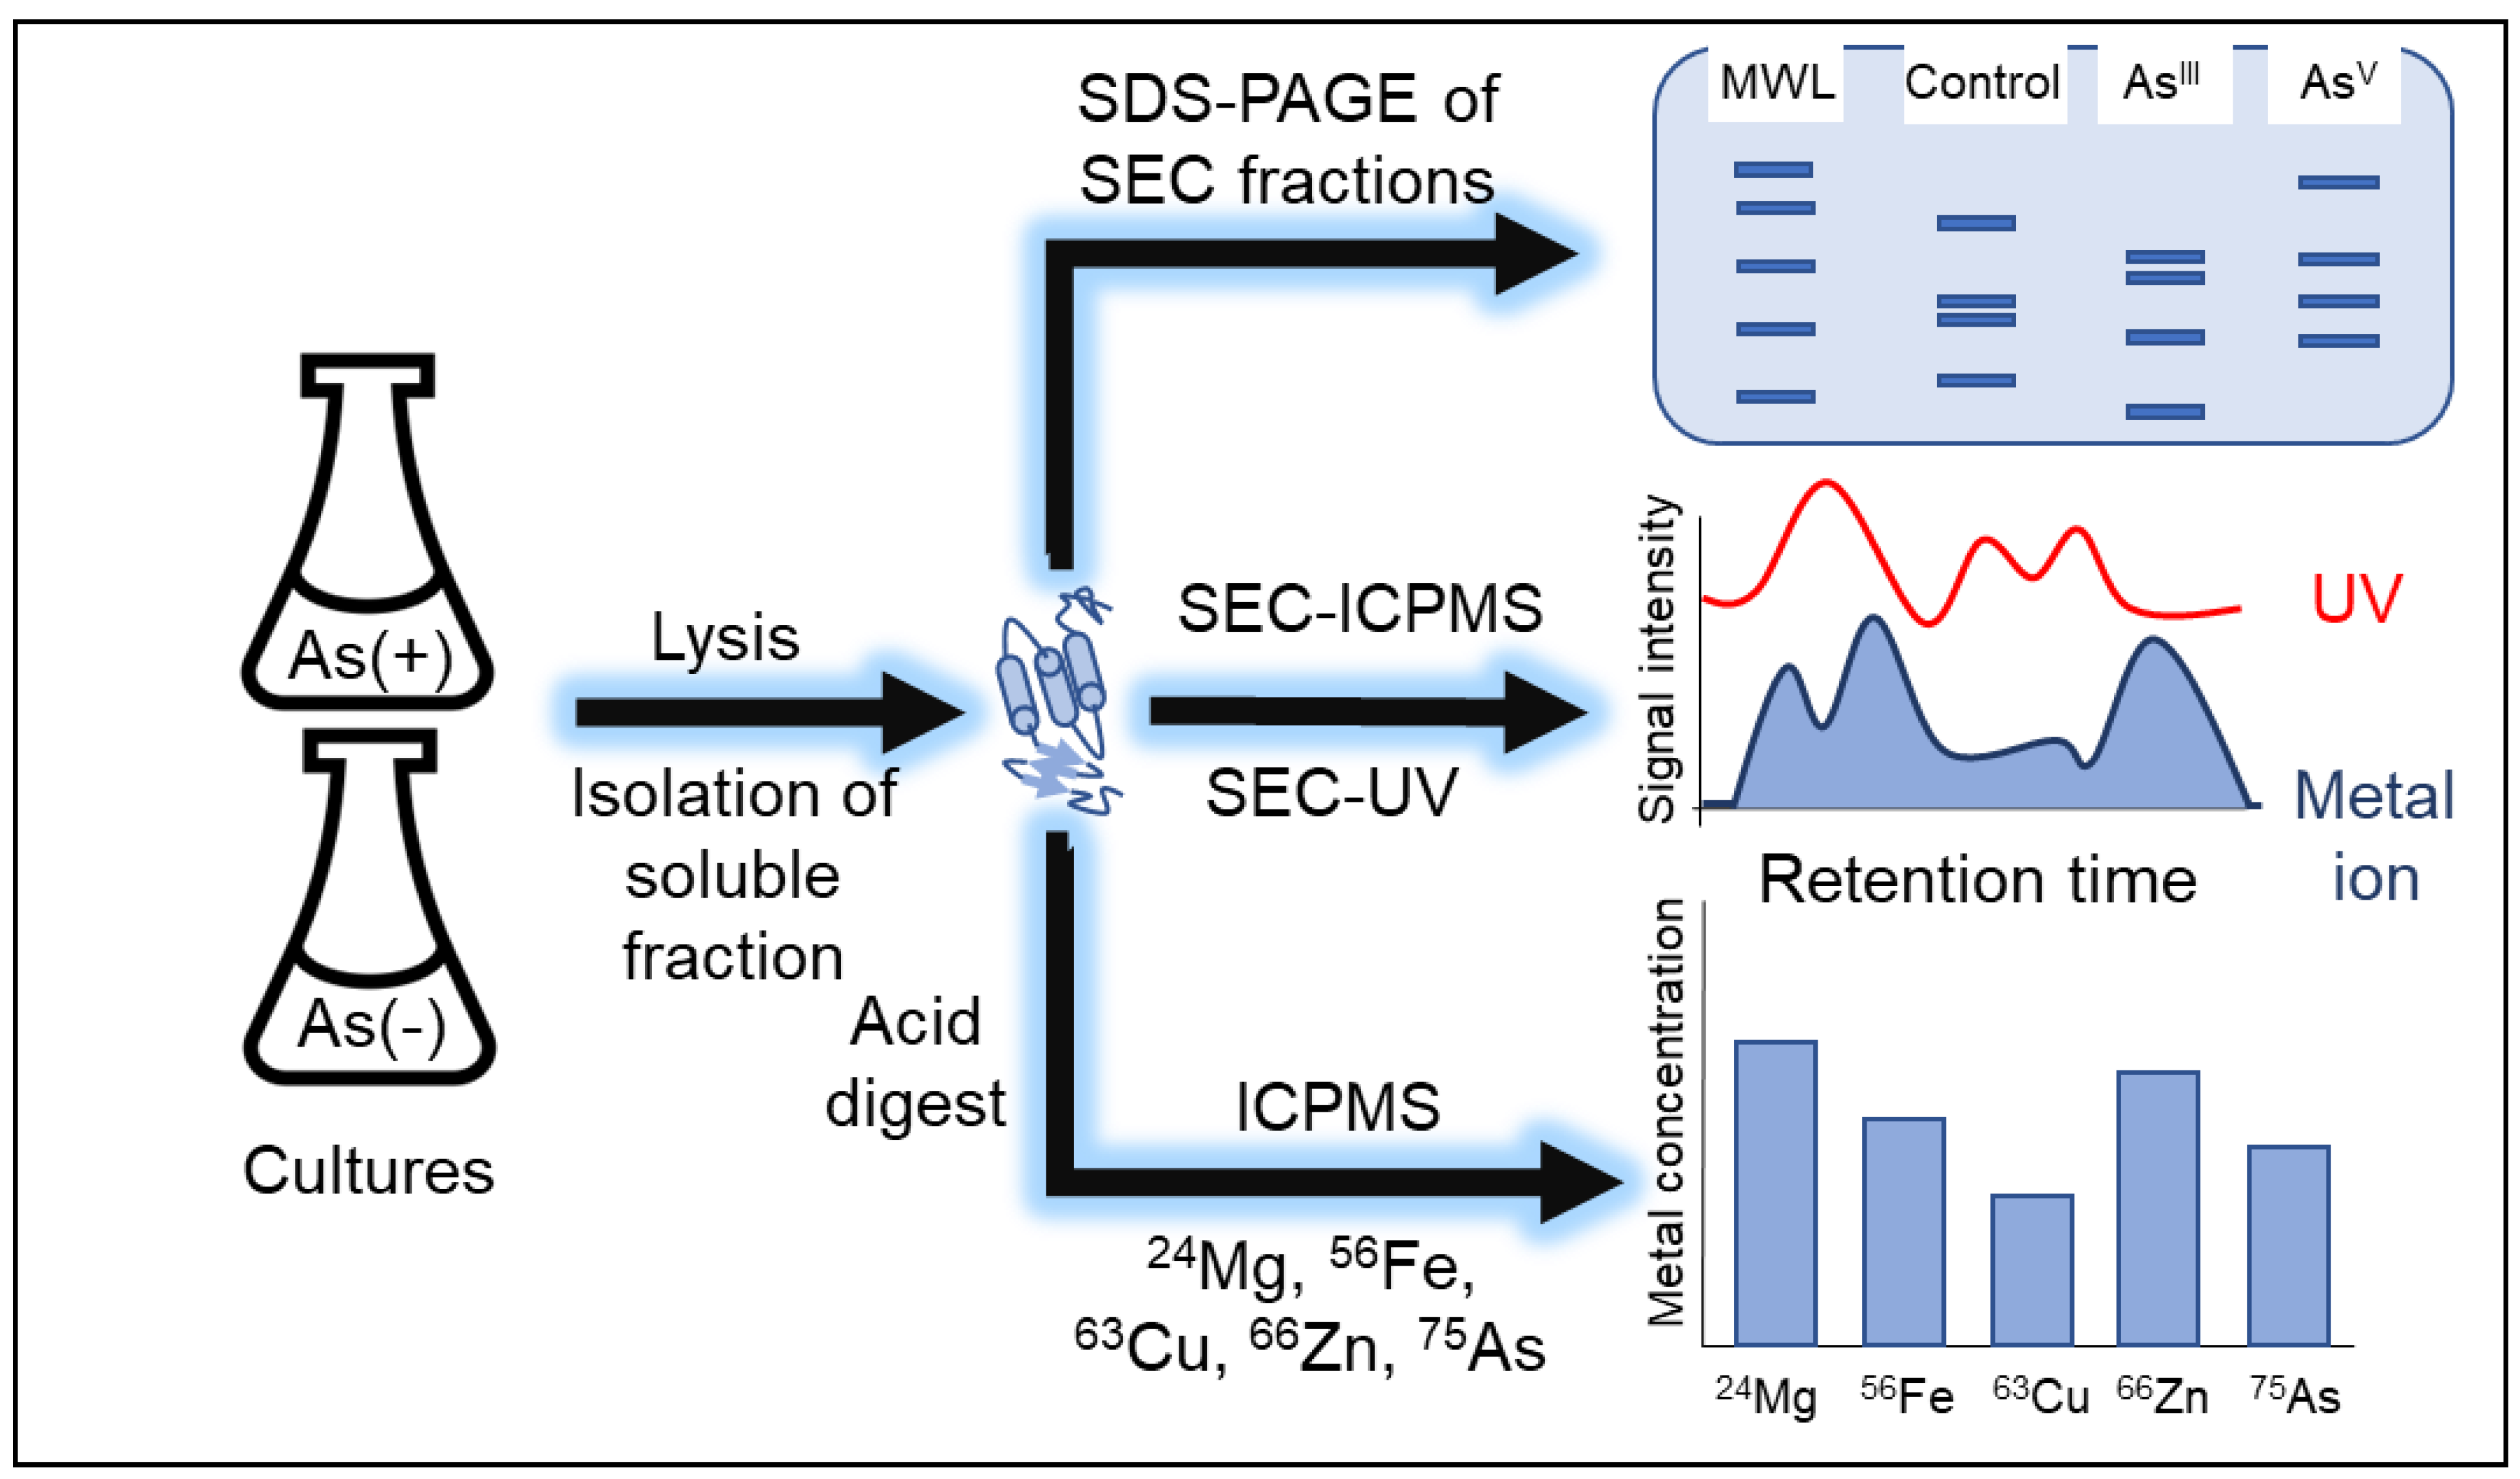
Abstract
1. Introduction
2. Materials and Methods
2.1. E. coli Cell Growths
2.2. Protein Extraction
2.3. Metalloproteome Analysis
2.4. Total Metal Analysis of Soluble Fraction Digest and Media
2.5. ICP-MS Instrument Parameters
2.6. Proteome Analysis
3. Results
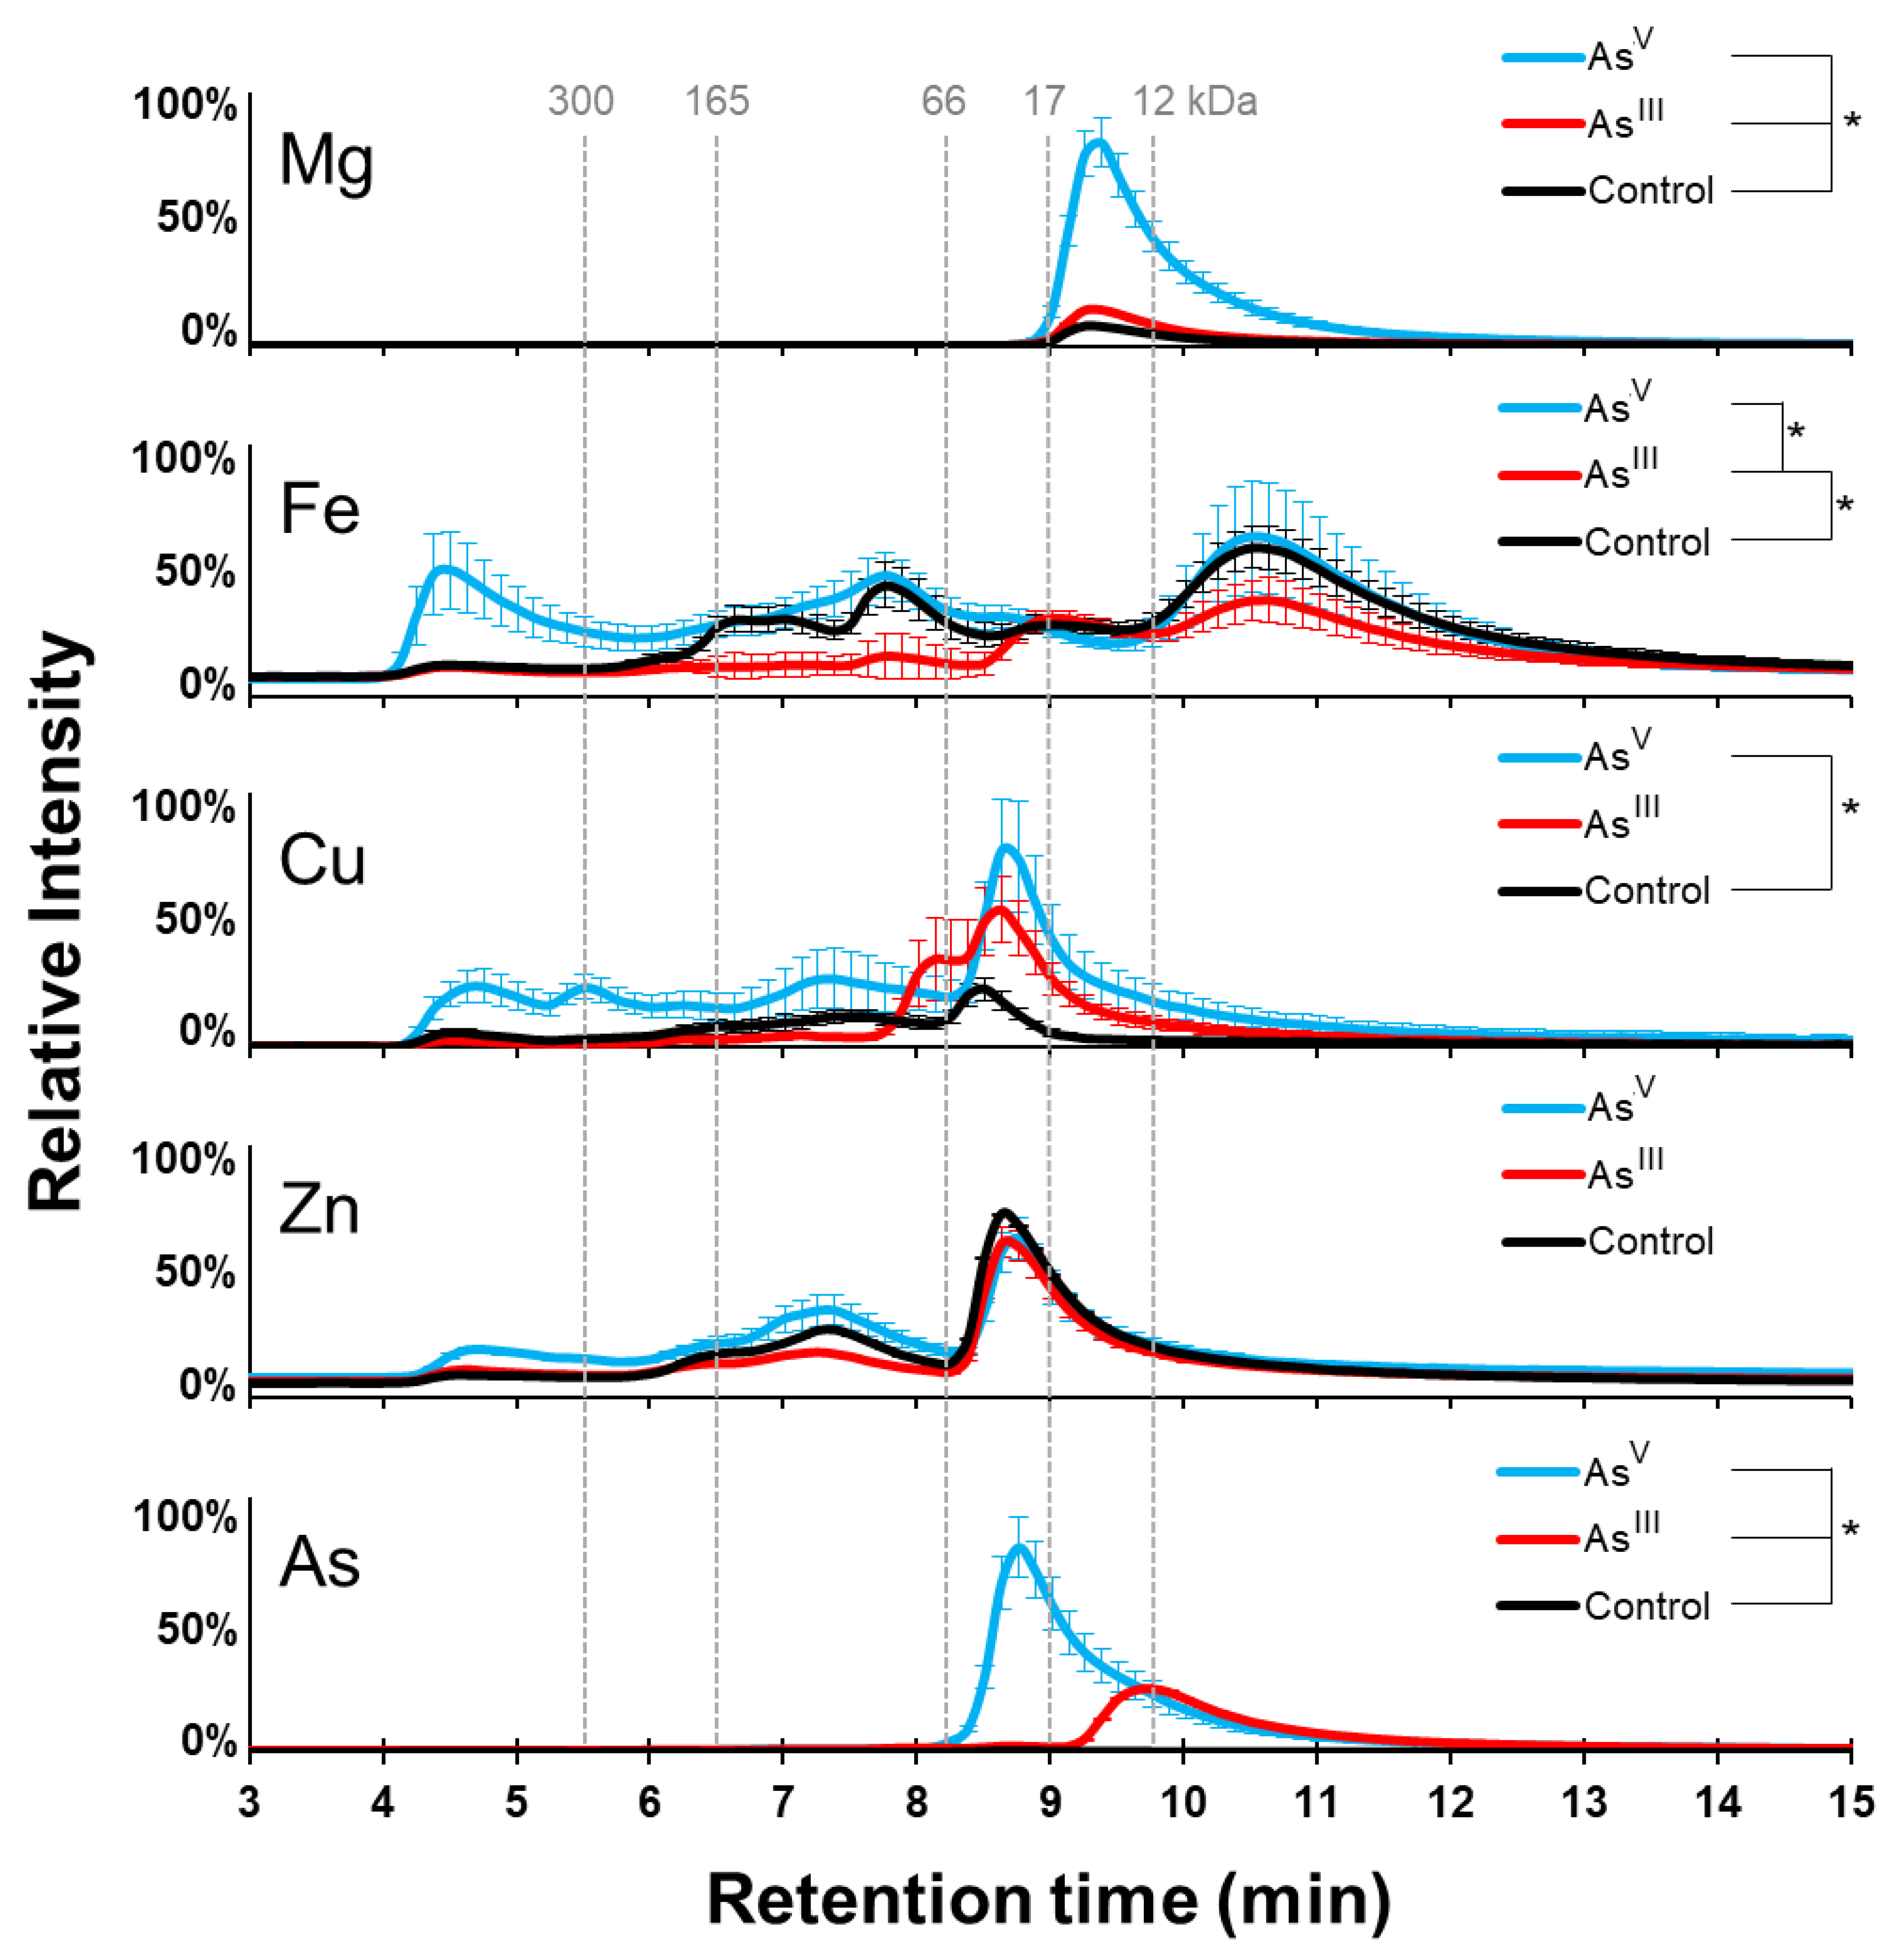
3.1. Arsenic Induced Changes in the Metalloproteome of E. coli K-12
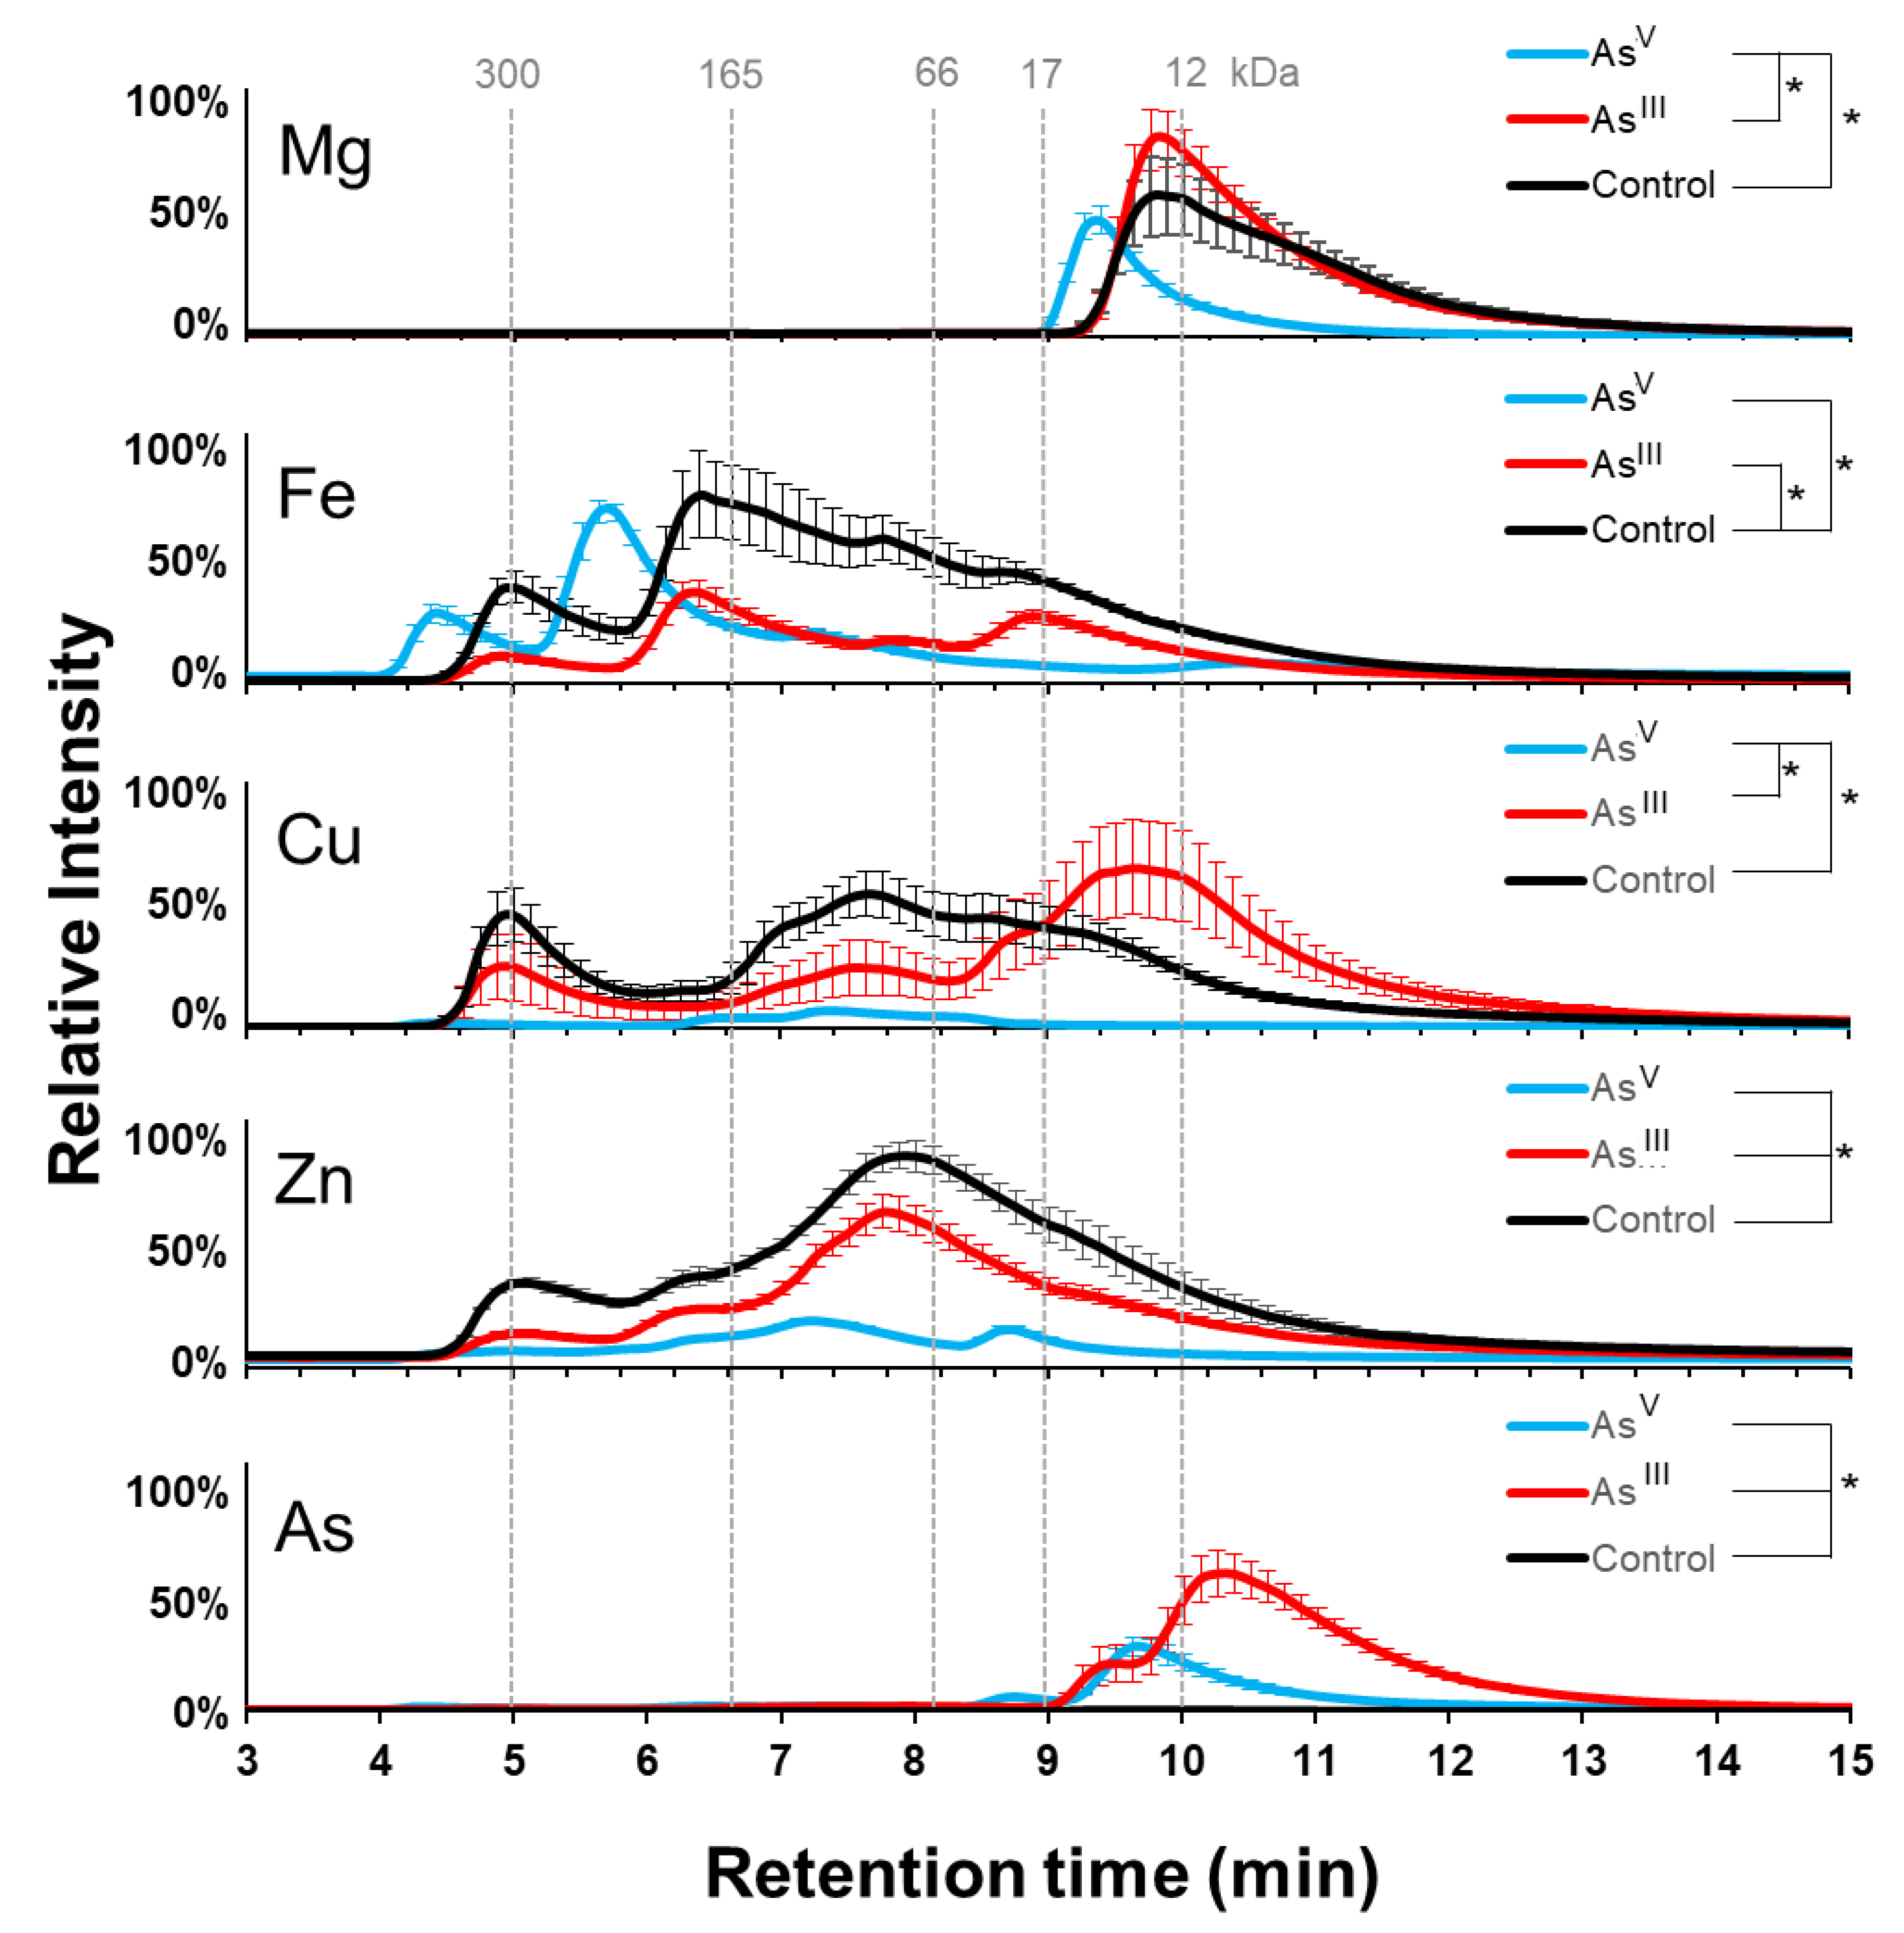
3.2. Arsenic Induced Changes in the Metalloproteome of E. coli AW3110
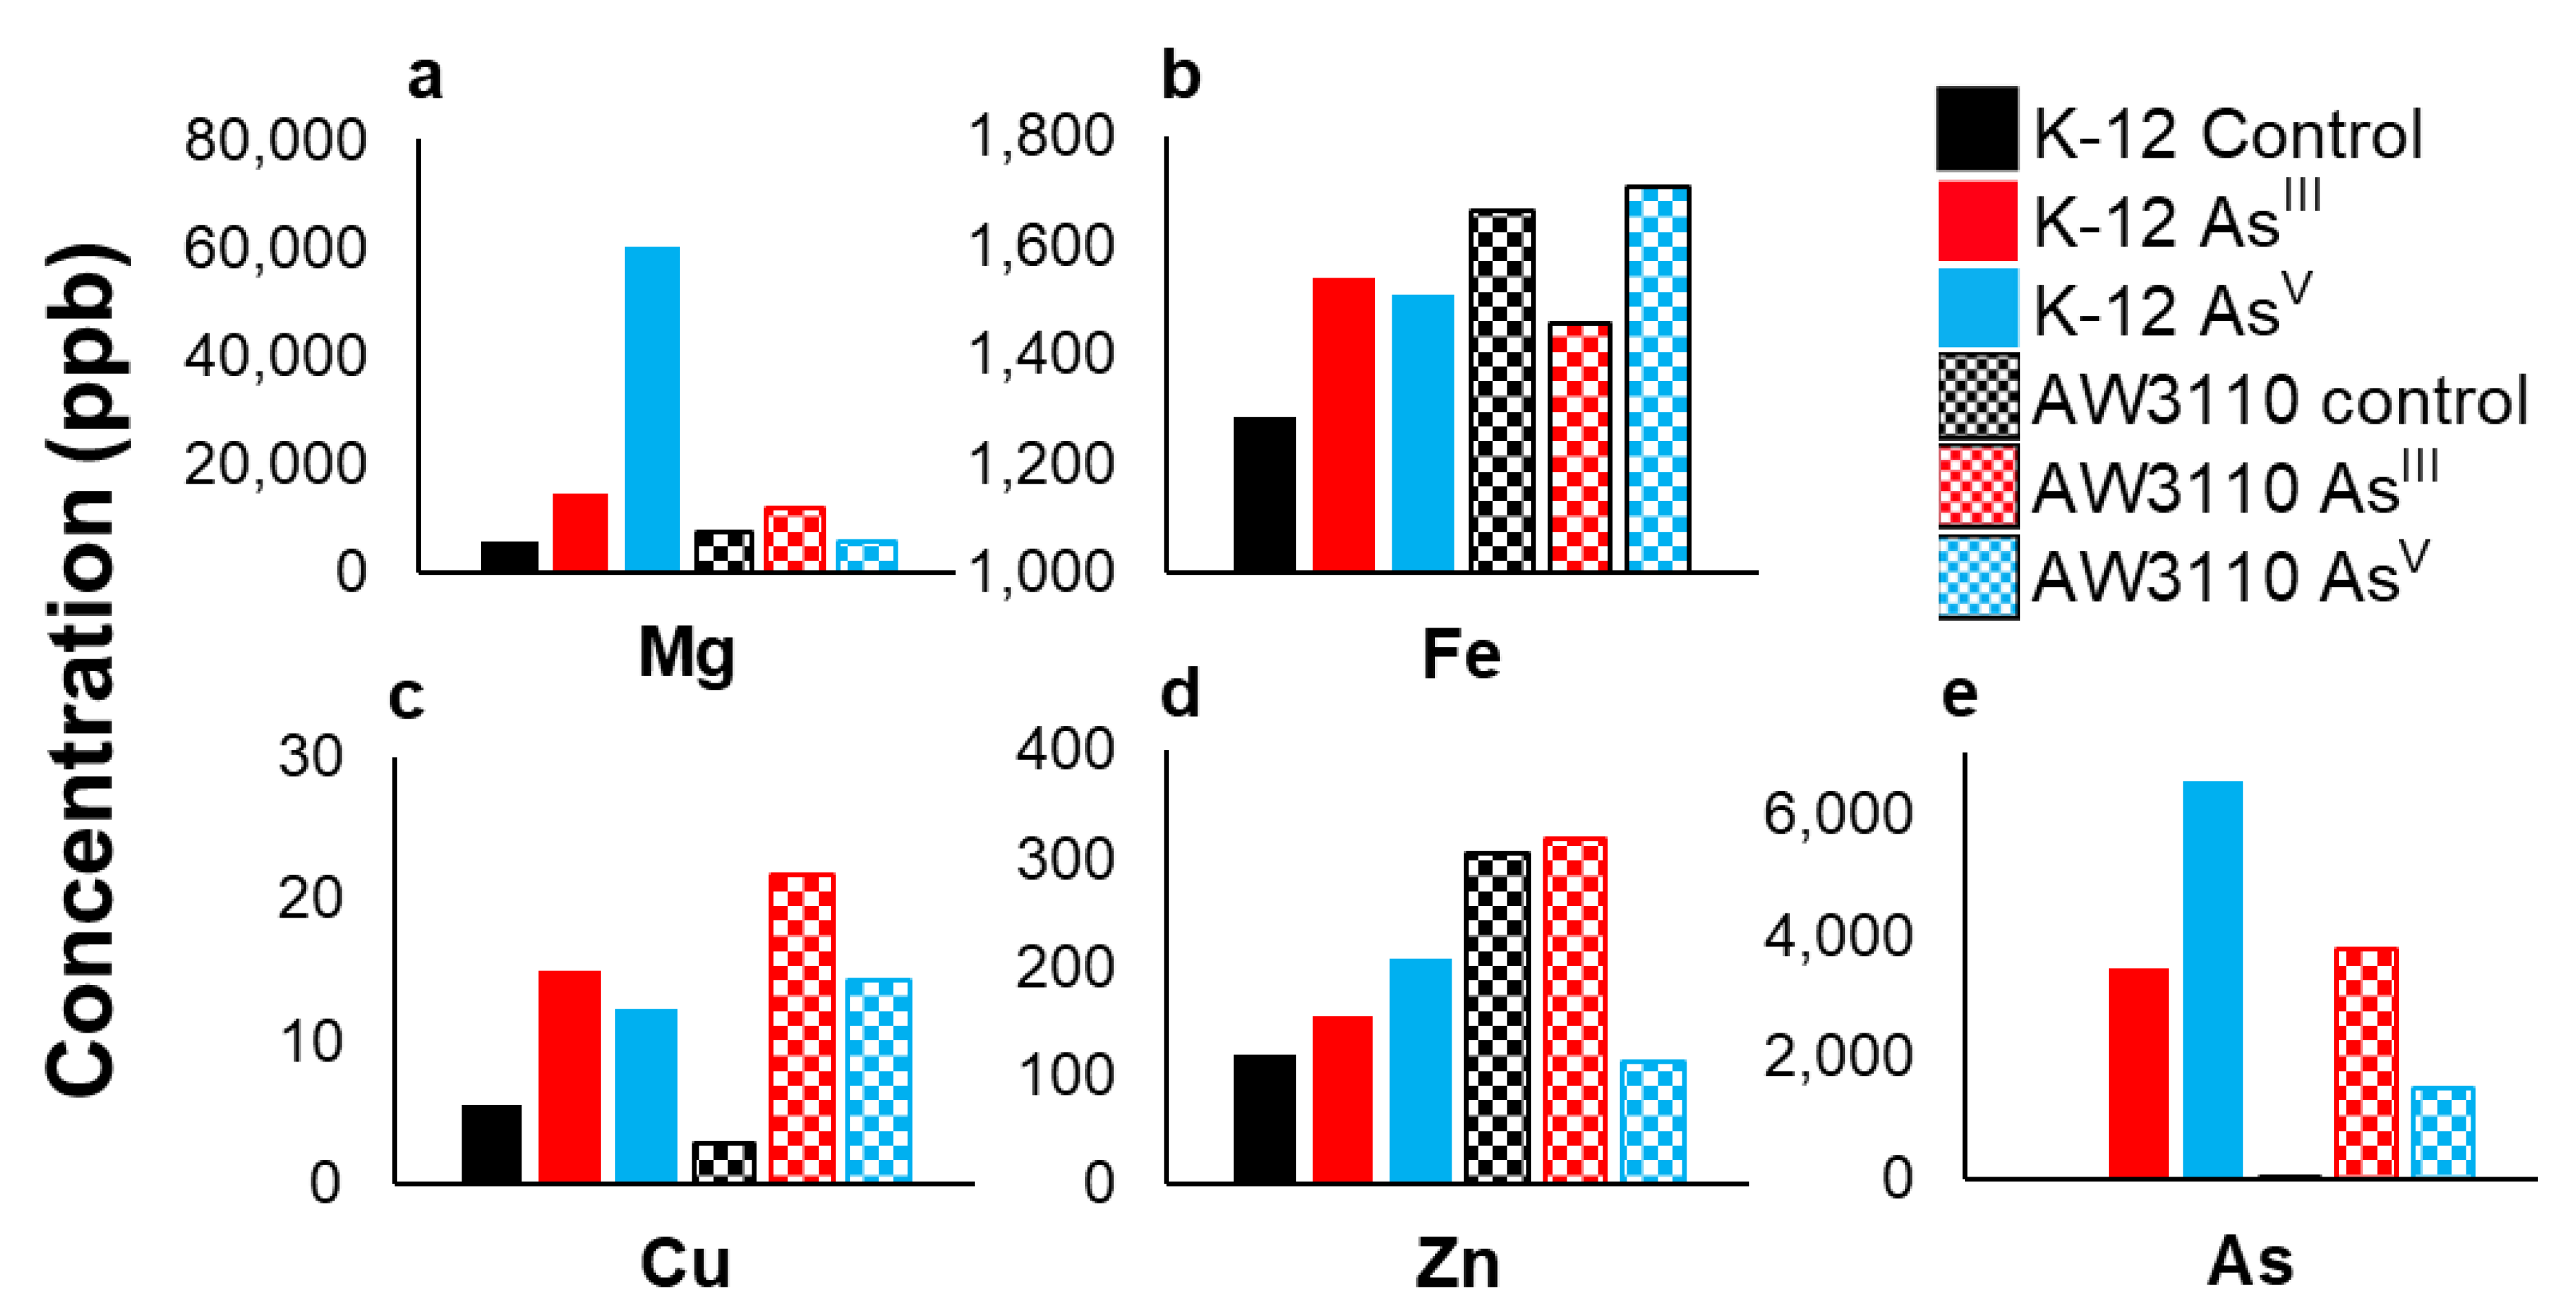
3.3. Changes in Total Cellular Metal
3.4. Changes in the Soluble Proteome
3.5. Protein Cofactor Changes
4. Discussion
4.1. Arsenic
4.2. Copper
4.3. Magnesium
4.4. Zinc
4.5. Iron
4.6. Protein Cofactor and Redox Status
5. Concluding Remarks
Supplementary Materials
Author Contributions
Funding
Institutional Review Board Statement
Informed Consent Statement
Data Availability Statement
Acknowledgments
Conflicts of Interest
References
- Hughes, M.F.; Beck, B.D.; Chen, Y.; Lewis, A.S.; Thomas, D.J. Arsenic Exposure and Toxicology: A Historical Perspective. Toxicol. Sci. 2011, 123, 305–332. [Google Scholar] [CrossRef]
- Sambu, S.; Wilson, R. Arsenic in Food and Water-a Brief History. Toxicol. Ind. Health 2008, 24, 217–226. [Google Scholar] [CrossRef]
- Chung, J.Y.; Do Yu, S.; Hong, Y.S. Environmental Source of Arsenic Exposure. J. Prev. Med. Public Health 2014, 47, 253. [Google Scholar] [CrossRef]
- Páez-Espino, D.; Tamames, J.; De Lorenzo, V.; Cánovas, D. Microbial Responses to Environmental Arsenic. BioMetals 2009, 22, 117–130. [Google Scholar] [CrossRef]
- Yang, H.C.; Fu, H.L.; Lin, Y.F.; Rosen, B.P. Chapter Twelve—Pathways of Arsenic Uptake and Efflux. Curr. Top. Membr. 2012, 69, 325. [Google Scholar] [CrossRef]
- Garbinski, L.D.; Rosen, B.P.; Chen, J. Pathways of Arsenic Uptake and Efflux. Environ. Int. 2019, 126, 585–597. [Google Scholar] [CrossRef]
- Rosen, B.P. Biochemistry of Arsenic Detoxification. FEBS Lett. 2002, 529, 86–92. [Google Scholar] [CrossRef]
- Yan, G.; Chen, X.; Du, S.; Deng, Z.; Wang, L.; Chen, S. Genetic Mechanisms of Arsenic Detoxification and Metabolism in Bacteria. Curr. Genet. 2019, 65, 329–338. [Google Scholar] [CrossRef]
- Rawle, R.; Saley, T.C.; Kang, Y.S.; Wang, Q.; Walk, S.; Bothner, B.; McDermott, T.R. Introducing the ArsR-Regulated Arsenic Stimulon. Front. Microbiol. 2021, 12, 162. [Google Scholar] [CrossRef]
- Murphy, J.N.; Saltikov, C.W. The ArsR Repressor Mediates Arsenite-Dependent Regulation of Arsenate Respiration and Detoxification Operons of Shewanella Sp. Strain ANA-3. J. Bacteriol. 2009, 191, 6722. [Google Scholar] [CrossRef]
- Hao, X.; Lin, Y.; Johnstone, L.; Liu, G.; Wang, G.; Wei, G.; McDermott, T.; Rensing, C. Genome Sequence of the Arsenite-Oxidizing Strain Agrobacterium Tumefaciens 5A. J. Bacteriol. 2012, 194, 903. [Google Scholar] [CrossRef]
- Kang, Y.S.; Heinemann, J.; Bothner, B.; Rensing, C.; McDermott, T.R. Integrated Co-Regulation of Bacterial Arsenic and Phosphorus Metabolisms. Environ. Microbiol. 2012, 14, 3097–3109. [Google Scholar] [CrossRef]
- Rawle, R.A.; Kang, Y.S.; Bothner, B.; Wang, G.; McDermott, T.R. Transcriptomics Analysis Defines Global Cellular Response of Agrobacterium Tumefaciens 5A to Arsenite Exposure Regulated through the Histidine Kinases PhoR and AioS. Environ. Microbiol. 2019, 21, 2659–2676. [Google Scholar] [CrossRef]
- Chandrangsu, P.; Rensing, C.; Helmann, J.D. Metal Homeostasis and Resistance in Bacteria. Nat. Rev. Microbiol. 2017, 15, 338. [Google Scholar] [CrossRef]
- Xu, Z.; Wang, P.; Wang, H.; HangYu, Z.; Au-Yeung, H.Y.; Hirayama, T.; Sun, H.; Yan, A. Zinc Excess Increases Cellular Demand for Iron and Decreases Tolerance to Copper in Escherichia Coli. J. Biol. Chem. 2019, 294, 16978–16991. [Google Scholar] [CrossRef]
- Angeli, S.; Barhydt, T.; Jacobs, R.; Killilea, D.W.; Lithgow, G.J.; Andersen, J.K. Manganese Disturbs Metal and Protein Homeostasis in Caenorhabditis Elegans. Metallomics 2014, 6, 1816–1823. [Google Scholar] [CrossRef] [PubMed]
- Carlin, A.; Shi, W.; Dey, S.; Rosen, B.P. The Ars Operon of Escherichia Coli Confers Arsenical and Antimonial Resistance. J. Bacteriol. 1995, 177, 981–986. [Google Scholar] [CrossRef]
- Lago, L.; Thomas, O.R.B.; Roberts, B.R. Choice of Mobile Phase: Implications for Size Exclusion Chromatography-Inductively Coupled Plasma-Mass Spectrometry Analyses of Copper, Zinc and Iron Metalloproteins. J. Chromatogr. A 2020, 1616, 460806. [Google Scholar] [CrossRef]
- Hare, D.J.; Grubman, A.; Ryan, T.M.; Lothian, A.; Liddell, J.R.; Grimm, R.; Matsuda, T.; Doble, P.A.; Cherny, R.A.; Bush, A.I.; et al. Profiling the Iron, Copper and Zinc Content in Primary Neuron and Astrocyte Cultures by Rapid Online Quantitative Size Exclusion Chromatography-Inductively Coupled Plasma-Mass Spectrometry. Metallomics 2013, 5, 1656–1662. [Google Scholar] [CrossRef]
- Chapman, S.K.; Reid, G.A.; Macheroux, P. UV-Visible Spectroscopy as a Tool to Study Flavoproteins. Methods Mol. Biol. 1999, 131, 1–7. [Google Scholar] [CrossRef]
- Hopp, M.T.; Schmalohr, B.F.; Kühl, T.; Detzel, M.S.; Wißbrock, A.; Imhof, D. Heme Determination and Quantification Methods and Their Suitability for Practical Applications and Everyday Use. Anal. Chem. 2020, 92, 9429–9440. [Google Scholar] [CrossRef]
- Shi, K.; Wang, Q.; Fan, X.; Wang, G. Proteomics and Genetic Analyses Reveal the Effects of Arsenite Oxidation on Metabolic Pathways and the Roles of AioR in Agrobacterium Tumefaciens GW4. Environ. Pollut. 2018, 235, 700–709. [Google Scholar] [CrossRef]
- Liu, G.; Liu, M.; Kim, E.H.; Maaty, W.S.; Bothner, B.; Lei, B.; Rensing, C.; Wang, G.; McDermott, T.R. A Periplasmic Arsenite-Binding Protein Involved in Regulating Arsenite Oxidation. Environ. Microbiol. 2012, 14, 1624–1634. [Google Scholar] [CrossRef] [PubMed]
- Kashyap, D.R.; Botero, L.M.; Franck, W.L.; Hassett, D.J.; McDermott, T.R. Complex Regulation of Arsenite Oxidation in Agrobacterium Tumefaciens. J. Bacteriol. 2006, 188, 1081–1088. [Google Scholar] [CrossRef]
- Bogdan, G.M.; Sampayo-Reyes, A.; Vasken Aposhian, H. Arsenic Binding Proteins of Mammalian Systems: I. Isolation of Three Arsenite-Binding Proteins of Rabbit Liver. Toxicology 1994, 93, 175–193. [Google Scholar] [CrossRef]
- Rubino, J.T.; Franz, K.J. Coordination Chemistry of Copper Proteins: How Nature Handles a Toxic Cargo for Essential Function. J. Inorg. Biochem. 2012, 107, 129–143. [Google Scholar] [CrossRef] [PubMed]
- Lu, M.; Wang, H.; Li, X.-F.; Lu, X.; Cullen, W.R.; Arnold, L.L.; Cohen, S.M.; Le, X.C. Evidence of Hemoglobin Binding to Arsenic as a Basis for the Accumulation of Arsenic in Rat Blood. Chem. Res. Toxicol. 2004, 17, 1733–1742. [Google Scholar] [CrossRef]
- Lee, D.-Y.D.; Galera-Laporta, L.; Bialecka-Fornal, M.; Briggs, S.P.; Garcia-Ojalvo, J.; Moon, E.C.; Shen, Z.; Rol, G.; Sü El, M. Magnesium Flux Modulates Ribosomes to Increase Bacterial Survival In Brief Bacteria Cope against Ribosome-Targeting Antibiotics by Controlling the Influx of Intracellular Magnesium and Controlling Their Membrane Potential. Article Magnesium Flux Modulates Ribosomes to Increase Bacterial Survival. Cell 2019, 177, 352–360.e13. [Google Scholar] [CrossRef]
- Basturea, G.N.; Harris, T.K.; Deutscher, M.P. Growth of a Bacterium That Apparently Uses Arsenic Instead of Phosphorus Is a Consequence of Massive Ribosome Breakdown. J. Biol. Chem. 2012, 287, 28816–28819. [Google Scholar] [CrossRef] [PubMed]
- Guerra-Moreno, A.; Isasa, M.; Bhanu, M.K.; Waterman, D.P.; Eapen, V.V.; Gygi, S.P.; Hanna, J. Proteomic Analysis Identifies Ribosome Reduction as an Effective Proteotoxic Stress Response. J. Biol. Chem. 2015, 290, 29695. [Google Scholar] [CrossRef]
- Khannpnavar, B.; Mehta, V.; Qi, C.; Korkhov, V. Structure and Function of Adenylyl Cyclases, Key Enzymes in Cellular Signaling. Curr. Opin. Struct. Biol. 2020, 63, 34–41. [Google Scholar] [CrossRef]
- Steer, M.L. Adenyl Cyclase. Ann. Surg. 1975, 182, 603. [Google Scholar] [CrossRef]
- Hayer-Hartl, M.; Bracher, A.; Hartl, F.U. The GroEL-GroES Chaperonin Machine: A Nano-Cage for Protein Folding. Trends Biochem. Sci. 2016, 41, 62–76. [Google Scholar] [CrossRef]
- Carreras-Puigvert, J.; Zitnik, M.; Jemth, A.S.; Carter, M.; Unterlass, J.E.; Hallström, B.; Loseva, O.; Karem, Z.; Calderón-Montanõ, J.M.; Lindskog, C.; et al. A Comprehensive Structural, Biochemical and Biological Profiling of the Human NUDIX Hydrolase Family. Nat. Commun. 2017, 8, 1541. [Google Scholar] [CrossRef]
- Mildvan, A.S.; Xia, Z.; Azurmendi, H.F.; Saraswat, V.; Legler, P.M.; Massiah, M.A.; Gabelli, S.B.; Bianchet, M.A.; Kang, L.W.; Amzel, L.M. Structures and Mechanisms of Nudix Hydrolases. Arch. Biochem. Biophys. 2005, 433, 129–143. [Google Scholar] [CrossRef]
- Ganger, R.; Garla, R.; Mohanty, B.P.; Bansal, M.P.; Garg, M.L. Protective Effects of Zinc Against Acute Arsenic Toxicity by Regulating Antioxidant Defense System and Cumulative Metallothionein Expression. Biol. Trace Elem. Res. 2016, 169, 218–229. [Google Scholar] [CrossRef]
- Wei, Y.Y.; Huang, H.; Xia, Y.K.; Wei, L.M.; Chen, X.; Zhang, R.Y.; Duan, W.W.; Su, L.; Rahman, M.L.; Rahman, M.; et al. Antagonistic Effect of Early Stage Zinc on Arsenic Toxicity Induced Preterm Birth during Pregnancy: Evidence from a Rural Bangladesh Birth Cohort. Chin. Med. J. (Engl.) 2021, 134, 619–621. [Google Scholar] [CrossRef]
- Zhou, X.; Sun, X.; Cooper, K.L.; Wang, F.; Liu, K.J.; Hudson, L.G. Arsenite Interacts Selectively with Zinc Finger Proteins Containing C3H1 or C4 Motifs. J. Biol. Chem. 2011, 286, 22855. [Google Scholar] [CrossRef]
- Yu, Y.; Su, J.; Xu, J.; Li, Y.P.; Alwathnani, H.A.; Wu, Z.; Ji, C.; Feng, R.; Rensing, C.; Herzberg, M. As(III) Exposure Induces a Zinc Scarcity Response and Restricts Iron Uptake in High-Level Arsenic-Resistant Paenibacillus Taichungensis Strain NC1. Appl. Environ. Microbiol. 2022, 88, e00312-22. [Google Scholar] [CrossRef]
- Soltani, S.; Ojaghi, A.; Robles, F.E. Deep UV Dispersion and Absorption Spectroscopy of Biomolecules. Biomed. Opt. Express 2019, 10, 487. [Google Scholar] [CrossRef]
- Aguilar-González, M.G.; Hernández, A.; López, M.L.; Mendoza-Figueroa, T.; Albores, A. Arsenite Alters Heme Synthesis in Long-Term Cultures of Adult Rat Hepatocytes. Toxicol. Sci. 1999, 49, 281–289. [Google Scholar] [CrossRef][Green Version]
- Shi, J.; Vlamis-Gardikas, A.; Åslund, F.; Holmgren, A.; Rosen, B.P. Reactivity of Glutaredoxins 1, 2, and 3 FromEscherichia Coli Shows That Glutaredoxin 2 Is the Primary Hydrogen Donor to ArsC-Catalyzed Arsenate Reduction. J. Biol. Chem. 1999, 274, 36039–36042. [Google Scholar] [CrossRef] [PubMed]
- Helbig, K.; Bleuel, C.; Krauss, G.J.; Nies, D.H. Glutathione and Transition-Metal Homeostasis in Escherichia Coli. J. Bacteriol. 2008, 190, 5431–5438. [Google Scholar] [CrossRef]
- Ilyas, S.; Rehman, A.; Coelho, A.V.; Sheehan, D. Proteomic Analysis of an Environmental Isolate of Rhodotorula Mucilaginosa after Arsenic and Cadmium Challenge: Identification of a Protein Expression Signature for Heavy Metal Exposure. J. Proteom. 2016, 141, 47–56. [Google Scholar] [CrossRef] [PubMed]


Disclaimer/Publisher’s Note: The statements, opinions and data contained in all publications are solely those of the individual author(s) and contributor(s) and not of MDPI and/or the editor(s). MDPI and/or the editor(s) disclaim responsibility for any injury to people or property resulting from any ideas, methods, instructions or products referred to in the content. |
© 2023 by the authors. Licensee MDPI, Basel, Switzerland. This article is an open access article distributed under the terms and conditions of the Creative Commons Attribution (CC BY) license (https://creativecommons.org/licenses/by/4.0/).
Share and Cite
Larson, J.; Tokmina-Lukaszewska, M.; Fausset, H.; Spurzem, S.; Cox, S.; Cooper, G.; Copié, V.; Bothner, B. Arsenic Exposure Causes Global Changes in the Metalloproteome of Escherichia coli. Microorganisms 2023, 11, 382. https://doi.org/10.3390/microorganisms11020382
Larson J, Tokmina-Lukaszewska M, Fausset H, Spurzem S, Cox S, Cooper G, Copié V, Bothner B. Arsenic Exposure Causes Global Changes in the Metalloproteome of Escherichia coli. Microorganisms. 2023; 11(2):382. https://doi.org/10.3390/microorganisms11020382
Chicago/Turabian StyleLarson, James, Monika Tokmina-Lukaszewska, Hunter Fausset, Scott Spurzem, Savannah Cox, Gwendolyn Cooper, Valérie Copié, and Brian Bothner. 2023. "Arsenic Exposure Causes Global Changes in the Metalloproteome of Escherichia coli" Microorganisms 11, no. 2: 382. https://doi.org/10.3390/microorganisms11020382
APA StyleLarson, J., Tokmina-Lukaszewska, M., Fausset, H., Spurzem, S., Cox, S., Cooper, G., Copié, V., & Bothner, B. (2023). Arsenic Exposure Causes Global Changes in the Metalloproteome of Escherichia coli. Microorganisms, 11(2), 382. https://doi.org/10.3390/microorganisms11020382