Article

Load-Bearing Morphing Actuator: Modelling and Testing of Elastomer-Interfaced SMA Hybrid Composites


by
Gregorio Pisaneschi
*,
Carlo Gotti
,
Francesco Mongioi
,
Andrea Zucchelli
and
Tommaso Maria Brugo
Department of Industrial Engineering, University of Bologna, Viale del Risorgimento 2, 40136 Bologna, Italy
*
Author to whom correspondence should be addressed.
Actuators 2026, 15(8), 416; https://doi.org/10.3390/act15080416
Submission received: 30 June 2026 / Revised: 24 July 2026 / Accepted: 27 July 2026 / Published: 29 July 2026
(This article belongs to the Special Issue Innovative Actuators Based on Shape Memory Alloys—2nd Edition)

Abstract

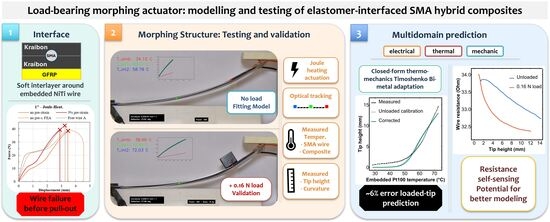
Shape Memory Alloy Hybrid Composites (SMAHCs) are promising for morphing structures. However, their transition from laboratory laminates to reliable actuators is hindered by interfacial delamination and the complexity of running real-time control modelling. We address both challenges with a single device and model. We manufactured an elastomer-interfaced SMAHC (E-SMAHC) in a two-step autoclave process that co-cures a rubber-like interface to relieve interfacial shear and embeds a Pt100 sensor adjacent to the wire. We modelled the laminate with a single Timoshenko bimetallic formulation combined with Turner’s effective coefficient of thermal expansion, which lumps the wire’s transformation into a single temperature-dependent coefficient, and added a Euler–Bernoulli contribution for the tip load. We actuated the cantilever by localised Joule heating at three power levels, both unloaded and under a tip load. We calibrated the model coefficients using the unloaded tests. With only the Euler–Bernoulli contribution for the tip load added, the model predicted the loaded tip position with an NRMSE of 6.2–11.7%. An a posteriori refit of the temperature shift using the loaded test data reduced the error to 5.8–6.4%. A preliminary diagnostic further indicates that the wire resistance contains an actuation-related signal, motivating its future evaluation as a possible feedback coordinate. The results provide a proof-of-concept demonstration of an elastomer-interfaced SMAHC actuator and a compact modelling approach under the investigated loading and heating conditions.

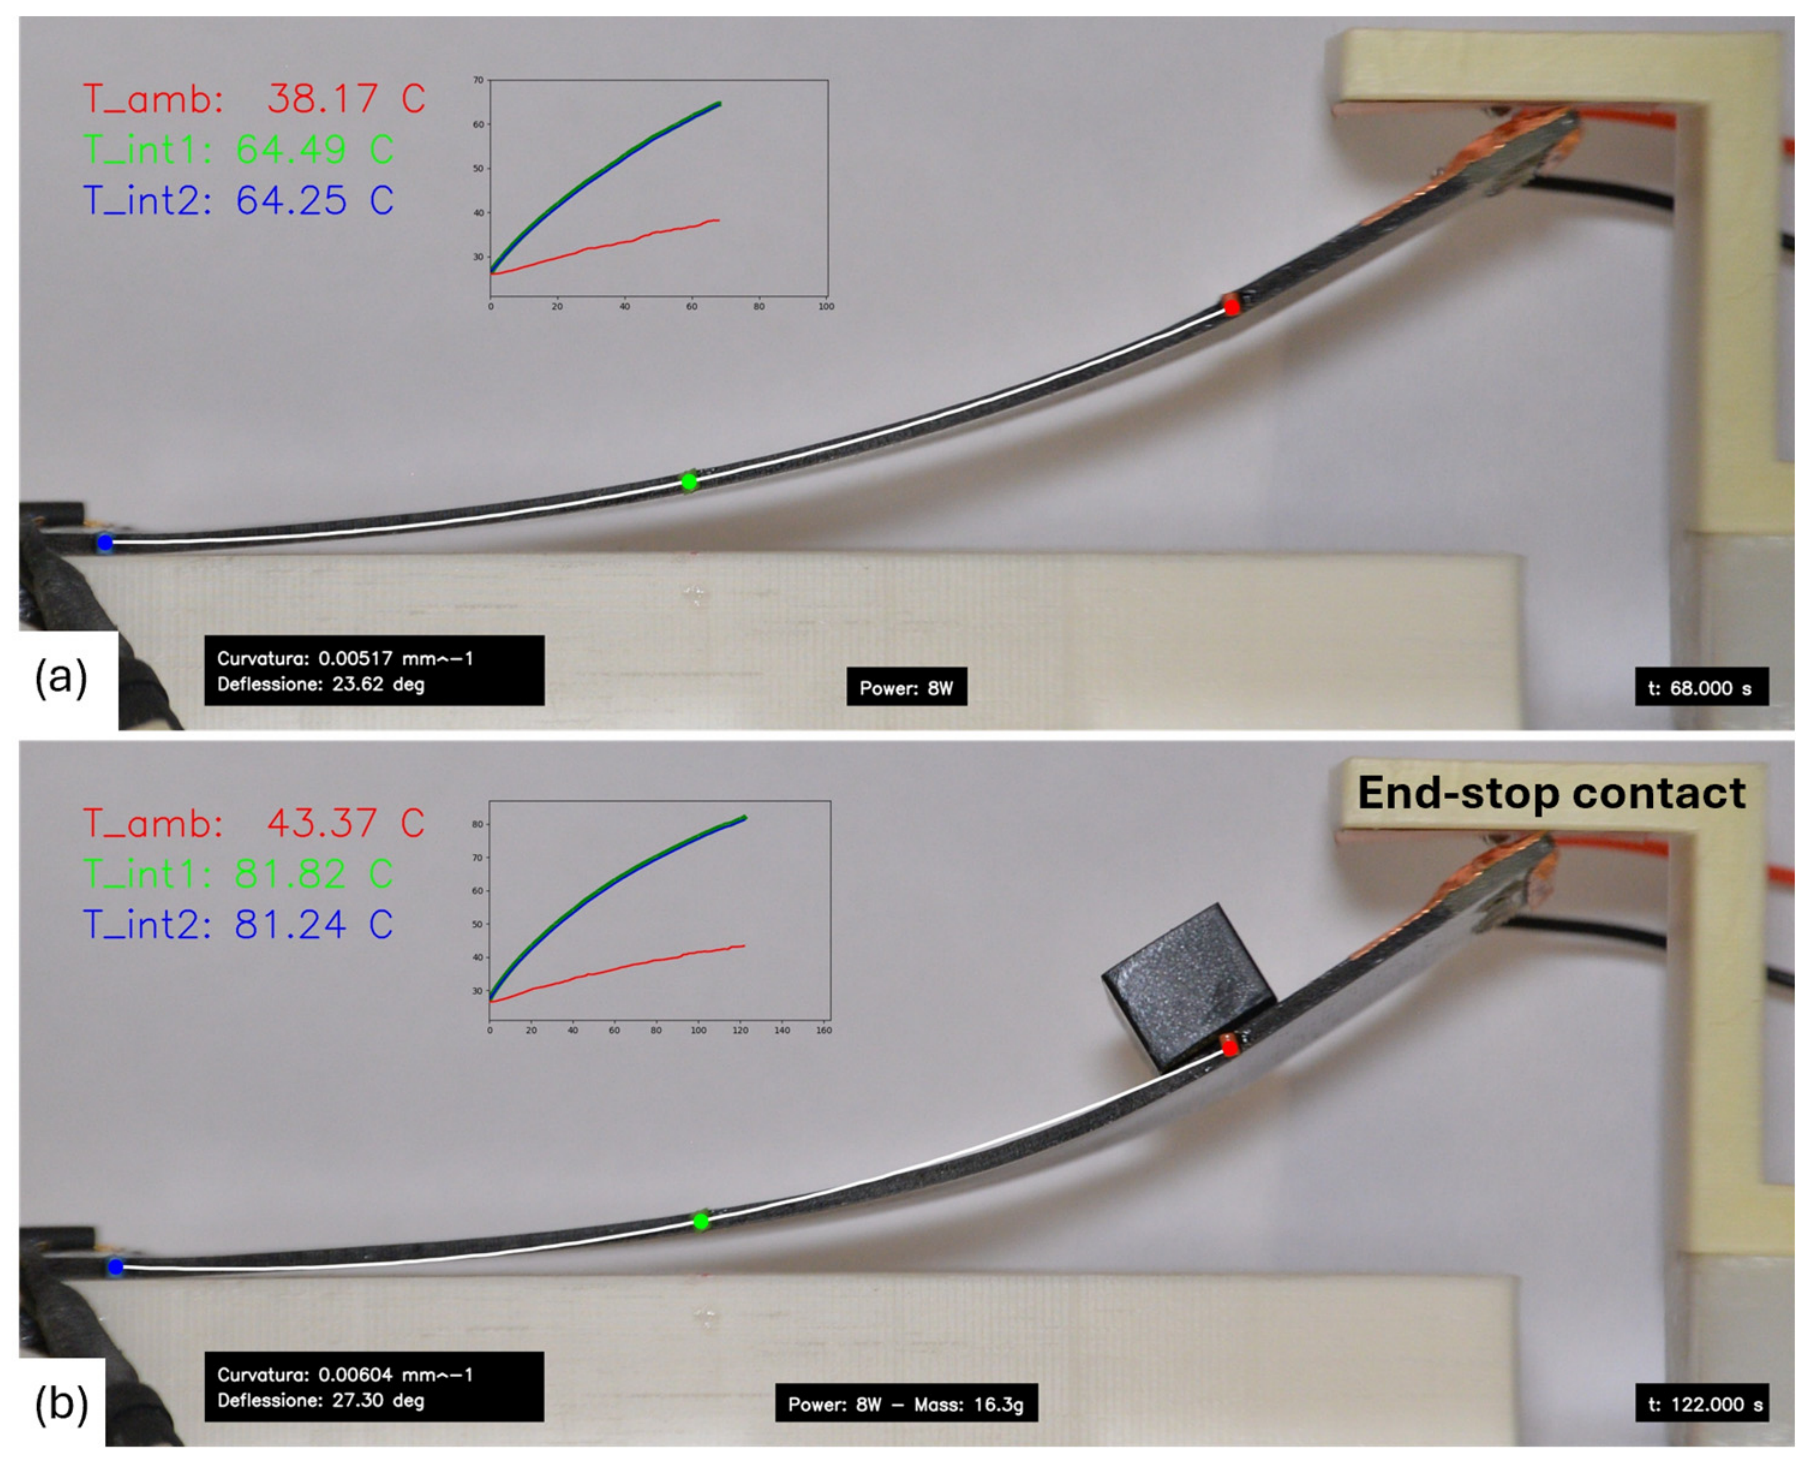
Graphical Abstract

1. Introduction

Shape Memory Alloy Hybrid Composites (SMAHCs) combine the large recoverable strains of nickel–titanium (NiTi) shape memory alloys (SMAs) with the stiffness and low weight of fibre-reinforced polymers [1]. Heating an embedded SMA wire above its austenite-start temperature drives the martensite-to-austenite transformation, recovering the pre-strain and contracting the wire. When a wire is bonded far from the neutral axis of a laminate, its contraction produces an internal bending moment that morphs the structure [2]. This makes SMAHCs attractive for adaptive aerofoils, deployable panels, and other morphing devices [3,4,5].
The wire–matrix interface is the main obstacle. The strain mismatch between the transforming NiTi and the surrounding polymer concentrates shear stress at the boundary, and brittle epoxy matrices tolerate little of it. Hence, a directly embedded wire usually debonds before the transformation is complete [2,6]. Surface treatments and geometric anchoring each increase the pull-out force, but none allow the embedded wire to fully transform and reach its own fracture strength without first delaminating [7,8].
In earlier work, we replaced the stiff bond with a thin elastomeric interlayer (KRAIBON®) co-cured between the wire and the glass-fibre-reinforced polymer (GFRP). Pull-out tests showed that the elastomer carries load throughout the stress-induced martensitic plateau up to wire breakage, and a finite-element (FE) study found that the same interlayer lowers curing residual stresses by orders of magnitude [9]. Soft elastomeric matrices, including silicone, have likewise hosted SMA wires for large-deformation morphing, but in those systems, the load is carried by mechanical end-fittings rather than a bonded interface [10,11,12]. Recent structural SMAHC studies have instead integrated SMA sheets into glass–epoxy beams or improved direct NiTi-wire/GFRP adhesion through dedicated surface treatments [13,14]. Our architecture differs by embedding pre-strained wires through a localised elastomeric interlayer, which transfers the recovery force into the stiff GFRP without permanent mechanical anchors or special wire-surface treatment. The present work applies this previously validated interface [9] to Joule-heated morphing against an external load. Two gaps separate that material from a working actuator. The first is the operating condition: our validation so far used a superelastic (SE) wire with no pre-load or external load [9], whereas a deployable actuator uses a shape memory effect (SME) wire with pre-strain driven by Joule heating and must overcome a resisting force. The second gap is the model. A closed-loop controller needs a model that predicts tip position from a sensor reading under load and Joule heating. Macroscopic constitutive and electro-thermal models map current to temperature, phase, and displacement for wire-form SMA actuators [15]. Effective coefficient of thermal expansion (CTE) models capture SMAHC thermos-mechanics within FE analysis [16], and analytical beam formulations predict the bending of SMA composite cantilevers, including under a tip load [10,17]. Fully coupled electro-thermo-mechanical and dynamical models achieve high fidelity in this regime [11,18], but their many measured parameters and numerical solves keep them out of a real-time loop. No simple closed-form model for real-time control under load and Joule heating exists for this system.
This paper addresses these gaps through a proof-of-concept actuator-level investigation. We drive an elastomer-interfaced SMAHC (E-SMAHC) cantilever by Joule heating at three constant power levels, unloaded or with a tip load, and measure the wire temperature using a co-cured Pt100 sensor. We describe the laminate using a single Timoshenko bimetallic formulation that adapts to three cases by switching terms on or off: chamber heating, unloaded Joule heating, and loaded Joule heating, the last adding a Euler–Bernoulli beam term. The unloaded tests calibrate a phenomenological CTE, and the loaded tests evaluate its transfer to the same actuator under a 0.16 N tip load. We also explore whether the wire’s electrical resistance provides an actuation-related signal suitable for future feedback applications.
To the authors’ knowledge, this is the first demonstration combining pre-strained NiTi wires, a localised elastomeric load-transfer layer, clamp-free integration into a stiff GFRP laminate, and bending actuation under an external tip load.

2. Materials and Methods

2.1. Materials and Characterisation

The actuator used a NiTi shape memory wire (SmartFlex 02, SAES Getters IT, Lainate, Italy), 0.2 mm in diameter, with an austenite-start temperature of 75 °C. The manufacturer trained the wire by heating it under constant stress, which provided repeatable strokes across cycles. The wire was supplied with the manufacturer’s amber surface finish and was embedded in the as-received surface condition. We did not apply chemical or mechanical surface treatment; before layup, the wire was cleaned with isopropyl alcohol. For full actuation in the pull-out tests, we applied 0.4 A DC and verified that the transformation occurred under quasi-static conditions. We measured the transformation temperatures in a climatic chamber by ramping the temperature under constant loads of 0.5 kg (156 MPa) and 1.9 kg (593 MPa), the loads the datasheet associates with 3% and 5% strain, yielding As values of ~75 °C and ~135 °C at the two stress levels. We tested the wire in uniaxial tension at room temperature (martensite) and under Joule heating (austenite). The room temperature response showed a modulus of 18 GPa in the linear regime and a detwinning plateau near 65 MPa; the heated response showed a modulus of 72 GPa, a stress-induced transformation onset near 650 MPa, and an ultimate tensile strength near 1300 MPa. More information is reported in Supplementary File S1. The elastomeric interface (KRAIBON® AA6CFZ, KRAIBURG GmbH, DE, Waldkraiburg, Germany) and the GFRP prepreg (VV300S, Delta-preg, IT, Sant’Egidio alla Vibrata, Italy) matched the ply thicknesses in our previous study, 0.5 mm and 0.22 mm, respectively [9]. Dynamic mechanical analysis (see Supplementary File S1) of the cured elastomer showed a 30%+ drop in stiffness between 25 °C and 90 °C, the actuation range of our experiments.

2.2. Pull-Out Testing: Interface Validation

We validated the interface with pull-out tests, following the fixtures and method of our previous study [9]. Specimens were stacked from GFRP and KRAIBON® plies in 3D-printed moulds, four per condition, at two embedding lengths: 1/8 inch, below the length at which the transformation can develop, and 1 inch, close to the length at which the wire should break before it debonds [9]. For each length, we ran four conditions: room temperature (martensite) or Joule heating (austenite), with no pre-strain or 5% pre-strain.

2.3. E-SMAHC Manufacturing

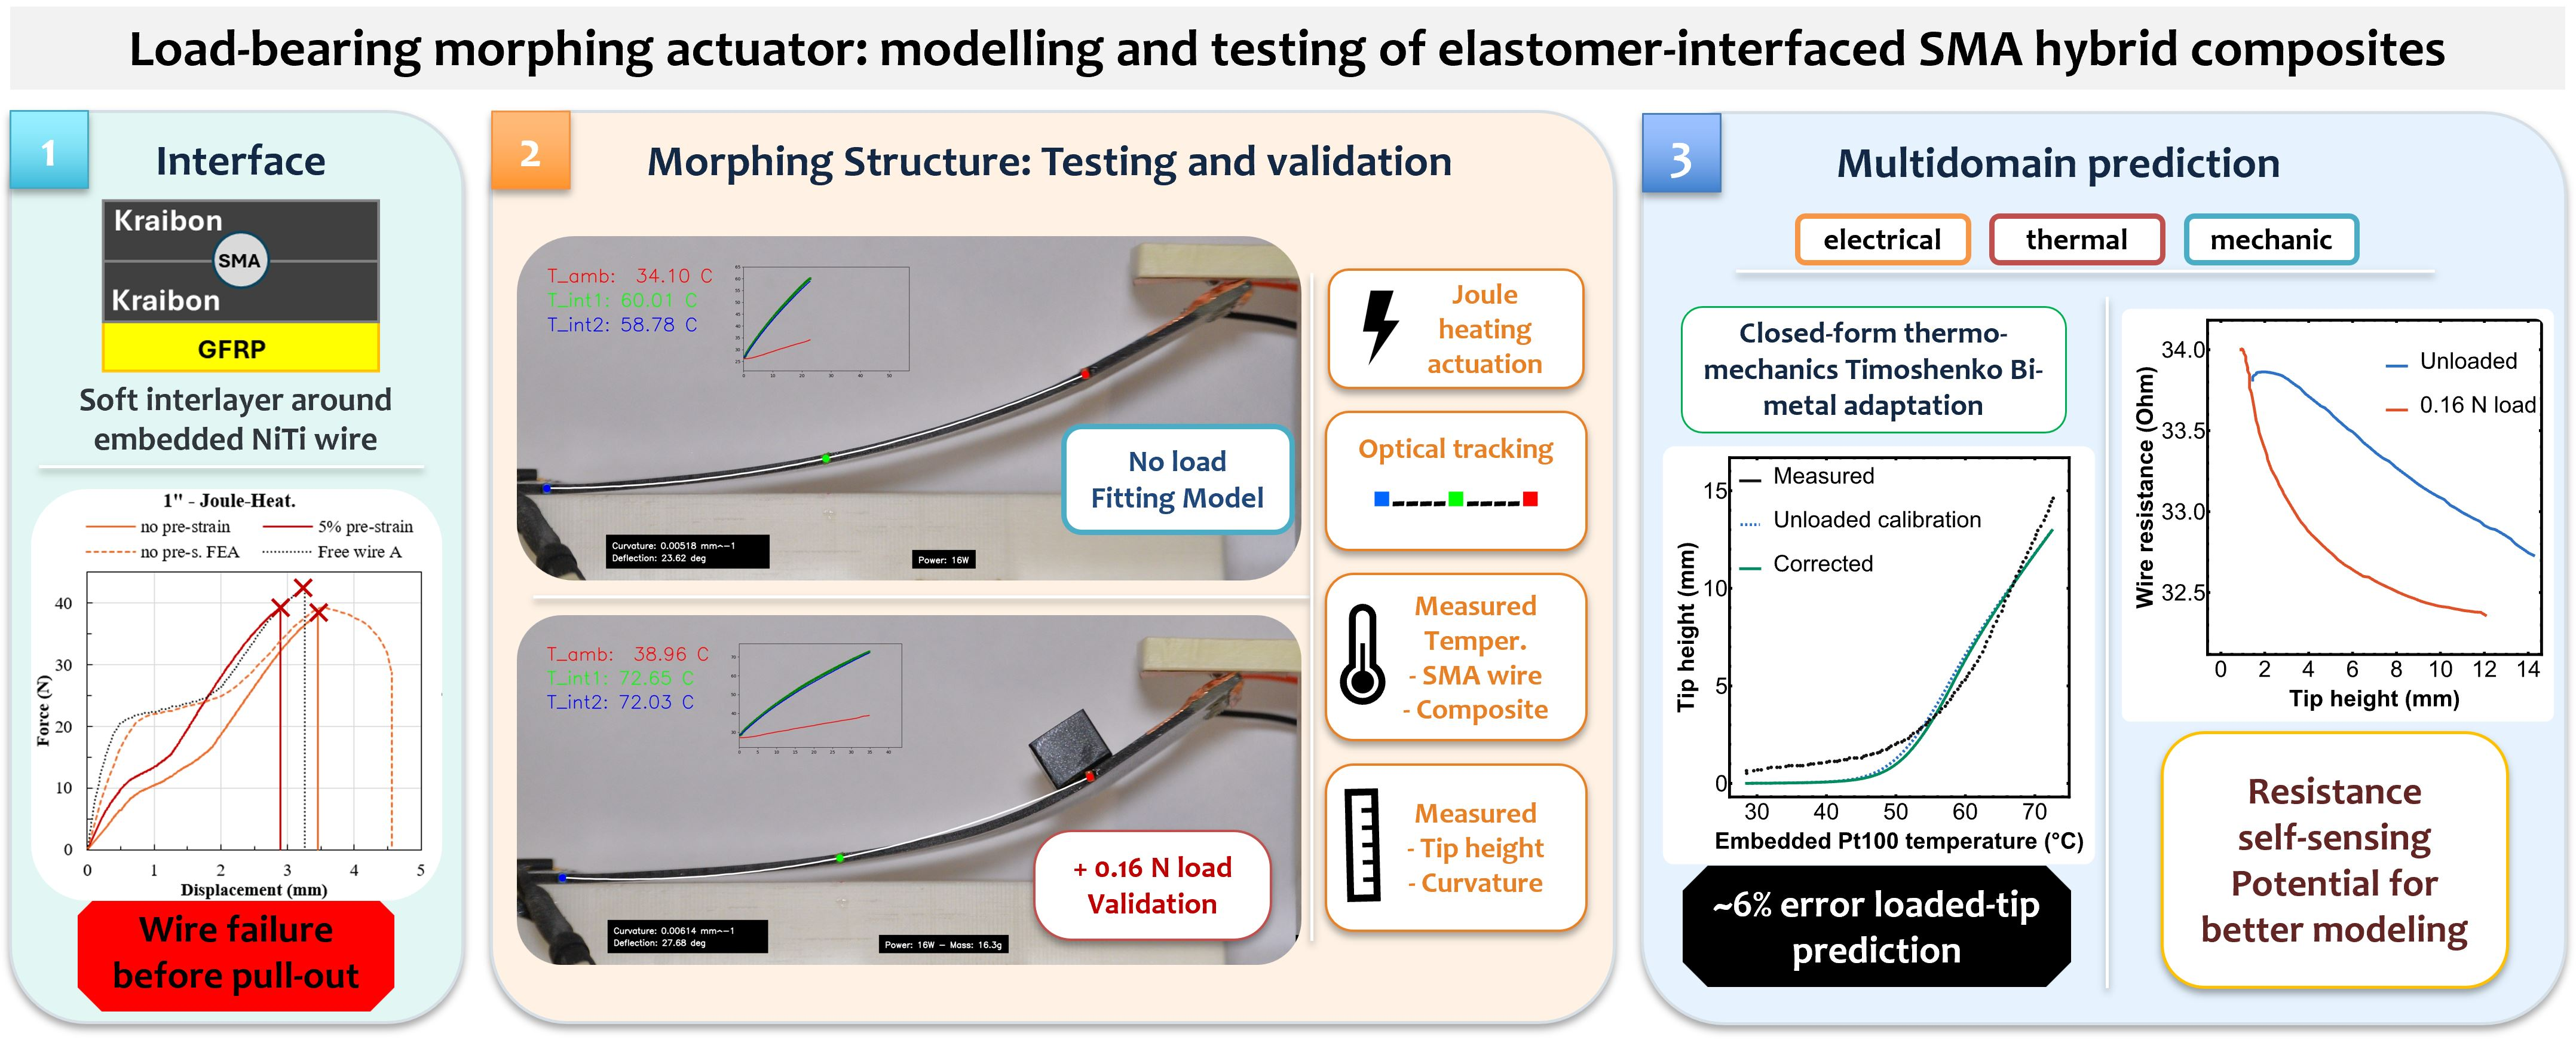
We manufactured the actuator in two autoclave stages, a sequence designed to keep the wire aligned, hold the pre-strain, and embed the temperature sensors without delamination. In the first stage (Figure 1a), we cured two anchoring tabs, each consisting of a GFRP–KRAIBON® stack with the wire embedded 20 mm into the elastomer; this length prevents the wire from pulling out before fracture.
We then stretched the tabs (Figure 1b) to 5% pre-strain (1.9 kg, 593 MPa). In the second stage (Figure 1c), we laid the pre-stressed assembly into the final stack, [KRAIBON®/SMA/KRAIBON®/GFRP ±45°2], and co-cured two Pt100 (666-7362, RS PRO, IT, London, UK) sensors (1: “Uno” and 2: “Due”) placed in contact with the wire inside the laminate (Figure 1d) at x = 0, corresponding to the end of the active beam where bending begins. Both stages used the same curing cycle as the pull-out specimens: 120 °C for 120 min, 3 bar pressure, 0.95 bar vacuum, and 2 °C/min ramps. 3D-printed PLA masks aligned the wire and located the sensors, and brass blocks were used to curve the wire and clamp it at the ends. The active length between the anchoring tabs was 81 mm. More information is reported in Supplementary File S1. The tensile tests in Supplementary File S1 show elastic recovery of martensite upon unloading. After unloading, elastic recovery likely reduced the nominal 5% pre-strain by approximately 1%, with further losses possible during layup. Consequently, the stress retained during curing was lower than 593 MPa and was not measured. Its phase state during curing was not measured in situ and therefore cannot be stated conclusively.

2.4. Analytical Model: Modified Timoshenko Bimetal Equations

We described the laminate as a two-layer Timoshenko bimetallic beam [19]. Layer 1 groups the SMA wire and the KRAIBON® elastomer; layer 2 is the GFRP. Because the wire contributes little to the layer’s bending stiffness while its axial contraction provides the active strain, layer 1 uses the elastomer modulus and represents the wire contraction through α1(T). Following Turner [16], we lumped the SME wire contraction into a temperature-dependent effective CTE, α1(T), for layer 1. The wire does not expand but contracts with rising temperature; expressing it this way lets a standard bimetal model to reproduce the bending from a single coefficient. With the two layers differing sharply in stiffness (E1·I1/E2·I2 ≈ 1/160 and E1·a1/E2·a2 ≈ 1/826), the bimetal denominator reduces to kden = h/2 + 2·E2I2/(h·E1·a1) ≈ 19.2 mm (see Supplementary File S2), which sets how much curvature a given thermal mismatch produces. The curvature law, with a measured rest curvature κ0, is
κ(T) = κ0 + [α1(T) − α2]·(T − T0)/kden
An asymmetric laminate cured flat does not stay flat: cure shrinkage and the locked pre-strain leave a residual curvature at room temperature. We therefore added a constant κ0, measured from the coldest unloaded frames. We modelled α1(T) as a sigmoid,
α1(T) = a + b/(1 + exp[−m·(T − Tm)])
where a is the pre-transformation level, b the transformation amplitude, Tm the inflexion temperature, and m is the steepness. One formulation covers three actuation cases by switching terms on or off. Under uniform chamber heating, both layers are hot, and the GFRP thermal term is present (α2 ≈ 14 × 10−6 °C−1). Under Joule heating, we approximate only the wire as hot: the laminate face stays near ambient (the “Amb” Pt100 on the KRAIBON® surface, reported in Table 1 as Tend, matrix, peaks at 40 °C, with the GFRP expected to be cooler), so the GFRP term drops out; the omitted strain remains below 0.3% of the wire term at its peak (see Supplementary File S2).
Unloaded, the heated beam forms a uniform-curvature arc, and the tip height is determined directly by the curvature. A tip mass opposes the thermal lift, and the beam no longer lifts as a whole: it peels off the base from the tip inward, with a length ℓ near the tip rising while the rest stays flat. Curvature is continuous along the beam, and the recumbent part, pressed flat against the rigid base, has zero curvature, so the net curvature is zero at the lift-off point. Setting it to zero, κthFg·/EIeq = 0, with κth(T) = κ0 + α1(T)(TT0)/kden, fixes the lifted length:
ℓ(T) = κth(T)·EIeq/Fg
where EIeq is the equivalent bending stiffness of the bonded layers (EIeq ≈ 2.7 × 10³ N·mm2; see Supplementary File S2). Note that width cancels in the curvature law, since the thermal curvature of a bimetallic strip does not depend on it, while it is retained in the deflection model through EIeq, the real cross-section bending stiffness, because the tip load Fg acts on the physical beam. The net curvature rises linearly from zero at lift-off to κth at the tip; integrating twice gives the partial-contact tip height,
ytip(T) = EIeq2·κth(T)3/(6·Fg2)
valid while a recumbent part exists, L. Once = L, at κth = Fg·L/EIeq, the beam is fully airborne and behaves as a root-clamped cantilever under thermal curvature and tip load:
ytip(T) = κth(T)·L2/2 − Fg·L3/(3·EIeq)
The load is applied only through the known weight Fg and the stiffness EIeq; no mechanical parameters are fitted to the loaded data. We identified α1(T) from the unloaded tests, where curvature is measured directly over the full range. Fitting through the measured curvature, rather than point-wise α1, avoids dividing by (TT0) and amplifying noise near room temperature. In the loaded tests, tip height depends cubically on curvature, making it difficult to estimate the sigmoid shape parameters. We therefore considered two curves. The unshifted prediction uses all four parameters (a, b, m, and Tm) from the unloaded calibration, with no fitting to the loaded data. For the shifted curve, a, b, and m remain fixed at their unloaded values, while only Tm is fitted to the loaded data to account for the sensor lag. Further details on the modelling, simplifications, and parameters are in Supplementary File S2. To summarise, the assumptions of the modified Timoshenko bimetal model are:
  • 1D, uniform width, and symmetric wire layout;
  • Quasi-static; heating branch only (cooling and hysteresis not modelled here);
  • Joule: only the wire heated → α2 = 0 (omitted strain < 0.3% of SMA term);
  • Rest curvature κ0 measured, not fitted → sigmoid keeps four parameters;
  • Simplified denominator: error < 1% versus the exact classical bimetal solution;
  • Loaded: small-deflection (error estimated at ~1% at the max ~25° tip rotation); rigid, frictionless, and flat base.

2.5. E-SMAHC Testing: Climatic Chamber, Joule Actuation Rig and Protocol

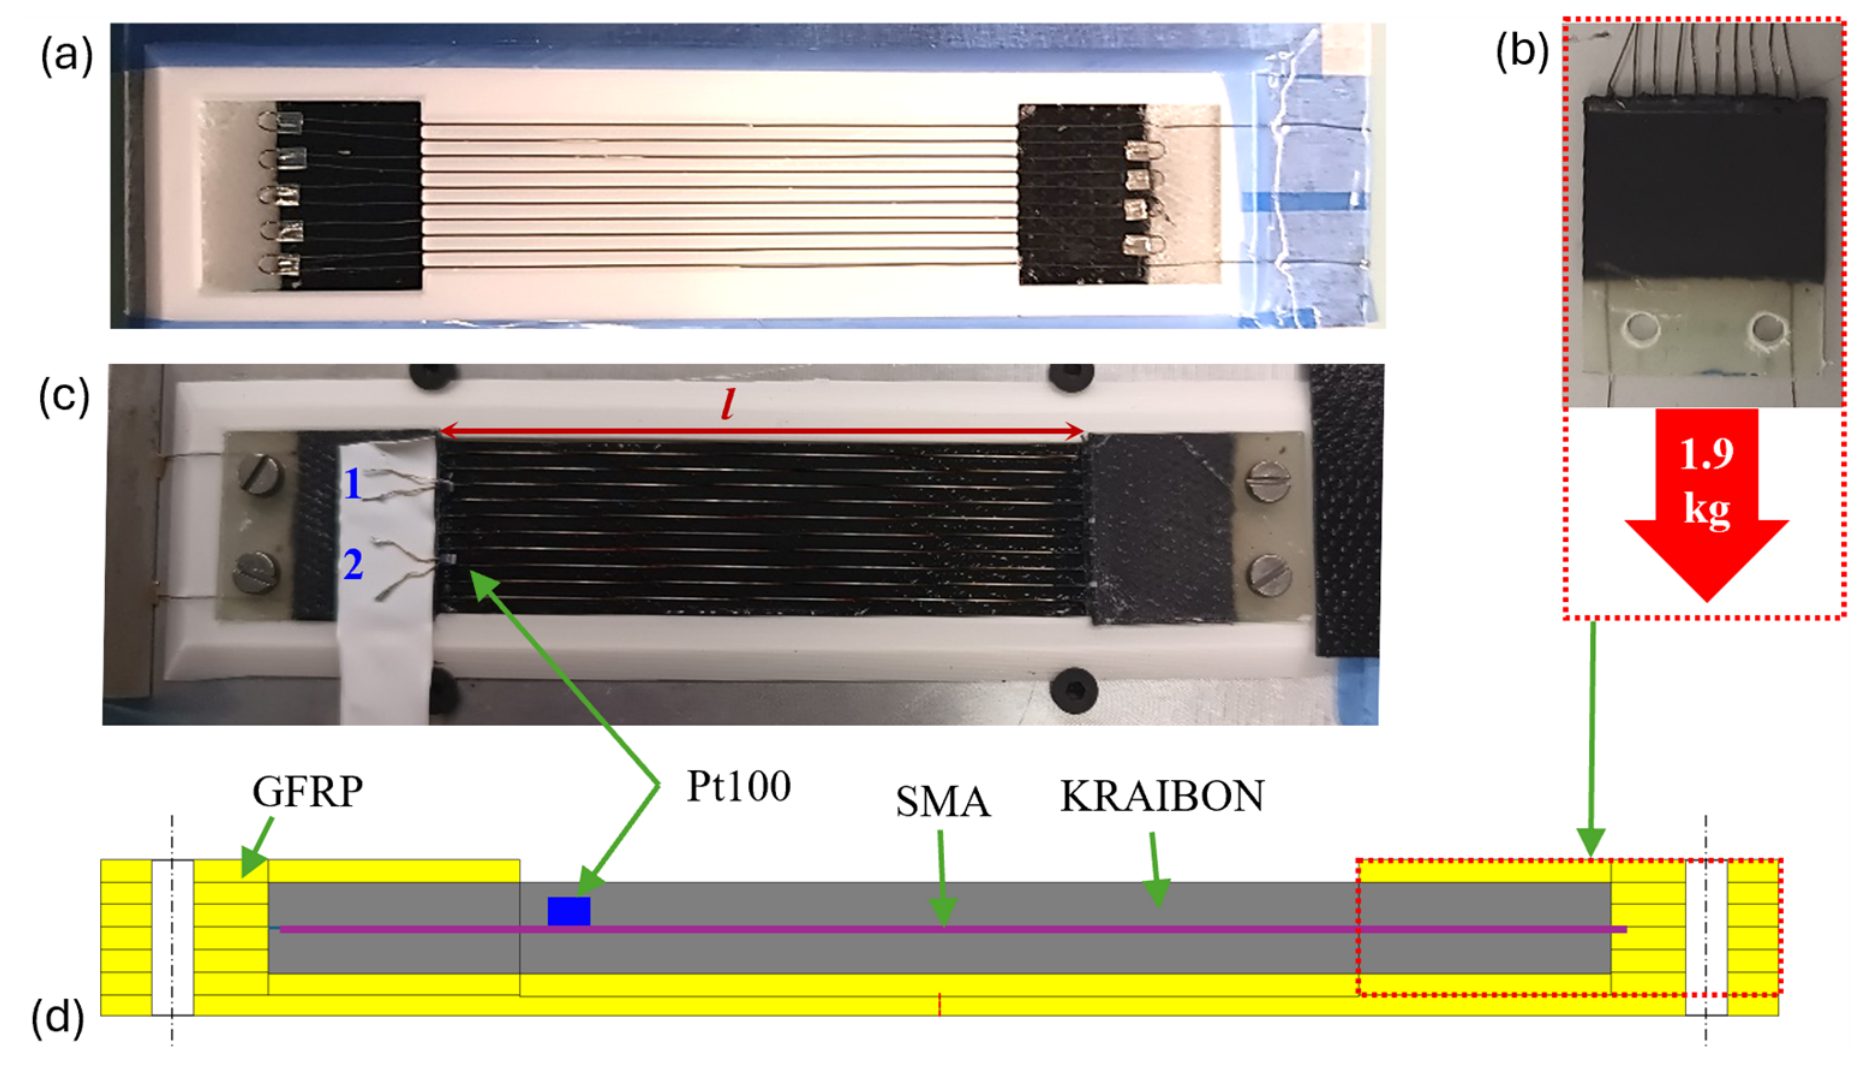
To test the E-SMAHC, we clamped one end (Figure 2), and a camera tracked three optical markers along the beam: a blue clamp marker at the fixed end (the origin), a green mid-span marker at L/2, and a red tip marker at the free end (L = 81 mm, the active length). The frame interval ranged from 0.5 to 10 s, depending on the heating speed. During the test run in the climatic chamber, we ramped the temperature continuously at 5 °C/min while logging data from the two embedded Pt100 sensors and one ambient Pt100 sensor. We synchronised the temperature and curvature time series, applied a Gaussian filter and linearly interpolated the Pt100 signal at the optical timestamps to generate paired {T, κ} data. This test served as a quasi-static actuation reference for temperatures, one order of magnitude slower than Joule heating, and fixed the tip height in the Joule heating experiments. The curvature reported for each frame was calculated from the circumcircle passing through the three marker centres. This approximation is most appropriate for the unloaded beam, which approaches a circular arc. In the loaded configuration, the analytical peeling-beam model instead accounts for the spatial variation of curvature, while the three-marker curvature is retained as an experimental descriptor. More information is reported in Supplementary File S2.
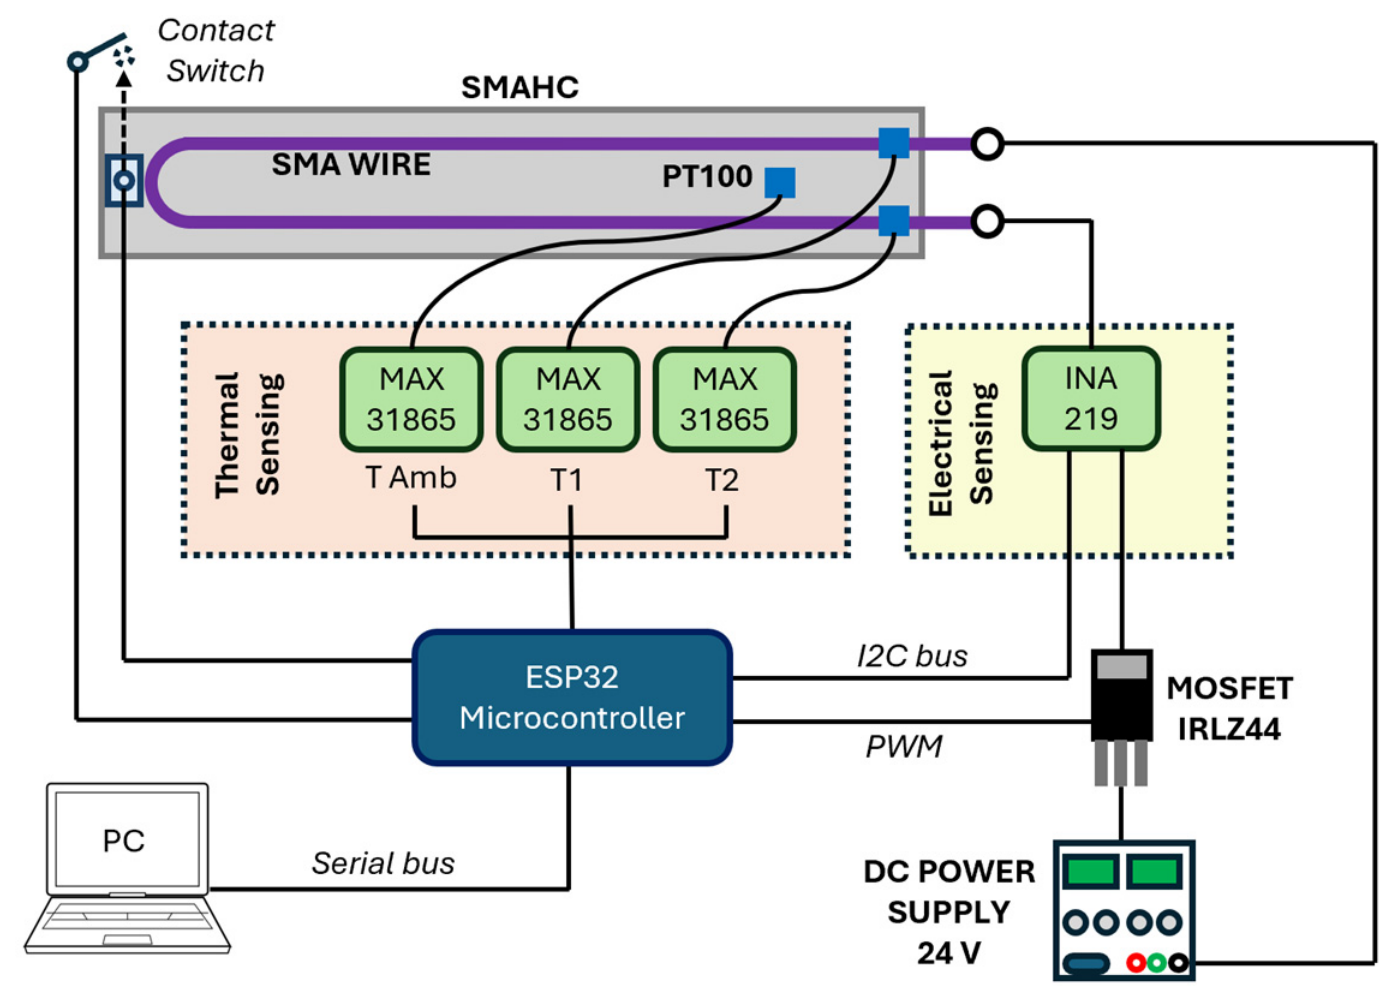
In the Joule heating experiments, a contact end-stop (Figure 2b) capped the tip at the maximum height reached in the climatic chamber, cutting the power when triggered. For both the chamber and the Joule heating experiments, we report only the heating branch; the cooling branch and its hysteresis are outside the scope of this study. For the Joule heating actuation test, we drove the wire with a pulse-width-modulated (PWM) MOSFET at 5 kHz under the control of an ESP32 (Figure 3).
A current monitor (INA219) sampled the bus voltage and current at 10 Hz, averaging 30 reads per sample, and three four-wire Pt100 sensors (MAX31865) measured the wire-contact and outer-shell laminate temperatures. The controller held the electrical power constant with a feed-forward estimate of the duty from the target power and the 33.4 Ω wire resistance (measured with an LCR), then trimmed it with a ±50 mW feedback deadband. We ran three power levels, 8, 12, and 16 W, each unloaded and with a 16.3 g tip mass (Fg = 0.16 N). Each power/load condition was tested once on the same actuator specimen; therefore, these tests provide controlled comparisons but do not quantify cyclic repeatability. The complete peeling-beam derivation, parameter definitions, and calculation of the load contribution are provided in Supplementary File S2.
Under PWM, the wire conducts only during the on-fraction of each cycle. At the same time, the bus voltage tracks the supply voltage, so the logged ratio of voltage to current overestimates the on-state resistance by the inverse of the duty cycle. We recovered the true wire resistance in post-processing as R = (V/I)·(D/1023), with D the 10-bit duty. The duty-corrected mean resistance agreed with the 33.4 Ω value used in the controller feed-forward. The correction was applied point by point using the duty value logged by the controller and introduced no fitted parameters. Videos of the climatic chamber and actuation tests, with and without a tip mass and with wire temperature tracking, are provided in the Supplementary Materials (Movie S3–S5).

3. Results and Discussion

3.1. Wire and Interface Characterisation

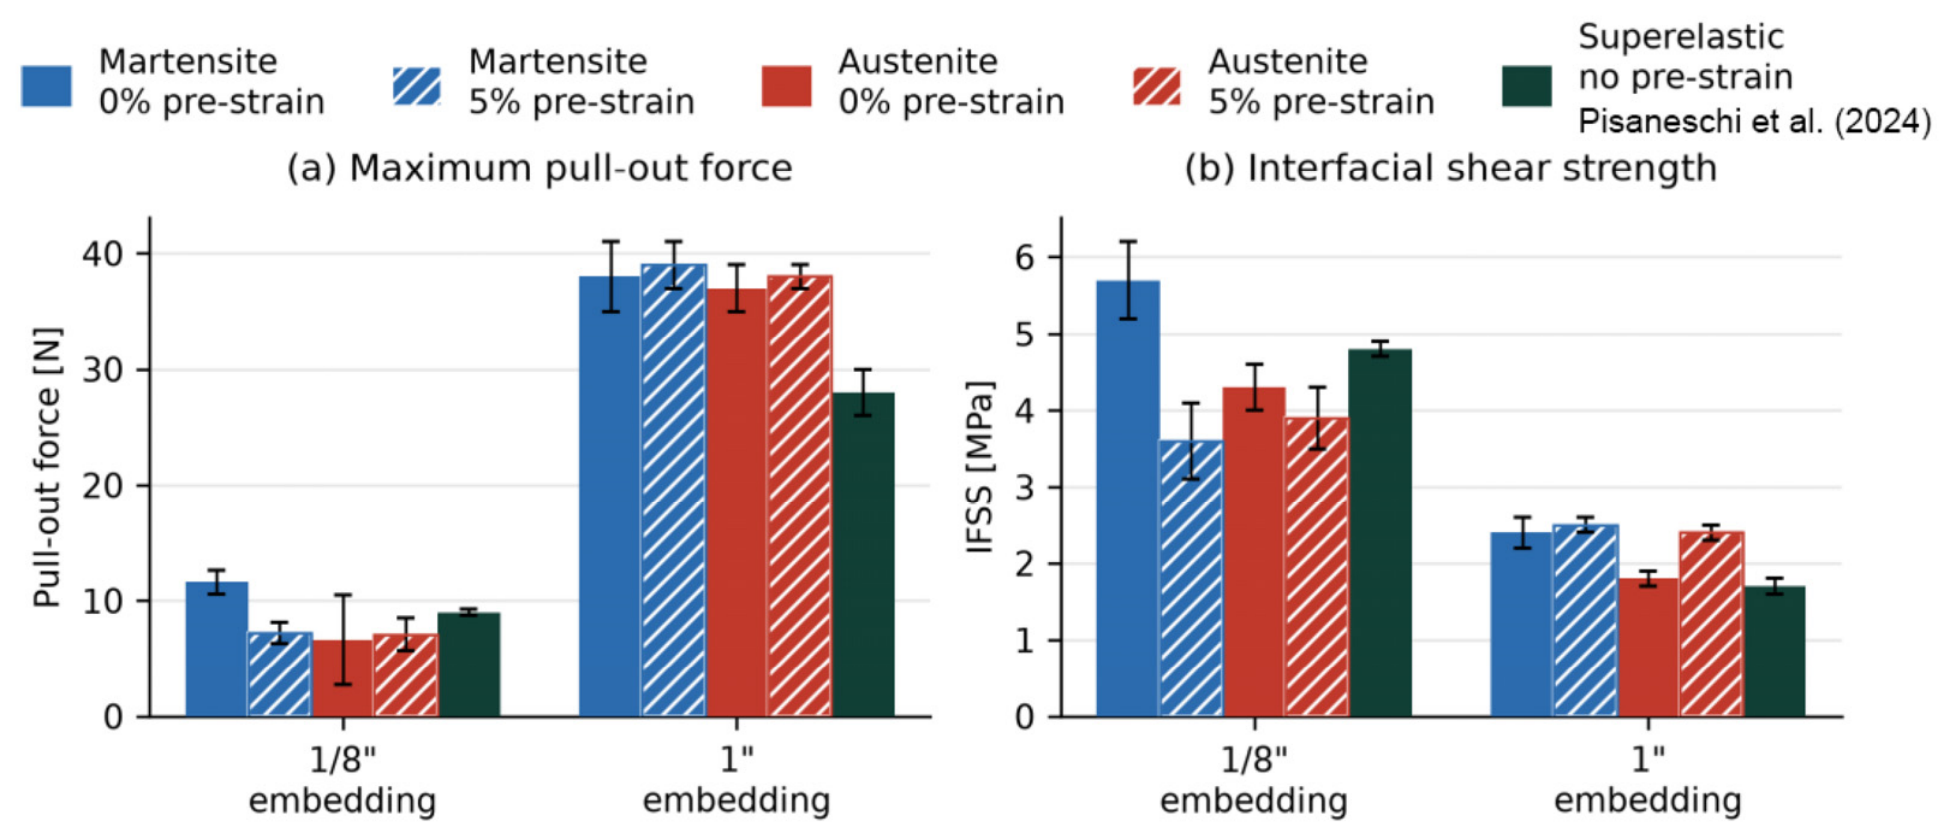
Figure 4 summarises the pull-out results against the superelastic (SE) wire data from our previous study [9]. At the 1/8-inch embedding length, the SME and SE specimens showed comparable interfacial shear strengths. The 1-inch specimens gave the key result. The wire fractured before the interface debonded in every specimen, across martensite, austenite, and both pre-strain levels. To our knowledge, this is the only reported interface whose strength exceeds the tensile strength of the embedded SMA wire, so the wire breaks before it pulls out, even under the actuator’s SME conditions. This extends our earlier interface result from SE to SME wires under the thermomechanical conditions in this study.

3.2. Joule Actuation Overview

Table 1 summarises the six actuation tests. With the target height fixed, the three unloaded tests on the same specimen reached the same endpoint curvature at all three investigated power levels (5.2 × 10⁻³ mm−1), indicating consistency. The temperature measured at the contact point decreased as power increased; this is a sensor effect we examine in Section 3.3. The loaded specimens needed more time and a higher recorded temperature to reach the same height, and they reached a higher peak curvature than the unloaded ones (~6.0 × 10⁻³ mm−1 against 5.2 × 10⁻³ mm−1) at every power level. Lifting the tip to the target height against the added load requires greater thermal curvature, as predicted by the loaded model (Section 3.4).
Table 2 reports the electrical performance. The controller held power within 1% in all tests, confirming power as the controlled variable at the three distinct levels. After duty correction, the mean wire resistance was consistent across the six tests (33.1 to 33.6 Ω), as expected for a single specimen, and matched the 33.4 Ω feed-forward value. Within each test, the resistance fell from ~34 Ω to ~32.5 Ω as the wire transformed to austenite.

3.3. Unloaded Calibration

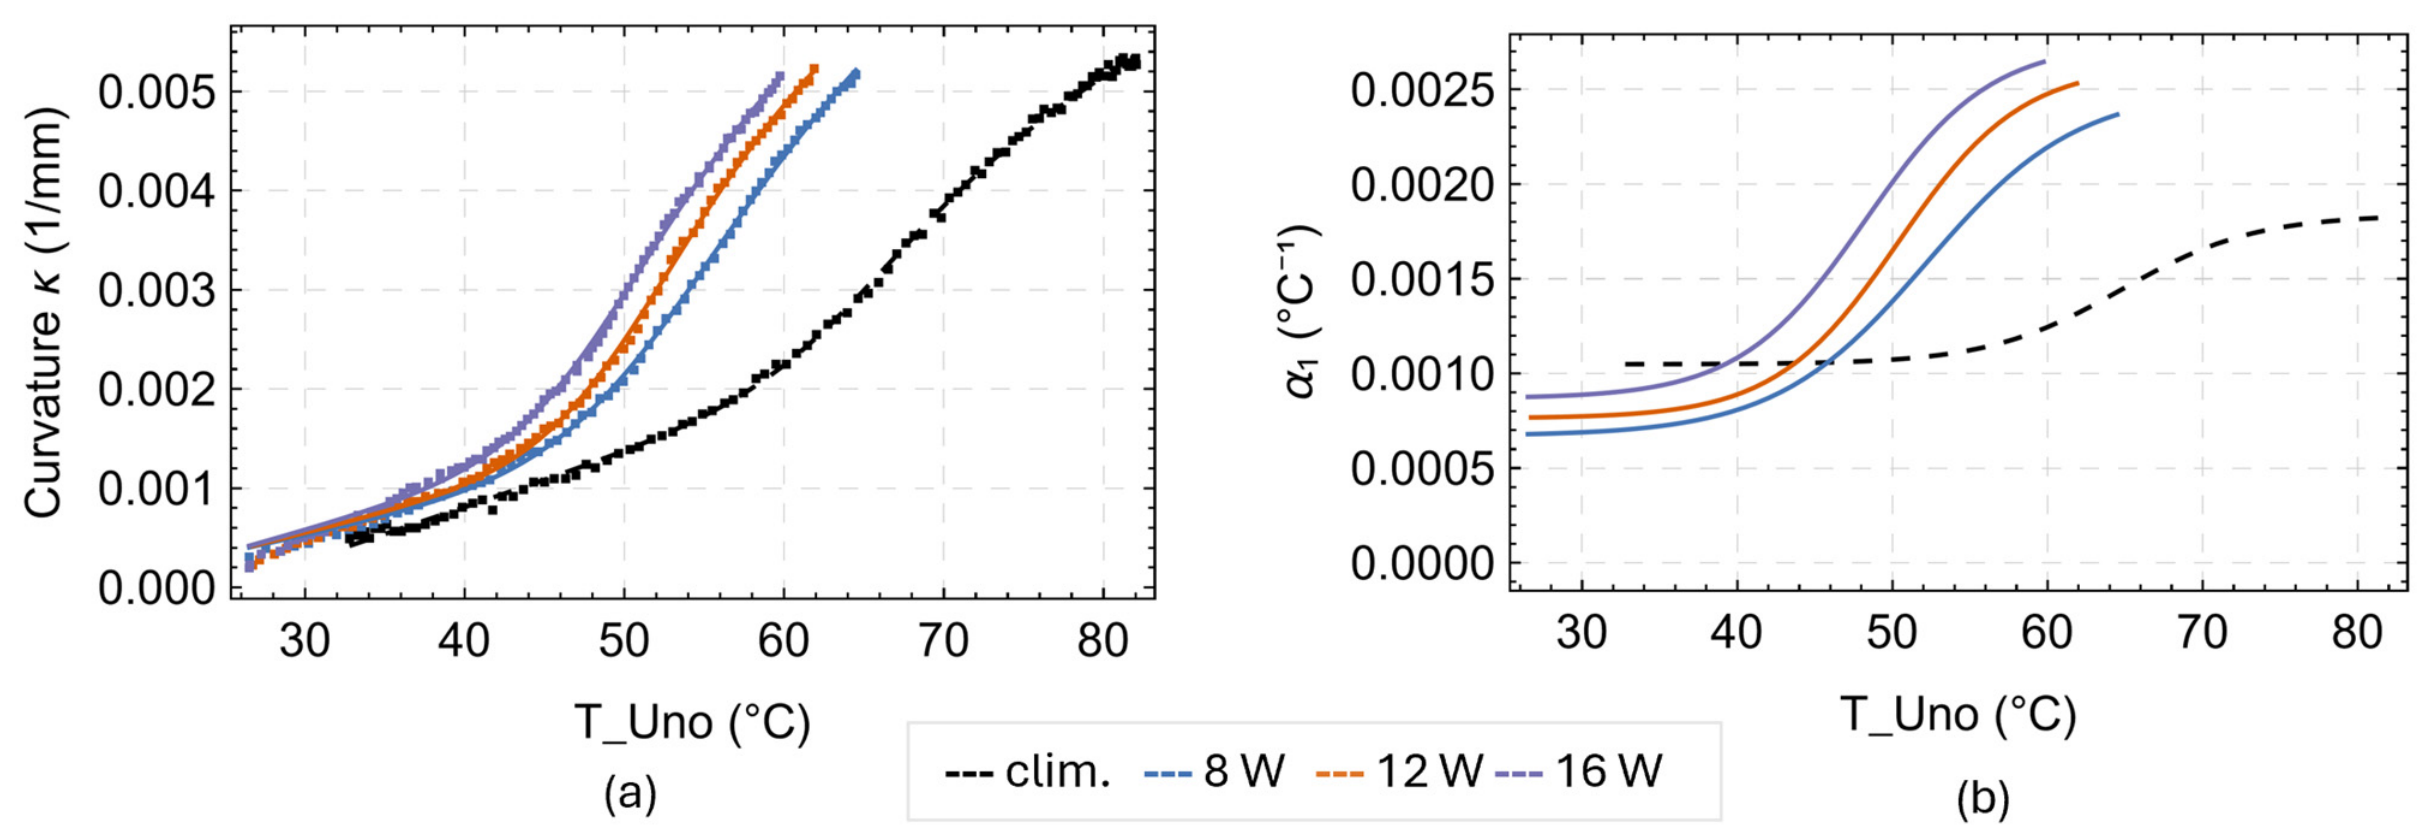
Figure 5 shows curvature versus embedded sensor temperature for the chamber reference and the three Joule powers, together with sigmoidal fits and the identified α1(T); Table 3 lists the parameters. The chamber fit uses κ0 = 0. For the Joule fits, the rest curvature measured from the cold, unactuated state was consistent across the three powers, κ0 = 3.5 × 10⁻⁴ mm−1, and we used this value for all of them.
Each power required a separate calibration because the measured curvature–temperature relation shifted with the heating rate. The lag is visible on the temperature axis: at a fixed curvature, the temperature is lower than the chamber one, and the gap widens with power (Tm = 64.8 °C for the chamber, then 52.2, 50.4, 48.2 °C at 8, 12, 16 W). This shift is consistent with the Pt100 reading being influenced by heat transfer between the wire and the surrounding matrix; longitudinal temperature gradients and modest rate effects may also contribute.
The transformation itself may also be rate-dependent. The characteristic transformation strain rate, estimated to the order of magnitude, was approximately 10−6 s−1 during climatic chamber heating and between 10−5 and 10−4 s−1 during Joule heating. Published results [20] indicate that detectable thermomechanical rate effects may begin within the latter range, although their magnitude remains limited. Accordingly, a modest rate-related contribution cannot be excluded, but the present measurements cannot separate it from sensor dynamics and spatially non-uniform heating. The power-dependent parameters are therefore treated as actuator-level calibrations rather than material constants.

3.4. Loaded Actuator Prediction

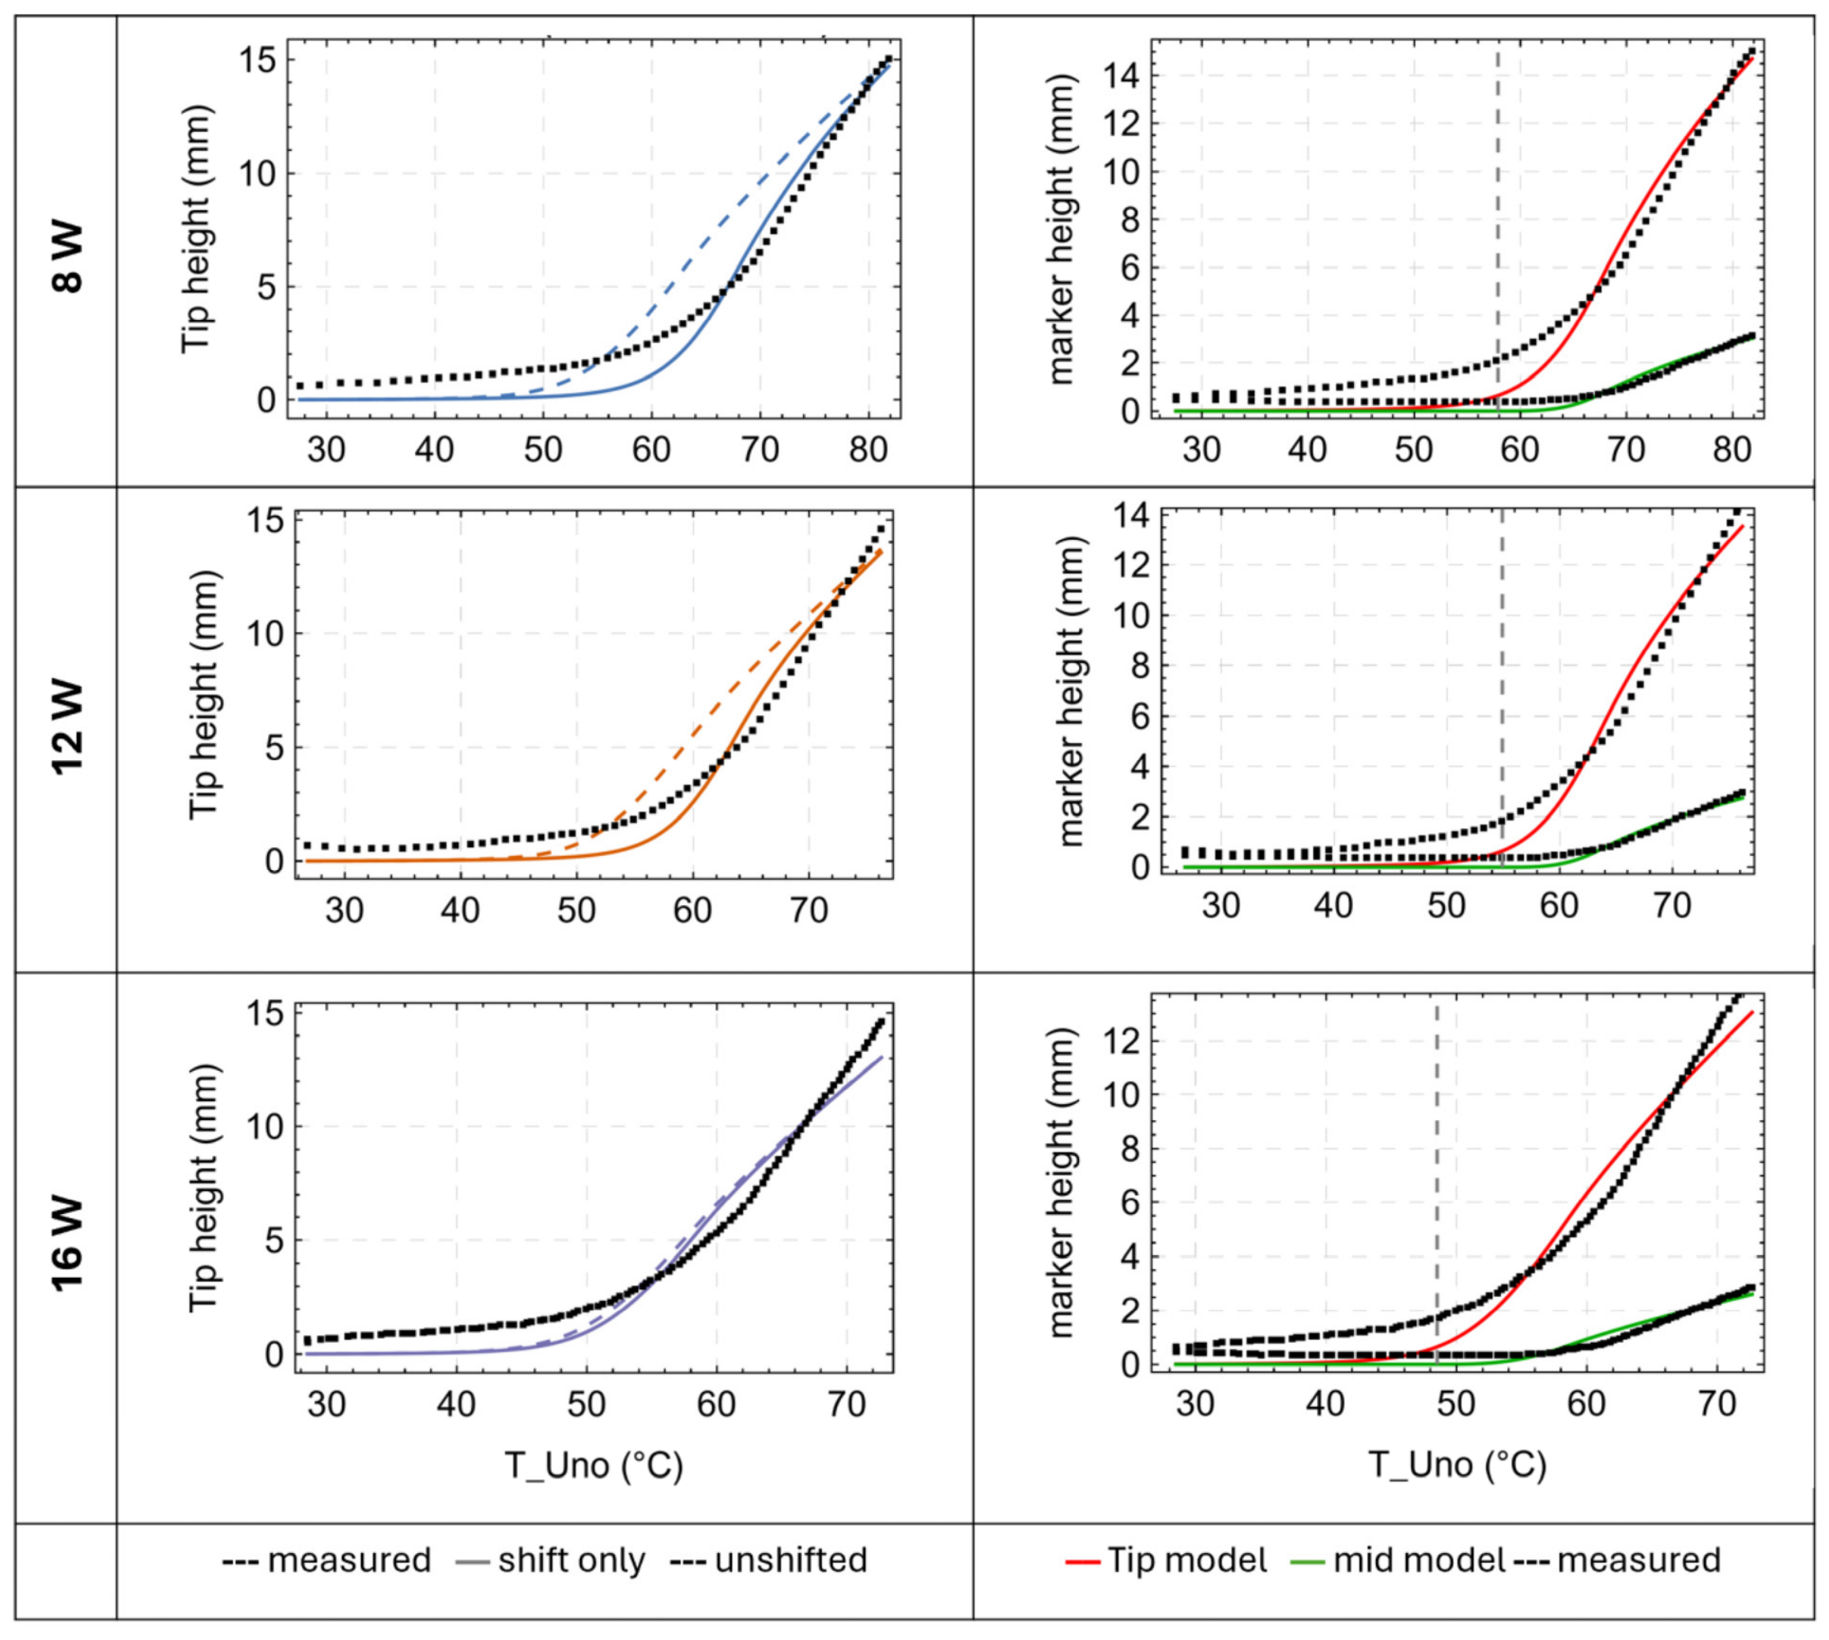
We started from the unloaded calibration and added the tip mass with no further fitting: the known weight Fg and stiffness EIeq alone predicted the loaded tip to within 6–12%, with the maximum error at low power (Figure 6, left; Table 4).
For the corrected curve, Tm was fitted to the loaded experiment data because the longer test increased the embedded sensor lag, similarly to the power-effect lag described in Section 3.3. The Fg term already accounts for the load, so the Tm shift does not modify the mechanical model. Because Tm was fitted to the loaded data, the shifted result is an a posteriori correction, with an NRMSE of 5.8–6.4% of full scale. In contrast, the unshifted result is the direct prediction based solely on the unloaded calibration and gives an NRMSE of 6.2–11.7%. The shift ΔTm was 10.3, 8.1, and 1.6 °C at 8, 12, and 16 W, respectively. It was almost negligible at 16 W, where the loaded and unloaded test dynamics were most similar. This trend supports a dynamics-dependent thermal origin and indicates that ΔTm may ultimately be estimated independently.
Every loaded test ran well past the partial-contact transition (grey dashed line, Figure 6, right); therefore, the cubic regime shaped only the early, low-temperature portion of the curve, while the cantilever regime governed the rest.
To check the model against data to which it was not fitted to, we tracked the mid-span marker. This marker remained flat until the lifting front reached it, after which it rose (Figure 6, right). The measured lift-off occurred 6–10 °C later than predicted across all power levels. This lift-off gap and the shift ΔTm are both consistent with a difference between the local Pt100 reading and the effective wire temperature governing actuation. Their different magnitudes may reflect the different stages of the transformation sampled by the mid-span lift-off and the complete tip trajectory. Because the mid-span marker was excluded from the fitting, its behaviour independently supports the peeling geometry and is qualitatively consistent with the proposed thermal lag interpretation.

3.5. Resistance as a Transformation Diagnostic

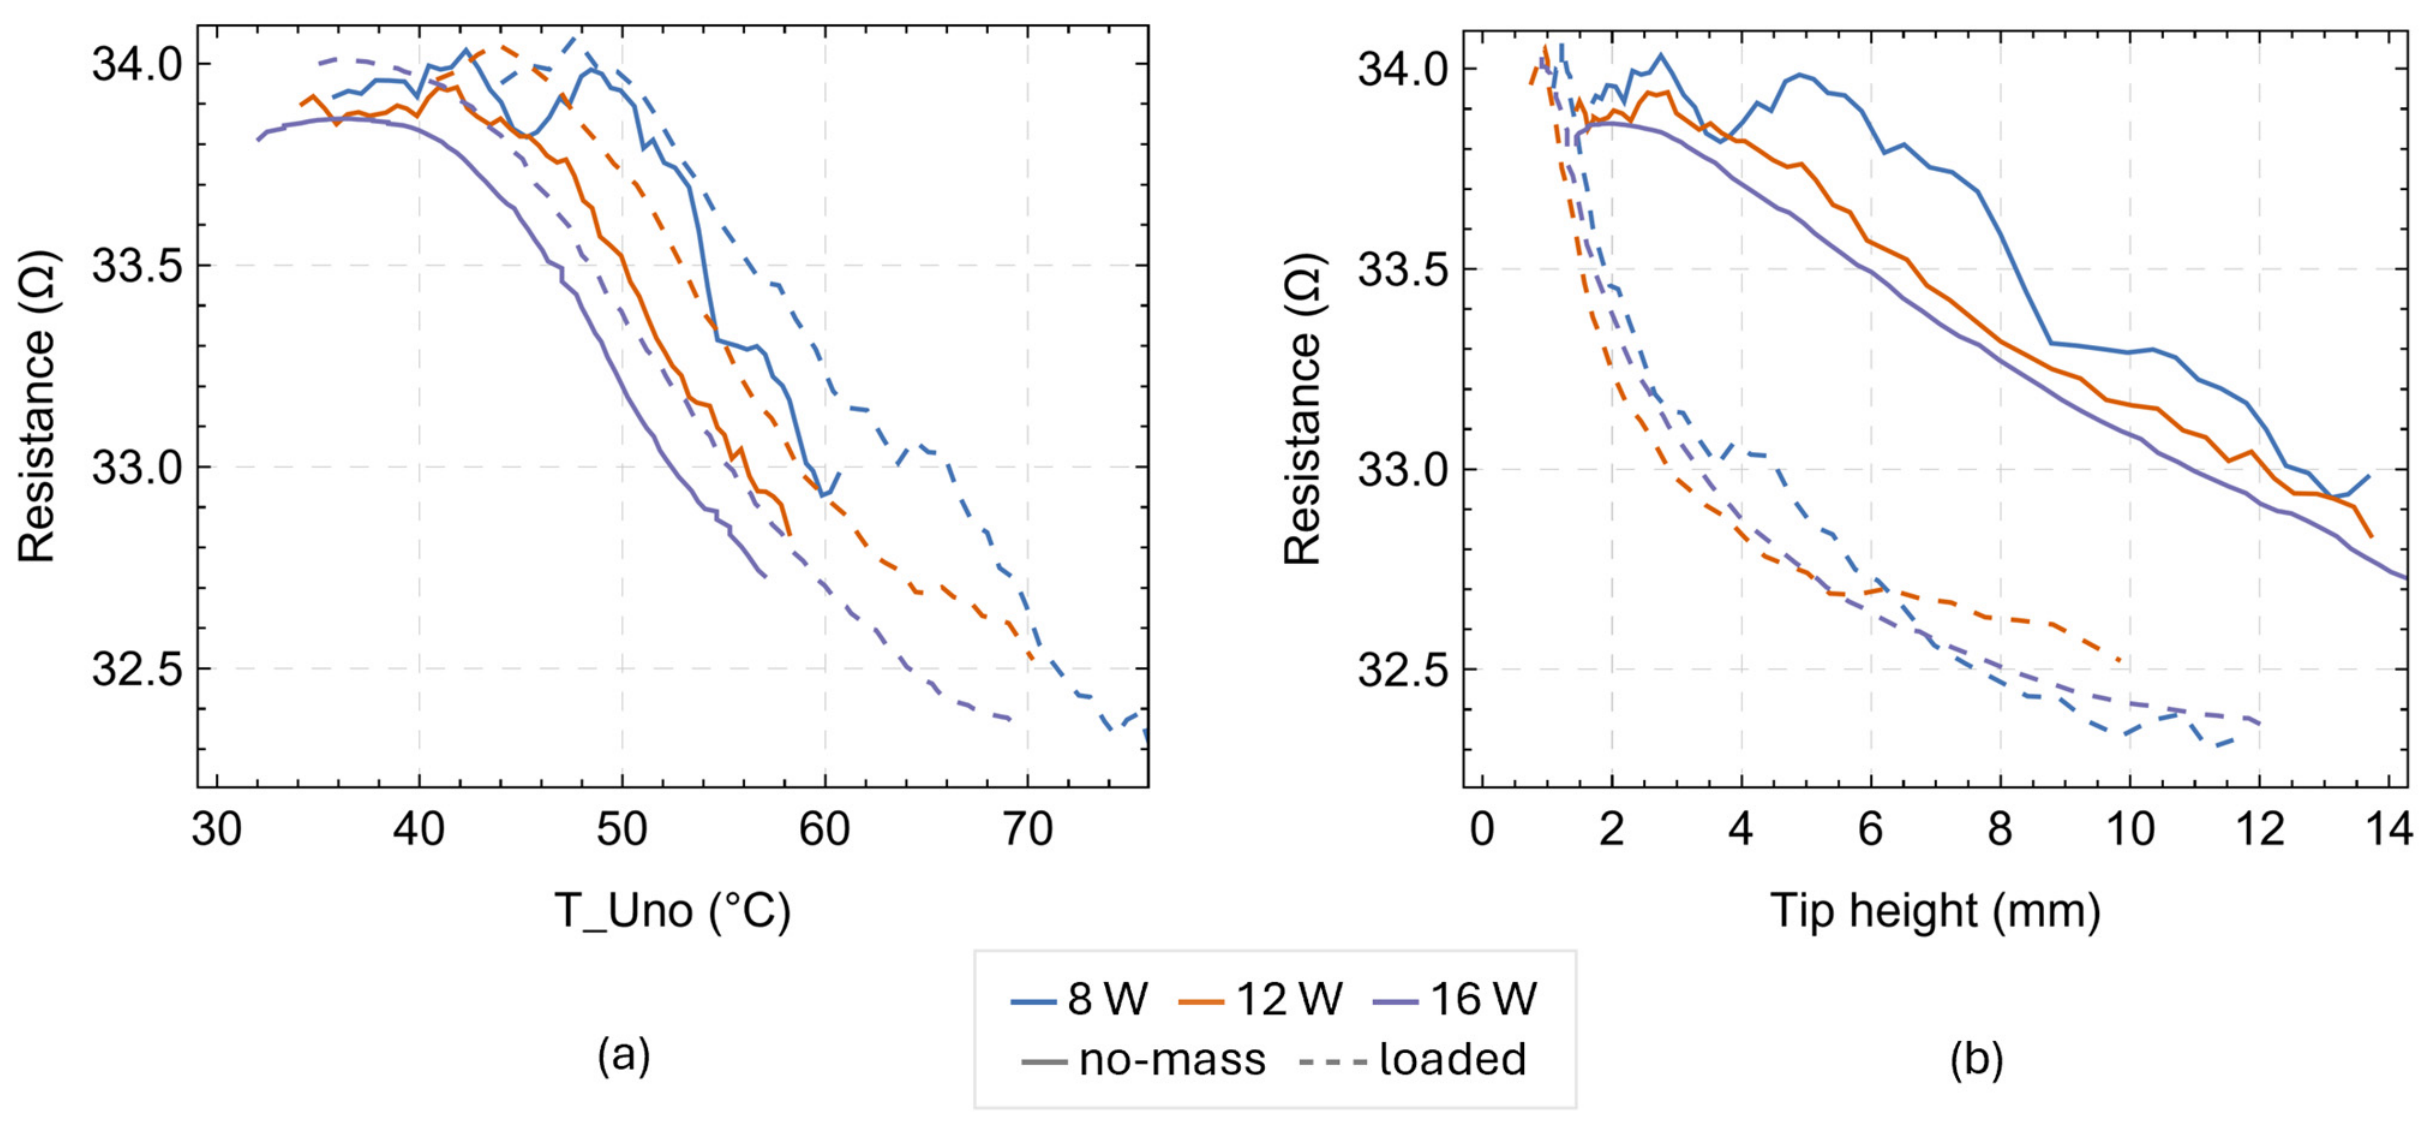
The duty-corrected wire resistance decreased from approximately 34 Ω to 32.5 Ω during heating. Electrical resistance is sensitive to the evolving phase fractions and temperature during the NiTi transformation [21,22], while strain, stress, and the associated changes in wire geometry also affect the measured resistance [23,24]. Resistance-based monitoring has consequently been investigated in both SMA actuators and SMA-integrated composites [25,26]. Because resistance is obtained from the active wire, it does not require heat transfer to a separate embedded temperature sensor.
Resistance was reconstructed from the logged bus voltage and current using a duty cycle correction rather than measured with a dedicated four-wire circuit. The following offsets are therefore reported as preliminary diagnostic observations rather than calibrated values. Each curve was smoothed with a Savitzky–Golay filter, and the offsets were averaged over the common range of the compared curves; filtering shortens each trend at both ends.
For the Pt100 temperature (Figure 7a), the loaded and unloaded curves nearly overlapped at all power levels. The offset δRT (unloaded-minus-loaded), averaged over the range, was −0.15, −0.20, and −0.16 Ω at 8, 12, and 16 W, with a scatter of 0.02–0.09 Ω (Table 5). This represented a small, essentially constant offset, comparable to its own noise and with no systematic dependence on power. Adding the tip mass barely changed the resistance–temperature relation. The small negative sign, corresponding to a slightly higher loaded resistance at a matched temperature, fits the tip stress raising the transformation temperature, so at a given sensor reading, the loaded wire is marginally less transformed. This near-invariance contrasts with the larger power-dependent shifts in the curvature–Pt100 relation in Figure 5. Against the directly measured tip height (Figure 7b), the curves split into two families: at every height and power level, the loaded curve lay below the unloaded one. To reach the same height under the tip load, the beam must transform further, which lowers the resistance; therefore, the vertical offset δRy represents the tip load penalty read in the resistance domain. δRy was 0.93, 0.79, and 0.70 Ω at 8, 12, and 16 W, respectively, each several times greater than its scatter (~0.2 Ω); thus, the offset stood clear of the noise and decreased mildly with power (Table 5).
The loaded tests also showed a greater total resistance drop than the unloaded ones (1.4–1.6 Ω vs. 0.9–1.1 Ω), indicating that the actuator reached a more advanced transformation state to attain the target height under load. Against the Pt100 temperature, the loaded and unloaded resistance trends showed only small offsets; against tip position, their separation was clearly resolved. These exploratory observations do not enter the present model but indicate that wire resistance contains an actuation-related signal. They therefore motivate future evaluation of resistance as a possible feedback coordinate using dedicated four-wire measurements, uncertainty analysis, cyclic testing, hysteresis compensation, and multiple specimens.
Because resistance varies monotonically with actuation over the investigated heating branch, it could potentially replace the Pt100 temperature as the model state coordinate. Calibrating the active mismatch strain, or equivalently the free thermal curvature, directly against resistance would preserve the same bimetal and peeling-beam equations while potentially removing the empirical Tm correction. This possibility requires dedicated resistance measurements and further validation.

3.6. Model in Context and Limitations

The formulation combines Timoshenko’s bimetal analysis [19] with Turner’s effective CTE representation of SMA recovery [16]. We made the effective coefficient temperature-dependent and identified it from the measured laminate curvature. The same curvature law describes chamber and Joule heating by retaining or removing the GFRP thermal term, while the peeling-beam contribution accounts for the external load. Compared with fully coupled electro-thermo-mechanical models [27], this closed-form formulation requires fewer parameters and is suitable for rapid evaluation. Its phenomenological nature, however, requires recalibration when the geometry or heating regime changes. The intended application is a structurally stiff morphing composite: the elastomer is confined to the interface, while the GFRP retains the structural and load-bearing function. Using only the unloaded calibration together with the known load and stiffness, the direct loaded prediction gave an NRMSE of 6.2–11.7%. Fitting Tm to the loaded data reduced the NRMSE to 5.8–6.4%, but this shifted result is an a posteriori correction rather than an independent prediction. The correction does not modify the mechanical model. Its reduction to 1.6 °C at 16 W, where the loaded and unloaded test dynamics were most similar, suggests that ΔTm depends on the heating dynamics. Predicting this correction independently would require dedicated thermal calibration.
The study is a controlled proof of concept based on one specimen, three heating powers, one tip load, and the heating branch. Each power/load condition was tested once. Using the same specimen isolates the effects of power and load from manufacturing variability, but the results do not quantify cyclic repeatability, specimen-to-specimen variability, cooling hysteresis, or performance across the load–power domain. The Pt100 readings were identical at the two symmetric sensor positions, but this does not establish temperature uniformity along the wires. The inferred thermal lag may also include longitudinal temperature gradients and modest rate effects, which cannot be separated with the present measurements. Accordingly, α1(T) is an actuator-level calibration relative to the local Pt100 reading, not a material coefficient obtained from a homogeneous wire temperature.
The mechanical model is one-dimensional and quasi-static, neglecting width effects and elastomer viscoelasticity. The small-deflection approximation introduces an estimated error of approximately 1% at the maximum tip rotation; the unloaded case instead uses the exact circular arc height.
Finally, the resistance analysis is exploratory because resistance was reconstructed from duty-corrected bus measurements rather than acquired with a dedicated four-wire circuit. Although agreement with the independently measured resistance provides an internal consistency check, uncertainty, cyclic repeatability, hysteresis, and specimen variability were not characterised. These aspects must be addressed before resistance can be implemented as a feedback coordinate.

4. Conclusions

We used a two-step autoclave process to manufacture an elastomer-interfaced SMAHC (E-SMAHC) cantilever and actuated it by Joule heating. The pull-out tests confirmed that the elastomeric interface holds the wire to fracture in both martensite (ambient) and austenite (Joule-heated) with or without pre-strain for the shape memory effect. The laminate therefore can be actuated without debonding.
A single Timoshenko bimetallic formulation, with a phenomenological effective CTE calibrated on the unloaded laminate, described chamber heating, unloaded Joule heating, and loaded Joule heating. For the loaded case, the direct prediction based solely on the unloaded calibration (with an added Euler–Bernoulli peeling-beam term) gave a tip NRMSE of 6.2–11.7%. An a posteriori temperature shift correction derived from the loaded test data reduced the NRMSE to 5.8–6.4%. A preliminary resistance analysis also identified an actuation-related electrical signal, motivating its future evaluation as a possible feedback coordinate to be used in place of the temperature in the proposed model.
These actuator-level findings are limited to the investigated specimen, three power settings, one tip load condition, and the heating branch. The results therefore do not quantify specimen-to-specimen variability, cyclic repeatability, cooling hysteresis, or general performance across the load–power domain.
Future work will calibrate the current-to-temperature relationship for autonomous Joule control and extend the validation to a range of tip loads to test whether a single thermal shift per load suffices to map the load–power plane. Additionally, we will model the cooling branch with a hysteresis operator and statistically characterise the resistance coordinate across multiple specimens.

Supplementary Materials

The following supporting information can be downloaded at https://www.mdpi.com/article/10.3390/act15080416/s1. Characterisation File S1: Characterisation-Tests-Manufacturing-E-SMAHC. Data-Analysis File S2: Tests-Equations-Data-Elaboration. Movies S3–S5: E-SMAHC-Testing-Oven-Current-noload-loaded.

Author Contributions

Conceptualization, G.P. and T.M.B.; methodology, G.P. and T.M.B.; software, G.P. and C.G.; validation, G.P., C.G. and F.M.; formal analysis, G.P. and C.G.; investigation, G.P., C.G. and F.M.; resources, A.Z.; data curation, G.P.; writing—original draft preparation, G.P.; writing—review and editing, T.M.B., A.Z., C.G. and F.M.; visualization, G.P.; supervision, T.M.B. and A.Z.; project administration, G.P.; funding acquisition, A.Z. All authors have read and agreed to the published version of the manuscript.

Funding

This research received no external funding.

Institutional Review Board Statement

Not applicable.

Informed Consent Statement

Not applicable.

Data Availability Statement

The data presented in this study are available in the Supplementary Materials and upon request from the corresponding author.

Acknowledgments

The authors thank Gummiwerk KRAIBURG GmbH & Co. KG for generously donating the KRAIBON® used in this experiment.

Conflicts of Interest

The authors declare no conflicts of interest.

Abbreviations

CTECoefficient of Thermal Expansion
FEFinite Element
E-SMAHCElastomer-Interfaced Shape Memory Alloy Hybrid Composite
GFRPGlass-Fibre-Reinforced Polymer
IFSSInterfacial Shear Strength
NiTiNickel–Titanium
NRMSENormalised Root-Mean-Square Error
PWMPulse-Width Modulation
SESuperelastic or Pseudoelastic
SMAShape Memory Alloy
SMAHCShape Memory Alloy Hybrid Composite
SMEShape Memory Effect

References

  1. Ashby, M.F.; Bréchet, Y.J.M. Designing hybrid materials. Acta Mater. 2003, 51, 5801–5821. [Google Scholar] [CrossRef]
  2. Lester, B.T.; Baxevanis, T.; Chemisky, Y.; Lagoudas, D.C. Review and perspectives: Shape memory alloy composite systems. Acta Mech. 2015, 226, 3907–3960. [Google Scholar] [CrossRef]
  3. Barbarino, S.; Saavedra Flores, E.I.; Ajaj, R.M.; Dayyani, I.; Friswell, M.I. A review on shape memory alloys with applications to morphing aircraft. Smart Mater. Struct. 2014, 23, 063001. [Google Scholar] [CrossRef]
  4. Airoldi, A.; Rigamonti, D.; Sala, G.; Bettini, P.; Villa, E.; Nespoli, A. Development of an actuated corrugated laminate for morphing structures. Aeronaut. J. 2021, 125, 180–204. [Google Scholar] [CrossRef]
  5. Chillara, V.S.C.; Headings, L.M.; Tabata, R.; Itakura, E.; Gandhi, U.N.; Dapino, M.J. Shape memory alloy-actuated pre-stressed composites with application to morphing automotive fender skirts. J. Intell. Mater. Syst. Struct. 2019, 30, 479–494. [Google Scholar] [CrossRef]
  6. Rodinò, S.; Curcio, E.M.; Renzo, D.A.; Sgambitterra, E.; Magarò, P.; Furgiuele, F.; Brandizzi, M.; Maletta, C. Shape Memory Alloy—Polymer Composites: Static and Fatigue Pull-out Strength under Thermo-Mechanical Loading. Materials 2022, 15, 3216. [Google Scholar] [CrossRef] [PubMed]
  7. Poon, C.K.; Lau, K.T.; Zhou, L.M. Design of pull-out stresses for pre-strained SMA wire/polymer hybrid composites. Compos. Part B Eng. 2005, 36, 25–31. [Google Scholar] [CrossRef]
  8. Lacasse, S.; Terriault, P.; Simoneau, C.; Brailovski, V. Design, manufacturing, and testing of an adaptive composite panel with embedded shape memory alloy actuators. J. Intell. Mater. Syst. Struct. 2015, 26, 2055–2072. [Google Scholar] [CrossRef]
  9. Pisaneschi, G.; Brugo, T.M.; Cosseddu, P.; Scalet, G.; Zucchelli, A. Enhanced interface adhesion in shape memory alloy hybrid composites via an elastomeric interface: An experimental and numerical investigation. Compos. Part B Eng. 2024, 286, 111785. [Google Scholar] [CrossRef]
  10. Keshtkar, N.; Röbenack, K. Mathematical Modeling of Fiber-Elastomer Composites with Embedded Shape Memory Alloys. In Proceedings of the 2020 24th International Conference on System Theory, Control and Computing (ICSTCC), Sinaia, Romania, 8–10 October 2020; IEEE: Piscataway, NJ, USA, 2020; pp. 477–482. [Google Scholar] [CrossRef]
  11. Rodinò, S.; Maletta, C. Multiphysics modeling and optimisation of an innovative shape memory alloy-polymer active composite. Polymer 2024, 307, 127316. [Google Scholar] [CrossRef]
  12. Endesfelder, A.; Annadata, A.R.; Acevedo-Velazquez, A.I.; Koenigsdorff, M.; Gerlach, G.; Röbenack, K.; Cherif, C.; Zimmermann, M. Deflection and Performance Analysis of Shape Memory Alloy-Driven Fiber–Elastomer Composites with Anisotropic Structure. Materials 2024, 17, 4855. [Google Scholar] [CrossRef] [PubMed]
  13. Böhm, H.; Winkler, A.; Senf, B.; Voigt, I.; Drossel, W.-G.; Gude, M. Experimental and Numerical Analysis of Bending Performance for a Glass-Epoxy Composite with Integrated Sheet-Shaped Shape Memory Alloy Actuator Elements. Mech. Adv. Mater. Struct. 2025, 32, 391–402. [Google Scholar] [CrossRef]
  14. Palaniyappan, S.; Ramesha, H.K.; Trautmann, M.; Quirin, S.; Heib, T.; Herrmann, H.-G.; Wagner, G. Surface Treatment Strategies and Their Impact on the Material Behavior and Interfacial Adhesion Strength of Shape Memory Alloy NiTi Wire Integrated in Glass Fiber-Reinforced Polymer Laminate Structures. Materials 2024, 17, 3513. [Google Scholar] [CrossRef] [PubMed]
  15. Zhang, R.; Yue, H.; Sun, H.; Wang, M.; Yang, F.; Liu, J.; Yu, Z.; Huang, X. Wire-form shape memory alloy actuators: Modeling, design, and control. Microsyst. Nanoeng. 2026, 12, 76. [Google Scholar] [CrossRef] [PubMed]
  16. Turner, T.L. A new thermoelastic model for analysis of shape memory alloy hybrid composites. J. Intell. Mater. Syst. Struct. 2000, 11, 382–394. [Google Scholar] [CrossRef]
  17. Viet, N.V.; Zaki, W.; Umer, R. Bending models for superelastic shape memory alloy laminated composite cantilever beams with elastic core layer. Compos. Part B Eng. 2018, 147, 86–103. [Google Scholar] [CrossRef]
  18. Kennedy, S.; Vlajic, N.; Perkins, E. Hybrid dynamical modeling of shape memory alloy actuators with phase kinetic equations. J. Intell. Mater. Syst. Struct. 2024, 35, 1245–1260. [Google Scholar] [CrossRef]
  19. Timoshenko, S. Analysis of bi-metal thermostats. J. Opt. Soc. Am. 1925, 11, 233–255. [Google Scholar] [CrossRef]
  20. Churchill, C.B.; Shaw, J.A.; Iadicola, M.A. Tips and tricks for characterizing shape memory alloy wire: Part 4—Thermo-mechanical coupling. Exp. Tech. 2010, 34, 63–80. [Google Scholar] [CrossRef]
  21. Novak, V.; Sittner, P.; Dayananda, G.N.; Braz-Fernandes, F.M.; Mahesh, K.K. Electric resistance variation of NiTi shape memory alloy wires in thermomechanical tests: Experiments and simulation. Mater. Sci. Eng. A Struct. 2008, 481, 127–133. [Google Scholar] [CrossRef]
  22. Antonucci, V.; Faiella, G.; Giordano, M.; Mennella, F.; Nicolais, L. Electrical resistivity study and characterization during NiTi phase transformations. Thermochim. Acta 2007, 462, 64–69. [Google Scholar] [CrossRef]
  23. Zhang, J.-J.; Yin, Y.-H.; Zhu, J.-Y. Electrical Resistivity-Based Study of Self-Sensing Properties for Shape Memory Alloy-Actuated Artificial Muscle. Sensors 2013, 13, 12958–12974. [Google Scholar] [CrossRef] [PubMed]
  24. Furst, S.J.; Crews, J.H.; Seelecke, S. Stress, strain, and resistance behavior of two opposing shape memory alloy actuator wires for resistance-based self-sensing applications. J. Intell. Mater. Syst. Struct. 2013, 24, 1951–1968. [Google Scholar] [CrossRef]
  25. Schwarz, M.; Weiler, M.; Palaniyappan, S.; Quirin, S.; Trautmann, M.; Wagner, G.; Herrmann, H.-G. Monitoring of Layered Thermoplastic Composites Using Shape Memory Alloys as Integrated Sensors for Multifunctional Lightweight Structures. Materials 2025, 18, 3193. [Google Scholar] [CrossRef] [PubMed]
  26. Mersch, J.; Keshtkar, N.; Grellmann, H.; Gomez Cuaran, C.A.; Bruns, M.; Nocke, A.; Cherif, C.; Röbenack, K.; Gerlach, G. Integrated Temperature and Position Sensors in a Shape-Memory Driven Soft Actuator for Closed-Loop Control. Materials 2022, 15, 520. [Google Scholar] [CrossRef] [PubMed]
  27. Kaiser, M.; Kunzler, M.; Gurka, M. Experimental characterisation and theoretical modeling of the electro-thermomechanical coupling of unimorph shape memory active hybrid composites. Compos. Sci. Technol. 2023, 242, 110186. [Google Scholar] [CrossRef]
Figure 1. Two-step manufacturing of the SMAHC: (a) manufacturing of the pre-strain tabs with a 3D-printed fixture; (b) application of the pre-strain (5%) of the SME wire; (c) manufacturing of the E-SMAHC, fixing the pre-strain tabs and embedding the Pt100 in contact with the SME wire; the blue number indicates the two pt100 in contact with the wire, 1 (uno) and 2 (due); (d) layup of the E-SMAHC plies; the box with the red dotted line highlights the pre-strained tab.
Actuators 15 00416 g001
Figure 2. Joule heating actuation test, unloaded (a) and with a 16.3 g tip mass (b), showing the clamped cantilever and the clamp (blue), mid-span (green), and tip (red) markers. Detailed temperature graphs are reported in Supplementary File S2.
Actuators 15 00416 g002
Figure 3. Circuit and system diagram of the Joule actuation rig: bench supply, PWM MOSFET (5 kHz) driven by the ESP32, the SMA wire as a resistive heater, the INA219 current monitor (Adafruit, New York, NY, USA), three four-wire Pt100 channels (MAX31865, Adafruit, USA) and the contact switch.
Actuators 15 00416 g003
Figure 4. (a) pull-out maximum force and (b) interfacial shear strength (IFSS) of the elastomer-interfaced specimens at 1/8-inch and 1-inch embedding, in martensite (room temperature) and austenite (Joule-heated), with and without 5% pre-strain, compared with SE wire results [9].
Actuators 15 00416 g004
Figure 5. Unloaded calibration. (a) Measured curvature κ versus embedded sensor, each with its sigmoidal fit; (b) the identified effective coefficient α1(T) for each condition.
Actuators 15 00416 g005
Figure 6. Loaded actuator. (Left): Measured and predicted tip height versus temperature at 8, 12, and 16 W; the dashed line is the direct prediction based solely on the unloaded calibration of α1(T), while the solid line is the a posteriori corrected curve obtained by fitting only Tm to the loaded data. (Right): Tip- and mid-span marker trajectories with the predicted lift-off temperature (vertical grey dashed line).
Actuators 15 00416 g006
Figure 7. Duty-corrected wire resistance as a preliminary actuation-related diagnostic (from a duty-corrected bus measurement). The smoothing window shortens each trend at its ends. (a) Resistance versus embedded Pt100 temperature. (b) Resistance versus measured tip height. Colours identify the applied power—8, 12, and 16 W—while solid and dashed lines identify the unloaded and loaded tests, respectively.
Actuators 15 00416 g007
Table 1. Summary of the six Joule heating actuation tests. Duration is the heating time from the current onset to the contact event; the two Tend are the wire and matrix contact Pt100 temperatures when the tip reached the contact switch and the current was interrupted; κmax is the peak curvature at the contact height.
TestDuration (s)Tend, wire (°C)Tend, matrix (°C)κmax (10−3 mm−1)
Climatic Chamb.104682.3-5.3
8 W7164.538.25.2
8 W + m 112581.843.46.0
12 W3661.936.55.2
12 W + m 15876.240.26.0
16 W2359.734.15.2
16 W + m 13572.639.06.1
1 With the addition of a mass (16.3 g) at the tip of the actuated beam.
Table 2. Electrical performance over the heating window. Pavg and σ are the mean and standard deviation of the delivered power; CV = 100·σ/Pavg; Rmin, Rmax, and Ravg are the minimum, maximum and mean duty-corrected wire resistance over the heating window.
TestPavg (W)CV (%)Rmin (Ω)Rmax (Ω)Ravg (Ω)
8 W8.00.8132.334.633.6
8 W + m 18.00.7831.834.833.2
12 W12.00.4332.334.333.5
12 W + m 112.00.3932.134.233.2
16 W16.00.3532.533.933.4
16 W + m 115.90.8332.334.133.1
1 With the addition of a mass (16.3 g) at the tip of the actuated beam.
Table 3. Sigmoidal CTE parameters identified per heating condition (heating branch only).
Conditionκ0 (10−4 mm−1)a (10−3 °C−1)b (10−3 °C−1)m (°C−1)Tm (°C)R2
Chamber01.0480.7890.23264.80.9992
8 W3.50.6701.8330.20652.20.9992
12 W3.50.7631.8660.25250.40.9987
16 W3.50.8681.8800.24848.20.9986
Table 4. Inflexion temperatures Tm and position RMSE errors normalised to full scale; ΔTm is the sensor lag shift; tip NRMSE is given both without the shift and after the Tm shift; for the latter, the mid marker NRMSE is also given.
Power (W)Tm No-Load (°C)Tm Loaded
(°C)
No Shift, Tip NRMSE (%)Shift: ΔTm
(°C)
+Shift, Tip NRMSE (%)+Shift, Mid NRMSE (%)
852.262.511.710.36.411.5
1250.458.59.78.15.812.5
1648.249.86.21.66.111.6
Table 5. Resistance offsets between the unloaded and loaded tests. δRT is the unloaded-minus-loaded resistance at matched temperature (Figure 7a); δRy is the same at matched tip height (Figure 7b); ΔR is the total resistance drop of each test over the heating window.
Power (W)δRT (Ω)δRy (Ω)ΔR No-Mass (Ω)ΔR Loaded (Ω)
8−0.15 ± 0.090.93 ± 0.210.91.6
12−0.20 ± 0.070.79 ± 0.171.11.4
16−0.16 ± 0.020.70 ± 0.161.11.6
Disclaimer/Publisher’s Note: The statements, opinions and data contained in all publications are solely those of the individual author(s) and contributor(s) and not of MDPI and/or the editor(s). MDPI and/or the editor(s) disclaim responsibility for any injury to people or property resulting from any ideas, methods, instructions or products referred to in the content.