Article

Design and Optimization of Miniaturized Actuation System with Systematic Dual-Output Compliant Displacement Amplification


by
Rohan R. Ozarkar
1,2,
Nilesh P. Salunke
3,*,
Prajitsen G. Damle
2,
Rahul Shukla
4,5,
Shakeelur Raheman
6,7 and
Khursheed B. Ansari
8,*
1
Department of Mechanical Engineering, R. C. Patel Institute of Technology, Shirpur 425405, India
2
Department of Mechanical Engineering, Shram Sadhna Bombay Trust’s College of Engineering and Technology, Jalgaon 425001, India
3
Department of Mechanical Engineering, SVKM’s NMIMS Global University, Dhule 424001, India
4
Indus Synchrotrons Utilization Division, Raja Ramanna Centre for Advanced Technology, Indore 452013, India
5
Homi Bhabha National Institute, Training School Complex, Anushakti Nagar, Mumbai 400094, India
6
Department of Mechanical Engineering, Pohang University of Science and Technology, 77 Cheongam-Ro, Nam-Gu, Pohang 37673, Gyeongbuk, Republic of Korea
7
Department of Applied Science and Humanity, SVKM’s NMIMS Global University, Dhule 424001, India
8
Department of Chemical Engineering, College of Engineering, King Khalid University, Abha 61411, Saudi Arabia
*
Authors to whom correspondence should be addressed.
Actuators 2026, 15(5), 244; https://doi.org/10.3390/act15050244
Submission received: 26 March 2026 / Revised: 19 April 2026 / Accepted: 28 April 2026 / Published: 30 April 2026
(This article belongs to the Special Issue Miniature and Micro-Actuators—2nd Edition)

Abstract

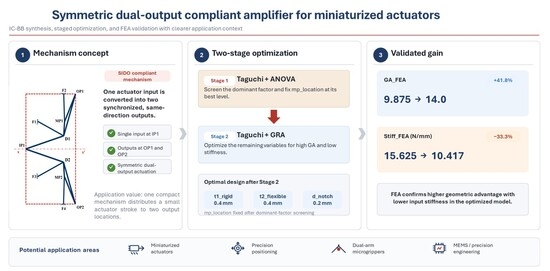
Compliant displacement amplification mechanisms are widely used in MEMSs and micro-actuated systems to enhance the limited stroke of micro-actuators. However, systematic integration of instantaneous center building block (IC-BB)-based conceptual design and structured post-synthesis optimization for symmetric single-input dual-output compliant displacement amplification mechanisms (SIDO-CDAMs) remains limited in the literature. In this work, a symmetric SIDO-CDAM is first conceptually synthesized using the IC-BB approach by employing only compliant dyad building blocks (CDBs), resulting in a mechanism that produces dual outputs in the same direction. The synthesized conceptual mechanism is subsequently realized with necessary geometric refinements and modeled to validate the conceptual design. A two-stage post-synthesis optimization framework is then proposed to enhance geometrical advantage (GA) while reducing stiffness. In Stage-1, Taguchi design of experiments combined with analysis of variance (ANOVA) is used to screen design parameters, identify the dominant factor, and fix it at its optimal level to eliminate masking effects. In Stage-2, a reduced Taguchi design integrated with gray relational analysis (GRA) is applied for multi-response optimization based on finite element analysis (FEA). Regression models and FEA-based confirmation tests are employed to validate the optimized design. The results demonstrate a significant improvement in displacement amplification with a simultaneous reduction in stiffness compared to the base design. The proposed IC-BB-based conceptual synthesis, coupled with structured post-synthesis optimization, provides a robust and computationally efficient framework for the development of micro-actuation and precision engineering applications.

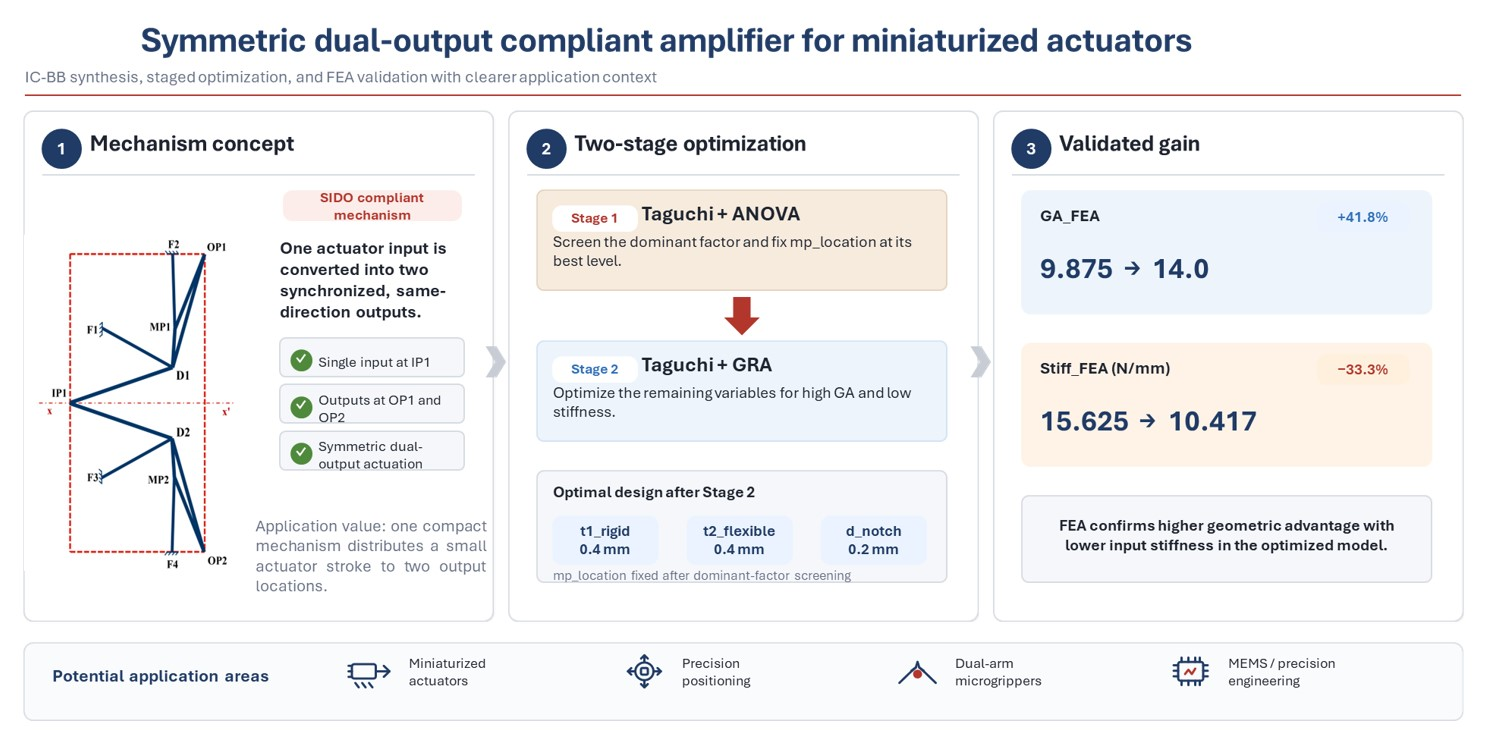
Graphical Abstract

1. Introduction

A compliant mechanism is a monolithic structure composed of stiff, rigid members transferring motion and deformable, flexible members that undergo elastic deformation. It eliminates conventional rotational joints present in traditional rigid-body mechanisms. Compliant mechanisms offer advantages such as compact size, absence of backlash, friction reduction, and ease of fabrication, which make them well-suited for micro-electro-mechanical systems (MEMSs) and precision engineering applications requiring smooth motion and repeatability [1,2].
Piezoelectric and electrostatic actuators are widely used in most precision positioning and actuation systems due to their high positional accuracy and quick response [3,4,5]. However, these actuators produce limited strokes, generally in the range of 10 μm to 100 μm, which is usually not sufficient for many practical applications. To overcome this limitation, compliant displacement amplification mechanisms (CDAMs) are integrated between the actuator and the load. CDAMs convert small input motions and displacements into amplified output displacements along a specified direction. As illustrated in Figure 1, the CDAM enhances the actuated input displacement to the desired output displacement along the specified direction. The geometrical advantage (GA) is a ratio of output displacement to input displacement, i.e., GA = o/i.
The CDAMs are categorized into different types based on structural topology, including lever-type [6], Scott-Russell mechanisms [7], bridge-type [8], rhombus, and pantograph-type mechanisms [9,10,11]. Based on the number of input and output locations, the CDAMs are further classified as single-input single-output (SISO), single-input multiple-output (SIMO), multiple-input single-output (MISO), and multiple-input multiple-output (MIMO) [12,13]. According to the building block approach, CDAMs are categorized into single-stage, dual-stage, and multi-stage amplification mechanisms. These mechanisms are extensively used with actuators for applications such as actuation systems [14,15], mirror positioning, microgrippers [16,17], micro-stages, and micro-positioners [18,19].
The literature indicates that SISO-type CDAMs are the most reported configurations. However, many of the SIDO configurations produce output displacement in a direction different from that of the input displacement [9,20]. In several applications, such as positioning stages [21], dual-arm microgrippers [22], and sensors with enhanced sensitivity [23], amplified displacements at multiple locations are achieved from a single actuator. Single-input dual-output (SIDO) CDAMs are particularly suitable for such applications, as they provide improved positional stability, accuracy, and precision by balancing load distribution compared to SISO-CDAM configurations. Despite these advantages, SIDO CDAMs remain relatively less explored than SISO configurations.
In compliant mechanisms, complete rotary motion of the link is not possible, as pin-rotatory joints between links are replaced by flexural points that undergo elastic deformation. Therefore, traditional design methods are not directly suitable for designing CDAMs. Several methodologies reported in the literature for the design of CDAMs are pseudo-rigid body modeling (PRBM), topology and structural optimization, and the building block method combined with an instantaneous center (IC) approach [12]. In PRBM, the configuration is initially synthesized using an equivalent conventional rigid body with rotatory joints, which are subsequently replaced by flexural elements to obtain a fully compliant mechanism. Due to distributed compliance, the actual motion produced by a fully compliant mechanism may slightly deviate from the conventional rigid-body prediction, particularly under large deformations [8]. The topology optimization approach relies on finite element method (FEM)-based material distribution and studying different topological combinations to achieve the desired GA. Topology optimization is followed by structural optimization to refine the shape and dimensions of links and flexural regions to improve the GA [6,24,25].
These methods are computationally expensive, time-consuming, and often result in complex geometries that lack clear kinematic interpretation and are difficult to modify or scale. In contrast, the instantaneous center-based approach employs fundamental kinematic principles to synthesize CDAMs based on the spatial arrangements and number of input and output locations. In the integrated instantaneous center building block (IC-BB) approach, the conceptual CDAM configurations for the required motion and GA are designed purely by a kinematic synthesis framework. The IC-BB approach distributes GA in multiple stages, resulting in compact and symmetric configurations that preserve a kinematic interpretation [12,13,14]. A review of the literature reveals that SIDO-CDAM designs synthesized using an instantaneous center-based building block have not yet been reported. In the two-stage displacement amplification of SISO CDAMs, Kim et al. employed combinations of two different building blocks: a compliant four-bar block (C4B) and compliant dyad blocks (CDBs), with a recommendation to use either two C4Bs or a hybrid CDB–C4B [13]. However, using only CDBs in the IC-BB approach for the synthesis of a symmetric SIDO-CDAM has not been reported. The IC-BB synthesis of conceptual kinematic configuration ignores link thickness and material properties. Therefore, it is essential to convert the conceptual configuration into a realizable compliant mechanism. The GA of a CDAM depends on various design parameters, such as mechanism topology, thickness of various links, nature of flexural points, and nature and magnitude of applied load. In addition to maximizing GA, stiffness optimization is important, particularly for precision and MEMS-oriented applications. Multi-objective optimization techniques have been widely employed to address such trade-offs, and recent studies on stiffness modeling and kinematic synthesis of compliant and metamorphic mechanisms further highlight their importance in systematic mechanism design and deployable applications [26].
Recent studies have utilized statistical approaches based on the Taguchi method, analysis of variance (ANOVA), and gray relational analysis (GRA) to solve multi-objective optimization problems related to compliant mechanisms [27,28,29,30,31] and other mechanical systems to reduce computational effort while providing meaningful insight into parameter significance and performance trade-offs. The bridge-type CDAMs have been widely investigated using a combined Taguchi and GRA framework to maximize displacement amplification. Dao et al. [27] optimized a CDAM by considering displacement and natural frequency as response parameters; ANOVA identified hinge thickness and angles as the most influential design variables; finite element analysis (FEA) was used to validate the optimization outcomes. Similarly, Huynh et al. [28] reported hinge thickness and angle as the significant control parameters affecting GA in bridge-type CDAMs. Wang et al. [29] analyzed the influence of design parameters on the modal frequency of a bridge-type CDAM using Taguchi–signal to noise (S/N) ratio–ANOVA, and found input body length to be the most sensitive parameter.
Beyond bridge-type CDAMs, Huynh et al. [30] optimized a symmetrical differential lever-type CDAM with a Taguchi–FEA–GRA framework and achieved close agreement between predicted and simulated stiffness and displacement values with a deviation within 5%. Song et al. [31] applied a hybrid Taguchi–entropy-weighted GRA approach to a 6-UPS parallel compliant mechanism, resulting in an improvement in angular range and reduction in drive force, demonstrating the effectiveness of statistical optimization for precision mechanisms. Several studies from other research domains have also implemented combined Taguchi–GRA–ANOVA frameworks for multi-objective optimization, demonstrating the versatility and robustness of these statistical methods. Canbolat et al. [32], Omoniyi et al. [33], Abdelhady et al. [34], and Patel et al. [35] applied a Taguchi–GRA and ANOVA statistical optimization framework to diverse engineering problems, including absorption refrigeration systems, laser welding of Ti6Al4V alloy, friction stir welding of AA5754 aluminum, and FDM-based 3D printing of PLA parts, respectively. Despite the extensive application of Taguchi, ANOVA, and GRA across diverse systems, their systematic application to the optimization of symmetric SIDO-CDAMs remains largely unexplored. Optimization studies immediately following conceptual synthesis based on the IC-BB building block have not yet been reported. The integrated use of Taguchi experimental design, ANOVA, and GRA provides a structured and computationally efficient framework for optimizing the geometrical amplification and stiffness of CDAMs. The Taguchi method, as a robust design of experiments (DOE) approach, significantly reduces the number of required simulations or physical experiments by employing orthogonal arrays while identifying influential design parameters with high statistical confidence through S/N ratios. ANOVA is subsequently used to determine the statistical contribution of each design parameter. The multi-objective problem is transformed into a single gray relational grade (GRG) using GRA, enabling effective ranking and selection of optimal design alternatives.
These studies highlight that, although the IC–BB approach is a well-established conceptual synthesis method for compliant mechanisms, the synthesis of symmetric SIDO CDAMs using the IC-BB approach, especially those synthesized using only compliant dyad building blocks (CDBs), remains unaddressed in the literature. Parametric optimization using a statistical Taguchi–ANOVA–GRA framework, conducted immediately following IC–BB-based conceptual synthesis, has not yet been reported, thereby motivating the present study. This work proposes a novel symmetric SIDO-CDAM synthesized using an IC–BB approach applicable for miniaturized macro-scale actuation systems. The proposed configuration employs only CDBs arranged symmetrically to generate two equal and collinear amplified outputs along the input direction, which has not been reported in the existing literature. Furthermore, a sequential Taguchi–ANOVA–GRA optimization framework is applied immediately after IC–BB synthesis to address the inherent geometrical amplification–stiffness trade-off in symmetric SIDO-CDAMs.
The key contributions of this work are summarized as follows:
  • Synthesis of a conceptual symmetric dual-stage SIDO-CDAM using an IC–BB methodology with CDBs only.
  • Conversion of the conceptual IC–BB configuration into a realizable compliant mechanism and validation through FEA.
  • Application of a sequential Taguchi–ANOVA–GRA optimization strategy to efficiently resolve the geometrical amplification–stiffness trade-off.
This paper is organized as follows: Section 2 presents the IC–BB-based conceptual synthesis of the symmetric SIDO-CDAM along with its finite element modeling. Section 3 describes the sequential Taguchi–ANOVA–GRA optimization framework, results, and discussion, followed by conclusions in Section 4.

2. Proposed Design

2.1. Conceptual Synthesis of SIDO-CDAM Using IC–BB Approach

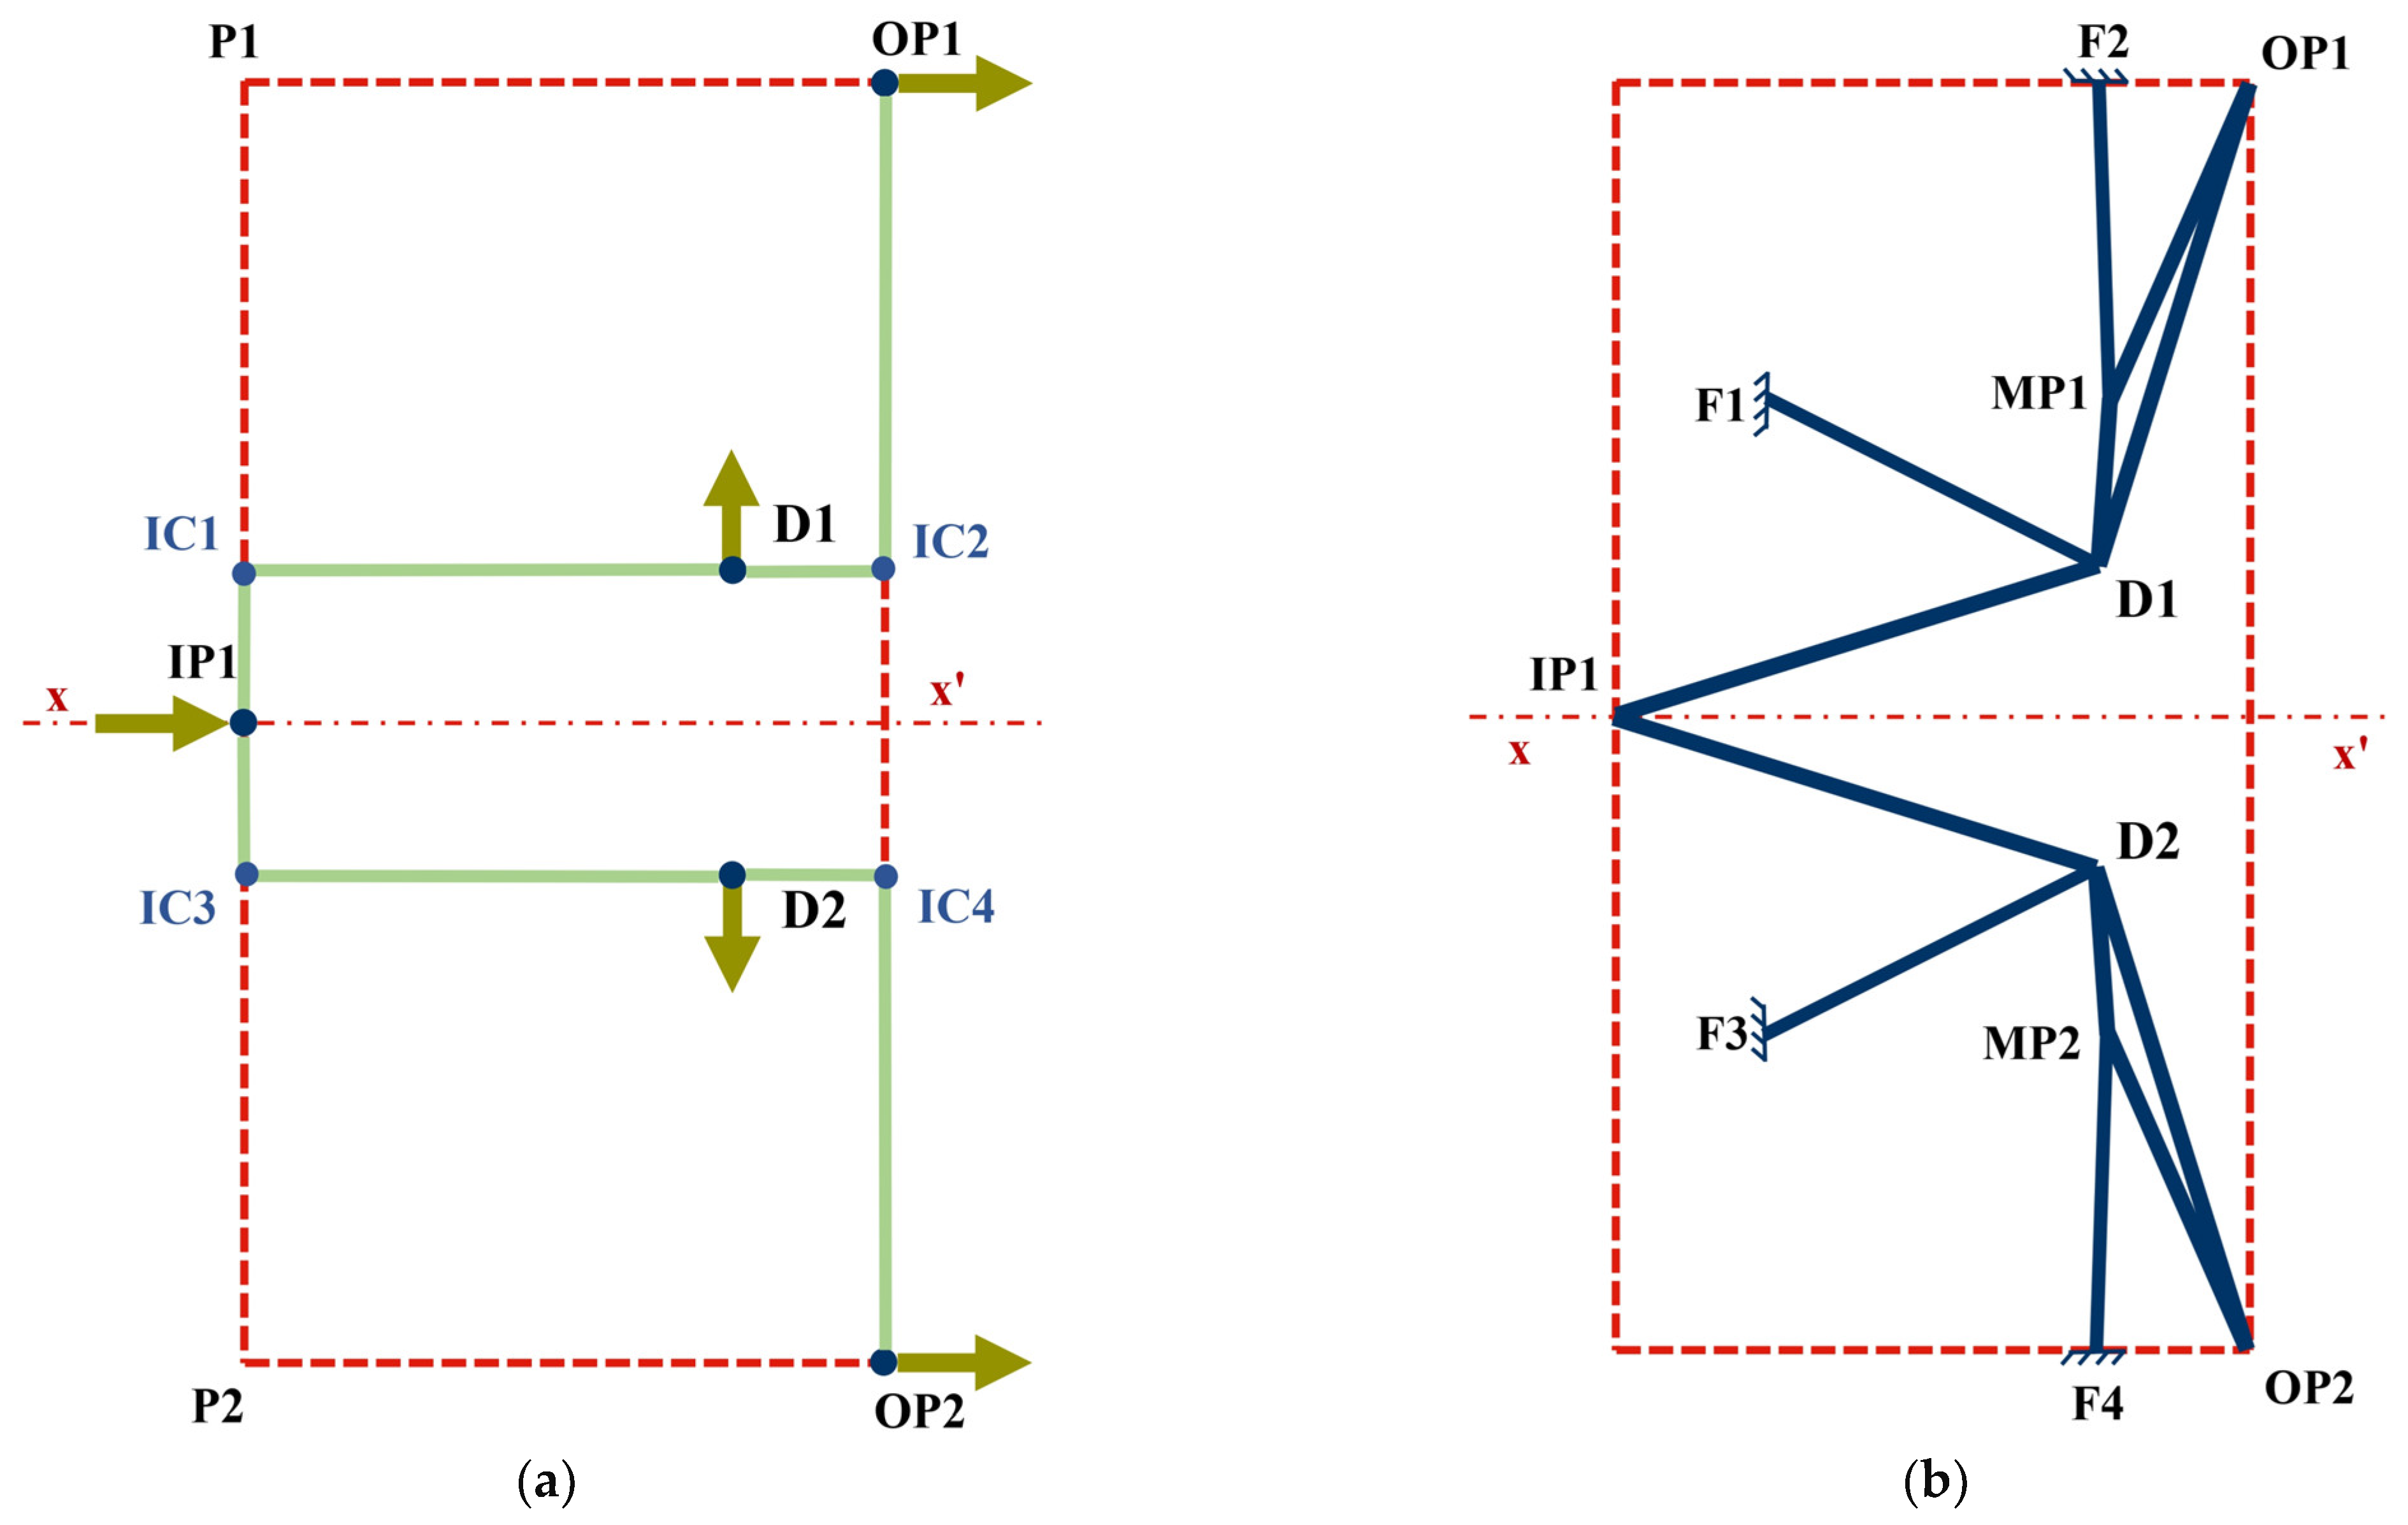
Kim et al. [13] presented the fundamentals of CDAM synthesis using the IC-BB approach. As discussed in the introduction, the present study adopts only CDBs to construct a dual-stage conceptual design of symmetric SIDO-CDAMs. Figure S1 illustrates a typical CDB element consisting of three links, out of which one link is fixed [13]. Each CDB contains a moving point (MP), whose spatial location significantly influences the GA of the mechanism. Figure 2a shows the spatial arrangement of key points defining the conceptual mechanism, including the input point (IP1), output points (OP1 and OP2), and intermediate decomposition points (D1 and D2), within the synthesis region (P1–P2–OP2–OP1). The displacement direction vectors at the input and output points indicate that both output displacements are aligned with the input displacement direction. The mechanism is symmetric about the axis xx′, which enhances structural stability and balanced load distribution, and allows for the use of identical CDB elements on both sides of the mechanism. This symmetry also enables the exclusive use of CDB elements in the synthesis.
The CDB elements are interconnected at points IP1, D1, and D2. The decomposition points D1 and D2 serve as motion transfer points between successive amplification stages along the displacement vector. When perpendiculars are drawn to the displacement vectors at the input, output, and decomposition points, their intersection points define the instantaneous centers of rotation (IC1, IC2, IC3, and IC4) corresponding to each CDB. These instantaneous centers govern the kinematic amplification behavior of individual stages.
The geometrical advantage of an individual amplification stage is obtained from the ratio of distances measured from the corresponding instantaneous center to the relevant points. For example, the first-stage amplification is given by the ratio IC1D1/IC1IP1, while similar ratios define the amplification of the remaining stages. The overall geometrical advantage of the dual-stage symmetric SIDO-CDAM is calculated as GA_conceptual = (GA1 × GA2 × GA3 × GA4)/2. The overall amplification is equally distributed between the two output paths and, therefore, the division by two accounts for the symmetric dual-output configuration.
Figure 2b presents the synthesized conceptual mechanism obtained using the IC–BB approach. Points F1, F2, F3, and F4 represent fixed points, while MP1 and MP2 denote moving points. The resulting conceptual configuration consists of the four CDBs arranged symmetrically as F1–D1–IP1, F3–D2–IP1, F2–D1–OP1, and F4–D2–OP2.
Table S1 lists the coordinates of all key points defining the conceptual mechanism shown in Figure 2. The total geometrical advantage obtained from the conceptual synthesis is 9.5. It is noted that the obtained geometrical advantage corresponds purely to the kinematic synthesis stage and serves as the basis for subsequent conversion into a realizable compliant mechanism and parametric optimization.

2.2. Realization and FEA Modeling of the SIDO-CDAM

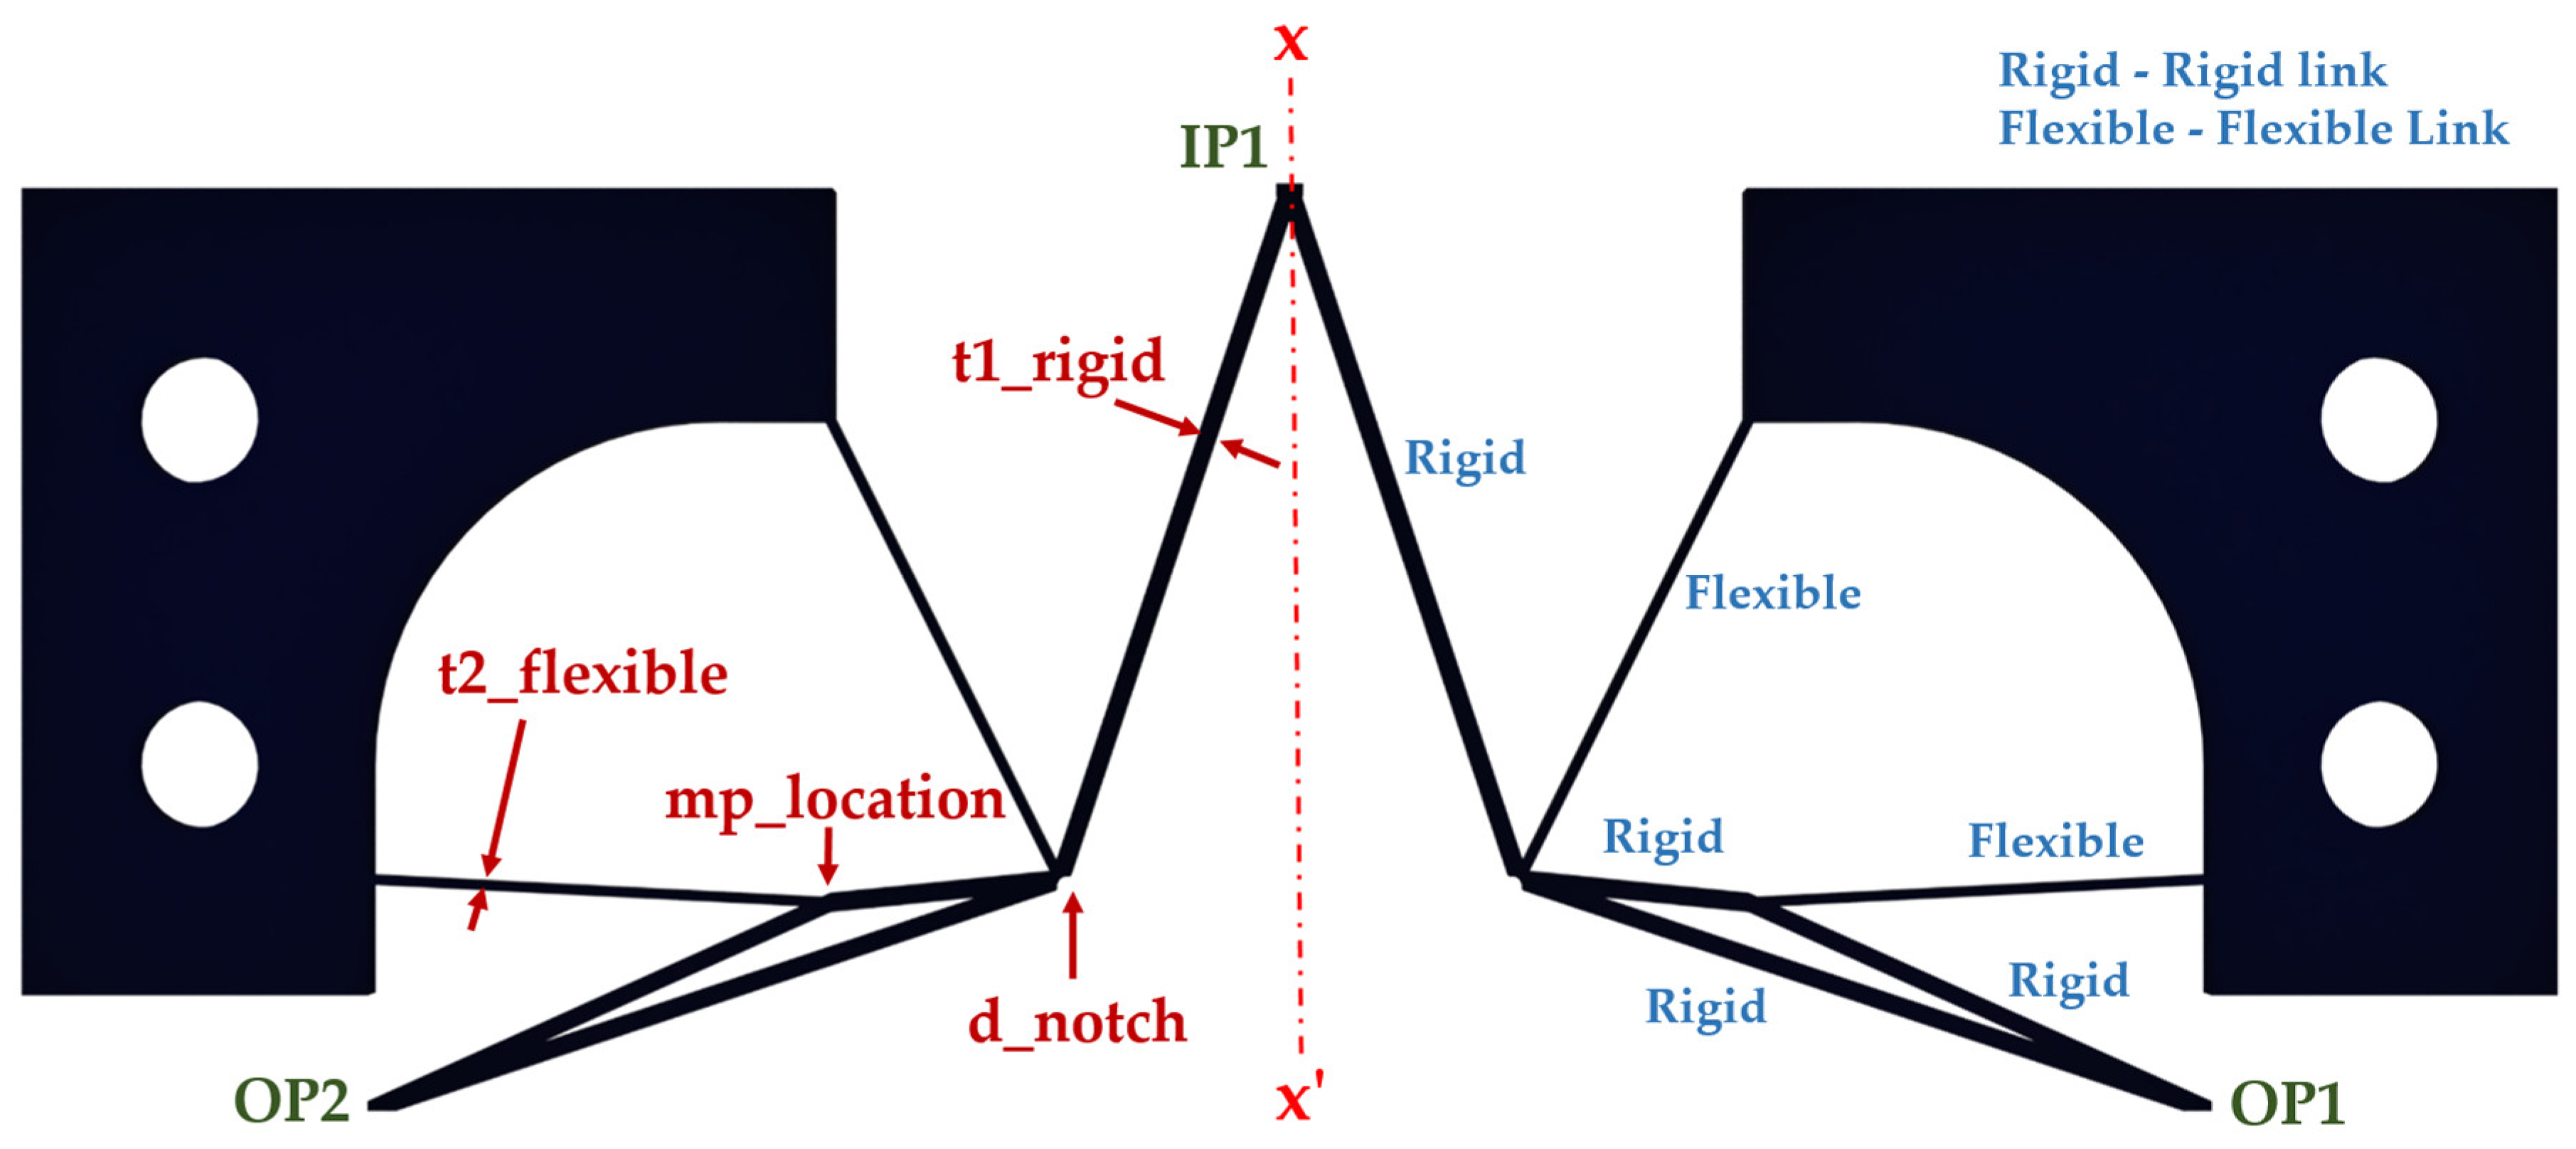
At this stage, the realized compliant mechanism with a manufacturable geometry is developed from the conceptually synthesized SIDO-CDAM by assigning finite thickness to links and considering material properties. The realized SIDO-CDAM (illustrated in Figure 3) consists of rigid links, which are relatively thick members that transfer load, and flexible links, which are thinner members that deform under applied load and act like springs during unloading. A notch with diameter d_notch is introduced at the decomposition point to enhance rotational flexibility. Additional beam reinforcement is provided near the input region to improve structural strength and load transfer at the actuation point. The mechanism includes a single input point (IP1), where the external load is applied, and two output points (OP1 and OP2), where displacement amplification occurs. The moving point (mp_location) plays a crucial role in defining amplification behavior and is treated as a key parametric variable for subsequent optimization. Figure S2 of the Supporting Information shows the 2D drawings and 3D views of this model.
Although real micro-electro-mechanical systems (MEMSs) operate at micro scales, the SIDO-CDAM designed in this study is conceptualized and simulated at the millimeter scale. The dimensions are purposely selected assuming future physical validation using fused deposition modeling (FDM)-based 3D printing, where a nozzle diameter of 0.2 or 0.4 mm is commonly used [36]. Accordingly, link thicknesses of 0.4 mm and 0.8 mm are selected for flexible and rigid links, respectively. To validate the conceptual GA obtained using the IC–BB method, FEA is performed in Autodesk Fusion using the Autodesk Nastran solver. The widely used additive manufacturing material PA-12 (PA 2200—120 µm) is selected from the Autodesk Fusion software’s material library. The assigned linear elastic properties include a Young’s Modulus of 1.49 GPa, a Poisson’s ratio of 0.41, and a mass density of 9.9 × 10 7 Kg/mm3, and an Ultimate Tensile Strength of 46 MPa.
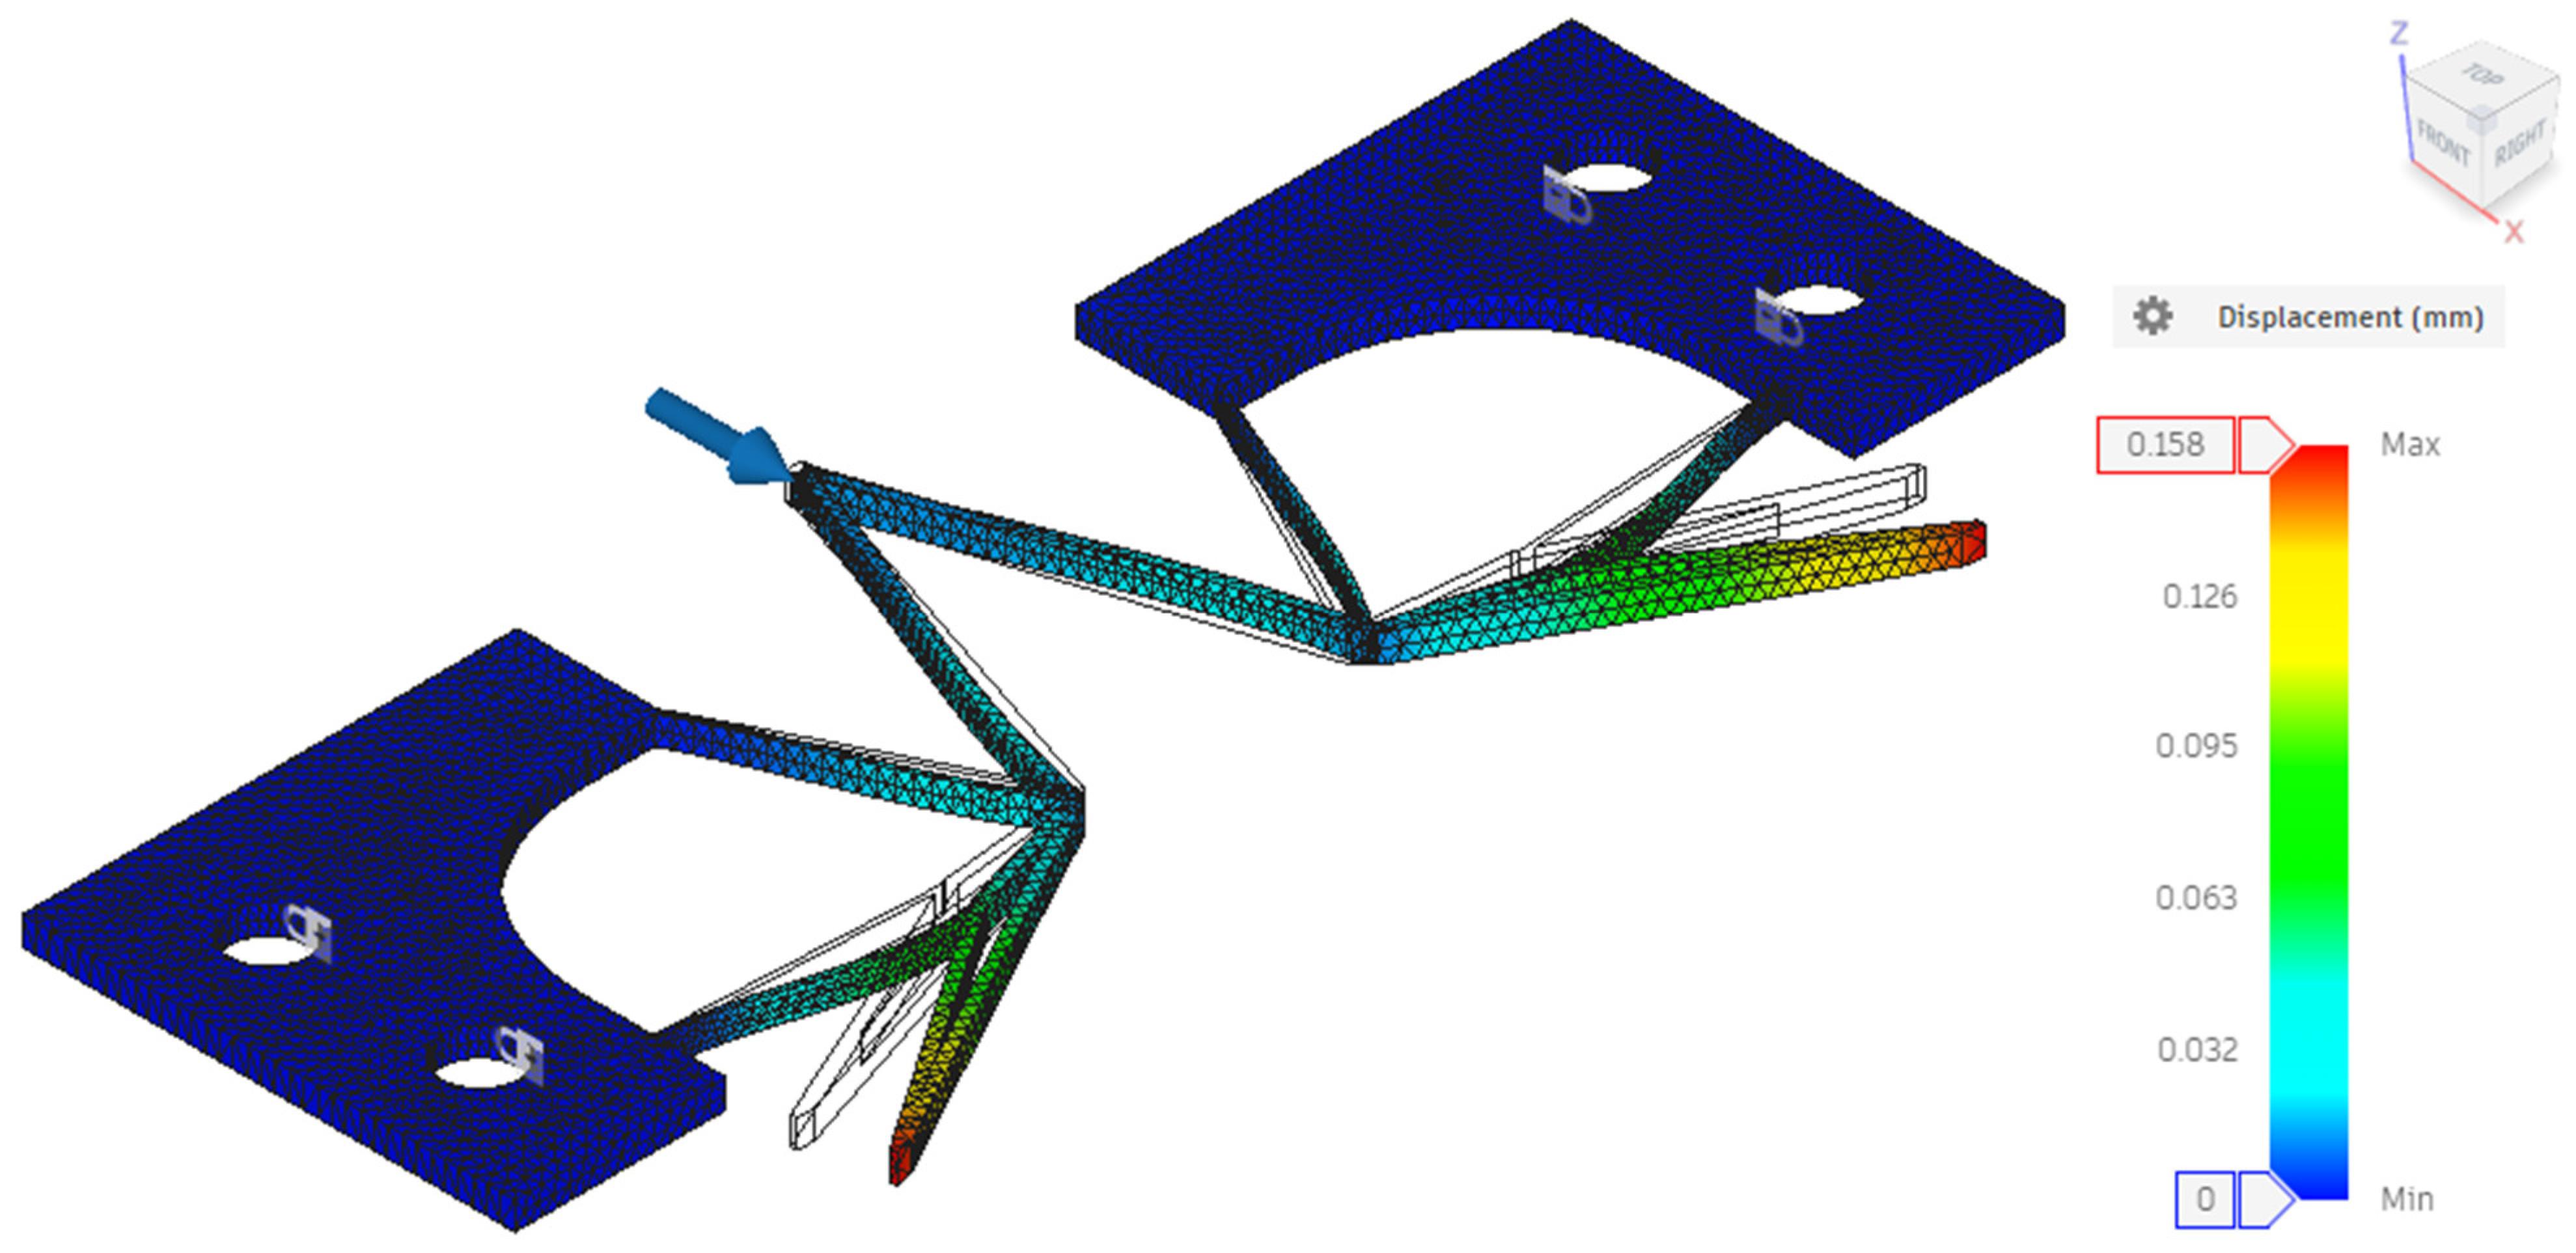
The model is constrained by fixing all degrees of freedom at the four mounting holes, and a load of 0.25 N is applied at IP1 along the x-direction. This specific load of 0.25 N was selected to represent the typical 50% operational force of commercial millimeter-scale piezoelectric actuators (e.g., PI PICMA® series, max force ~0.50 N) [37]. Crucially, this small actuation load ensures the mechanism operates within the linear elastic regime of PA-12 material. It prevents both structural yielding and geometric nonlinearities during precision operation. Figure 4 illustrates the displacement contours, showing amplified output displacements at both OP1 and OP2 aligned with the input direction.
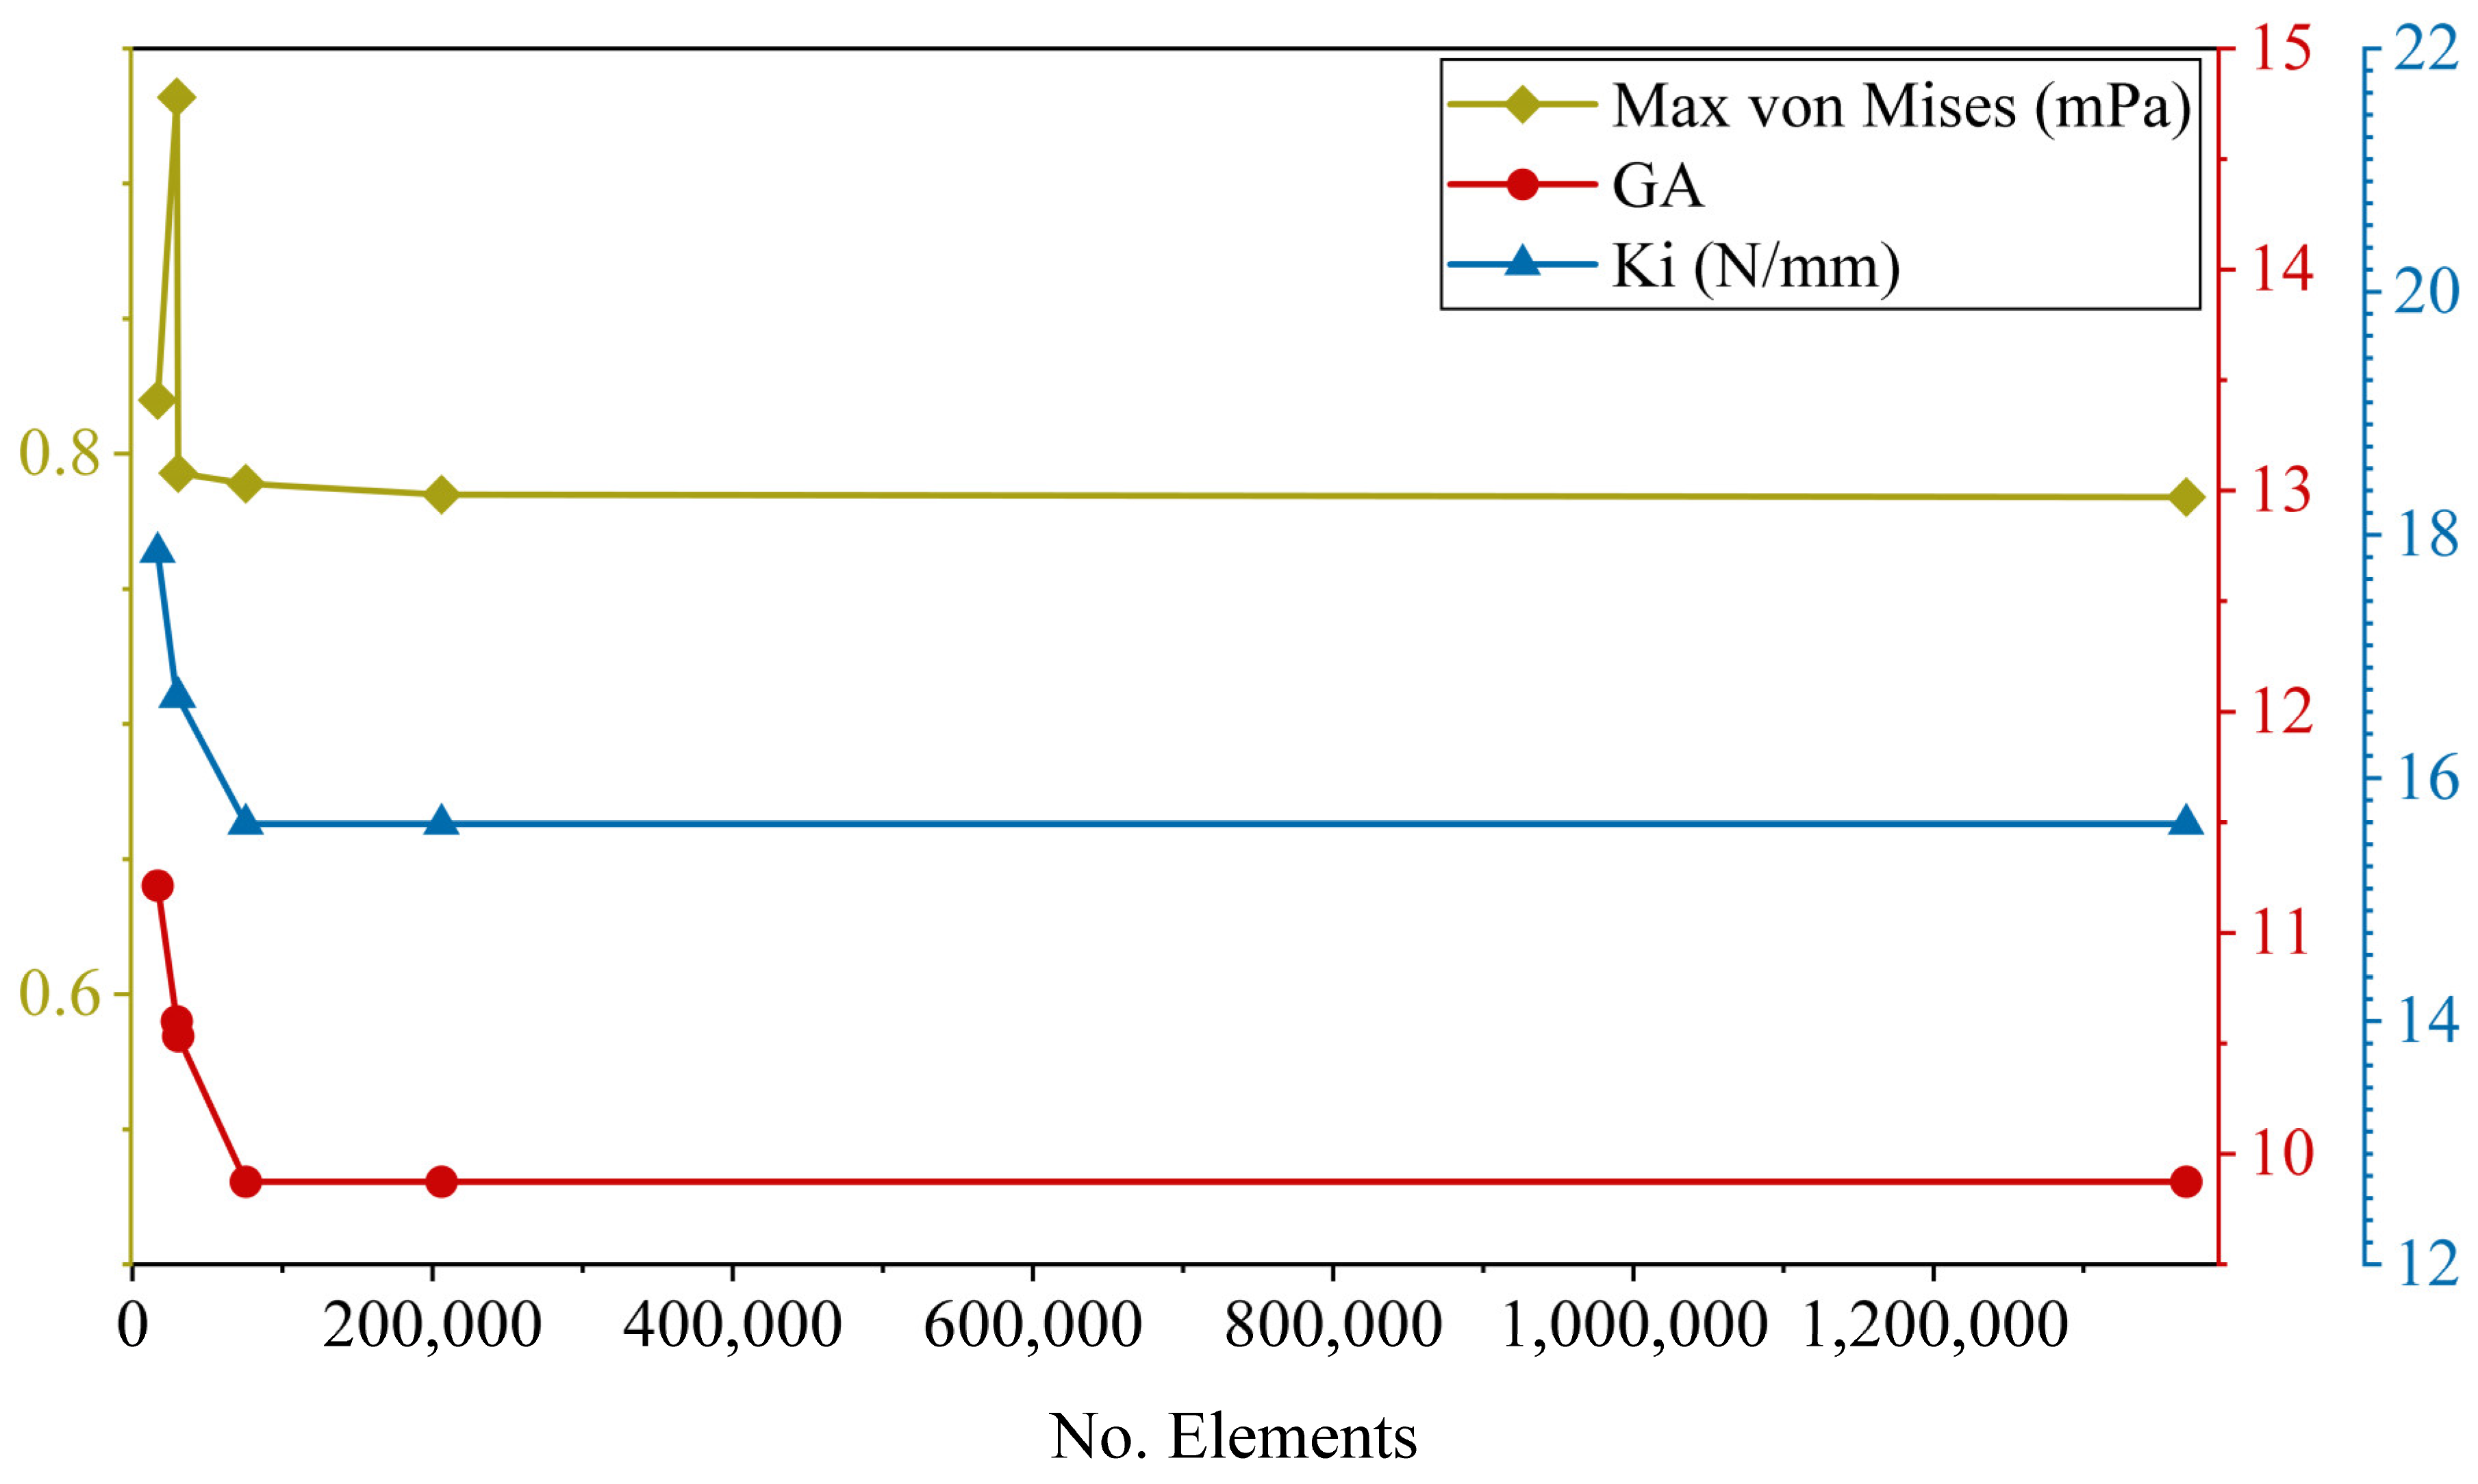
To ensure the accuracy of the numerical simulation and verify that the GA and stiffness results are independent of the mesh resolution, a mesh convergence study was performed by systematically reducing the adaptive element length from 1.5 mm down to 0.25 mm. The simulation achieved convergence at a 0.5 mm element length. Further refinement to 0.25 mm (resulting in a highly dense mesh of 1,368,261 elements) yielded no change in the GA (9.875) and a negligible variation in the maximum von Mises stress, as shown in Figure 5 and Supplementary Table S2. Crucially, the maximum von Mises stress of 0.784 MPa for the baseline model was safely below the 27.50 MPa yield strength of PA-12. Consequently, the 0.5 mm converged mesh configuration was utilized for all subsequent optimizations, validating the reliability of the Autodesk solver for this linear elastic analysis.
The GA obtained from FEA is GA_FEA = 9.875, which closely agrees with the theoretical value obtained from conceptual synthesis (GA_conceptual = 9.5). The slight deviation between conceptual and simulated GA values is attributed to the consideration of finite link thickness, material compliance, and stress-induced deformation in the realized mechanism, which are neglected in the idealized conceptual model. This close agreement confirms the validity of the IC–BB-based conceptual synthesis and establishes the realized SIDO-CDAM as a reliable baseline model for subsequent parametric optimization.

3. Parametric Optimization of SIDO-CDAM

3.1. Optimization Problem Formulation

In the present study, the SIDO-CDAM is synthesized using the IC–BB approach, considering ideal kinematic assumptions. However, conceptual synthesis alone does not ensure optimal performance once material properties, finite link dimensions, and manufacturing constraints are incorporated. Therefore, parametric optimization is essential to enhance the performance of the realized SIDO-CDAM.
A SIDO-CDAM is considered effective when it produces maximum output displacement while requiring minimum force at the input location. Therefore, maximizing GA and minimizing the input-location stiffness relative to a baseline realized design are selected as the primary design objectives of this study. The GA and stiffness of the SIDO-CDAM are strongly influenced by several geometrical design parameters, namely rigid link thickness (t1_rigid), flexible link thickness (t2_flexible), notch diameter (d_notch), and moving-point location (mp_location) [13]. Variations in any of these parameters alter force transmission, thereby significantly affecting both GA and stiffness.
The design parameters were constrained within prescribed ranges based on fabrication limitations and spatial constraints of mechanism geometry. Considering FDM–3D printing-based fabrication, the minimum allowable thickness for both rigid and flexible links is limited to 0.4 mm. To avoid geometrical interference and excessive structural stiffness, the maximum thickness is restricted to 2.0 mm for rigid links and 1.2 mm for flexible links. The notch diameter is constrained within the range of 0.2 mm to 1.0 mm, as excessive notch size may compromise the structural integrity of the mechanism, whereas small diameters may restrict compliant deformation. The moving-point location is permitted to vary within a bounded ±1 mm grid along both the x- and y-directions. This constraint prevents physical geometric interference between the compliant links, while still allowing sufficient variance to significantly influence the effective topology and the resulting geometrical advantage (GA).
Based on the above considerations, the multi-objective optimization problem is formulated as follows:
Design variables:
t1_rigid, t2_flexible, d_notch, mp_location;
Maximize GA:
GA_FEA = f (t1_rigid, t2_flexible, d_notch, mp_location);
Minimize input-location stiffness:
Stiff_FEA = g (t1_rigid, t2_flexible, d_notch, mp_location);
Subject to constraints:
0.4 mm ≤ t1_rigid ≤ 2.0 mm;
0.4 mm ≤ t2_flexible ≤ 1.2 mm;
0.2 mm ≤ d_notch ≤ 1.0 mm;
mp_location: ± 1 mm in the x- and y-directions.
In the current work, GA and input-location stiffness are conflicting objectives; an increase in GA generally leads to a reduction in stiffness and vice versa. To address this trade-off and to identify an optimal balance between displacement amplification and structural rigidity, a multi-objective optimization framework is adopted.

3.2. Optimization Methodology

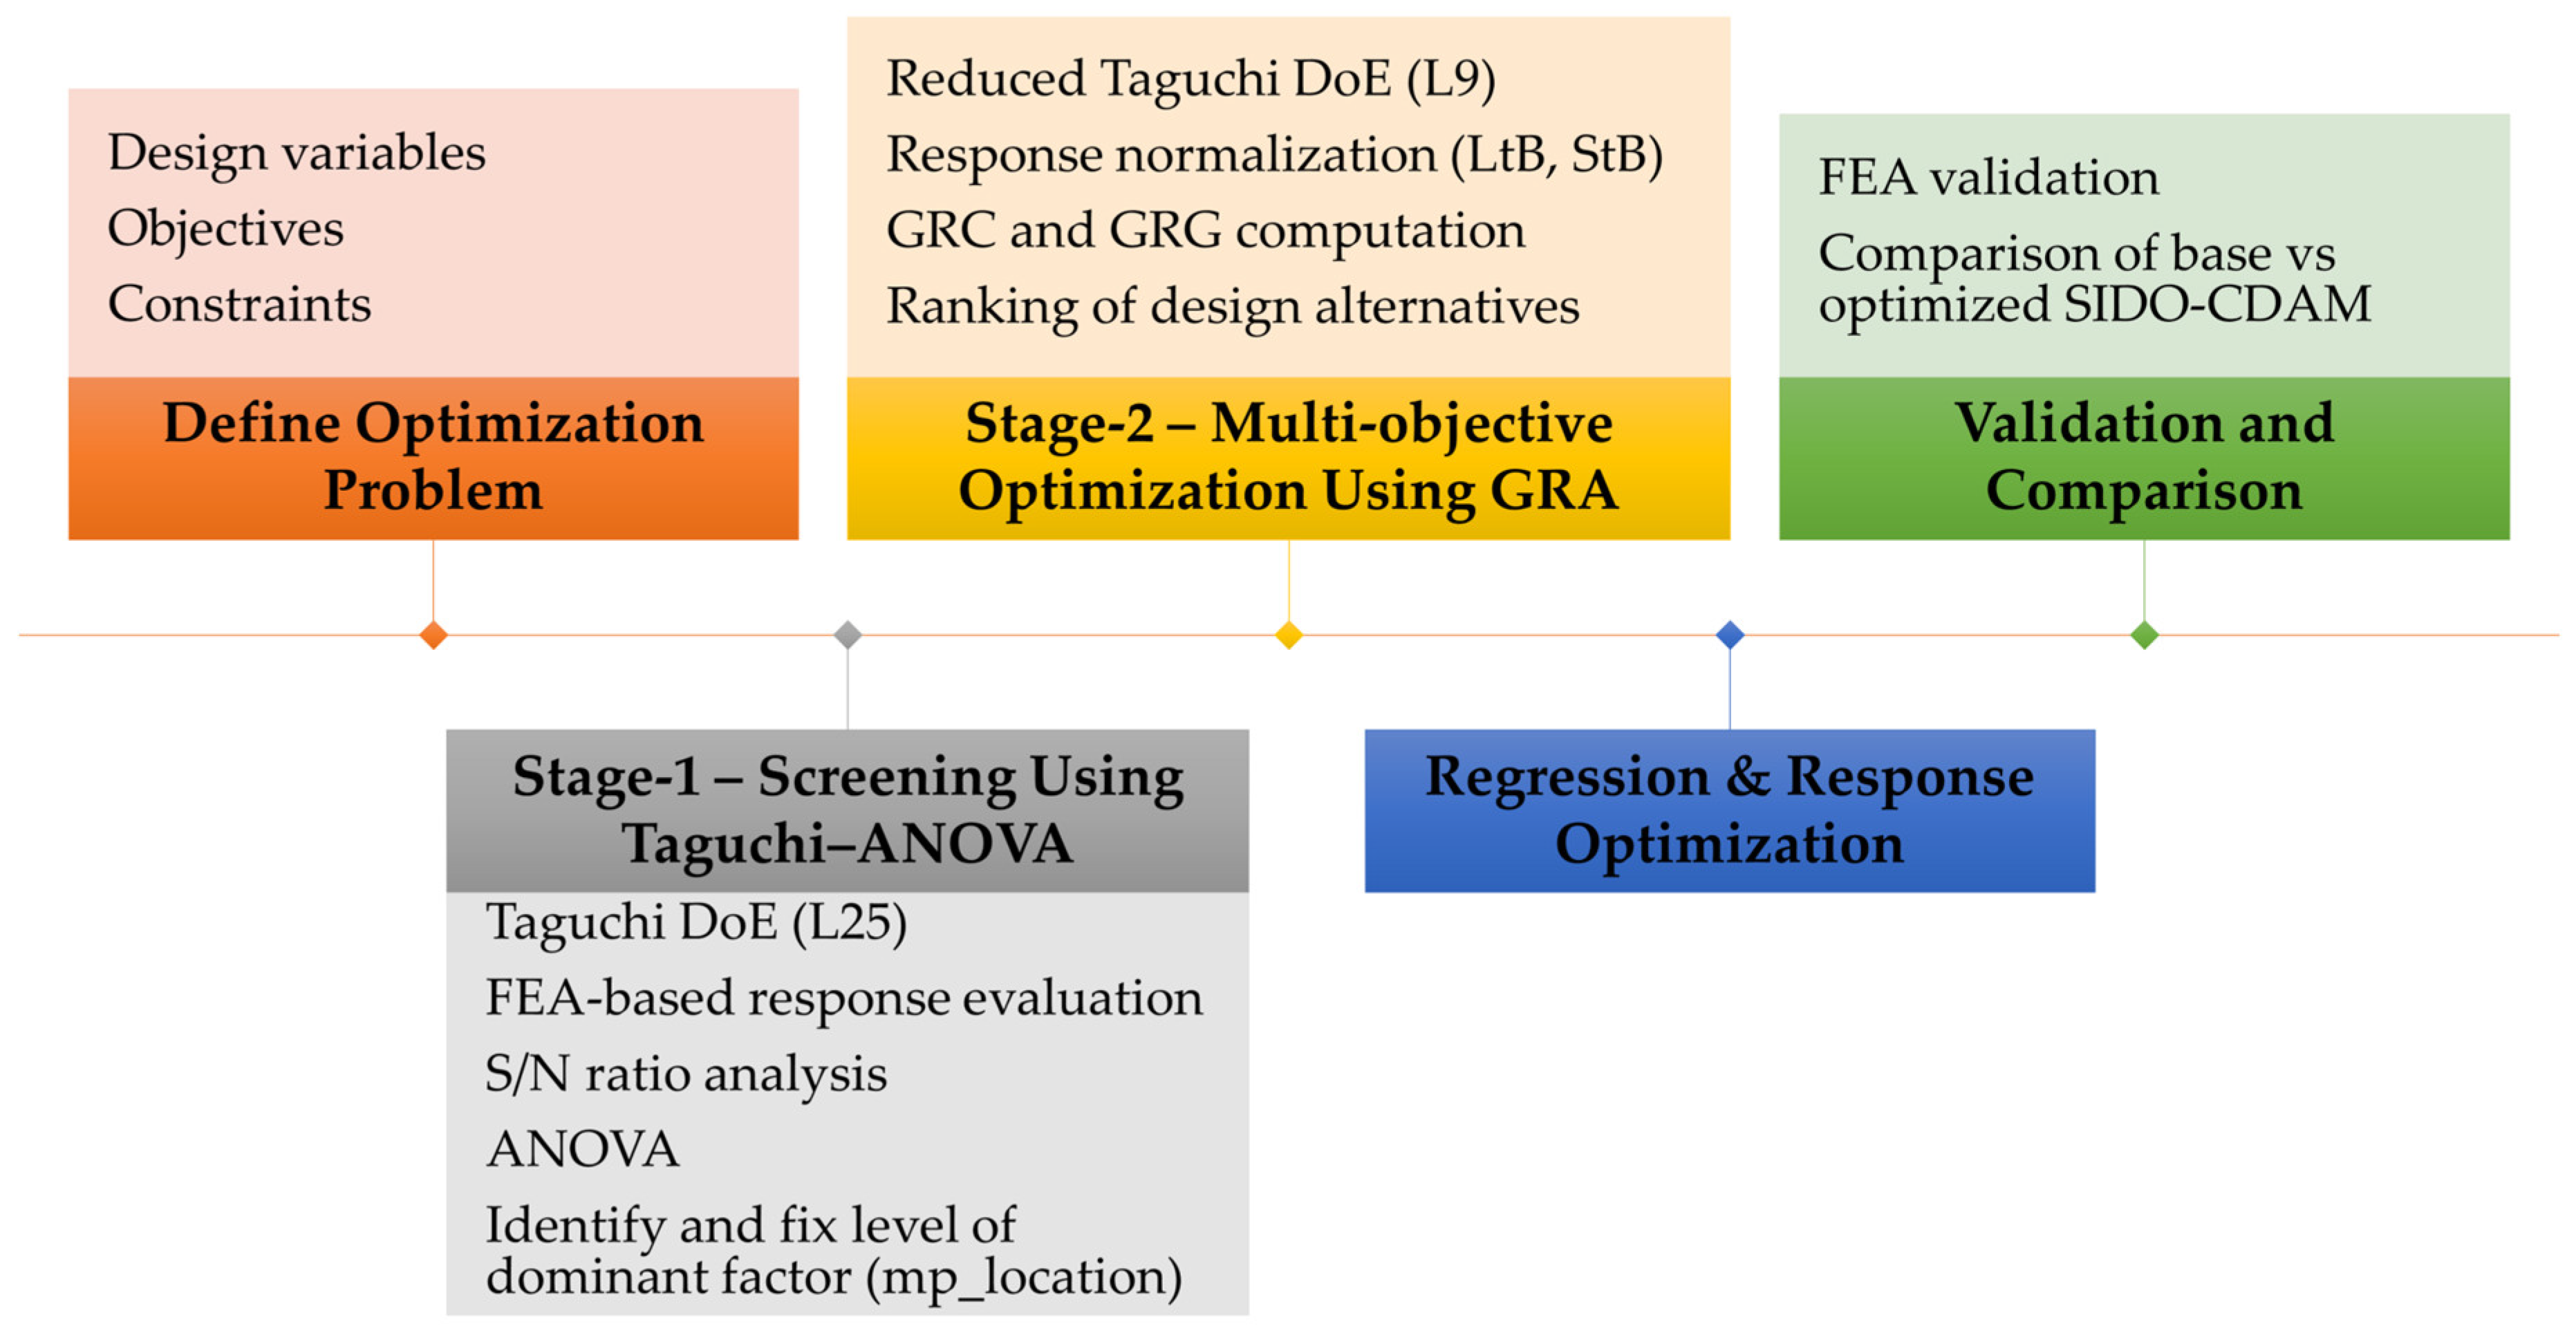
In this study, the realized SIDO-CDAM is optimized using a sequential Taguchi–ANOVA–GRA approach. While advanced techniques like evolutionary algorithms offer superior continuous design space exploration, they demand computationally expensive FEA evaluations. In contrast, the sequential Taguchi–GRA framework was selected for its highly efficient discrete screening capabilities. This methodology enables efficient exploration of the design space, identification of dominant design parameters, and determination of an optimal parameter combination, while significantly reducing computational efforts. A two-stage optimization strategy is employed to improve the robustness and interpretability of the results. In Stage-1, a Taguchi design combined with ANOVA is used as a screening tool to evaluate the relative influence of all design parameters and to identify the most dominant factor. Fixing this dominant parameter at its optimal level in the subsequent stage helps eliminate its masking effect on other parameters. In Stage-2, the remaining influential parameters are refined using a reduced Taguchi design, and GRA is applied to obtain an optimal solution under conflicting objectives. The overall optimization workflow is illustrated in Figure 6.

3.3. Stage-1: Taguchi–ANOVA-Based Screening

A Taguchi design of experiments (DOE) approach was employed to systematically investigate the influence of four design parameters, namely t1_rigid, t2_flexible, mp_location, and d_notch (defined earlier in Section 3.1), on the performance of the SIDO-CDAM. As shown in Figure 3, the moving point of the base model is initially located at coordinates (31, 20). Since the moving-point location has a strong influence on GA, a strategic spatial sampling method was employed. Instead of arbitrary continuous points, the position was varied to represent the nominal center point and the four extreme diagonal boundaries of the allowable grid. Accordingly, five discrete levels were purposefully selected for mp_location: (31, 20), (32, 21), (30, 21), (30, 19), and (32, 19). This configuration effectively maps the directional sensitivity of the geometrical advantage without causing an unnecessary exponential increase in factorial levels. For all Taguchi trials, the elliptical notch cut on the links was modeled by keeping the ratio of its minor to major diameter constant at 0.894. The presence of four control factors, each evaluated at five discrete levels, resulted in a 5 4 Taguchi experimental design. The control parameters and their corresponding levels used for Stage-1 optimization are summarized in Table 1.
To design the experiment efficiently, an L25 orthogonal array (OA) was selected using Minitab Statistical Software 22. The required degrees of freedom (DOFs) [38] were calculated as DOF = (Number of levels − 1) × Number of factors + 1 = (5 − 1) × 4 + 1 = 17. Among the available orthogonal arrays, L25 satisfied the requirement of having DOFs ≥ 17 for five-level designs with four factors. Therefore, the L25 orthogonal array was adopted to generate the input parameter combinations for FEA trials.
For each Taguchi trial, a 3D parametric model of the SIDO-CDAM was developed in Fusion 360, where the geometry was automatically updated by modifying the design parameters. FEA simulations were carried out under identical material properties and boundary conditions as described in Section 2.2. The GA_FEA and Stiff_FEA were computed from the simulated input and output displacements and input forces. The complete L25 design matrix, along with the corresponding simulated response values, is presented in Table 2. S/N ratio analysis and ANOVA-based sensitivity analysis were carried out using Minitab to evaluate the contribution of each control parameter to the variation in GA and stiffness.

3.4. Results and Discussion for Stage-1 Optimization

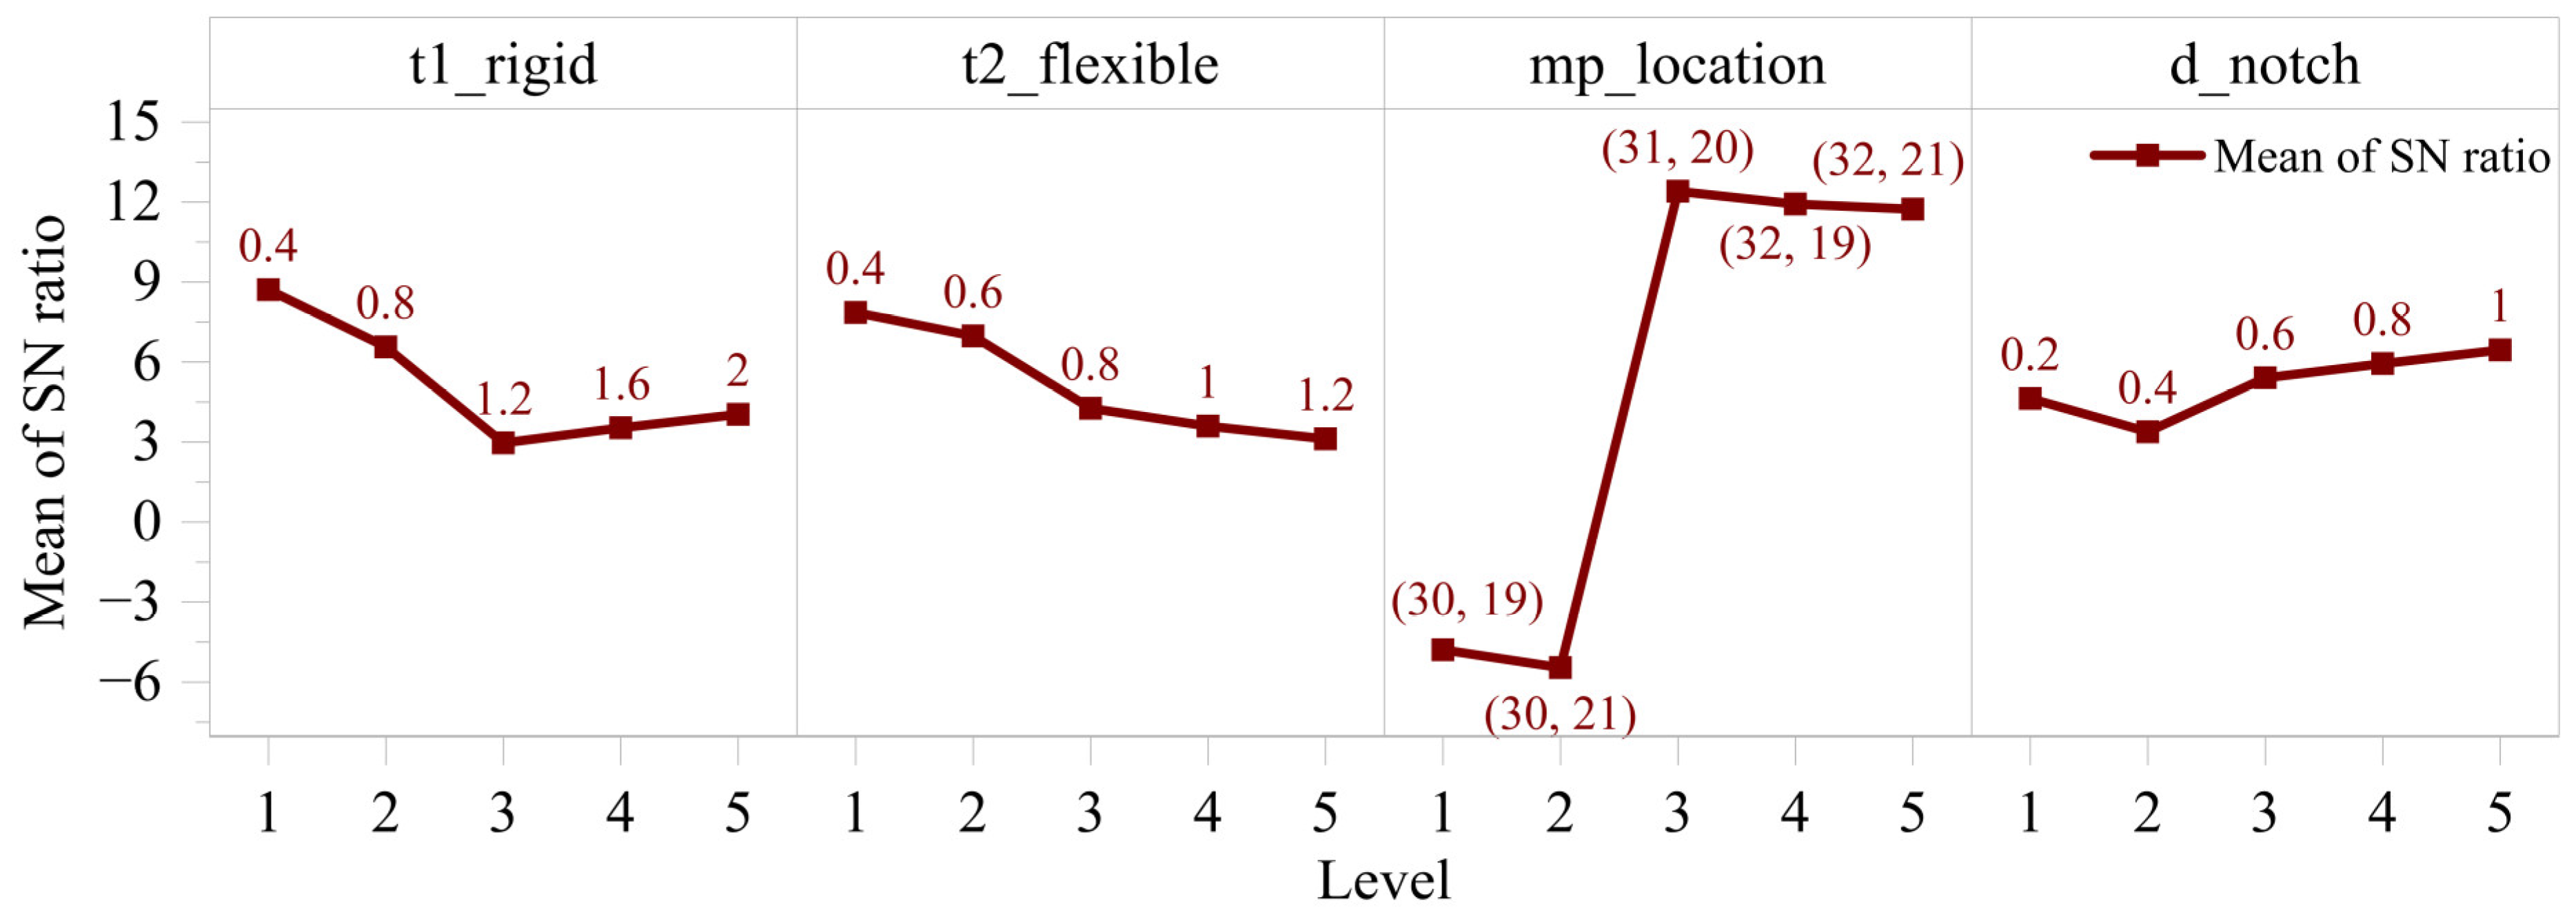
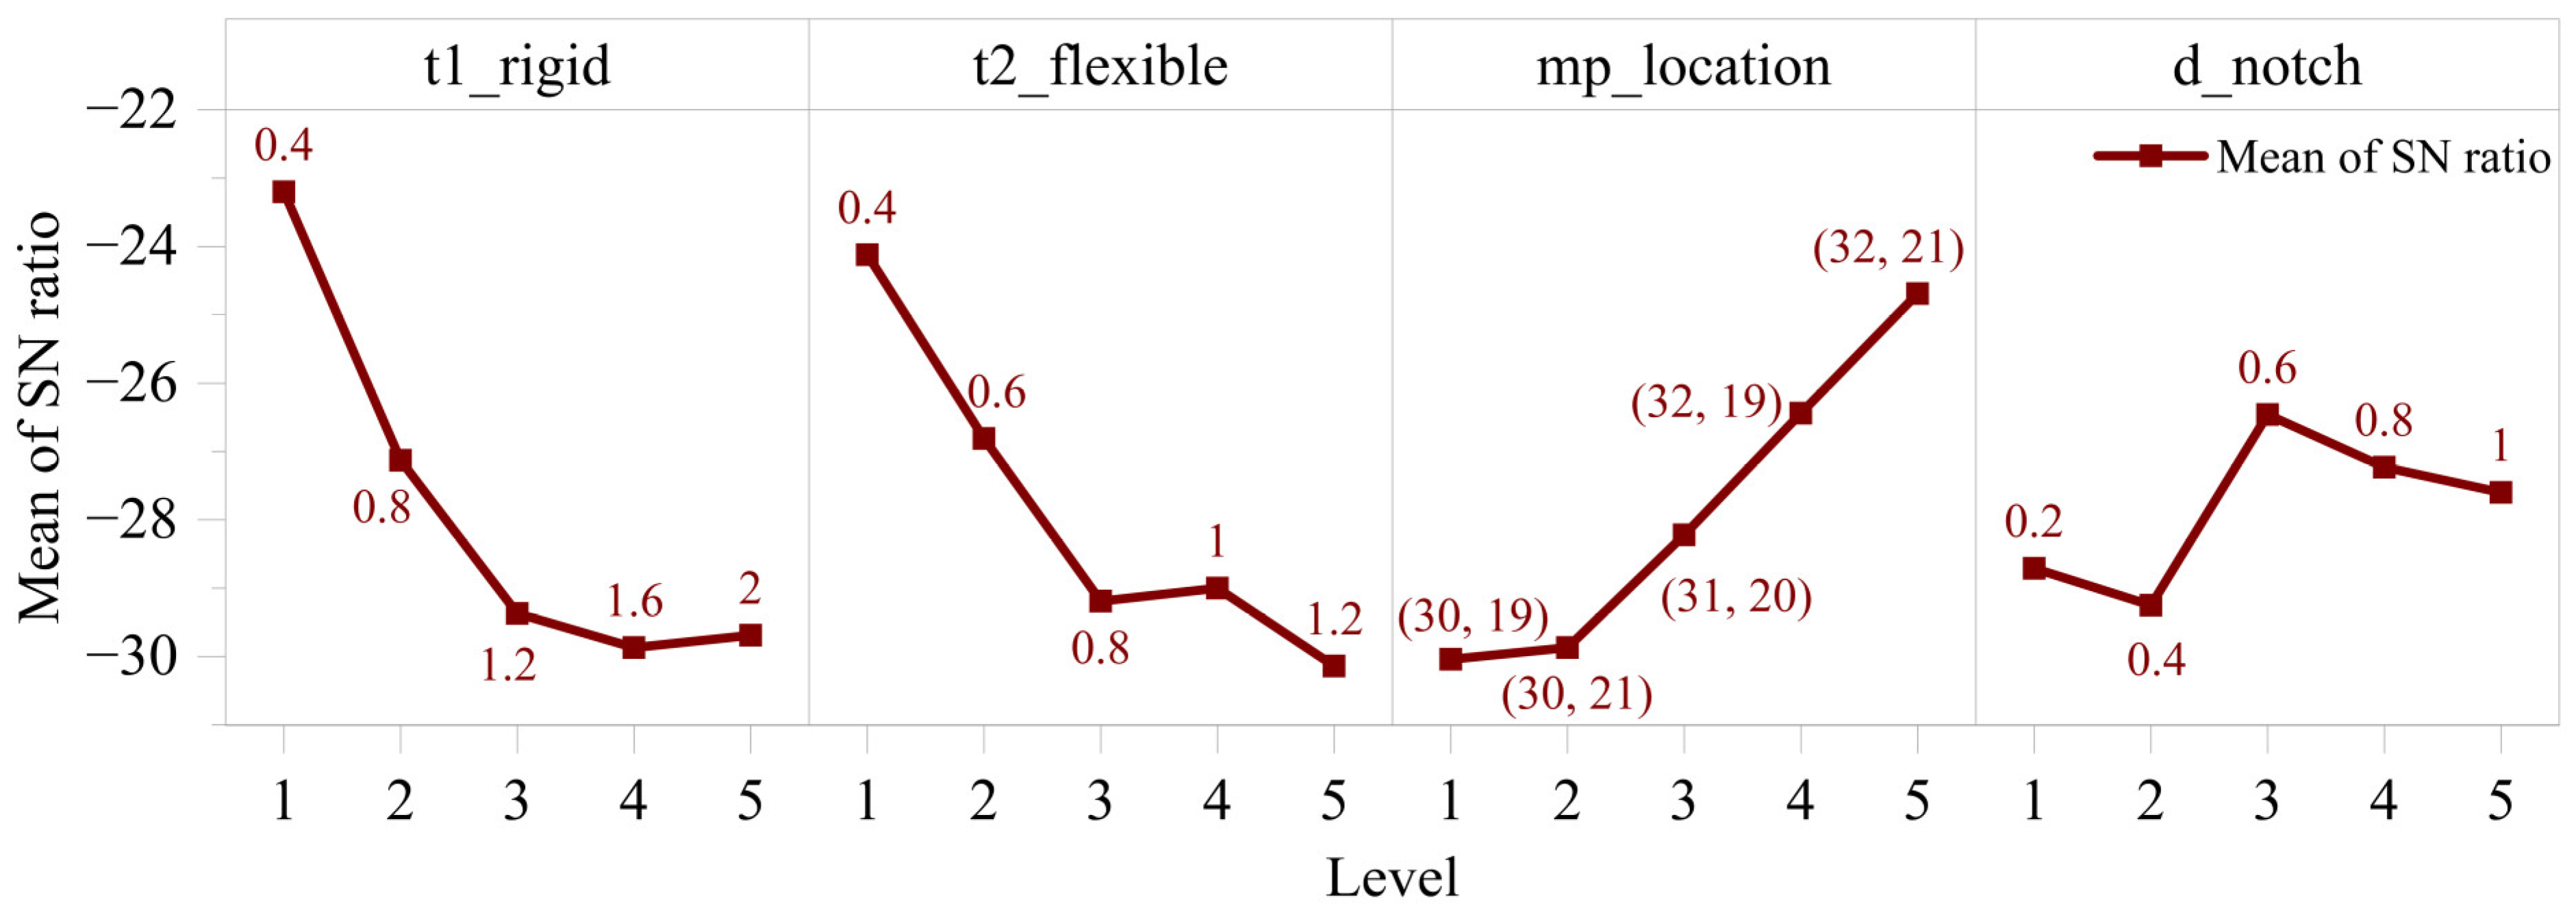
The S/N ratio plots for GA_FEA (“larger-the-better”) and Stiff_FEA (“smaller-the-better”) are shown in Figure 7 and Figure 8, respectively. For GA_FEA, the highest S/N ratios were obtained for t1_rigid = 0.4 mm, t2_flexible = 0.4 mm, mp_location = (31, 20), and d_notch = 1 mm, indicating that thinner links combined with an optimally positioned moving point enhance displacement amplification. For stiffness minimization, the optimal parameter combination was t1_rigid = 0.4 mm, t2_flexible = 0.4 mm, mp_location = (32, 21), and d_notch = 0.6 mm. The optimal combination of control parameters for maximizing GA was (1 1 3 5), while that for minimizing stiffness was (1 1 5 3). These results highlight the inherent trade-off between maximizing geometrical advantage and minimizing stiffness.
ANOVA was performed on S/N ratios to quantify the statistical significance of each control parameter. The ANOVA results for GA_FEA listed in Table 3 indicate that mp_location is the most influential parameter, contributing to the largest share (85.41%) of the total variation with p < 0.001. A p-value less than 0.05 confirms the statistical significance of the parameter. The t1_rigid showed marginal significance (p = 0.061), while t2_flexible and d_notch had negligible effects. The low residual error of 3.20% confirms that the selected control parameters are the primary sources of variability in GA_FEA.
The ANOVA results for stiffness listed in Table 4 show that t1_rigid appeared as the most significant factor, contributing 35.37% of the total variation (p = 0.009). t2_flexible and mp_location also showed significant contributions of 25.88% and 23.21%, respectively, whereas d_notch remained statistically insignificant. The low residual error further confirms a good model fit and supports the adequacy of the Taguchi model in representing stiff behavior.
The response tables for S/N ratios are presented in Table 5, highlighting the optimal levels and relative ranking of control parameters for both responses. Regression models were developed for GA_FEA and Stiff_FEA using Minitab to support prediction and validation, and the corresponding equations are listed in Table 6. Residual plots provided in the Supporting Information, shown in Figure S3a,b, indicate that the residuals closely follow the reference line, confirming good agreement between predicted and simulated responses.
The optimized input parameter combinations obtained from the S/N analysis were evaluated using FEA, and the results are summarized in Table 7. Compared to the base model, the optimized configuration for GA_FEA achieved a 17.47% improvement in geometrical advantage with only a marginal change in stiffness, while the stiffness-optimized configuration resulted in a 74.05% reduction in stiffness, accompanied by a moderate reduction in GA_FEA.
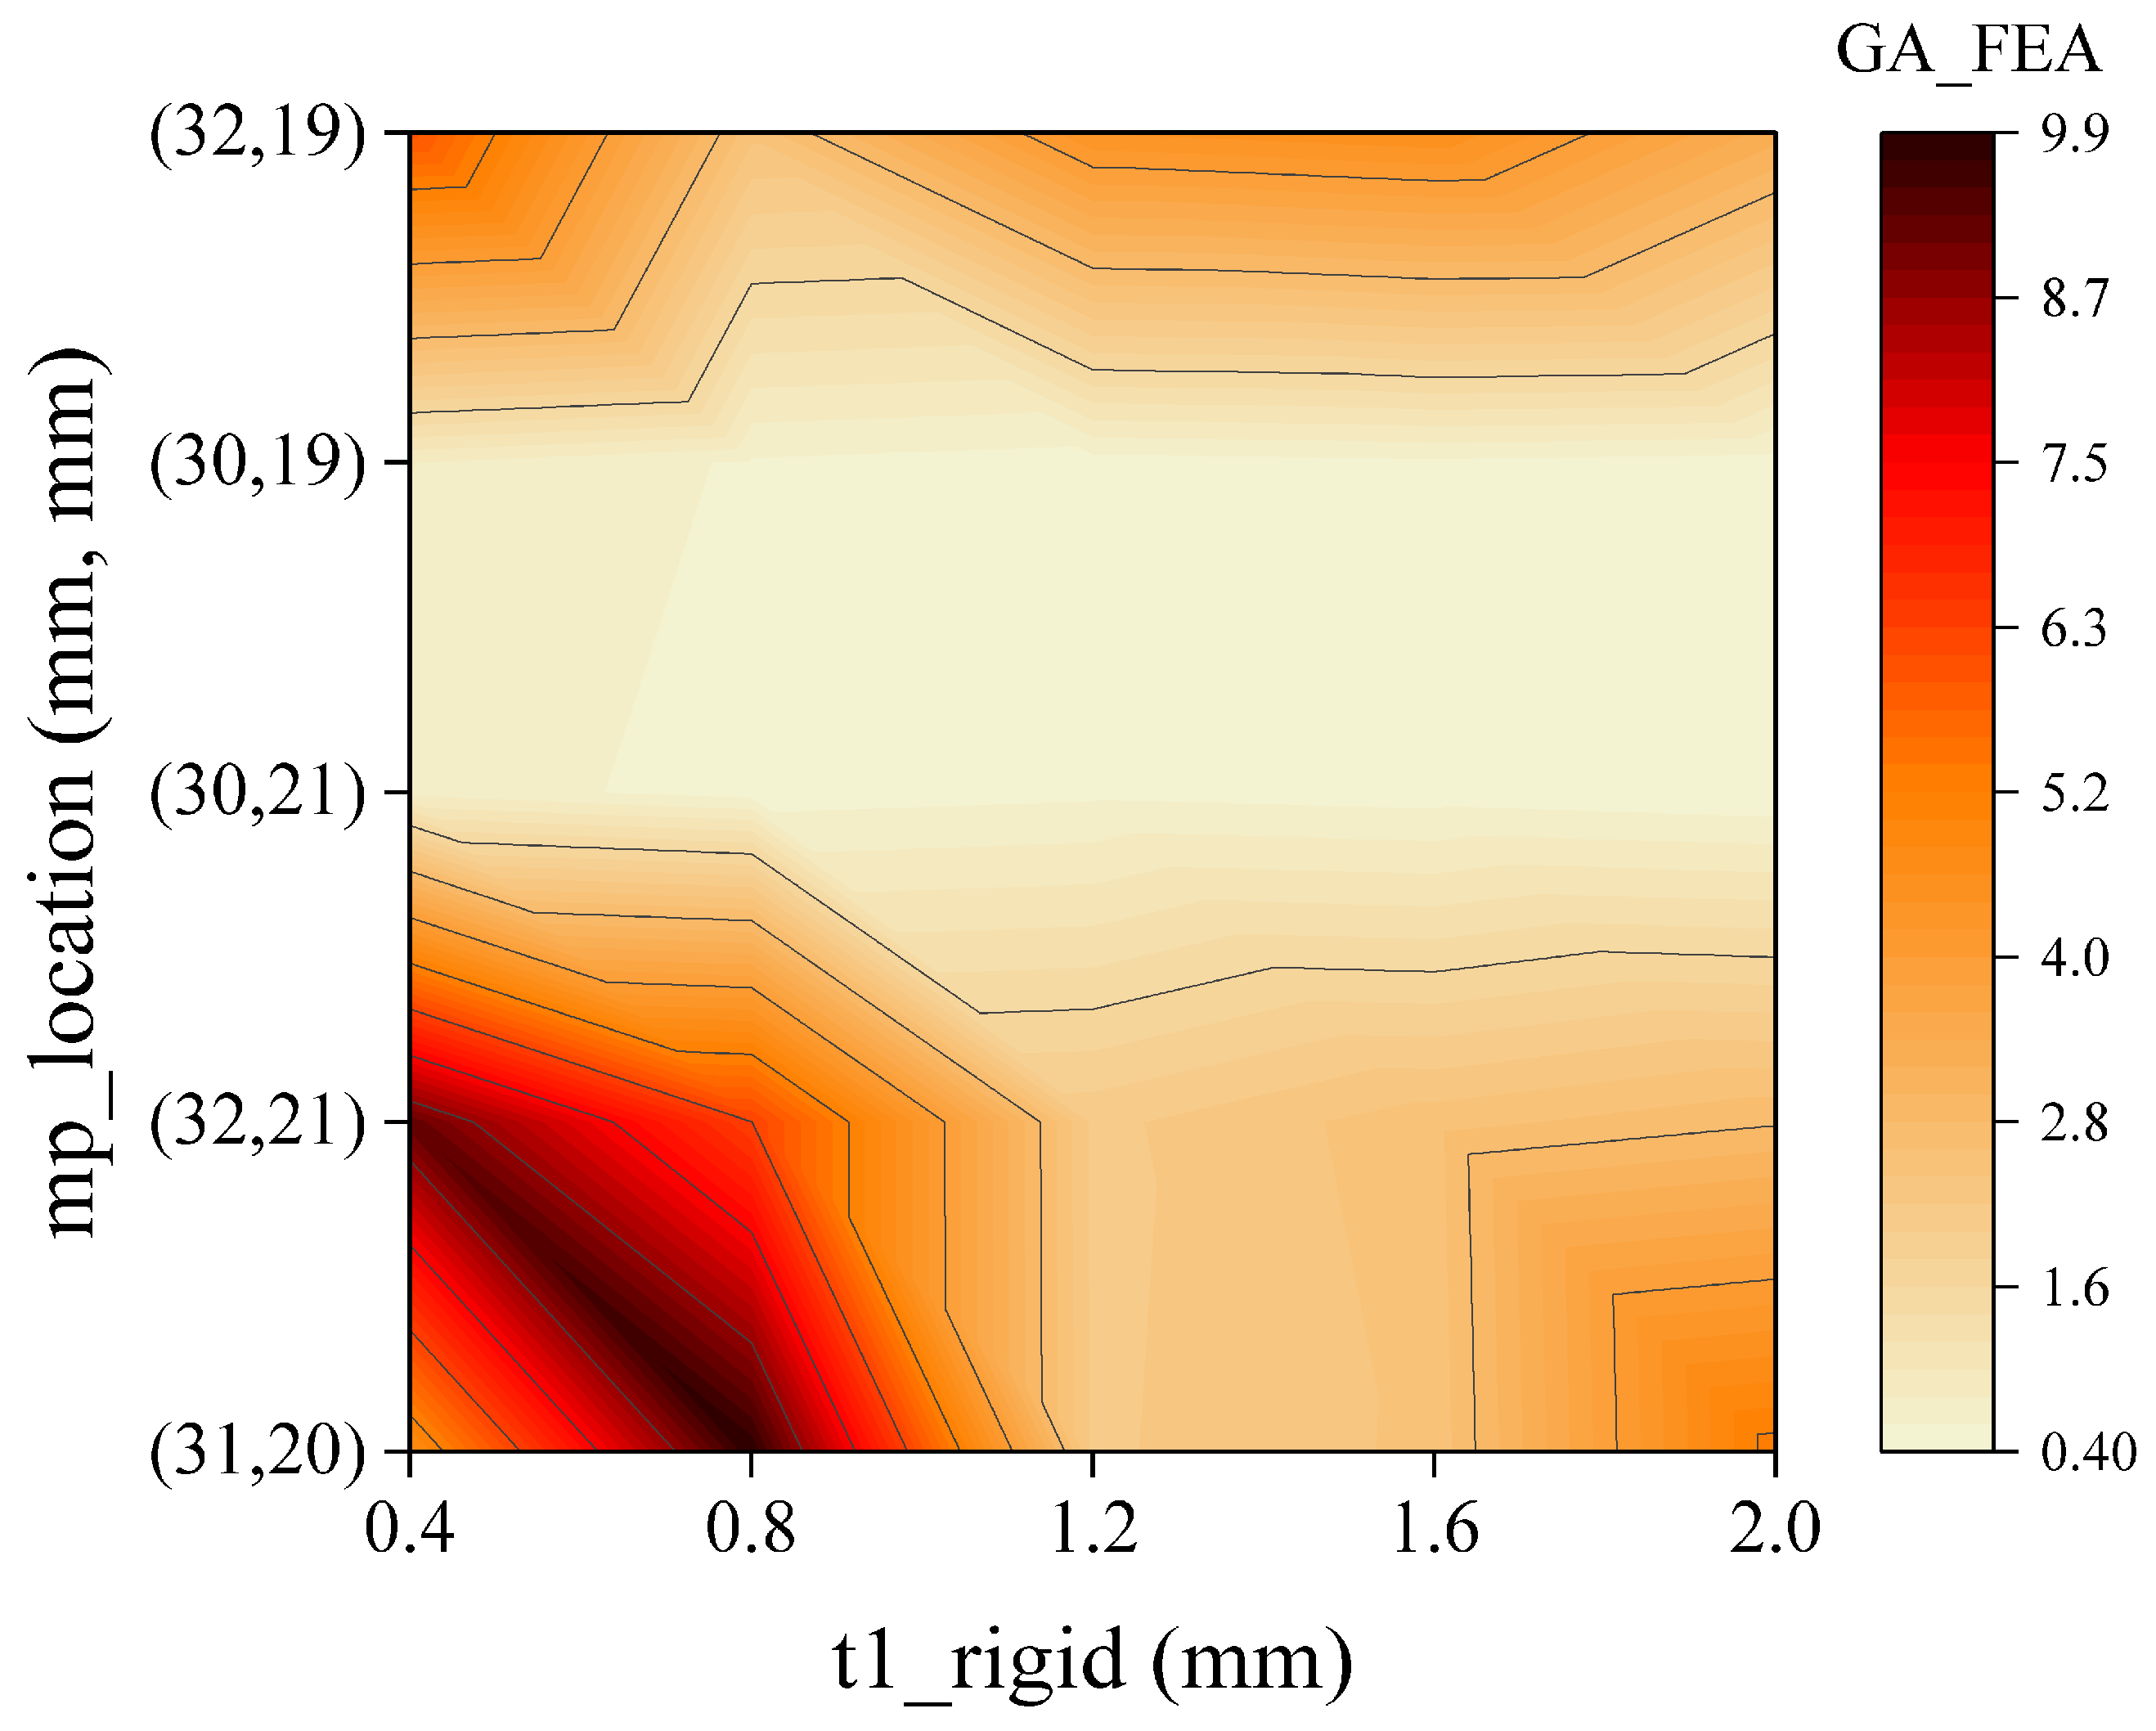
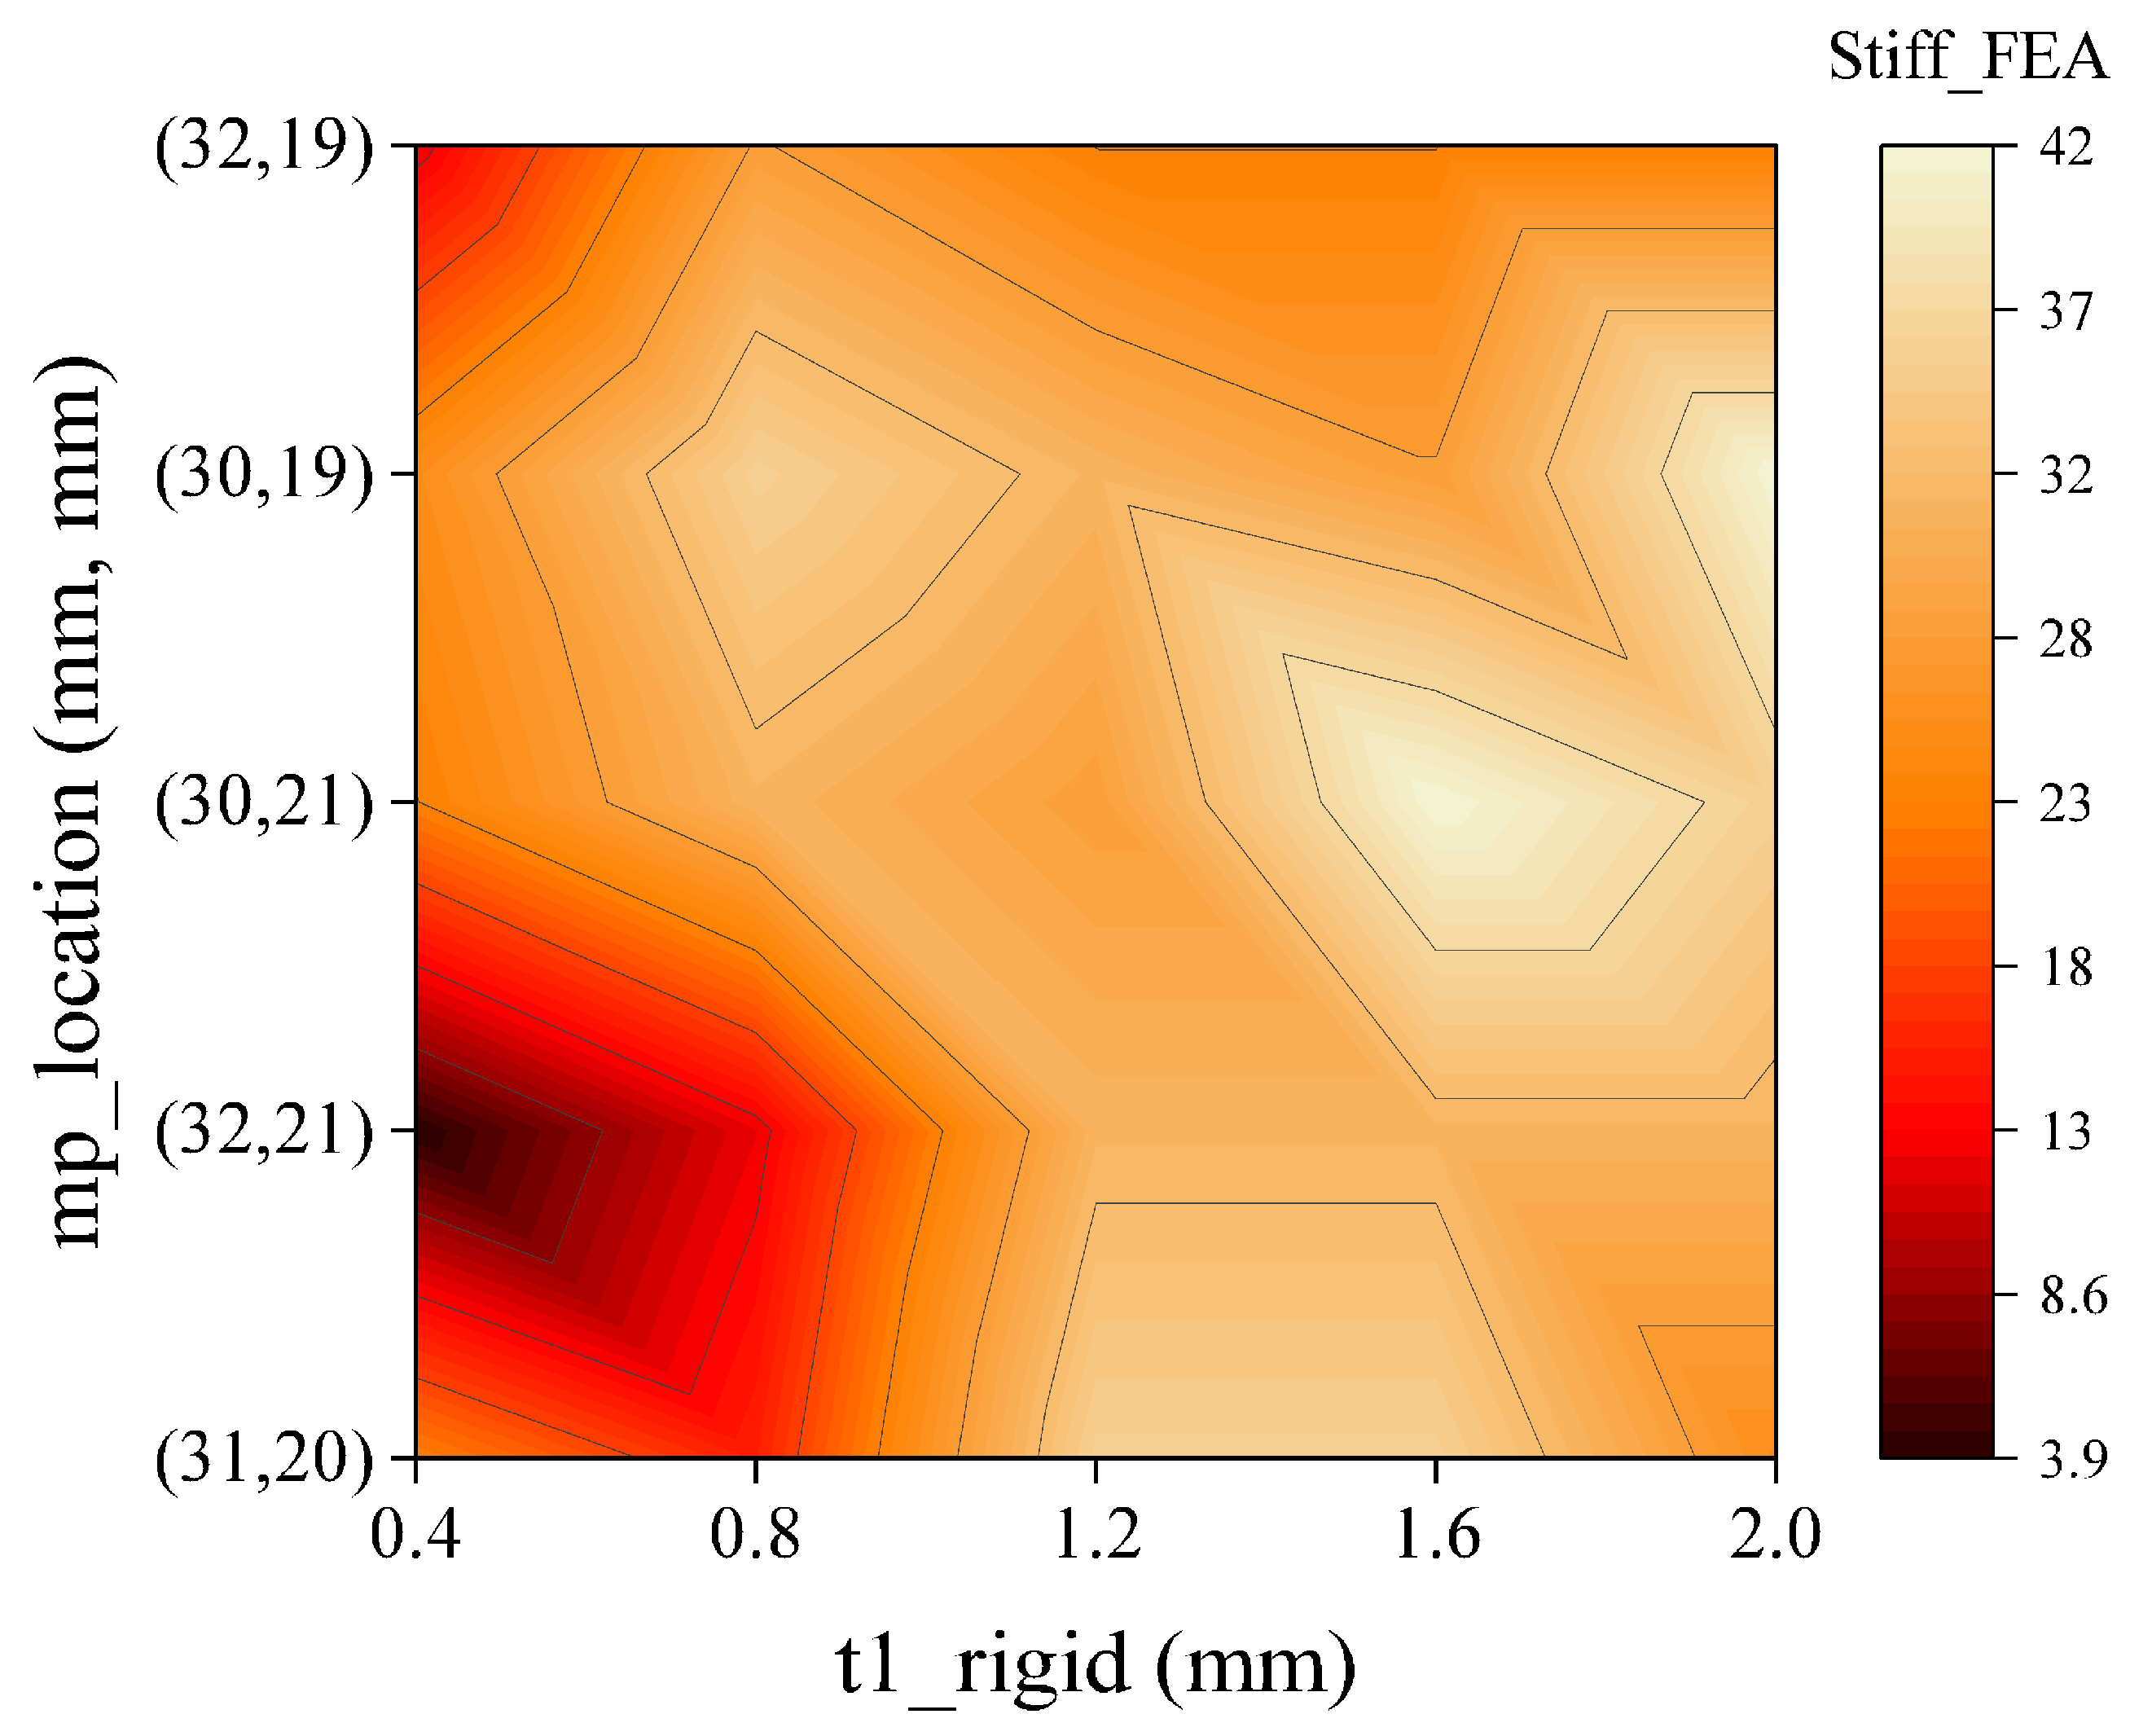
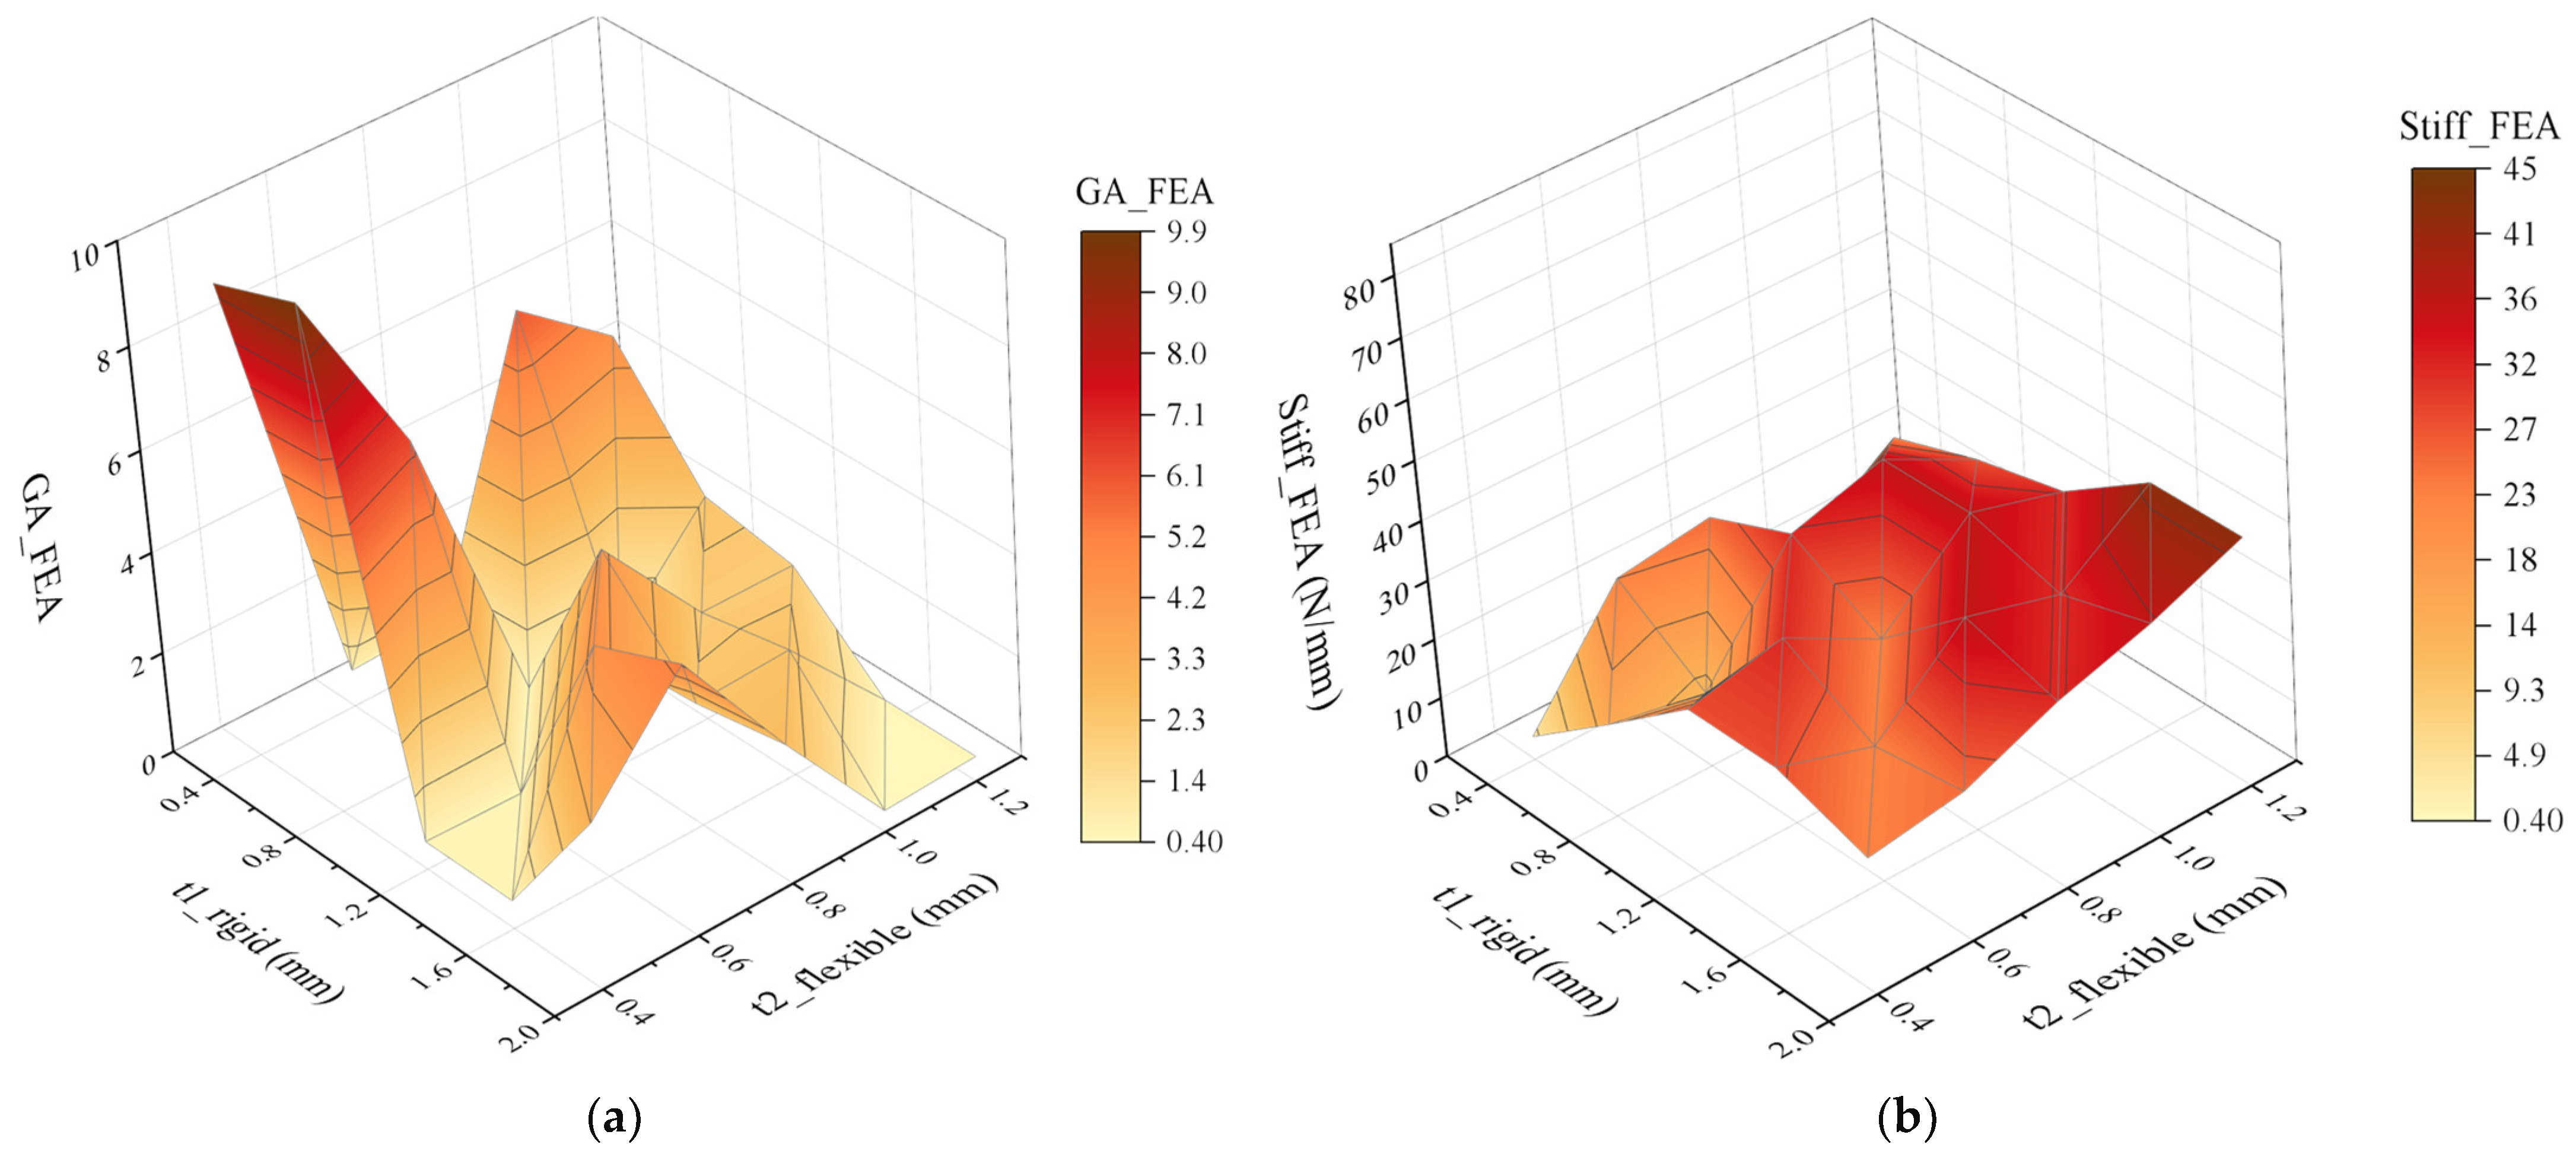
The effects of the significant control parameters t1_rigid and mp_location on GA_FEA and Stiff_FEA are illustrated in Figure 9 and Figure 10, respectively. The surface plots and heatmaps presented in Figure 11a,b, Figures S4 and S5 (in the Supporting Information) consistently reveal specific parameter regions where high geometrical advantage and low stiffness coexist. In particular, GA values close to or beyond 9 were achieved when the moving point was located at (31, 20) or (32, 21) with t1_rigid in the range of 0.4–0.8 mm.
The moving-point location was therefore identified as the dominant design parameter. Any change in the location of the moving point directly altered the lengths and orientations of the connected links, thereby modifying the instantaneous geometry and significantly affecting the overall amplification behavior. Since maximizing GA_FEA was prioritized in this study, the moving-point location of (31, 20) was selected and fixed for subsequent optimization. The moving point is considered a categorical parameter; however, fixing it at its optimal level simplifies the regression model, which improves prediction accuracy and allows the remaining continuous parameters to be analyzed independently. The influence of the remaining parameters is further investigated using a reduced Taguchi L9 design, as discussed in Section 3.5.

3.5. Stage-2: Multi-Objective Optimization Using GRA

In this stage, multi-objective optimization was performed to simultaneously maximize GA and minimize stiffness using GRA. Based on the Stage-1 results, the moving-point location was fixed at its optimal position, and the remaining control parameters t1_rigid, t2_flexible, and d_notch were further investigated at three levels, as listed in Table 8. A Taguchi orthogonal array L9 ( 3 3 ) was selected, which satisfies the degree of freedom requirement (DOF = 7) while minimizing the number of simulation trials.
The Taguchi L9 design matrix and corresponding FEA-based response values are summarized in Table 9. All simulations were conducted using the same process described in Section 3.3. The deformed and undeformed configurations of the mechanism for each trial are provided in Figure S6 of the Supporting Information.
Taguchi analysis is suitable for single-objective optimization, whereas GRA was employed to convert the multi-response problem into a single performance index. The S/N ratios of GA_FEA (larger-the-better) and Stiff_FEA (smaller-the-better) were first calculated using Equations (4) and (5), followed by normalization using Equations (6) and (7). The deviation sequences were then computed using Equations (8) and (9), and the corresponding Gray Relational Coefficients (GRCs) were obtained using Equations (10) and (11), with the distinguishing coefficient ζ set to 0.5.
The gray relational grade (GRG), defined as the weighted sum of the GRCs for GA_FEA and Stiff_FEA (Equation 12), was used as the overall performance indicator. All trials were ranked based on GRG values, where a higher GRG indicates superior combined performance. The GRA calculations were implemented using Python 3.12. Because maximizing geometric amplification was the primary objective of this specific actuation mechanism, unequal weighting factors were strategically assigned. A weight of w G A  = 0.7 was applied to the geometrical advantage, while a weight of w S t i f f  = 0.3 was applied to the input stiffness. This formulation explicitly prioritizes amplification while maintaining an acceptable penalty for stiffness reduction. The detailed GRA results are presented in Table 10.
S/N ratios:
For   larger - the - better :   S / N G A i = 10 log 10 1 n i = 1 n 1 G A i 2
For   smaller - the - better :   S / N S t i = 10 log 10 1 n i = 1 n S t i 2
Normalization of S/N ratios:
S / N * G A i = S / N G A i m i n ( S / N G A ) m a x ( S / N G A ) m i n ( S / N G A )
S / N * S t i = m a x ( S / N S t ) S / N S t i m a x ( S / N S t ) m i n ( S / N S t )
Deviation sequences:
G A i = 1 S / N * G A i
S t i = 1 S / N * S t i
Gray Relational Coefficients (GRCs):
ξ G A i = m i n G A + ζ m a x G A G A i + ζ m a x G A
ξ S t i = m i n S t + ζ m a x S t S t i + ζ m a x S t
Gray relational grade (GRG):
  G R G i = j = 1 m w j   ξ i j = w G A × ξ G A i + w s t i f f × ξ   S t i
Here, n is the total number of experimental trials in the OA, i denotes the trial index (i = 1, 2,…, n), GAi and Sti represent the GA_FEA and Stiff_FEA obtained from the ith trial, respectively, and m is the number of response parameters (m = 2 in this study).

3.6. Results and Discussion of Stage-2 Optimization

3.6.1. Effect of Control Parameters on GA and Stiffness and Regression Validation

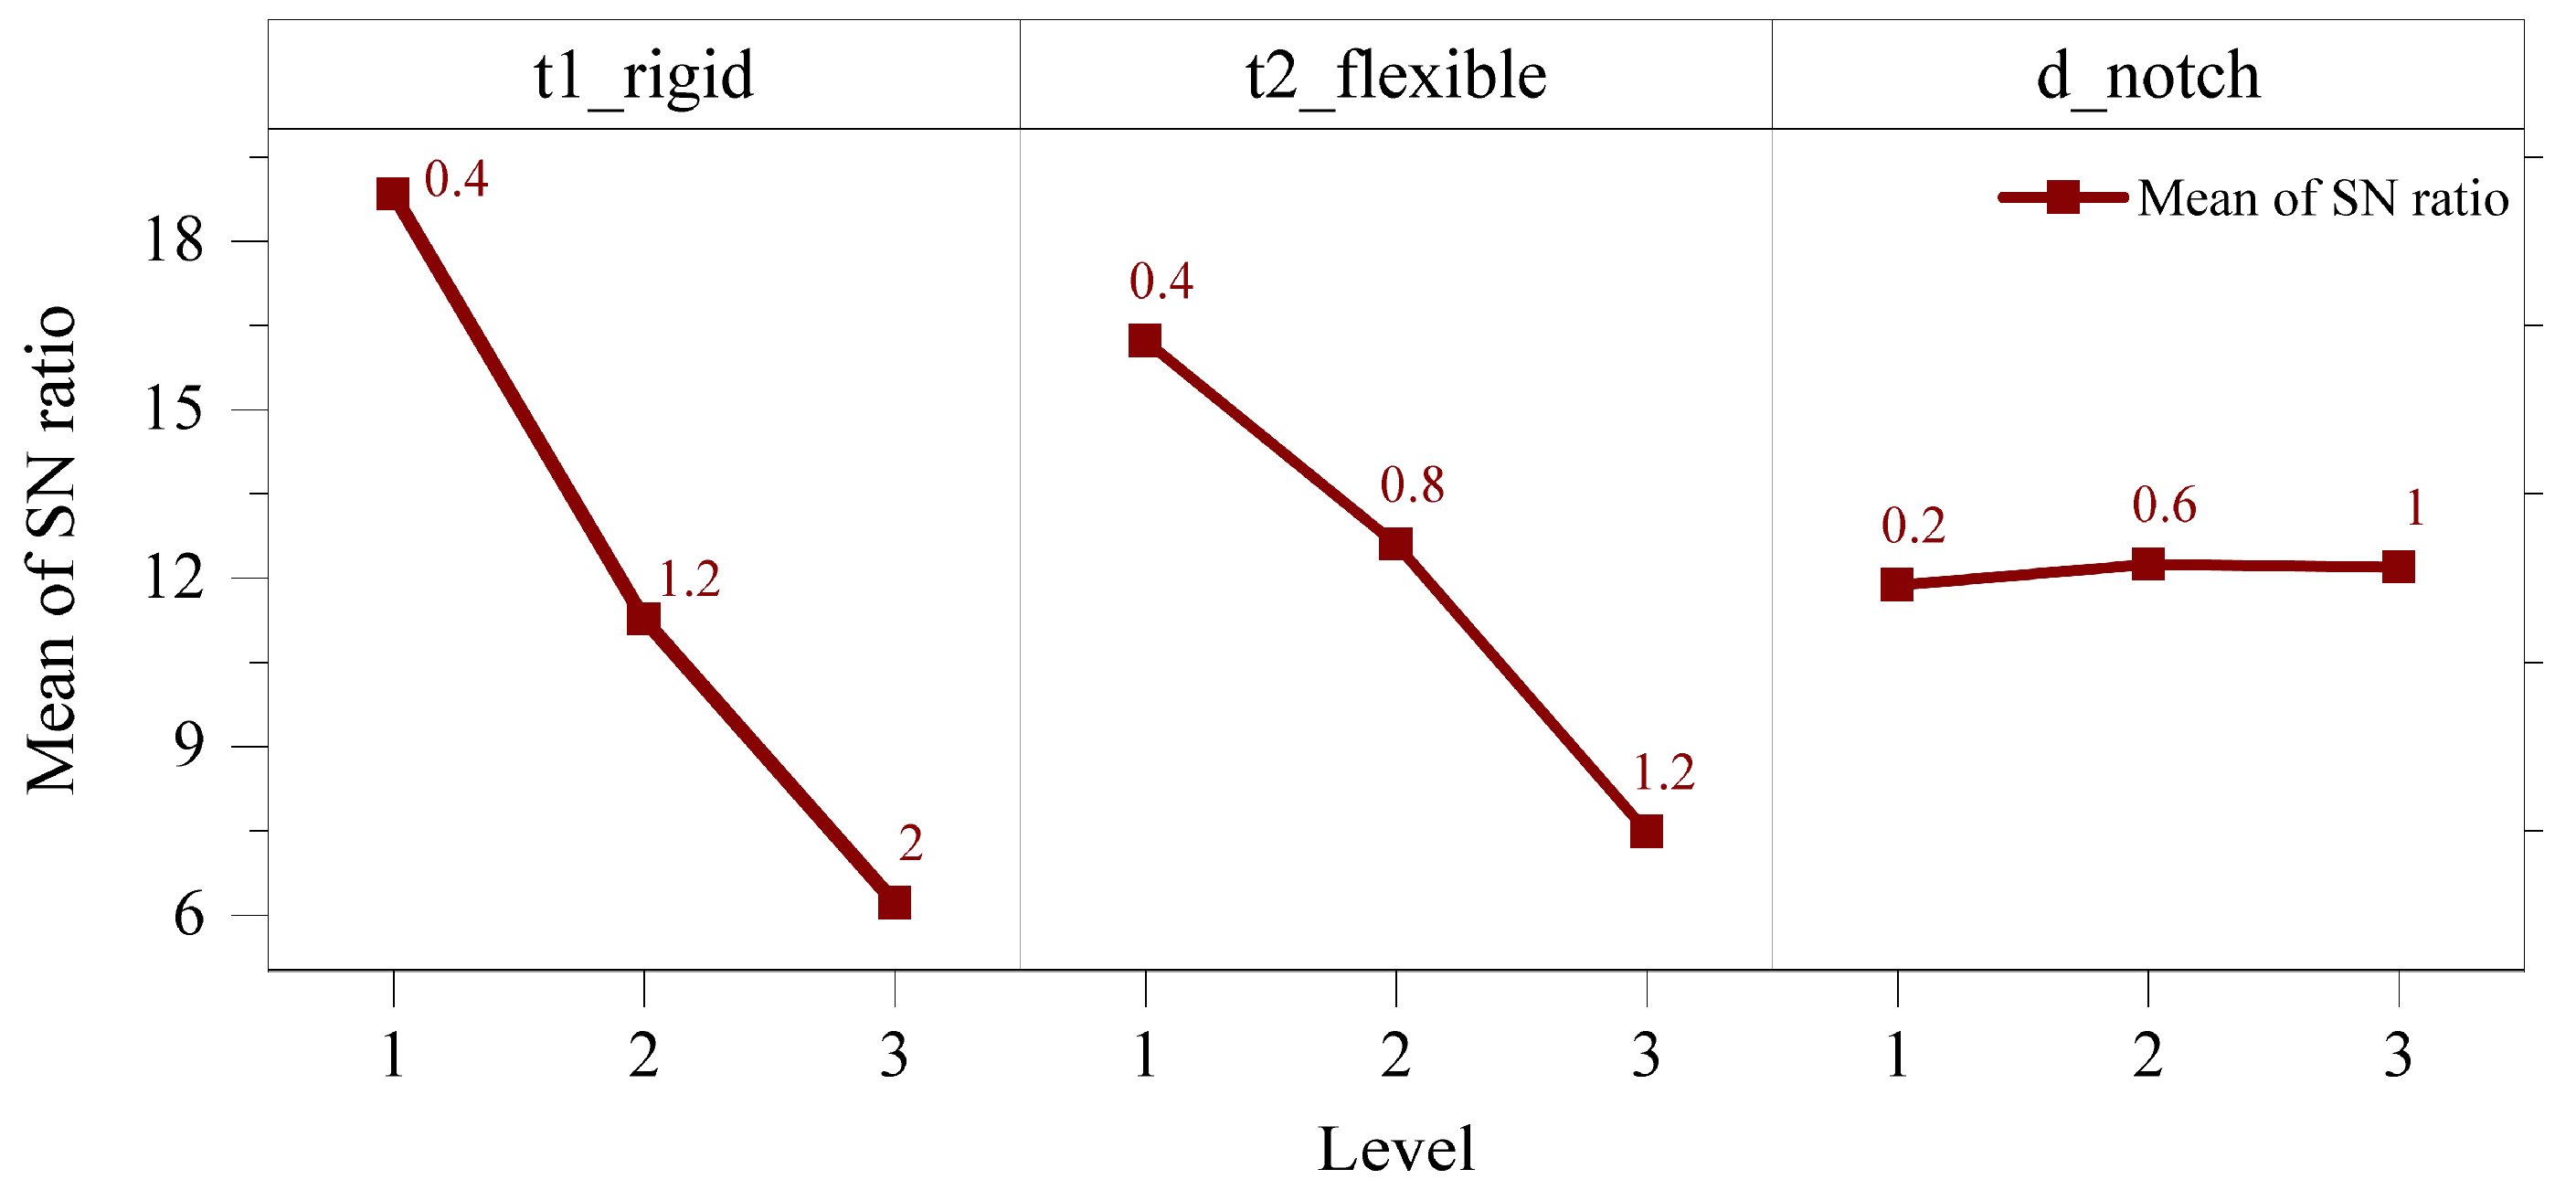
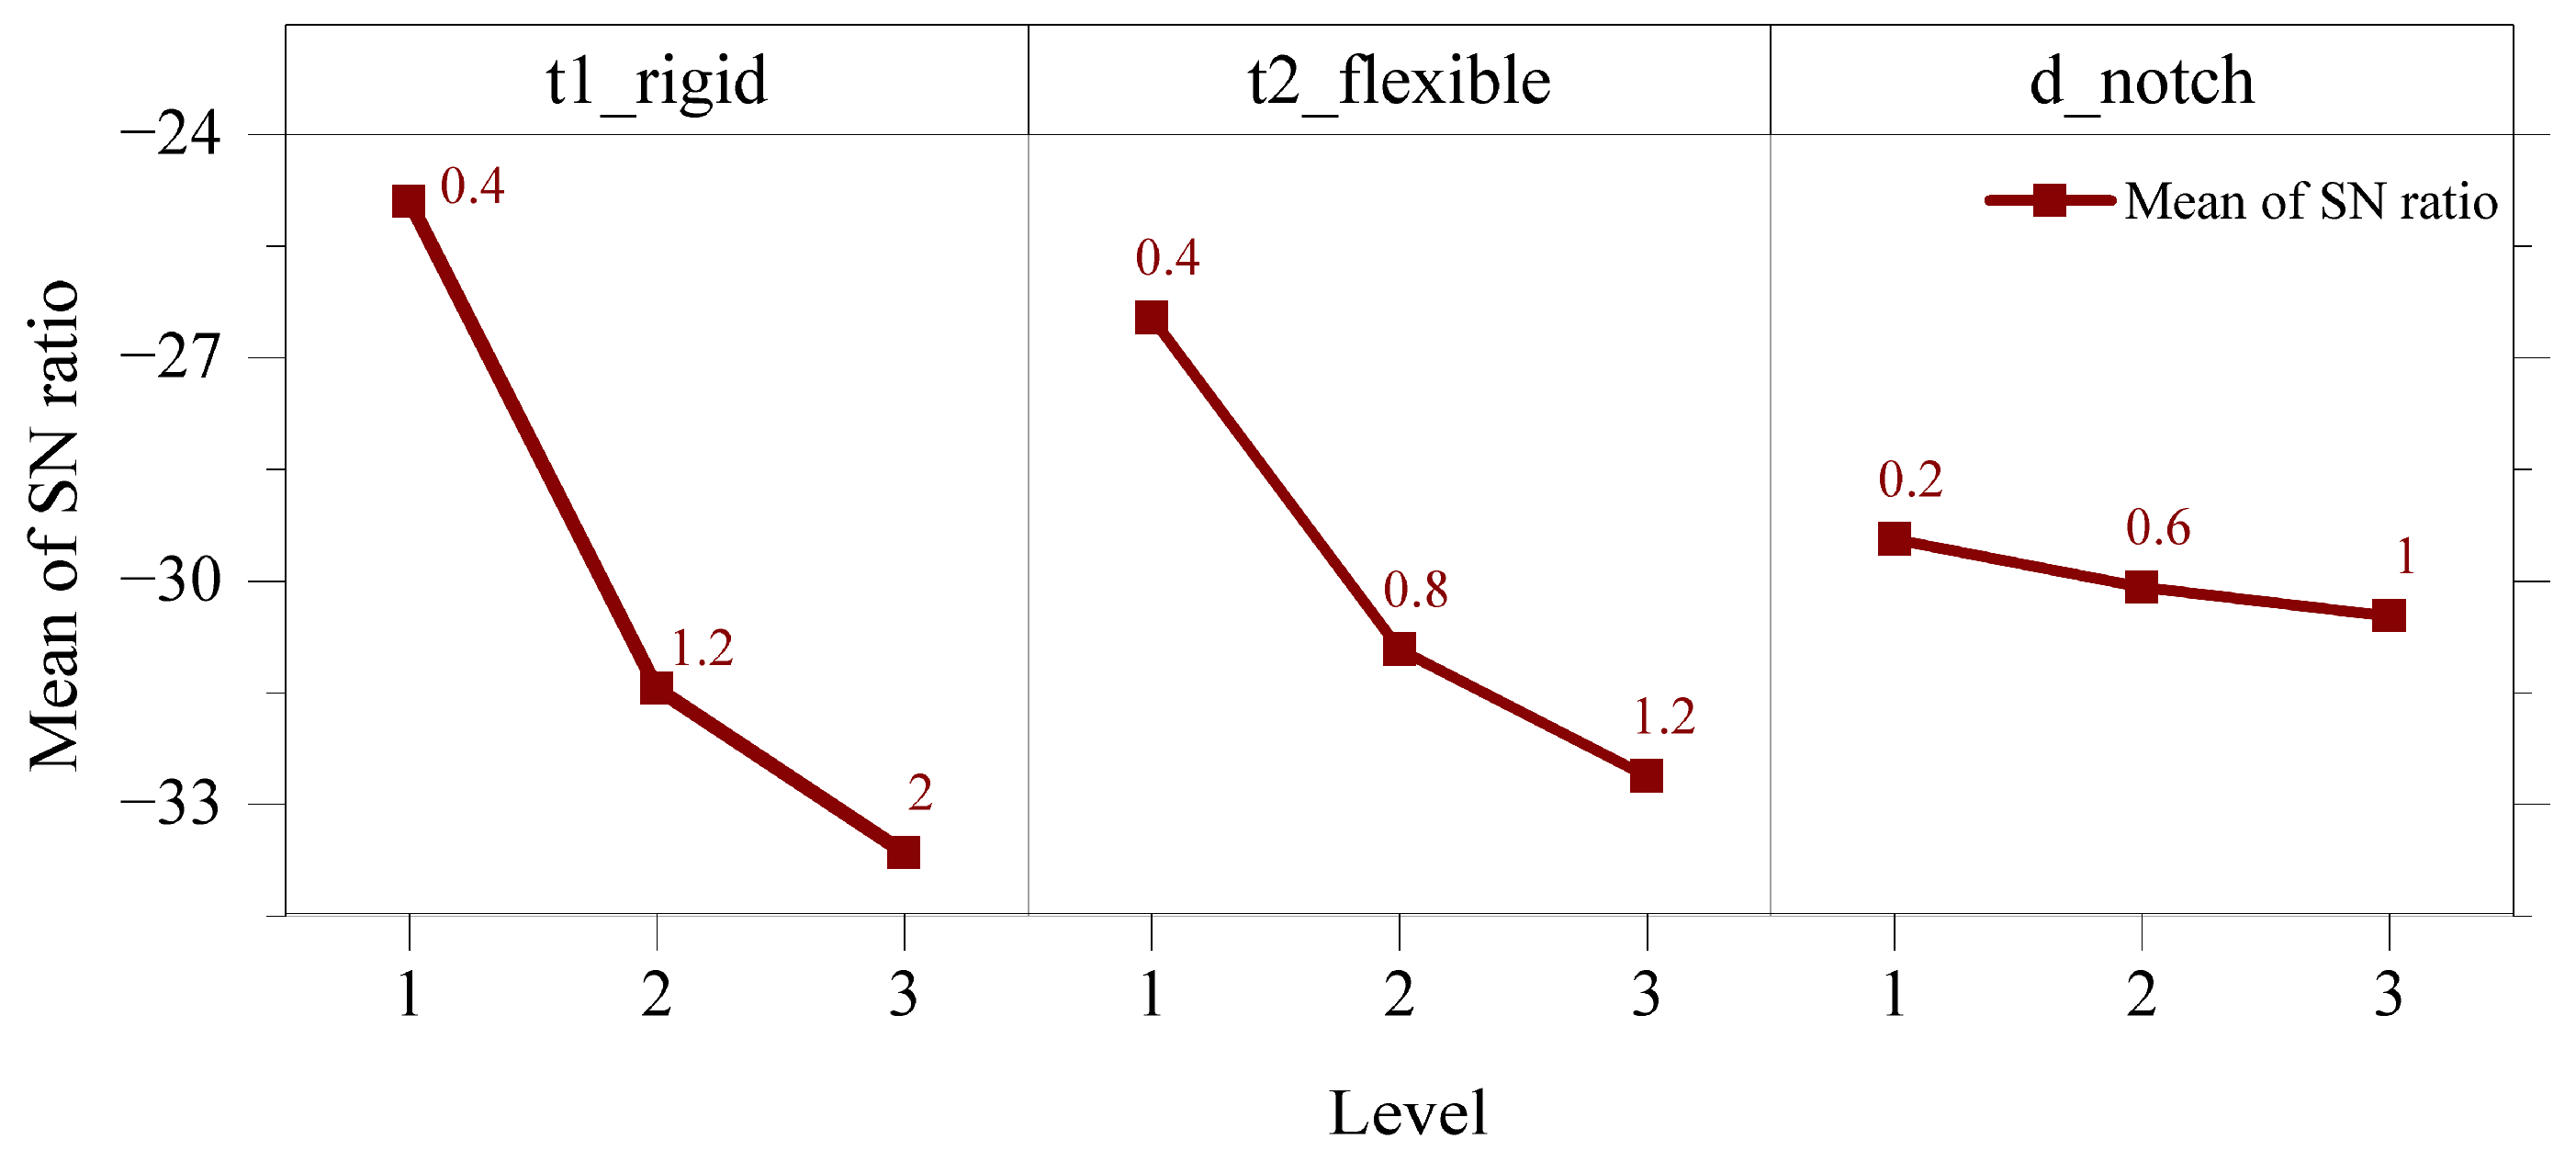
At Stage-2, S/N ratio analysis was performed to examine refined trends within the reduced design space using the L9 Taguchi orthogonal array. Figure 12 and Figure 13 present the S/N ratio plots for GA_FEA (larger-the-better) and Stiff_FEA (smaller-the-better), respectively.
For GA_FEA, the optimal parameter combination was identified as t1_rigid = 0.4 (Level 1), t2_flexible = 0.4 (Level 1), and d_notch = 0.6 (Level 2). In contrast, minimization of Stiff_FEA preferred t1_rigid = 0.4 (Level 1), t2_flexible = 0.4 (Level 1), and d_notch = 0.2 (Level 1). Table 11 summarizes the S/N analysis results, including the levels and ranks of the influencing factors.
The refined ANOVA results for GA_FEA and Stiff_FEA are presented in Table 12 and Table 13, respectively. Consistent with Stage-1 observations, t1_rigid remained the most influential parameter, contributing 65.9% to the variation in GA_FEA (p = 0.036 < 0.05) and 66.16% to Stiff_FEA (p = 0.010). The parameter t2_flexible exhibited a moderate influence, contributing 31.56% to GA_FEA and 32.31% to Stiff_FEA, whereas d_notch showed a negligible effect in both cases. The low residual error percentages confirm the adequacy of the reduced Taguchi model.
The dominance of rigid link thickness can be attributed to its dual role in SIDO-CDAM behavior. Rigid links primarily act as load-bearing members that transfer forces between flexural segments. Increasing rigid link thickness enhances stiffness by reducing elastic deformation; however, it also restricts flexural motion and alters kinematic transmission, thereby influencing displacement amplification. Consequently, t1_rigid governs the balance between structural stiffness and kinematic fidelity.
To establish predictive relationships between the control parameters and the response variables and enable validation, linear regression models were developed based on the Stage-2 experimental data and are expressed in Equations (13) and (14), respectively. A confirmation study was conducted by comparing regression-predicted responses with FEA-simulated results obtained in Fusion 360 for selected parameter combinations. The comparison is summarized in Table 14. The comparison shows close agreement for selected parameter combinations, with a root mean square error (RMSE) of 2.95, confirming the adequacy of the regression models for response prediction within the investigated design space.
GA_FEA = 18.01 − 4.63 t1_rigid − 6.74 t2_flexible − 2.46 d_notch
Stiff_FEA = −7.31 + 20.27 t1_rigid + 27.66 t2_flexible − 5.15 d_notch

3.6.2. Multi-Response Optimization Using GRA: Results

GRA, as described in Section 3.5, was employed to perform multi-response optimization by simultaneously considering GA_FEA and Stiff_FEA. This method minimizes subjective bias by converting multiple performance characteristics into a single gray relational grade (GRG). Depending on the intended MEMS application, weighting factors can be adjusted to prioritize either displacement amplification or stiffness. Because maximizing GA_FEA was prioritized in the present study, unequal weights were strategically assigned ( w G A  = 0.7 and w S t i f f  = 0.3) to explicitly reflect this objective.
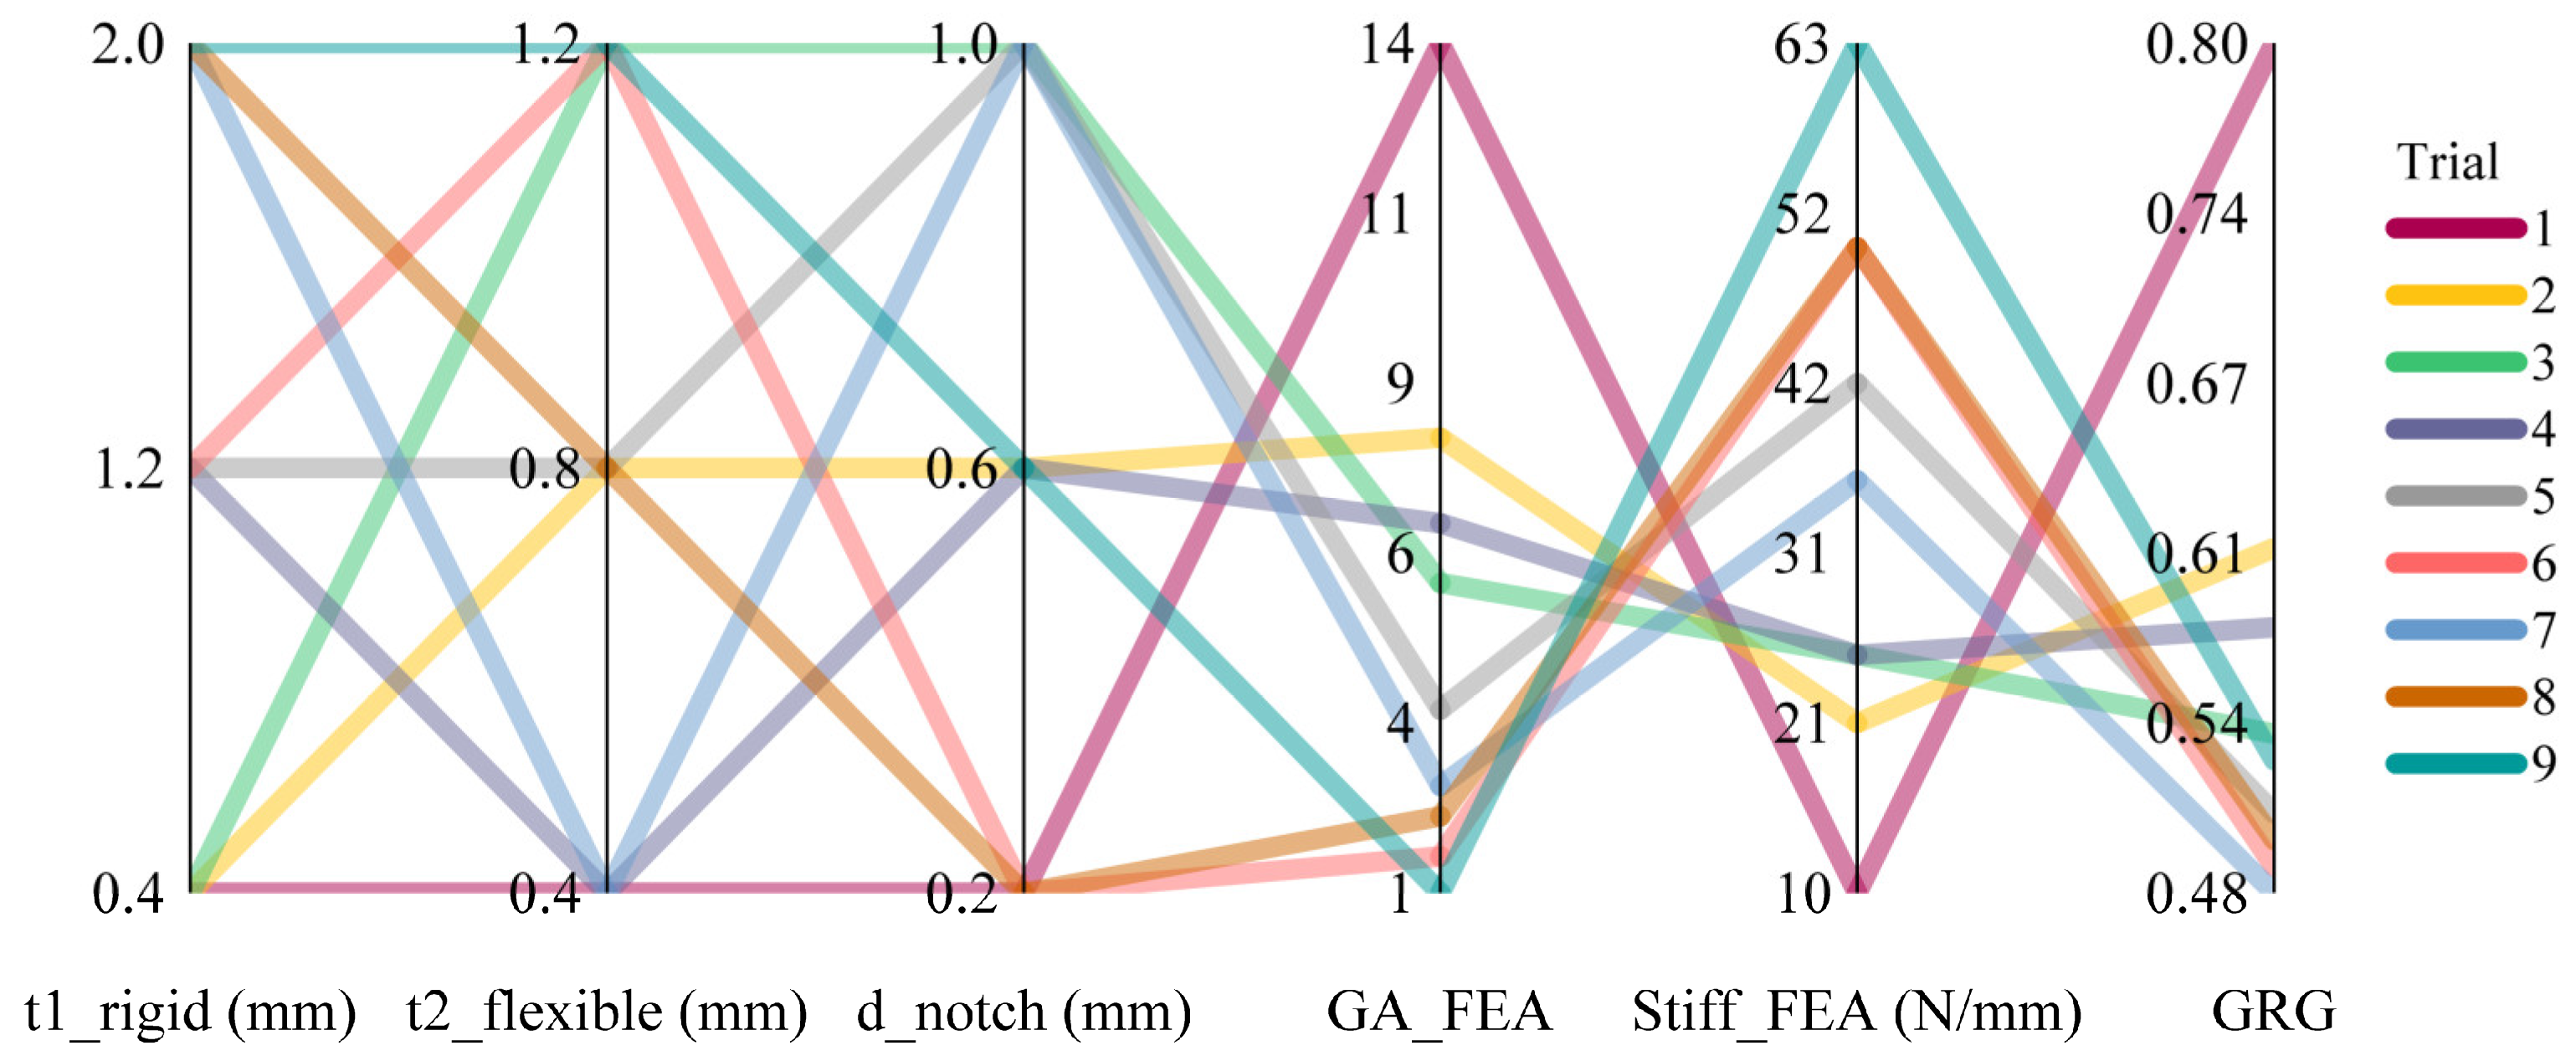
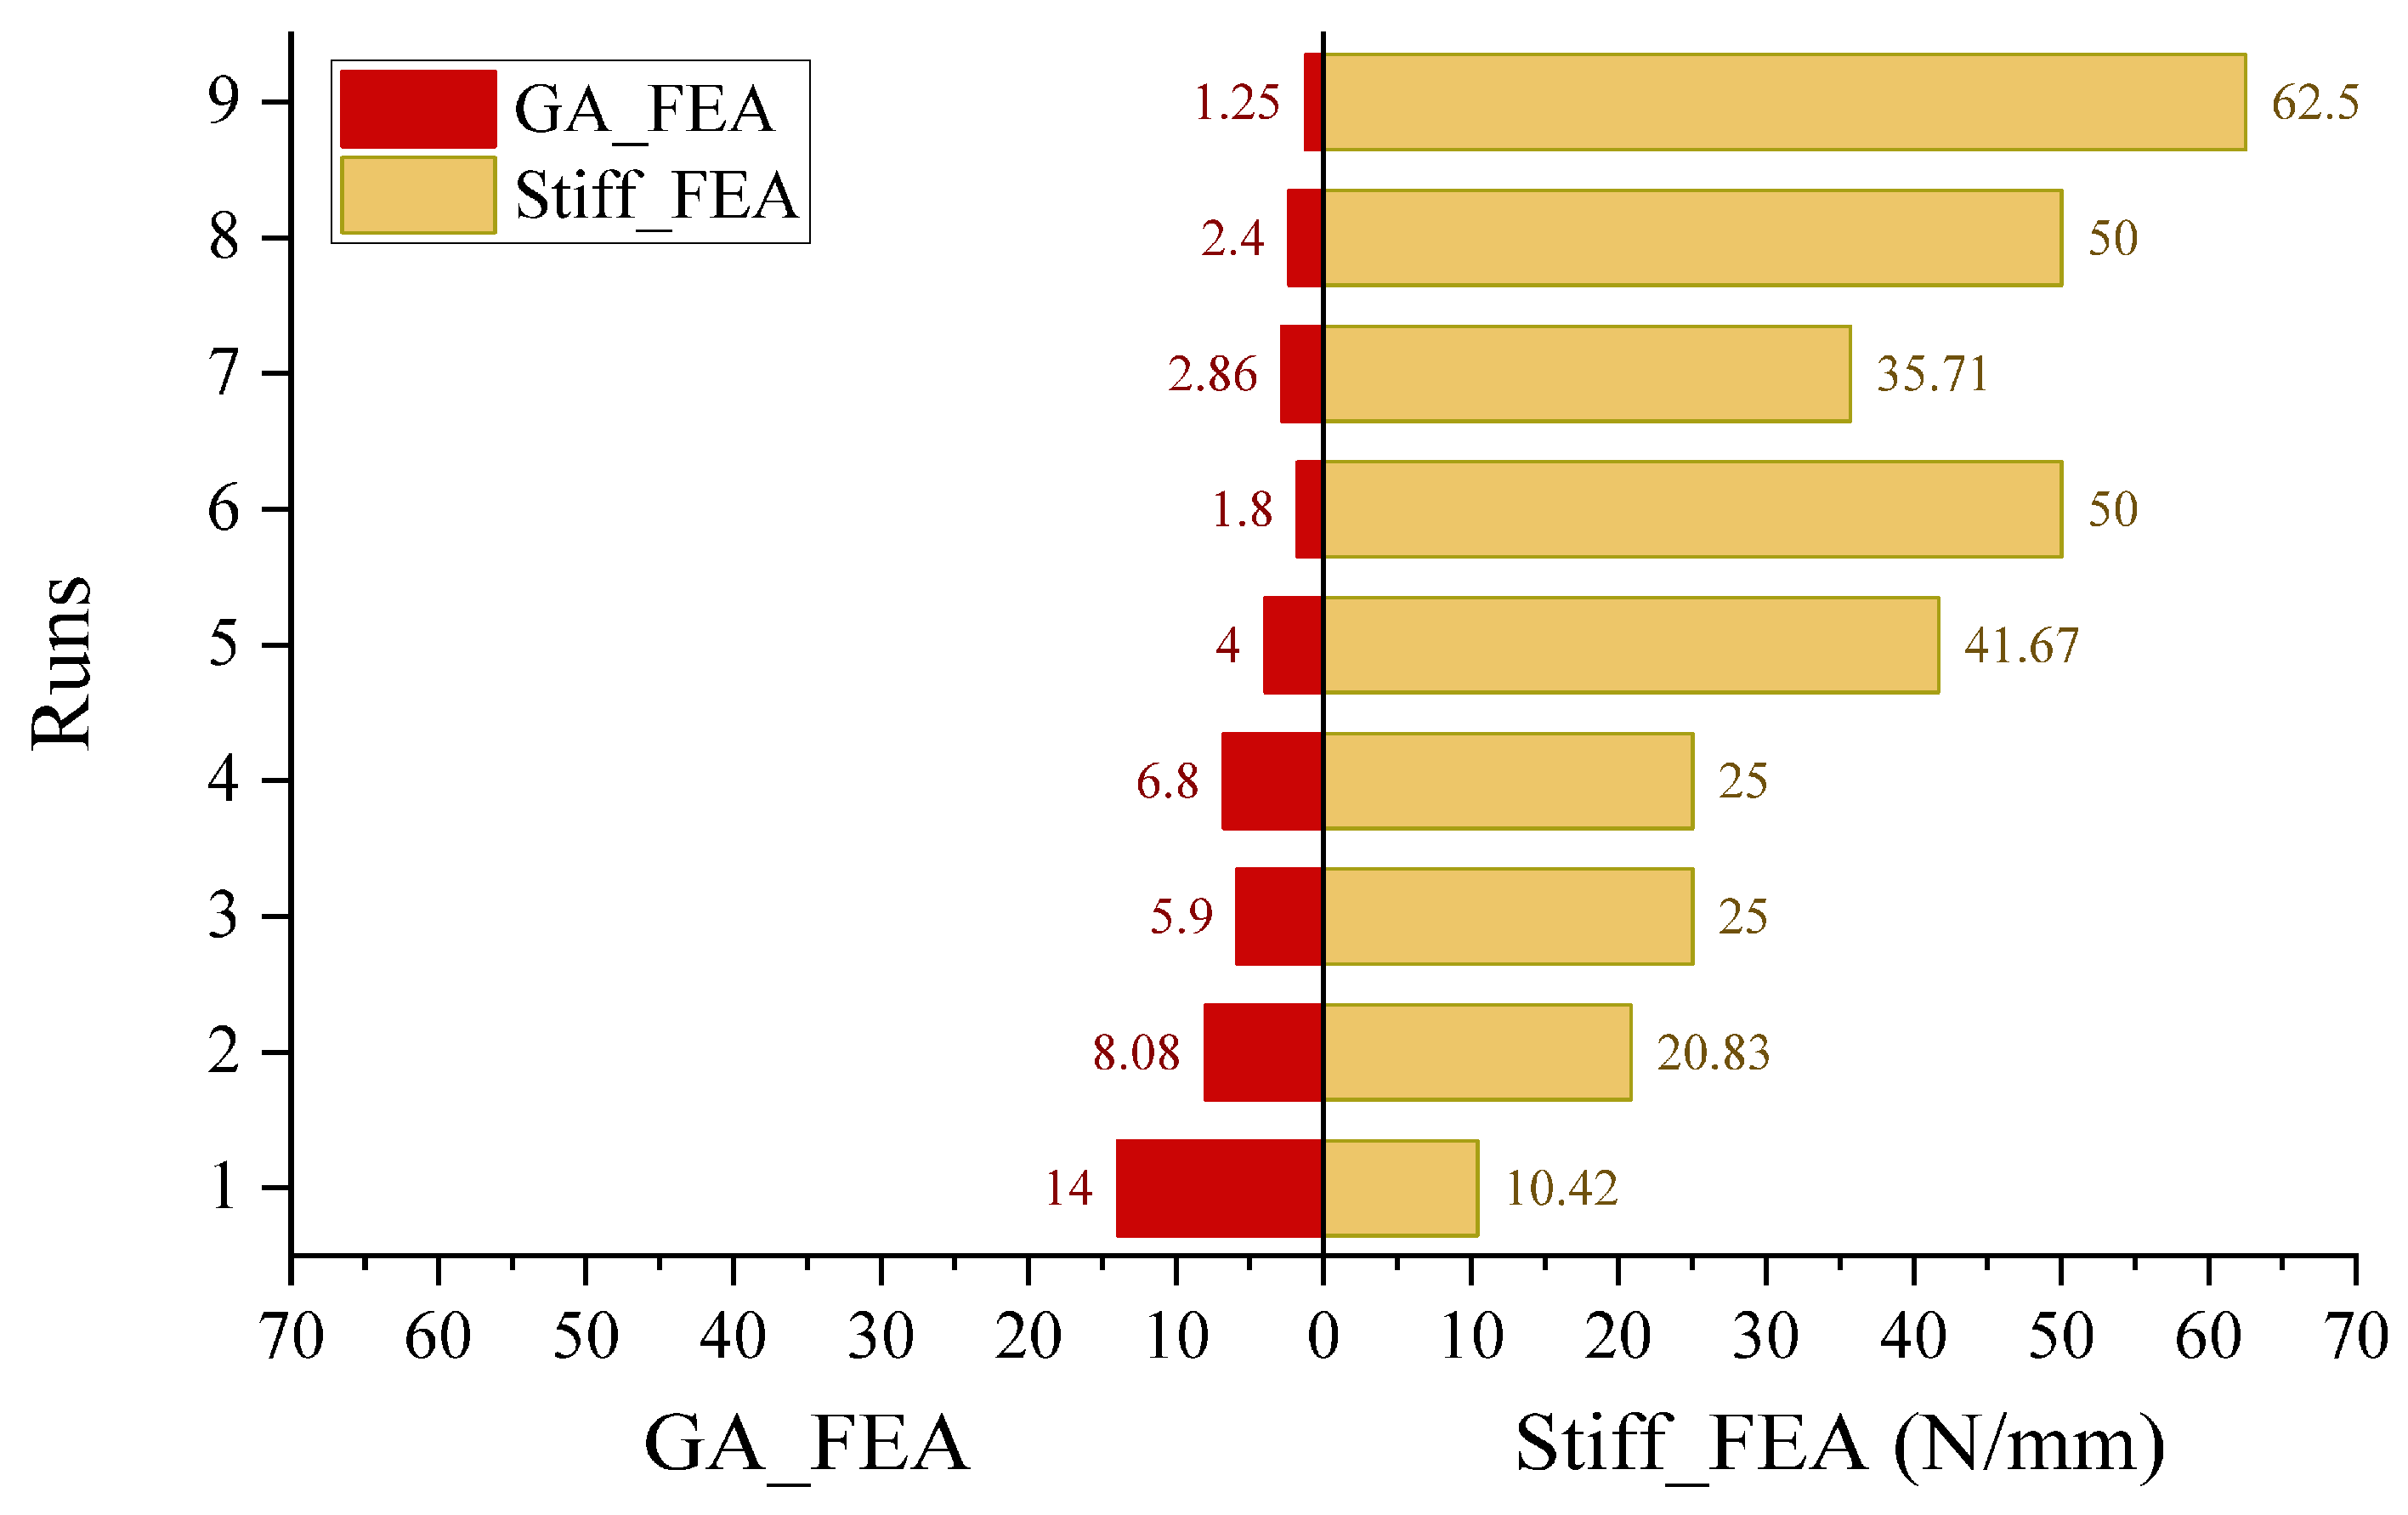
Among all Taguchi trials, Trial 1 (t1_rigid = 0.4 mm, t2_flexible = 0.4 mm, and d_notch = 0.2 mm; Level (1 1 1)) exhibited the highest GRG value, indicating the most favorable compromise between maximum GA and minimum stiffness. Hence, Trial 1 was identified as the multi-objective solution with the optimal control parameter combination (1 1 1).
Figure 14 illustrates the variation in GA_FEA and Stiff_FEA across all Taguchi trials. It clearly shows that Trial 1 achieved the highest GA_FEA while maintaining comparatively low stiffness. The parallel coordinates plot in Figure 15 provides a multidimensional visualization of the relationships between design variables and performance metrics. Higher GRG values were predominantly associated with lower rigid link thickness and lower-to-moderate flexible link thickness, validating the dominant influence of these parameters. The plot validated the effectiveness of Taguchi design in identifying optimal parameter settings that obtain the best multi-objective performance.
Furthermore, the influence of significant control parameters (t1_rigid and t2_flexible) and response parameters (GA_FEA and Stiff_FEA) on GRG is illustrated in Figures S7 and S8 of the Supporting Information. These results indicate that GRG increases with higher GA and lower stiffness and tends to be maximized at lower rigid link thickness values, which aligns with the expected mechanical behavior of compliant amplification mechanisms.

3.6.3. Confirmation Test and FEA-Based Validation

In addition to GRA, a response optimizer based on regression models with a 95% prediction interval (PI) was employed to further validate the multi-response optimization. The optimization objectives were set to maximize GA_FEA (target 14 > 10) and minimize Stiff_FEA (target 1 < 50), as shown in Figure S9 of the Supporting Information. The design variable ranges were defined as t1_rigid (0.4–2), t2_flexible (0.4–1.2), and d_notch (0.2–1).
The response optimizer predicted an optimal parameter combination of t1_rigid = 0.4 mm, t2_flexible = 0.4 mm, and d_notch = 0.2 mm, obtaining GA_FEA = 12.97 and Stiff_FEA = 10.83. The results obtained from both Gray Relation Analysis and the Minitab Regression Response Optimizer indicated that the optimal input set of Trial 1 (1 1 1) obtained desired response parameters; however, the obtained GA_FEA and Stiff_FEA slightly differ from simulated values, as the response optimizer is based on 95% PI.
The linear regression model for GRG is expressed as
GRG = 0.661 + 0.0179 t1_rigid − 0.0058 t2_flexible − 0.1429 d_notch
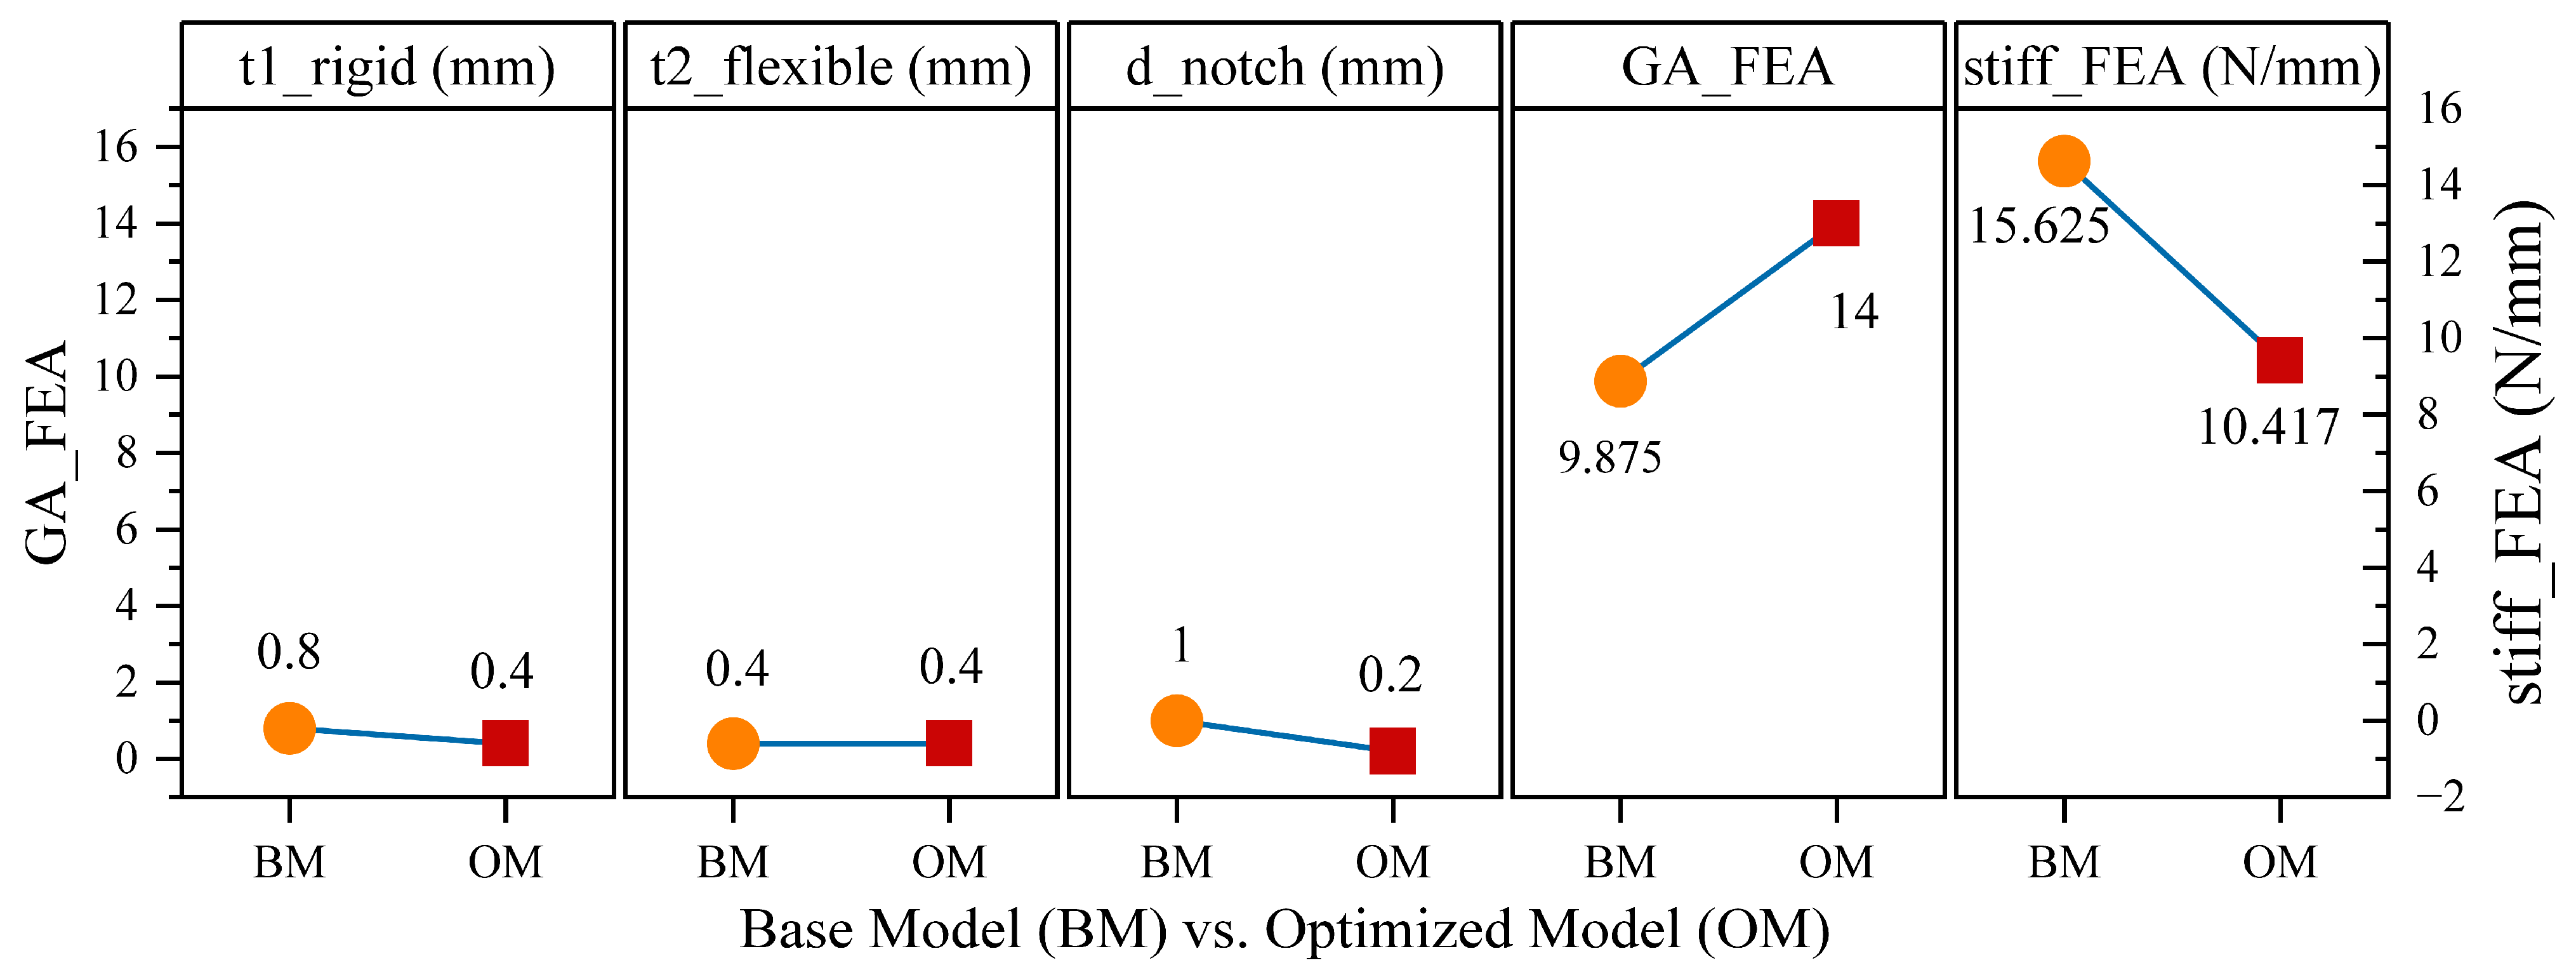
A confirmation test was conducted by comparing the optimized design with the base (non-optimized) realized SIDO-CDAM model using FEA simulations in Fusion 360. As summarized in Table 15 and illustrated in Figure 16, the optimized model demonstrates a significant performance improvement, achieving a 41.77% increase in geometrical advantage and a 33.33% reduction in stiffness relative to the base model. While the reduction in rigid link thickness increased the peak von Mises stress to 1.049 MPa (up from 0.784 MPa), this remains safely below the material yield strength of 27.50 MPa, validating the mechanism’s structural reliability.
These results confirm that the integrated Taguchi–GRA–regression optimization framework is effective in enhancing the performance of the proposed SIDO-CDAM. While the present study is based on finite element simulations, experimental validation through prototype fabrication and testing will be pursued in future work to further verify the robustness of the proposed approach.

4. Conclusions

This study presented a systematic framework for the conceptual design and post-synthesis optimization of a symmetric single-input dual-output compliant displacement amplification mechanism (SIDO-CDAM). The mechanism was first conceptually synthesized by the instantaneous center building block (IC-BB) approach. By using only compliant dyad building blocks (CDBs), a symmetric mechanism capable of generating same-direction dual outputs was successfully developed. The realized three-dimensional model, based on conceptual synthesis, confirmed the effectiveness of the IC-BB method for generating physically meaningful and practically compliant mechanisms. A two-stage post-synthesis optimization strategy, implemented directly after conceptual synthesis, enabled simultaneous improvement of geometrical advantage and stiffness within a reduced and computationally efficient design space. In Stage-1, Taguchi design of experiments- and analysis of variance (ANOVA)-based optimization identified dominant design parameters, and the moving-point location was found to have the strongest influence on amplification behavior. Its masking effect was eliminated by fixing this parameter at its optimal level. In Stage-2, multi-response optimization using Taguchi–gray relational analysis (GRA) explicitly prioritized displacement amplification over stiffness. The results confirm that rigid link thickness is the most influential parameter governing both displacement amplification and stiffness in the optimized design space, while flexible link thickness exhibits a moderate effect. Finite element simulations, regression-based prediction models, and confirmation tests demonstrated that the optimized SIDO-CDAM achieved a substantial increase in displacement amplification with a simultaneous reduction in stiffness compared to the base design. The close agreement between predicted and simulated responses confirms the robustness and reliability of the proposed optimization framework. Overall, this study presented a systematic pathway integrating IC-BB-based conceptual synthesis using CDB elements with a structured and computationally efficient post-synthesis optimization strategy for symmetric SIDO-CDAMs. The proposed framework is computationally efficient, scalable, and well-suited for the design of compliant mechanisms in MEMS, micro-actuation, and precision engineering applications. Future work will focus on experimental validation through prototype fabrication and on continuous nonlinear design space exploration. Specifically, advanced optimization techniques such as Response Surface Methodology (RSM), Kriging-based surrogate models, and multi-objective evolutionary algorithms will be implemented to further maximize the geometric advantage and kinematic precision of the compliant mechanism.

Supplementary Materials

The following supporting information can be downloaded at: https://www.mdpi.com/article/10.3390/act15050244/s1, Figure S1: Typical compliant dyad building blocks (CDBs): Definition; Table S1: The coordinates of the key points of the conceptual configuration as shown in Figure 2; Figure S2: 2D Orthogonal and 3D views of the realized SIDO-CDAM; Table S2: Effect of mesh density on GA and von Mises stress; Figure S3: Normal probability plots of residuals for Stage-1 regression models (a) for GA_FEA, (b) for stiff_FEA; Figure S4: Heat plot for Stage-1 GA_FEA vs Control parameters ; Figure S5: Heat plot for Stage-1 Stiff_FEA vs Control parameters; Figure S6: FEA Simulation trial results of the deformed and undeformed models for Stage-2; Figure S7: Stage-2 GRG vs. t1_rigid vs. t2_flexible ; Figure S8: Stage-2 GRG vs. GA_FEA vs. stiff_FEA; Figure S9: Minitab response optimizer setup for response parameters ; Figure S10: (a) Contour Plot Stage-1 GA_FEA vs. t1_rigid vs. t2_flexible, (b). Contour Plot Stage-1 stiff_FEA vs. t1_rigid vs. t2_flexible.

Author Contributions

Conceptualization, R.R.O. and R.S.; methodology, software and validation, R.R.O. and N.P.S.; writing—original draft preparation, R.R.O.; writing—review and editing, R.R.O. and S.R.; resources, S.R. and K.B.A.; supervision, N.P.S. and P.G.D.; project administration, funding acquisition, and review and editing, K.B.A. All authors have read and agreed to the published version of the manuscript.

Funding

The authors extend their appreciation to the Deanship of Research and Graduate Studies at King Khalid University for funding this work through the Large Research Project under grant number (RGP. 2/236/46).

Institutional Review Board Statement

Not applicable.

Informed Consent Statement

Not applicable.

Data Availability Statement

The original contributions presented in this study are included in the article. Further inquiries can be directed to the corresponding author.

Conflicts of Interest

The authors declare no conflicts of interest.

Abbreviations

The following abbreviations are used in this manuscript:
CDAM Compliant Displacement Amplification Mechanism
MEMS Micro-Electro-Mechanical System
SISO Single-Input Single-Output
SIMO Single-Input Multiple-Output
MISO Multiple-Input Single-Output
MIMO Multiple-Input Multiple-Output
PRBM Pseudo-Rigid Body Model
IC-BB Instantaneous Center and Building Block
t1_rigid Thickness of Rigid Link
t2_flexible Thickness of Flexible Link
mp_location Moving-Point Location
d_notch Diameter of Notch
FEM Finite Element Method
GA Geometrical Advantage
FEA Finite Element Analysis
GA_FEA Geometrical Advantage from Finite Element Analysis
Stiff_FEA Stiffness from Finite Element Analysis
DOE Design of Experiments
DOF Degree of Freedom
OA Orthogonal Array
S/N ratio Signal-to-Noise Ratio
ANOVA Analysis of Variance
GRA Gray Relational Analysis

References

  1. Lobontiu, N. Compliant Mechanisms, 2nd ed.; CRC Press: Boca Raton, FL, USA, 2021; ISBN 9780429184666. [Google Scholar]
  2. Madou, M.J. Fundamentals of Microfabrication and Nanotechnology, Three-Volume Set, 3rd ed.; CRC Press: Boca Raton, FL, USA, 2018; Volume III, ISBN 9781482274660. [Google Scholar]
  3. Wu, Z.; Xu, Q. Survey on Recent Designs of Compliant Micro-/Nano-Positioning Stages. Actuators 2018, 7, 5. [Google Scholar] [CrossRef] [Scilit]
  4. Zhou, X.; Wu, S.; Wang, X.; Wang, Z.; Zhu, Q.; Sun, J.; Huang, P.; Wang, X.; Huang, W.; Lu, Q. Review on Piezoelectric Actuators: Materials, Classifications, Applications, and Recent Trends. Front. Mech. Eng. 2024, 19, 6. [Google Scholar] [CrossRef] [Scilit]
  5. Zupan, M.; Ashby, M.F.; Fleck, N.A. Actuator Classification and Selection—The Development of a Database. Adv. Eng. Mater. 2002, 4, 933–940. [Google Scholar] [CrossRef] [Scilit]
  6. Chattaraj, N.; Ananthasuresh, G.K.; Ganguli, R. Design of a Distributed Compliant Mechanism Using Spring-Lever Model and Topology Optimization for Piezoelectrically Actuated Flapping Wings. Mech. Adv. Mater. Struct. 2021, 28, 118–126. [Google Scholar] [CrossRef] [Scilit]
  7. Ding, Y.; Lai, L.-J. Design and Analysis of a Displacement Amplifier with High Load Capacity by Combining Bridge-Type and Scott-Russell Mechanisms. Rev. Sci. Instrum. 2019, 90, 065102. [Google Scholar] [CrossRef] [Scilit]
  8. Qi, K.; Xiang, Y.; Fang, C.; Zhang, Y.; Yu, C. Analysis of the Displacement Amplification Ratio of Bridge-Type Mechanism. Mech. Mach. Theory 2015, 87, 45–56. [Google Scholar] [CrossRef] [Scilit]
  9. Iqbal, S.; Malik, A. A Review on MEMS Based Micro Displacement Amplification Mechanisms. Sens. Actuators A Phys. 2019, 300, 111666. [Google Scholar] [CrossRef] [Scilit]
  10. Tian, Y.; Ma, Y.; Wang, F.; Lu, K.; Zhang, D. A Novel XYZ Micro/Nano Positioner with an Amplifier Based on L-Shape Levers and Half-Bridge Structure. Sens. Actuators A Phys. 2020, 302, 111777. [Google Scholar] [CrossRef] [Scilit]
  11. Chen, F.; Zhang, Q.; Gao, Y.; Dong, W. A Review on the Flexure-Based Displacement Amplification Mechanisms. IEEE Access 2020, 8, 205919–205937. [Google Scholar] [CrossRef] [Scilit]
  12. Kim, C.J.; Moon, Y.-M.; Kota, S. A Building Block Approach to the Conceptual Synthesis of Compliant Mechanisms Utilizing Compliance and Stiffness Ellipsoids. J. Mech. Des. 2008, 130, 022308. [Google Scholar] [CrossRef] [Scilit]
  13. Kim, C.J.; Kota, S.; Moon, Y.M. An Instant Center Approach toward the Conceptual Design of Compliant Mechanisms. J. Mech. Des. 2006, 128, 542–550. [Google Scholar] [CrossRef] [Scilit]
  14. Chu, L.L.; Hetrick, J.A.; Gianchandani, Y.B. High Amplication Compliant Microtransmissions for Rectilinear Electrothermal Actuators. Sens. Actuators A Phys. 2002, 98, 776–783. [Google Scholar] [CrossRef] [Scilit]
  15. Schmitt, P.; Hoffmann, M. Engineering a Compliant Mechanical Amplifier for MEMS Sensor Applications. J. Microelectromech. Syst. 2020, 29, 214–227. [Google Scholar] [CrossRef] [Scilit]
  16. Chang, P.-L.; Chi, I.-T.; Tran, N.D.K.; Wang, D.-A. Design and Modeling of a Compliant Gripper with Parallel Movement of Jaws. Mech. Mach. Theory 2020, 152, 103942. [Google Scholar] [CrossRef] [Scilit]
  17. Chen, F.; Zhang, Q.; Gao, Y.; Dong, W. Design and Analysis of a Compact Piezo-Actuated Microgripper with a Large Amplification Ratio. J. Mech. Des. 2022, 144, 054503. [Google Scholar] [CrossRef] [Scilit]
  18. Dinesh, M.; Ananthasuresh, G.K. Micro-Mechanical Stages with Enhanced Range. Int. J. Adv. Eng. Sci. Appl. Math. 2010, 2, 35–43. [Google Scholar] [CrossRef] [Scilit]
  19. Yao, Q.; Dong, J.; Ferreira, P.M. Design, Analysis, Fabrication and Testing of a Parallel-Kinematic Micropositioning XY Stage. Int. J. Mach. Tools Manuf. 2007, 47, 946–961. [Google Scholar] [CrossRef] [Scilit]
  20. Ling, J.; Ye, T.; Feng, Z.; Zhu, Y.; Li, Y.; Xiao, X. A Survey on Synthesis of Compliant Constant Force/Torque Mechanisms. Mech. Mach. Theory 2022, 176, 104970. [Google Scholar] [CrossRef] [Scilit]
  21. Deng, J.; Liu, Y.; Lu, F.; Wang, W.; Liu, Y. Development of a Rotary Piezoelectric Platform with Smooth Displacement Output Based on Tripod Cooperation Force Adjustment Mechanism. Smart Mater. Struct. 2025, 34, 025044. [Google Scholar] [CrossRef] [Scilit]
  22. Das, T.K.; Shirinzadeh, B. Design, Computational Analysis and Experimental Study of a High Amplification Piezoelectric Actuated Microgripper. Eng. Res. Express 2024, 6, 035509. [Google Scholar] [CrossRef] [Scilit]
  23. Schmitt, P.; Hoffmann, M. A Force-Compensated Compliant MEMS-Amplifier with Electrostatic Anti-Springs. Microsyst. Nanoeng. 2023, 9, 83. [Google Scholar] [CrossRef] [Scilit] [PubMed]
  24. Zhu, B.; Zhang, X.; Zhang, H.; Liang, J.; Zang, H.; Li, H.; Wang, R. Design of Compliant Mechanisms Using Continuum Topology Optimization: A Review. Mech. Mach. Theory 2020, 143, 103622. [Google Scholar] [CrossRef] [Scilit]
  25. Kota, S.; Joo, J.; Li, Z.; Rodgers, S.M.; Sniegowski, J. Design of Compliant Mechanisms: Applications to MEMS. Analog Integr. Circuits Signal Process. 2001, 29, 7–15. [Google Scholar] [CrossRef] [Scilit]
  26. Jia, G.; Huang, H.; Li, B.; Wu, Y.; Cao, Q.; Guo, H. Synthesis of a Novel Type of Metamorphic Mechanism Module for Large Scale Deployable Grasping Manipulators. Mech. Mach. Theory 2018, 128, 544–559. [Google Scholar] [CrossRef] [Scilit]
  27. Dao, T.-P.; Huang, S.-C. Optimization of a Two Degrees of Freedom Compliant Mechanism Using Taguchi Method-Based Grey Relational Analysis. Microsyst. Technol. 2017, 23, 4815–4830. [Google Scholar] [CrossRef] [Scilit]
  28. Huynh, N.-T.; Huang, S.-C.; Dao, T.-P. Optimal Displacement Amplification Ratio of Bridge-Type Compliant Mechanism Flexure Hinge Using the Taguchi Method with Grey Relational Analysis. Microsyst. Technol. 2021, 27, 1251–1265. [Google Scholar] [CrossRef] [Scilit]
  29. Wang, C.; Wu, X.; Sadeghpour, S.; Shojaeian, M.; Wang, L.; Madeira, B.P.; Guan, Y.; Liu, H.; Wang, Y.; Zhang, P.; et al. A MEMS Electro-Mechanical Co-Optimization Platform Featuring Freeform Geometry Optimization Based on a Genetic Algorithm. Microsyst. Nanoeng. 2025, 11, 64. [Google Scholar] [CrossRef] [Scilit]
  30. Huynh, N.T.; Nguyen, M.H.; Dinh, L.C.K. Design Optimization of a Novel Symmetrical Differential Lever Displacement Magnification Compliant Mechanism. Res. Sq. 2023. [Google Scholar] [CrossRef] [Scilit]
  31. Song, H.; Chen, X.; Zhang, S.; Xu, L. Multi-Objective Optimization Design of 6-UPS Parallel Mechanism Based on Taguchi Method and Entropy-Weighted Gray Relational Analysis. Appl. Sci. 2022, 12, 5836. [Google Scholar] [CrossRef] [Scilit]
  32. Canbolat, A.S.; Bademlioglu, A.H.; Arslanoglu, N.; Kaynakli, O. Performance Optimization of Absorption Refrigeration Systems Using Taguchi, ANOVA and Grey Relational Analysis Methods. J. Clean. Prod. 2019, 229, 874–885. [Google Scholar] [CrossRef] [Scilit]
  33. Omoniyi, P.; Acharya, U.; Akinlabi, S.; Jen, T.-C.; Akinlabi, E. Taguchi-Grey Relational Analysis Driven Multi-Objective Optimization of Weld Bead Geometry and Hardness in Laser Welded Ti6Al4V Alloy. Int. J. Interact. Des. Manuf. 2025, 19, 423–434. [Google Scholar] [CrossRef] [Scilit]
  34. Abdelhady, S.S.; Elbadawi, R.E.; Zoalfakar, S.H. Multi-Objective Optimization of FSW Variables on Joint Properties of AA5754 Aluminum Alloy Using Taguchi Approach and Grey Relational Analysis. Int. J. Adv. Manuf. Technol. 2024, 130, 4235–4250. [Google Scholar] [CrossRef] [Scilit]
  35. Patel, K.; Acharya, S.; Acharya, G.D. Taguchi Grey Relational Analysis for Multi-Objective FDM Parameter Optimization of PLA Components. J. Kejuruter. 2024, 36, 1155–1165. [Google Scholar] [CrossRef] [Scilit] [PubMed]
  36. Flashforge. How 3D Printer Nozzle Size Affects Your Prints. Available online: https://www.flashforge.com/blogs/news/how-3d-printer-nozzle-size-affects-your-prints (accessed on 25 March 2026).
  37. Physik Instrumente (PI). Bender Piezoelectric Actuators Datasheet (PL140). Available online: https://www.piceramic.com/en/products/piezoceramic-actuators/bender-actuators/pl112-pl140-picma-bender-103000#specification (accessed on 25 March 2026).
  38. Kumar Rai, R.; Rekha Sahoo, R. Taguchi-Grey Method Optimization of VCR Engine Performance and Heat Losses by Using Shorea Robusta Biodiesel Fuel. Fuel 2020, 281, 118399. [Google Scholar] [CrossRef] [Scilit]
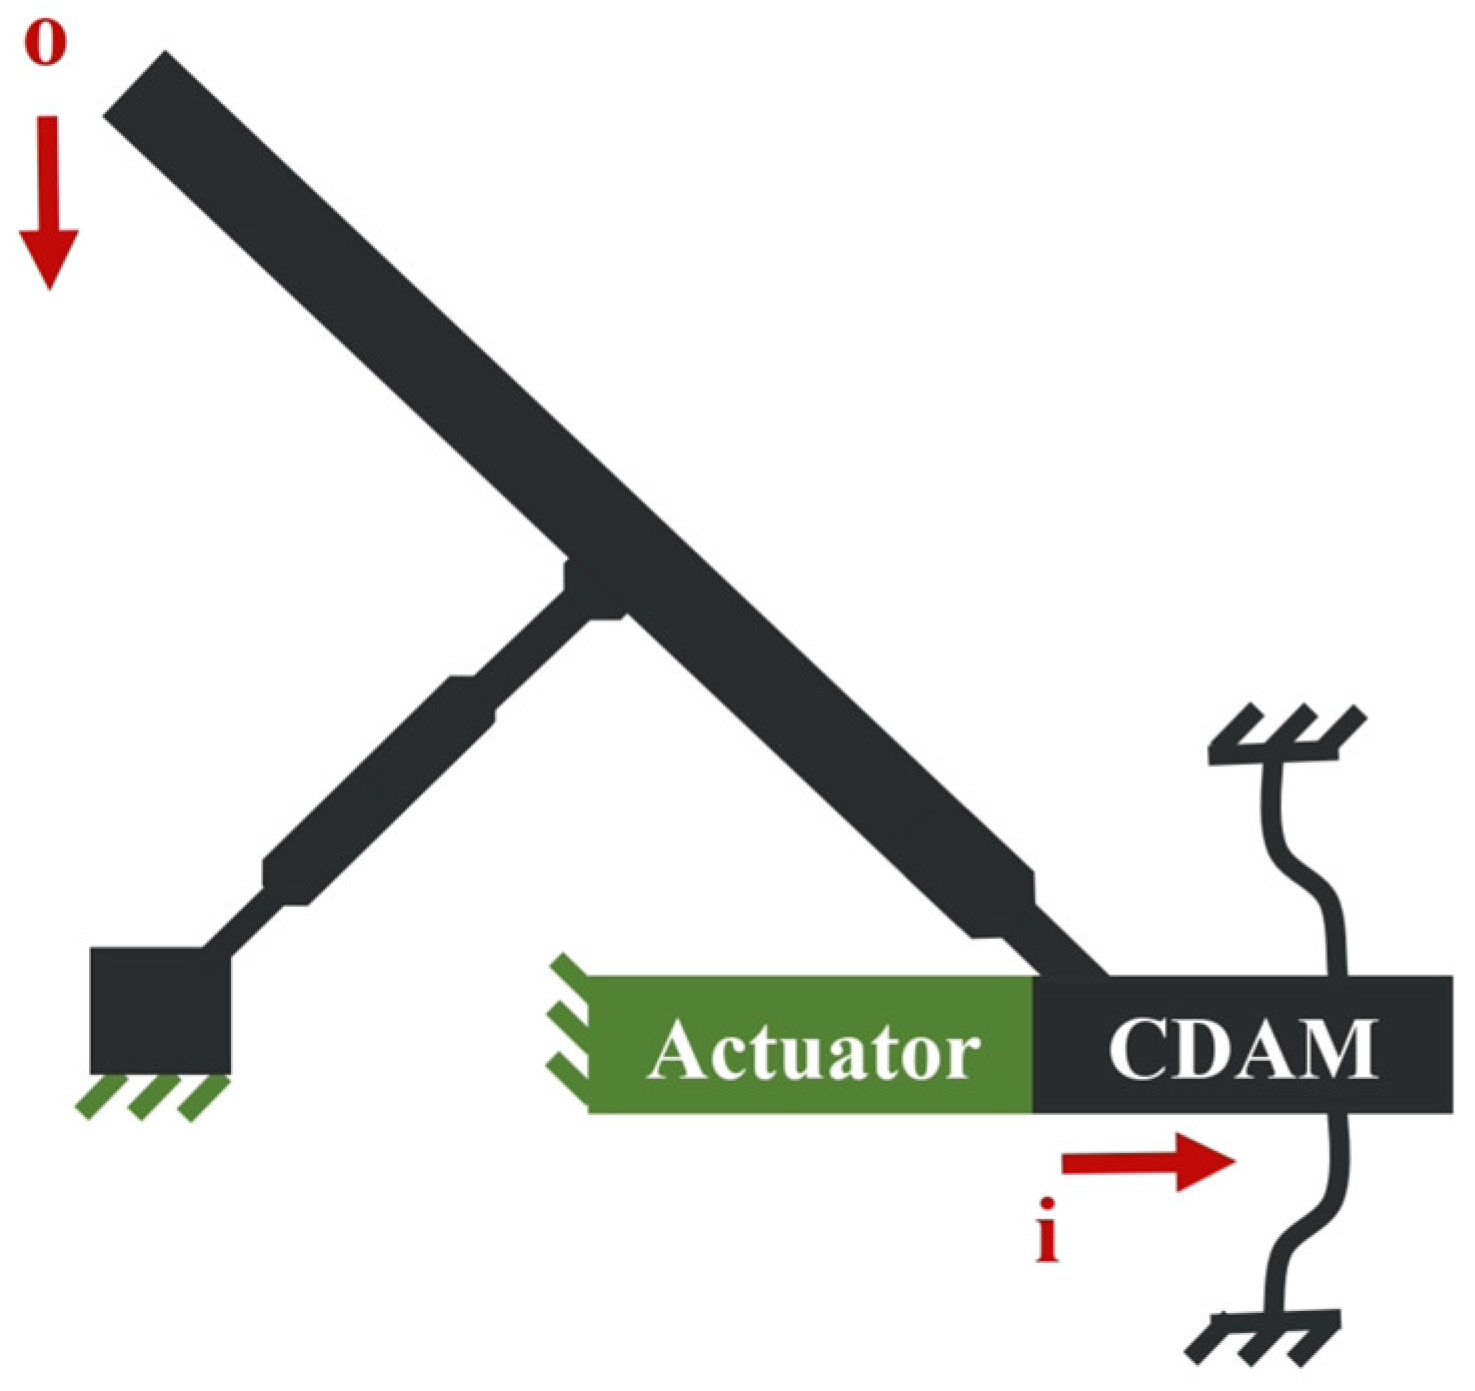
Figure 1. Compliant displacement amplification mechanism: Definition.
Actuators 15 00244 g001
Figure 2. Synthesis of symmetric SIDO-CDAMs. (a) Spatial domain; (b) conceptual mechanism.
Actuators 15 00244 g002
Figure 3. Realized SIDO-CDAM showing CAD geometry and design parameters.
Actuators 15 00244 g003
Figure 4. FEA model of realized SIDO-CDAM with mesh, boundary conditions, and displacement.
Actuators 15 00244 g004
Figure 5. Mesh convergence of GA and maximum von Mises stress.
Actuators 15 00244 g005
Figure 6. A two-stage Taguchi–GRA optimization methodology.
Actuators 15 00244 g006
Figure 7. S/N ratio plot for Stage-1 showing effect of control parameters on GA_FEA (larger-the-better).
Actuators 15 00244 g007
Figure 8. S/N ratio plot for Stage-1 showing effect of control parameters on Stiff_FEA (smaller-the-better).
Actuators 15 00244 g008
Figure 9. Effect of t1_rigid and mp_location on GA at Stage-1.
Actuators 15 00244 g009
Figure 10. Effect of t1_rigid and mp_location on stiffness at Stage-1.
Actuators 15 00244 g010
Figure 11. Surface plots at Stage-1: (a) geometrical advantage vs. t1_rigid and t2_flexible; (b) stiffness vs. t1_rigid and t2_flexible.
Actuators 15 00244 g011
Figure 12. S/N ratio curve showing the effect of control factors on GA_FEA at Stage-2 (larger-the-better).
Actuators 15 00244 g012
Figure 13. S/N ratio curve showing effect of control factors on Stiff_FEA at Stage-2 (smaller-the-better).
Actuators 15 00244 g013
Figure 14. Response parameters (GA_FEA vs. Stiff_FEA) vs. Taguchi trials plot for L9.
Actuators 15 00244 g014
Figure 15. GRG parallel coordinate plot with design and response parameters for Stage-2.
Actuators 15 00244 g015
Figure 16. Comparison of response parameters of the optimized and base models.
Actuators 15 00244 g016
Table 1. Taguchi DoE parameters with their levels for Stage-1 optimization of SIDO-CDAM.
Control
Parameters
UnitsLevels
12345
t1_rigid mm 0.4 0.8 1.2 1.6 2.0
t2_flexible mm 0.4 0.6 0.8 1.0 1.2
mp_location (mm, mm) (30, 19) (30, 21) (31, 20) (32, 19) (32, 21)
d_notch mm 0.2 0.4 0.6 0.8 1.0
Response Parameters
GA_FEA - GA_FEA = Output Displacement/Input Displacement
Stiff_FEA N/mm Stiff_FEA = Input Force/Input Displacement
Table 2. Stage-1 Taguchi DoE L25 design matrix with simulated results.
TrialsCombination of Control ParametersSimulated ResultsResponses
t1_Rigidt2_Flexiblemp_Locationd_NotchInput
Displacement
Output
Displacement
GA_FEAStiff_FEA
(mm)(mm)(mm, mm)(mm)(mm)(mm)-(N/mm)
1 0.8 0.4 (31,20) 1.0 0.016 0.158 9.8750 15.6250
2 0.8 0.6 (32,21) 0.8 0.020 0.127 6.3500 12.5000
3 0.8 0.8 (30,21) 0.6 0.008 0.004 0.5000 31.2500
4 0.8 1.0 (30,19) 0.4 0.007 0.004 0.5714 35.7143
5 0.8 1.2 (32,19) 0.2 0.009 0.022 2.4444 27.7778
6 0.4 0.4 (32,21) 0.6 0.064 0.592 9.2500 3.9063
7 0.4 0.6 (30,21) 0.4 0.011 0.008 0.7273 22.7273
8 0.4 0.8 (30,19) 0.2 0.010 0.008 0.8000 25.0000
9 0.4 1.0 (32,19) 1.0 0.020 0.121 6.0500 12.5000
10 0.4 1.2 (31,20) 0.8 0.011 0.051 4.6364 22.7273
11 1.2 0.4 (30,21) 0.2 0.009 0.005 0.5556 27.7778
12 1.2 0.6 (30,19) 1.0 0.008 0.004 0.5000 31.2500
13 1.2 0.8 (32,19) 0.8 0.011 0.048 4.3636 22.7273
14 1.2 1.0 (31,20) 0.6 0.007 0.015 2.1429 35.7143
15 1.2 1.2 (32,21) 0.4 0.008 0.017 2.1250 31.2500
16 1.6 0.4 (30,19) 0.8 0.009 0.005 0.5556 27.7778
17 1.6 0.6 (32,19) 0.6 0.011 0.050 4.5455 22.7273
18 1.6 0.8 (31,20) 0.4 0.007 0.017 2.4286 35.7143
19 1.6 1.0 (32,21) 0.2 0.008 0.02 2.5000 31.2500
20 1.6 1.2 (30,21) 1.0 0.006 0.003 0.5000 41.6667
21 2.0 0.4 (32,19) 0.4 0.011 0.036 3.2727 22.7273
22 2.0 0.6 (31,20) 0.2 0.010 0.053 5.3000 25.0000
23 2.0 0.8 (32,21) 1.0 0.008 0.022 2.7500 31.2500
24 2.0 1.0 (30,21) 0.8 0.007 0.003 0.4286 35.7143
25 2.0 1.2 (30,19) 0.6 0.006 0.003 0.5000 41.6667
Table 3. Analysis of variance for Stage-1 GA_FEA (larger-the-better).
SourceDFSeq SSAdj SSFp% ContributionInfluential Rank
t1_rigid 4 116.56 116.56 3.52 0.061 5.64% 2
t2_flexible 4 90.06 90.06 2.72 0.107 4.36% 3
mp_location 4 1765.90 1765.90 53.33 0.000 85.41% 1
d_notch 4 28.89 28.89 0.87 0.521 1.40% 4
Residual Error 8 66.22 66.22 3.20%
Total 24 2067.63
DF = Degrees of Freedom, SS = Sums of Squares, F = F-ratio, p = Probability, and Rsq = 96.80%.
Table 4. Analysis of variance for Stage-1 Stiff_FEA (smaller-the-better).
SourceDFSeq SSAdj SSFp% ContributionInfluential Rank
t1_rigid 4 159.65 39.912 7.15 0.009 35.37% 1
t2_flexible 4 116.80 29.20 5.23 0.023 25.88% 2
mp_location 4 104.76 26.189 4.69 0.030 23.21% 3
d_notch 4 25.46 6.364 1.14 0.404 5.64% 4
Residual Error 8 44.67 5.584 9.90%
Total 24 451.33
DF = Degrees of Freedom, SS = Sums of Squares, F = F-ratio, p = Probability, and Rsq = 90.10%.
Table 5. Signal-to-noise ratio response table for Stage-1.
GA_FEA (Larger-the-Better)Stiff_FEA (Smaller-the-Better)
Levelt1_Rigidt2_Flexiblemp_Locationd_NotchLevelt1_Rigidt2_Flexiblemp_Locationd_Notch
1 8.716 7.860 −4.789 4.633 1 −23.20 −24.12 −30.04 −28.71
2 6.566 6.981 −5.454 3.385 2 −27.13 −26.81 −29.87 −29.25
3 2.968 4.266 12.405 5.411 3 −29.37 −29.19 −28.22 −26.46
4 3.538 3.599 11.929 5.942 4 −29.87 −29.00 −26.44 −27.23
5 4.038 3.119 11.734 6.454 5 −29.69 −30.14 −24.69 −27.60
Delta 5.748 4.742 17.86 3.069 Delta 6.67 6.02 5.34 2.79
Rank 2 3 1 4 Rank 1 2 3 4
The optimal level is highlighted in bold.
Table 6. Regression equations at Stage-1.
mp_LocationRegression Equations for Response Parameters
at (30,19) GA_FEA = 10.08 − 0.770 t1_rigid − 0.556 t2_flexible − 0.569 d_notch
Stiff_FEA = 10.44 + 3.044 t1_rigid + 2.991 t2_flexible + 0.834 d_notch
at (30,21) GA_FEA = 9.23 − 0.770 t1_rigid − 0.556 t2_flexible − 0.569 d_notch
Stiff_FEA = 3.95 + 3.044 t1_rigid + 2.991 t2_flexible + 0.834 d_notch
at (31,20) GA_FEA = 6.37 − 0.770 t1_rigid − 0.556 t2_flexible − 0.569 d_notch
Stiff_FEA = 12.19 + 3.044 t1_rigid + 2.991 t2_flexible + 0.834 d_notch
at (32,19) GA_FEA = 5.63 − 0.770 t1_rigid − 0.556 t2_flexible − 0.569 d_notch
Stiff_FEA = 12.35 + 3.044 t1_rigid + 2.991 t2_flexible + 0.834 d_notch
at (32,21) GA_FEA = 10.07 − 0.770 t1_rigid − 0.556 t2_flexible − 0.569 d_notch
Stiff_FEA = −0.05 + 3.044 t1_rigid + 2.991 t2_flexible + 0.834 d_notch
Table 7. Comparison of base and optimal models of S/N ratio for Stage-1.
ParametersUnitsBase ModelStage-1 GA_FEA Optimal Combination (1 1 3 5)Stage-1 Stiff_FEA Optimal Combination (1 1 5 3)
t1_rigid mm 0.8 0.4 0.4
t2_flexible mm 0.4 0.4 0.4
mp_location (mm, mm) (31,20) (31,20) (32,21)
d_notch mm 1.0 1.0 0.6
GA_FEA - 9.875 11.6 8.96
Stiff_FEA N/mm 1.58 1.62 0.41
% change GA_FEA 17.47% −9.27%
% change Stiff_FEA −2.53 74.05%
Table 8. Taguchi DoE parameters with their levels for Stage-2 optimization of SIDO-CDAM.
Control ParametersUnitsLevels
123
t1_rigid mm 0.4 1.2 2.0
t2_flexible mm 0.4 0.8 1.2
d_notch mm 0.2 0.6 1.0
Table 9. Stage-2 Taguchi DoE L9 design matrix with the simulated results.
ParametersTrial 1Trial 2Trial 3Trial 4Trial 5Trial 6Trial 7Trial 8Trial 9
SIDO-CDAM Model *Actuators 15 00244 i001Actuators 15 00244 i002Actuators 15 00244 i003Actuators 15 00244 i004Actuators 15 00244 i005Actuators 15 00244 i006Actuators 15 00244 i007Actuators 15 00244 i008Actuators 15 00244 i009
t1_rigid 0.4 0.4 0.4 1.2 1.2 1.2 2 2 2
t2_flexible 0.4 0.8 1.2 0.4 0.8 1.2 0.4 0.8 1.2
d_notch 0.2 0.6 1.0 0.6 1.0 0.2 1.0 0.2 0.6
Input displacement 0.024 0.012 0.010 0.010 0.006 0.005 0.007 0.005 0.004
Output displacement 0.336 0.097 0.059 0.068 0.024 0.009 0.020 0.012 0.005
GA_FEA 14 8.0833 5.9 6.8 4 1.8 2.8571 2.4 1.25
Stiff_FEA 10.4167 20.8333 25.0000 25.0000 41.6667 50.0000 35.7143 50.0000 62.5000
* FEA simulated model (half-section) including deformed and undeformed positions.
Table 10. Gray relational analysis for Stage-2 optimization.
TrialsResponse
Parameters
S/N RatioNormalized
S/N Ratio
Deviation SequenceGRCGRGRank
LtBStBLtBStBLtBStB
GA_FEAStiff_FEA S / N G A i S / N S t i S / N * G A i S / N * S t i G A i S t i ξ G A i ξ S t i G R G i
1 14.00 10.42 22.92 −20.35 1.00 0.00 0.00 1.00 1.00 0.33 0.80 1
2 8.08 20.83 18.15 −26.38 0.77 −0.39 0.23 0.70 0.69 0.42 0.61 2
3 5.90 25.00 15.42 −27.96 0.64 −0.49 0.36 0.59 0.58 0.46 0.54 4
4 6.80 25.00 16.65 −27.96 0.70 −0.49 0.30 0.62 0.63 0.45 0.58 3
5 4.00 41.67 12.04 −32.40 0.48 −0.77 0.52 0.37 0.49 0.57 0.51 6
6 1.80 50.00 5.11 −33.98 0.15 −0.88 0.85 0.14 0.37 0.78 0.49 8
7 2.86 35.71 9.12 −31.06 0.34 −0.69 0.66 0.33 0.43 0.60 0.48 9
8 2.40 50.00 7.60 −33.98 0.27 −0.88 0.73 0.21 0.41 0.71 0.50 7
9 1.25 62.50 1.94 −35.92 0.00 −1.00 1.00 0.00 0.33 1.00 0.53 5
LtB = larger-the-better; StB = smaller-the-better.
Table 11. Signal-to-noise ratio response table for Stage-2.
GA_FEA (Larger-the-Better)Stiff_FEA (Smaller-the-Better)
Levelt1_Rigidt2_Flexibled_NotchLevelt1_Rigidt2_Flexibled_Notch
1 18.830 *16.230 * 11.877 1 −24.90 *−26.46 *−29.44 *
2 11.266 12.599 12.247 * 2 −31.44 −30.92 −30.08
3 6.220 7.487 12.192 3 −33.65 −32.62 −30.47
Delta 12.610 8.744 0.369 Delta 8.76 6.16 1.03
Rank 1 * 2 3 Rank 1 * 2 3
* The optimal level is highlighted in bold.
Table 12. Analysis of variance for Stage-2 GA_FEA (larger-the-better).
SourceDFSeq SSAdj SSFp% ContributionInfluential Rank
t1_rigid 2 241.697 120.848 26.73 0.036 65.90% 1
t2_flexible 2 115.771 57.886 12.80 0.072 31.56% 2
d_notch 2 0.239 0.119 0.03 0.974 0.06% 3
Residual Error 2 9.042 4.521 2.47%
Total 8 366.749
DF = Degrees of Freedom, SS = Sums of Squares, F = F-ratio, p = Probability, and Rsq = 97.53%.
Table 13. Analysis of variance for Stage-2 Stiff_FEA (smaller-the-better).
SourceDFSeq SSAdj SSFp% ContributionInfluential Rank
t1_rigid 2 124.403 62.2017 98.81 0.010 66.16% 1
t2_flexible 2 60.756 30.3784 48.26 0.020 32.31% 2
d_notch 2 1.633 0.8166 1.3 0.435 0.87% 3
Residual Error 2 1.259 0.6295 0.67%
Total 8 188.052
DF = Degrees of Freedom, SS = Sums of Squares, F = F-ratio, p = Probability, and Rsq = 99.33%.
Table 14. Comparison of predictive model results and simulated results for Stage-2.
Input Parameter SetsGA_FEA
t1_Rigidt2_Flexibled_NotchPredicted ValueSimulated Value
0.8 0.4 1.0 9.150 9.875
0.4 0.4 1.0 11.002 14.430
0.8 0.6 0.8 8.294 6.350
1.2 0.6 1.0 5.950 0.500
1.6 0.8 0.4 4.226 2.429
2.0 0.4 0.4 5.070 3.273
Root Mean Square Error (RMSE) = 2.95
Table 15. Comparison of the optimized and base models.
ModelsControl ParametersResponse Parameters
Thickness of Rigid Link
t1_Rigid (mm)
Thickness of Flexible Link
t2_Flexible (mm)
Diameter of Notch
d_Notch
(mm)
Geometrical
Advantage
GA_FEA
Stiffness
Stiff_FEA
(N/mm)
Base Model 0.8 0.4 1.0 9.875 15.625
Optimized Model 0.4 0.4 0.2 14 10.417
% improvement after optimization 41.77% −33.33%
Disclaimer/Publisher’s Note: The statements, opinions and data contained in all publications are solely those of the individual author(s) and contributor(s) and not of MDPI and/or the editor(s). MDPI and/or the editor(s) disclaim responsibility for any injury to people or property resulting from any ideas, methods, instructions or products referred to in the content.