Article

An Enhanced Envelope Spectroscopy Method for Bearing Diagnosis: Coupling PSO-Adaptive Stochastic Resonance with LMD


1
School of Mechanical and Electrical Engineering, China University of Mining and Technology, Xuzhou 221116, China
2
Faculty of Mechanical Engineering, Delft University of Technology, 2628 CD Delft, The Netherlands
3
School of Mechanical and Electrical Engineering, Xuzhou University of Technology, Xuzhou 221018, China
*
Author to whom correspondence should be addressed.
Actuators 2026, 15(4), 201; https://doi.org/10.3390/act15040201
Submission received: 2 December 2025 / Revised: 16 January 2026 / Accepted: 1 February 2026 / Published: 2 April 2026
(This article belongs to the Section Control Systems)

Abstract

Early fault vibration signals from rolling bearings are typically nonlinear, non-stationary, and heavily obscured by background noise, which severely impedes the accurate extraction of fault features. To overcome the limitations of traditional stochastic resonance (SR)—specifically the small-parameter restriction for high-frequency signals and the subjectivity in parameter selection—this paper proposes an adaptive SR envelope spectroscopy method based on particle swarm optimization (PSO) and local mean decomposition (LMD). First, a variable-scale transformation is introduced to compress the high-frequency fault signals into the effective frequency band required by the adiabatic approximation theory. Second, utilizing the global search capability of PSO, the potential well parameters of the bistable system are adaptively optimized by maximizing the output signal-to-noise ratio (SNR), thereby achieving optimal matching between the nonlinear system and the input signal. Finally, the enhanced signal is decomposed by LMD, and the sensitive components are selected for envelope spectrum analysis to identify fault characteristics. Experimental validation using the Case Western Reserve University bearing dataset demonstrates that the proposed method effectively amplifies weak fault signals under strong noise conditions, exhibiting superior feature extraction accuracy and noise robustness compared to traditional methods.

1. Introduction

Rolling bearings serve as critical components in rotating machinery, and their operational status directly impacts the safety and reliability of the entire mechanical system [1]. In practical industrial environments, bearings typically operate under complex working conditions, where early fault signatures are extremely weak and inevitably submerged by strong background noise and interference [2,3]. As a result, the extraction of effective fault characteristic frequencies from heavy noise continues to be a challenging yet significant subject in the field of mechanical fault diagnosis [4,5,6,7].
To address the challenge of noise interference, signal processing techniques have been widely studied. Conventional time-frequency analysis methods, such as Wavelet Transform [8,9], Empirical Mode Decomposition [10], and Variational Mode Decomposition (VMD) [11,12], have been extensively applied to separate fault features from noise. Additionally, local mean decomposition (LMD) has emerged as a powerful tool for processing non-stationary signals due to its ability to adaptively decompose modulation signals into Product Functions (PFs) [13,14]. However, these traditional methods primarily focus on “noise suppression” or “noise cancellation”. When the signal-to-noise ratio (SNR) is extremely low, these denoising algorithms may inadvertently remove the weak fault transients along with the noise or suffer from mode mixing and endpoint effects, leading to missed diagnoses.
Distinct from traditional noise cancellation methods, SR offers a paradigm shift by utilizing noise to enhance weak signals rather than eliminating it. The core mechanism of SR facilitates the transfer of energy from noise to the weak periodic signal within a nonlinear system, thereby amplifying the fault features [15,16,17]. Recent studies have demonstrated the effectiveness of SR in bearing fault diagnosis. Xu et al. [18] investigated the effect of the intensity and stability index of Levy noise and external signal amplitude on the occurrence of the SR phenomenon, and proved that higher signal amplitude enhances the output power profile of the system and promotes the occurrence of SR. Zhang et al. [19] proposed a new type of model for the asymmetric bistable system with asymmetric terms on the basis of the traditional bistable model, and the study showed that the system parameters had an effect on the asymmetric bistable potential function. Fan et al. [20] discovered a region with three stable states through secondary optomechanical coupling, and demonstrated that there are stochastic switches of noise activation between the three stable states. Zhou et al. [21] used bistatic theory to obtain an expression for the SNR of an asymmetric bistable system that was affected by correlated multiplicative and additive white noises.
Despite its theoretical superiority, the practical application of SR in engineering faces two major bottlenecks. First, the classical SR theory is based on the adiabatic approximation, which requires the input signal frequency to be far smaller than 1 Hz. Since bearing fault frequencies are typically in the range of hundreds of Hertz, a variable-scale method must be employed to transform high-frequency signals into the specific range suitable for SR [22]. For example, Li et al. [23] proposed a piecewise nonlinear SR method with single-parameter adjustment. This method not only enhances the theoretical output signal-to-noise ratio but also effectively detects weak signals in strong background noise. Qiao et al. [24] introduced an adaptive non-saturated bistable stochastic resonance model. By establishing a piecewise bistable potential model, this model avoids output saturation. Nevertheless, the potential function of this model is completely symmetric, which might not be appropriate for dealing with asymmetric or skewed signals encountered in practical applications. To tackle this issue, Cui et al. [25] put forward a piecewise nonlinear asymmetric bistable stochastic resonance model, which partially alleviated the saturation phenomenon in classical bistable stochastic resonance. However, since this method does not optimize the system parameters, its adaptability and stability in engineering practice require further improvement. Second, and more critically, the output performance of the SR system is highly sensitive to its system parameter. These parameters must be essentially matched with the input signal features and noise intensity to induce resonance. Subjective or manual selection of parameters often fails to achieve optimal resonance [26,27].
Unlike traditional combinations of signal processing methods, this paper establishes a systematic framework to address the two critical bottlenecks of applying SR in engineering: the high-frequency restriction and the parameter matching difficulty. This paper proposes an adaptive SR envelope spectroscopy method based on particle swarm optimization (PSO). The PSO algorithm is introduced to globally optimize the system parameters of the bistable model, maximizing the output SNR. Furthermore, a variable-scale step is integrated to satisfy the small-parameter condition for high-frequency bearing faults. Finally, LMD is employed to decompose the SR-enhanced signal and perform envelope spectrum analysis, ensuring accurate extraction of fault characteristics even under strong noise backgrounds. The effectiveness of the method proposed in this paper is verified by conducting experiments on public datasets, and its superiority is further demonstrated by comparison with several classical methods.

2. Methods

2.1. Bistable Stochastic Resonance

The measured vibration signal is quite weak and accompanied by intense noise that exists in the harsh operation site environment. Two ideas can be applied to extract the existing weak features by subjecting the original signal to noise reduction and no noise reduction, respectively. While noise reduction techniques can suppress interference, they risk inadvertently attenuating the weak fault transients along with the noise, thereby complicating the extraction of fault features. No-noise-reduction processing detects fault signals by noise to improve the SNR of weak signals. The SR theory proposed by Benzi et al. [28], its most significant feature is that it enhances the energy of weak signal features by using the energy of noise; meanwhile, it can mitigate the impact of noise on detection to achieve the effective extraction of signals.
SR contains the study of a variety of nonlinear systems, and bistable stochastic resonance (BSR) systems have been the most widely studied due to their typical noisy nonlinear effects. Before the concept of SR was introduced, Robert Brown, a British botanist, observed that when he looked at pollen particles suspended on the surface of water, these particles showed irregular motion in response to the collision of water molecules and called it Brownian motion. Brownian motion can be described as:
m ¨ x + c x ¨ = f ( x ) + H * ( t )
where f ( x ) represents the external force on the particle, and H * ( t ) stands for random disturbance force. If f ( x ) possesses a potential energy and this potential function exhibits bi-stability, the f ( x ) = U ( x ) .
Then the equation can be rewritten as:
m x ¨ + c x ¨ + U ( x ) = H * ( t )
where U ( x ) = a * x 2 / 2 + b * x 2 / 4 , a * > 0 , b * > 0 .
Since the particle mass is small and the inertial force can be ignored, the equation can be expressed as:
x ¨ = C ( x ) + H ( t )
where C ( x ) = a x b x 3 , a * > 0 , b * > 0 .
H ( t ) can be expressed as:
H ( t ) = s ( t ) + g ( x ) ξ ( t )
where s ( t ) is a definite excitation and can be regarded as an input signal, while g ( x ) ξ ( t ) is a random excitation, and it can be regarded as noise in an SR system.
Give the system a simple incentive S ( t ) = A cos ω t ; the stochastic disturbance η ( t ) is Gaussian white noise; and the SR model of a bistable system can be expressed as the Ronzwan equation:
d x d t = a x b x 3 + A cos w t + η ( t )
where a and b are the shape parameters greater than zero potential well, and the corresponding potential function is:
U ( x ) = a x 2 / 2 + b x 4 / 4 x A cos w t + η ( t )
The equation above describes a BSR system that consists of two potential wells and a barrier. This system can be represented visually as the movement of an overdamped particle within these two potential wells.
When there is no excitation or system noise, the system is a left-right symmetric potential well with a barrier height Δ U = a 2 / 4 b and a bottom at x m = ± a / b . The output of the bistable system depends on the initial state, which can be in any one of the potential wells, and the system has two minima and one maxima, corresponding to the two potential wells and the barrier point.
When the external excitation A is unequal to zero, the potential function U ( x ) is inclined regularly at frequency ω according to the change in amplitude. A c = 4 a 3 / 27 b 3 is the static trigger value. When the signal amplitude does not exceed A c , the overdamped particles can only move in one side of the potential well. When the static triggering threshold is exceeded, there is only one potential well left in the potential function. A potential well-triggering will be completed and the system output will undergo a significant increase.
When the system has no external excitation and only noise acts, the overdamped particles switch back and forth jumping the potential well according to the Kramers jump rate r k , which can be expressed as follows:
r k = a 2 π exp Δ U D
where D is the noise intensity.
The signal causes the overdamped particles to move periodically in the two potential wells when excited by the signal and disturbed by the noise at the same time, and the noise-driven overdamped particles migrate in the two potential wells, which is equivalent to the potential wells being flipped in accordance with r k . When A < A c , particles can only move in one of the potential wells x m = a / b or x m = a / b . The particle is actually equivalent to jumping from one original potential well to another when guided by noise. The output signal experiences significant enhancement due to the fact that the potential difference of the new potential well is much larger than the amplitude of the input signal. Meanwhile, the output state of the system shows regular changes, which helps to suppress the interference of noise and eventually leads to a significant improvement in the signal-to-noise ratio of the output signal, an effect described as the SR phenomenon.

2.2. Runge–Kutta Algorithm and Signal-to-Noise Ratio

The Runge–Kutta algorithm is an iterative algorithm commonly developed for solving solutions of ordinary differential equations in engineering which is characterized by high accuracy, stability, and convergence. The BSR model belongs to a kind of nonlinear stochastic equation, so this paper applies a kind of improved fourth-order Runge–Kutta algorithm to solve the BSR, and the modified algorithm is as follows:
x n + 1 = x n + 1 6 k 1 + ( 2 2 ) k 2 + ( 2 + 2 ) k 3 + k 4 , n = 0 , , N 1
k 1 = h a x n b x n 3 + s n + η n
k 2 = h a x n + 1 2 k 1 b x + 1 2 k 1 + s n + η n
k 3 = h a x n + 1 2 k 1 b x n + 2 1 2 k 2 + 2 2 2 k 2 + s n + 1 + n n + 1
k 4 = h a ( x n + 1 2 k 1 ) b x n 2 2 k 2 + 2 + 2 2 k 3 3 + s n + 1 + η n + 1
where s n , η n , and x n are the nth sampling points of the input, noise, and output signals, respectively, and h is the iteration step size, usually taken as h = 1 / f s .
Based on the study of the theory and method of SR, it is easy to find that the method is more inclined to a qualitative enhancement of weak signals. To be quantitatively descriptive, some specific scale values are needed. As the study of SR methods proceeds, the quantitative description of the phenomenon becomes particularly urgent. The concept of SNR originated with Fauve and Heslot in the field of flip-flop circuits, where a method was proposed for the stochastic resonance to be characterized quantitatively. At the same frequency, this method calculates the SNR of spectral values, which became the most commonly used measure of SR, and its expression is:
S N R = lim Δ w 0 w Δ w w + Δ w S ( w ) d w S N ( w )

2.3. Fault Regulation of Bistable Stochastic Resonance System

An SR model generally consists of a weak input signal S ( t ) , a noise η ( t ) and a nonlinear system [25]:
  • Input for weak signals S ( t ) . There are various types of signals, such as digital pulse signals, non-periodic signals, periodic signals, random signals or deterministic signals.
  • Noise components η ( t ) . In essence, noise components are random signals that satisfy specific requirements on their statistical characteristics, which mainly include white noise, colored noise, Gaussian noise and non-Gaussian noise.
  • Nonlinear signal processing system. The input signal consists of a mixture of signal and noise, which is processed by the nonlinear system to obtain the output signal x ( t ) .
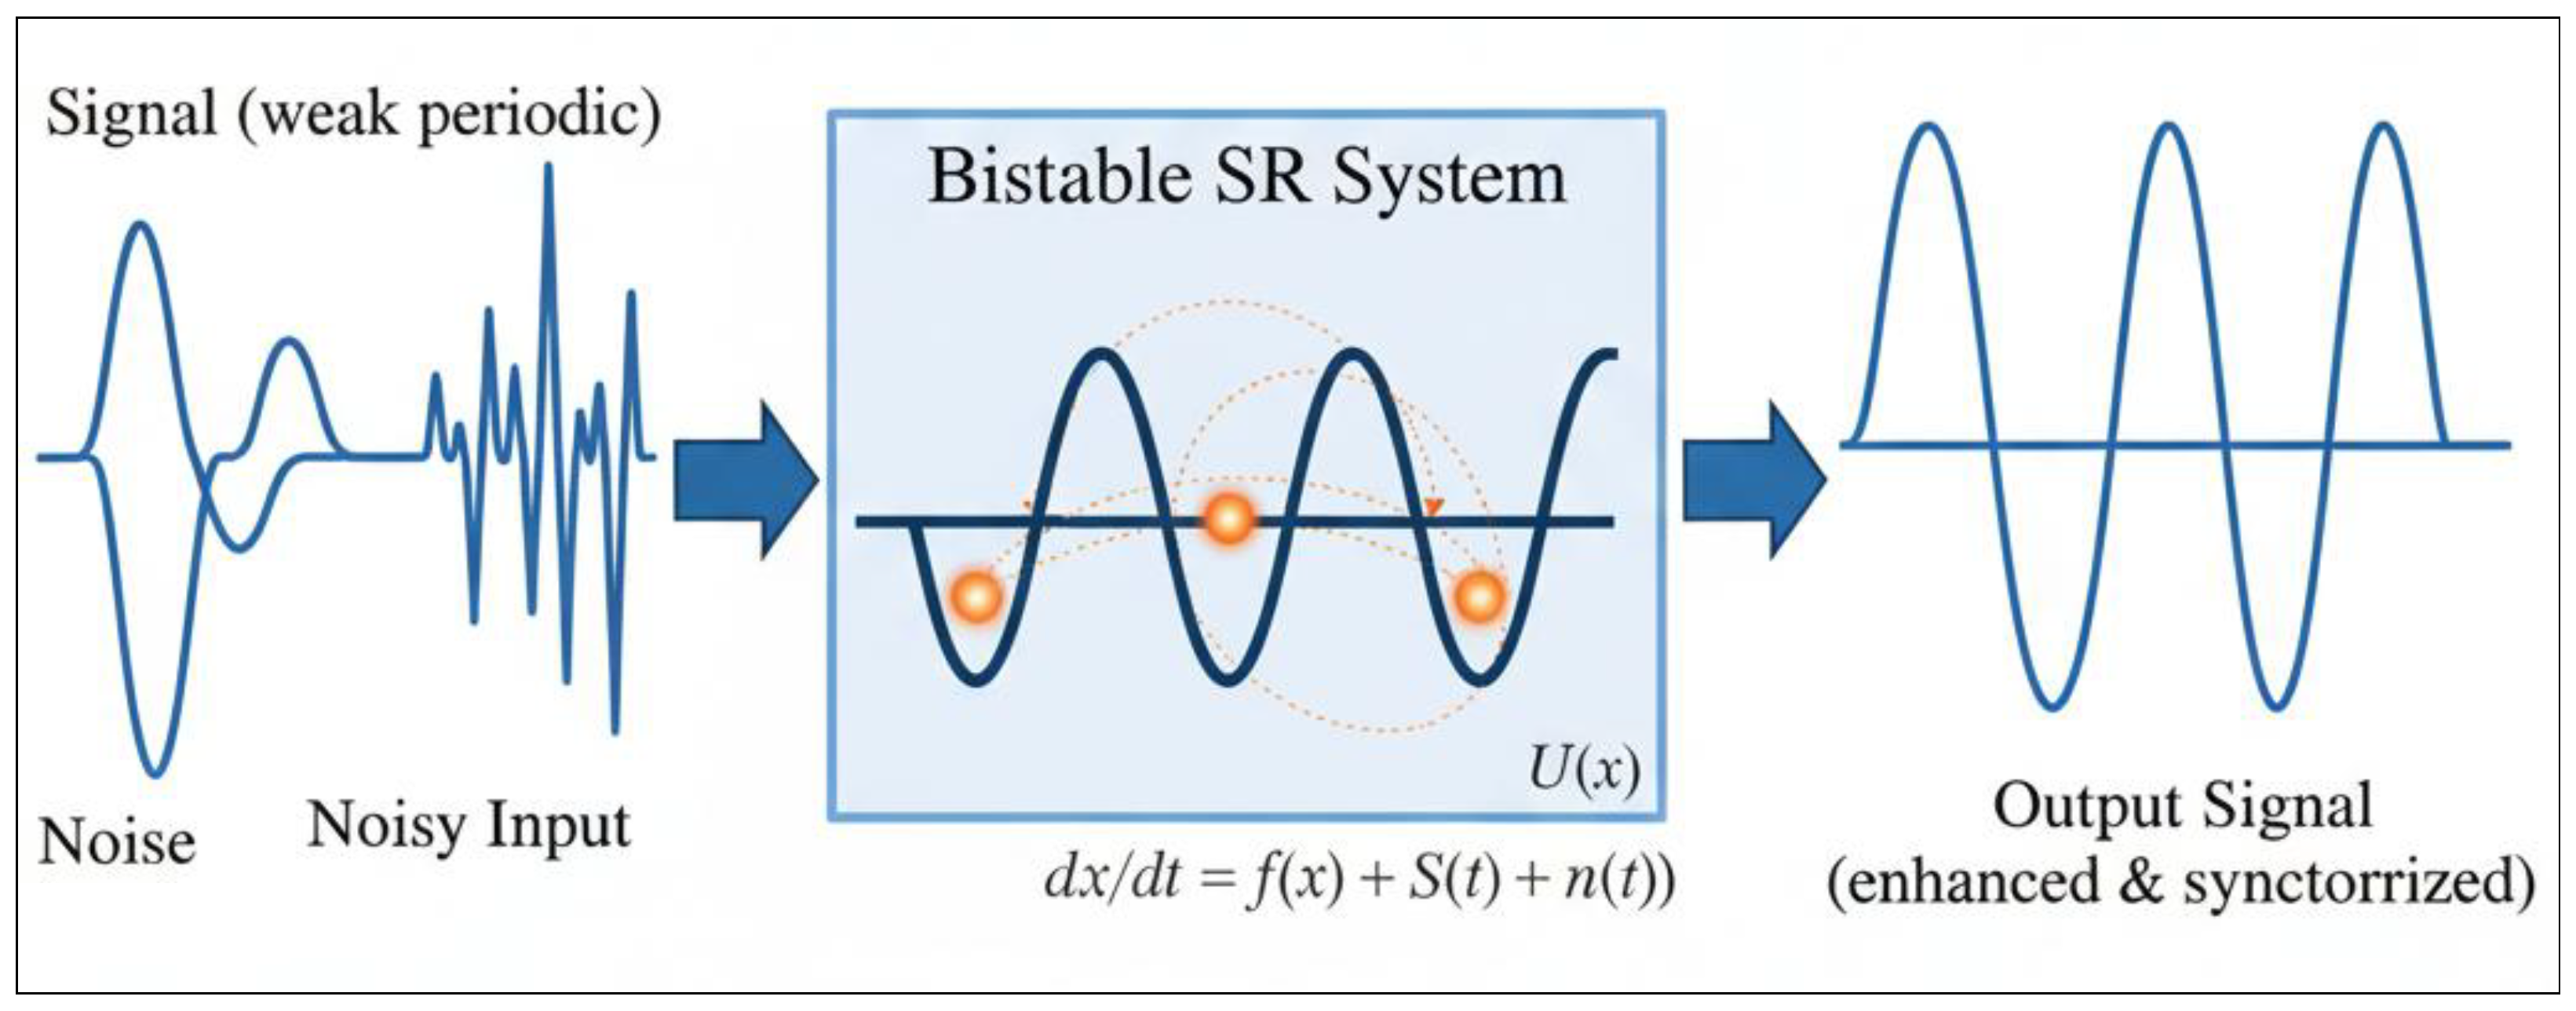
The BSR model is shown in Figure 1.
As can be seen from Figure 1, the occurrence of SR is the result of the combined effect of signal, noise, and system. Generally, it is difficult for the measured signal to meet the requirements, so the noise or system parameters must be adjusted to produce random resonance.
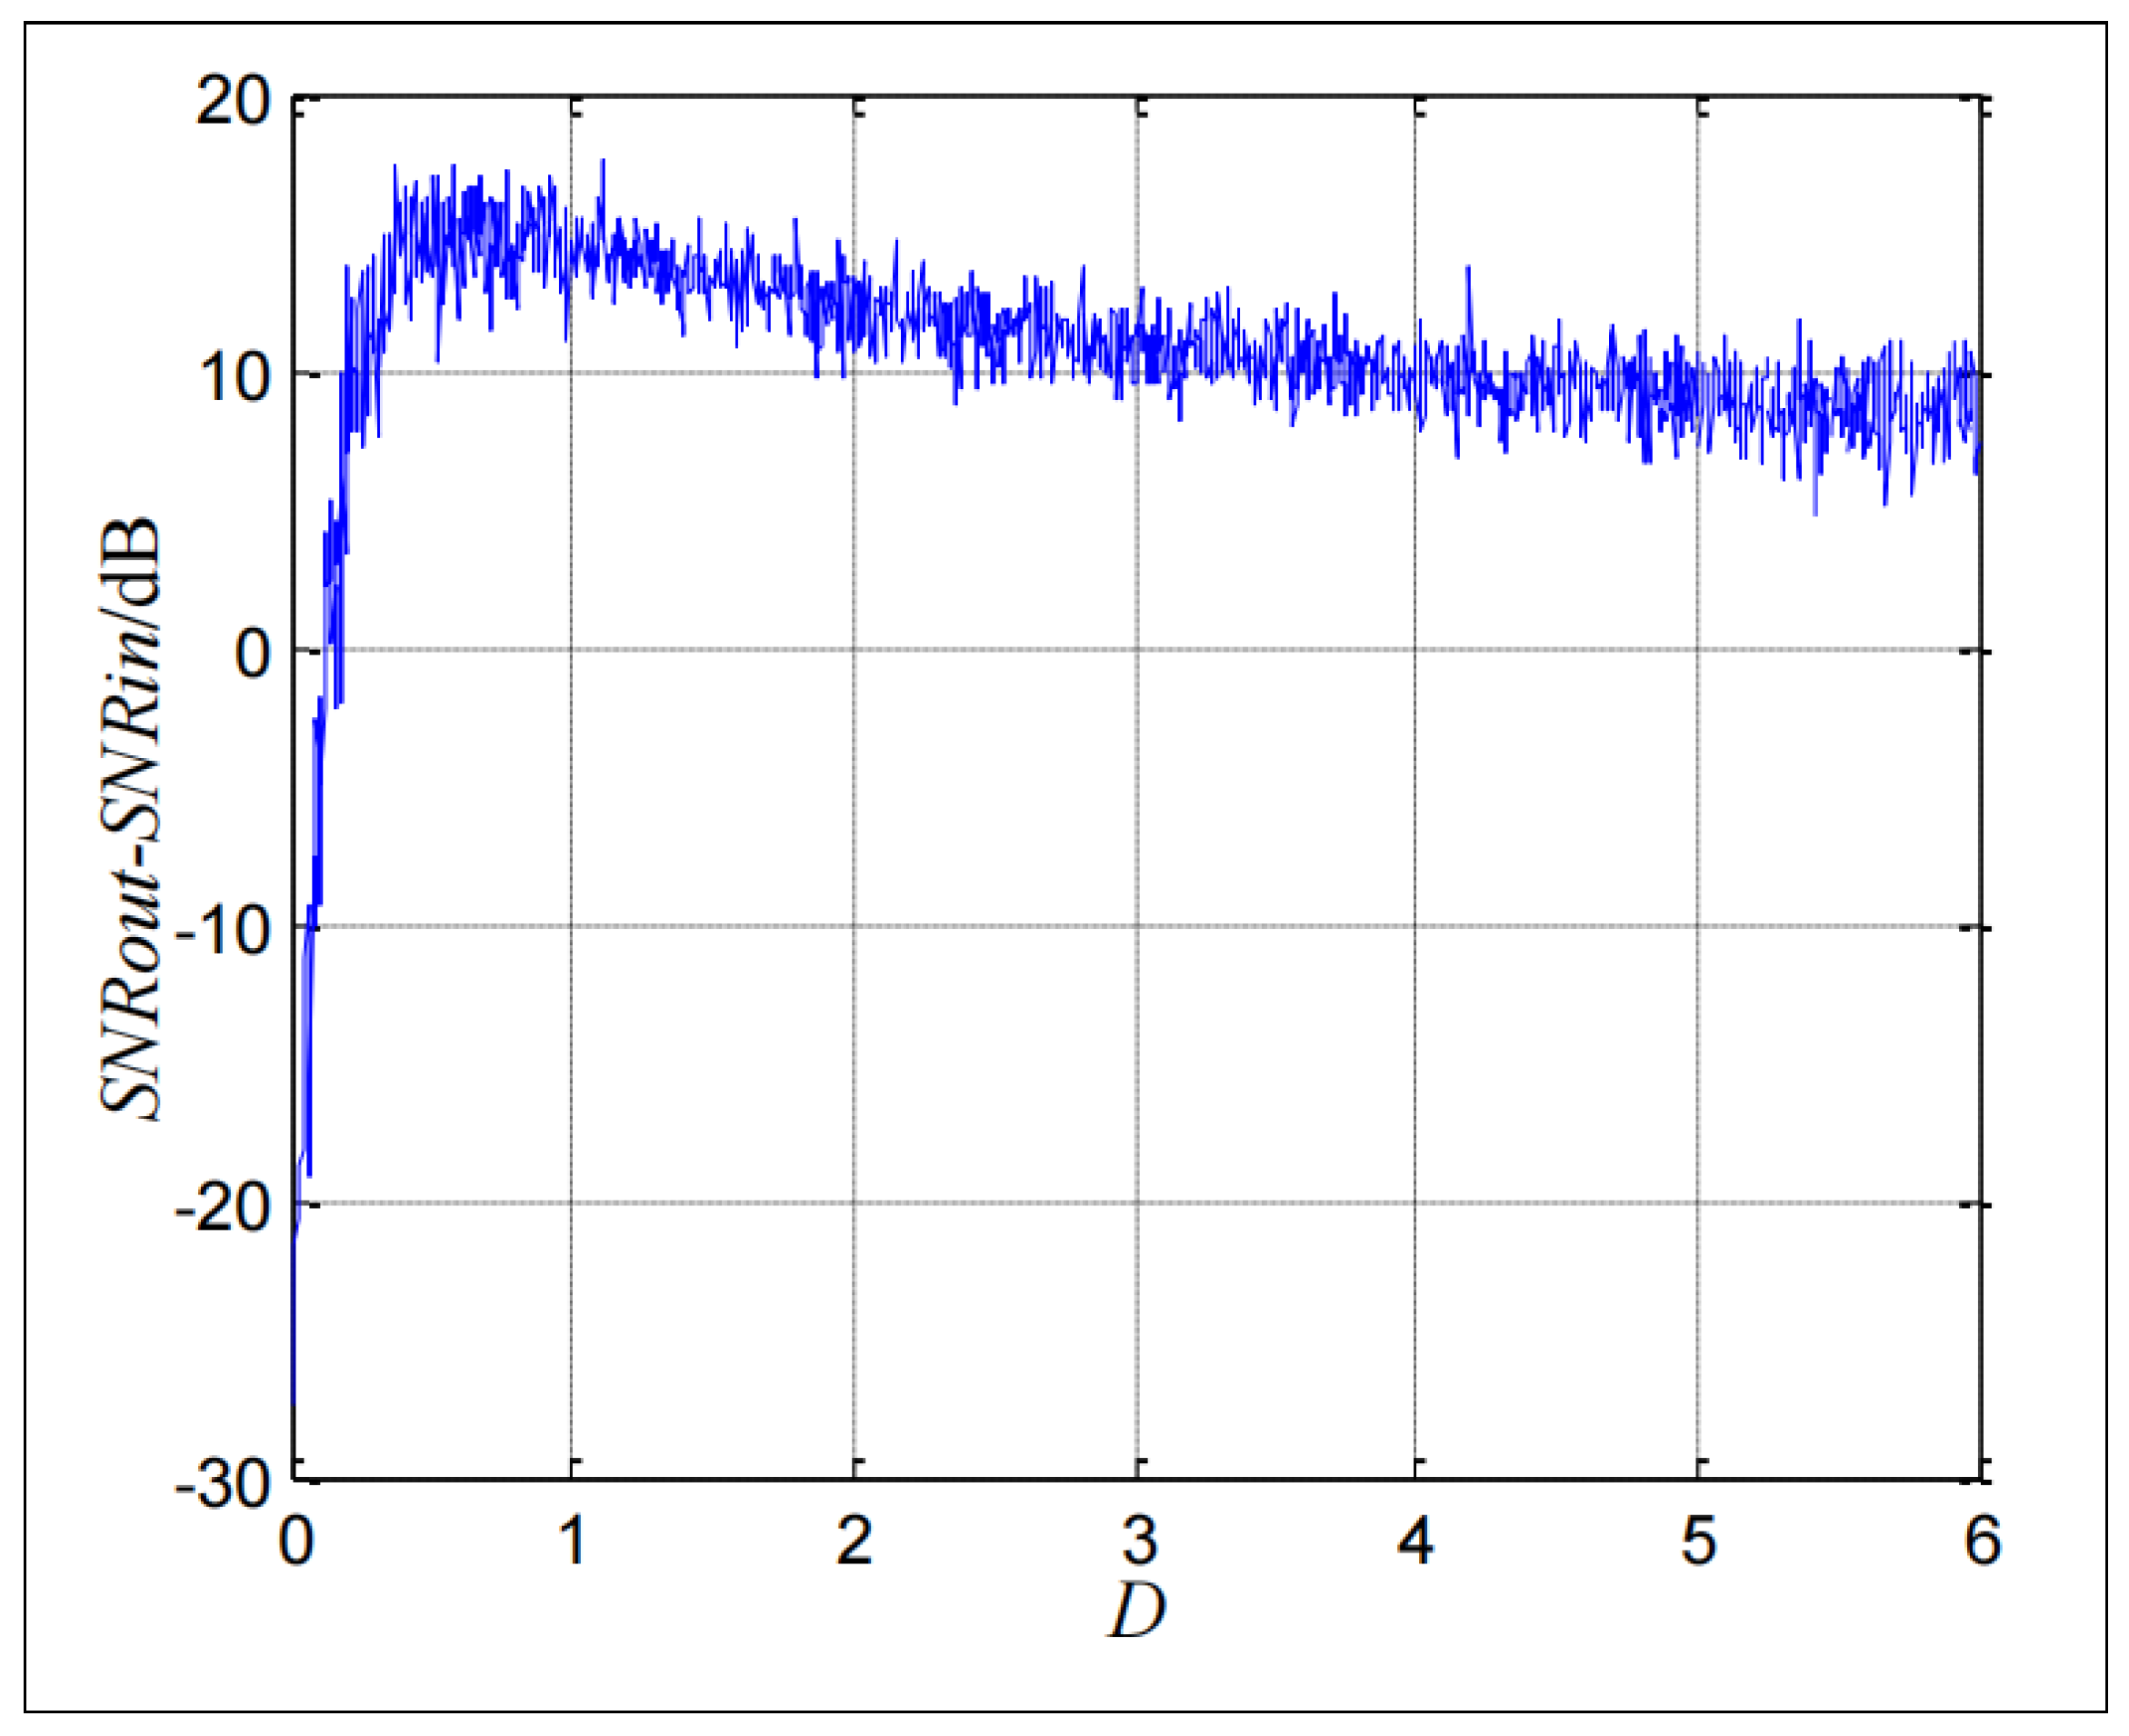
From the study, it can be seen that as the noise intensity in the signal gradually increases, the barrier height and the input SNR gradually decrease. As shown in Figure 2, signal jumps are less difficult and SR phenomenon are more easily manifested. Since the SNR decreases at a rate less than the rate of potential drop, through simulation a peak will be produced by increasing the noise intensity, and it makes sense to continue to increase the noise intensity further. Further, the addition of noise is an incremental process: if the signal is already submerged in noise, this processing method will increase the difficulty of practical applications.
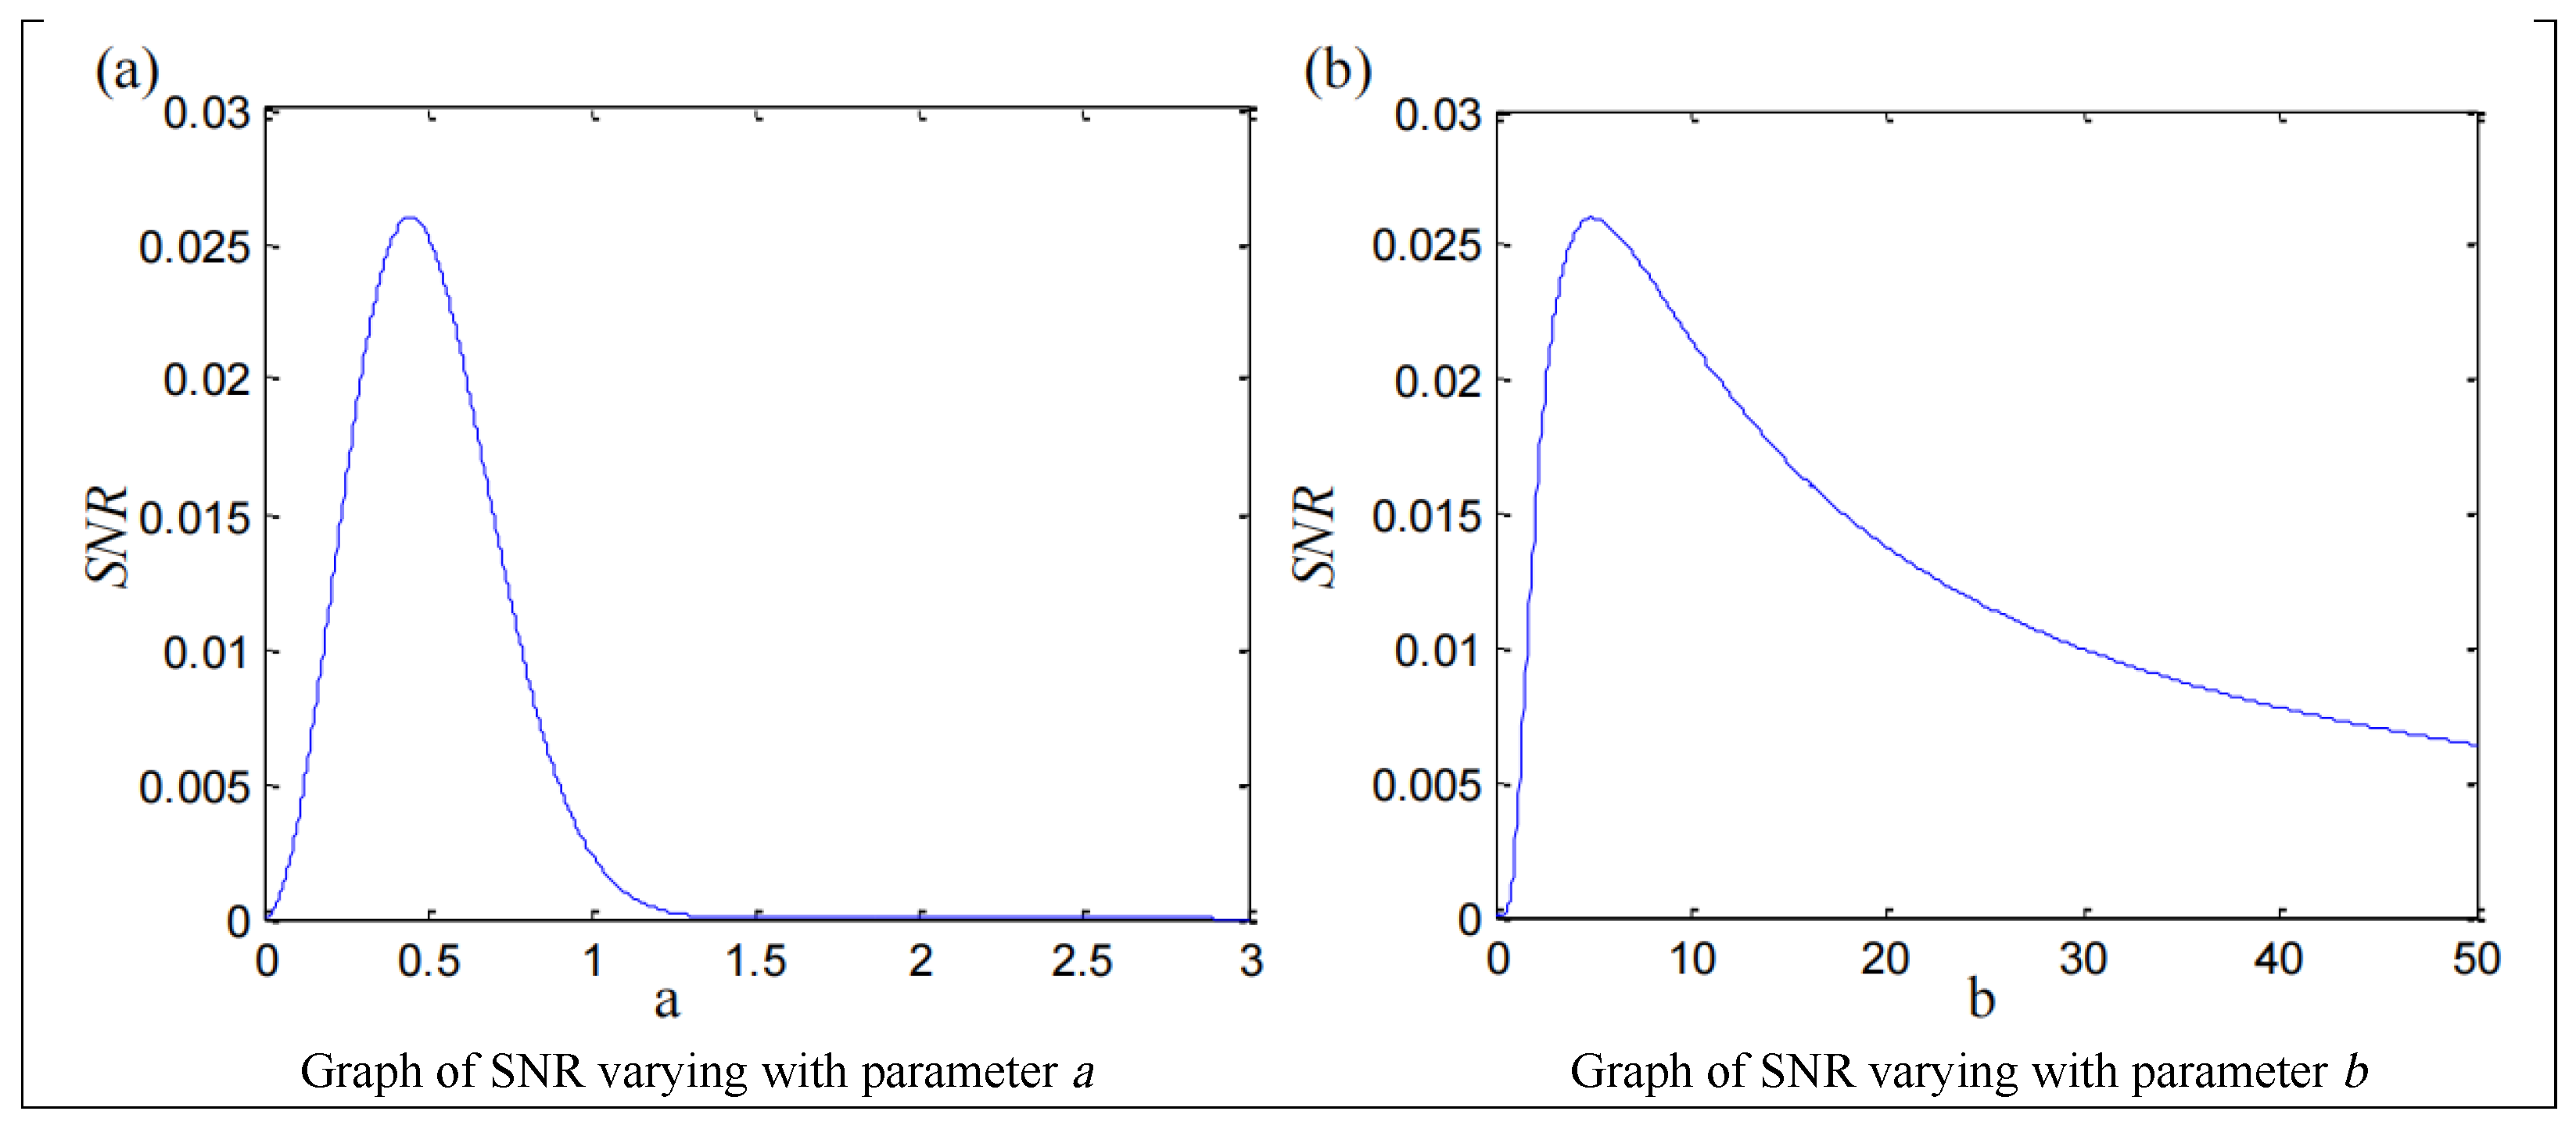
Another way to reduce the difficulty of generating random resonances in a signal is to adjust the system parameters. From the above, the static trigger threshold of the system is A c = 4 a 3 / 27 b ; it is particularly important to obtain the optimal potential height by adjusting the parameters a and b. In the case of weak signal input, according to the adiabatic approximation theory and linear response theory, the approximate expression for the output SNR can be described as:
SNR = 2 a 2 A 2 e D U / D 4 b D 2 = 2 a 2 A 2 e a 2 / D 4 b D 2
The SNR of the output signal has a simple increasing and decreasing relationship with the adjustment of the system parameters ( A = 0.05 , D = 0.05 , a, b unchanged at 1). The process of change is shown in Figure 3. Adjusting the parameters of the system is effective because the graph shows the SR of the system at this point in time.
The parameters for a and b are usually chosen subjectively or independently by existing parameter tuning methods. The optimization process can easily become trapped in a local optimum when existing methods fail to account for the synergistic effects of the two parameters. PSO is a global optimization algorithm that searches for multiple objectives simultaneously. In this paper, the PSO is introduced into the parameter optimization of SR systems to optimize multiple parameters simultaneously to overcome the above drawbacks.

2.4. Particle Swarm Optimization for Bistable Stochastic Resonance System

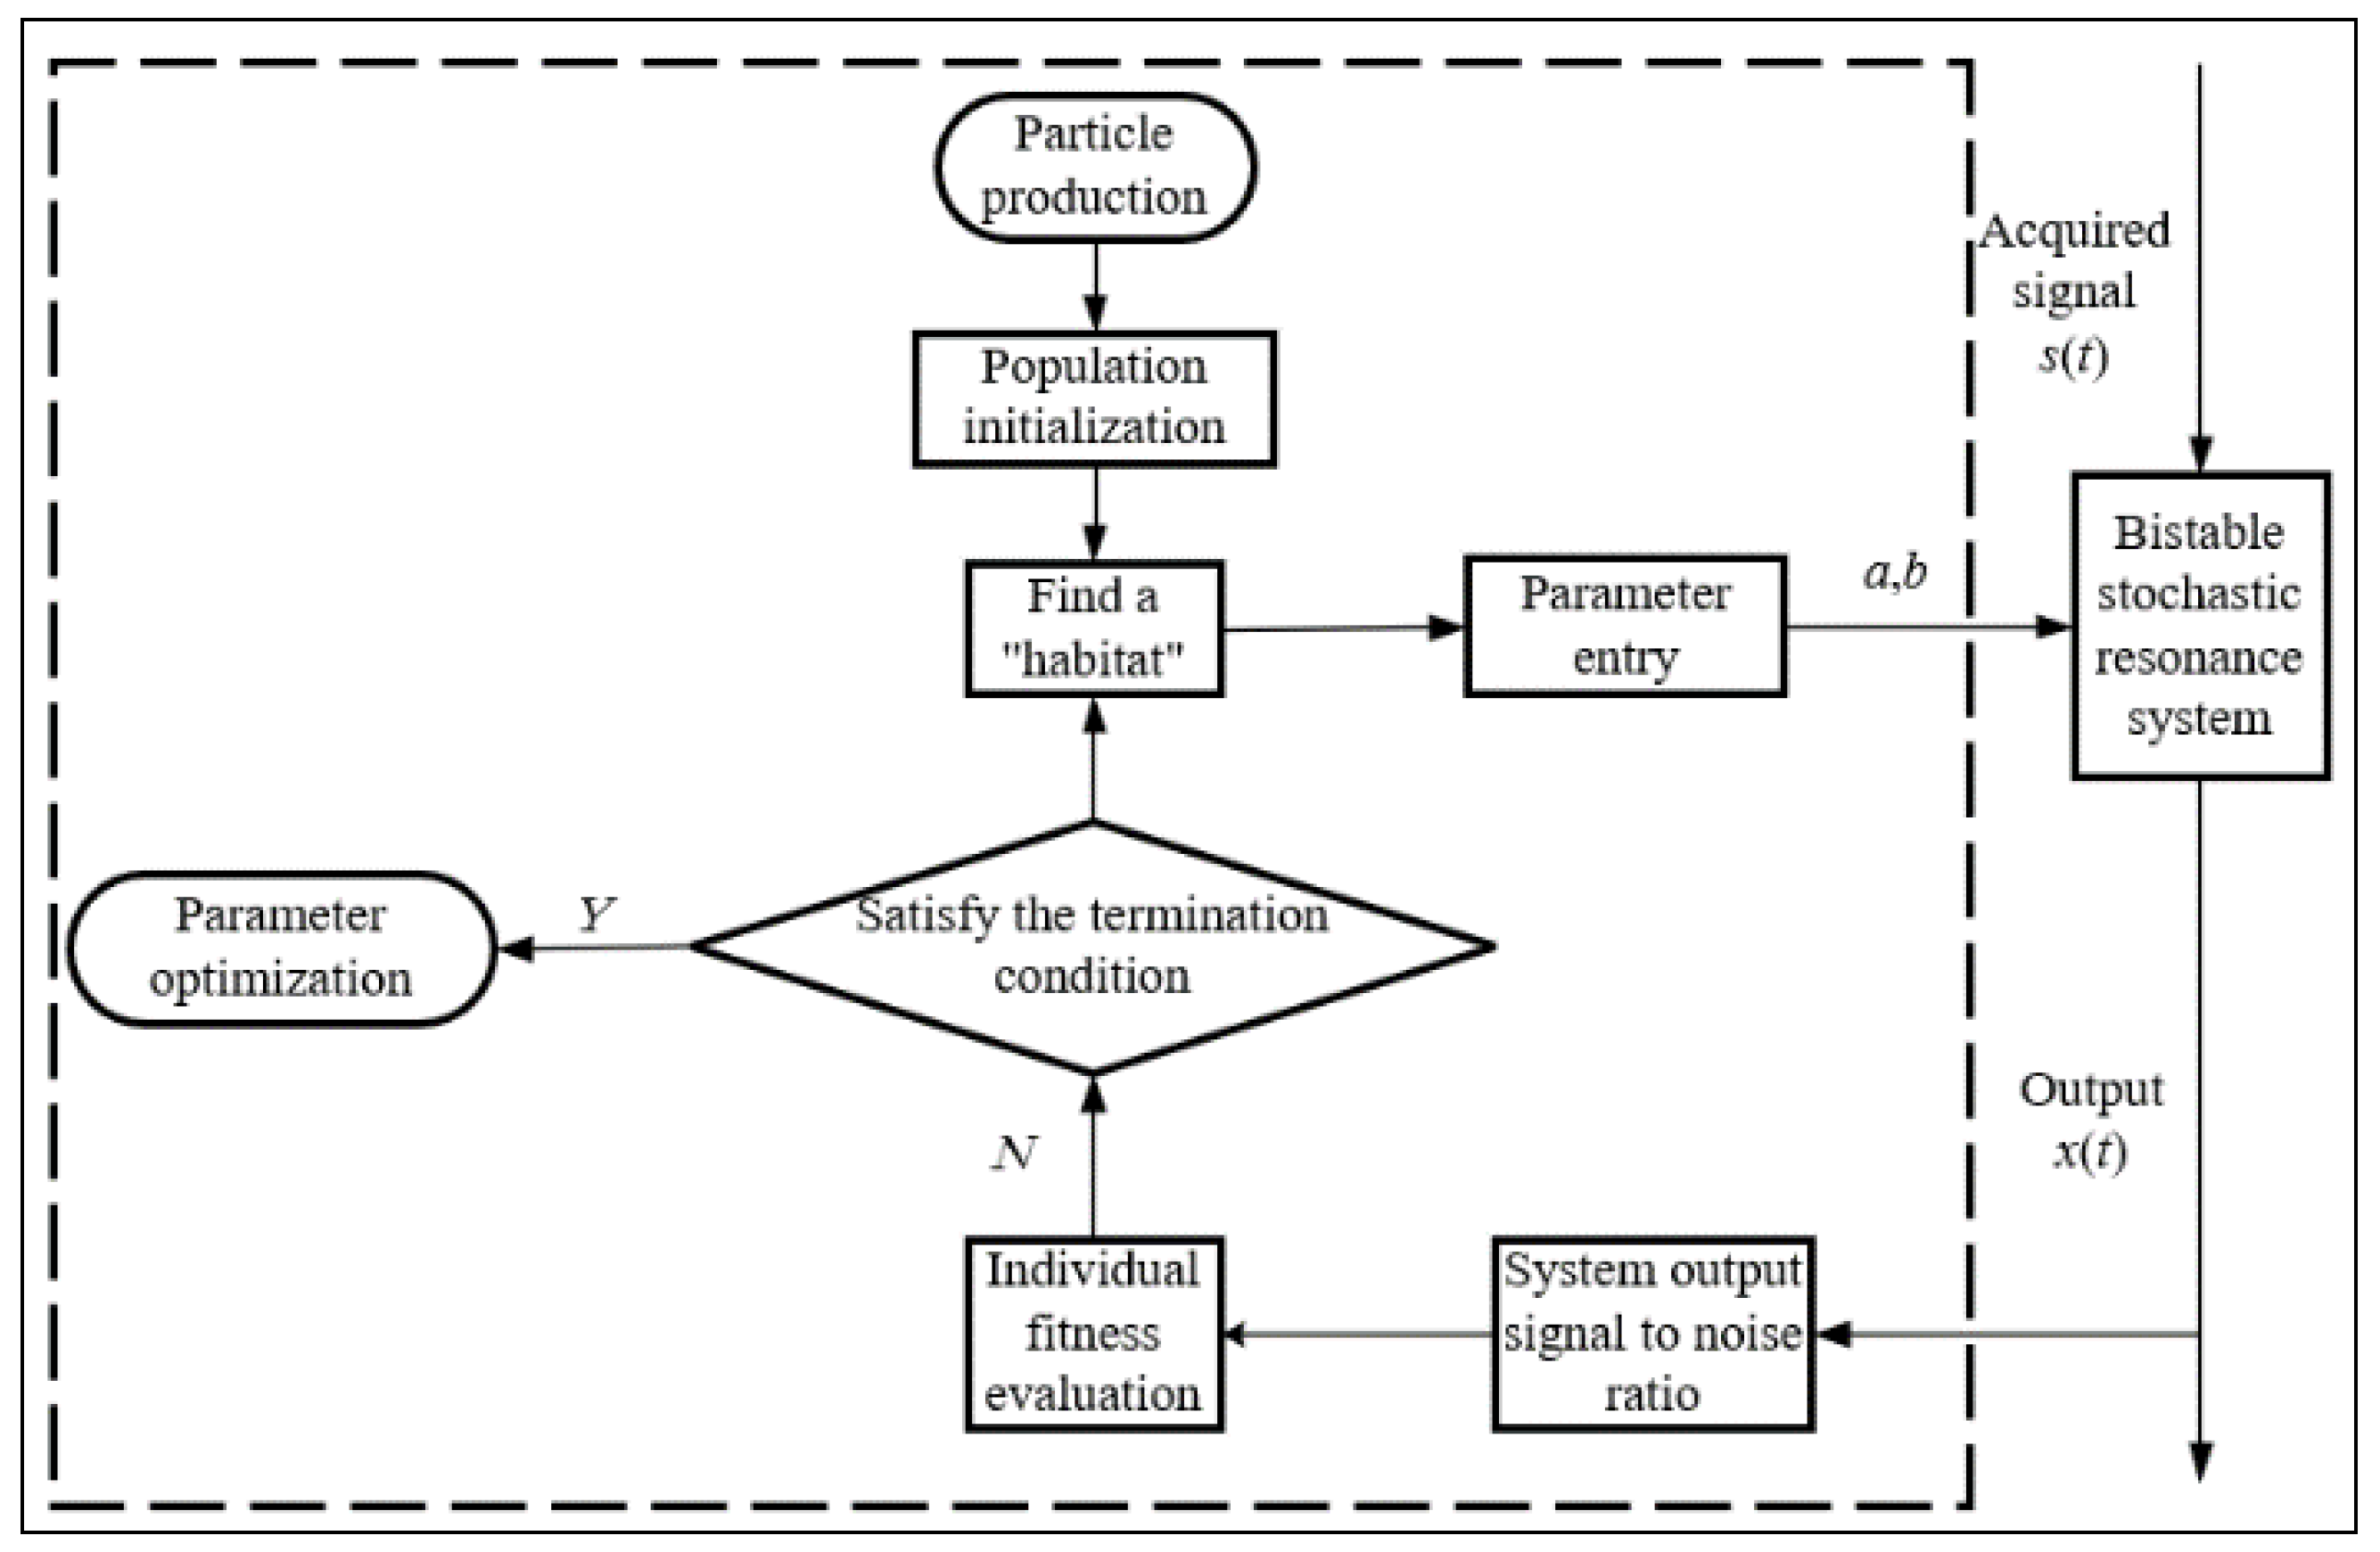
BSR can highlight a signal’s frequency to weaken it, which greatly enhances the SNR of signals at specific frequencies in preparation for LMD. Optimization of parameters a and b is necessary to improve the signal, noise, and random resonance of the system. The PSO’s multi-objective optimization capability is utilized in this paper to propose an adaptive SR method. The method takes the output SNR as the optimization objective and searches for the system parameters a and b that make the system randomly resonate and match the original input signal optimally. The method can adaptively calculate the optimal parameters based on the input signal, and the block diagram of the algorithm is shown in Figure 4.
The SNR is calculated by the PSO algorithm (with the swarm size set to 30) based on the input signal of the system, with the system parameters given first. The swarm size set to 30 is a common choice that balances computational efficiency and search capability. The optimization objective is set to maximize the SNR obtained by the algorithm, which adaptively adjusts the parameters a (search range: [ 0.1 , 5 ] ) and b (search range: [ 0.1 , 5 ] ) until the optimal objective is achieved or the maximum number of iterations is reached, and then outputs the optimized parameters.The search range [ 0.1 , 5 ] ensures that the barrier height remains within the “resonant regime”.

3. Experimental Verification

3.1. Dataset Introduction

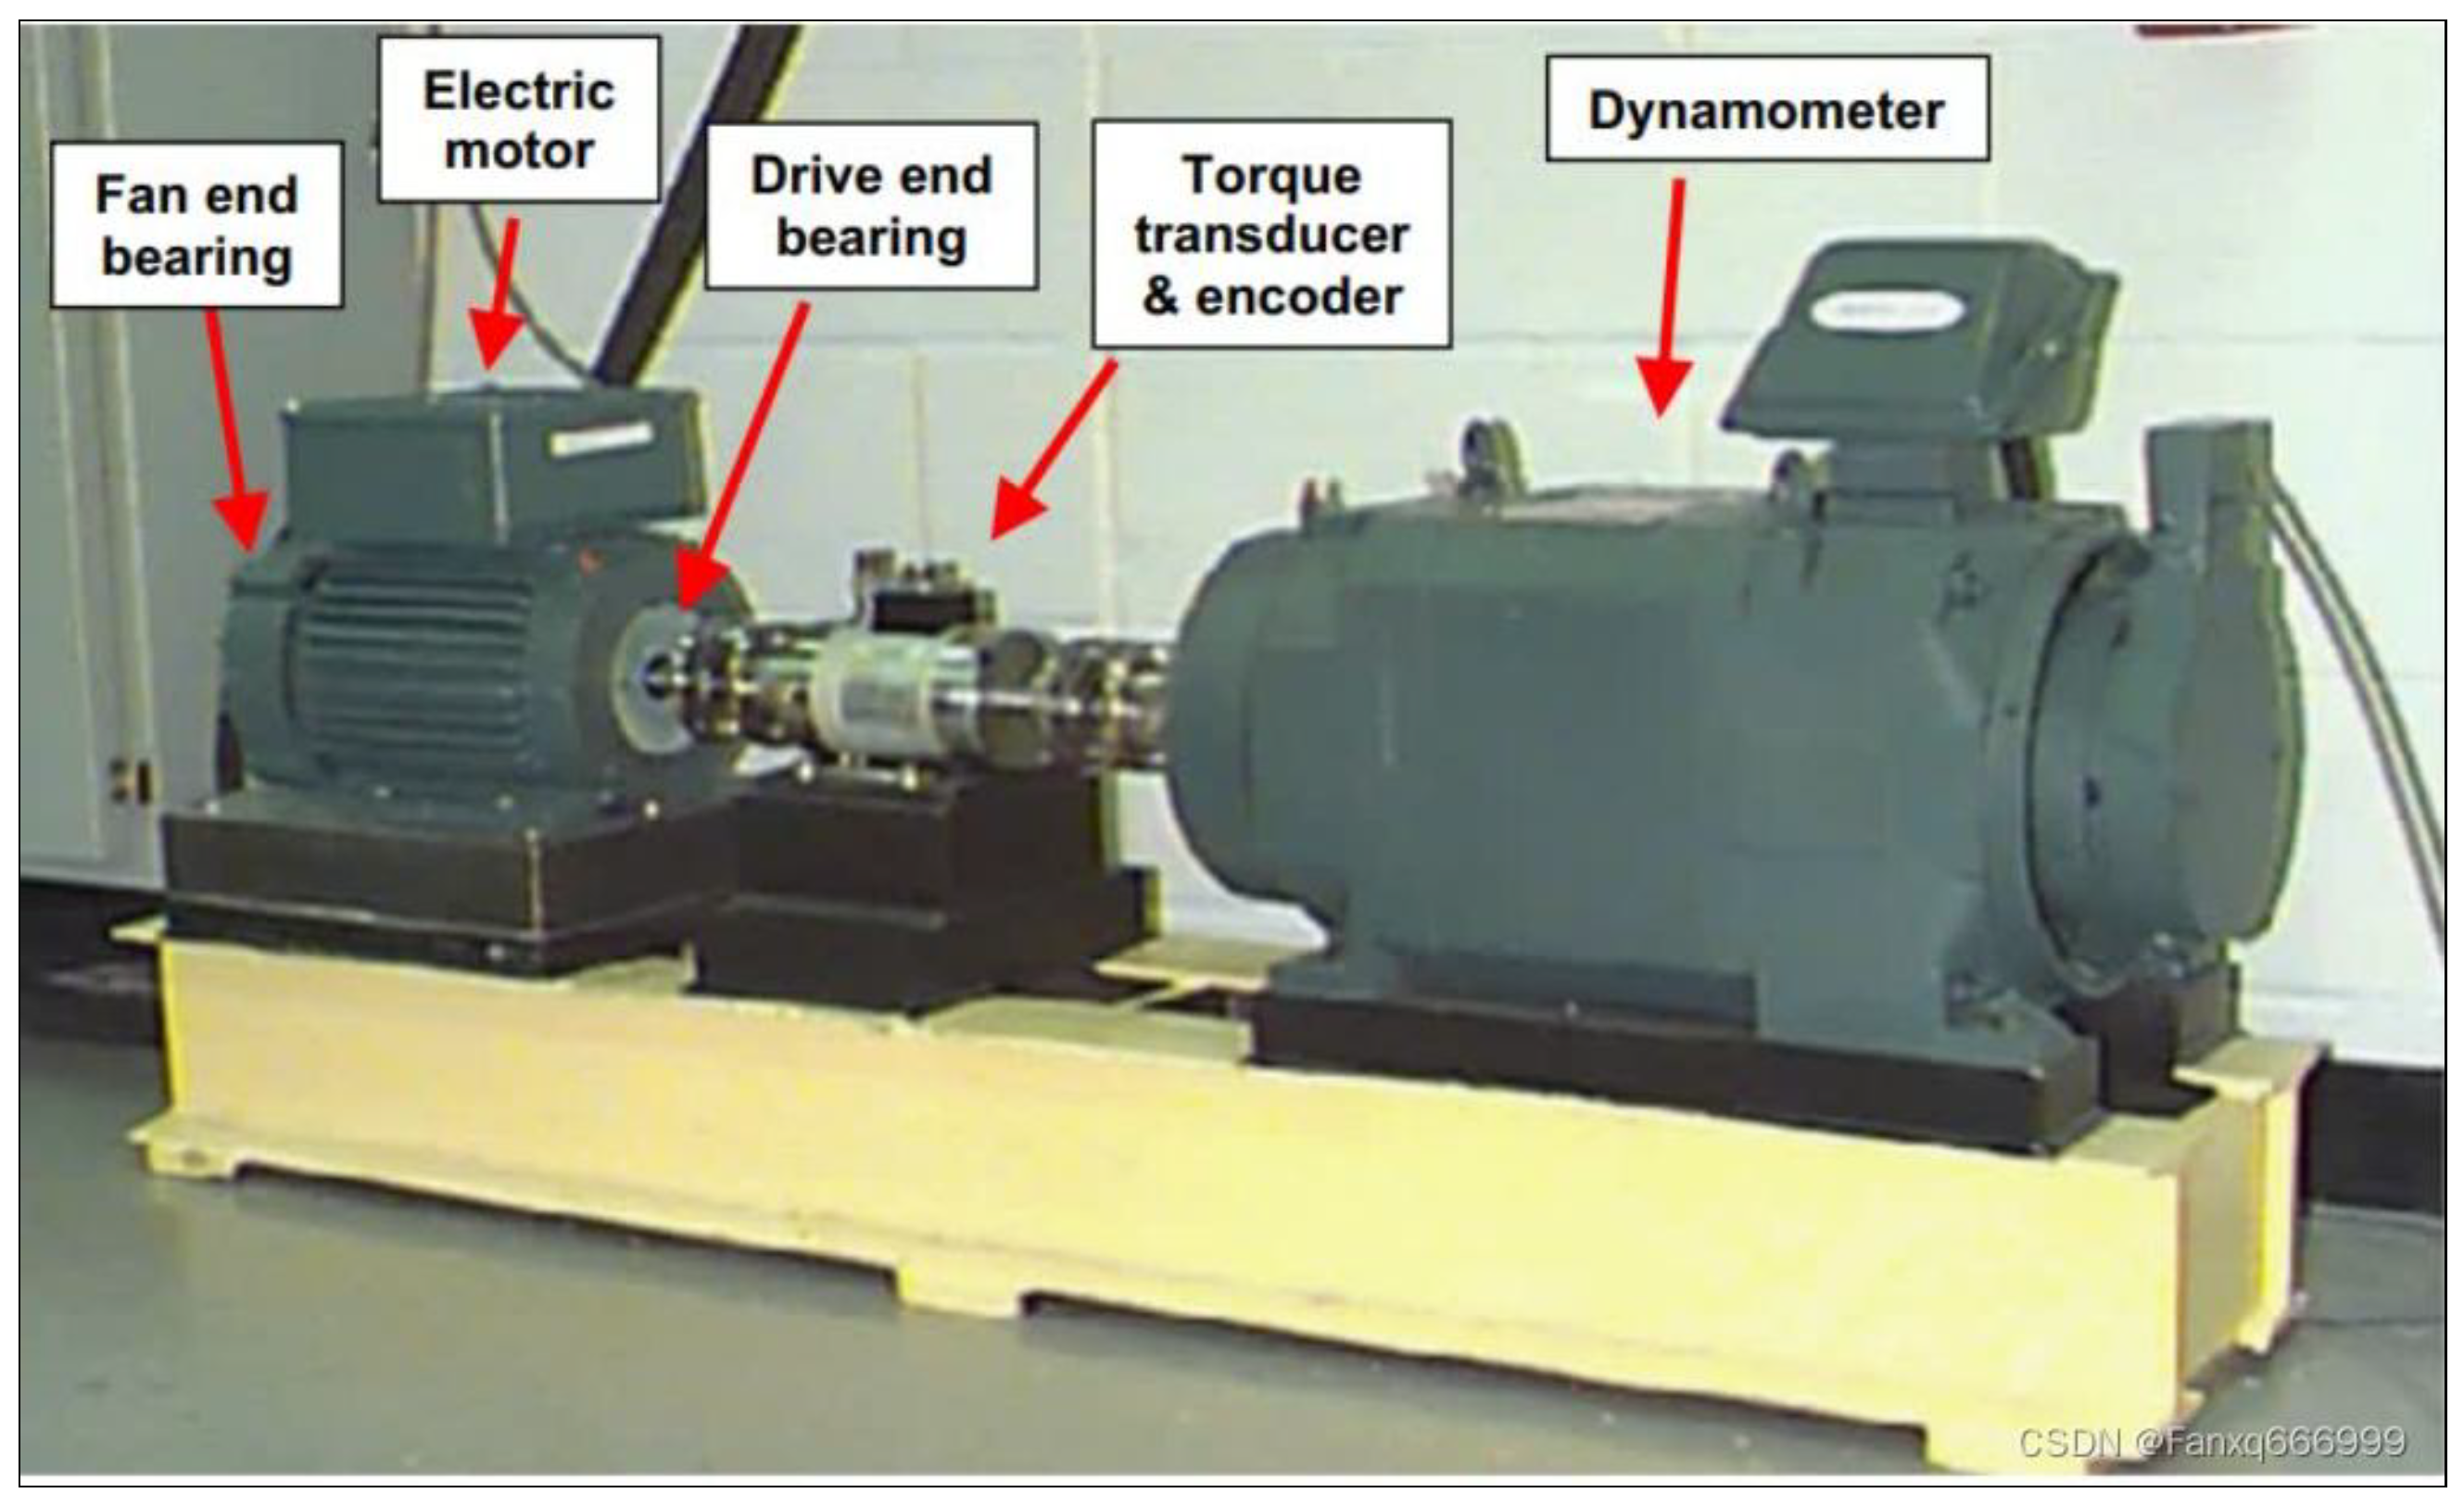
This paper selects the bearing troubleshooting data from the experiments conducted by Case Western Reserve University [29] for example analysis. In the experiment, a two-horsepower motor drives a 6205-2RS JEMSKF bearing, and the experimental setup includes auxiliary equipment such as torque sensors, electronic control equipment, and power meters. The experimental equipment is shown in Figure 5; the equations for calculating the fault frequencies of each bearing element are as follows; and the reference information for using the bearings is shown in Table 1.
f i = n 2 1 + d D c cos α f r
f o = n 2 1 d D c cos α f r
f b = D c d 1 d D c cos α 2 f r
where n is the number of bearing balls; d is the diameter of the rolling element; D c is the pitch circle diameter; α is the contact angle; f i is the inner ring fault characteristic frequency; f o is the outer ring fault characteristic frequency; f b is the rolling element fault characteristic frequency; and f r is the bearing rotational frequency.

3.2. Experimental Results and Analysis

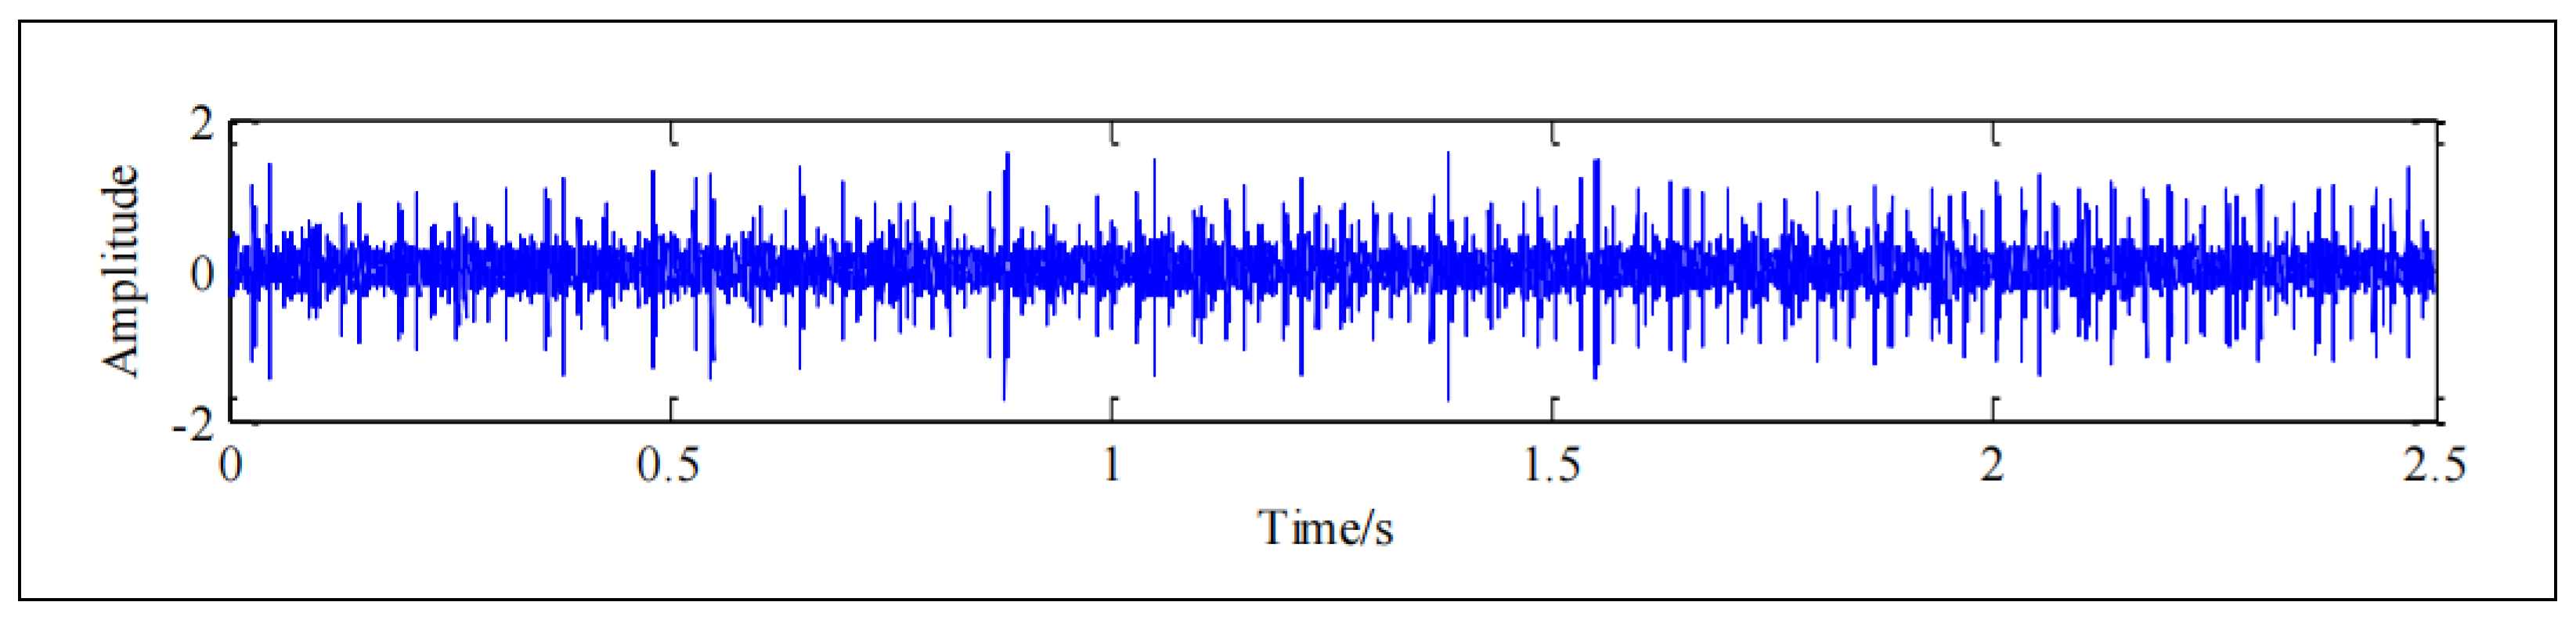
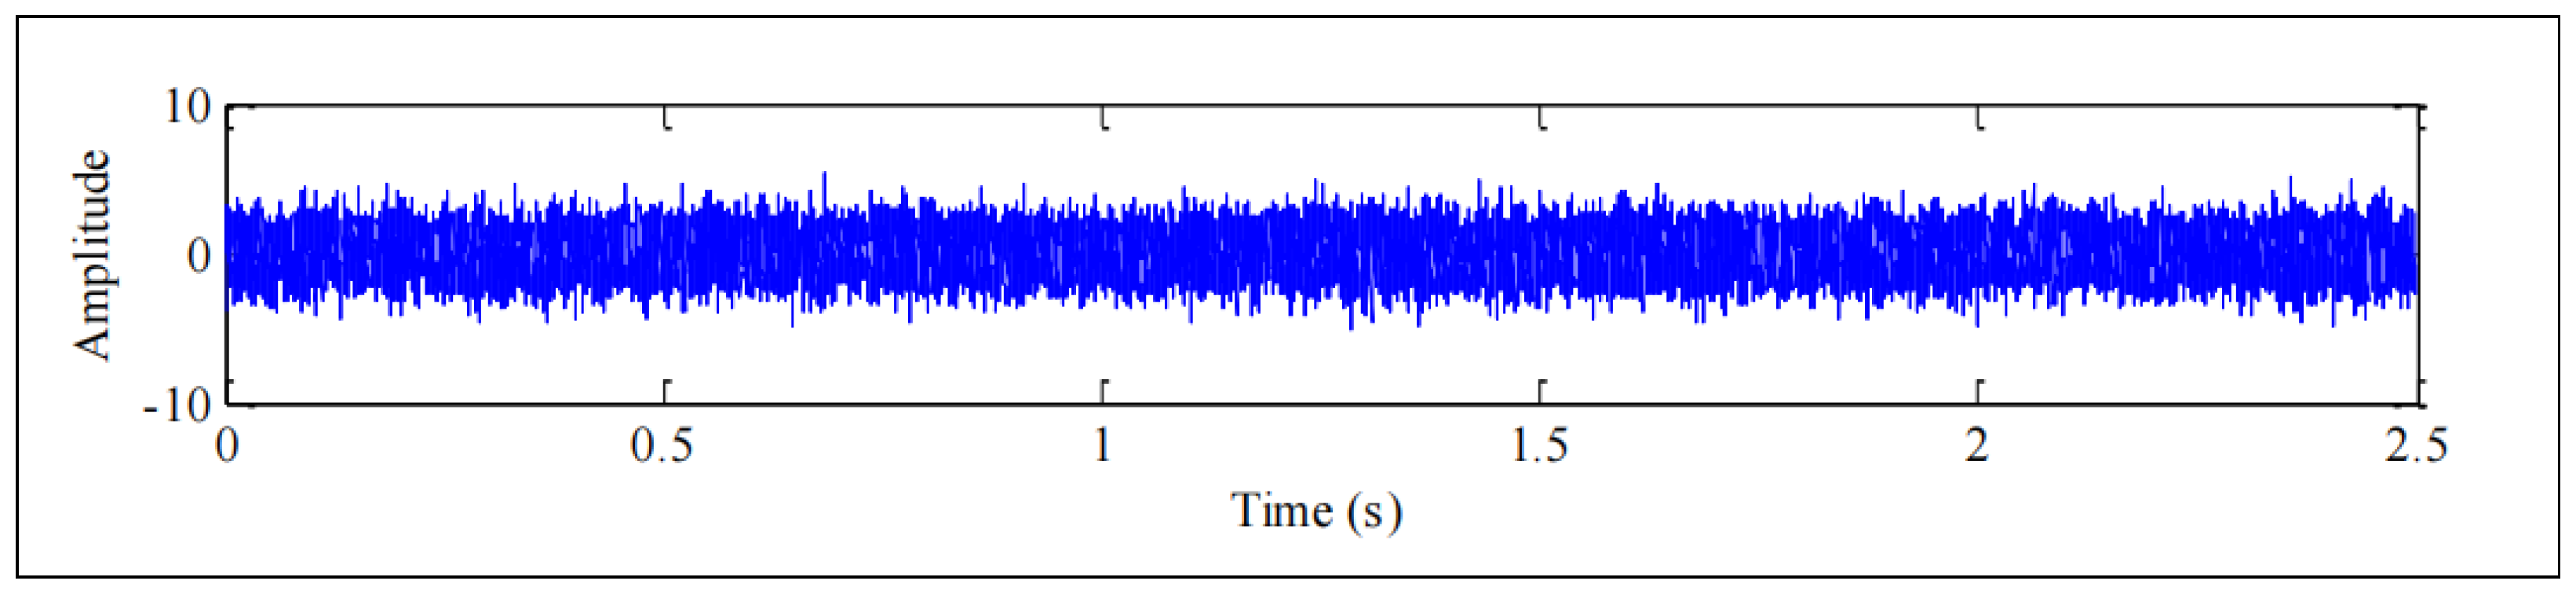
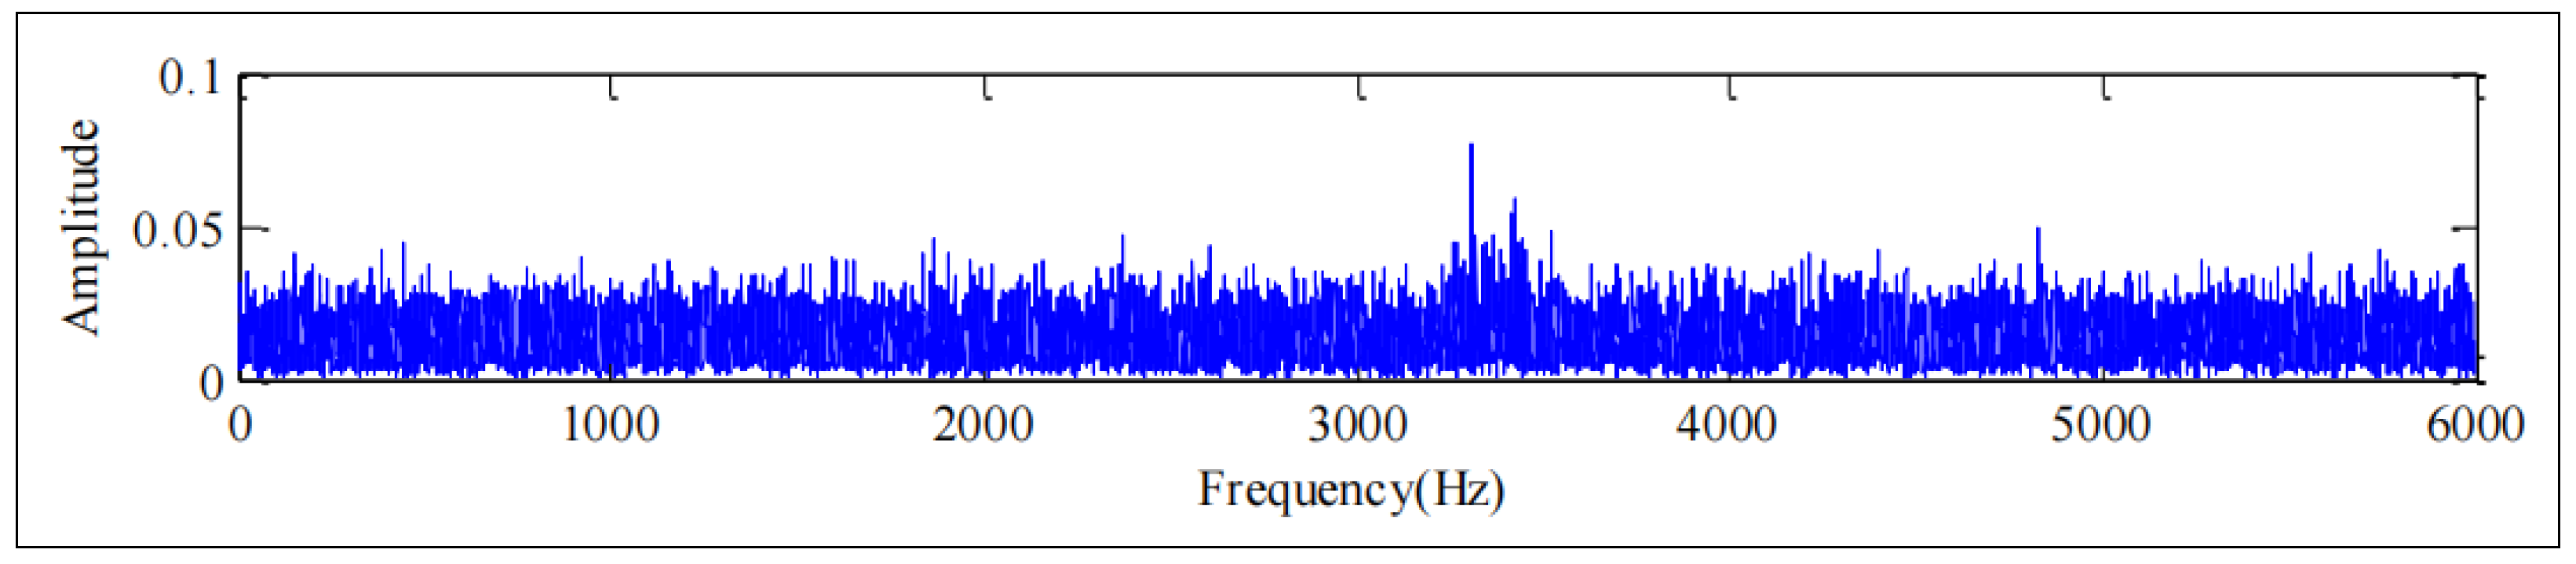
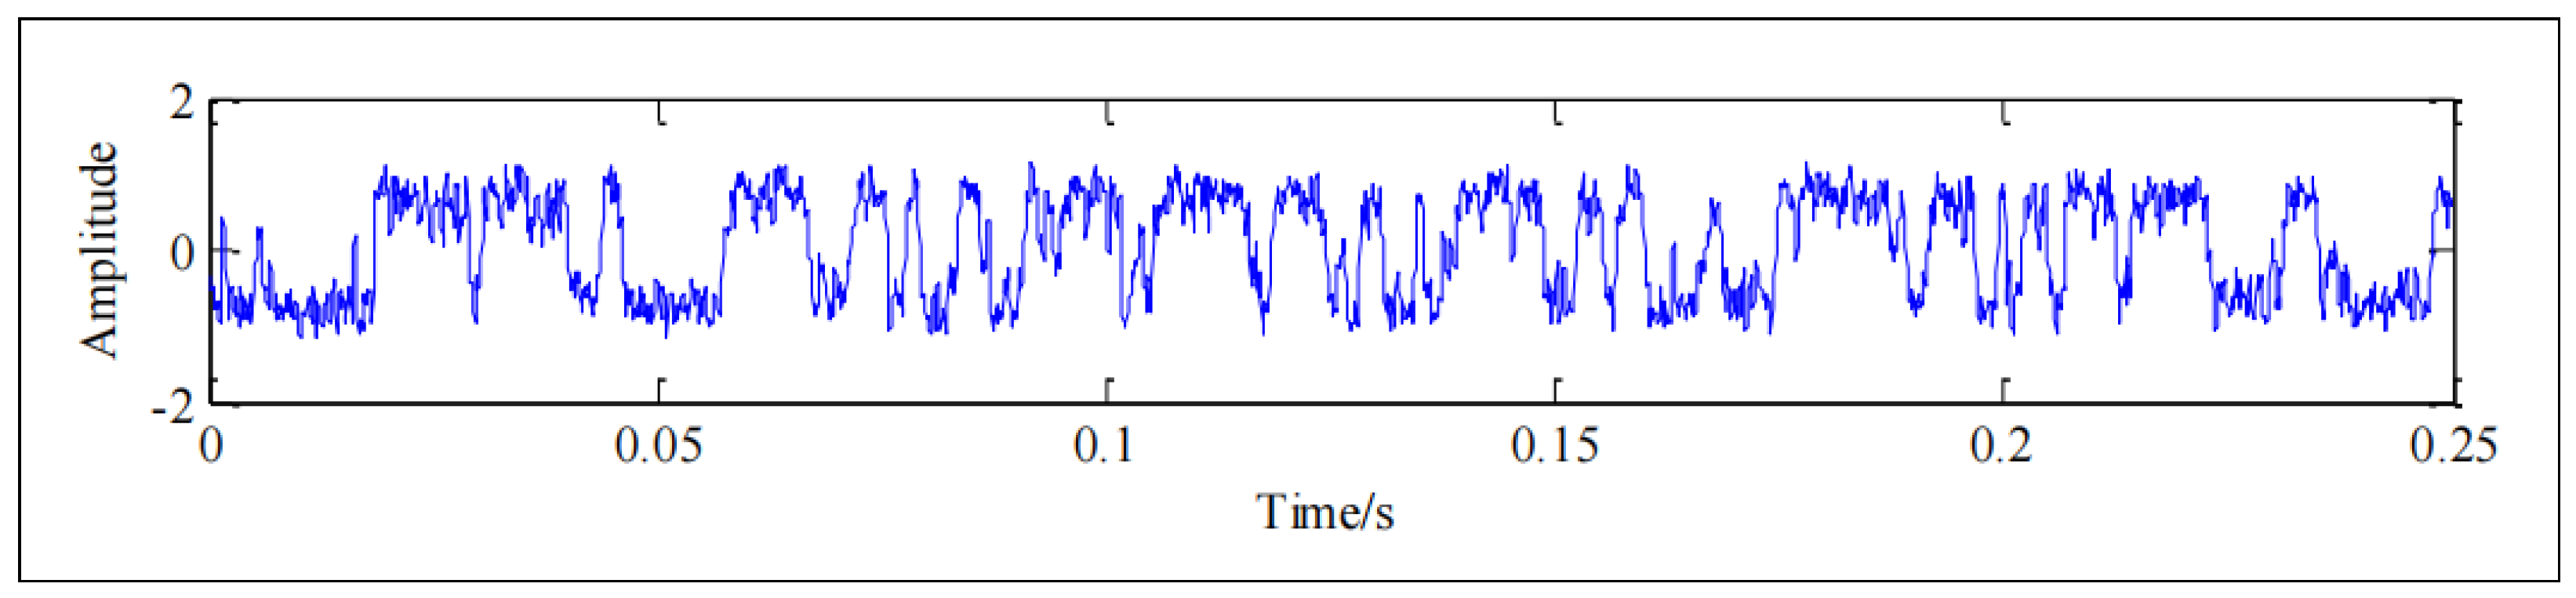
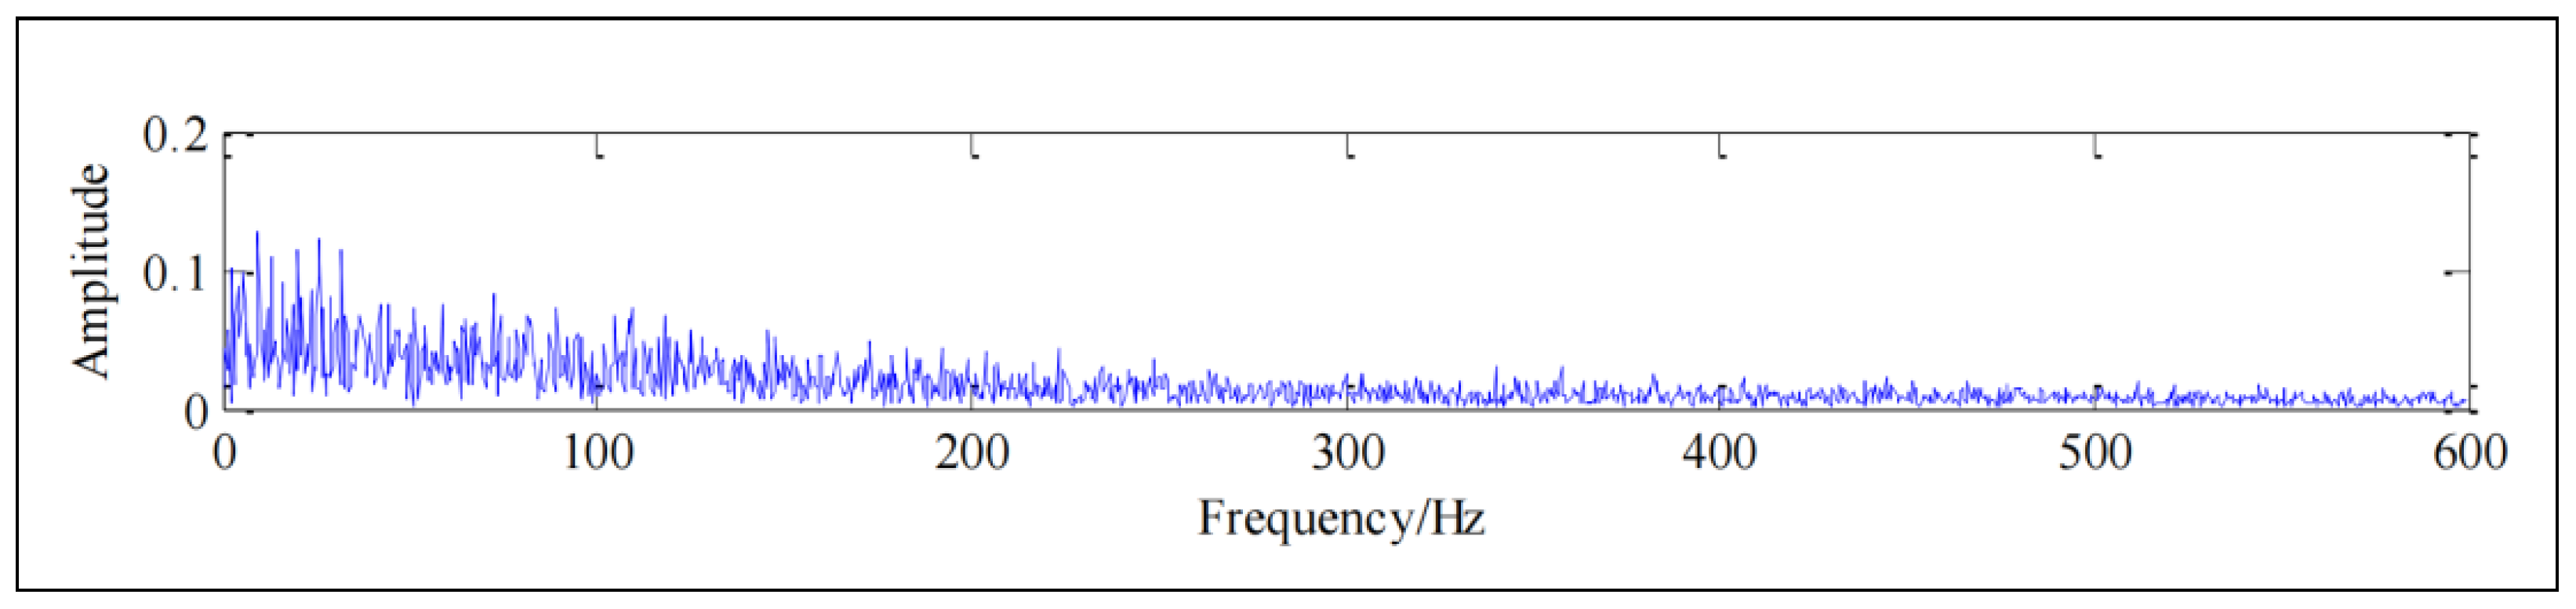
The BSR model is essentially a nonlinear stochastic equation. Therefore, in this paper, an improved fourth-order Runge–Kutta algorithm is employed to solve the BSR problem. During the test, the motor shaft was supported by a bearing with motor load = 0 and the motor speed was set at 1797 rpm. A single-point failure of 0.1778 cm was created on the bearing using electrical discharge machining. The outer raceway faults were located at the 3 o’clock position, and the sampling frequency was set at 12 kHz, the number of sampling points is 30,000, and the fault eigenfrequency is 107.6 Hz. The original waveform and time-domain diagram of the signal after noise addition are presented in Figure 6 and Figure 7, and the spectrum of the signal after noise addition is shown in Figure 8.
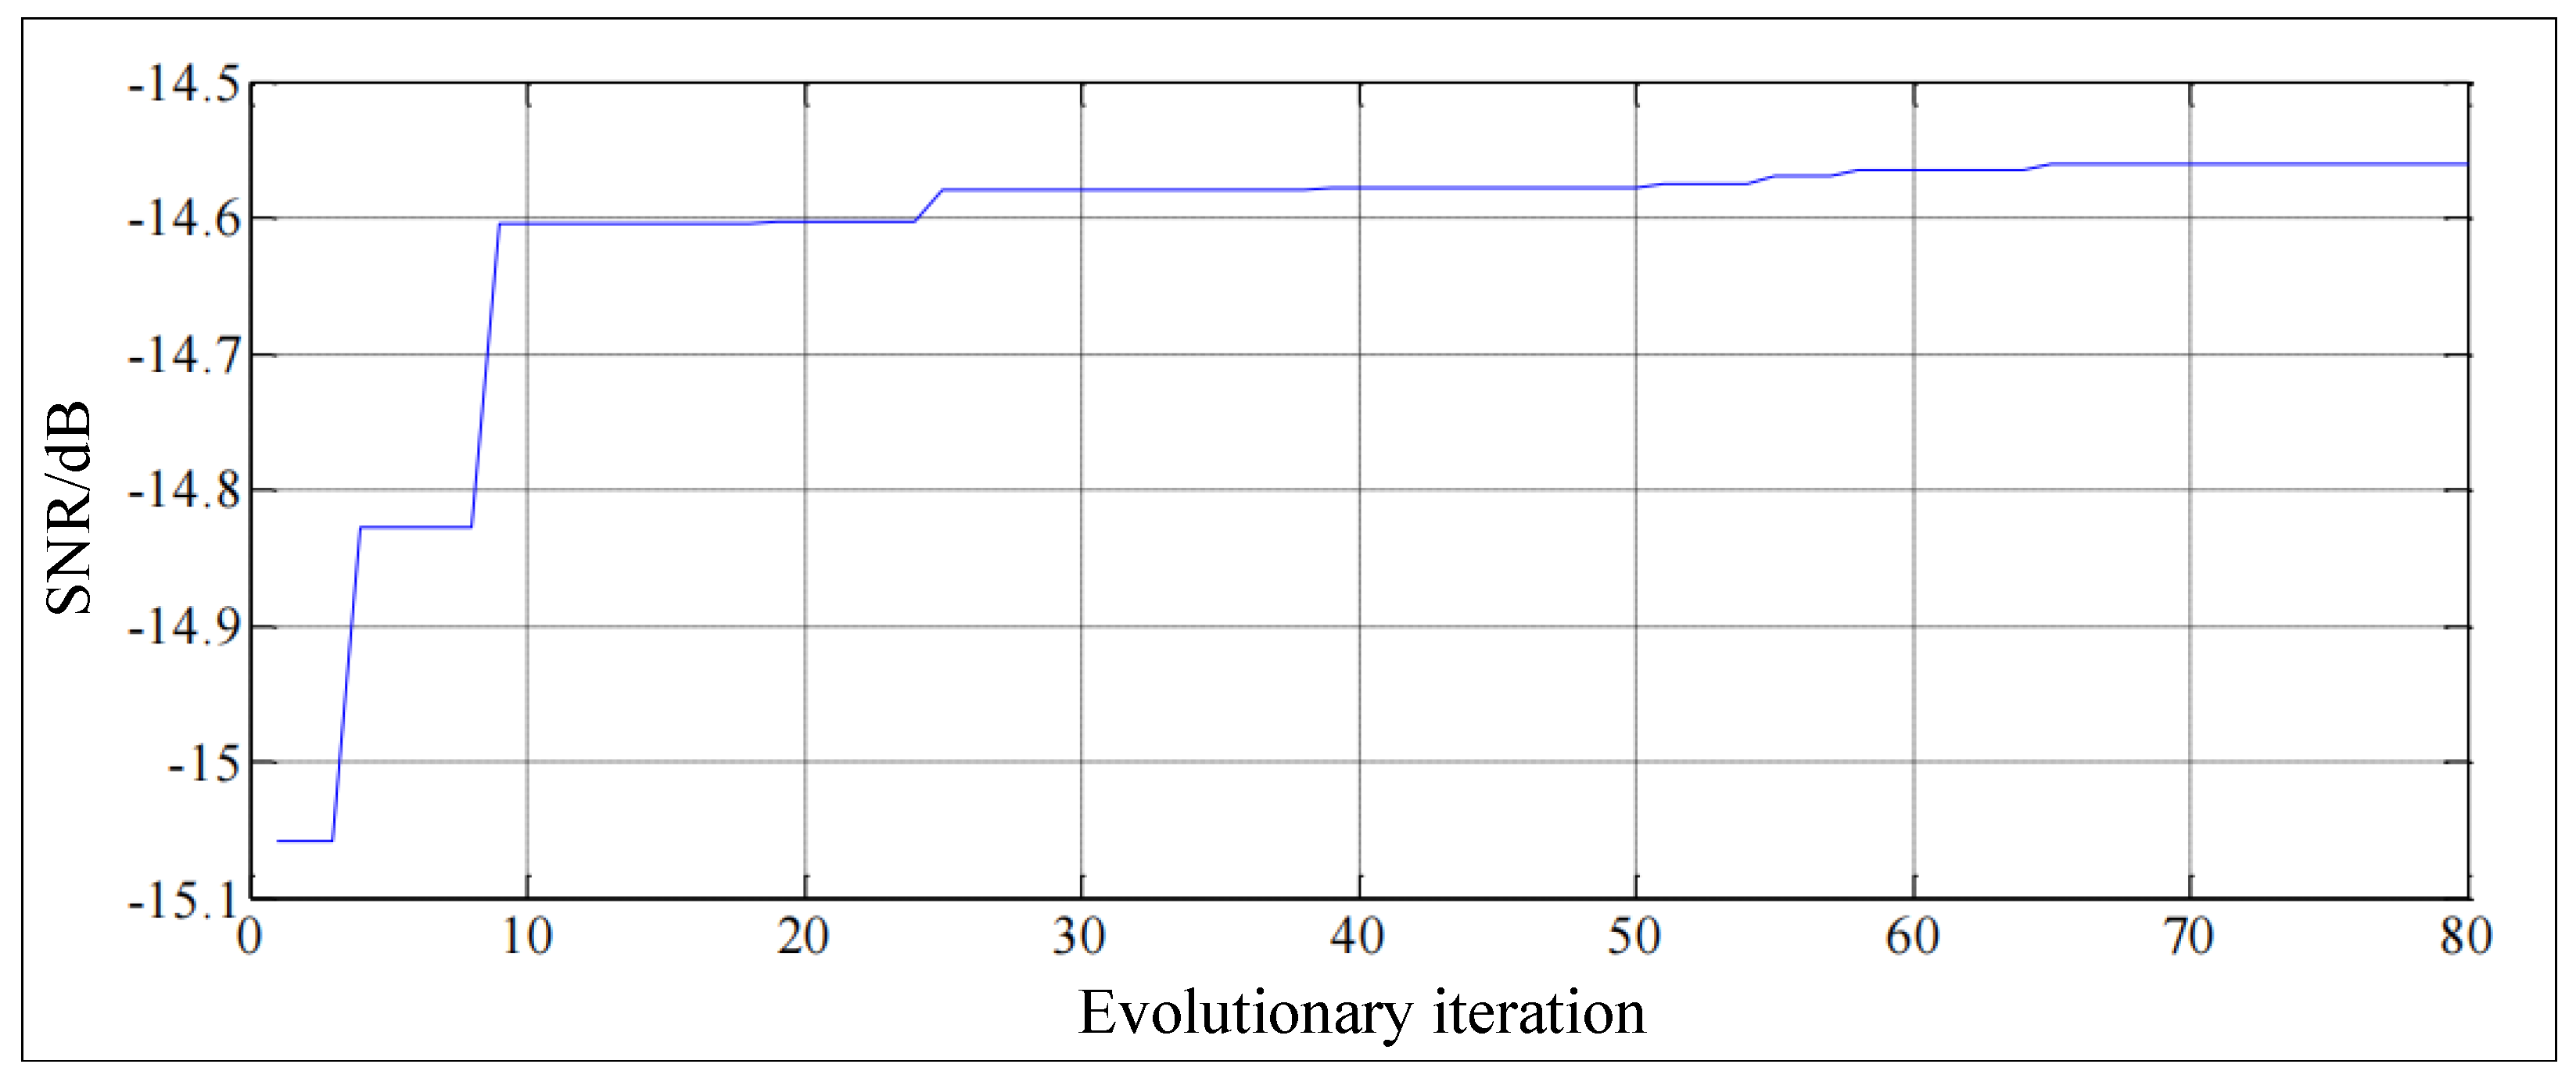
As observed in Figure 7 and Figure 8, the fault features are completely masked by strong background noise in both the time domain and frequency spectrum, making direct extraction impossible. Therefore, there is a need for more processing of this signal. From Table 1, it can be calculated that the target frequency of the bearing is 107.6 Hz. Since the SR system is required to satisfy the small-parameter condition, the variable scale compression rate R was set to 2500. Then the target frequency is compressed to 107.6 / 2500 = 0.043 Hz after pre-processing, which meets the demand of small parameters. The Figure 9 shows the particle swarm algorithm’s adaptive optimization of the system parameters results in a = 1.5244 and b = 1.796 .
Substitution of the optimal system parameters for the SR solution yields Figure 10 and Figure 11, which show the output time-domain waveforms of the noise-added signals and their frequency spectra, respectively, after processing by the SR system.
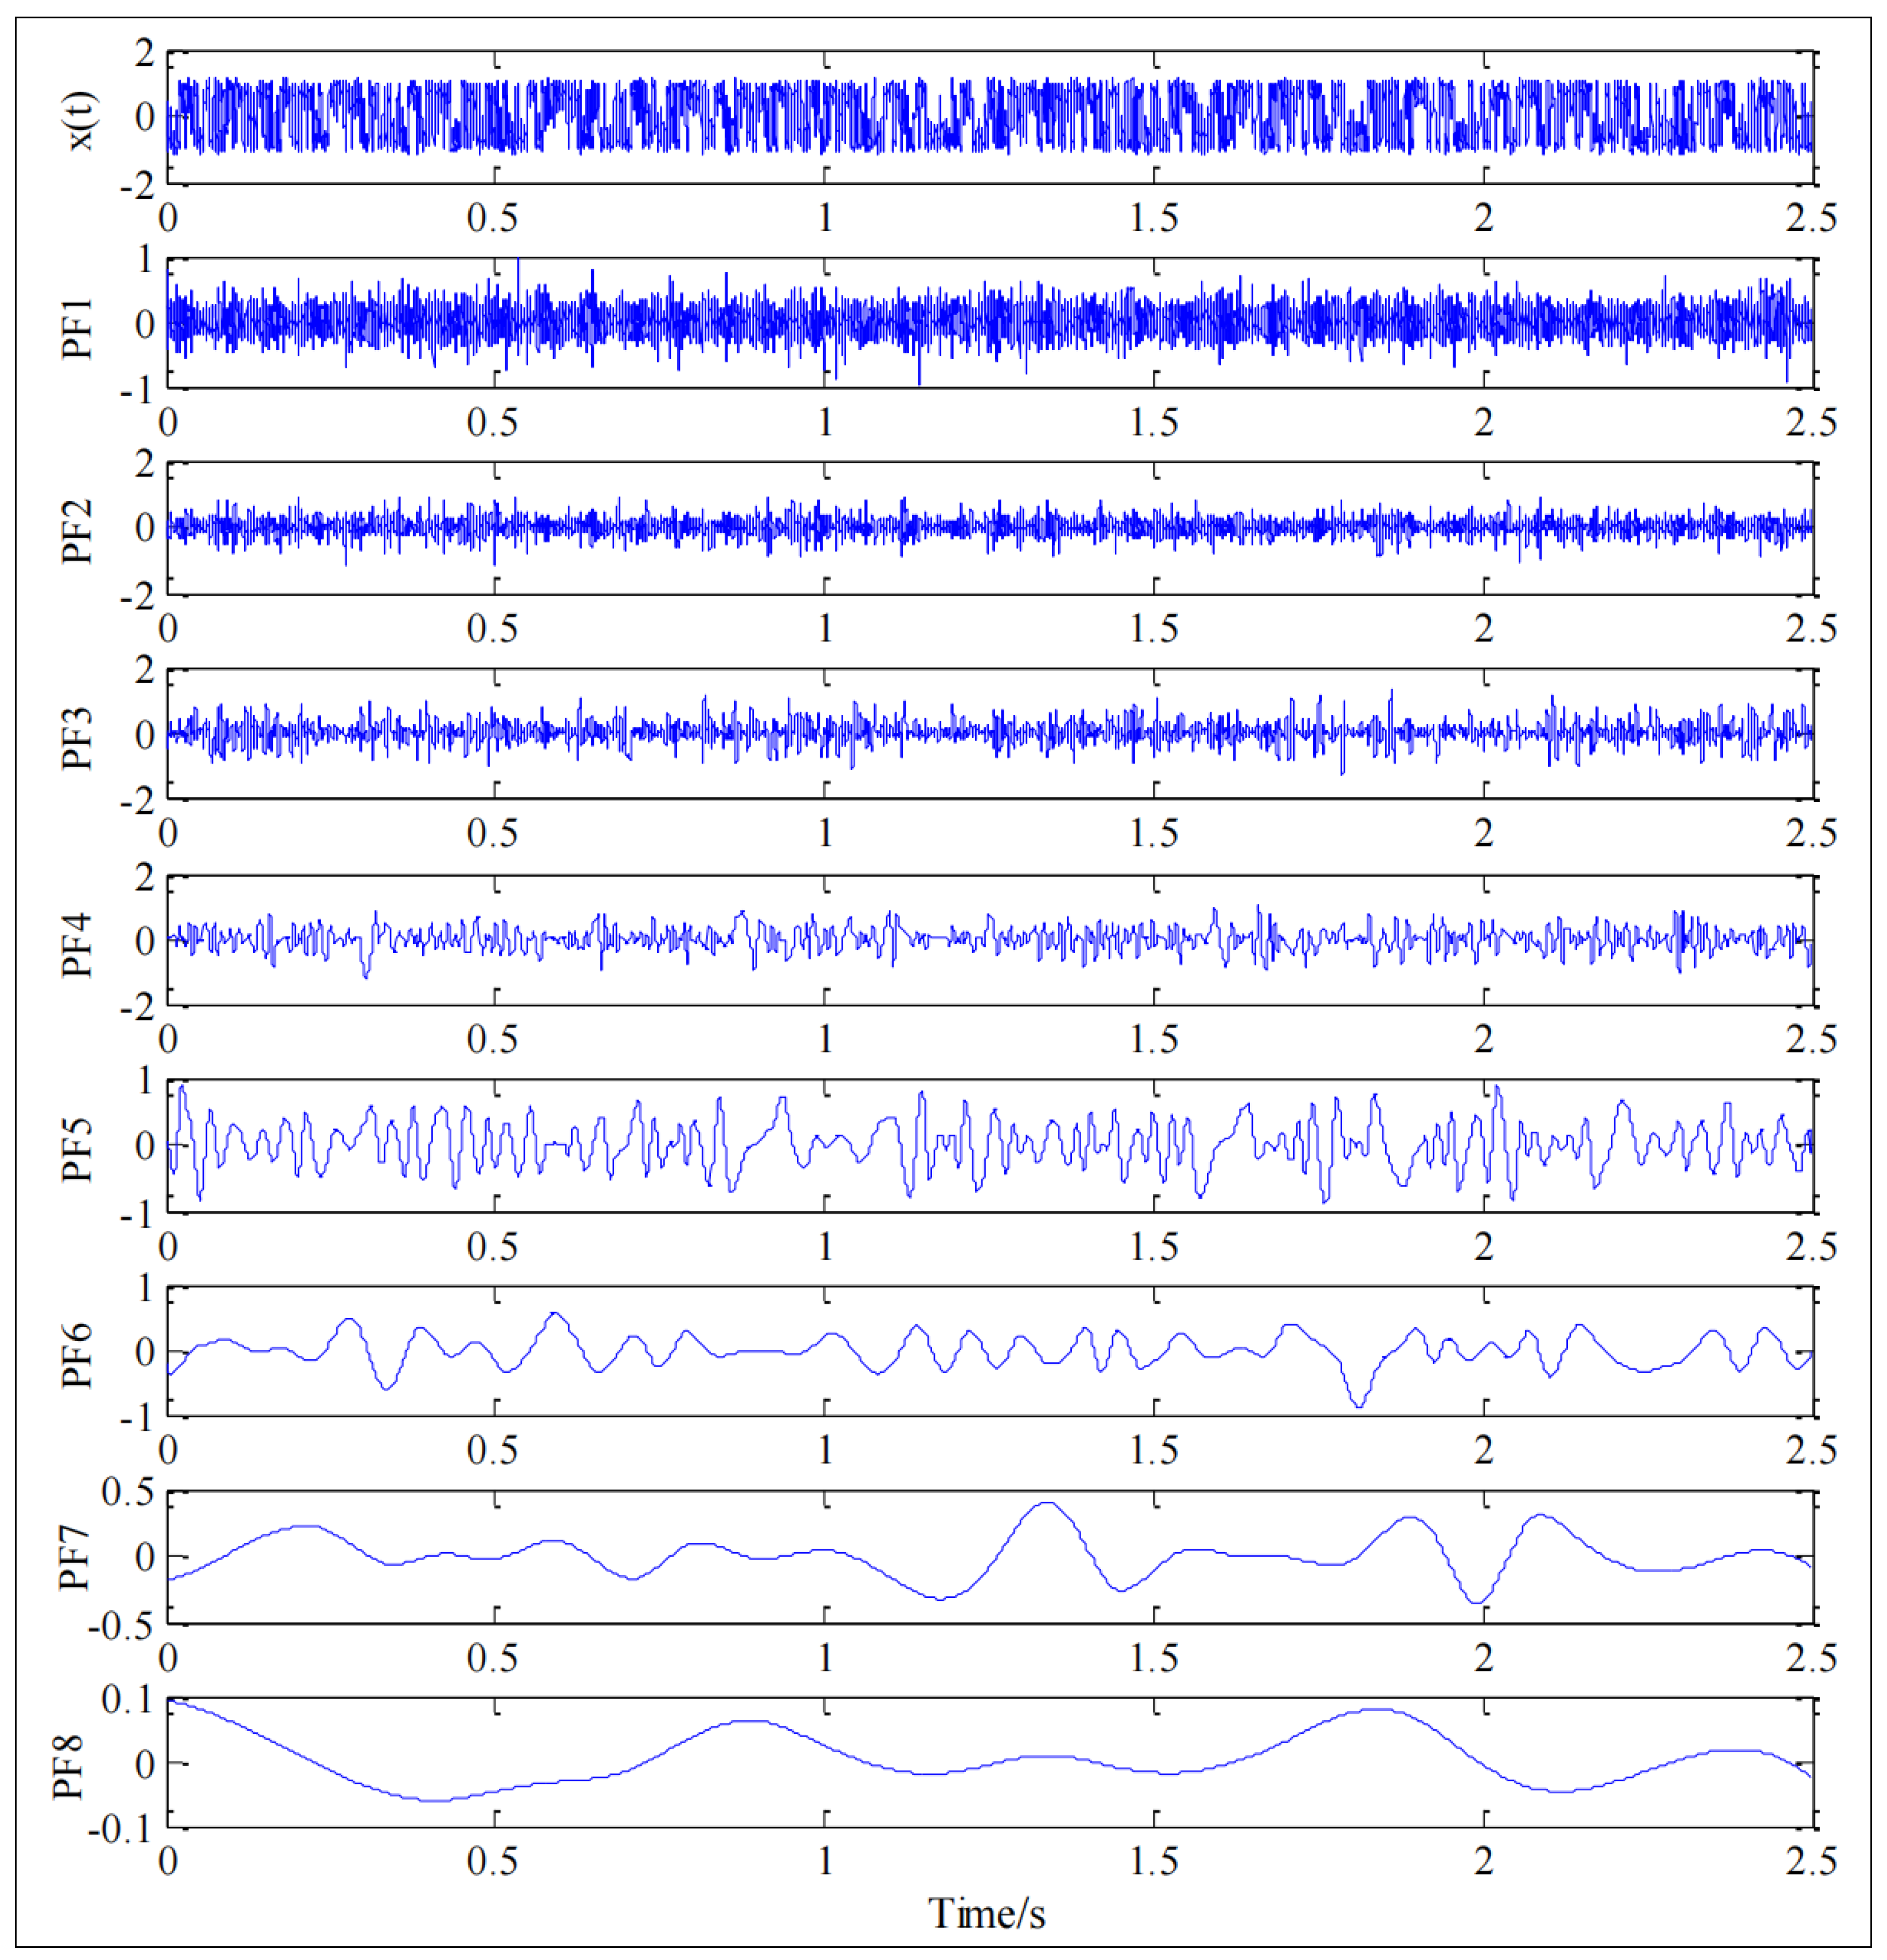
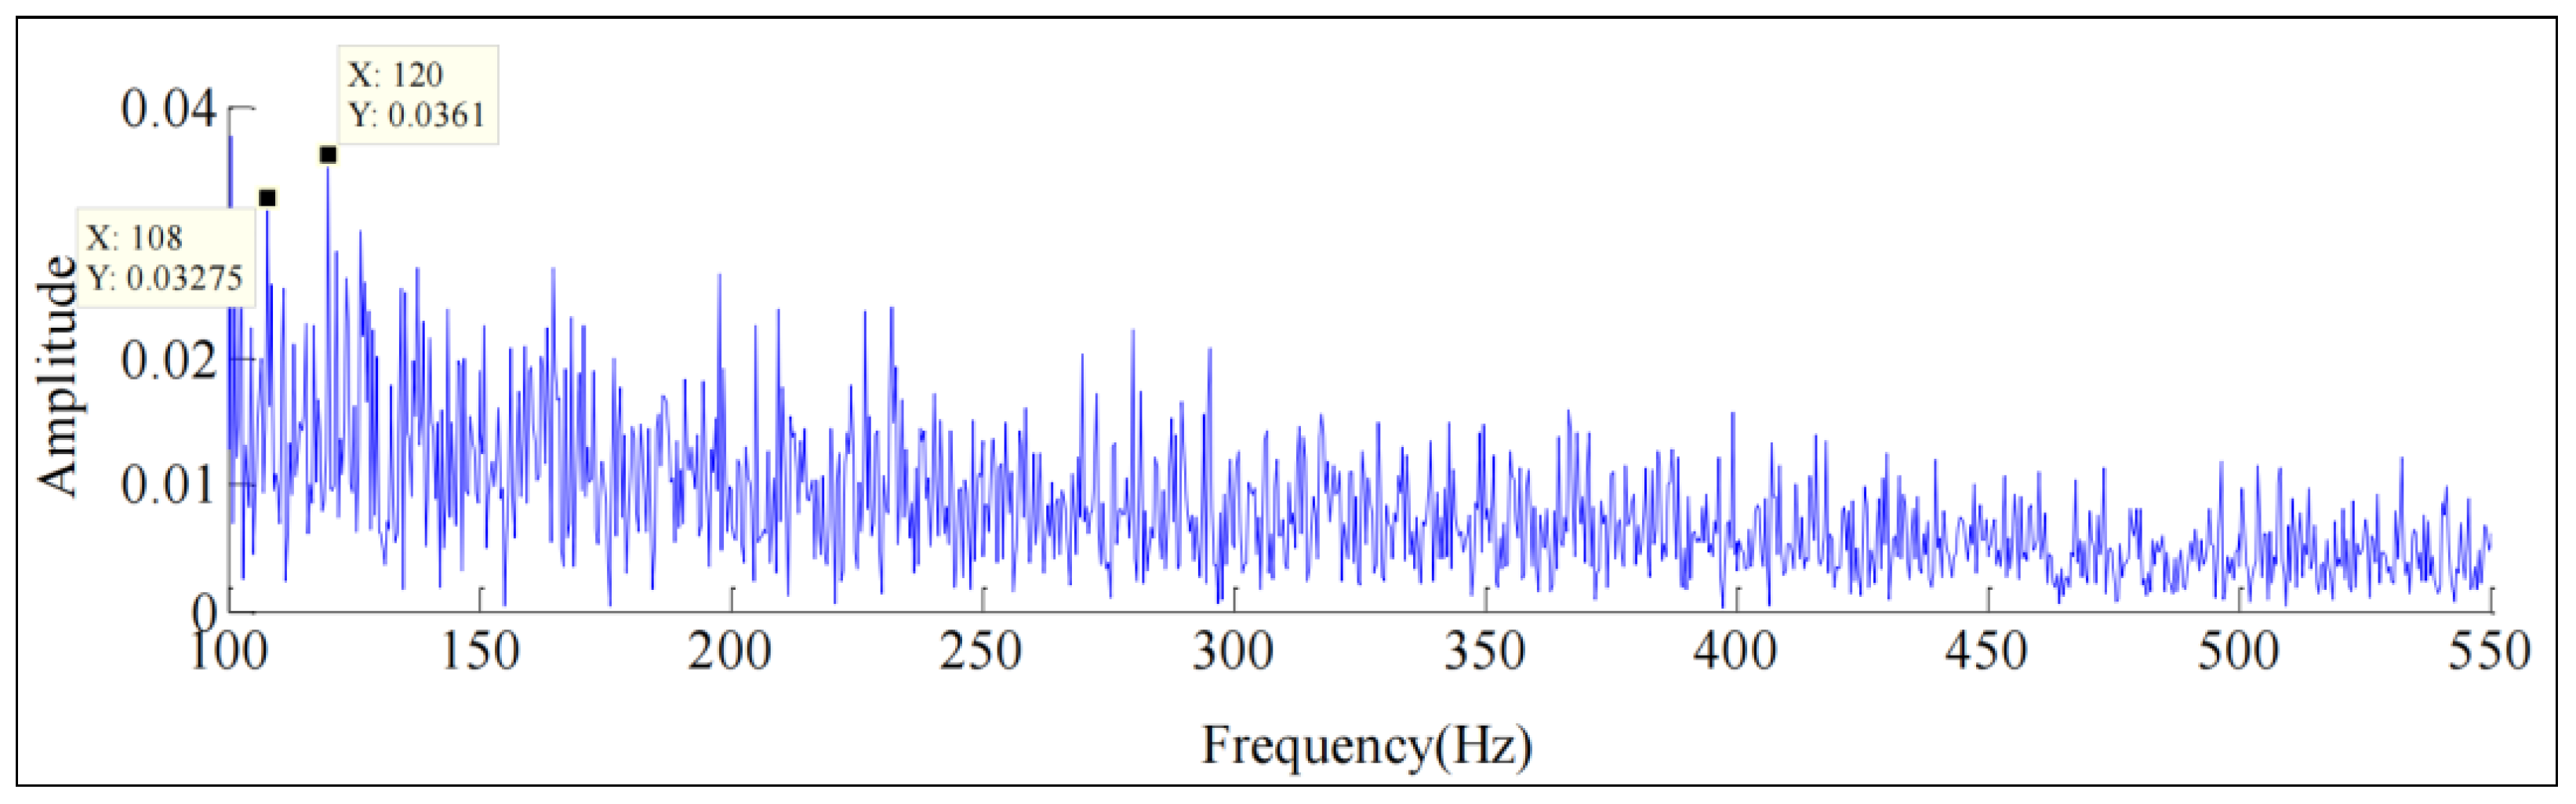
LMD analysis is performed on the output signal to obtain seven PF components and a residual. The reconstruction process involves selecting the first four components that have a higher correlation with the original signal and performing envelope spectral analysis. The characteristic frequencies of 120 Hz and 107.6 Hz can be extracted from it, in which 120 Hz is 4 times the rotational frequency. The theoretical failure characteristic frequency of the bearing outer ring is 107.6 Hz, and the feature frequency of 108 Hz can be efficiently extracted using this method. Envelope spectrum analysis revealed a fault frequency of 108 Hz. Compared to the theoretical outer ring fault frequency of 107.6 Hz, the relative error is less than 0.3%, demonstrating the method’s high precision in identifying fault characteristics. Therefore, the envelope spectrum method proposed in this paper, which combines the SR model and LMD, can be used for rolling bearing fault analysis and diagnosis.
Taking the fault frequency of the bearing 107.6 Hz as the target frequency, the target frequency after pre-processing is reduced to 0.043 Hz by setting the variable scale compression rate R = 2500 . The parameters of the SR system are optimized by a PSO to obtain the shape parameters of the regulated potential wells a = 1.5244 and b = 1.796 . To solve and obtain the output signal, the optimal system parameters are substituted into the modified SR. The LMD of the output signal is performed, and the first four components with higher correlation with the original signal are selected for reconstruction. The decomposed signal and the reconstructed signal after LMD decomposition are shown in Figure 12 and Figure 13, respectively. After analyzing the envelope spectrum, the outer ring of the bearing’s fault frequency was extracted to be 108 Hz, with an error within three thousandths of a degree. The envelope spectrum analysis results are shown in Figure 14. This method can effectively determine error frequencies and identify error characteristics. Therefore, bearing fault analysis and diagnosis can be carried out using the proposed envelope spectrum method of the SR model combined with LMD in this study.
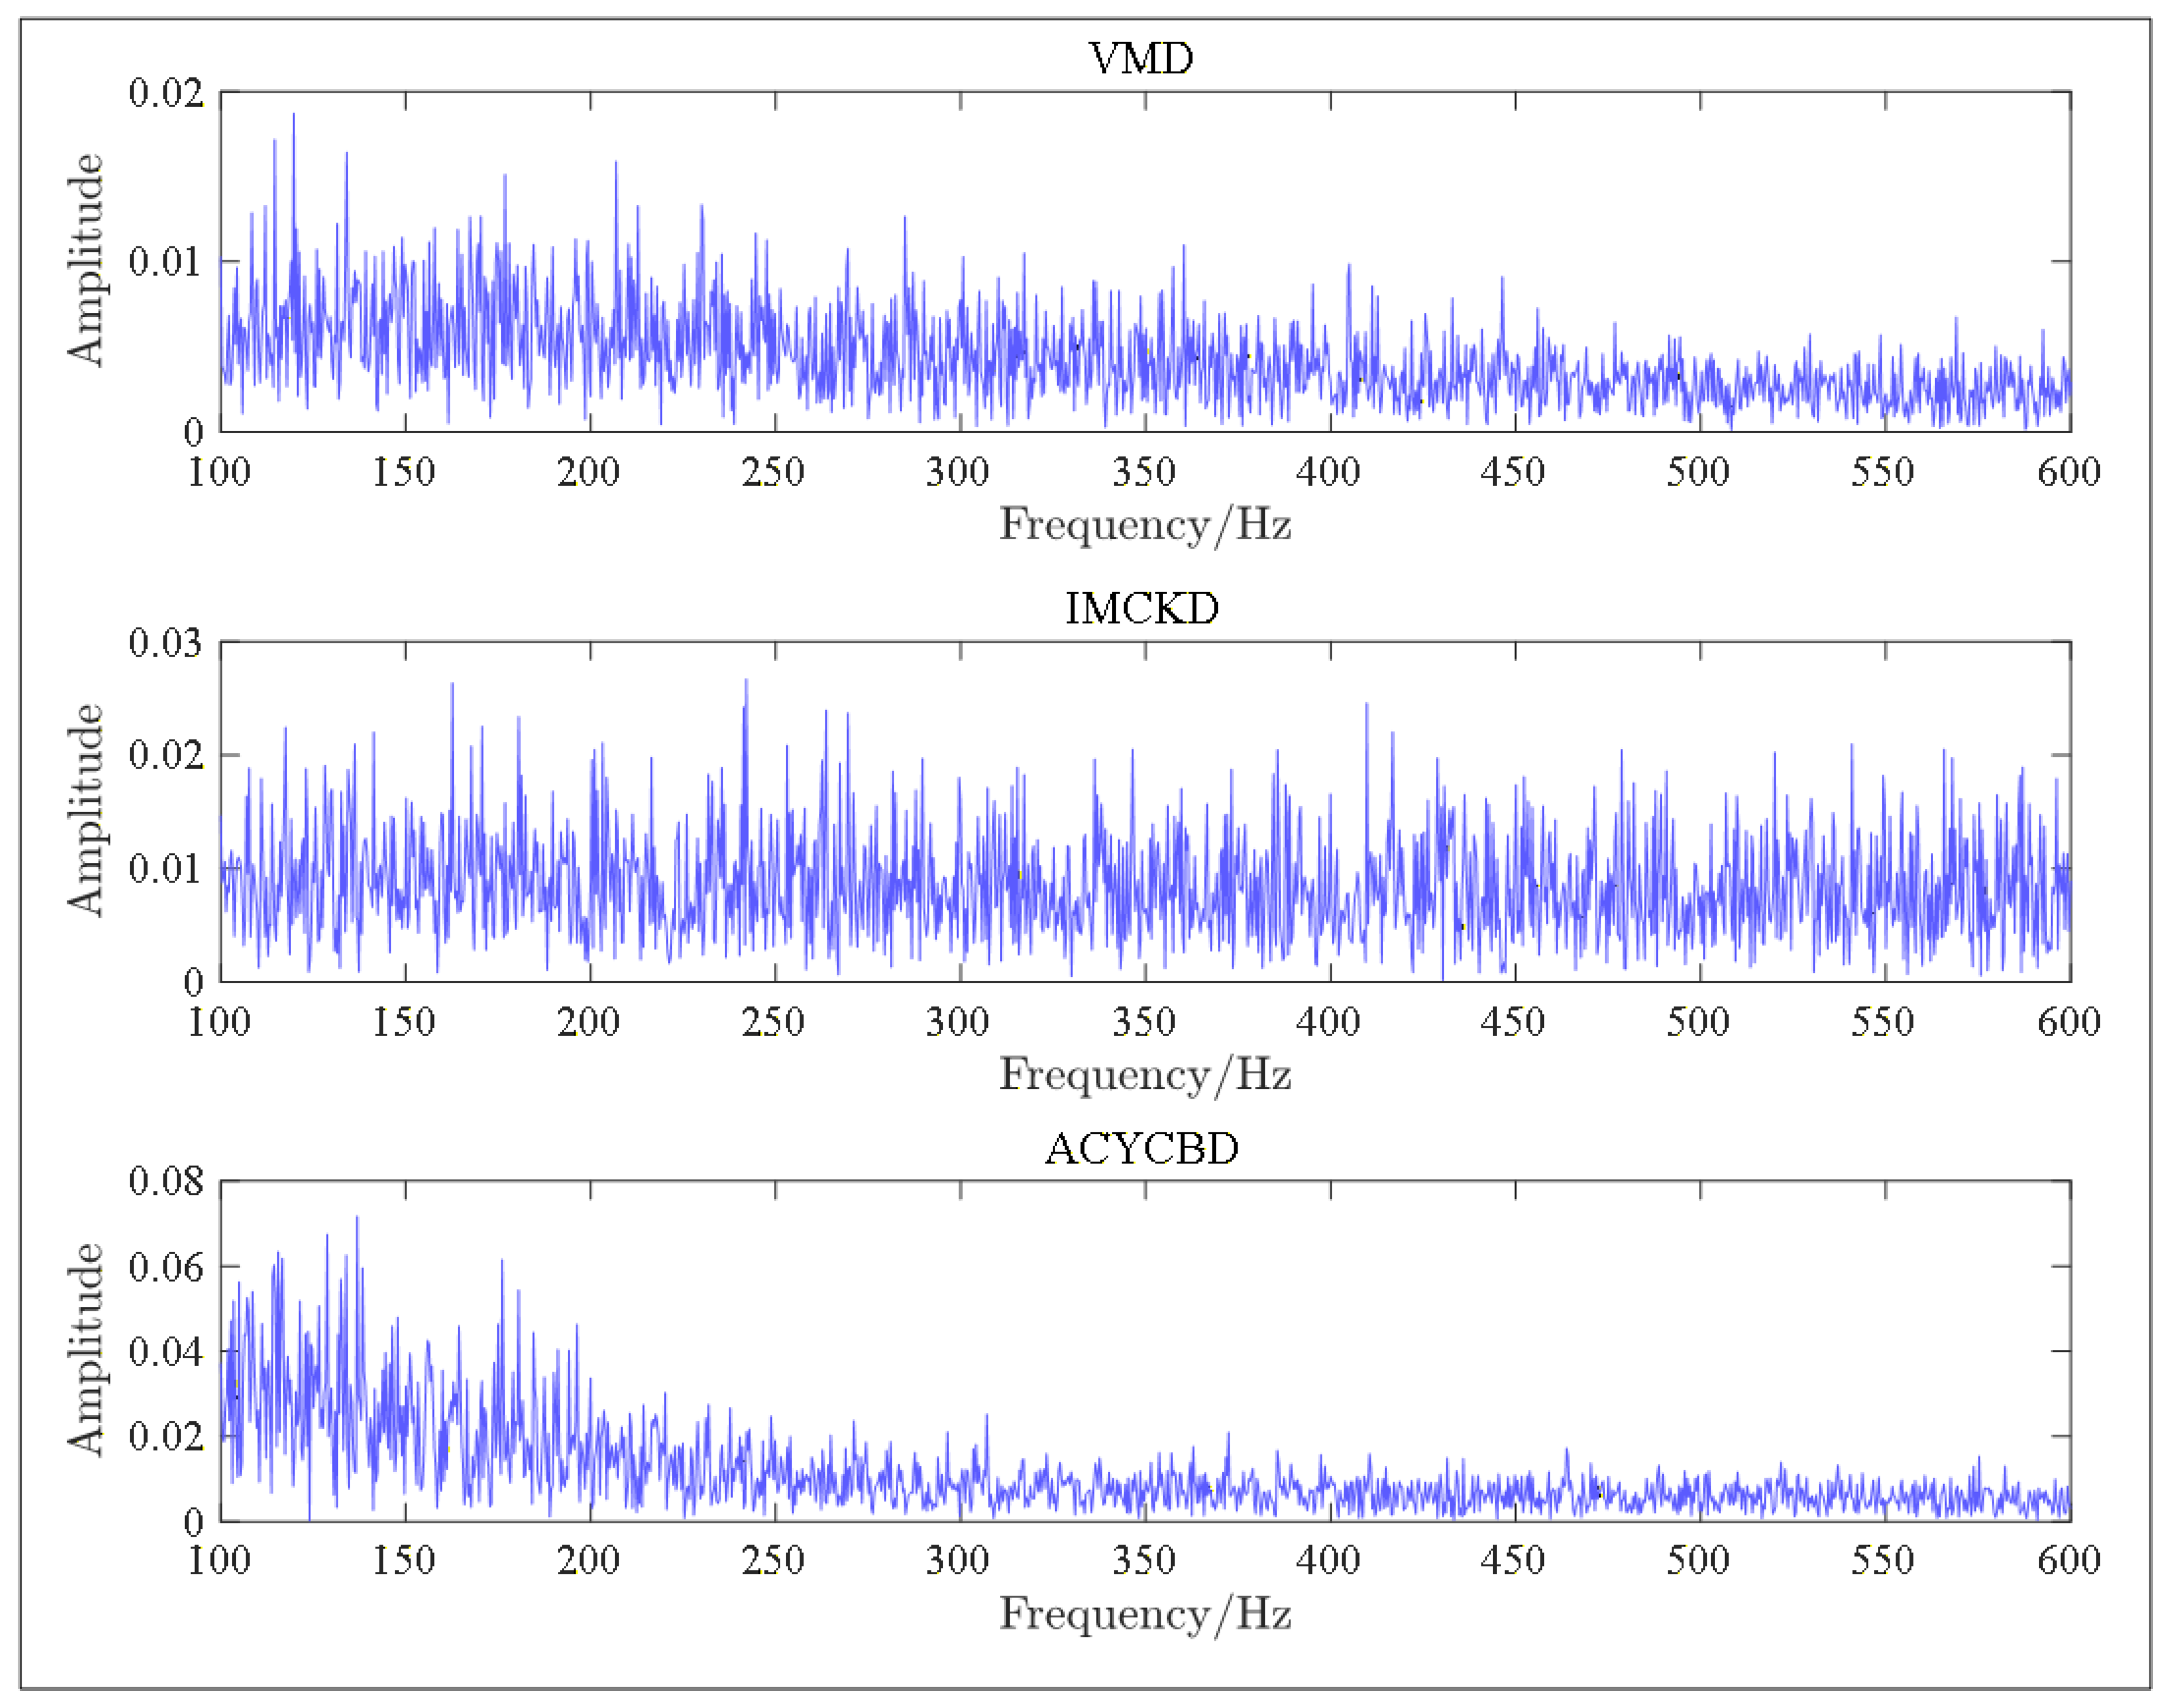
To further validate the superiority of the proposed method, VMD, improved maximum correlated kurtosis deconvolution (IMCKD) [30], and adaptive maximum second-order cyclostationarity blind deconvolution (ACYCBD) [31] are adopted to process the outer ring fault signals, with their results compared against those of the proposed method. The parameters of the VMD method are optimized by the PSO, and the optimal parameter combination [ n , α ] is ultimately determined as [ 6 , 2400 ] . For the IMCKD and ACYCBD methods, the recommended parameter settings in their original studies are adopted directly. None of these three methods can extract the characteristic frequencies of the outer ring fault, which demonstrates the superiority of the method proposed in this paper. The processing results of different methods are shown in Figure 15.
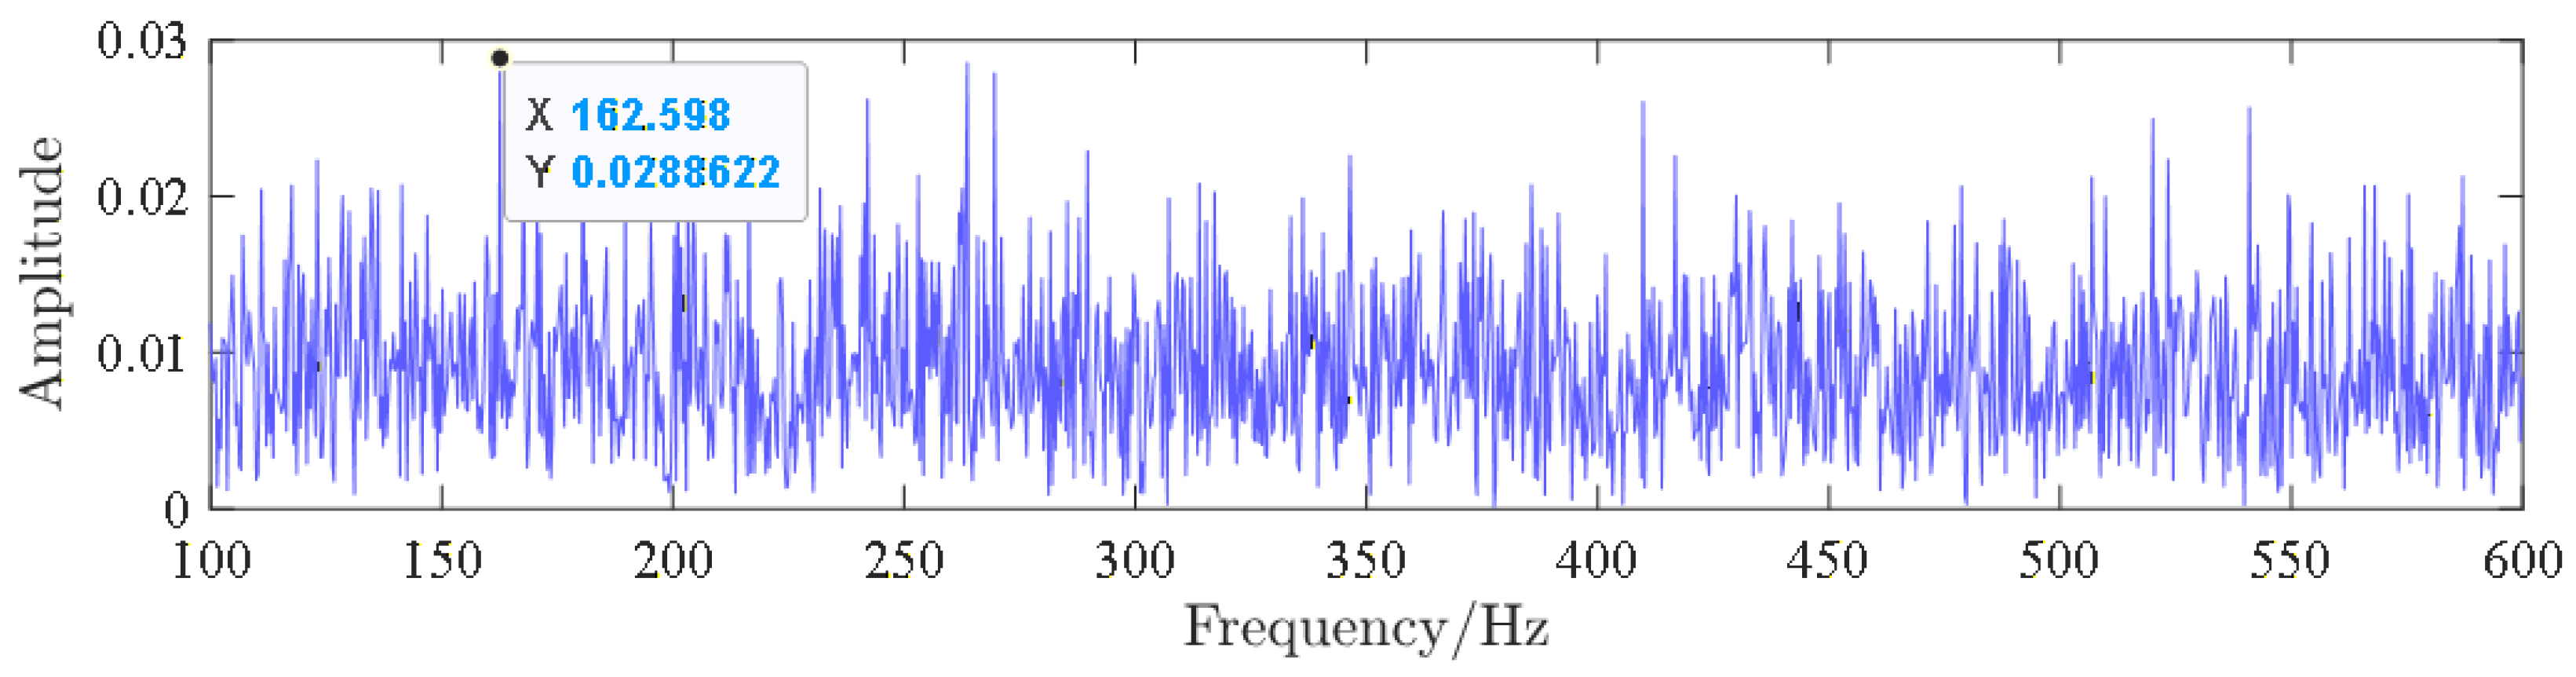
To emphasize the practicality in engineering applications, we selected the inner-race fault data from the Case Western Reserve University bearing dataset, with a motor speed of 1772 rpm and a motor load of 1 HP. The theoretical inner ring fault frequency is 159.9 Hz. Gaussian white noise was added to the fault signal, and the proposed method was applied to process the noisy signal. As shown in the Figure 16, the inner ring fault frequency was successfully extracted.

4. Conclusions

This paper proposed an enhanced envelope spectroscopy method to bridge the gap between theoretical stochastic resonance and practical bearing fault diagnosis. The primary contribution is the development of a variable-scale adaptive framework that successfully overcomes the adiabatic approximation limit and the parameter selection subjectivity. The parameter settings of this system were optimized precisely by means of PSO. The SNR function is used to analyze the influence of each parameter on the SR phenomenon of the system. Adjusting the shape parameter of the potential trap can be used to achieve optimal regulation of the potential height, and it can significantly improve the output SNR of the system, making the SR phenomenon more significant and appreciable.
To verify the accuracy of the theoretical analysis and the excellence of the performance of the proposed system, experiments were conducted using actual bearing signals from Case Western Reserve University, and the final results show that the improved adaptive BSR system performs better in detecting fault signals, and it further promotes the phenomenon of SR of the system. The practicality of the proposed method is validated through experiments on publicly available datasets, and its superiority is confirmed by comparative studies with other classical methods.
However, although the system has made some progress in enhancing the SR phenomenon of the system, there is still room for improvement. Therefore, the research will focus on developing two-dimensional and asymmetric systems with superior performance as the next step. As part of our future work, we plan to test the proposed framework on other public datasets to further verify its adaptability across different machines, sensors, and degradation modes.

Author Contributions

Conceptualization, Z.W. and J.W.; methodology, Z.W.; software, J.X. and H.W.; validation, Y.P. and G.C.; investigation, Z.W.; resources, G.C.; writing—original draft preparation, Z.W.; writing—review and editing, J.W.; visualization, J.X.; supervision, G.C.; project administration, G.C.; funding acquisition, C.L. All authors have read and agreed to the published version of the manuscript.

Funding

This research was supported by the National Natural Science Foundation of China (No. 52304179).

Institutional Review Board Statement

Not applicable.

Informed Consent Statement

Not applicable.

Data Availability Statement

The data are available on reasonable request from the author.

Conflicts of Interest

The authors declare no conflicts of interest.

References

  1. Fan, J.; Zhao, L.; Li, M. Research on Digital Twin Modeling and Fault Diagnosis Methods for Rolling Bearings. Sensors 2025, 25, 2023. [Google Scholar] [CrossRef]
  2. Tuo, J.; Li, C.; Liu, Y.; Wang, Y. Bearing Fault Diagnosis in Noisy Environment Based on Continuous Wavelet Transform and Convolutional Attention Fusion Network. In Proceedings of the 2024 China Automation Congress (CAC), Qingdao, China, 1–3 November 2024; pp. 2041–2046. [Google Scholar]
  3. Lei, C.; Wang, L.; Zhang, Q.; Li, X.; Li, M.; Wang, B. Rolling bearing fault diagnosis method based on DSICNN under strong noise background. Nondestruct. Test. Eval. 2025, 40, 5804–5820. [Google Scholar] [CrossRef]
  4. Borghesani, P.; Pennacchi, P.; Randall, R.B.; Sawalhi, N.; Ricci, R. Application of cepstrum pre-whitening for the diagnosis of bearing faults under variable speed conditions. Mech. Syst. Signal Process. 2013, 36, 370–384. [Google Scholar] [CrossRef]
  5. Sacerdoti, D.; Strozzi, M.; Secchi, C. A Comparison of Signal Analysis Techniques for the Diagnostics of the IMS Rolling Element Bearing Dataset. Appl. Sci. 2023, 13, 5977. [Google Scholar] [CrossRef]
  6. Ma, S.; Cheng, G.; Li, Y.; Huang, Y.; Zhuang, D. Research on multi-granularity imbalanced knowledge condition monitoring for mechanical equipment based on hierarchical ELM in multi-entropy space. Expert Syst. Appl. 2024, 238, 121817. [Google Scholar] [CrossRef]
  7. Shao, L.; Zhao, B.; Kang, X. Rolling Bearing Fault Diagnosis Based on VMD-DWT and HADS-CNN-BiLSTM Hybrid Model. Machines 2025, 13, 423. [Google Scholar] [CrossRef]
  8. Lei, Y.; Yang, B.; Jiang, X.; Jia, F.; Li, N.; Nandi, A.K. Applications of machine learning to machine fault diagnosis: A review and roadmap. Mech. Syst. Signal Process. 2020, 138, 106587. [Google Scholar] [CrossRef]
  9. Shi, M.; Shi, J.; Zhang, K.; Qu, H.; Tian, J. Bearing fault diagnosis based on simplified segmentation empirical wavelet transform. In Proceedings of the International Conference on Computer Vision and Augmented Reality (CVAR 2025), Chengdu, China, 16–18 May 2025; Volume 13801, pp. 41–48. [Google Scholar]
  10. Wu, Z.; Huang, N.E. Ensemble empirical mode decomposition: A noise-assisted data analysis method. Adv. Adapt. Data Anal. 2009, 1, 1–41. [Google Scholar] [CrossRef]
  11. Dragomiretskiy, K.; Zosso, D. Variational Mode Decomposition. IEEE Trans. Signal Process. 2014, 62, 531–544. [Google Scholar] [CrossRef]
  12. Xing, X.; Zhang, M.; Wang, W. Adaptive Variational Mode Decomposition for Bearing Fault Detection. J. Signal Inf. Process. 2023, 14, 9–24. [Google Scholar] [CrossRef]
  13. Bouaouiche, K.; Menasria, Y.; Khalfa, D. Local Mean Decomposition, using an Empirical Optimal Envelope and a Log-Envelope, for Bearing Fault Detection. Acta Polytech. Hung. 2024, 21, 265–280. [Google Scholar] [CrossRef]
  14. Smith, J.S. The local mean decomposition and its application to EEG perception data. J. R. Soc. Interface 2005, 2, 443–454. [Google Scholar] [CrossRef]
  15. Cui, L.; Yang, J.; Wang, L.; Liu, H.; Xiao, Y. An adaptive improved unsaturated bistable stochastic resonance method based on weak signal detection. Int. J. Adapt. Control. Signal Process. 2021, 35, 2314–2327. [Google Scholar] [CrossRef]
  16. Qiao, Z.; Lei, Y.; Li, N. Applications of stochastic resonance to machinery fault detection: A review and tutorial. Mech. Syst. Signal Process. 2019, 122, 502–536. [Google Scholar] [CrossRef]
  17. Zhai, Y.; Fu, Y.; Kang, Y. Incipient Bearing Fault Diagnosis Based on the Two-State Theory for Stochastic Resonance Systems. IEEE Trans. Instrum. Meas. 2023, 72, 3508011. [Google Scholar] [CrossRef]
  18. Xu, Y.; Li, J.; Feng, J.; Zhang, H.; Xu, W.; Duan, J. Levy noise-induced stochastic resonance in a bistable system. Eur. Phys. J. B 2013, 86, 198. [Google Scholar] [CrossRef]
  19. Zhang, G.; Zhang, Y.; Zhang, T.; Rana, M. Stochastic resonance in an asymmetric bistable system driven by multiplicative and additive Gaussian noise and its application in bearing fault detection. Chin. J. Phys. 2018, 56, 1173–1186. [Google Scholar] [CrossRef]
  20. Fan, B.; Xie, M. Stochastic resonance in a tristable optomechanical system. Phys. Rev. A 2017, 95, 023808. [Google Scholar] [CrossRef]
  21. Zhou, B.C.; Xu, W. Stochastic resonance in an asymmetric bistable system driven by mixed periodic force and noises. Acta Phys. Sin. 2007, 56, 5623–5628. [Google Scholar] [CrossRef]
  22. Liu, X.; Liu, H.; Yang, J.; Litak, G.; Cheng, G.; Han, S. Improving the bearing fault diagnosis efficiency by the adaptive stochastic resonance in a new nonlinear system. Mech. Syst. Signal Process. 2017, 96, 58–76. [Google Scholar] [CrossRef]
  23. Li, Z.; Shi, B. A piecewise nonlinear stochastic resonance method and its application to incipient fault diagnosis of machinery. Chin. J. Phys. 2019, 59, 126–137. [Google Scholar] [CrossRef]
  24. Qiao, Z.; Lei, Y.; Lin, J.; Jia, F. An adaptive unsaturated bistable stochastic resonance method and its application in mechanical fault diagnosis. Mech. Syst. Signal Process. 2017, 84, 731–746. [Google Scholar] [CrossRef]
  25. Cui, L.; Xu, W. A New Piecewise Nonlinear Asymmetry Bistable Stochastic Resonance Model for Weak Fault Extraction. Machines 2022, 10, 373. [Google Scholar] [CrossRef]
  26. Zhang, G.; Lei, L.; Liu, W. Adaptive vibration assisted hybrid potential enhanced cascaded multi-stable stochastic resonance in bearing fault diagnosis. Chaos Solitons Fractals 2025, 201, 117315. [Google Scholar] [CrossRef]
  27. Wang, Z.; Fan, J.; Guo, Y. Research on fault feature extraction for planet-bearing using novel combination operator morphological filtering and stochastic resonance. J. Sound Vib. 2025, 607, 119037. [Google Scholar] [CrossRef]
  28. Benzi, R.; Sutera, A.; Vulpiani, A. The mechanism of stochastic resonance. J. Phys. A Gen. Phys. 1998, 14, L453. [Google Scholar] [CrossRef]
  29. Smith, W.A.; Randall, R.B. Rolling element bearing diagnostics using the Case Western Reserve University data: A benchmark study. Mech. Syst. Signal Process. 2015, 64, 100–131. [Google Scholar] [CrossRef]
  30. Miao, Y.; Zhao, M.; Lin, J.; Lei, Y. Application of an improved maximum correlated kurtosis deconvolution method for fault diagnosis of rolling element bearings. Mech. Syst. Signal Process. 2017, 92, 173–195. [Google Scholar] [CrossRef]
  31. Zhang, B.; Miao, Y.; Lin, J.; Yi, Y. Adaptive maximum second-order cyclostationarity blind deconvolution and its application for locomotive bearing fault diagnosis. Mech. Syst. Signal Process. 2021, 158, 107736. [Google Scholar] [CrossRef]
Figure 1. Bistable stochastic resonance model.
Actuators 15 00201 g001
Figure 2. Diagram of signal-to-noise ratio varying with noise intensity.
Actuators 15 00201 g002
Figure 3. Diagram of SNR varying with system parameters.
Actuators 15 00201 g003
Figure 4. An improved adaptive stochastic resonance system based on particle swarm optimization.
Actuators 15 00201 g004
Figure 5. The diagram of experimental equipment [29].
Actuators 15 00201 g005
Figure 6. The waveform of the original signal in the time domain.
Actuators 15 00201 g006
Figure 7. The waveform in the time domain of the noise signal.
Actuators 15 00201 g007
Figure 8. The spectrum of the noisy signal.
Actuators 15 00201 g008
Figure 9. Parameter optimization of SR system.
Actuators 15 00201 g009
Figure 10. Time-domain waveform of output signal of SR system.
Actuators 15 00201 g010
Figure 11. The spectrum of output signal of SR system.
Actuators 15 00201 g011
Figure 12. LMD diagram of output signal.
Actuators 15 00201 g012
Figure 13. Reconstructed signal waveform diagram of outer ring.
Actuators 15 00201 g013
Figure 14. Spectrum of reconstructed signal of outer ring.
Actuators 15 00201 g014
Figure 15. Processing results of VMD, IMCKD and ACYCBD.
Actuators 15 00201 g015
Figure 16. Spectrum of reconstructed signal of inner ring.
Actuators 15 00201 g016
Table 1. Characteristic frequency of faults of each element of rolling bearings.
Bearing PartsInner RingOuter RingRolling Element
Fault frequency5.4152 f r 3.5848 f r 4.7135 f r
Disclaimer/Publisher’s Note: The statements, opinions and data contained in all publications are solely those of the individual author(s) and contributor(s) and not of MDPI and/or the editor(s). MDPI and/or the editor(s) disclaim responsibility for any injury to people or property resulting from any ideas, methods, instructions or products referred to in the content.