Article

Research on Impedance Matching Performance Evaluation Method for Ultrasonic Machining System Based on Standing Wave Detection


1
School of Mechanical Engineering, Hangzhou Dianzi University, Hangzhou 310018, China
2
School of Mechanical Engineering, Hangzhou Dianzi University Information Engineering College, Hangzhou 311305, China
3
The State Key Laboratory of Fluid Power and Mechatronic Systems, School of Mechanical Engineering, Zhejiang University, Hangzhou 310027, China
*
Author to whom correspondence should be addressed.
Actuators 2026, 15(4), 202; https://doi.org/10.3390/act15040202
Submission received: 20 January 2026 / Revised: 3 March 2026 / Accepted: 9 March 2026 / Published: 2 April 2026
(This article belongs to the Section Actuators for Manufacturing Systems)

Abstract

The failure of impedance matching between the ultrasonic power supply and the transducer can degrade machining quality, decrease machining efficiency, and reduce tool life. To enhance the detection efficiency of impedance matching status in ultrasonic machining systems, an impedance matching detection method based on the Voltage Standing Wave Ratio (VSWR) is proposed. First, by constructing a fitting model for the forward and reverse voltage and power of ultrasonic power supply, the relationship between VSWR and voltage is determined. Subsequently, a correlation model between the VSWR and tool tip amplitude, which reflects the working state of the ultrasonic system, is established. And the range of VSWR for optimal performance of system impedance matching is obtained by means of the model. Finally, the detection effectiveness of this method is verified through experiments on tool tip output amplitude under varying working conditions, and a comparison is made between this method and the phase method. The results indicate that using VSWR as a detection parameter to characterize impedance matching yields measurement values within 7% of the theoretical values. These results confirm the evaluation interval for a good working state of the system. Furthermore, experiments under varying force loads and temperatures demonstrate the reliability of the VSWR-based characterization. Compared to the traditional phase method, this approach reduces the cost of impedance matching performance detection and meets the requirements for impedance matching status detection during ultrasonic machining.

1. Introduction

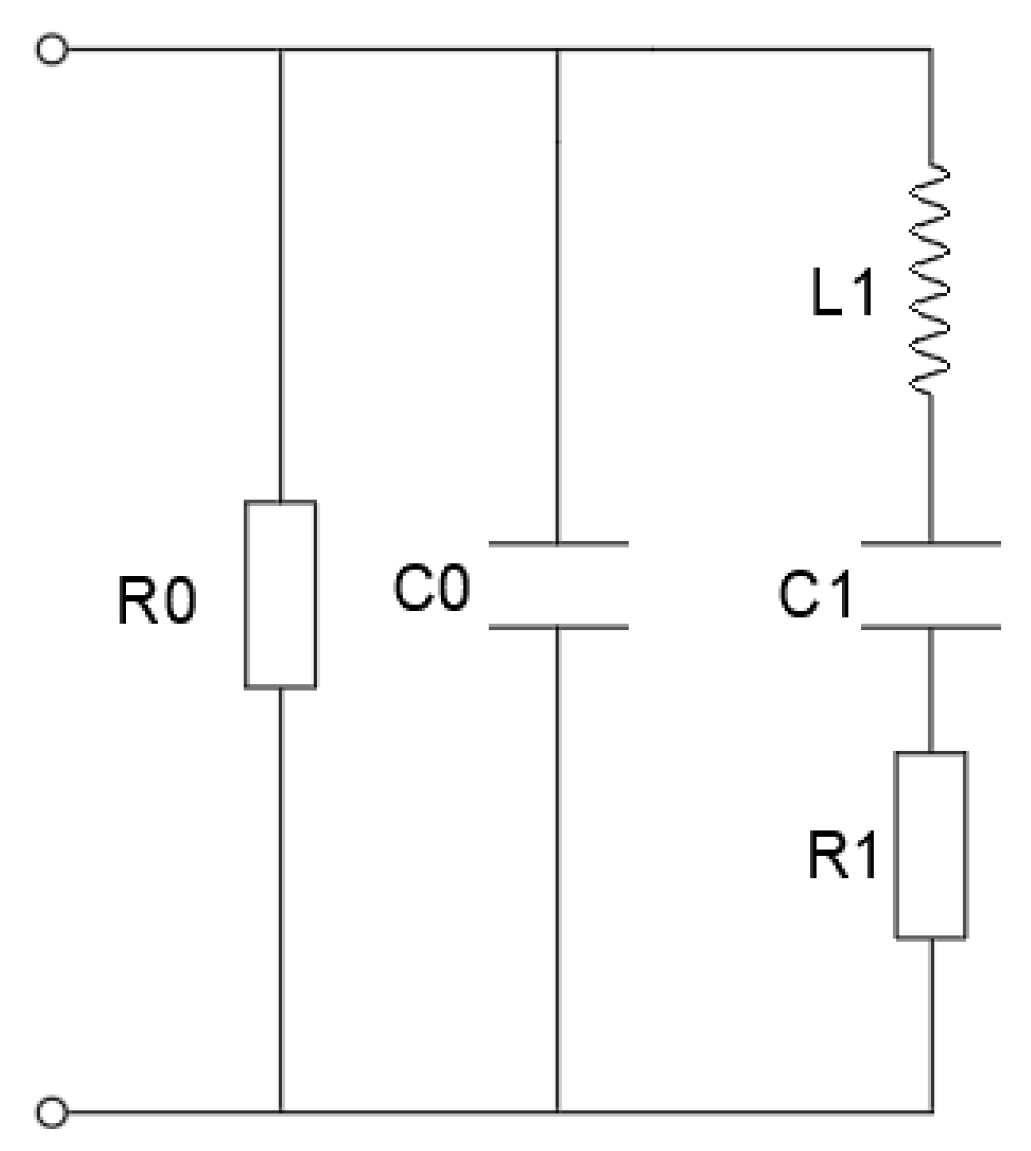
Ultrasonic machining exhibits exceptional suitability for processing hard and brittle materials, including ceramics [1,2] and composites [3,4]. This technique employs high-frequency vibrations of the tool to facilitate material removal, thereby minimizing tool wear, enhancing surface finish quality, and reducing machining forces [5]. In the ultrasonic system, the transducer, horn, and tool collectively constitute the acoustic load, and the impedance matching between this acoustic load and the generator critically influences the tool tip amplitude and overall system stability [6]. Figure 1 illustrates the Mason equivalent circuit of the piezoelectric transducer. During machining operations, dynamic changes in the transducer’s electrical properties occur due to load variations and temperature elevation (reaching 40–50 °C), resulting in impedance drift and subsequent mismatch [7,8]. Such impedance mismatching can lead to amplitude reduction, performance degradation, or even equipment failure [9,10]. Therefore, real-time impedance matching detection is essential to maintain system reliability and machining quality.
In current ultrasonic machining systems, impedance matching is commonly evaluated by measuring the phase difference between voltage and current across the transducer. However, this method requires precise synchronization of acquisition channels, making the hardware complex and prone to interference, thereby limiting real-time performance and reliability [11]. Frequency scanning approaches, which identify anti-resonance points through predefined sweeps, often experience delays and mismatches due to frequency drift under dynamic loading [12,13,14]. Equivalent circuit modeling depends on accurate parameter identification but suffers from reliability issues during operation because of temperature and load-induced drift [15,16]. Although dynamic matching techniques offer adaptive adjustment, their implementation is hindered by complex control logic, limited response speed, and integration challenges [17,18]. Additionally, most methods still rely on simultaneous acquisition of voltage and current, increasing system cost and complexity while reducing noise immunity [11,19]. To address these limitations, the Voltage Standing Wave Ratio (VSWR), widely used in radio frequency (RF) and power transmission systems, has gained attention as a simplified and responsive alternative for impedance matching evaluation [20,21]. A VSWR value close to 1 indicates ideal matching, while higher values reflect mismatches or open-circuit faults, making it a practical indicator of system status. For instance, VSWR values below 1.5 are typically considered acceptable in communication systems, with higher values potentially causing signal degradation or equipment failure [22]. Furthermore, studies have shown that variations in VSWR can be used to locate fault positions and maintain stability across variable cable lengths and electrical disturbances [23]. As VSWR detection requires only voltage measurements, it simplifies circuit design and enhances real-time monitoring performance [20]. Despite its advantages, the application of VSWR-based methods in ultrasonic machining remains limited, and further development is needed to establish standardized implementation frameworks and performance evaluation criteria.
To resolve the above problems, the forward and reverse voltages of the ultrasonic power supply are separated and detected by the developed standing wave detection device. The fitting model of voltage and power is obtained through experimentation, as well as the relationship between the Voltage and Standing Wave Ratio. On the basis of the actual processing requirements, a correlation model between the tool tip amplitude and the Standing Wave Ratio under stable operation was established, and the impedance matching status of the ultrasonic machining system was characterized by range. Experiments validate the effectiveness of the proposed detection method in assessing the impedance matching status of the system. Finally, the proposed method was compared with the traditional phase detection method according to the differences in detection accuracy and implementation complexity. This research offers a new approach for impedance matching detection in practical applications.

2. VSWR-Based Impedance Matching Detection Method

2.1. Detection Principle Based on VSWR

In the ultrasonic machining system, the operating frequency (20–40 kHz) is much lower than that of typical RF systems. However, when impedance mismatch occurs, measurable reflected power still appears in the power transmission path. Since the cable length at this frequency range is electrically short compared to the wavelength of electromagnetic waves, the system cannot form standing waves along the transmission line in the typical RF sense. Therefore, the concept of VSWR introduced in this paper is not used to describe the spatial standing wave phenomenon along the transmission line but rather serves as a mismatch indicator based on the forward and reflected power components, to quantitatively evaluate the impedance matching and energy transfer efficiency in the ultrasonic system.
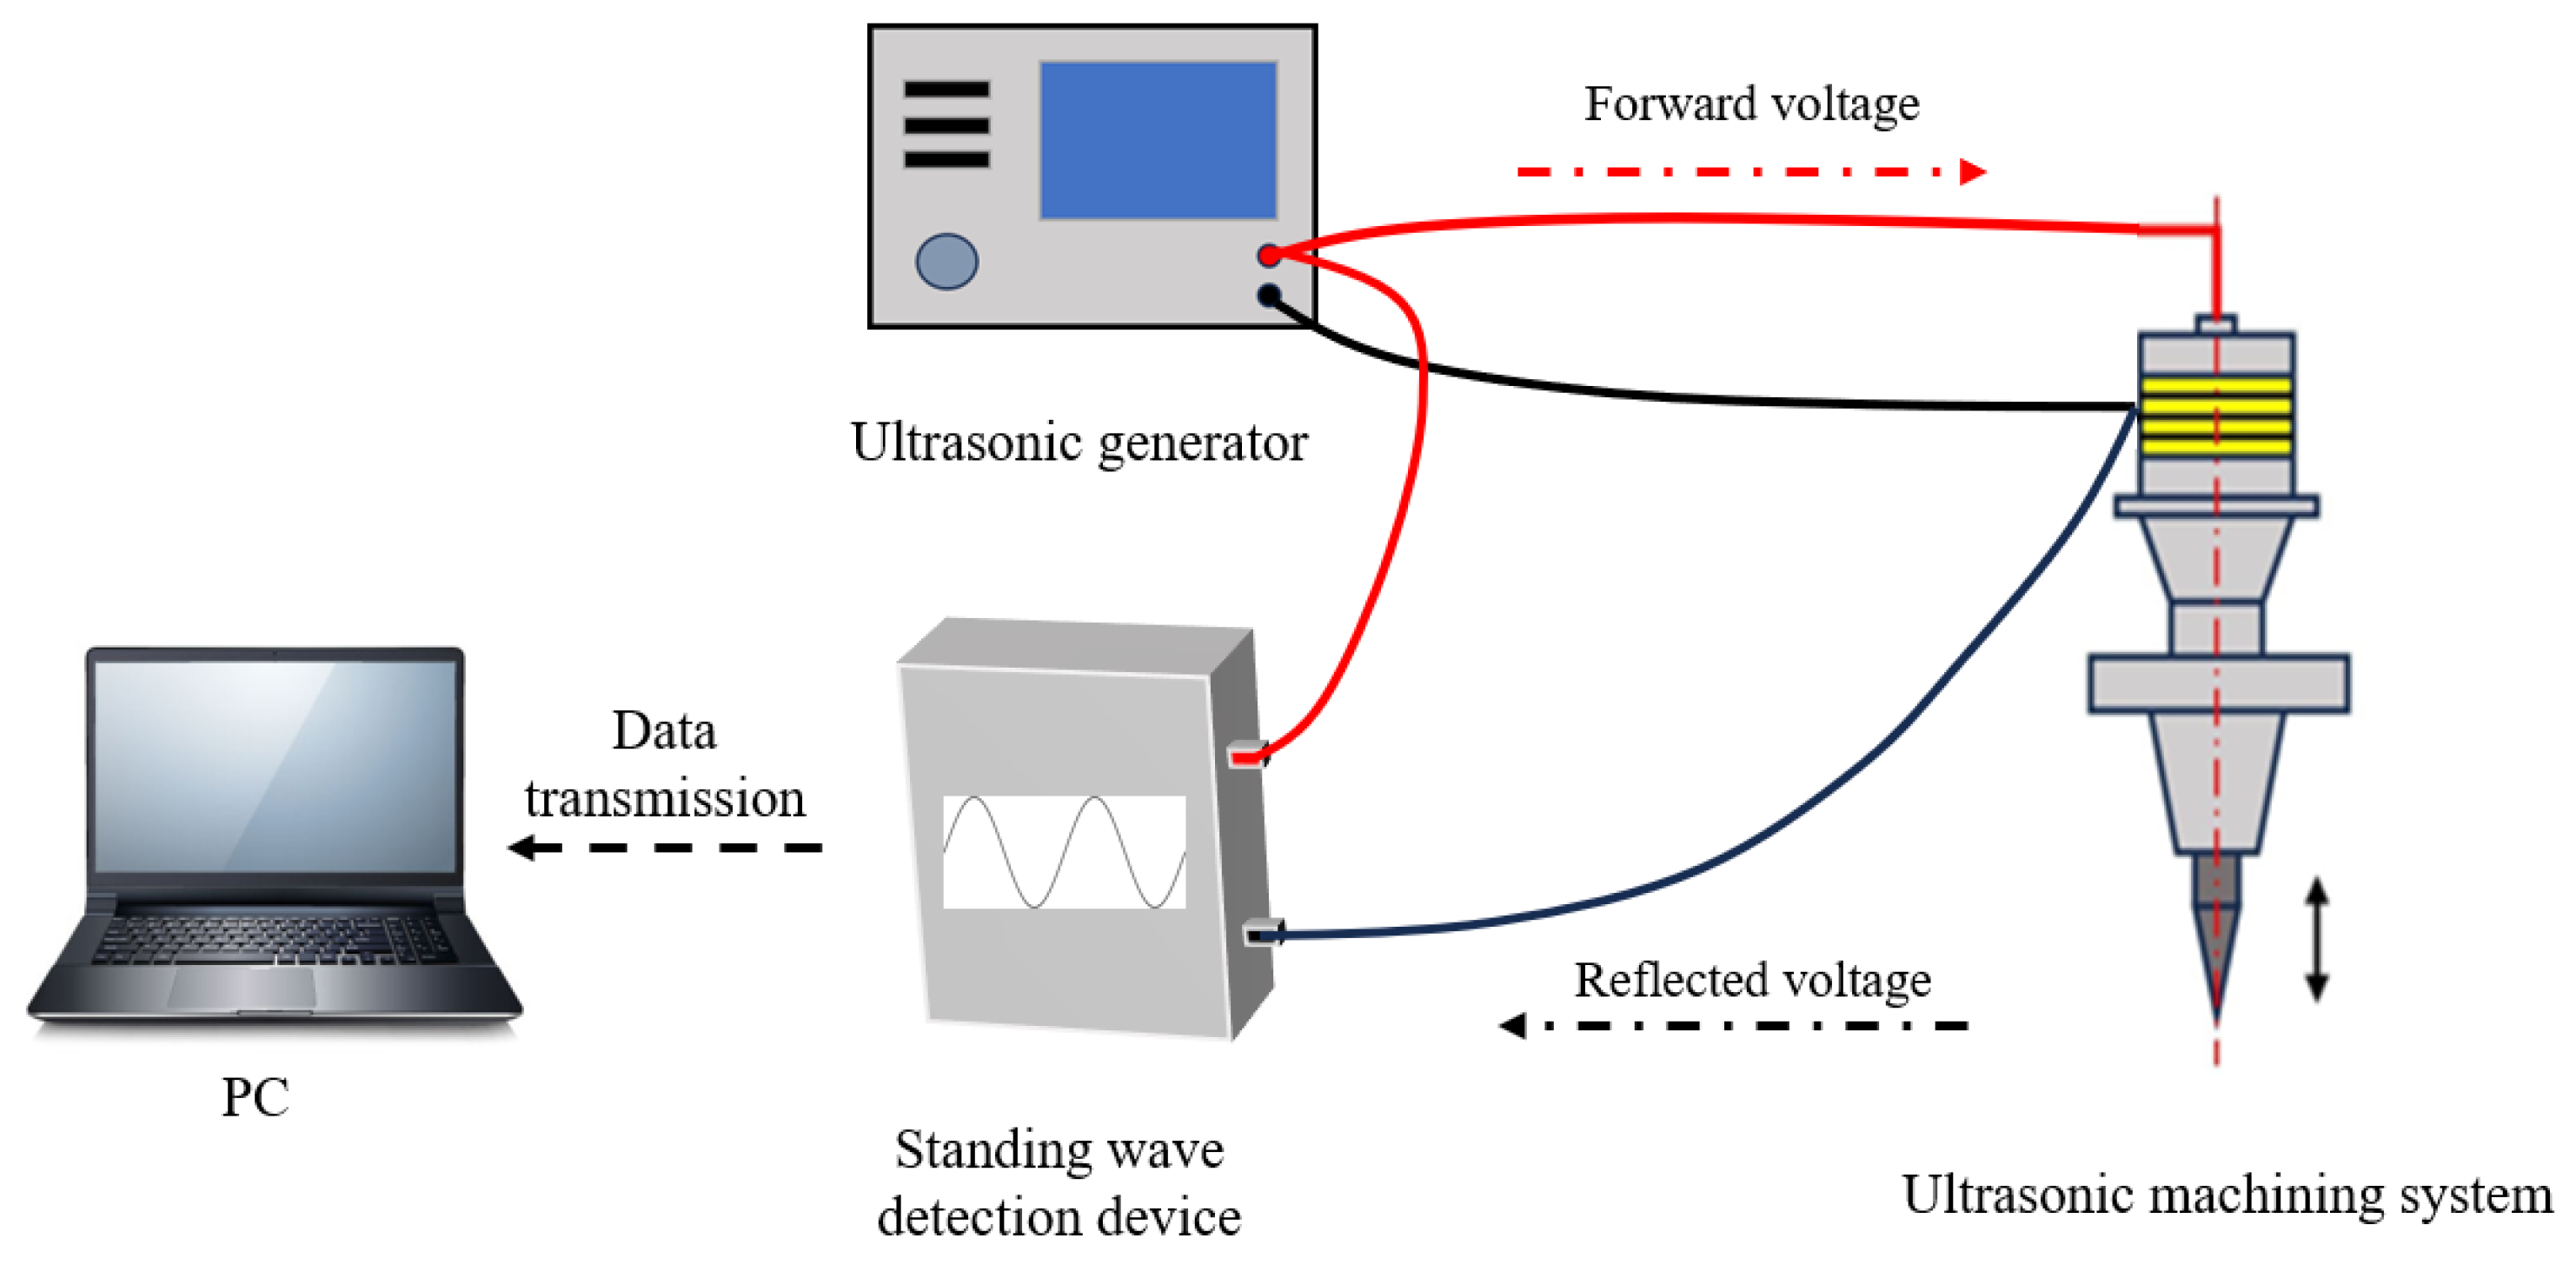
When the ultrasonic machining system is not impedance-matched, standing waves are formed. The reverse power increases, the VSWR increases, and the active power of the system decreases, resulting in a reduced output amplitude at the tool tip. VSWR is defined as the ratio of the antinode voltage to the node voltage on the transmission line. When the VSWR equals 1, the system is fully matched, and all power is transmitted forward without reflection loss. When the VSWR approaches infinity, the system is in a fully reflective state, where all power is reactive and no effective energy is delivered to the load. By combining the VSWR with the effective amplitude of the tool tip, the system’s power transmission state can be used to evaluate whether impedance matching has been achieved. Figure 2 illustrates the framework of the VSWR-based detection method.

2.2. VSWR Detection Circuit Design

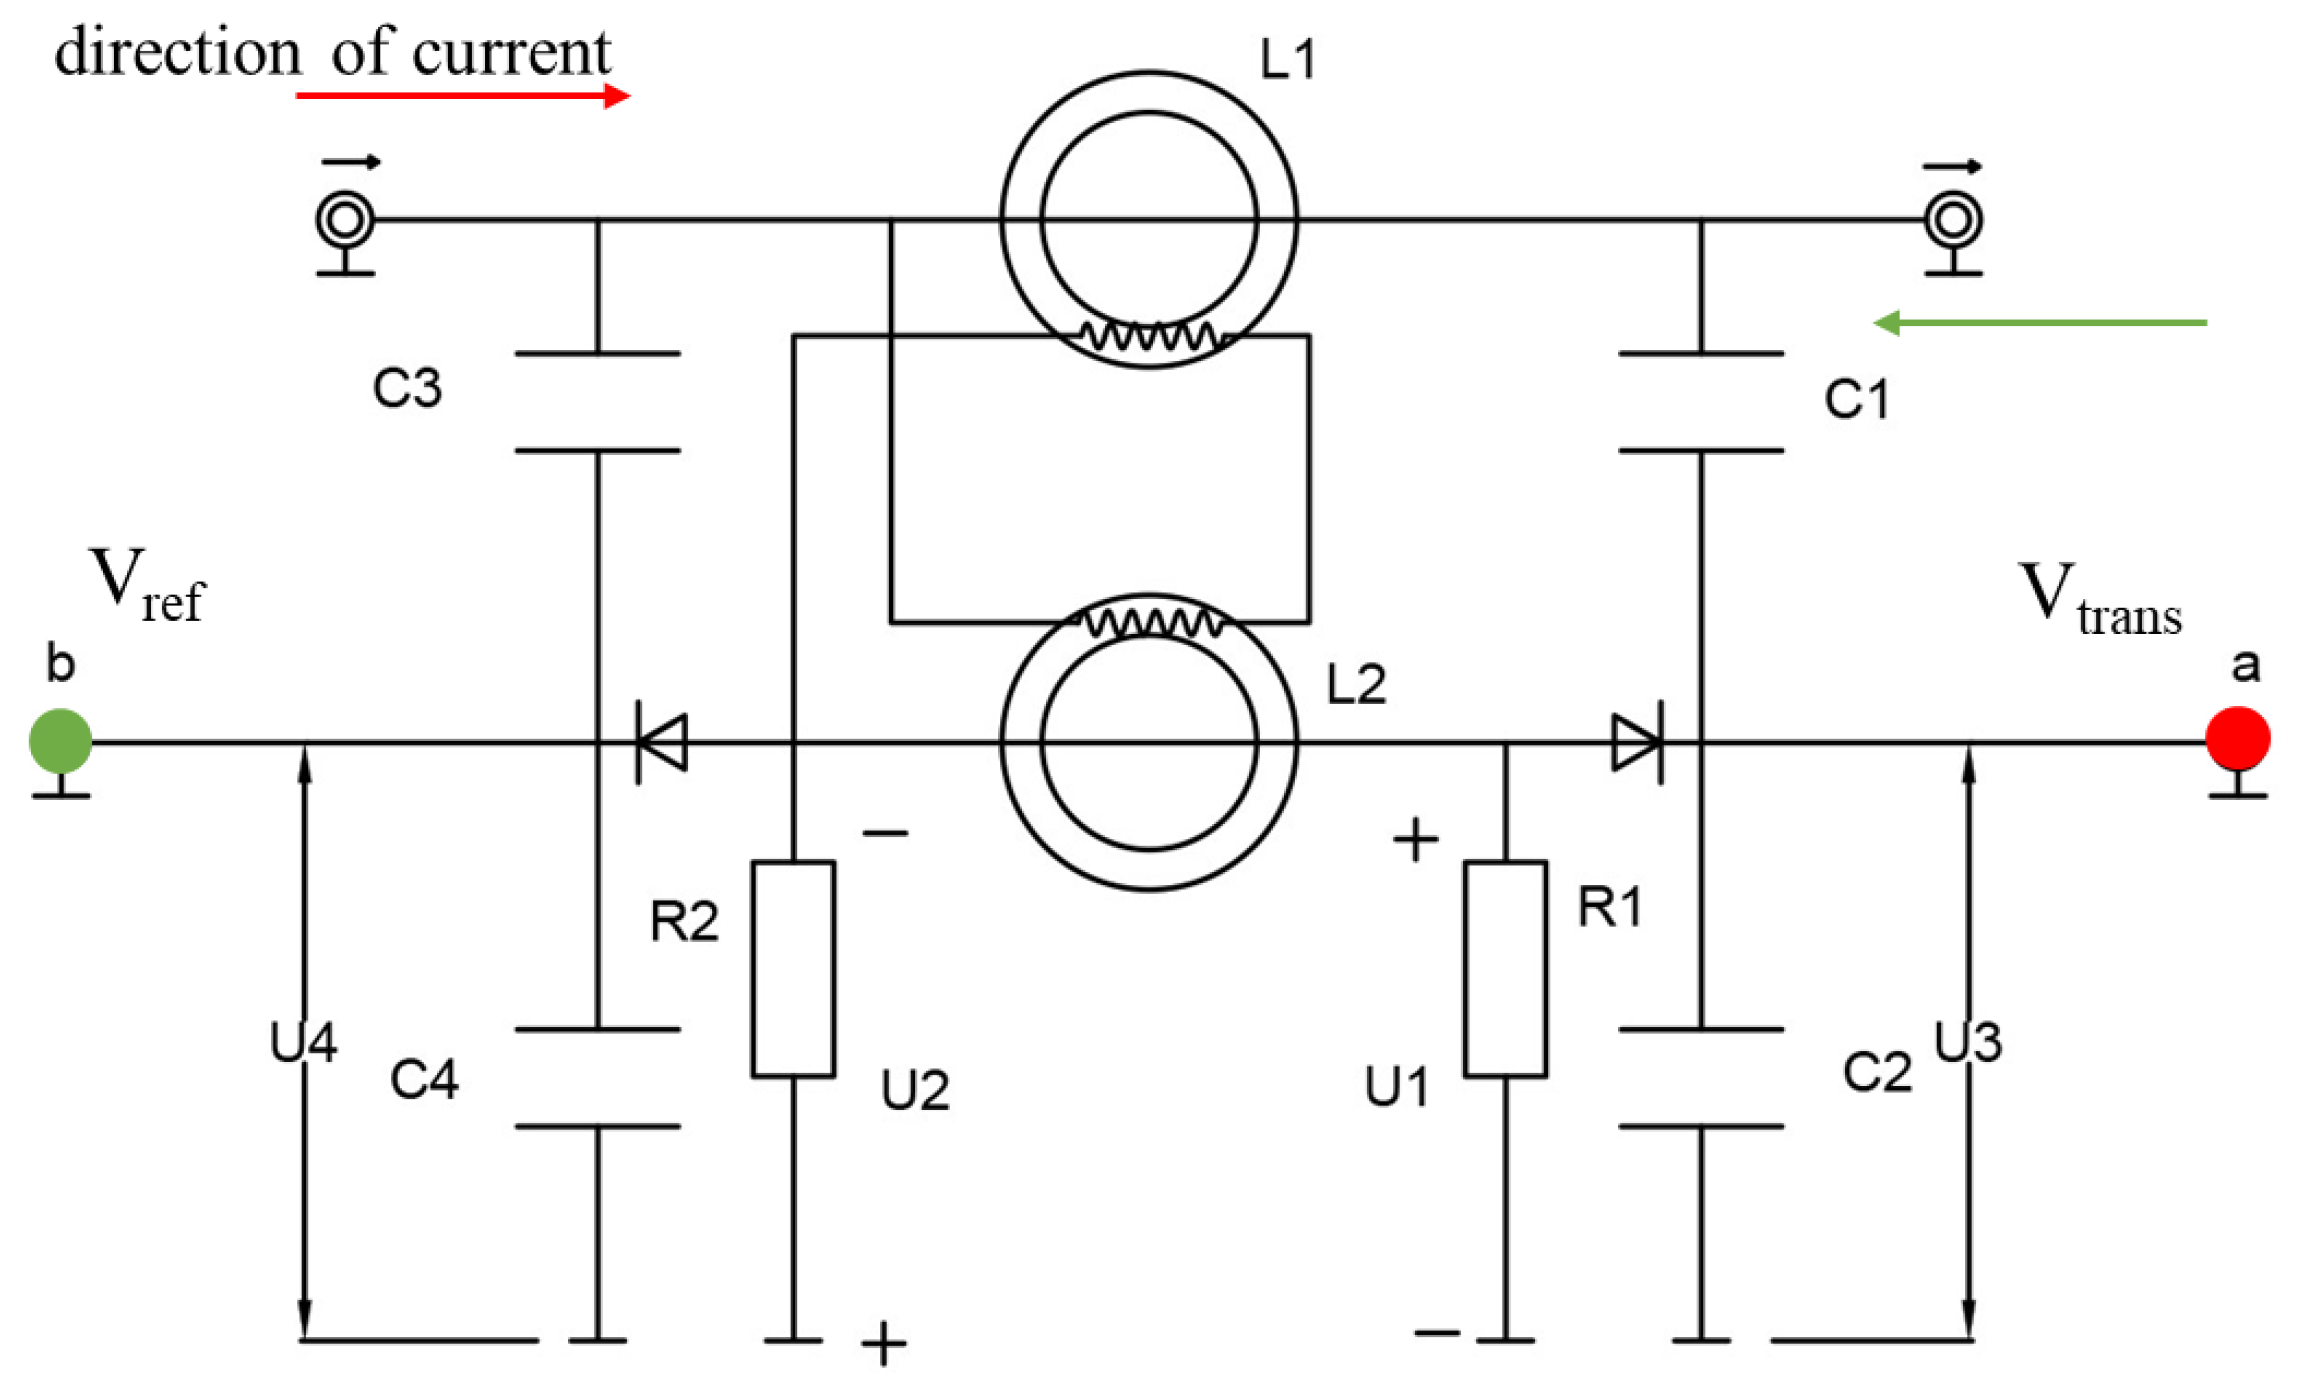
The VSWR-based detection method requires measurement of the forward and reverse power of the ultrasonic power supply. To achieve this, the forward voltage and reverse voltage must first be extracted [24]. In this work, a standing wave detection circuit based on magnetic ring mutual inductance is employed to separate V t r a n s and V r e f . The schematic of the detection circuit is shown in Figure 3.
The circuit operates under high-frequency excitation and consists of a composition of a voltage divider capacitor network (C1-C2 and C3-C4) and voltage measurement resistors R1 and R2. In the circuit, L1 L2 represent the primary and secondary windings of the magnetic coupling coil, respectively. In this circuit, the high-frequency signal propagates from the source end on the left to the load end on the right along the upper transmission line. The direction of propagation is defined as forward (forward direction), corresponding to the formation of a forward traveling wave. When there is impedance mismatch at the load, a reflected wave is generated at the load end and propagates in the opposite direction. The L1 and L2 in the circuit are mutually coupled inductors, with their secondary windings arranged in specific directions and polarities to achieve directional separation. When only the forward wave propagates, the voltages induced in the right-side sampling branch by L1 and L2 add in phase, while in the left-side branch, they cancel out in anti-phase. As a result, the DC output at port a is relatively large and is defined as the forward voltage (Vtrans). When the reflected wave appears and propagates in the reverse direction, the phase addition and cancellation relationship of the two branches reverses, causing the left-side branch to add in phase and the right-side branch to cancel out, which increases the output at port b, defined as the reflected voltage (Vref). The diode and RC network then rectify and low-pass-filter the coupled high-frequency sampling signal, converting it into a DC quantity suitable for calibrating and calculating the VSWR.
When the high-frequency transformer primary coil L1 has high-frequency current flow I, the secondary coil L2 will generate an induced electromotive force, as shown in Equation (1)
e = j ω M I
where M is the mutual inductance between the primary and secondary coils. The secondary coil, together with resistors R1 and R2, forms a closed loop in which the induced electromotive force generates a high-frequency current i. The magnitude of this current is determined by the inductive reactance of the high-frequency transformer L, as shown in Equation (2):
i = j ω M I R 1 + R 2 + j ω L M I L   ω L R 1 + R 2
At this point, the voltages across resistors R1 and R2 are given by
U 1 = M I L R 1
U 2 = M I L R 2
In the high-frequency transformer primary coil L1, the voltage and current at each point are as shown in Equations (5) and (6), and the coil L1 and L2 impedances at each point on Z are consistent; thus, in the secondary coil circuit R1 and R2, the voltage is shown in Equation (7):
U = V t r a n s + V r e f
I = I t r a n s I r e f
U 1 = U 2 = M R 1 L I t r a n s I r e f = M R 1 L Z V t r a n s V r e f
Assuming a voltage divider capacitor bank C1-C2, C3-C4, the pressure partial ratios K are as follows:
K = M R 1 L Z
Then, C2 with C4, the voltages are as follows:
U 3 = U 4 = K V t r a n s + V r e f = M R 1 L Z V t r a n s + V r e f
After diode detection, a is reached. The voltage at the point is as follows:
U a = 1 2   U 1 + 1 2   U 3 = 1 2 V t r a n s 1 2 V r e f + 1 2 V t r a n s + 1 2 V r e f = V t r a n s
Similarly, for the voltage U2 arriving at b, the voltage at the point is also only 1/2 of the original level and U1 inverted, as shown in the following equation:
U b = 1 2   U 4 1 2   U 2 = 1 2 V t r a n s + 1 2 V r e f 1 2 V t r a n s + 1 2 V r e f = V r e f
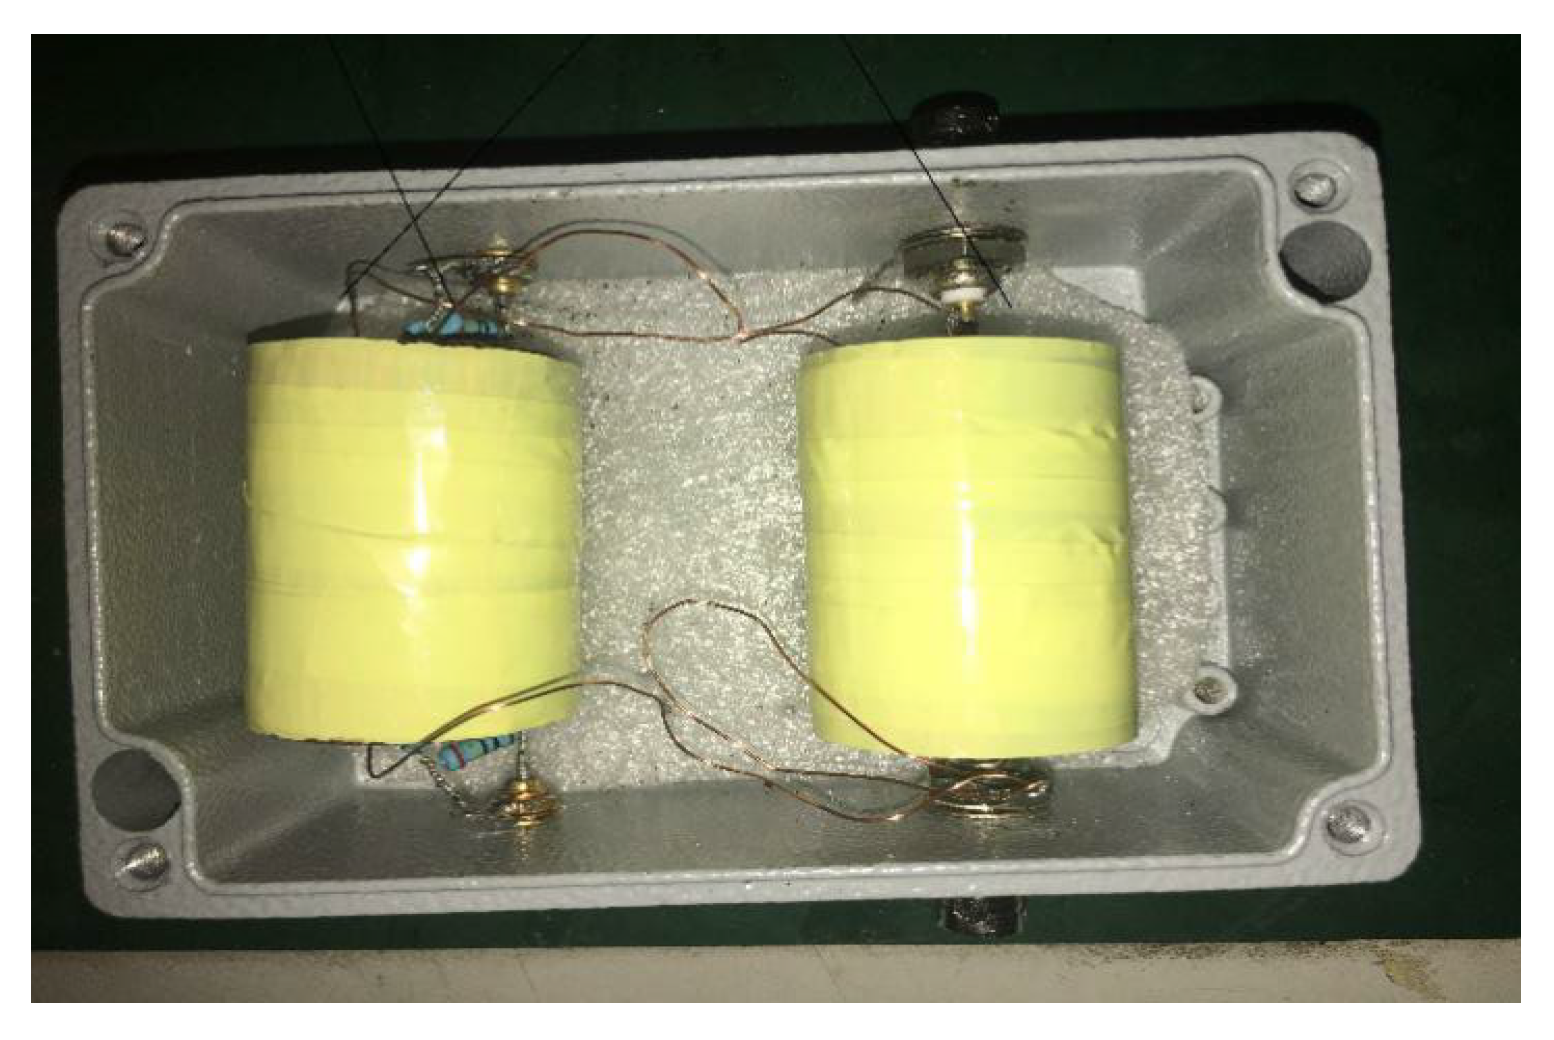
The standing wave detection circuit implements a, b forward voltages at two points Vtrans and reverse voltages Vref of separation. Figure 4 shows a photograph of a standing wave detection device fabricated on the basis of the above detection circuit.

3. VSWR-Based Impedance Matching Evaluation

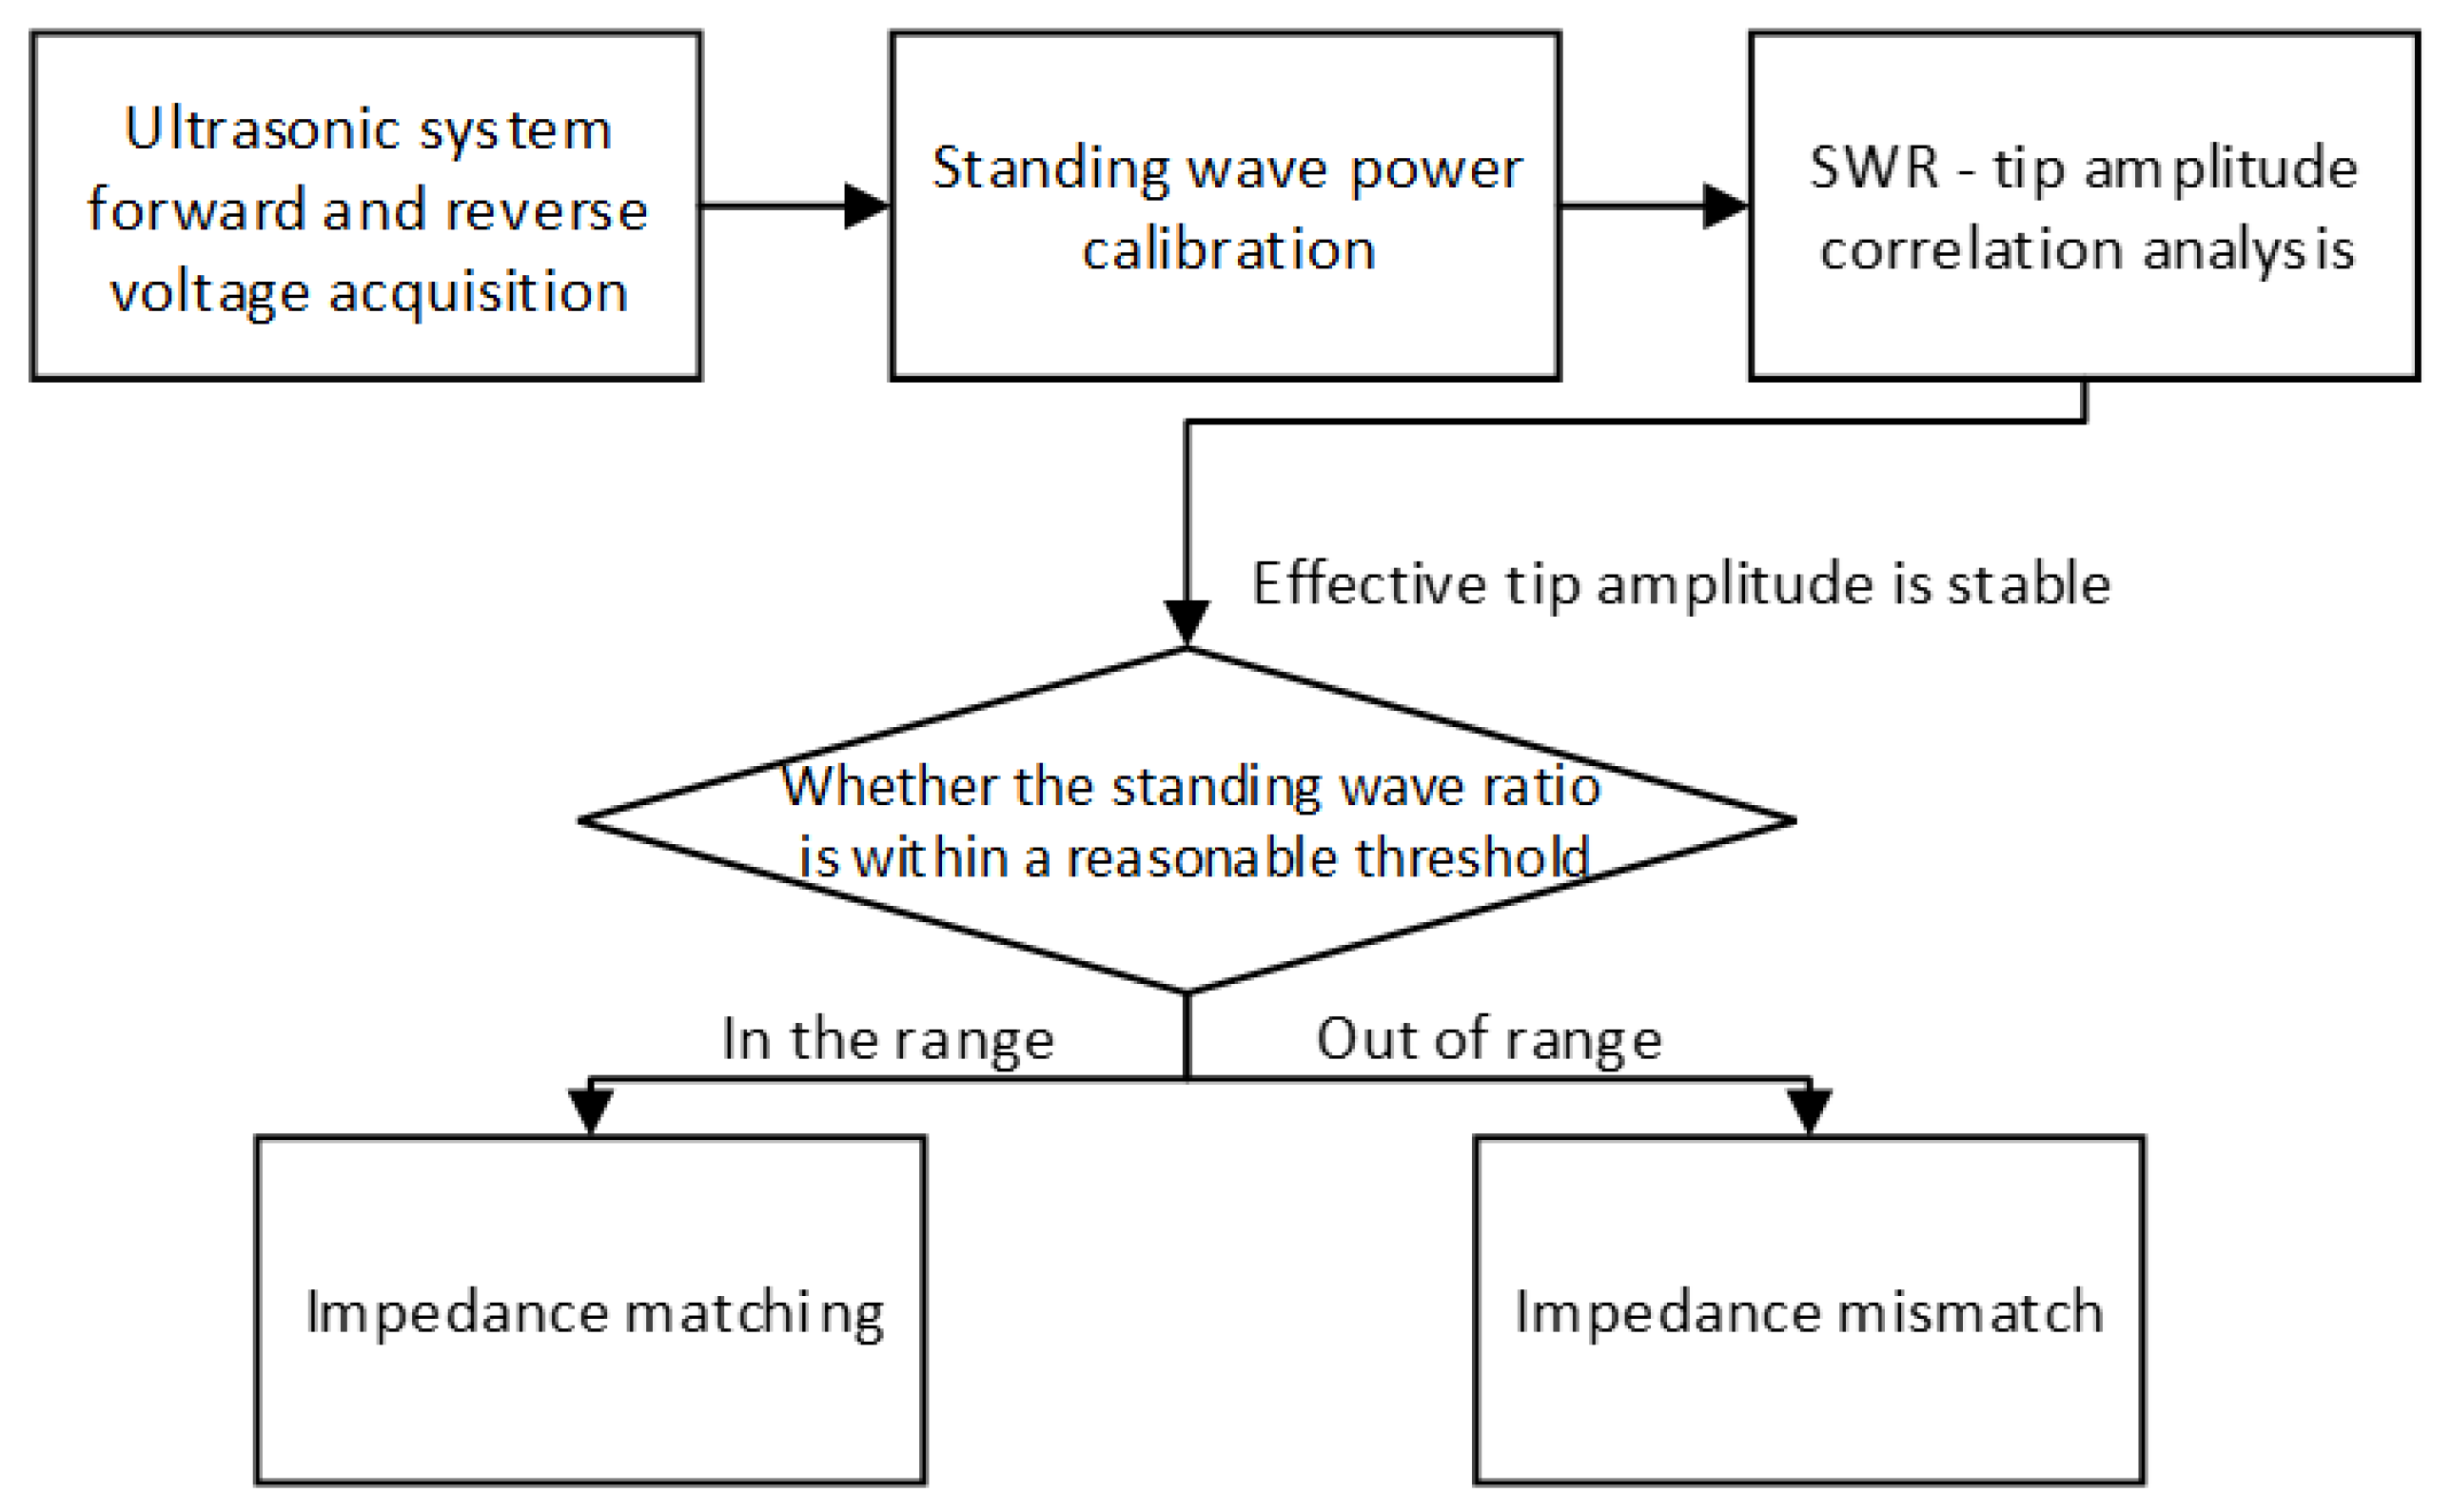
The impedance matching identification method proposed in this paper involves calibrating the power of the collected forward and reverse voltages, calculating the VSWR, and establishing a qualitative relationship between VSWR and the effective amplitude of the tool tip. Based on experimental results, a reasonable operating range of ultrasonic VSWR is determined. Figure 5 illustrates the overall flow of impedance matching detection in the processing system, including the VSWR-based identification method.

3.1. Forward and Reflected Power Modeling

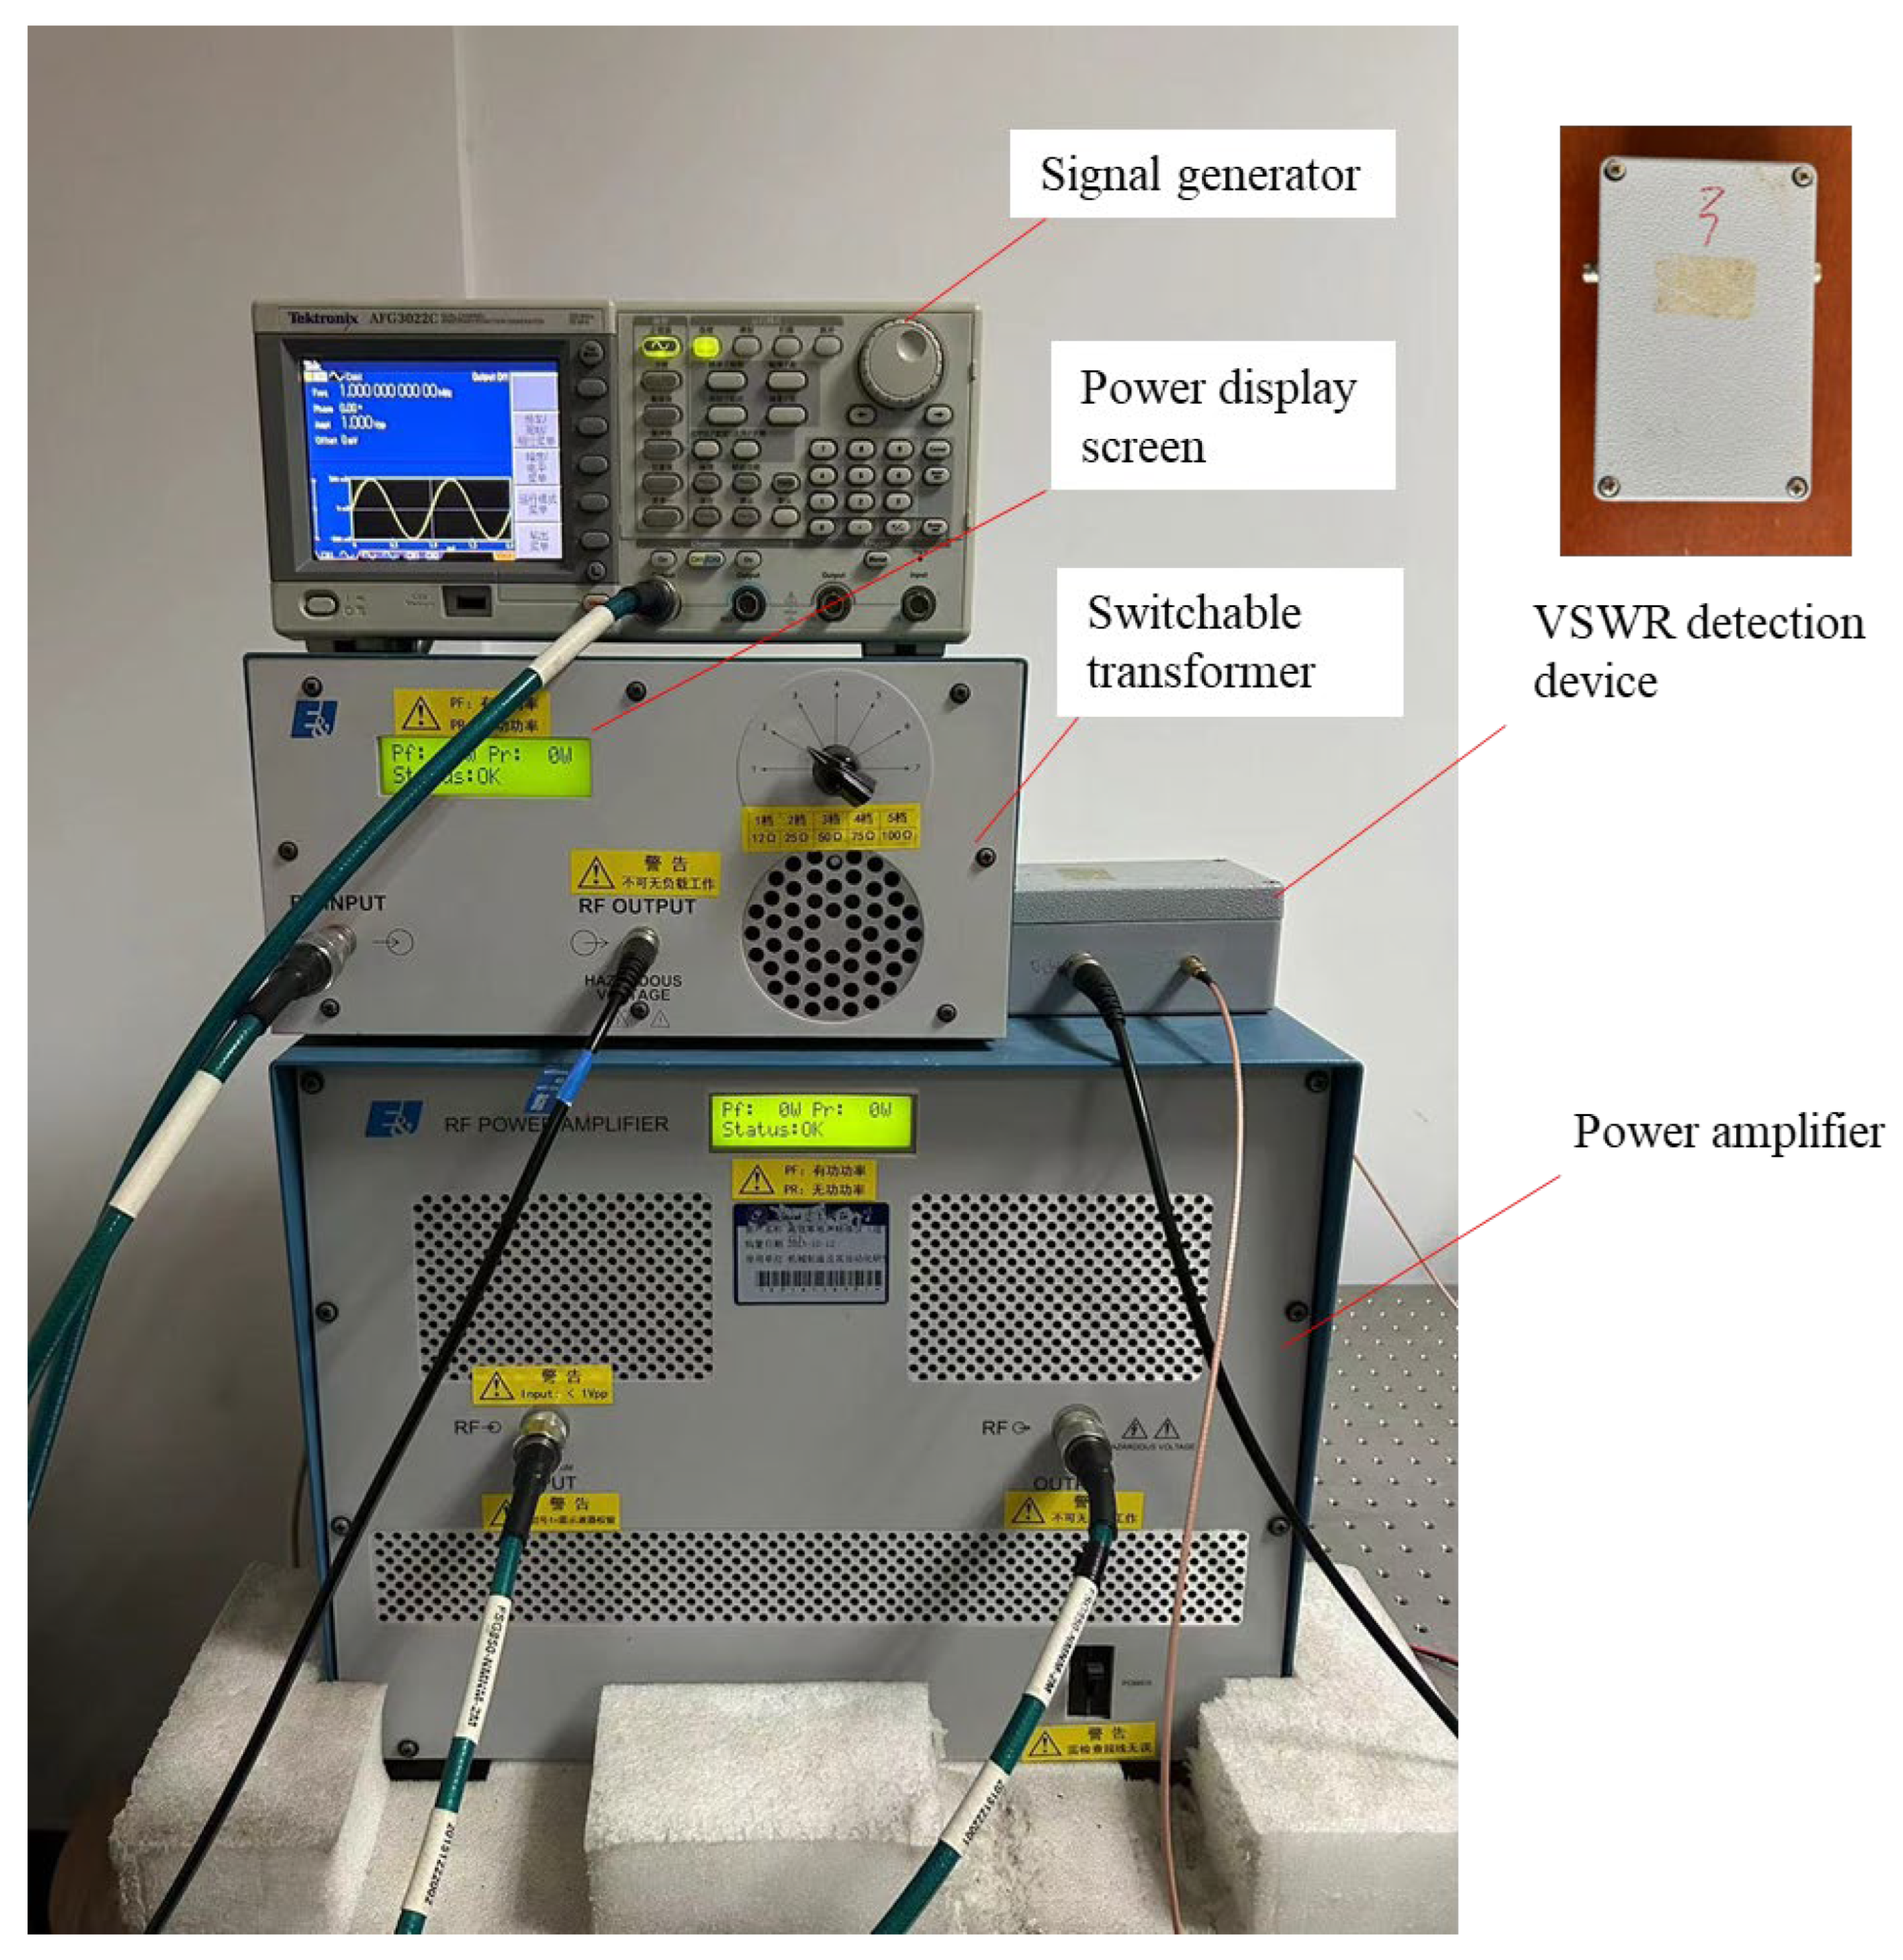
The standing wave detection circuit is employed to separate the forward and reverse voltage signals of the ultrasonic system. To determine the corresponding forward and reverse power values, the separated voltage signals are subsequently calibrated and fitted. In this study, high-frequency, low-voltage excitation signals generated by a Tektronix AFG3022C signal generator are amplified by a 1140LA power amplifier (E&I Company, Rochester, NY, USA) to obtain the high-frequency electrical signals required by the ultrasonic vibration system. The E&I switchable transformer, provided as an accessory to the power amplifier, is connected in the power transmission line to enable adjustable impedance transformation and facilitate fine tuning of load matching. Its display interface allows direct reading of the forward power Pf and reflected power Pr of the ultrasonic machining system. In this study, a self-designed and fabricated impedance matching device was employed. By tuning the capacitance within the matching box, the ultrasonic vibration system can be brought back to an impedance-matched state under a given operating condition. The signals are first fed into the standing wave detection circuit and then delivered to the impedance matching device, where the load impedance is adjusted to ensure proper matching. The matched high-frequency signals are then supplied to the ultrasonic vibration system. The experimental setup for power calibration is illustrated in Figure 6.
Before the experiment, the impedance analyzer used in this study, the PV70A model manufactured by Beijing Lianbang Electronics (Beijing, China), was employed to characterize the ultrasonic system and obtain key acoustic parameters, including the resonant frequency, dynamic resistance, and static capacitance. Based on these results, the impedance matching device and signal generator are adjusted to achieve proper impedance and frequency matching. The generator’s output voltage and frequency are then varied to record the corresponding forward and reverse voltage signals under different power levels. Previous studies have shown that the forward power during ultrasonic machining typically does not exceed 40 W; therefore, in this experiment, the maximum forward power delivered by the amplifier was limited to 45 W.
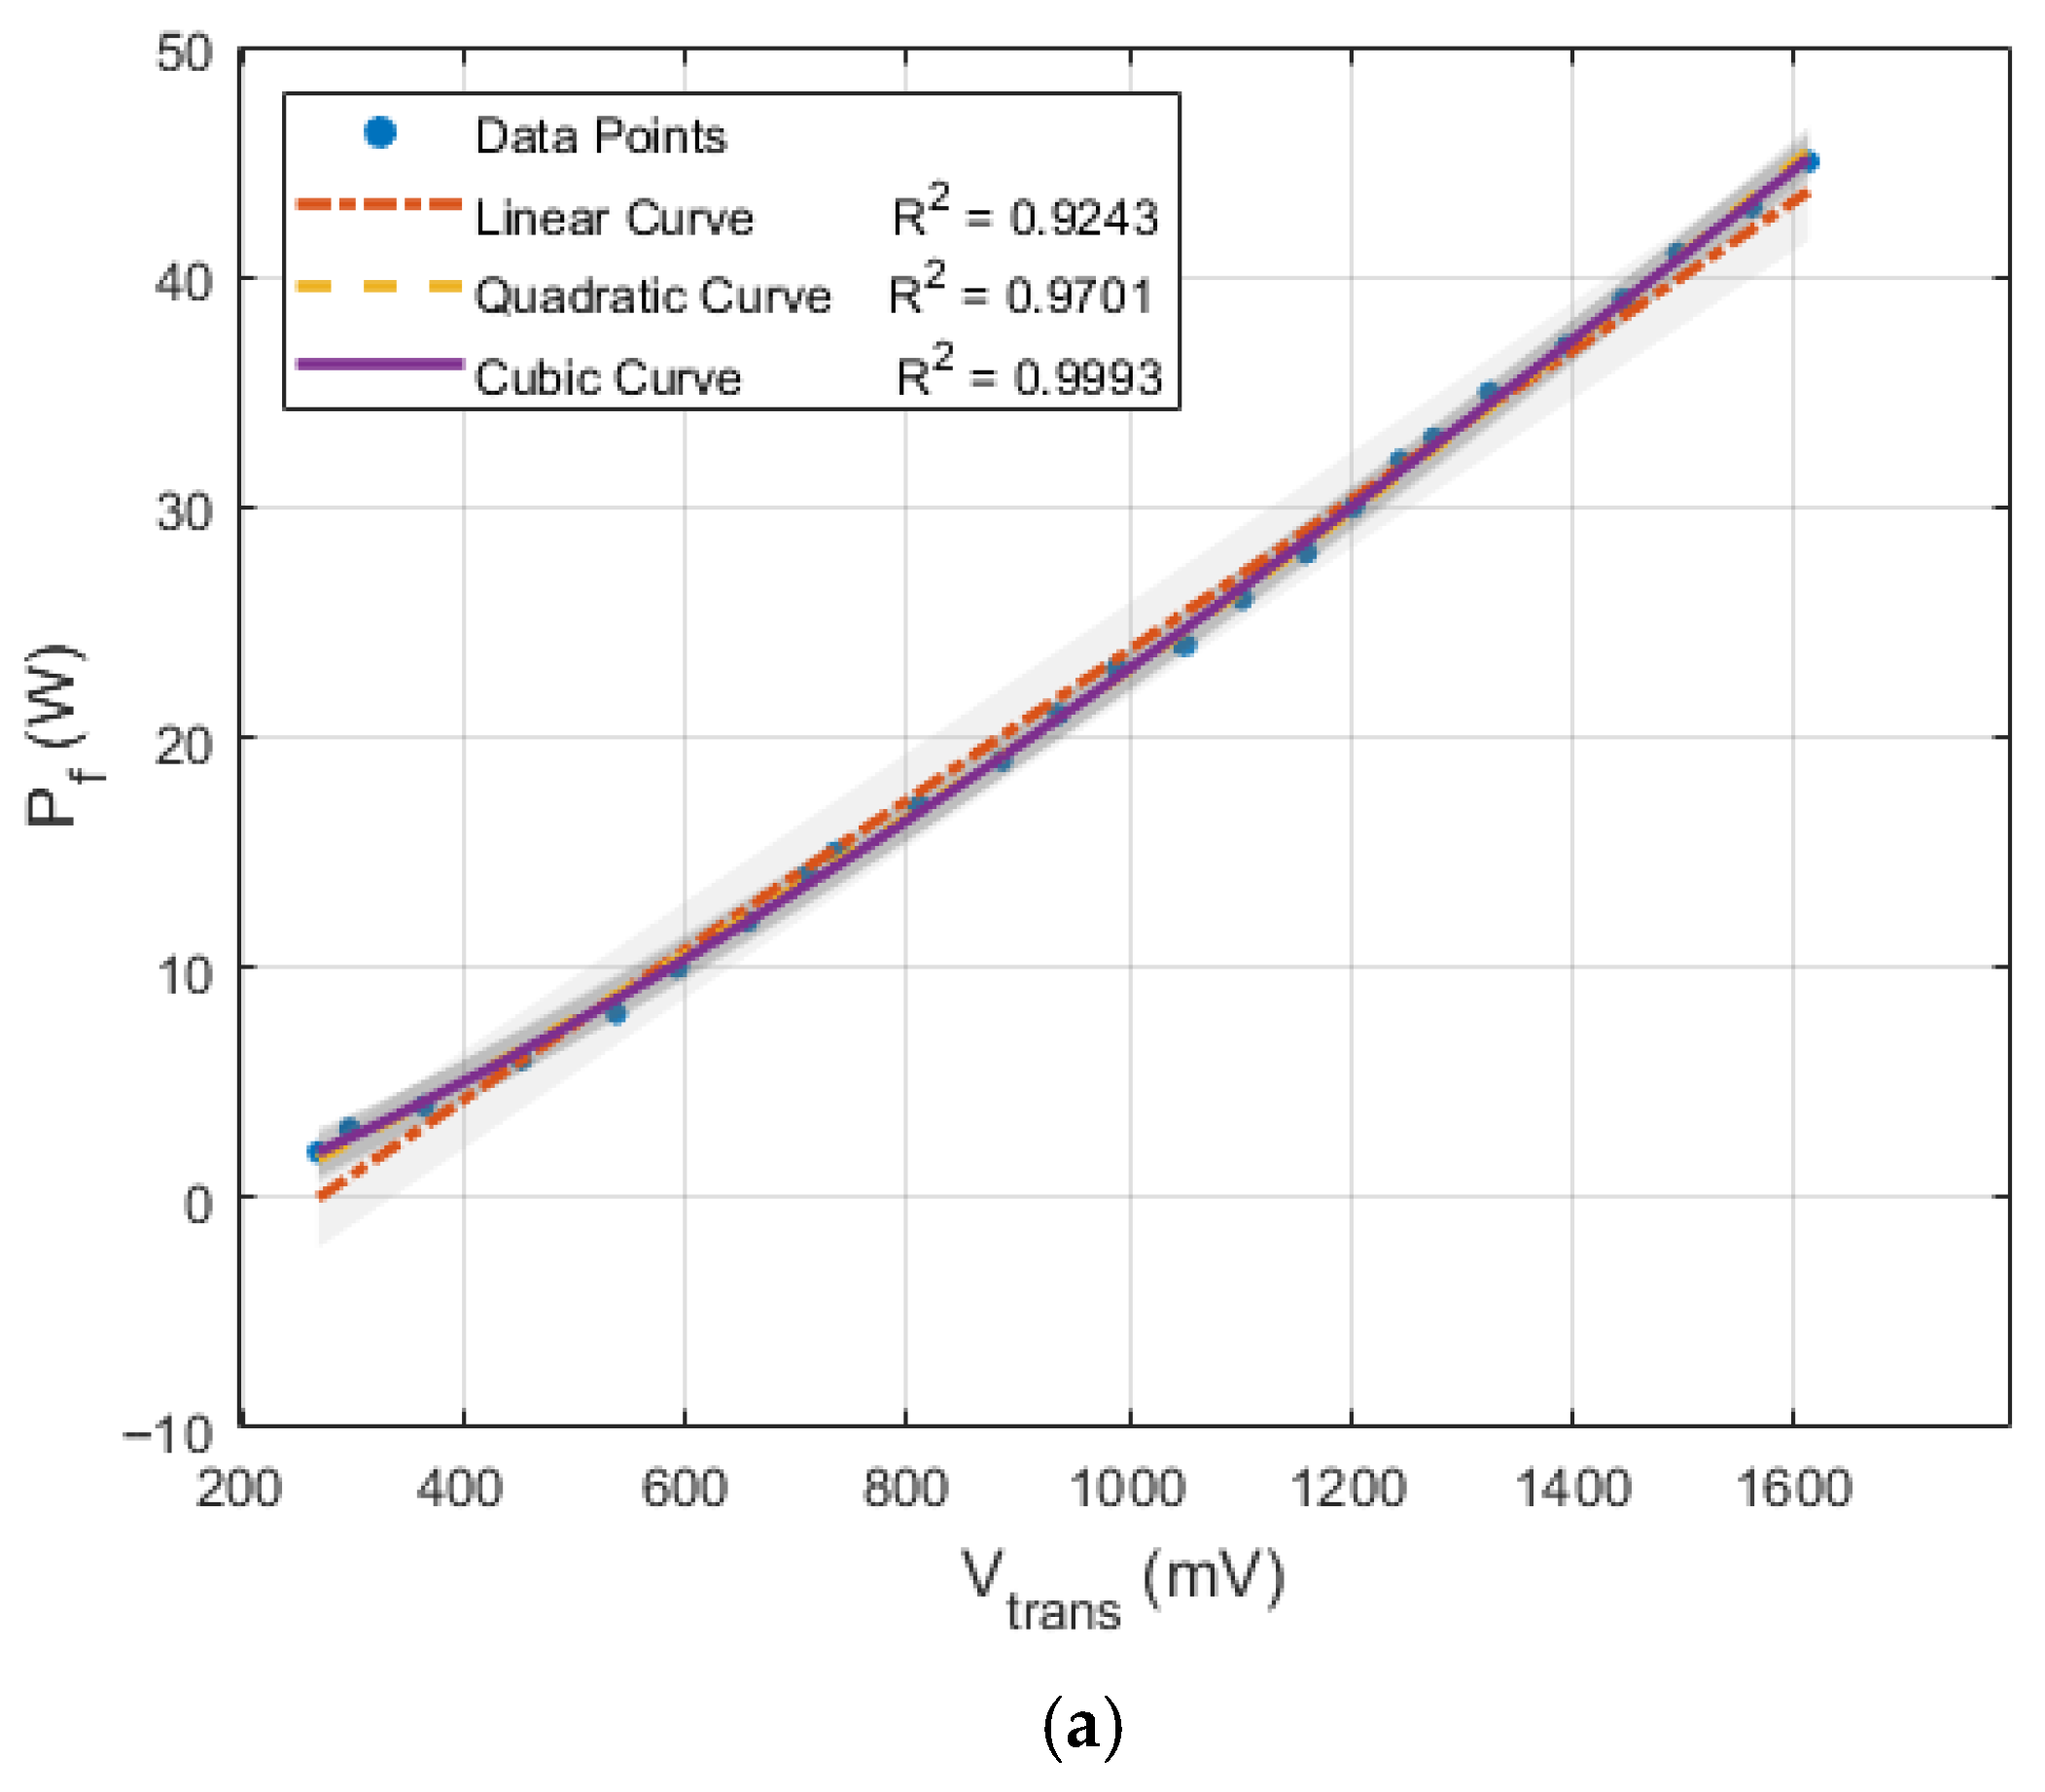
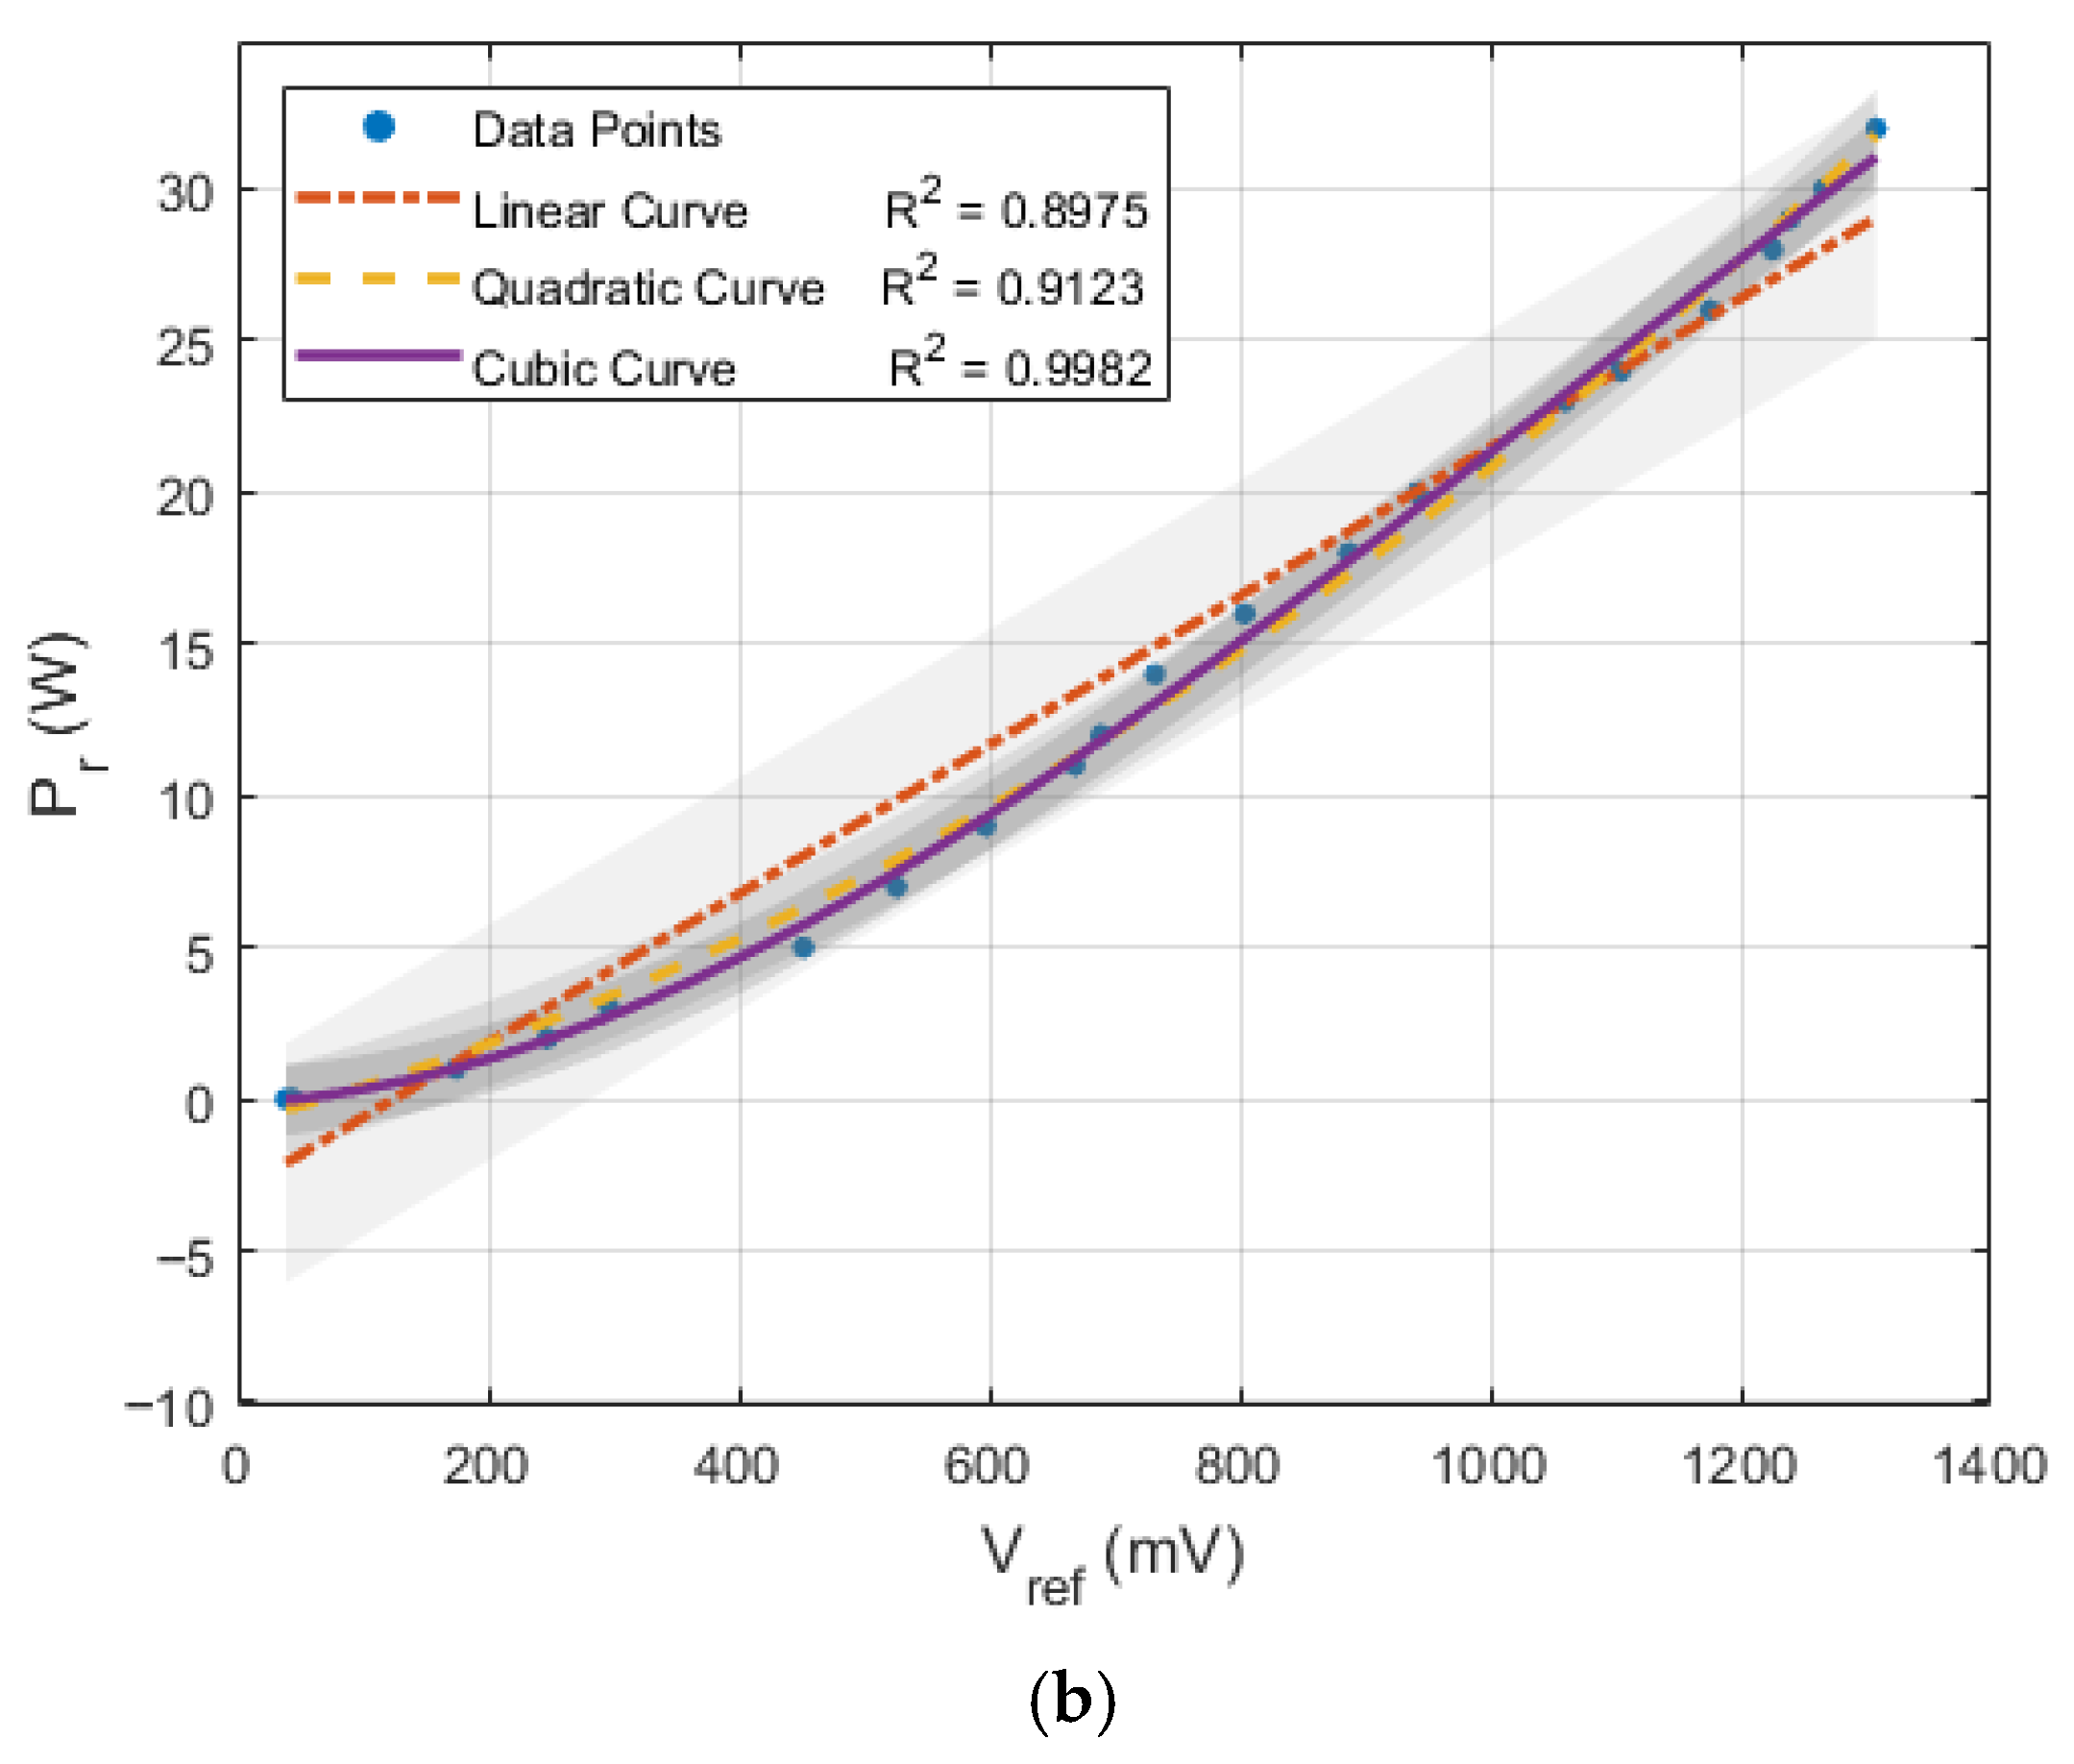
To construct the power–voltage model, a curve regression approach is adopted. The experimental data including forward and reverse power values and their corresponding voltages are analyzed to establish a suitable mathematical model, followed by an error evaluation. Specifically, linear, quadratic, and cubic regressions are applied to fit the forward power versus voltage relationship, as shown in Figure 7.
Figure 7 shows that the linear fitting curve only aligns with a small subset of the sample data and significantly deviates from the overall distribution, resulting in large calibration errors. In contrast, both the quadratic and cubic fitting curves closely match the majority of the data. Notably, when the reflected voltage lies within the range of 500–1000 mV, the cubic curve provides a better fit than the quadratic curve. Furthermore, when the reflected voltage exceeds 1250 mV, the cubic fit remains consistent with the data trend, whereas the quadratic curve begins to diverge. Therefore, in this study, the parameters obtained from the cubic fitting curve are adopted to construct the reflected power calibration model. It is important to note that this cubic regression model is a calibration model based on the detection circuit used in this study, and its parameters are derived from fitting the experimental data. When the circuit topology, component parameters, or operating conditions change, recalibration is necessary to obtain new model coefficients. The fitting process is implemented using the curve_fit function in Python 3.7, and the resulting parameters are as follows:
P r = 8.617 × 10 9 V r e f 3 + 2.769 × 10 5 V r e f 2 + 0.002 V r e f 0.166
P f = 5.289 × 10 9 V t r a n s 3 + 2.067 × 10 5 V t r a n s 2 + 0.009 V t r a n s 1.738
Through the calibration of the forward and reflected voltage signals in the standing wave detection circuit, the corresponding forward and reflected power values in the power transmission system are obtained, and the VSWR is subsequently calculated. As shown in Equation (14), under ideal conditions, the power transmission circuit produces no standing waves, and the VSWR equals 1:
V S W R = 1 + P r P f 1 P r P f

3.2. Correlation Model Between VSWR and Tool Tip Amplitude

In ultrasonic machining systems, the effective amplitude at the tool tip is commonly used as a criterion for evaluating whether the system is operating as expected. Under ideal conditions, where the VSWR is equal to 1, no standing waves are generated in the power transmission circuit. However, during system operation, factors such as load variation and transducer temperature rise cause nonlinear changes in the dynamic branch impedance of the transducer’s equivalent circuit, leading to impedance mismatch with the ultrasonic generator. In this case, the transducer exhibits reactive characteristics, reverse voltage is generated, the VSWR increases, and the output amplitude of the tool tip decreases. Therefore, the relationship between VSWR and the effective amplitude of the tool tip can be used as a discriminant model for evaluating the impedance matching status of the system.
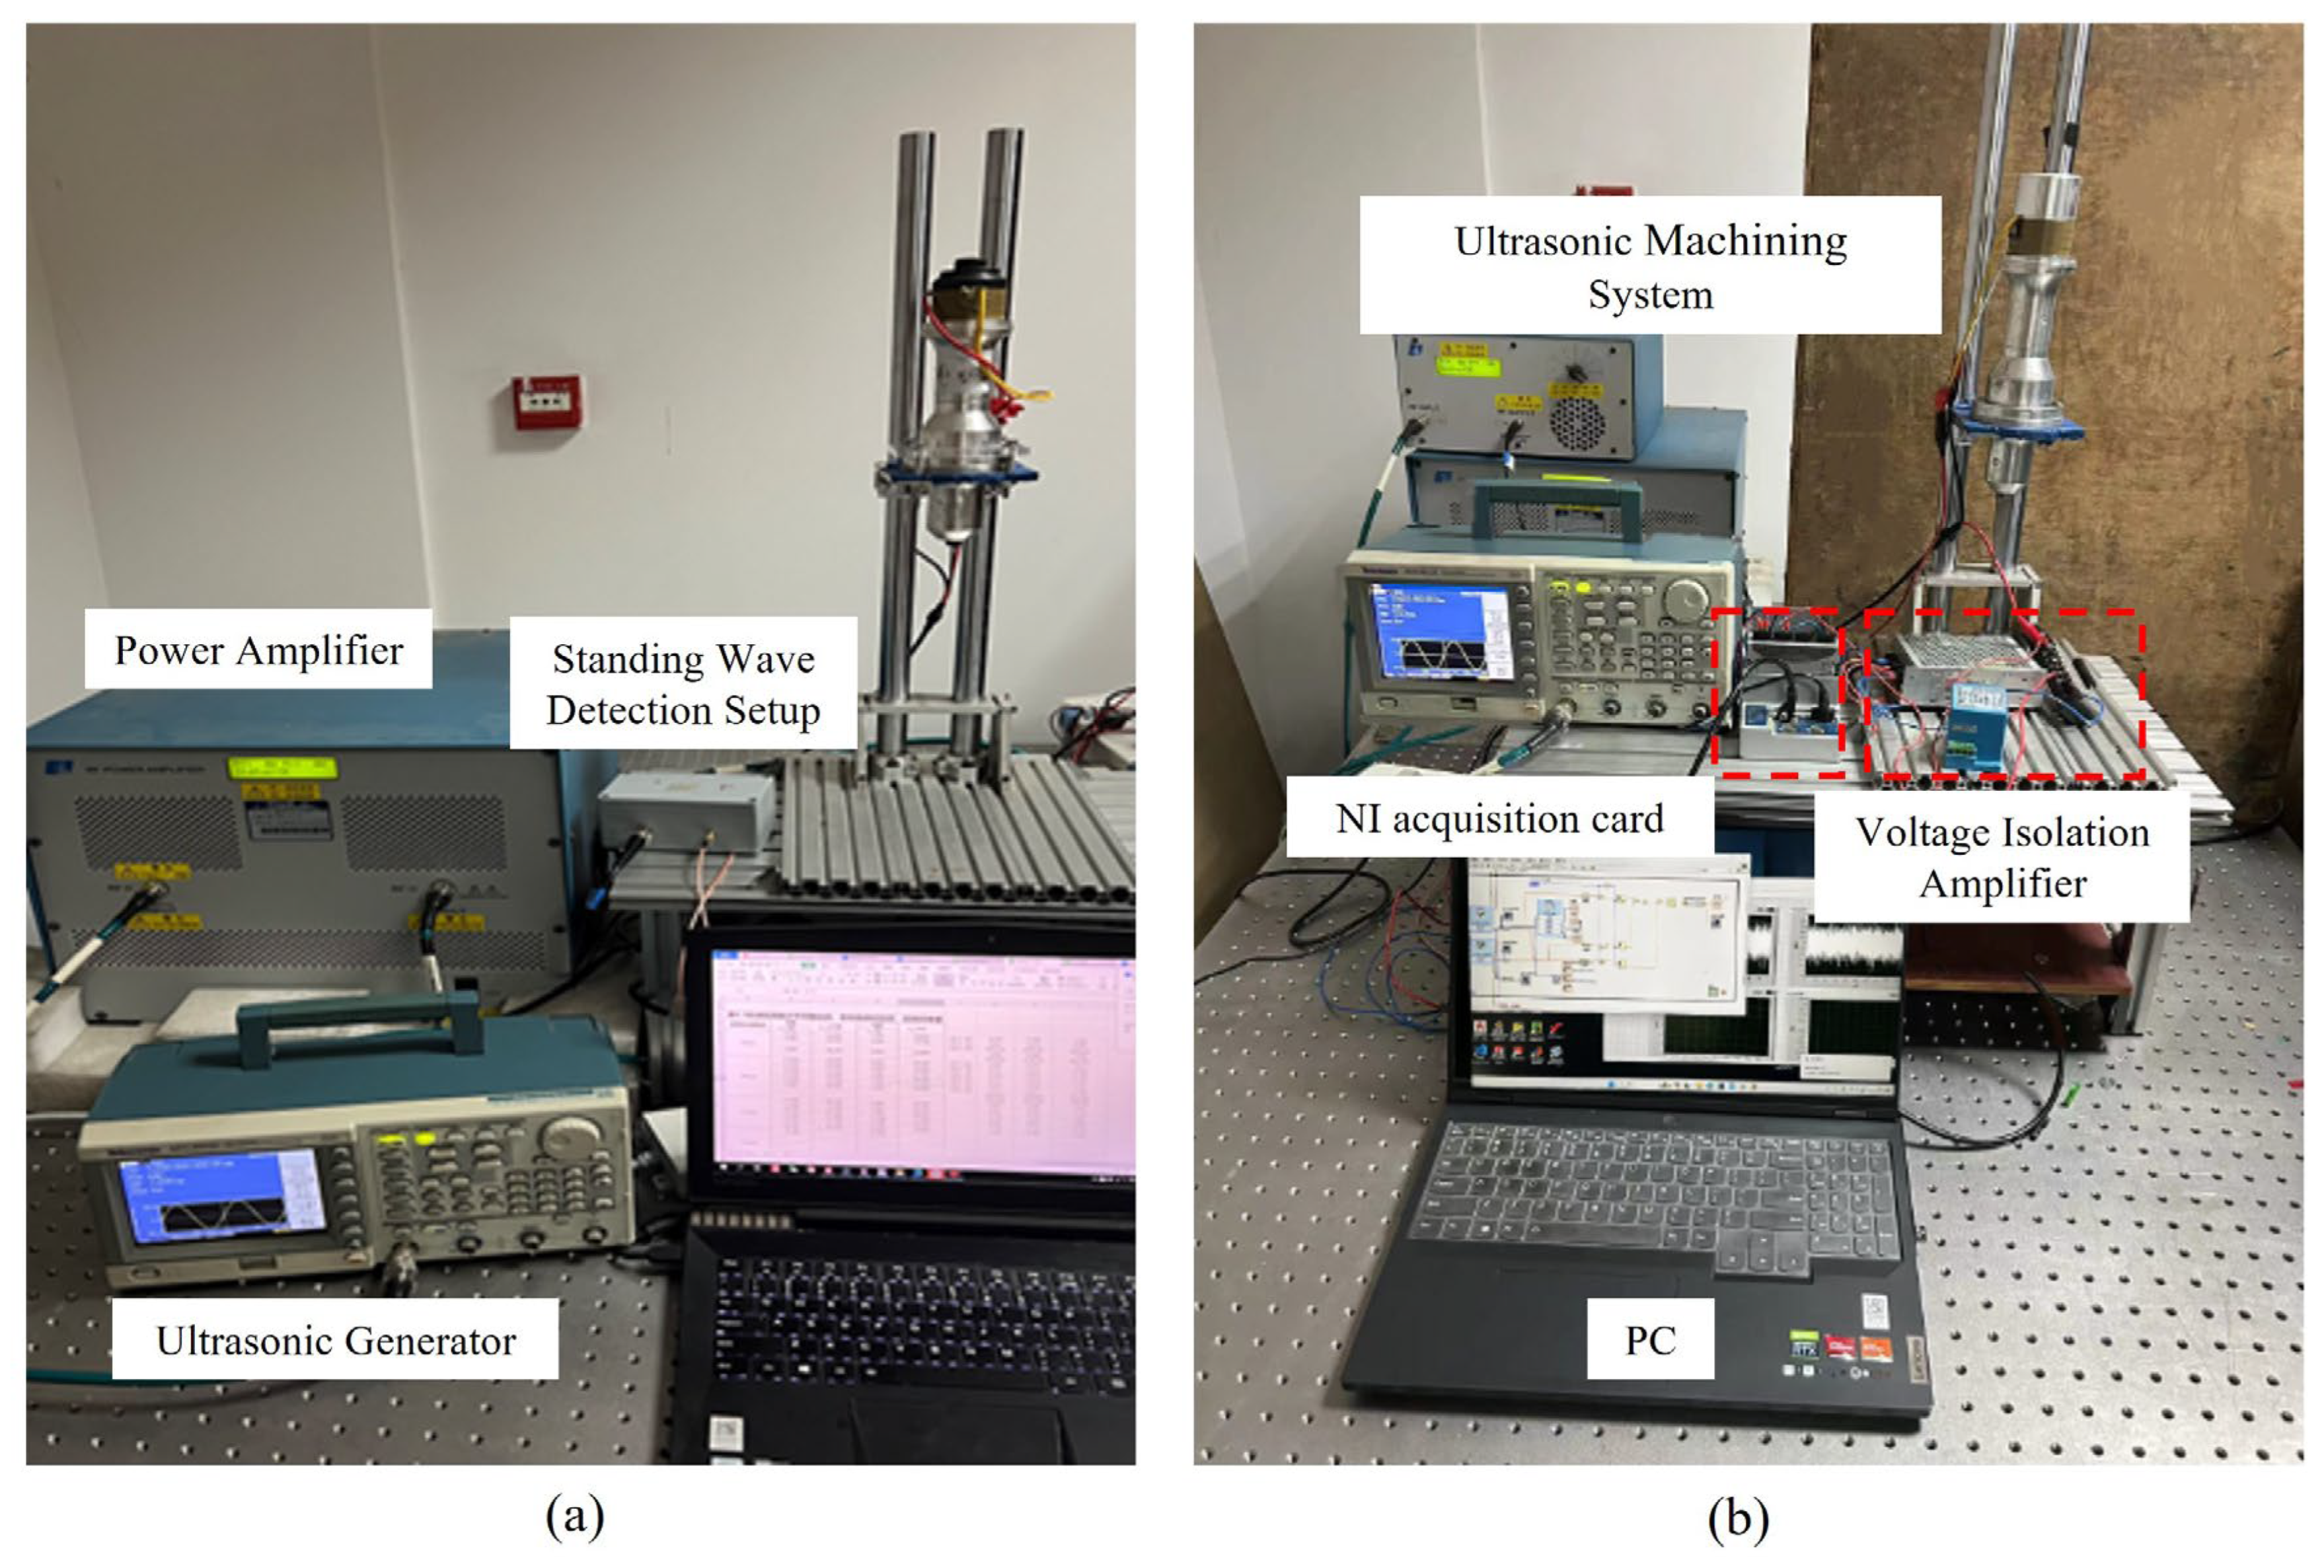
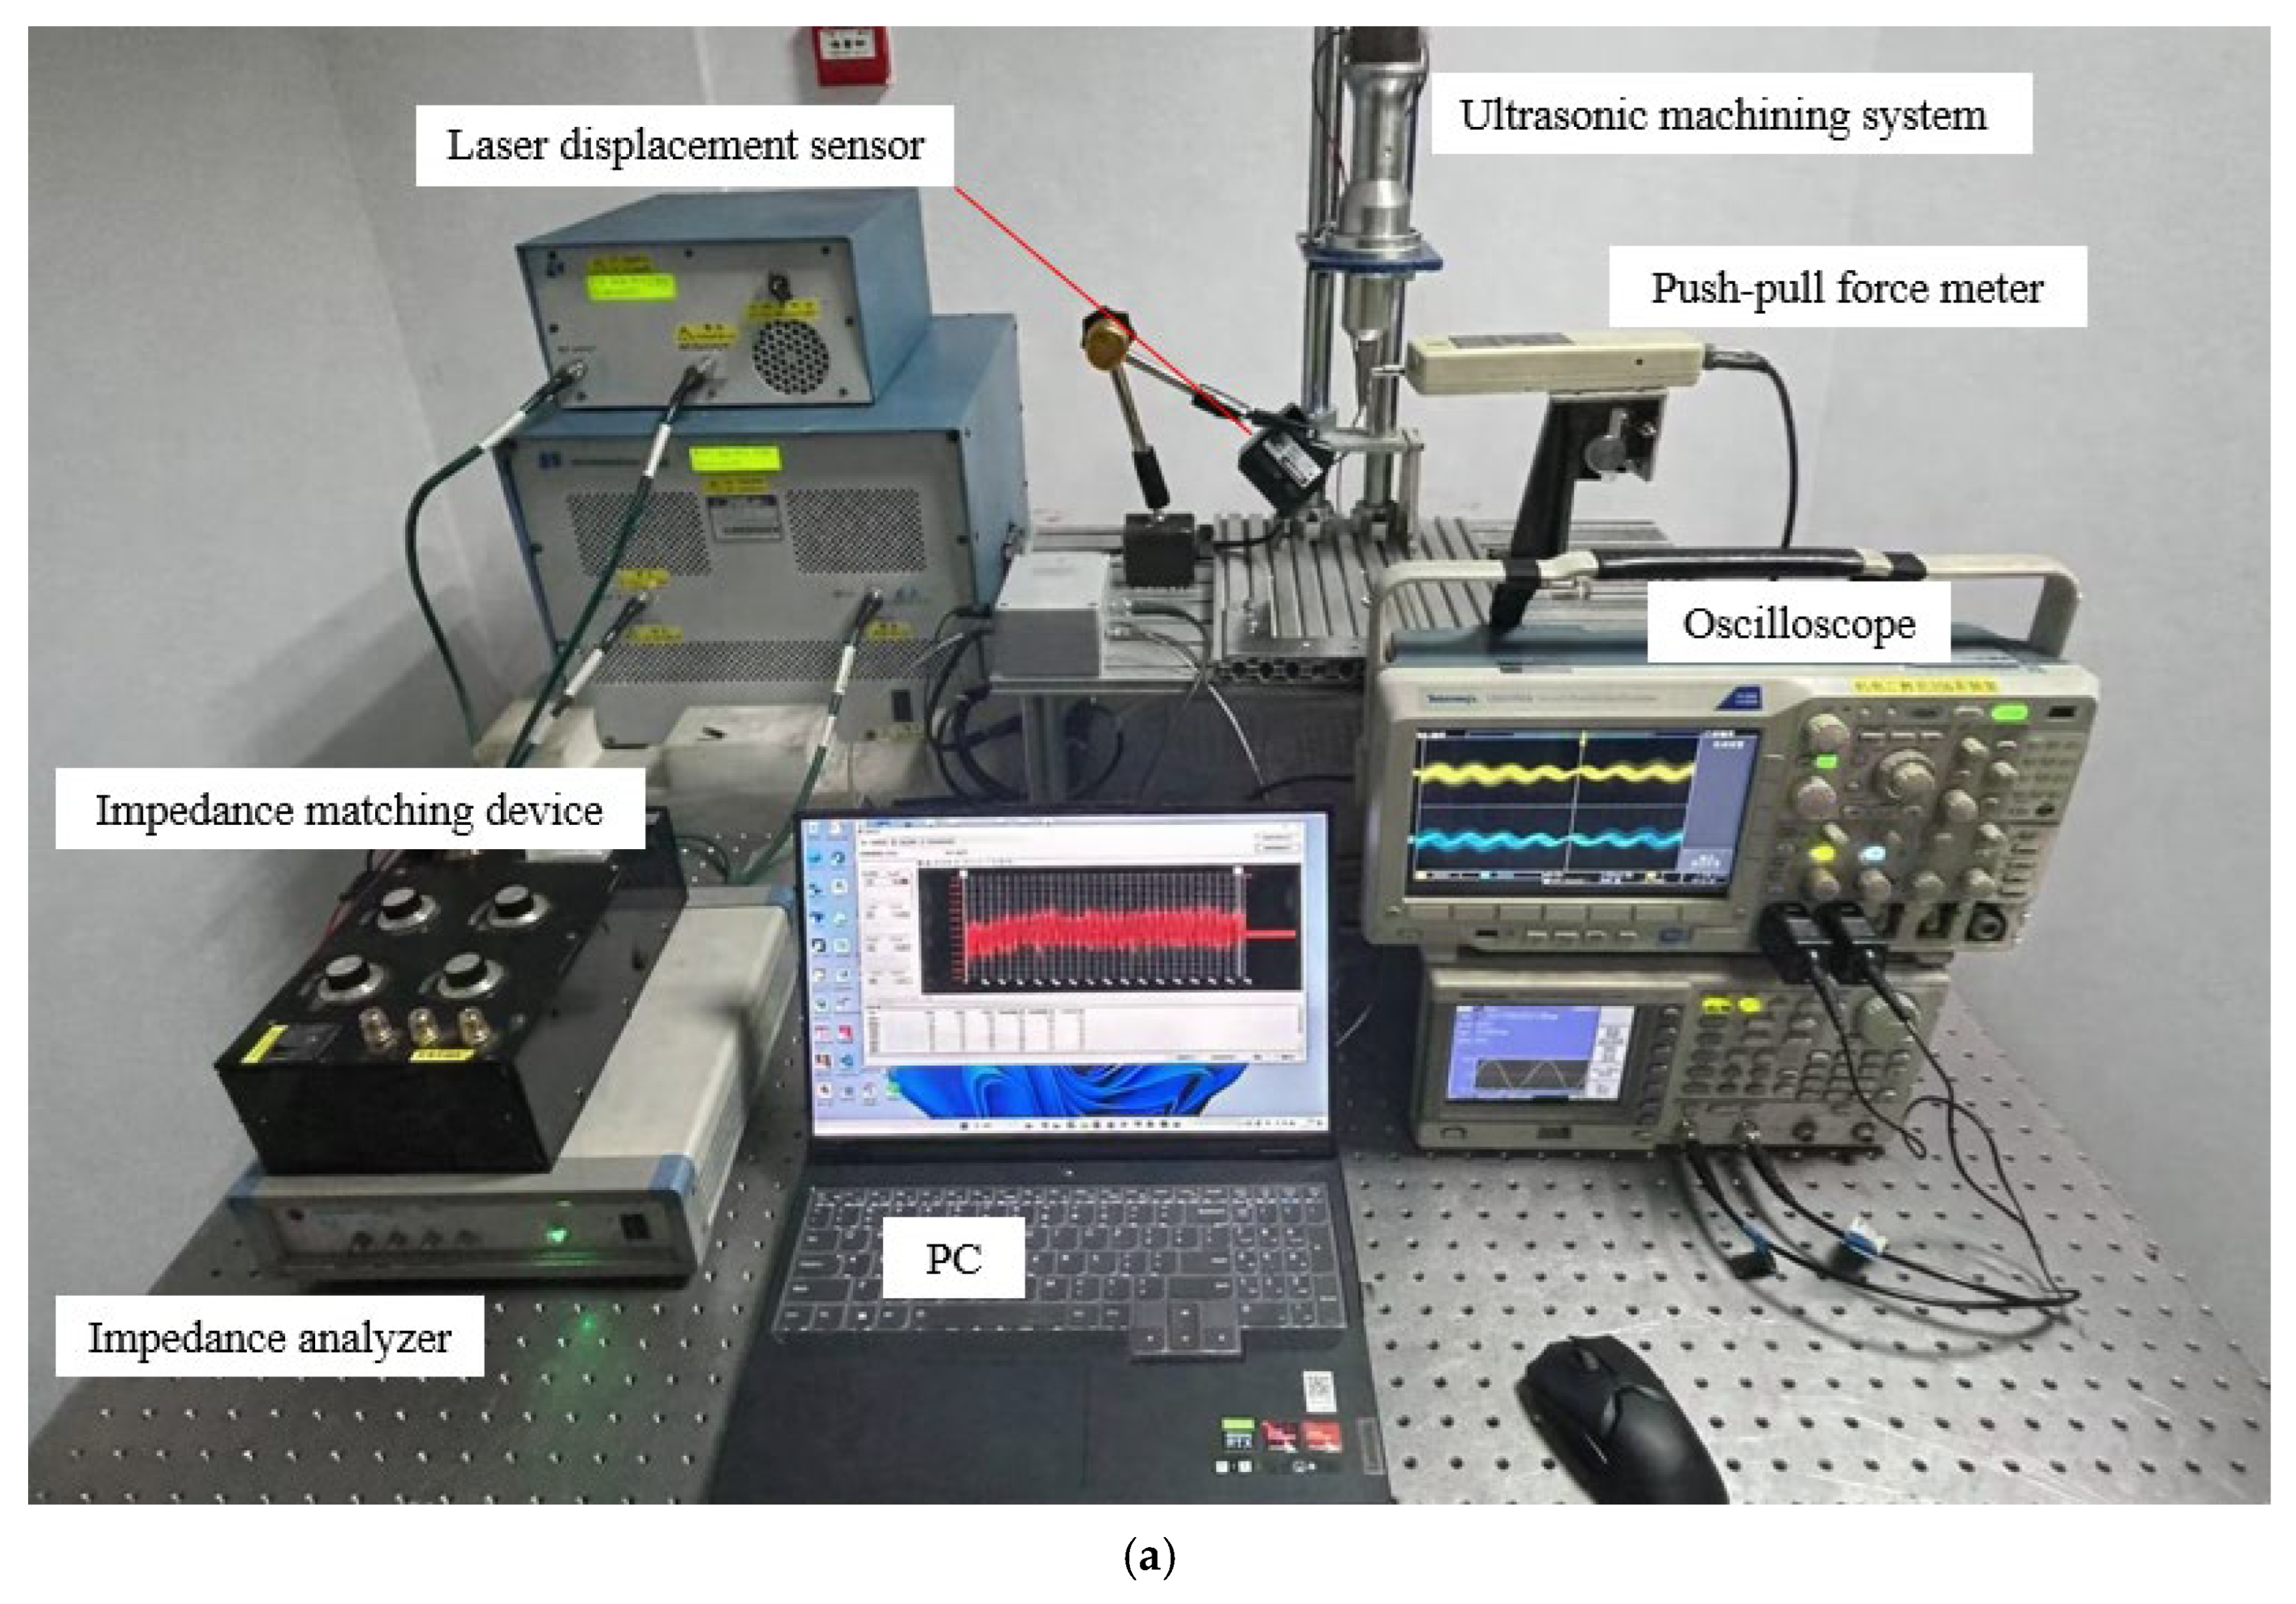
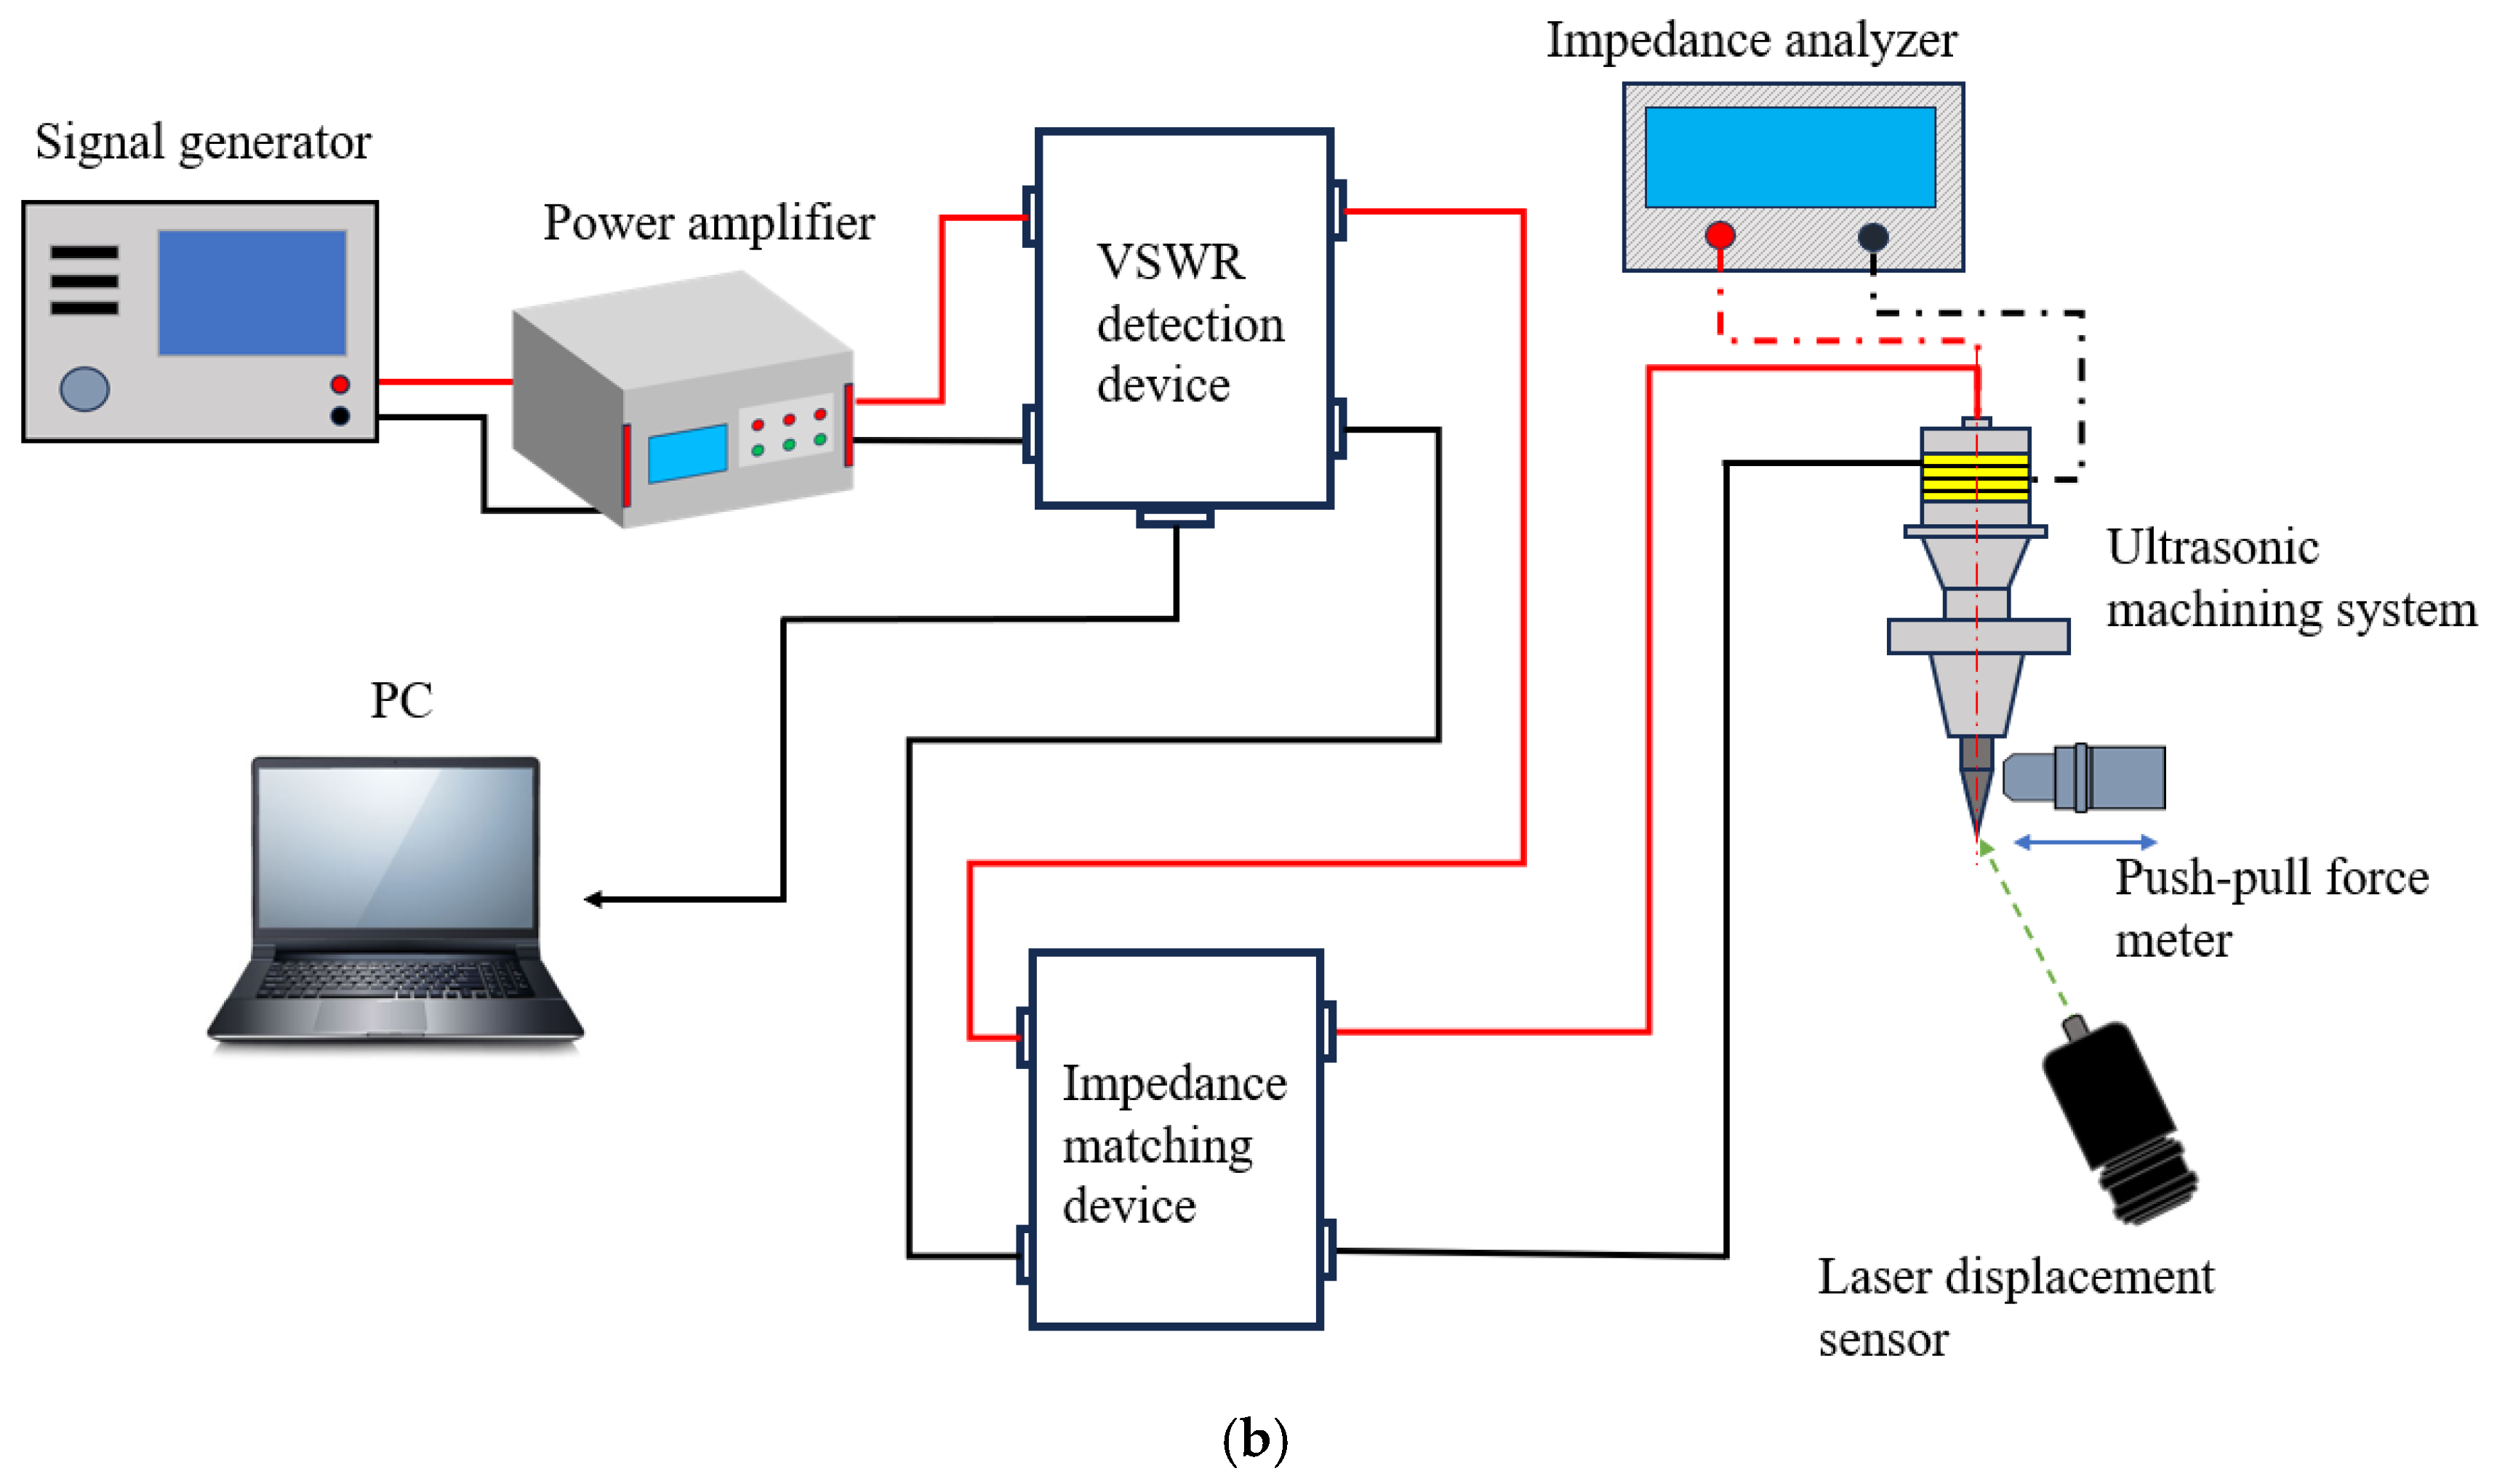
In this experiment, a signal generator and power amplifier are used to simulate the high-frequency electrical signals output by the ultrasonic power supply, which are then connected to the standing wave detection module. After being matched by the impedance matching device, the signal enters the ultrasonic vibration system. The ultrasonic vibration system is fixed on the test stand, and the tool tip amplitude is measured using the LK-H025 laser displacement sensor from Keyence, Osaka, Japan. The HP-50 digital push–pull force meter, with an accuracy of 0.5% and a minimum reading of 0.01 N, was used to apply the force load. The overall experimental setup is shown in Figure 8. The dashed line in Figure 8b represents the impedance measurement of the tool holder under static (non-operating) conditions using an impedance analyzer.
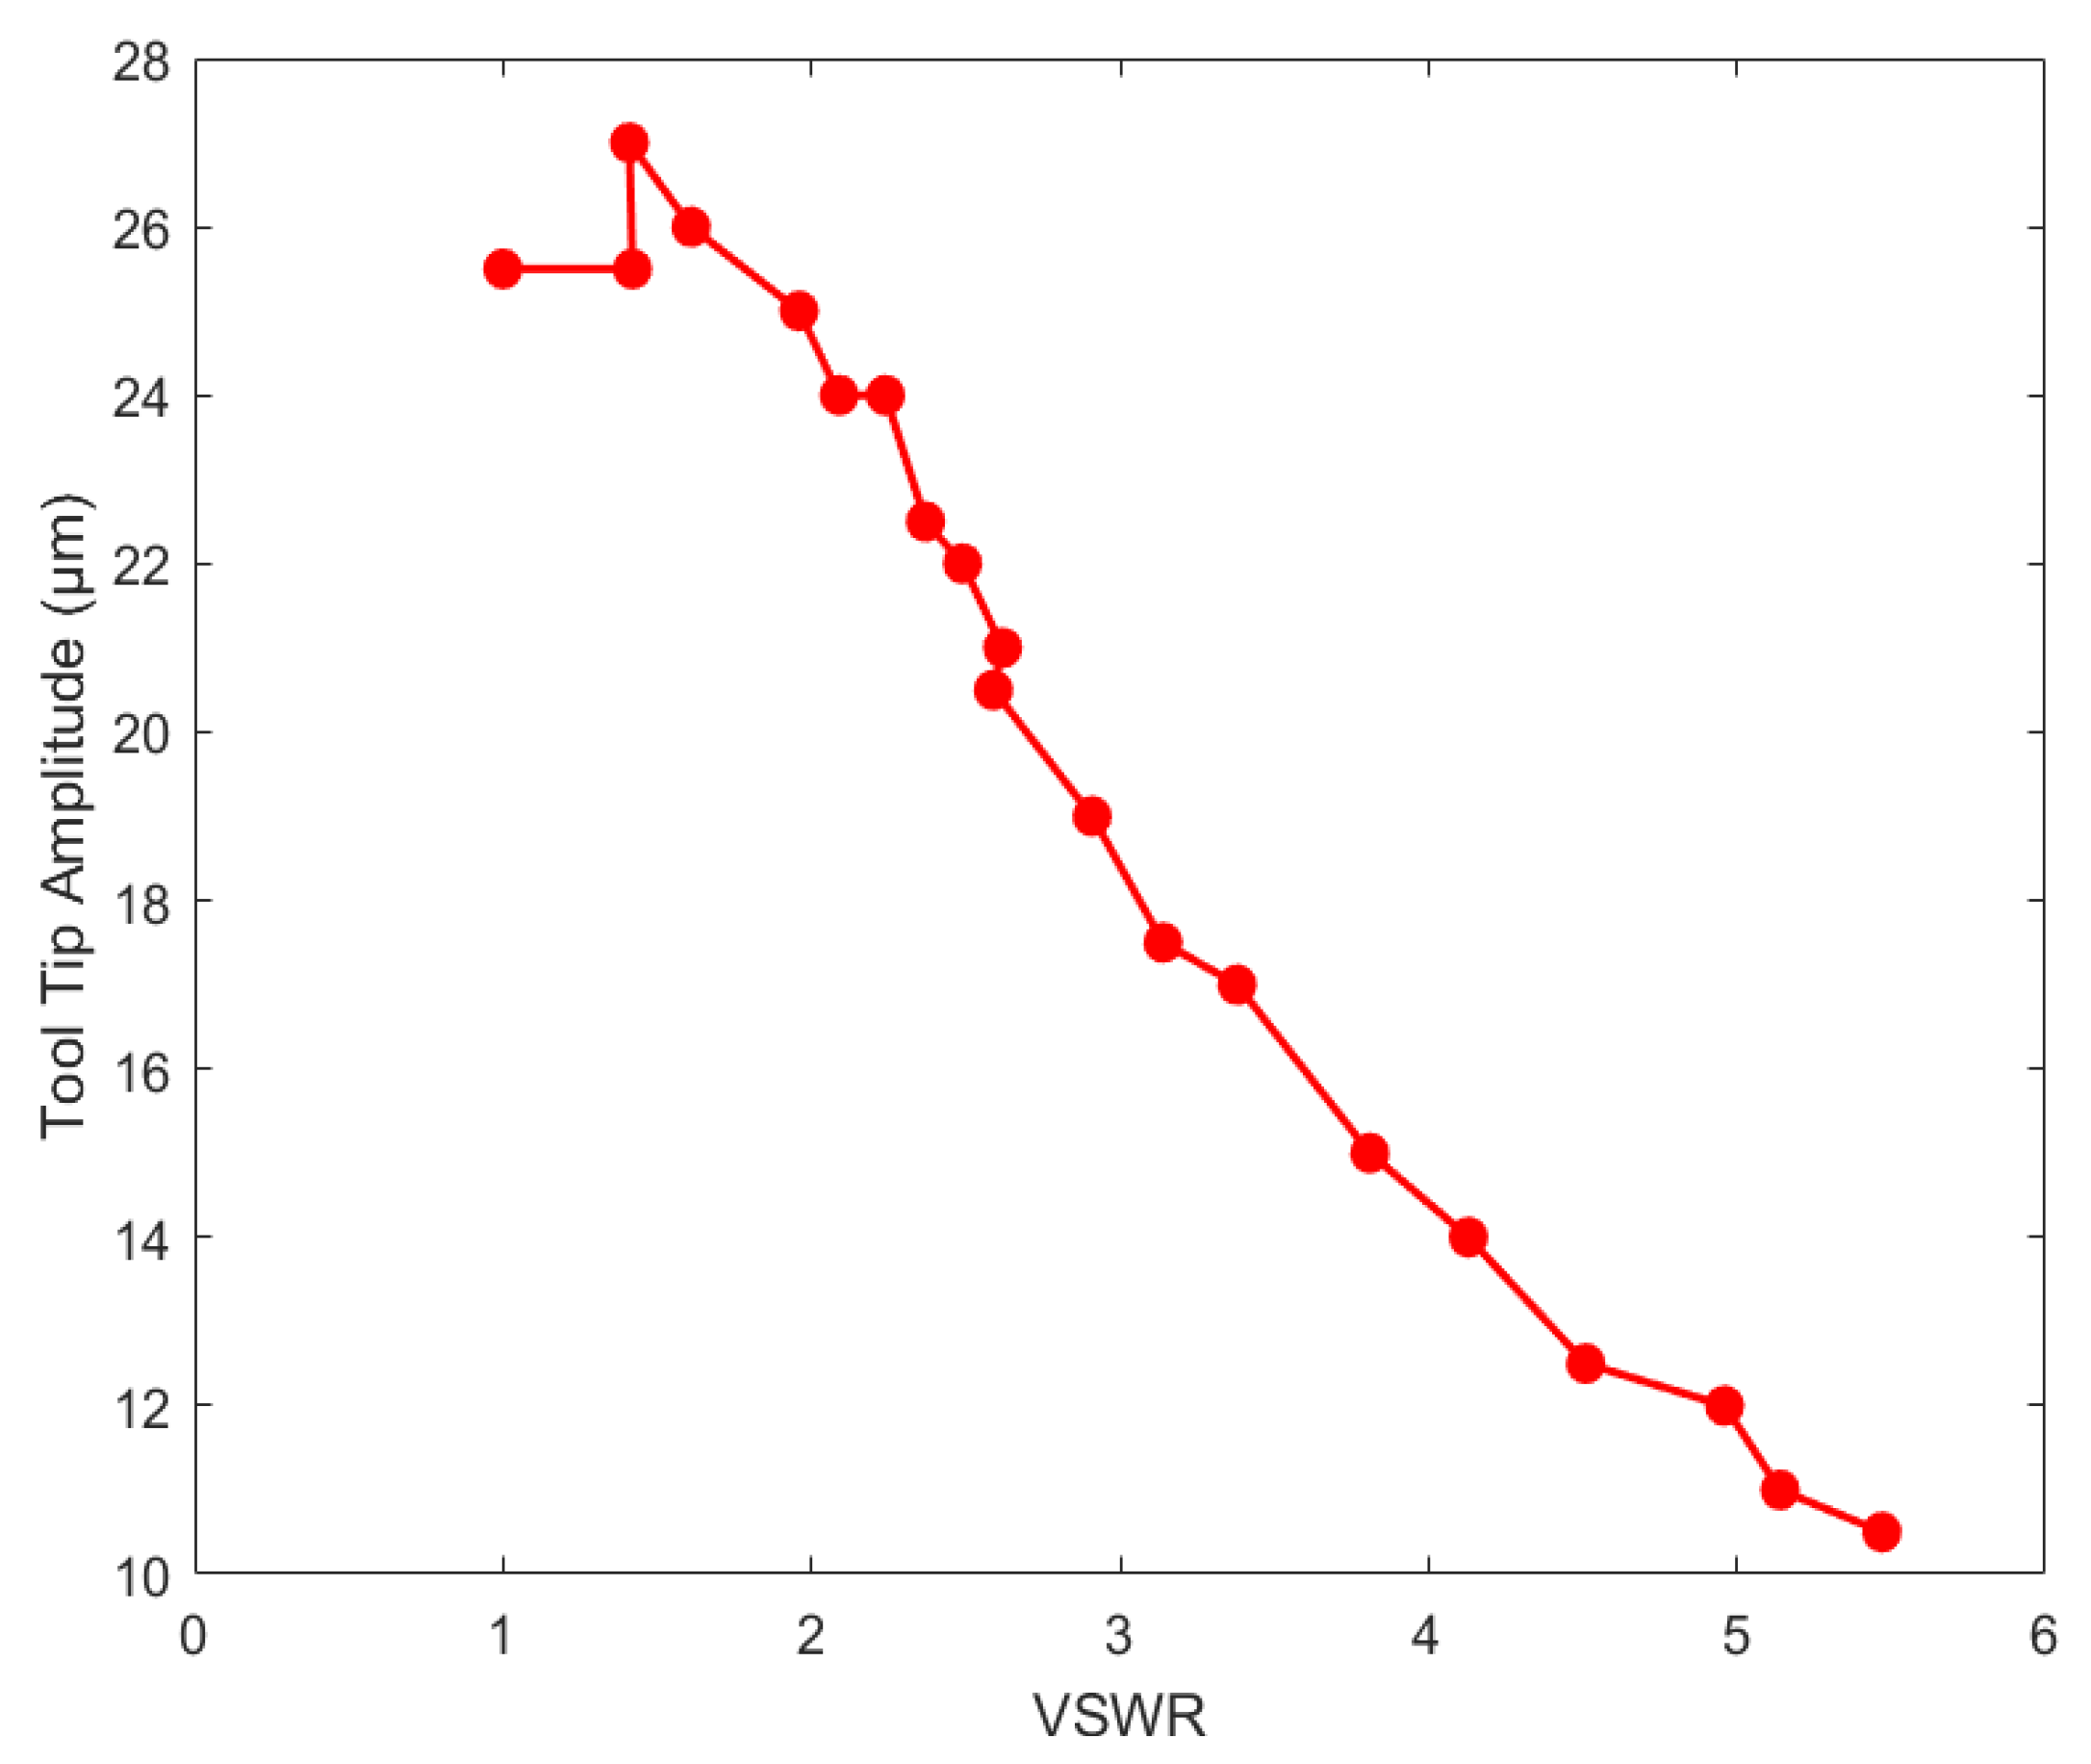
Based on the acoustic parameters measured by the impedance analyzer, an output voltage from the signal generator that produced an effective tool tip amplitude was selected. The output frequency was then adjusted to ensure that the VSWR approached 1 and the reverse power approached 0, representing an ideal impedance matching condition. Under this state, the output amplitude and corresponding VSWR of the ultrasonic machining system were recorded. Subsequently, the signal generator frequency was adjusted to introduce impedance mismatch, and the output amplitude of the tool tip was recorded under different VSWR conditions. Using the collected experimental data, the relationship between tool tip amplitude and VSWR was plotted, as shown in Figure 9.
Figure 9 shows that the tool tip amplitude initially increases with rising VSWR, reaching a stable range between 25 and 27 μ m when the VSWR is between 1 and 2. Within this range, the ultrasonic vibration system operates smoothly, and the amplitude meets the requirements for stable cutting. However, mild impedance mismatch (as shown in the figure, where VSWR increases from 1 to 1.6; at VSWR = 1.6, the ratio of Pr/Pf is only 0.06) does not cause significant power loss but rather affects the impedance matching of the ultrasonic system. Since the ultrasonic machining system is a coupled electromechanical resonant system, a slight mismatch may bring the system’s operating point closer to the mechanical resonance peak, thereby temporarily increasing the amplitude. When the VSWR exceeds 2, the amplitude decreases rapidly, and the system begins to exhibit instability accompanied by howling noise. We believe that this phenomenon is an inherent characteristic of the ultrasonic system under mild impedance perturbations. As VSWR continues to increase, the amplitude further declines, indicating significant impedance mismatch. Therefore, in the ultrasonic machining system studied in this paper, maintaining the VSWR range between 1 and 2 is considered optimal, as it ensures effective impedance matching.

4. Experimental Validation and Method Comparison

4.1. Experimental Validation

Before the experiment, the system’s parameters under the initial conditions were measured and recorded using the experimental setup shown in Figure 8, with the specific data provided in Table 1.
To investigate the relationship between VSWR and the tool tip output amplitude under simulated operating conditions, dynamic load variations were introduced by adjusting the applied force using the push–pull force meter and modifying the output voltage of the signal generator. Under each operating condition (i.e., with the same applied force load and identical dynamic resistance R1), five independent measurements were conducted at different time intervals. The arithmetic mean of the collected data was then calculated to minimize the influence of random errors on the results. The corresponding tool tip amplitudes and dynamic resistance R1 of the ultrasonic machining system under various working conditions were recorded. The Pf and Pr displayed in the table were obtained through fitting based on the collected voltage, from which the measured VSWR was derived, whereas the standard value was calculated by reading the data displayed on the transformer screen.
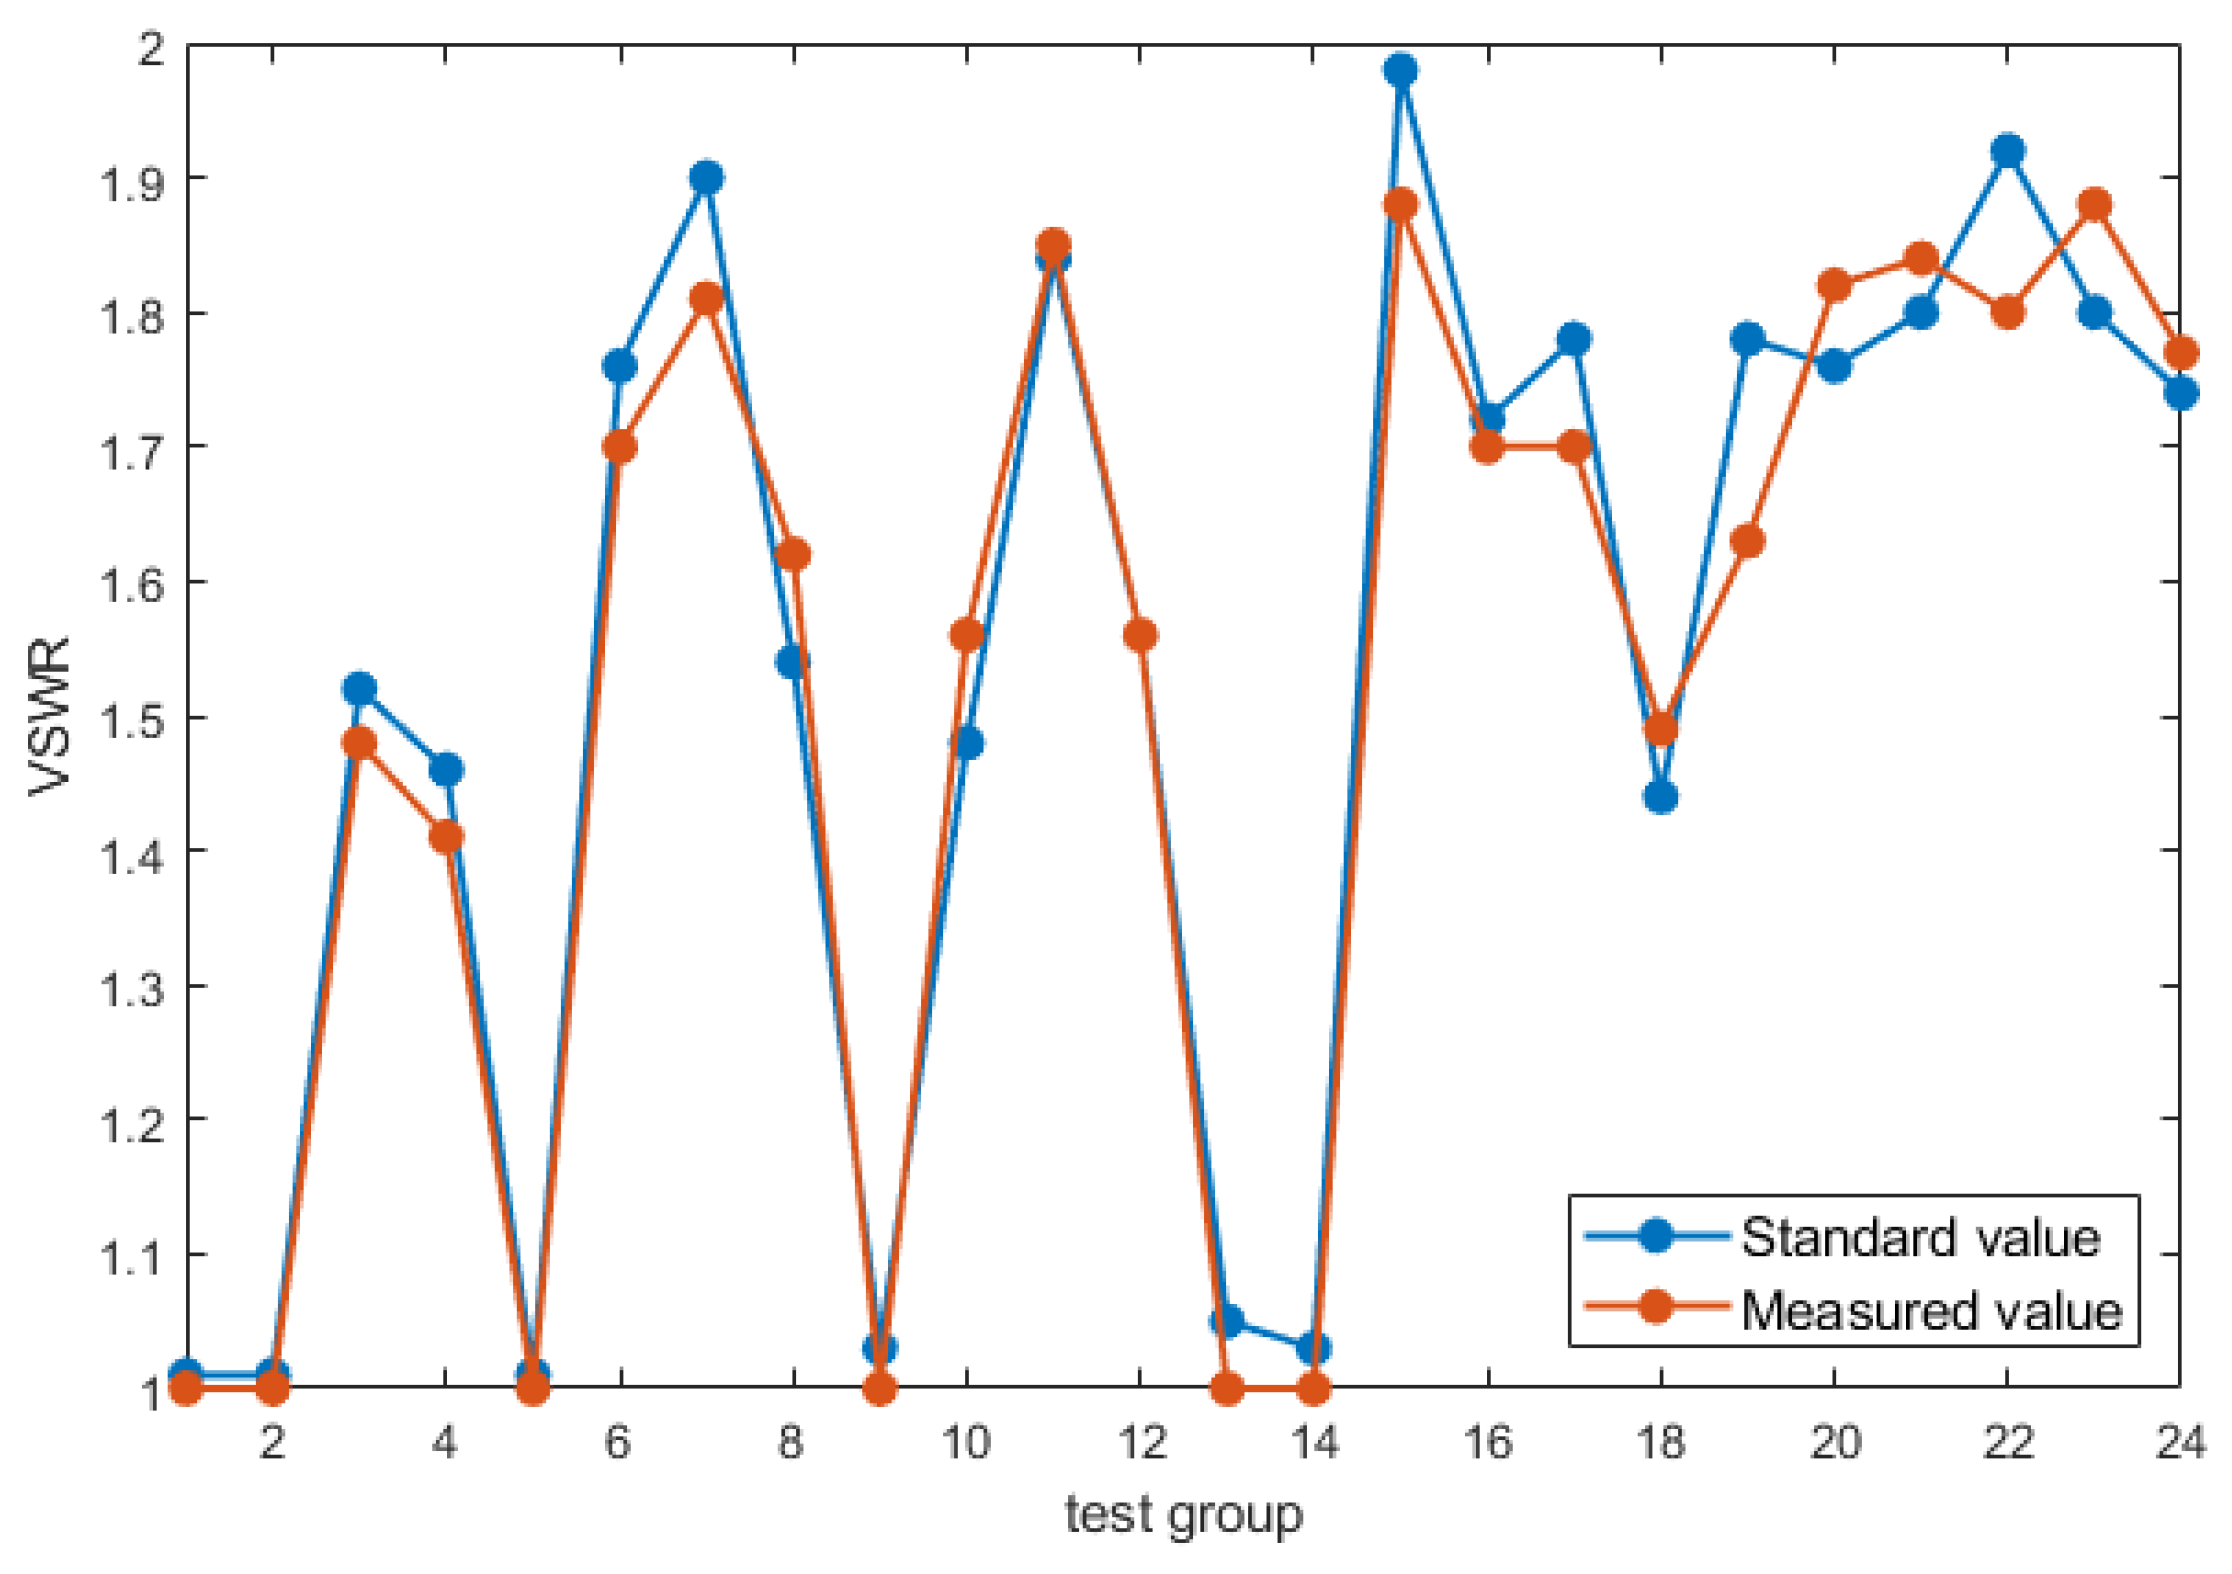
Table 2 shows that changes in the applied force lead to an increase in the dynamic resistance R1, which corresponds to the load and energy consumption of the ultrasonic vibration system. It can be considered that, under impedance matching conditions, the magnitude of the dynamic resistance R1 directly affects the output amplitude of the tool tip. Meanwhile, the VSWR of the ultrasonic machining system changes with varying operating conditions. As the output voltage of the signal generator increases, both the reverse power and the output amplitude of the cutting tool increase accordingly. In addition, measurement errors inherent to the standing wave detection circuit tend to grow with higher power levels. Due to heat generation within the ultrasonic vibration system, minor fluctuations in VSWR may occur. However, when the VSWR remains within the 1–2 range, which aligns with the impedance matching criteria outlined in Section 2.2, the system maintains a stable and effective working state. Figure 10 plots a comparison between the standard and measured VSWR values. As shown, the measured VSWR closely matches the theoretical values, with a deviation of less than 7%, confirming the high accuracy of the detection method.
To ensure that the impedance characteristics of the ultrasonic vibration system are effectively correlated with changes in VSWR, this study measures the impedance characteristics of the transducer-tool assembly under different working conditions and analyzes the impact of impedance on the VSWR. The impedance variation caused by temperature changes has been previously analyzed in our research [10].
Using the experimental setup shown in Figure 8, the temperature variation of the transducer is recorded with a Fluke VT04 infrared thermometer, and impedance data is collected using an impedance analyzer. In the experiment, the initial acoustic parameters of the ultrasonic vibration system were first measured and recorded using the impedance analyzer. The voltage and frequency of the output signal from the impedance matching device and signal generator were adjusted to bring the ultrasonic vibration system into a normal working state, and the system’s force load, temperature, and forward and reflected power, as well as the output amplitude of the cutting tool, were recorded. Then, the force applied to the ultrasonic cutting tool was simulated using a push–pull force meter, while the transducer was uniformly heated with a hot air gun, and the forward and reflected power, as well as the output amplitude of the cutting tool, was recorded under different temperature and cutting force load conditions. After diagnosing an impedance mismatch when the VSWR exceeds 2, the dynamic matching inductance of the impedance matching device was adjusted by measuring the changes in dynamic resistance and static capacitance, while corresponding adjustments were made to the output frequency, voltage, and matching parameters of the signal generator to restore the VSWR to normal, and the output amplitude of the cutting tool was measured. Finally, the above steps were repeated to record the changes in output amplitude and forward and reflected power before and after adjustment under various working conditions. The corresponding experimental data and relative error analysis are summarized in Table 3.
Under the condition of keeping the signal generator output unchanged, typical faults such as frequency mismatch, impedance mismatch, and power mismatch occurred in the ultrasonic machining system by changing the cutting force load and transducer temperature, leading to varying degrees of decrease in the tool tip output amplitude. In these cases, VSWR, as an indicator of impedance matching, reflects the system’s operational state. When the VSWR exceeds 2, it indicates that impedance mismatch is present, causing an increase in power reflection and a decrease in amplitude. By adjusting the matching parameters, the VSWR can be restored to a normal range, resulting in a significant increase in output amplitude.
After adjusting the frequency, impedance, and power matching parameters, the VSWR was significantly improved and approached the standard for impedance matching. In the fourth set of experiments, the adjusted VSWR was 2.08, which is close to the ideal impedance matching range. Although the VSWR slightly exceeded 2 due to transmission line thermal losses and the energy storage effect of matching components during the experiment, it remained within an acceptable range, demonstrating the important role of VSWR in impedance matching.

4.2. Comparison with Phase-Based Detection Method

The phase difference between the AC voltage and current is a key parameter in three-phase circuits and is closely related to quantities such as the power factor (cos φ), active power (P), and reactive power (Q). Therefore, impedance matching in ultrasonic processing systems is often monitored using phase detection methods. Typically, an XOR-gate-based phase detector is employed, where a zero-crossing comparator converts the sinusoidal voltage and current signals into square waves. These signals are then processed through the XOR gate and digitized via an analog-to-digital (AD) sampling circuit. However, this signal chain is relatively complex, and analog circuits are susceptible to introducing spurious signals. In addition, harmonic components can cause zero-crossing drift, which negatively impacts the accuracy of phase detection [25]. To evaluate the performance of the standing wave detection method in comparison with the traditional phase detection approach, two corresponding experimental setups are established in this study, as illustrated in Figure 11. In this experiment, the NI 9222 acquisition card samples both current and voltage signals simultaneously at a sampling frequency of 100 kHz. To improve measurement accuracy, a 1 Ω current sampling resistor is used during current signal acquisition. The voltage signal is synchronized using a voltage transmitter with a 200:1 step-down ratio, capturing the voltage from the main circuit. The collected signals are processed through gain adjustment and low-pass filtering to remove high-frequency noise and ensure signal quality. The phase difference is calculated by computing the cross-correlation function between the voltage and current signals, which allows us to assess whether the system is in an impedance-matched state.
Multiple groups of simulation tests were conducted to compare the detection errors of the standing wave method and the traditional phase detection method. The test results are presented in Table 4, and the comparative error analysis is summarized in Table 5. From the perspective of signal acquisition type, data processing complexity, hardware requirements, and measurement accuracy, the standing wave method, which only requires AC voltage measurement, significantly simplifies the need for synchronized multi-signal acquisition as required by the phase detection approach. Under well-designed hardware conditions, the standing wave method achieves lower detection errors while maintaining high accuracy and system stability. These advantages make it a simple, efficient, and practical solution for real-time impedance matching monitoring in ultrasonic processing systems.

5. Discussion

This study introduced a standing wave-based method for impedance matching evaluation in ultrasonic machining systems, aiming to simplify signal acquisition and enhance real-time monitoring performance. The main contributions are as follows:
  • A standing wave detection circuit was designed to extract the forward and reflected voltage signals in the ultrasonic machining system, enabling the calculation of the VSWR and the analysis of power transmission characteristics.
  • A relationship between VSWR and tool tip amplitude was established. The system was found to operate stably when the VSWR ranged from 1.0 to 2.0 and the amplitude remained between 25 and 27 μ m , providing a practical threshold for impedance evaluation. The VSWR-based evaluation yielded results within 7% of theoretical values, and experiments under varying force loads and temperatures further verified the reliability of this characterization.
  • The proposed method evaluates the impedance matching status by extracting forward and reverse voltage signals, eliminating the need for synchronous voltage–current sampling and complex filtering procedures required in conventional phase detection approaches. This simplification of the circuit architecture enhances detection efficiency and reduces the cost of the monitoring system.
In conclusion, the standing wave detection method proposed in this study simplifies the signal acquisition path and reduces reliance on synchronous sampling and complex circuitry, thereby lowering the system’s implementation cost and complexity. This method provides a practical solution for impedance matching evaluation in ultrasonic machining systems, featuring a compact structure, stable detection performance, and ease of integration, with strong engineering adaptability and broad application potential. Nevertheless, the current validation and performance assessment were conducted mainly on our in-laboratory ultrasonic machining platform, covering only a limited range of load conditions and impedance-mismatch levels. Although the results demonstrate feasibility and good repeatability within this scope, further investigations are still required before the method can be generalized to other ultrasonic machining systems or more demanding industrial scenarios. Future work will therefore focus on extending its applicability under diversified machining conditions, as well as evaluating long-term stability and drift characteristics during continuous operation. In addition, calibration procedures for impedance matching and uncertainty quantification will be explored to further improve the quantitative accuracy and measurement reliability.

Author Contributions

All authors contributed to the study conception and design. The original draft of the manuscript was written by N.J. All authors commented on the previous version. All authors have read and agreed to the published version of the manuscript.

Funding

This work was supported by the Zhejiang Public Welfare Technology Research Project (LGG21E050010).

Institutional Review Board Statement

Not applicable.

Informed Consent Statement

Not applicable.

Data Availability Statement

Data are contained within the article.

Acknowledgments

We gratefully acknowledge the financial support provided by the relevant research projects and funding programs, which made it possible to carry out the experiments and complete the work reported in this study. Thanks are given to all the organizations or individuals who provided material and equipment support during the experiments. It is due to their help that we were able to carry out the research and experiments successfully.

Conflicts of Interest

The authors declare no conflicts of interest.

Abbreviation

The following abbreviation is used in this manuscript:
VSWRVoltage Standing Wave Ratio

References

  1. Jin, J.; Wang, X.; Bie, W.; Liu, Y.; Zhang, D. Machinability of SiCf/SiC ceramic matrix composites using longitudinal-torsional coupled rotary ultrasonic machining. Int. J. Adv. Manuf. Technol. 2024, 131, 2465–2476. [Google Scholar] [CrossRef]
  2. Sharma, A.; Babbar, A.; Tian, Y.; Yan, L.; Yu, M.Y. Machining of ceramic materials: A state-of-the-art review. Int. J. Interact. Des. Manuf. (IJIDeM) 2023, 17, 2891–2911. [Google Scholar] [CrossRef]
  3. Yuan, Z.; Xiang, D.; Peng, P.; Tan, H.; Ma, Y. A comprehensive review of advances in ultrasonic vibration machining on SiCp/Al composites. J. Mater. Res. Technol. 2023, 24, 6665–6698. [Google Scholar] [CrossRef]
  4. Mughal, K.H.; Qureshi, M.A.M.; Jamil, M.F.; Ahmed, A.; Masood, S.M. Investigation of hybrid ultrasonic machining process of Nomex honeycomb composite using a toothed disc cutter. Ultrasonics 2024, 141, 107343. [Google Scholar] [CrossRef]
  5. Sonia, P.; Jain, J.K.; Saxena, K.K. Influence of ultrasonic vibration assistance in manufacturing processes: A review. Mater. Manuf. Process. 2021, 36, 1451–1475. [Google Scholar] [CrossRef]
  6. Thoe, T.B.; Aspinwall, D.K.; Wise, M.L.H. Review on ultrasonic machining. Int. J. Mach. Tools Manuf. 1998, 38, 239–255. [Google Scholar] [CrossRef]
  7. Liu, L.; Lin, B.; Zhu, X. Optimization of rotary transformer for RUM with secondary self-compensation. AEU-Int. J. Electron. Commun. 2017, 83, 73–80. [Google Scholar] [CrossRef]
  8. Chen, Z.; Zhao, X.; Chen, S.; Chen, H.; Ni, P.; Zhang, F. Analysis of ultrasonic machining characteristics under dynamic load. Sensors 2022, 22, 8576. [Google Scholar] [CrossRef] [PubMed]
  9. Wang, R.; You, L.; Hu, X. Performance degradation modeling and continuous worktime assessment of ultrasonic vibration systems. Processes 2024, 12, 439. [Google Scholar] [CrossRef]
  10. Ye, H.; Yang, X.; Hu, X.; Yu, B.-H.; Kang, X. Research on correlation model between transducer temperature and acoustic performance parameters of ultrasonic machining system. AIP Adv. 2022, 12, 11. [Google Scholar] [CrossRef]
  11. Jin, Z.; Huo, L.; Long, T.; Guo, X.; Tu, J.; Zhang, D. An online impedance analysis and matching system for ultrasonic transducers. IEEE Trans. Ultrason. Ferroelectr. Freq. Control 2019, 66, 591–599. [Google Scholar] [CrossRef]
  12. Duan, J.; Chen, T.; Suo, Y.; Pan, X.; Pan, X. Research on the performance of frequency tracking methods for the ultrasonic machining system considering the influence of impedance matching unit. Appl. Acoust. 2025, 231, 110439. [Google Scholar] [CrossRef]
  13. Ma, K.; Zhang, J.Q.; Zhang, J.F.; Feng, P.F.; Ahmad, S. A fast and accurate frequency tracking method for ultrasonic cutting system via the synergetic control of phase and current. IEEE Trans. Ultrason. Ferroelectr. Freq. Control 2022, 69, 902–910. [Google Scholar] [CrossRef]
  14. Yao, Z.; Mo, Y.-Q.; Luo, Z.-L.; He, J.; Lei, G.-W. Matching technology of piezoelectric transducers under nonlinear operating conditions. Appl. Acoust. 2023, 42, 379–385. [Google Scholar]
  15. Guo, N.X.; Luo, X.Q.; Yan, H.X.; Liu, C.R.; Yang, W.H.; Zhao, L.B. A novel mathematical method for calculating the LCL-type matching of ultrasonic transducer for liquefaction treatment. IEEE Sens. J. 2023, 23, 8737–8743. [Google Scholar] [CrossRef]
  16. Peng, T.Y.; Ye, S.Y.; Ju, J.Z.; Zhao, H.; Liu, X.C.; Zhang, X.Z. A novel robustness matching method based on amplitude-frequency characteristic for high power ultrasonic system under variable load. Appl. Acoust. 2024, 217, 109799. [Google Scholar] [CrossRef]
  17. Wang, J.D.; Jiang, J.J.; Duan, F.J.; Cheng, S.Y.; Peng, C.X.; Liu, W. A high-tolerance matching method against load fluctuation for ultrasonic transducers. IEEE Trans. Power Electron. 2020, 35, 1147–1155. [Google Scholar] [CrossRef]
  18. Kuang, Y.; Jin, Y.; Cochran, S.; Huang, Z. Resonance tracking and vibration stabilization for high power ultrasonic transducers. Ultrasonics 2014, 54, 187–194. [Google Scholar] [CrossRef]
  19. Ji, H.; Li, X.; Hu, X. A new method for measuring impedance angle of ultrasonic transducer based on improved orthogonal correlation. Acta Metrol. Sin. 2016, 37, 79–83. [Google Scholar]
  20. Karami, A.; Hadianfard, M.; Mokhtari, H.; Rafiei, M.; Sadeghierad, M. A novel method for accurate fault location on high-voltage transmission lines using voltage standing wave ratio. Energies 2017, 10, 309. [Google Scholar]
  21. Luo, X.; Cao, J.; Gong, H.; Yan, H.; He, L. Phase separation technology based on ultrasonic standing waves: A review. Ultrason. Sonochemistry 2018, 48, 287–298. [Google Scholar] [CrossRef]
  22. Cheng, G.; Wang, X.; Zhu, Y. Research of Power Combining Efficiency Based on Standing Wave Ratio Principle; Internal Report; China Satellite Maritime Tracking and Control Department: Jiangyin, China, 2019. [Google Scholar] [CrossRef][Green Version]
  23. Otasowie, P.O. Detection and location of faults in power system transmission lines using standing wave ratio. IEEE Trans. Power Deliv. 2004, 19, 1715–1721. [Google Scholar]
  24. Wang, Q.H. The principle and manufacture of power standing wave table. J. Electron. 2004, 12, 45–47. [Google Scholar] [CrossRef]
  25. Yeom, K.W.; Roh, J.S. An efficient cross-correlation method for a digital phase noise measurement system. J. Electromagn. Eng. Sci. 2022, 22, 441–448. [Google Scholar] [CrossRef]
Figure 1. Mason equivalent circuit model of the piezoelectric transducer.
Actuators 15 00202 g001
Figure 2. Framework of standing wave detection in a high-frequency energy transfer system.
Actuators 15 00202 g002
Figure 3. Schematic of the standing wave detection circuit.
Actuators 15 00202 g003
Figure 4. Physical diagram of the VSWR detection device.
Actuators 15 00202 g004
Figure 5. Flowchart of the impedance matching evaluation method using standing wave detection.
Actuators 15 00202 g005
Figure 6. Experimental setup for power calibration using standing wave detection.
Actuators 15 00202 g006
Figure 7. Comparison of forward and reverse power calibration curves using different fitting orders: (a) forward power calibration curves of different orders; (b) reverse power calibration curves of different orders.
Actuators 15 00202 g007aActuators 15 00202 g007b
Figure 8. Experimental setup for impedance matching determination: (a) experimental setup; (b) schematic diagram.
Actuators 15 00202 g008aActuators 15 00202 g008b
Figure 9. Relationship between nose amplitude and VSWR of the ultrasonic cutting tool.
Actuators 15 00202 g009
Figure 10. Comparison between the standard and measured VSWR values.
Actuators 15 00202 g010
Figure 11. Experimental setup for comparing the standing wave method and the correlation method: (a) standing wave method; (b) correlation method.
Actuators 15 00202 g011
Table 1. System parameters under initial conditions.
Resonant Frequency fs/HzDynamic Resistance R1 (Ω)Static Capacitance C0/nFForce Load (N)Tool Tip Amplitude (μm)Pf (W)Pr (W)Relative Error (%)
20,052.6014.5810.80021.233125.2
Table 2. Tool tip amplitude and VSWR measurements under variable working conditions.
Force Load (N)R1 (Ω)Pf (W)Pr (W)A (μm)VSWRRelative Error (%)
Standard ValueMeasured Value
0.0014.115010.51.011.001.00
14017.51.011.001.00
27122.41.521.482.70
35126.21.461.413.54
5.1919.75508.61.011.001.00
15114.81.761.703.53
24219.11.901.814.97
36223.01.541.624.94
9.9627.8410011.51.031.003.00
21115.91.481.565.13
33322.51.841.861.08
42229.01.561.560.00
15.0338.781107.91.051.005.00
19012.51.031.003.00
32321.01.981.885.52
45326.51.721.703.30
20.9443.5415112.01.781.702.96
26117.81.441.491.61
35222.51.721.633.82
47426.41.761.822.13
26.1255.5023213.51.801.842.17
37320.01.921.806.67
43423.51.801.884.53
52425.21.741.771.69
Table 3. Verification experimental data and error analysis.
Force Load (N)Transducer Temperature/°CPr/PfVSWRTool Tip Amplitude (μm)Error Compared to Initial Vibration Amplitude (%)
InitialAdjustmentInitialAdjustmentInitialAdjustment
13.1321.25/262/422.751.5612.523.56.75%
4.0543.78/293/383.211.7819.226.55.16%
19.2572.816/183/4933.971.666.826.03.82%
2.5486.521/265/4218.752.058.527.08.14%
Table 4. Comparison of measurement results: VSWR-based vs. phase difference detection.
Standing Wave MethodPhase Difference Detection Method
(Correlation Method)
GroupsVSWR
(Theoretical)
VSWR
(Measured)
Relative Error (%)GroupsPhase
(Theoretical, °)
Phase
(Measured, °)
Relative Error (%)
11.241.261.61183.08759.72
21.311.273.05275.96707.84
31.411.382.13368.23637.67
41.441.493.47445.554012.18
Table 5. Comparison of impedance matching detection methods: VSWR vs. phase difference.
MethodsAcquisition Signal TypeProcessing ProcessError AnalysisHardware
Complexity
VSWR detection methodAC voltage in working circuit(1) Measure forward and reflected signals
(2) Calibrate and calculate VSWR
(1) Acquisition error
(2) Computational error
(1) VSWR detection circuit
(2) Processing chip
Phase difference detection methodAC voltage and current in working circuit(1) Filter & sample
(2) AD conversion
(3) Phase calculation
(1) Sampling error
(2) Waveform distortion
(3) Computational error
(1) Filter circuit
(2) AD circuit
(3) Processor
Disclaimer/Publisher’s Note: The statements, opinions and data contained in all publications are solely those of the individual author(s) and contributor(s) and not of MDPI and/or the editor(s). MDPI and/or the editor(s) disclaim responsibility for any injury to people or property resulting from any ideas, methods, instructions or products referred to in the content.