Article

Detection Algorithm of Thrombolytic Solution Concentration with an Optimized Conical Thrombolytic Actuator for Interventional Therapy

1
Faculty of Civil Aviation and Aeronautics, Kunming University of Science and Technology, Kunming 650500, China
2
Faculty of Mechanical and Electrical Engineering, Kunming University of Science and Technology, Kunming 650500, China
*
Author to whom correspondence should be addressed.
Actuators 2025, 14(11), 549; https://doi.org/10.3390/act14110549
Submission received: 27 September 2025 / Revised: 31 October 2025 / Accepted: 7 November 2025 / Published: 10 November 2025
(This article belongs to the Special Issue Actuation and Sensing of Intelligent Soft Robots)

Abstract

Fragmented thrombolytic actuators address the limited time window of thrombolysis agents and the risk of intimal injury from mechanical thrombectomy, emerging as a crucial method for rapid vascular recanalization. However, occluded vessels are often tortuous and narrow, imposing strict size constraints on the actuator. Moreover, the inability to assess thrombolysis efficacy in real-time during procedures impedes timely adjustments to control strategies for the actuator. To address these challenges, this study designs a conical piezoelectric actuator that employs high-frequency vibration in conjunction with a small dose of thrombolytics to fragment and accelerate thrombus dissolution. Firstly, structural parameters of the actuator are optimized using grey relational analysis combined with an improved entropy-weighting method, and the optimal design is prototyped and tested. Next, a real-time thrombolytic solution concentration detection algorithm based on an Improved Grey Wolf Optimizer–Support Vector Regression (IGWO-SVR) model is proposed. Finally, an experimental platform is constructed for validation and analysis. The results show that compared to the initial design, the optimized actuator has significantly improved kinematic and force performance, with the tip amplitude increasing by 42% and the output energy density reaching 3.3726 × 10⁻² W/mm3. The IGWO-SVR model yields highly accurate, stable concentration estimates, with a coefficient of determination (R2) of 0.9987 and a root-mean-square error (RMSE) of 0.8118. This work provides a pathway toward actuator miniaturization and real-time thrombolysis monitoring, with positive implications for future clinical applications.

1. Introduction

Cardiovascular and cerebrovascular diseases, due to their high incidence and disability rates, have been identified by the World Health Organization as leading global public health burdens [1,2]. Arterial occlusion caused by thrombi is the immediate cause of major events such as ischemic stroke and myocardial infarction [3,4,5]. Thrombus formation arises from an abnormally activated coagulation response within the vessel lumen and is closely associated with endothelial injury, hemodynamic disturbances, and hypercoagulable states [6,7]. The primary clinical goal is to quickly restore blood flow in the blocked vessel. However, both pharmacologic thrombolysis and mechanical thrombectomy face inherent limitations. Intravenous thrombolytics such as rt-PA can directly lyse fibrin but are constrained by a 3–4.5 h therapeutic time window and carry a higher risk of hemorrhagic complications with a big dose of thrombolytic drugs [8,9,10,11]. Stent-retriever devices such as Merci Retriever and Solitaire FR extend the therapeutic time window and improve recanalization rates to approximately 80–90% [12,13,14], yet they cannot fully avoid intimal damage and often face deliverability constraints in tortuous, stenotic segments [15,16]. And, in clinical applications, the real-time thrombolysis monitoring system needs to meet performance indicators such as a detection error of less than 5%, a response time of less than 0.1 s, and an acoustic pressure intensity of less than 0.5 watts per square centimetre to ensure vascular safety [17]. However, traditional rt-PA chemical thrombolysis and mechanical thrombectomy methods cannot provide such real-time biochemical feedback. Therefore, developing an impedance-based detection algorithm capable of rapid and accurate concentration estimation is of great clinical significance.
The operating principle of the fragmented thrombolytic actuator is as follows. A small amount of thrombolytic drug is first delivered locally to the clot via a microcatheter. The actuator then applies high-frequency vibration to fragment the thrombus and enhance drug diffusion. Finally, clot debris is rapidly aspirated through the microcatheter to restore blood flow [18], as shown in Figure 1. This approach reduces hemorrhagic risk while mitigating intimal injury that can be caused by dragging self-expanding stents. Nevertheless, the actuator must function within a blood vessel only a few millimetres in diameter and exhibiting multiple bends. Achieving large tip amplitude and high output energy within strict size limitations is challenging. Yang et al. [19] employed a single-factor finite element scanning strategy to sequentially optimize parameters such as inertial mass and length, thereby increasing the lateral tip amplitude of a micro-stirrer and significantly improving mechanical thrombus dissolution efficiency. For a conical actuator, however, length, thickness, aperture size, and the geometry of the piezoelectric patch are coupled in their influence on dynamic performance, making single-factor optimization inadequate. For complex structural design, grey relational analysis is regarded as an effective tool that balances sampling efficiency with computational cost and has seen broad application in electromagnetic device design and manufacturing process studies [20,21,22,23]. Accordingly, a systematic multi-factor optimization strategy based on grey relational analysis can enable actuator miniaturization while maximizing vibrational output.
Because thrombi differ in location, age, and composition, the actuator’s vibration output and the time required for fragmentation-assisted thrombolysis also vary [24]. As a result, it is difficult to assess intraoperative progress in real time and to adjust the actuator’s control strategy promptly. Yang et al. [25] experimentally observed that the piezoelectric impedance feedback from the actuator inside the vessel exhibits regular variations as the concentration of the thrombolytic mixture in blood varies. Thus, by measuring the actuator’s impedance during fragmentation-assisted thrombolysis, the concentration of the thrombolytic solution can be estimated and the treatment effect inferred. However, there is a nonlinear relationship between blood concentration and the actuator’s impedance feedback. Accurately reconstructing the concentration trajectory under conditions of high noise and limited samples is therefore a core challenge for achieving integrated diagnosis–therapy with the actuator.
Existing studies indicate that machine learning performs strongly in biochemical sensing [26,27,28]. Saraoglu et al. [29] developed an artificial neural network (ANN) trained via the Levenberg–Marquardt algorithm to detect the relationship between blood glucose concentration and palmar sweating rate. Yang et al. [30] combined deep learning with surface-enhanced Raman spectroscopy (SERS) to achieve rapid, accurate detection and quantification of SARS-CoV-2 variants. Rao et al. [31] used a PSO-ANN model to improve the selectivity and accuracy of dopamine (DA) detection under epinephrine (EP) interference. Zhao et al. [32] employed a vis-NIR-ANN approach to build an online model for bacterial concentration during kombucha fermentation. Nevertheless, machine learning and neural network methods often encounter challenges with small-sample, high-noise blood concentration data, resulting in prediction errors and slow convergence. By contrast, algorithms such as Support Vector Regression (SVR) and Random Forest (RF) exhibit strong generalization on small, nonlinear datasets and are advantageous for blood concentration estimation. Zhang et al. [33] designed an efficient blood pressure prediction method using SVR, addressing the gap between the need for preventive continuous measurement and the lack of effective continuous measurement tools and substantially improving accuracy. Zhou et al. [34] compared seven machine learning models, including SVR and RF, for soybean branching prediction and found that SVR outperformed RF. They further used an SVR model for feature-importance analysis and Gene Ontology (GO) enrichment. However, SVR performance depends critically on the choice of kernel and hyperparameters; poor settings can lead to local optima. Owing to its simple parameterization and global search capability, the Grey Wolf Optimizer (GWO) is widely used for hyperparameter tuning. Its improved variant, IGWO, introduces a dynamic convergence factor and adaptive weights to globally optimize SVR hyperparameters [35], thereby meeting the dual requirements of real-time “impedance–concentration” regression accuracy and robustness during fragmentation-assisted thrombolysis.
Previous studies on thrombolytic actuators mainly relied on single-factor parameter optimization, which failed to account for the coupling effects among multiple structural parameters and limited further improvements in performance and miniaturization. In this study, grey relational analysis (GRA) is employed to conduct multi-factor structural optimization of the actuator, resolving the trade-off between the size of the conical thrombolytic actuator and its output performance and providing a route to miniaturization. Furthermore, an Improved Grey Wolf Optimizer (IGWO) is used to globally tune the hyperparameters of Support Vector Regression (SVR), yielding an IGWO–SVR intelligent detection algorithm capable of providing real-time feedback on blood concentration during thrombus fragmentation. This study therefore clearly defines the structural and algorithmic strategies to enhance actuator performance, offering theoretical and practical significance for the development of intelligent thrombolytic systems in cardiovascular and cerebrovascular treatments.

2. Modelling and Structural Parameter Optimization

2.1. Actuator Modelling

To further reduce the risk of the actuator tip contacting and injuring the vessel wall, we modify a conventional cantilever beam and design a conical piezoelectric actuator, as shown in Figure 2. A piezoelectric patch is bonded on the actuator surface. When an AC voltage is applied, the inverse piezoelectric effect induces sinusoidal stress and strain along the polarization direction, thereby providing the driving force that excites tip vibration. The conical tip helps avoid intimal damage during high-frequency operation.
The scaling dimensions of the actuator will mainly alter the absolute resonant frequency and the mechanical quality factor but will not change the functional relationship between impedance and concentration. Therefore, to meet experimental requirements, the actuator is scaled up by a fixed ratio. The initial actuator model has an overall length of 60 mm, a thickness of 1 mm, and a width of 5 mm. The bonded piezoelectric patch on the upper surface measures 6 mm × 2 mm × 0.3 mm (length × width × thickness).
This work performs a dynamical analysis of the actuator’s vibration and, based on Euler–Bernoulli beam theory, establishes the governing equation of motion for the actuator:
ə 2 ə x 2 E b I ə 2 z ə x 2 + ρ A b ə 2 z ə t 2 = ə 2 M p ə x 2
where ρ denotes the actuator material density and Ab the cross-sectional area, E b is the Young’s modulus of the beam substrate, I is the second moment of area of the beam cross-section, and z ( x , t ) is the transverse displacement. The term E b I ə 4 z / ə x 4 represents the internal elastic restoring force, ρ A b ə 2 z / ə t 2 denotes the inertial effect, and the right-hand side ə 2 M p / ə x 2 corresponds to the distributed bending moment produced by the bonded piezoelectric patch.
The excitation produced by the bonded piezoelectric patch is given by the following:
M p ( x , t ) = τ b 2 τ b 2 + τ p σ p ( x , t ) b z d z = 1 2 E p d 31 b τ p + τ p V p ( x , t ) = C p V p ( x , t )
where M p ( x , t ) denotes the equivalent bending moment generated by the surface-bonded piezoelectric patch, σ p ( x , t ) is the stress induced in the piezoelectric layer, E p is the Young’s modulus of the piezoelectric material, d 31 is the piezoelectric strain coefficient, b is the beam width, τ p is the distance from the neutral axis of the beam to the mid-plane of the piezoelectric layer, V p ( x , t ) is the driving voltage, and C p is the equivalent electromechanical coupling coefficient.
Substituting the piezoelectric excitation (2) into the actuator’s governing equation (Equation (1)) yields the vibration equation of the piezoelectric actuator:
ρ A b L 3 q ¨ i ( t ) + 2 ξ i q ˙ ( t ) + ω i 2 q i ( t ) = 0 L C p ə 2 V p ( x , t ) ə x 2 ϕ j = 0 L C p δ x x p 1 δ x x p 2 V p ( t ) ϕ j = C p [ ϕ j ( x p 2 ) ϕ j ( x p 1 ) ] V p ( t )
where L is the actuator length, q i ( t ) is the generalized coordinate of the i -th vibration mode, ξ i is the modal damping ratio, and ω i is the natural angular frequency.
This can be recast in state-space form as follows:
r ˙ = A r + B 1 u + B 2 w y = C r
Here, A is the system (state) matrix, B1 = B2 are the input (control) matrices, and C is the output (observation) matrix.
From Equation (3), the transverse displacement z ( x , t ) is governed by the modal coordinates q ( t ) and mode shapes φ ( x ) . The coordinates q ( t ) and φ ( x ) in turn depend on geometric parameters such as actuator length, width, and thickness; the piezoelectric patch dimensions; and structural properties including the substrate’s elastic modulus Eb and second moment of area I. Because the geometry sets the stiffness and natural frequencies, maximizing the longitudinal tip amplitude and output energy at the actuator end requires multi-parameter optimization over the actuator and piezoelectric patch dimensions to identify the combination that yields the largest vibrational output.
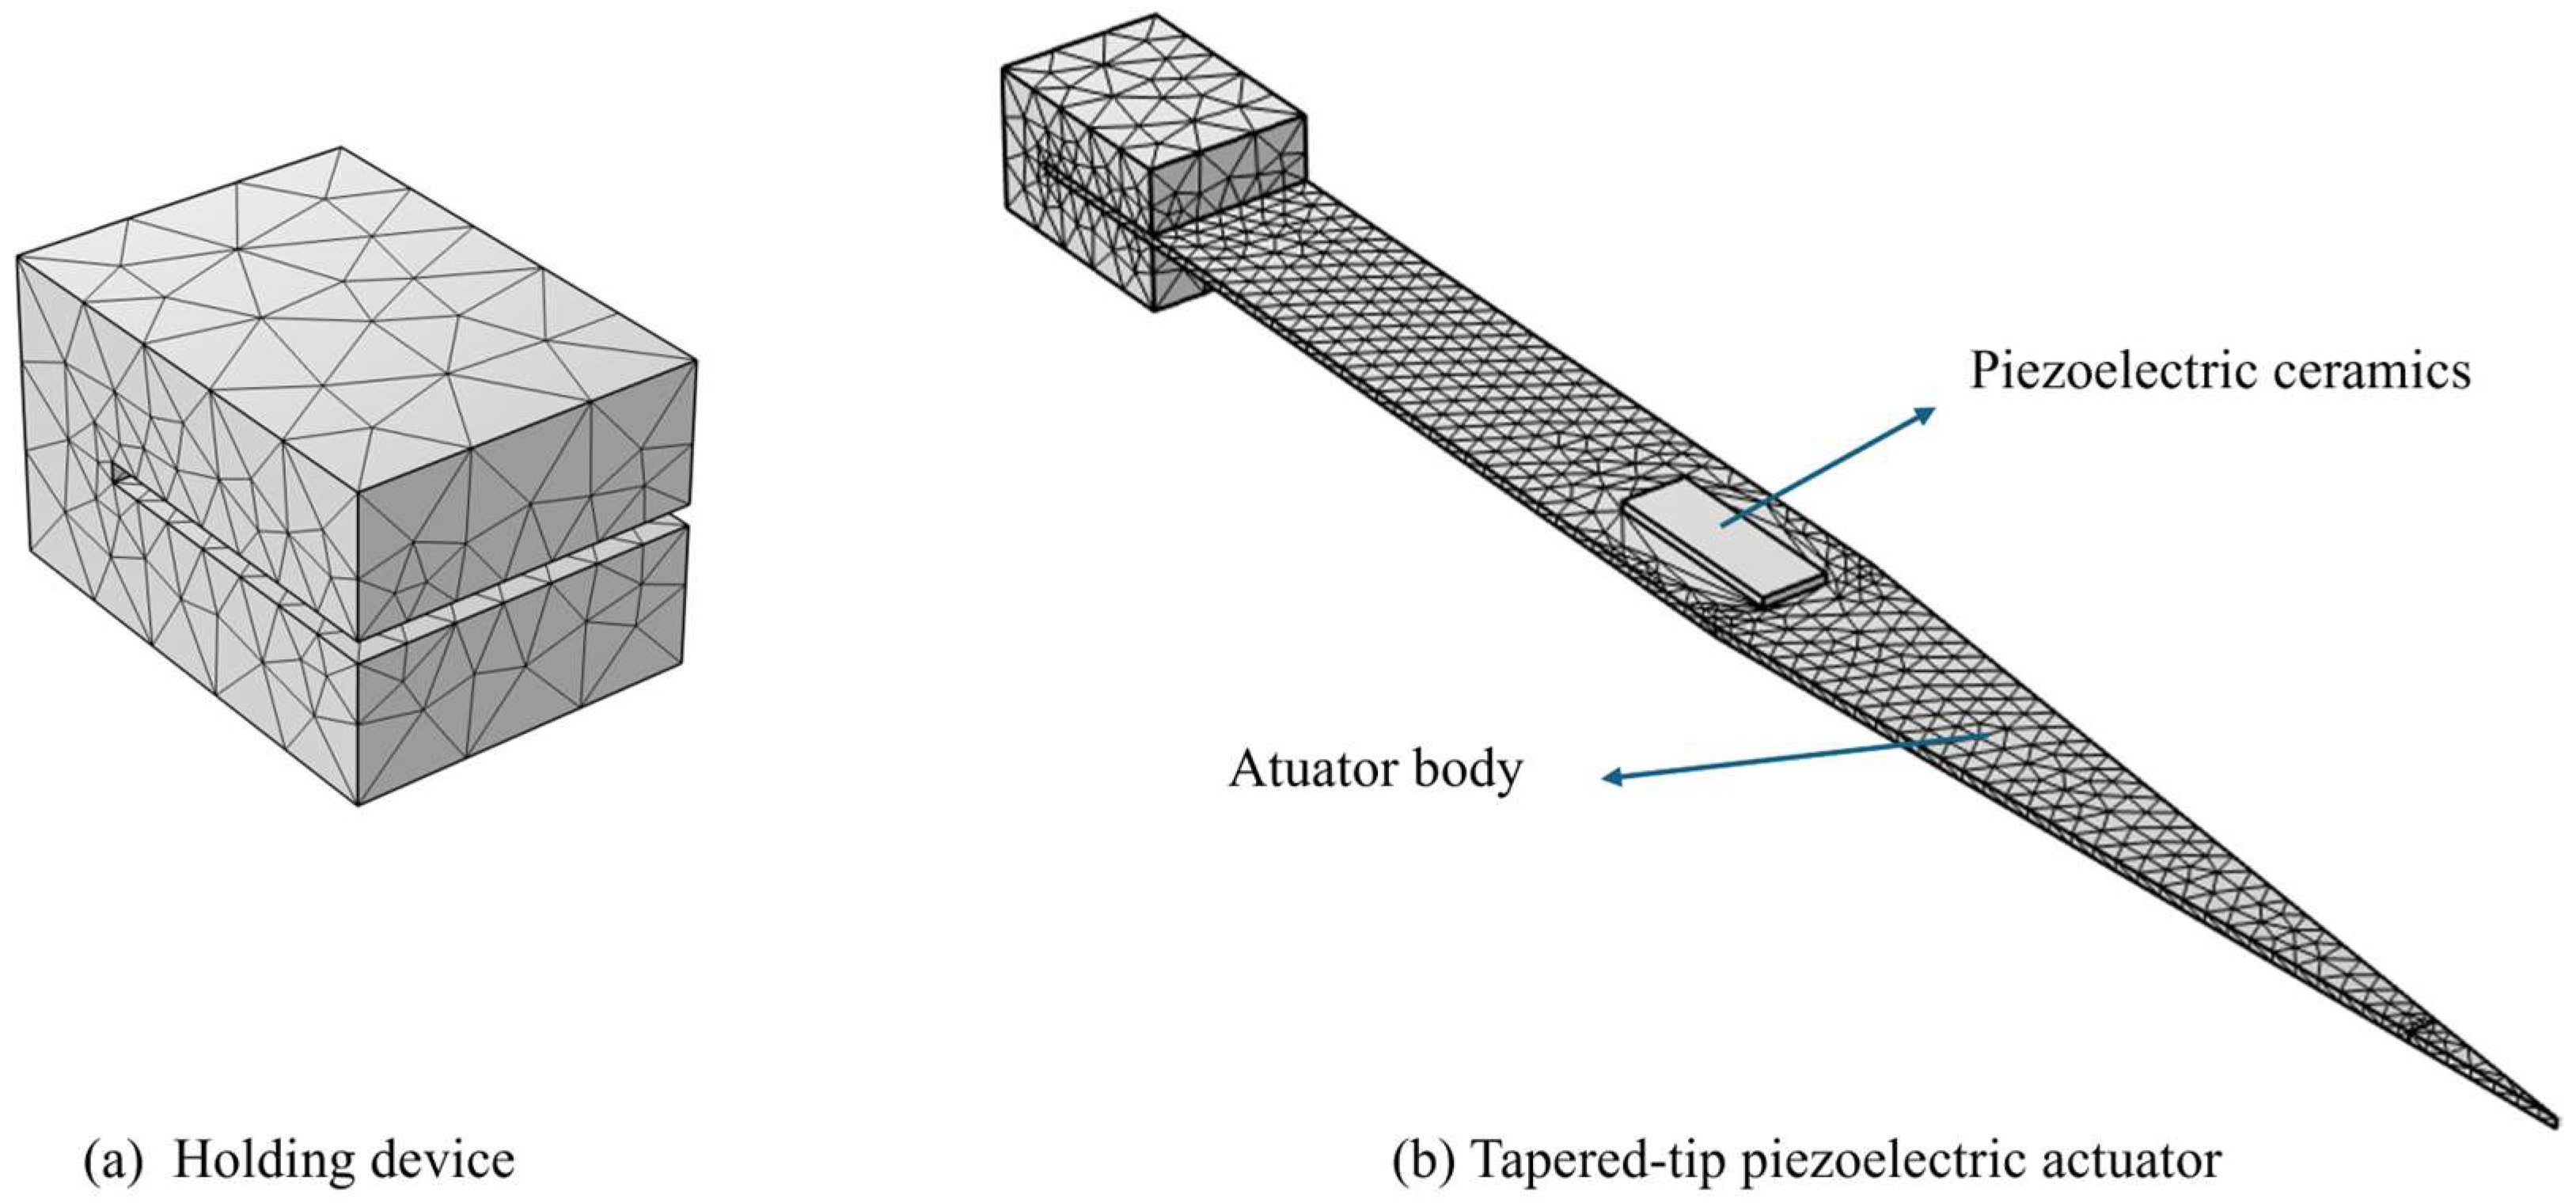
For the initial design, a modal vibration analysis is carried out by discretizing the actuator into tetrahedral finite elements. Since the piezoelectric excitation propagates along the structure and affects different regions unevenly, a non-uniform mesh is adopted: the conical tip and the patch–beam interface is locally refined, while the remaining beam regions are gradually coarsened to a uniform density. The average element size is 0.0980 mm3. The mesh model is shown in Figure 3. The actuator substrate is medical-grade 304 stainless steel, and the piezoelectric patch is PZT-5H. Material properties are summarized in Table 1.
Using the parameters in Table 1, an eigenfrequency analysis was performed. With the piezoelectric patch driven at 20 V, the first three mode shapes were obtained as shown in Figure 4, and the tip amplitudes are listed in Table 2.
From Figure 4 and Table 2, the first and second modes are identified as the optimal vibration modes. The tip–amplitude response analysis at these two resonant frequencies shows a first-mode tip amplitude of 1.8 × 10⁻⁵ mm and a second-mode tip amplitude of 1.5 × 10⁻⁵ mm, indicating that the actuator achieves its maximum tip amplitude at the first natural frequency.

2.2. Actuator Structural Parameter Optimization

2.2.1. Orthogonal Experimental Design

Orthogonal design is an efficient approach for multi-factor experiments [36,37]. By arranging combinations of multiple factors at multiple levels in an orthogonal array, it reduces the number of trials while enabling attribution of performance variations to individual factors. Two common array types are equal-level and mixed-level designs. For the conical piezoelectric actuator, voltage excitation induces lateral vibration at the free end. The tip amplitude and the corresponding output energy jointly reflect thrombolysis efficiency; larger amplitude and higher energy imply better performance.
The dominant factors affecting tip amplitude and output energy include seven geometrical and piezoelectric parameters: actuator width, thickness, length, aperture size, and the piezoelectric patch length, width, and thickness. Accordingly, these seven factors are selected for simulation studies and denoted as A ( w a ) , B ( t a ) , C ( l a ) , D ( h a ) , E ( l p ) , F ( w p ) , and G ( t p ) . An equal-level orthogonal array L 18 ( 3 7 ) is employed to design the experiments. The factor–level matrix is given in Table 3.
To identify the structural parameters that deliver the best performance, the seven factors and three levels listed in Table 3 were combined according to the L 18 ( 3 7 ) orthogonal array. The actuator’s tip amplitude ( z a ) and output energy ( μ a ) were taken as the objective responses. Eighteen simulation runs were conducted, and the resulting tip amplitude and output energy are summarized in Table 4.
The simulation outputs were standardized using Min–Max normalization, whose mathematical form is given by Equation (5):
x = a + ( x x min ) ( b a ) x max x min
where a and b are the lower and upper bounds of the target interval, x min and x max are the minimum and maximum of the raw data, x is the current value, and x is the normalized value.
To enhance comparability and robustness, the normalized data were further evaluated with the larger-the-better signal-to-noise (S/N) model, as defined in Equation (6):
S / N = 10 log 1 n i = 1 n 1 y i 2
In this study, S/N is adopted as the evaluation metric for thrombolysis efficiency because it captures the fluctuation characteristics under different structural parameters. Since the performance indicators, tip amplitude and output energy should be as large as possible, the larger-the-better S/N formulation is employed. The S/N values for all parameter combinations are reported in Table 5.
From Table 5, the third structural combination attains the highest S/N for end-output energy but a comparatively smaller S/N for tip amplitude, whereas the seventeenth combination yields the highest S/N for tip amplitude but a relatively smaller S/N for output energy. Therefore, to determine the final optimal parameter set, grey relational analysis (GRA) is further conducted to uncover latent inter-factor associations, support decision-making, and improve the comprehensiveness of the analysis.

2.2.2. Grey Relational Analysis with Improved Entropy Weights

Grey relational analysis is a multivariate statistical method within grey system theory for examining relationships among multiple factors, particularly suitable for systems characterized by uncertainty, scarce information, or incomplete data [38]. By ranking grey relational degrees, the most influential factors can be identified to guide optimization and decision-making.
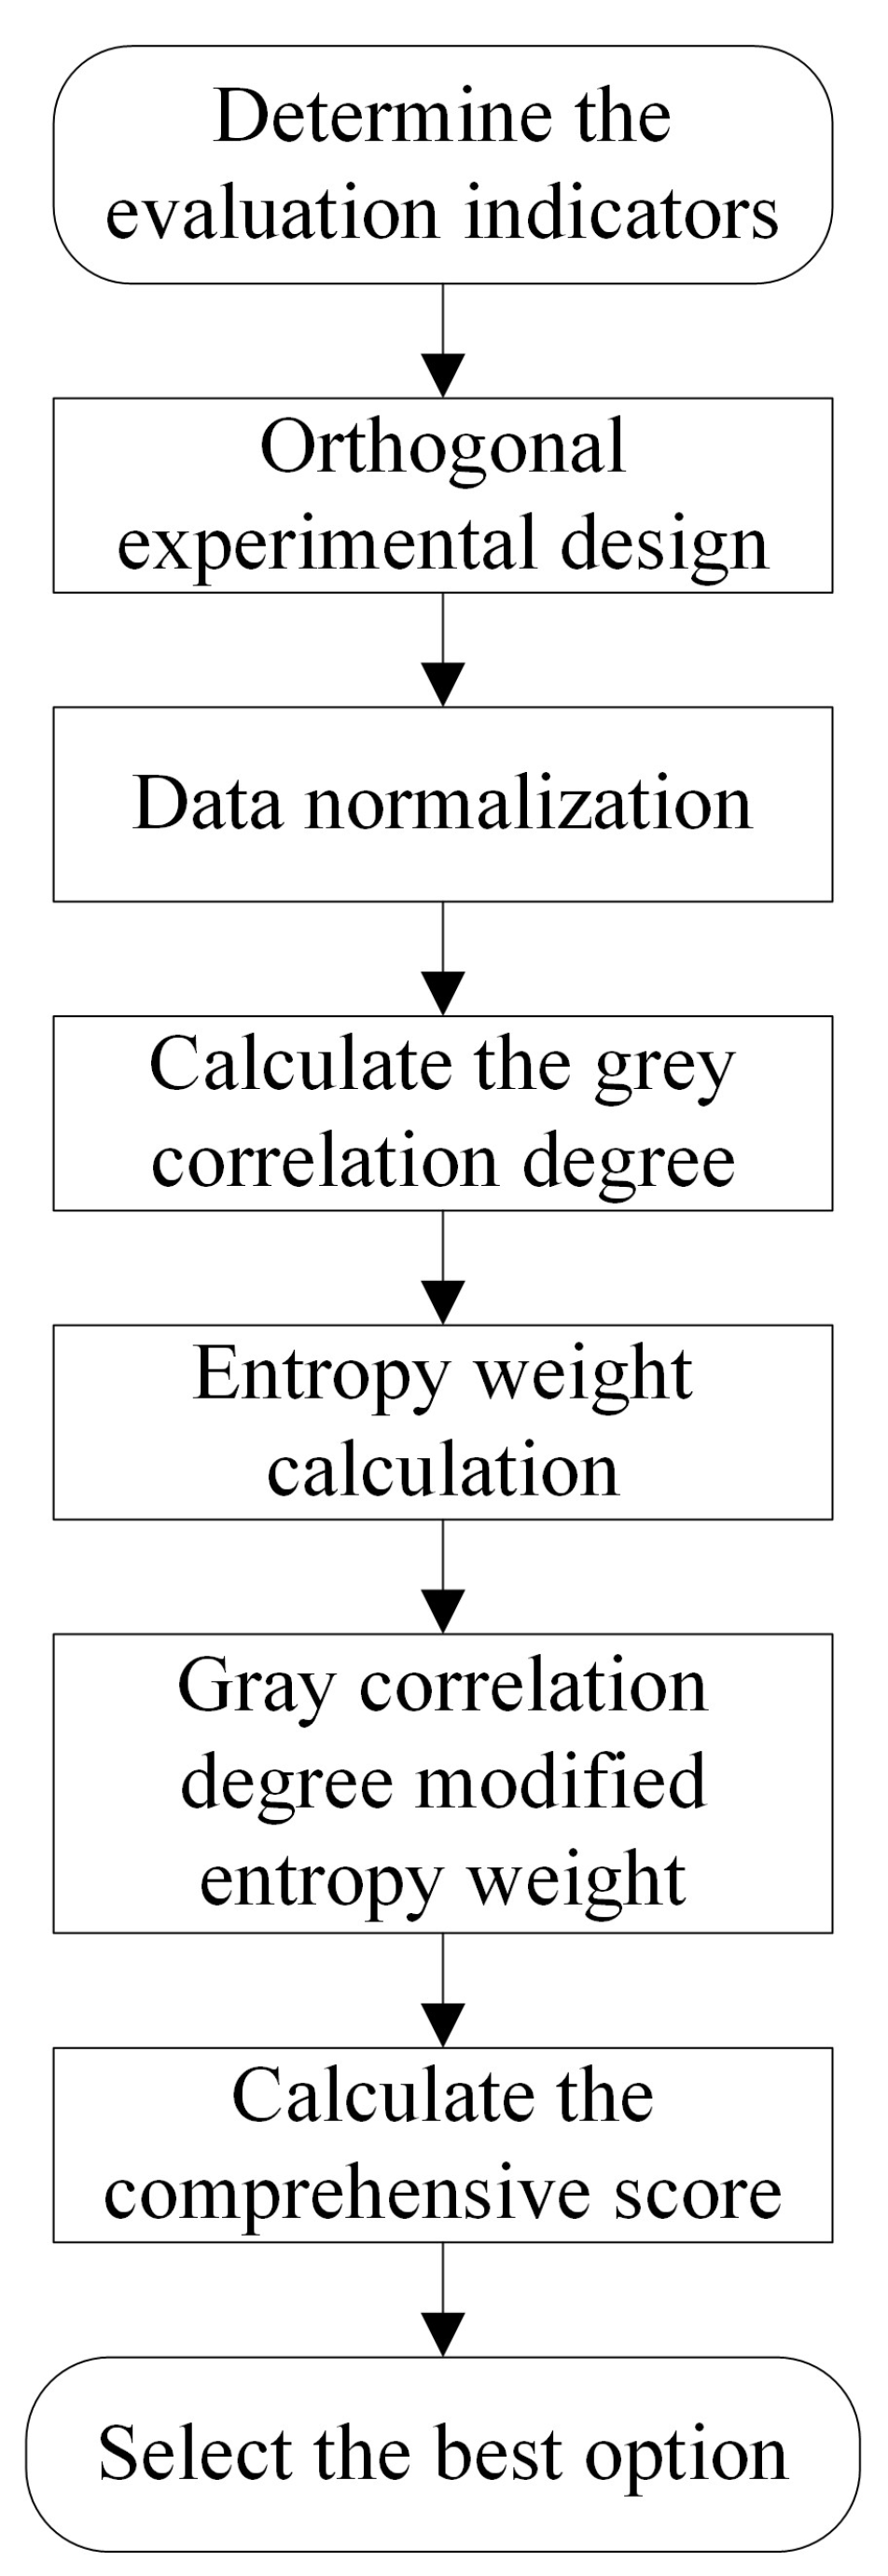
A flowchart of the grey relational analysis with improved entropy weighting is shown in Figure 5.
The grey relational coefficient is defined as follows:
ξ i = min x i x i + ρ max x i x i x i x i + ρ max x i x i
where ξ i is the grey relational coefficient for the i-th sample; x i is the reference sequence, i.e., the ideal optimal value after normalization for the i-th datum; x i is the comparative sequence; and ρ [ 0 , 1 ] is the distinguishing coefficient (commonly set to 0.5 to mitigate distortion caused by very small values).
In conventional entropy–weight calculations, when individual entropies approach 1, the resulting weights can vary markedly across indicators, potentially misrepresenting their true importance. To address this, an improved entropy–weighting scheme is adopted to compute sub-objective weights. The procedure is as follows:
(1)
Compute the information entropy H j for the j-th indicator. Its mathematical form is the following:
H j = k i = 1 m r ij ln ( r ij )
where k = 1 ln ( m ) is a constant ensuring that the entropy lies within [0, 1].
(2)
The weights using the improved entropy–weighting formula:
λ j = 1 H ¯ 40 w 0 j + H ¯ 40 w 3 j H j < 1 0 H j = 1
where w 3 j = 1 + H ¯ H j Σ m = 1 , H m 1 n 1 + H ¯ H m , H ¯ is the mean of all entropies not equal to 1, and w 0 j is a default prior weight set to 0.5.
Substituting the normalized data into the above yields the information entropy and corresponding weights for the actuator’s tip transverse amplitude and total tip output energy.
The grey relational grade is the weighted sum of the grey relational coefficients, expressed as α = j = 1 m β j ξ i with j = 1 m β j = 1 , where β j is the weight of the j-th response, obtained via the improved entropy–weighting method. As shown in Table 6, β 1 = 0.5003 and β 2 = 0.4997 . The resulting grey relational grades for all trials are reported in Table 7.
From Table 7, Trial 3 attains the highest grey relational grade, indicating that, under this parameter combination, the evaluation indices are most consistent across factor levels, and the actuator achieves the best thrombolysis performance.

2.2.3. Mean–Range Analysis Based on Grey Relational Grades

To quantify the influence of each single factor on thrombolysis performance, a mean–range analysis is performed on the grey relational grades. For each factor, the grades corresponding to the same level are averaged to obtain the level mean, and the range R is computed as the difference between the maximum and minimum level means. A larger R indicates a stronger effect of that factor on the performance indices. In Table 8, ξ i denotes the mean grey relational grade at level i .
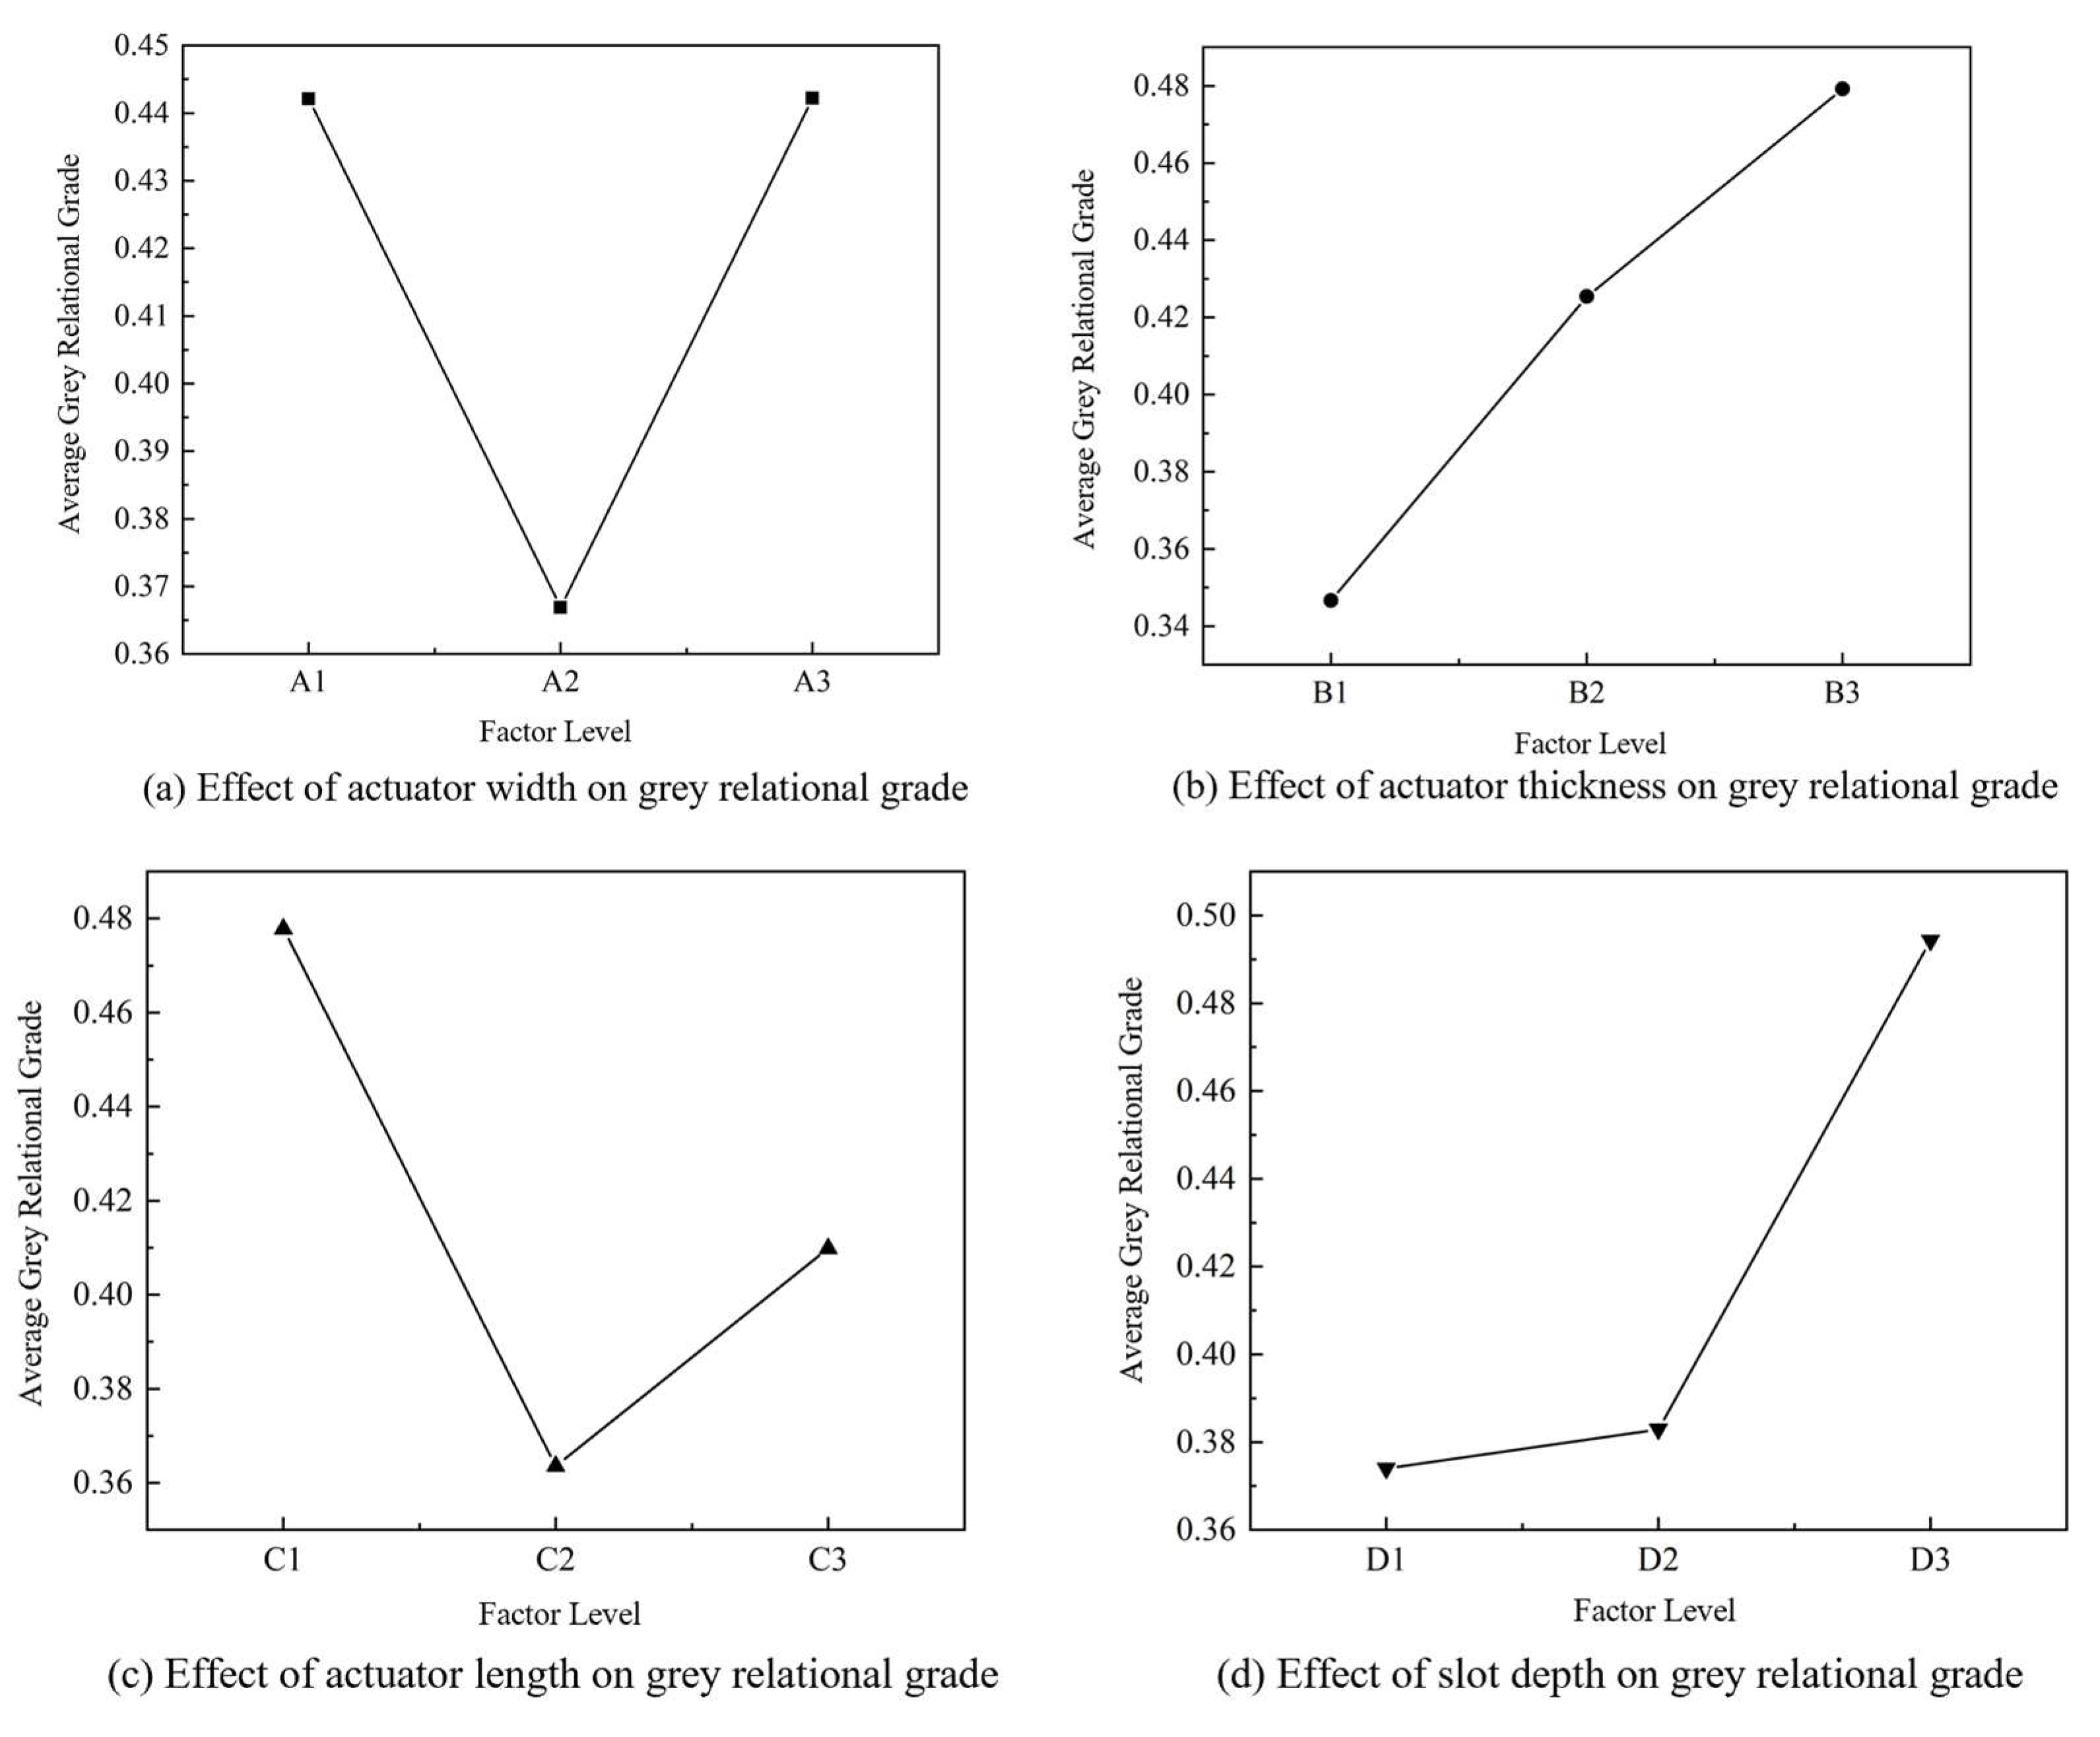
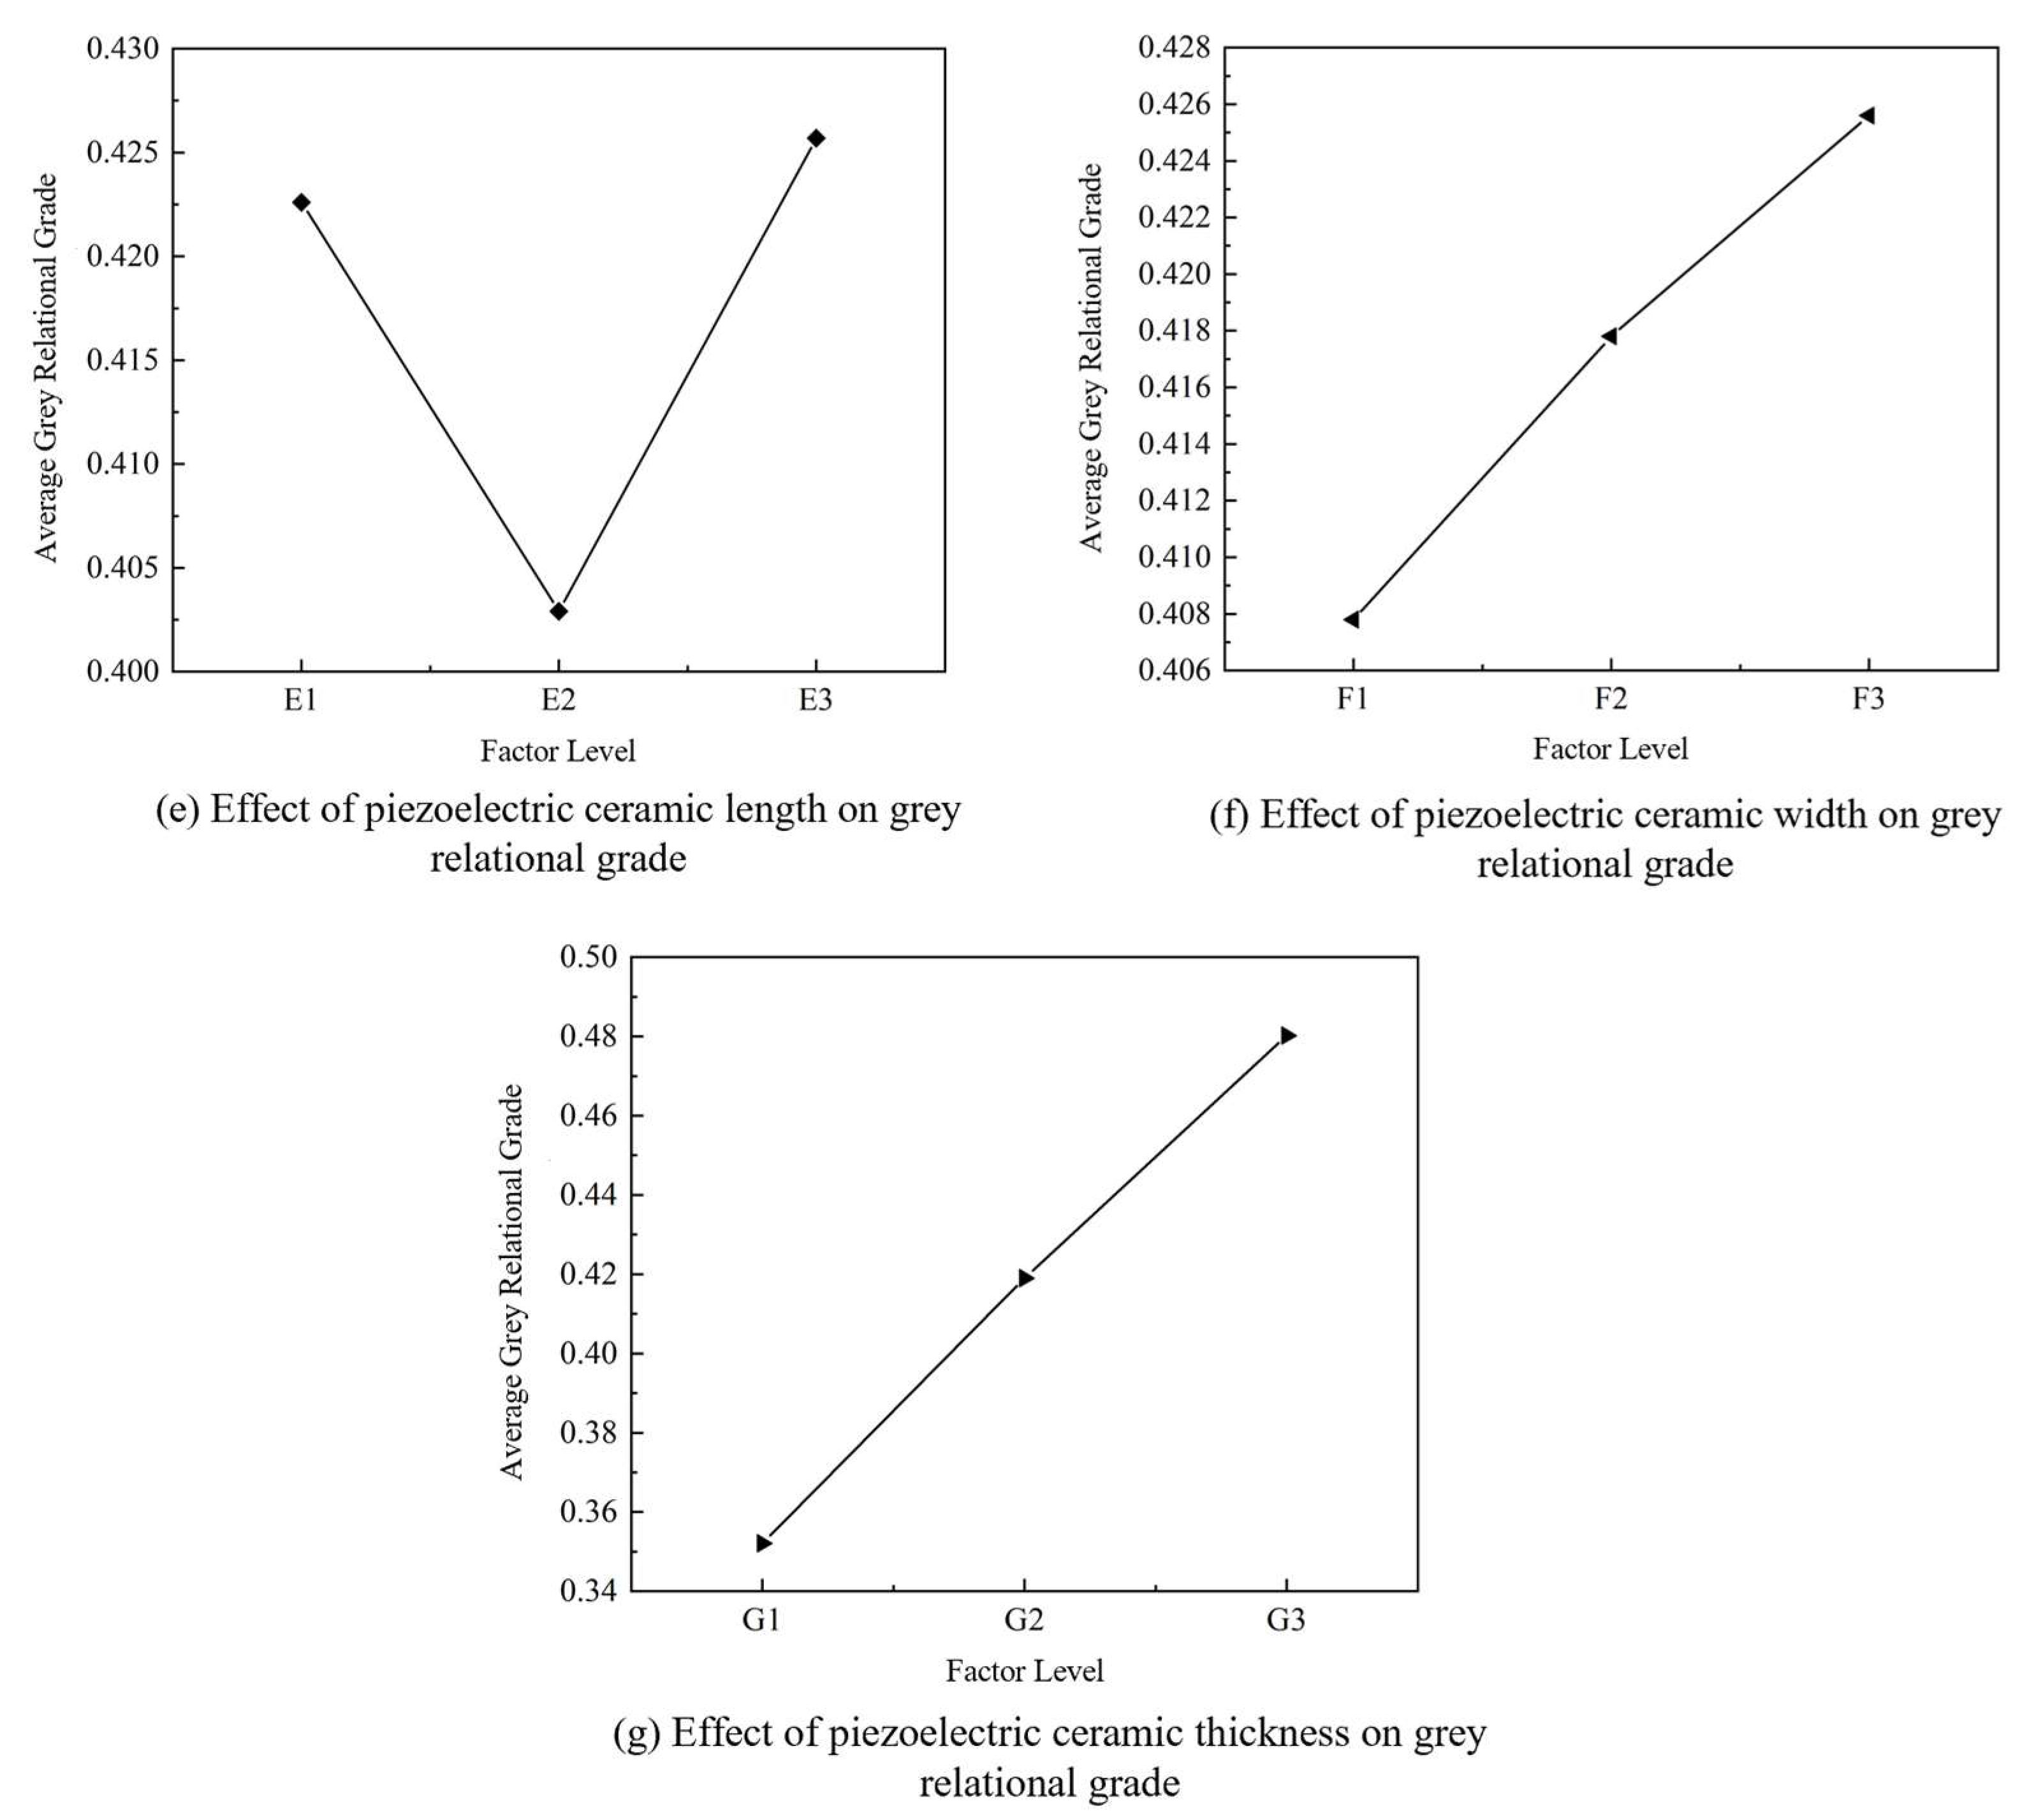
In this study, actuator width w a , thickness t a , length l a , aperture h a , and piezoelectric patch length l p , width w p , and thickness t p are denoted as Factors A–G, respectively. Based on Table 8, the trends of the mean grey relational grade versus factor levels are plotted in Figure 6.
From Table 8 and Figure 6, actuator thickness exerts the greatest influence on the thrombolysis efficiency of the actuator, whereas the patch width has the least influence. Consequently, careful control of actuator width, thickness, length, aperture, and the patch length and thickness are essential during operation. According to the evaluation criteria, the optimal structural parameter set is as follows: width: 5 mm; thickness: 1 mm; overall actuator length: 70 mm; aperture diameter: 2 mm; piezoelectric patch length: 8 mm; piezoelectric patch width: 2 mm; and piezoelectric patch thickness: 0.5 mm.
Having determined the optimal geometry, sustaining peak thrombolysis efficacy across varying stages of clot dissolution hinges on accurate, real-time prediction of thrombolytic solution concentration. To this end, we develop a Support Vector Regression (SVR) detection algorithm with hyperparameters globally optimized by an Improved Grey Wolf Optimizer (IGWO) to map actuator impedance to concentration during fragmentation.

3. Detection Algorithm of Thrombolytic-Solution Concentration

3.1. Improved Grey Wolf Optimizer (IGWO)

The Grey Wolf Optimizer (GWO) is a swarm-intelligence metaheuristic inspired by the social hierarchy and hunting behaviour of grey wolves [39]. Wang et al. [40] proposed a variant incorporating differential evolution, in which adaptive operators are coupled with an improved GWO to address continuous global optimization. Owing to its few tunable parameters, low computational cost, and ability to avoid local optima, GWO has been applied to a wide range of optimization problems.
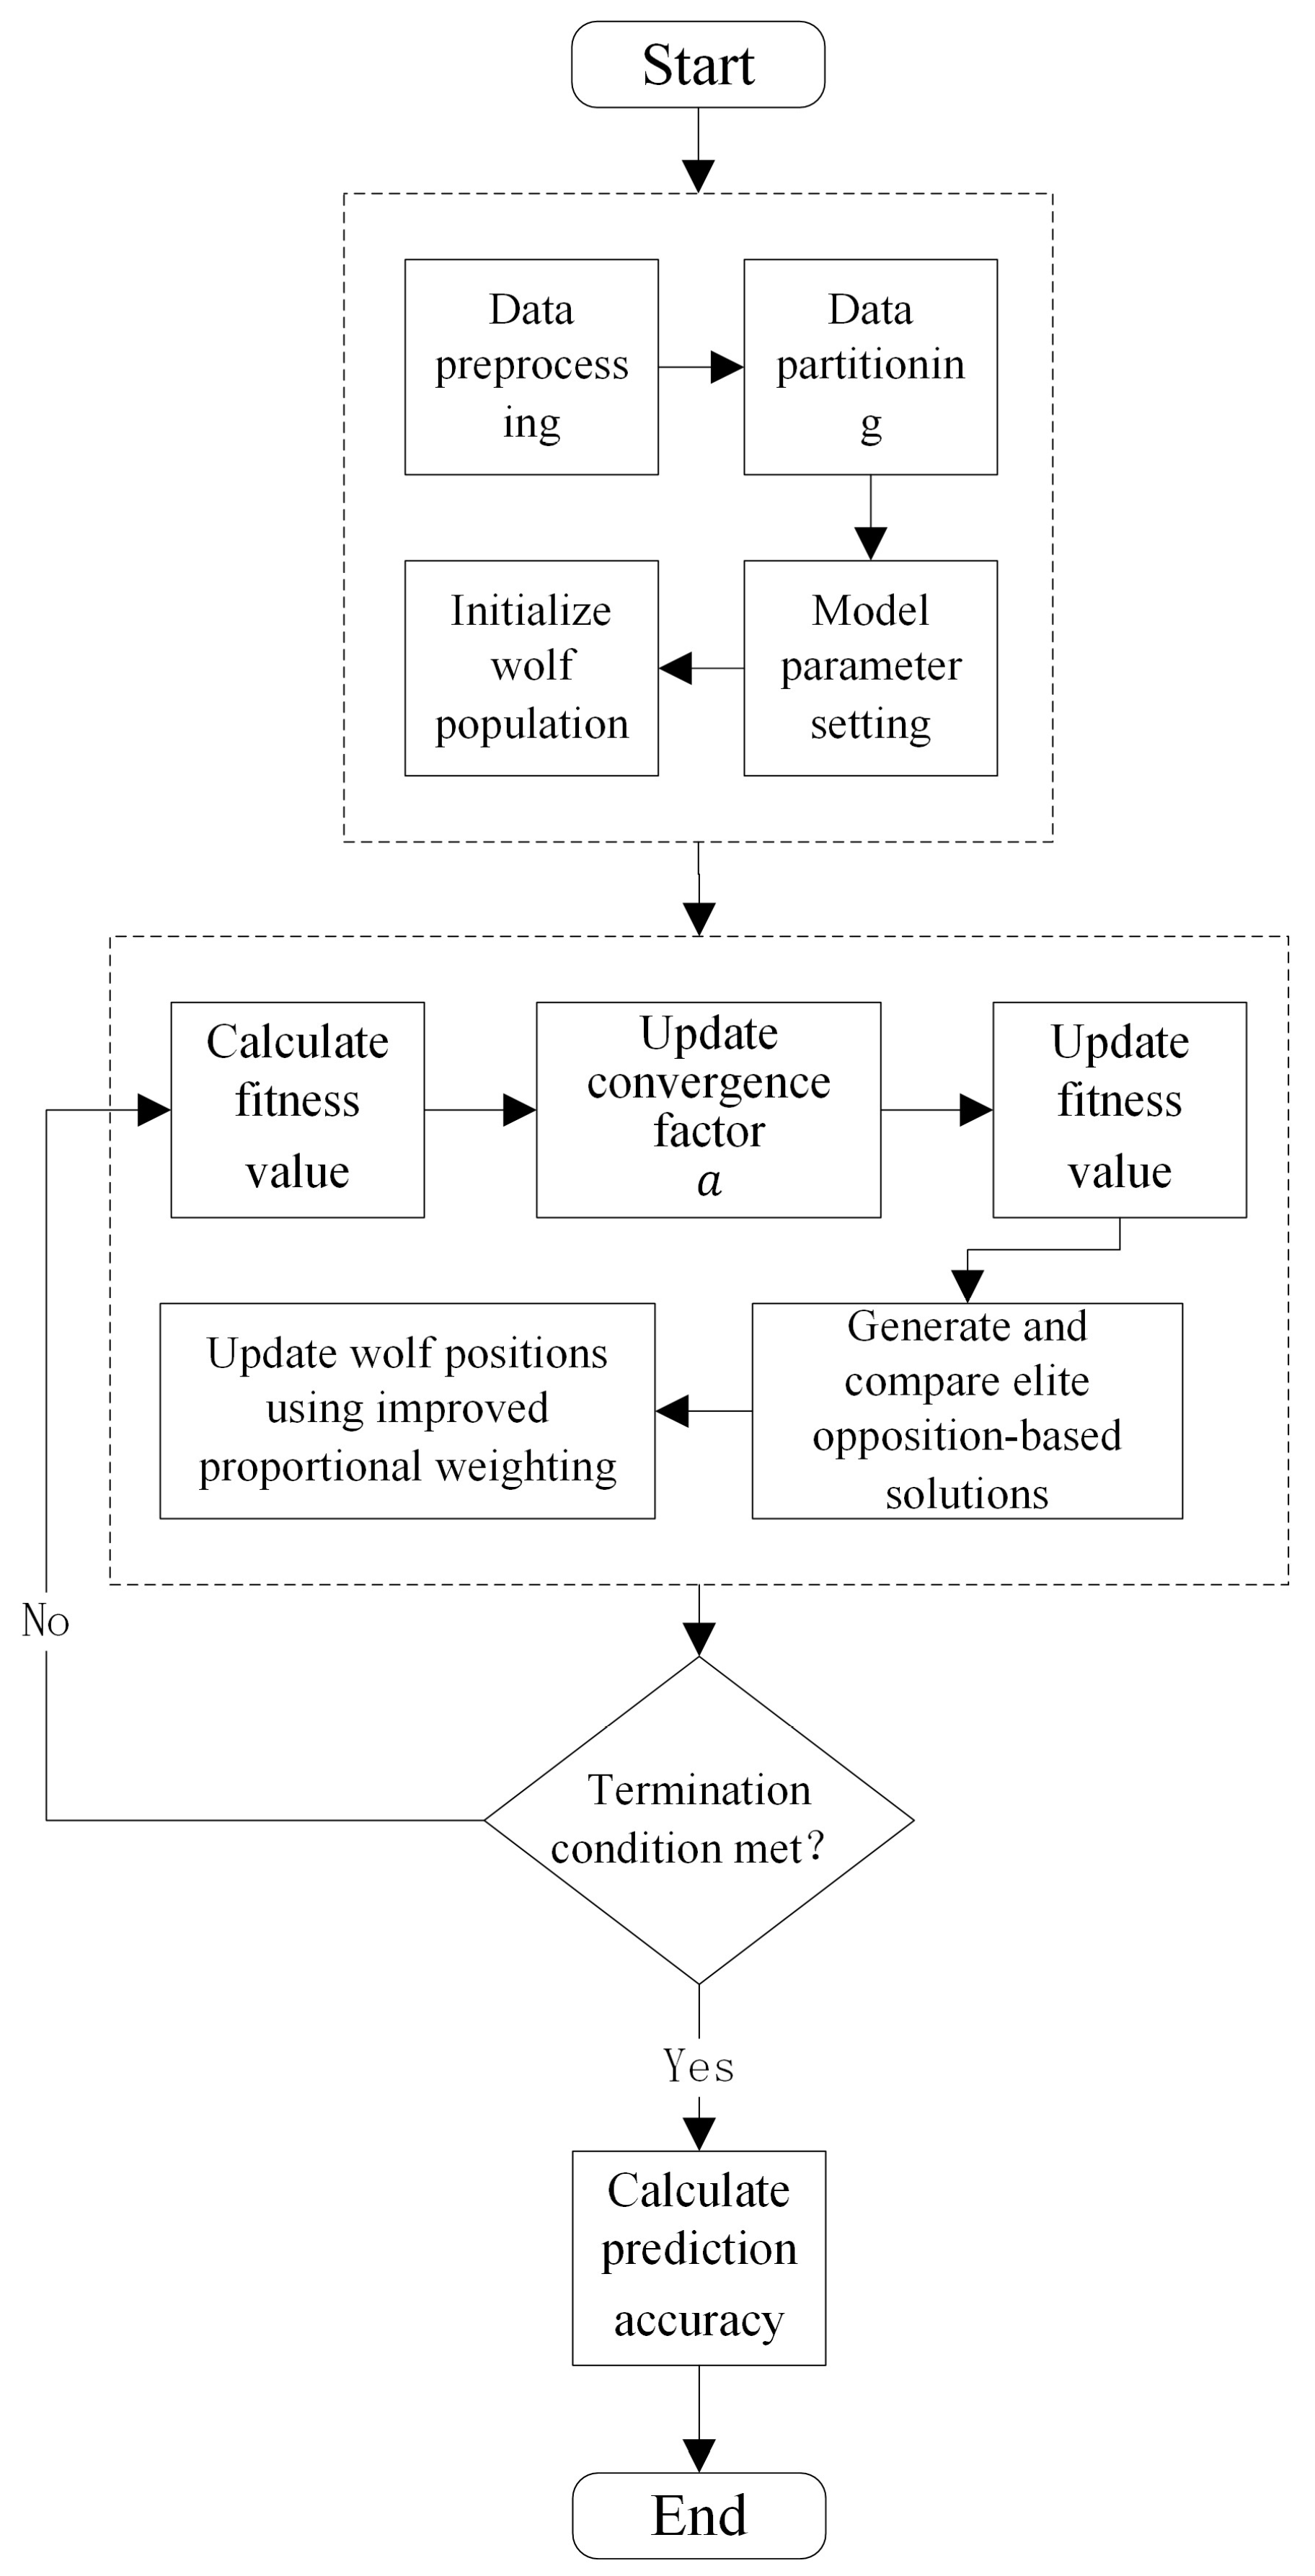
Here, three enhancement strategies are introduced to develop an elite-guided GWO with a cosine-based convergence factor and improved proportional weights. This IGWO aims to accelerate convergence while reducing the tendency to become trapped in local optima. The three improvements are as follows:
(1) Cosine-varying convergence factor. We propose a convergence factor that follows a cosine law, leveraging the nonlinear shape of the cosine function to adjust exploration and exploitation more flexibly through the iterations and thus balance global versus local search. The revised convergence factor is given in Equation (10).
a ( t ) = 1 + cos t t max π n , t 1 2 t max 1 cos t t max π n ,   1 2 t max t t max
where a is the cosine-modified convergence factor, t is the current iteration, t max is the maximum number of iterations, and n is a decay exponent.
The attenuation index n represents the nonlinear speed of the function a(t) from a large step size in the initial stage to a small step size in the later stage. When n is between 0.5 and 1, the attenuation speed is relatively slow. When n is greater than 2, the attenuation speed is too fast, and it is prone to getting stuck in local optima. Therefore, in this study, after testing the values of n, the value of n was selected as 1.4, providing the best balance between the search breadth and the convergence speed. The maximum iteration number is t max , which determines the available computational budget. A larger t max improves convergence accuracy but increases time cost. Considering the real-time constraint of the concentration-detection system (82 ms per prediction, 200 Hz sampling), we used t max = 200 for offline optimization and 60–100 for online adaptation.
(2) Elite Opposite Learning Strategy (EOLS). EOLS is an opposition-based strategy that generates new candidate solutions using the current elites as references. Let the elite individual be X i . j e = ( X i .1 e , X i .2 e , , X i . d e ) for i = 1 , 2 , , s , and dimension j = 1 , 2 , , d . Its opposite solution is X ¯ i , j e = ( X ¯ i , 1 e , X ¯ i , 2 e , X ¯ i , 3 e , , X ¯ i , d e ) , constructed from the elite’s position and the search-space bounds. For each dimension, the opposite value is computed by Equation (11):
X ¯ i , j e = K * a j + b j - X I , j e
where X ¯ i , j e denotes the opposite value in dimension i , K ∈ (0,1) is a dynamic coefficient, and K regulates the distance of the opposite solution: larger K (>0.6) enhances global exploration but may cause oscillation, whereas smaller K (<0.2) yields conservative refinement. We adopted a linearly decreasing schedule K: 0.6–0.2, enabling strong exploration in the early phase and stable convergence later.
(3) Distance-aware proportional weights. We revise the position-update (proportional weight) rule in GWO. The proportional weights govern the relative contributions of different wolves to the update and, hence, steer the search adaptively. Using a step-size Euclidean-distance-based weighting scheme, ordinary wolves adjust their influence according to their distances from the elites, improving search behaviour across different phases. The weights are defined in Equations (12)–(13):
W 1 = X 1 X 1 + X 2 + X 3 W 2 = X 2 X 1 + X 2 + X 3 W 3 = X 3 X 1 + X 2 + X 3
X ( t + 1 ) = W 1 X 1 + W 2 X 2 + W 3 X 3 3
where W1, W2, and W3 denote the learning rates with respect to the leading α , β , and δ wolves, and X 1 , X 2 , and X 3 are their positions.
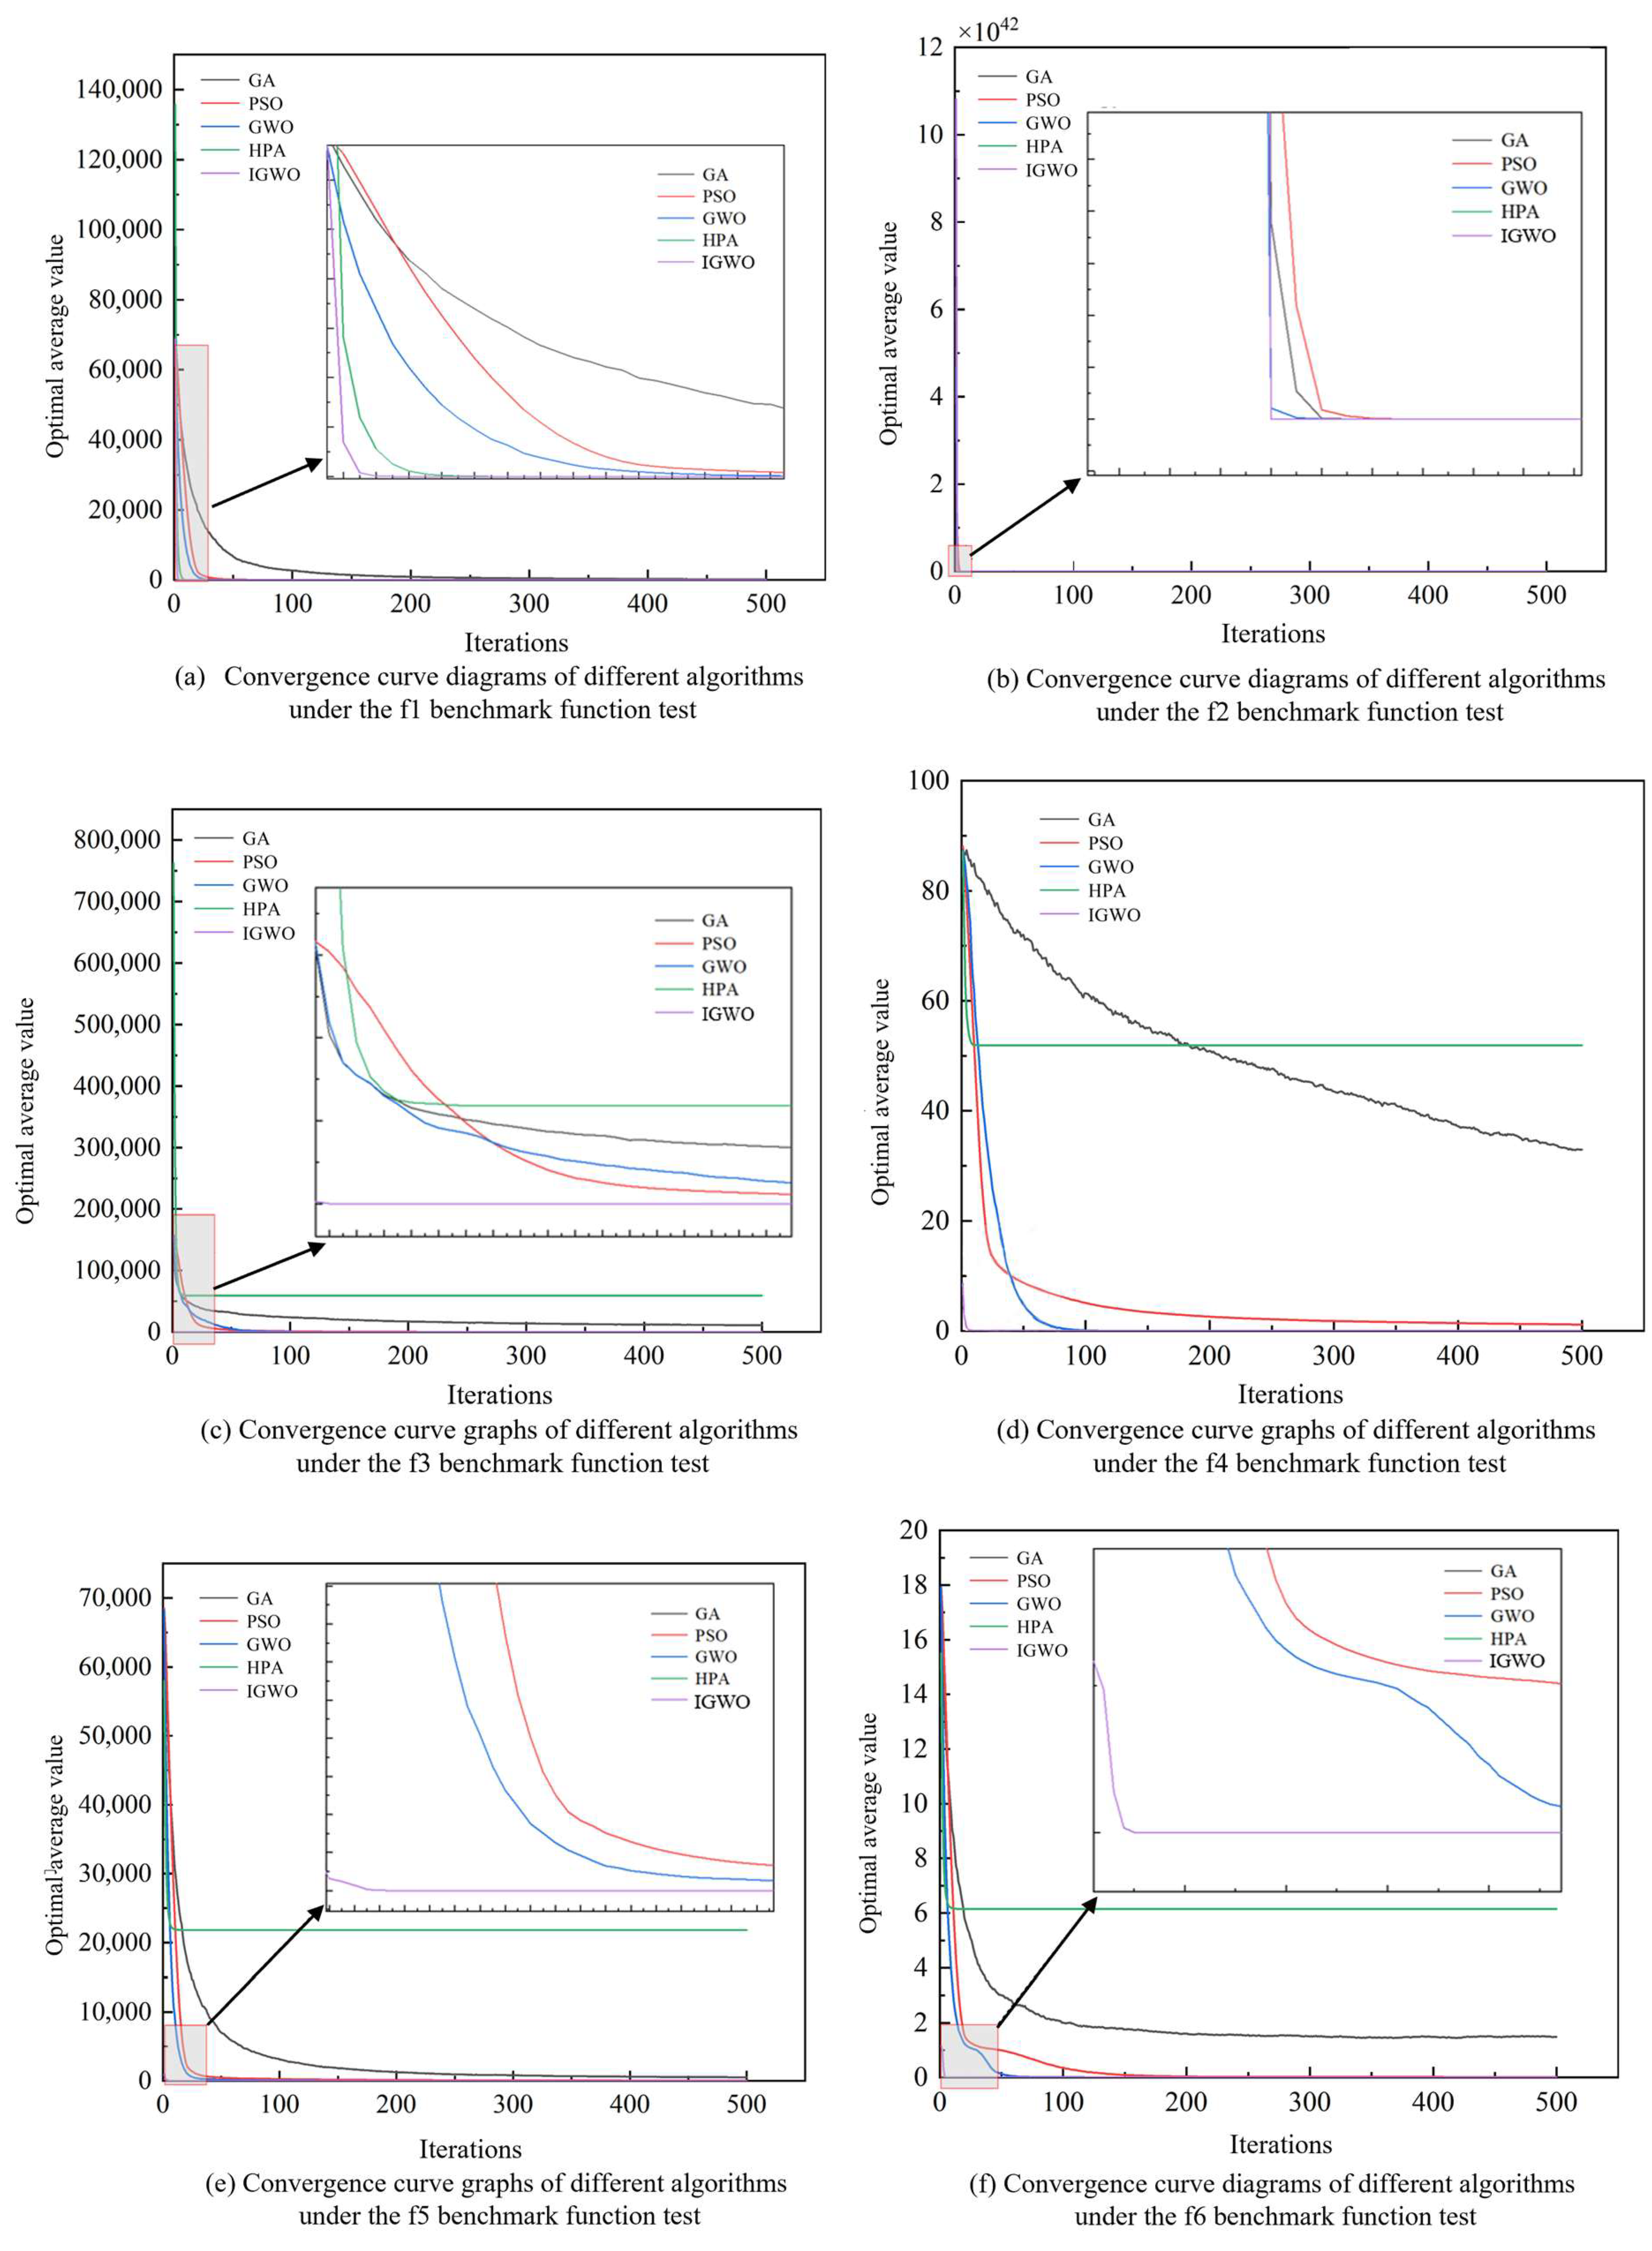
To evaluate the performance of the Improved Grey Wolf Optimizer (IGWO), six commonly used benchmark test functions were selected for simulation studies. The functions f 1 f 6 are listed in Table 9; f 1 f 4 are unimodal, while f 5 and f 6 are multimodal. Each algorithm was executed independently 30 times.
We compare the proposed IGWO with the canonical Genetic Algorithm (GA), Particle Swarm Optimization (PSO), the Grey Wolf Optimizer (GWO), and the more recent Hunter–Prey Optimization (HPO) across six benchmark functions. The numerical results are summarized in Table 10, and the convergence trajectories are shown in Figure 7.
The average fitness value across 30 independent runs reflects the convergence accuracy under a fixed iteration budget, whereas the standard deviation measures the robustness of convergence against random initialization and parameter perturbation. The IGWO consistently achieved the lowest mean errors and near-zero standard deviations across all unimodal and multimodal functions (see Table 10 and Figure 7). These results demonstrate that the improved convergence factor (controlled by n), elite-opposition learning coefficient K, and iteration budget tₘₐₓ together enhance convergence precision and stability while maintaining performance insensitivity to small parameter variations.

3.2. Support Vector Regression for Concentration Detection Based on IGWO

Support Vector Regression (SVR) is the regression variant of Support Vector Machines (SVMs). By constructing an ε-insensitive wide tube in feature space—within which prediction errors are treated as zero—SVR improves generalization. In this study, an Improved Grey Wolf Optimizer (IGWO) is used to tune two SVR hyperparameters, the penalty coefficient C and the kernel width σ , thereby enhancing the accuracy of thrombolytic solution concentration detection. We build an IGWO-SVR model that takes the coefficient of determination R2 as the fitness function and seeks the hyperparameter pair that maximizes R2 on the training set. The resulting model balances detection accuracy and generalization and is validated on a dataset generated via finite element simulations of a clamped piezoelectric actuator.
A flowchart of the IGWO-SVR pipeline is shown in Figure 8.
To better approximate in vivo thrombus dissolution, we construct a bidirectional acoustic–solid coupled multiphysics finite element (FE) model using the actuator’s optimal geometry (overall length 70 mm, thickness 1 mm, width 5 mm; piezoelectric patch 8 mm × 2 mm × 0.5 mm), as illustrated in Figure 9.
In the finite element simulation of acoustic–solid coupling for the actuator, the fundamental governing equation used to model and simulate the acoustic pressure and wave propagation within the sound field is expressed as follows:
( 1 ρ c ( p t q d ) ) k eq 2 p t ρ c = Q m p t = p + p b k eq 2 = ( ω c c ) 2
where p t denotes the acoustic pressure gradient, and p t represents the total pressure, which consists of the static pressure of the fluid ( p ) and the additional pressure induced by the acoustic wave ( p b ). q d refers to the gradient of the particle velocity potential, which is related to the fluid velocity field. ρ c denotes the characteristic acoustic impedance of the fluid, defined as the product of the fluid density ( ρ ) and the sound speed. k eq is the equivalent wavenumber, which determines the propagation characteristics of the acoustic wave in the medium. Q m represents the source term, describing the acoustic source intensity per unit volume. ω denotes the angular frequency of the acoustic wave, and c c is the sound speed.
In the acoustic–solid coupling analysis, the accurate definition of boundary conditions plays a decisive role in ensuring the reliability of the simulation results. Therefore, in this study, corresponding boundary conditions were applied to the structural, piezoelectric, and fluid domains.
In the structural domain, the actuator base and support end were constrained using a fixed constraint to represent rigid fixation, while the tip and the portion in contact with the liquid were treated as free boundaries, where the displacement is determined by the reactive pressure of the acoustic field. In the piezoelectric domain, the upper and lower electrodes were subjected to voltage excitation and ground potential, respectively, and the side surfaces were set as electrical insulation to prevent current leakage. Thus, for the piezoelectric element, the electrode boundary condition can be expressed as follows:
V p = V 0 sin ( 2 π f t ) V bottom = 0
In the fluid domain, an acoustic–solid coupling interface was established between the actuator surface and the liquid field, satisfying the continuity of normal velocity and acoustic pressure to realize the bidirectional transfer of energy and momentum. The coupling boundary condition can be expressed as follows:
p = ρ c 2 ( u ) v n fluid = v n solid
where u is the solid displacement vector, and its divergence ∇u represents the local volumetric strain within the material.
The free liquid surface was defined as p = 0, representing an open interface exposed to air. The bottom and side walls of the liquid domain were treated as rigid boundaries, where the normal velocity is zero ( ə p ə n = 0 ). To prevent acoustic wave reflection in the finite fluid domain, an absorbing boundary condition ( ə p ə n = j k p ) was applied at the outer edges to simulate outward energy propagation and absorption. The complete boundary condition parameters are summarized in Table 11.
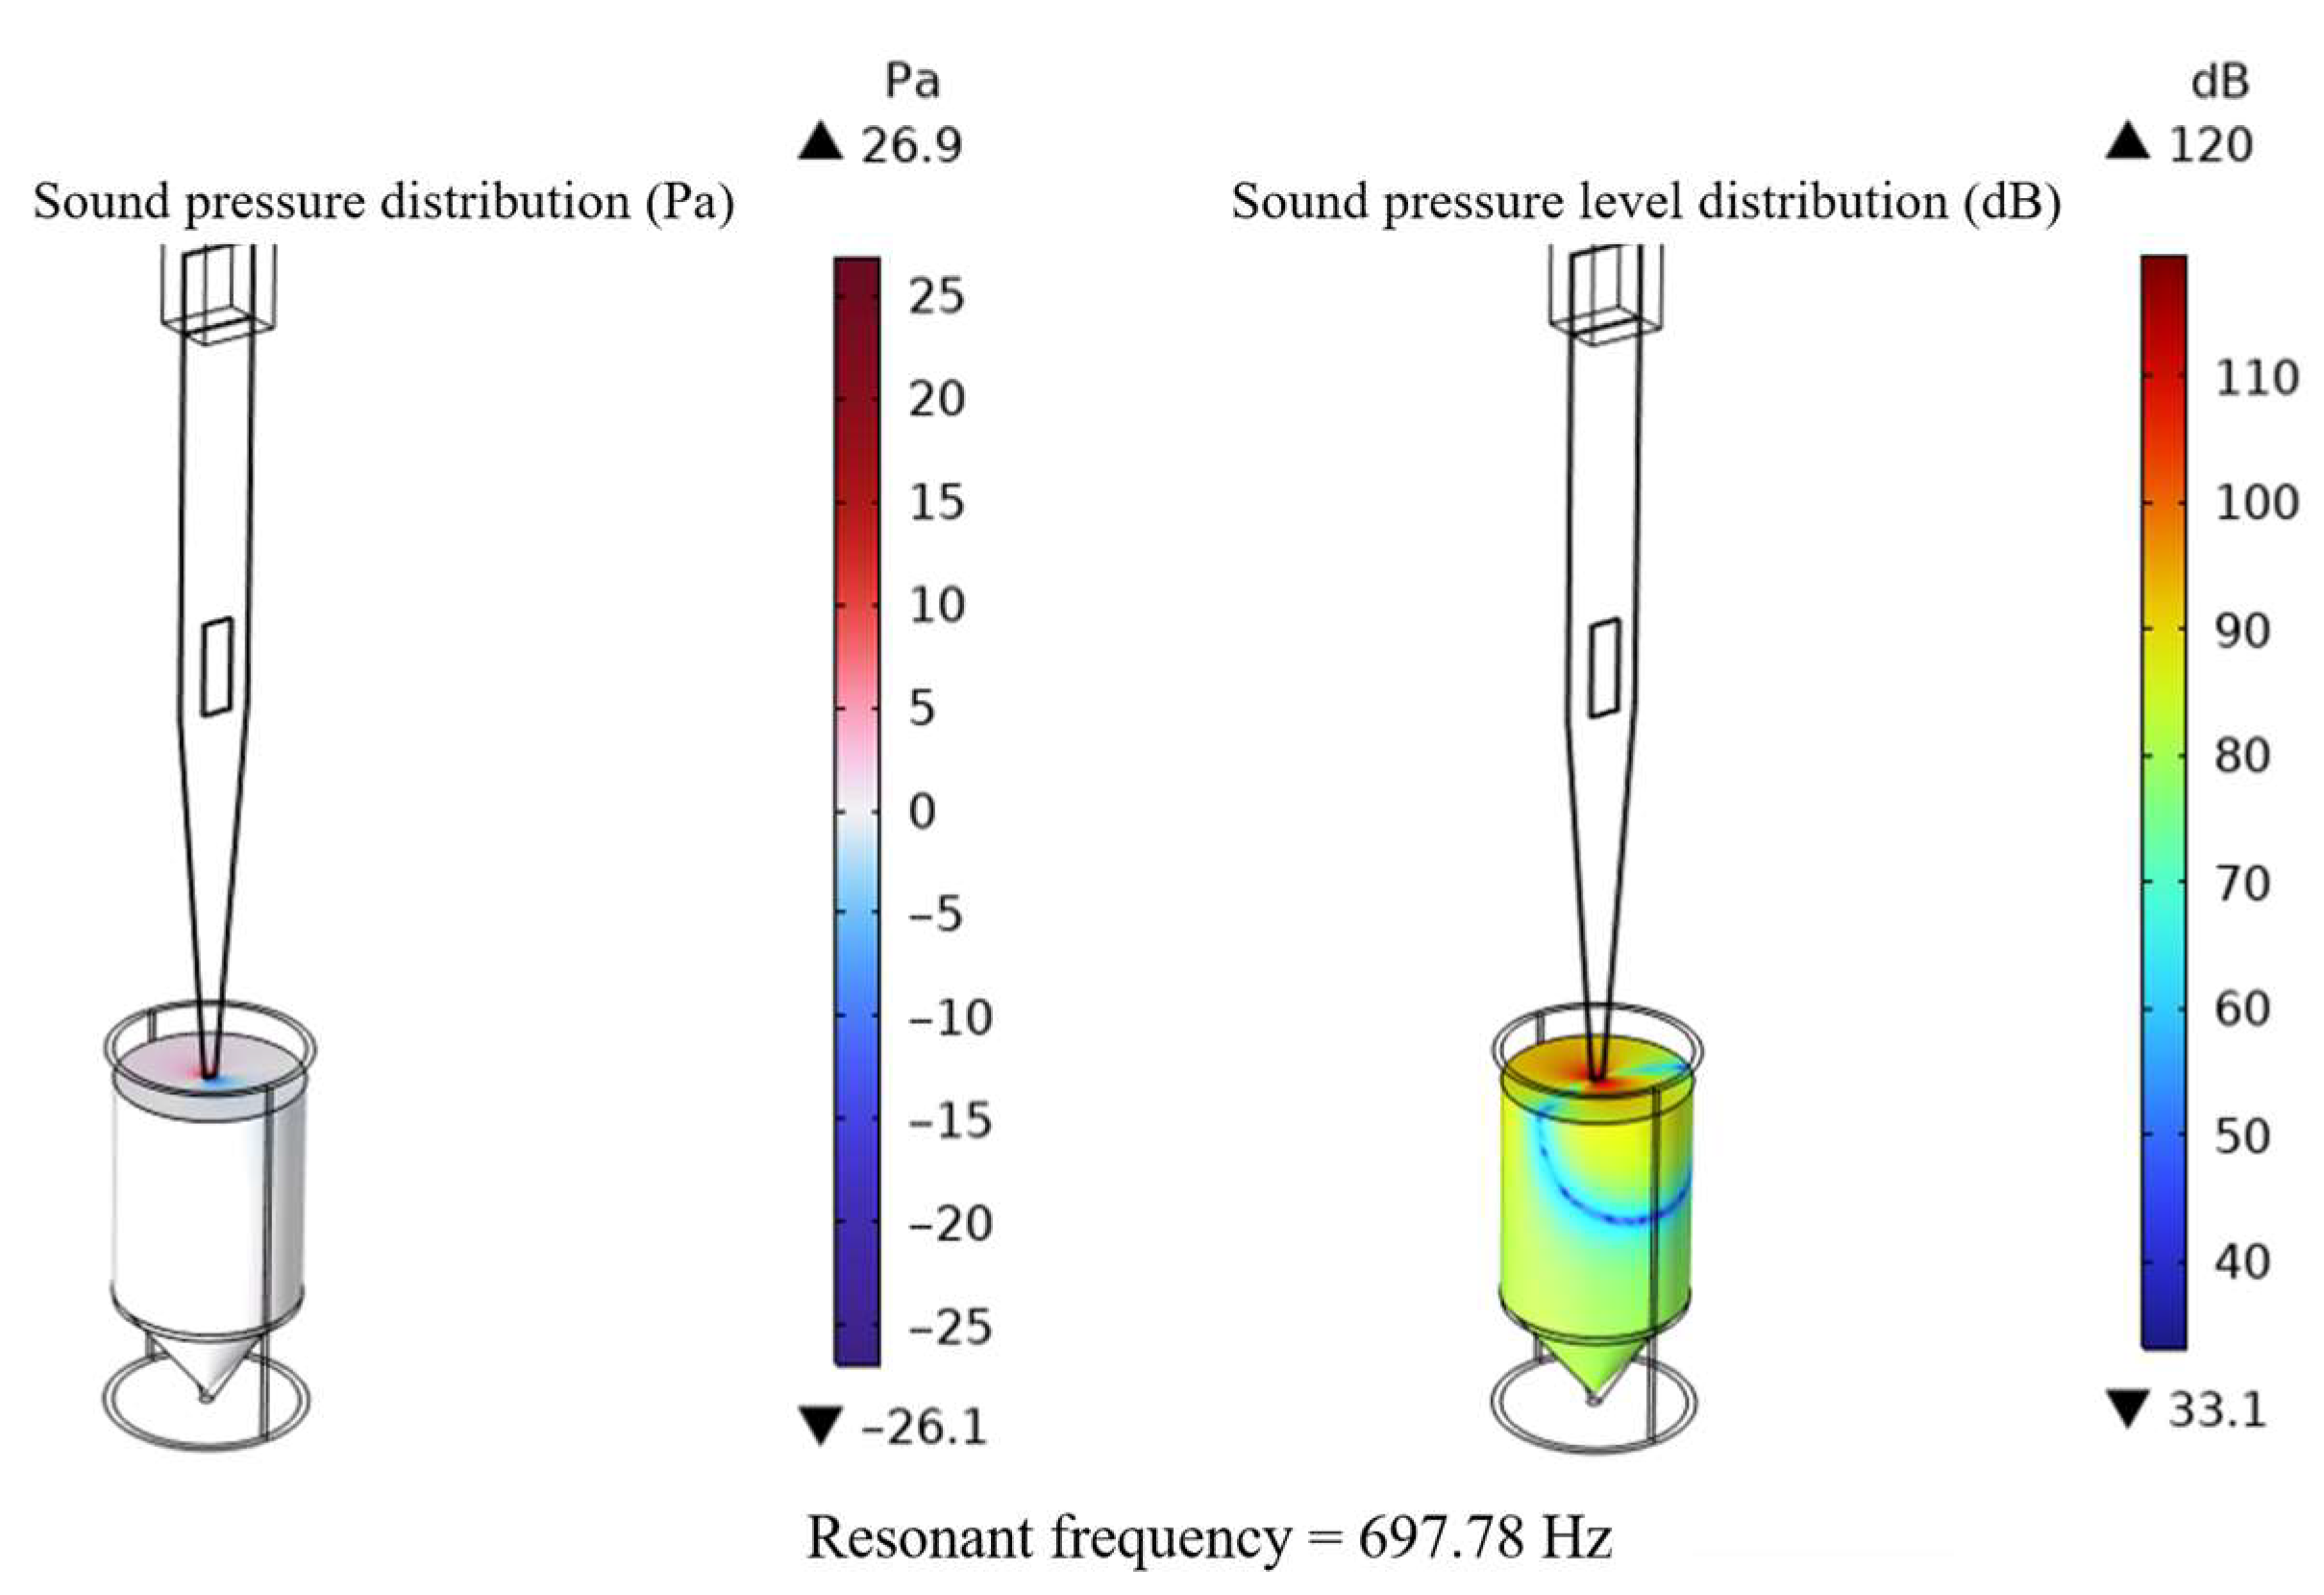
Prior FE results indicate that the first natural frequency yields the largest tip amplitude and output energy; accordingly, acoustic pressure and sound pressure level (SPL) analyses are performed at the first mode on the actuator–fluid interface.
Because glycerol–water mixtures emulate blood’s viscosity and density and can reproduce its non-Newtonian behaviour, and, according to literature data [41,42], the physical properties of the mixture—density ≈ 1100 kg·m−3, viscosity ≈ 3.5 mPa·s, and sound speed ≈ 1500 m s−1—are close to those of human blood ( ρ ≈ 1050 kg·m−3, η ≈ 3.0–4.0 mPa·s, c ≈ 1570 m·s−1), both the simulations and the experiments employ glycerol–water solutions as thrombolytic surrogates. The simulated acoustic pressure and SPL fields are shown in Figure 10.
As seen in Figure 10, the total acoustic pressure at the conical tip–solution interface is approximately 26.9 Pa, with a corresponding SPL of about 120 dB, indicating strong actuator–fluid coupling. Since the tip is only immersed 5 mm below the liquid surface, the change in the resonance frequency is not significant. The first-order resonance frequency is 697.78 Hz.
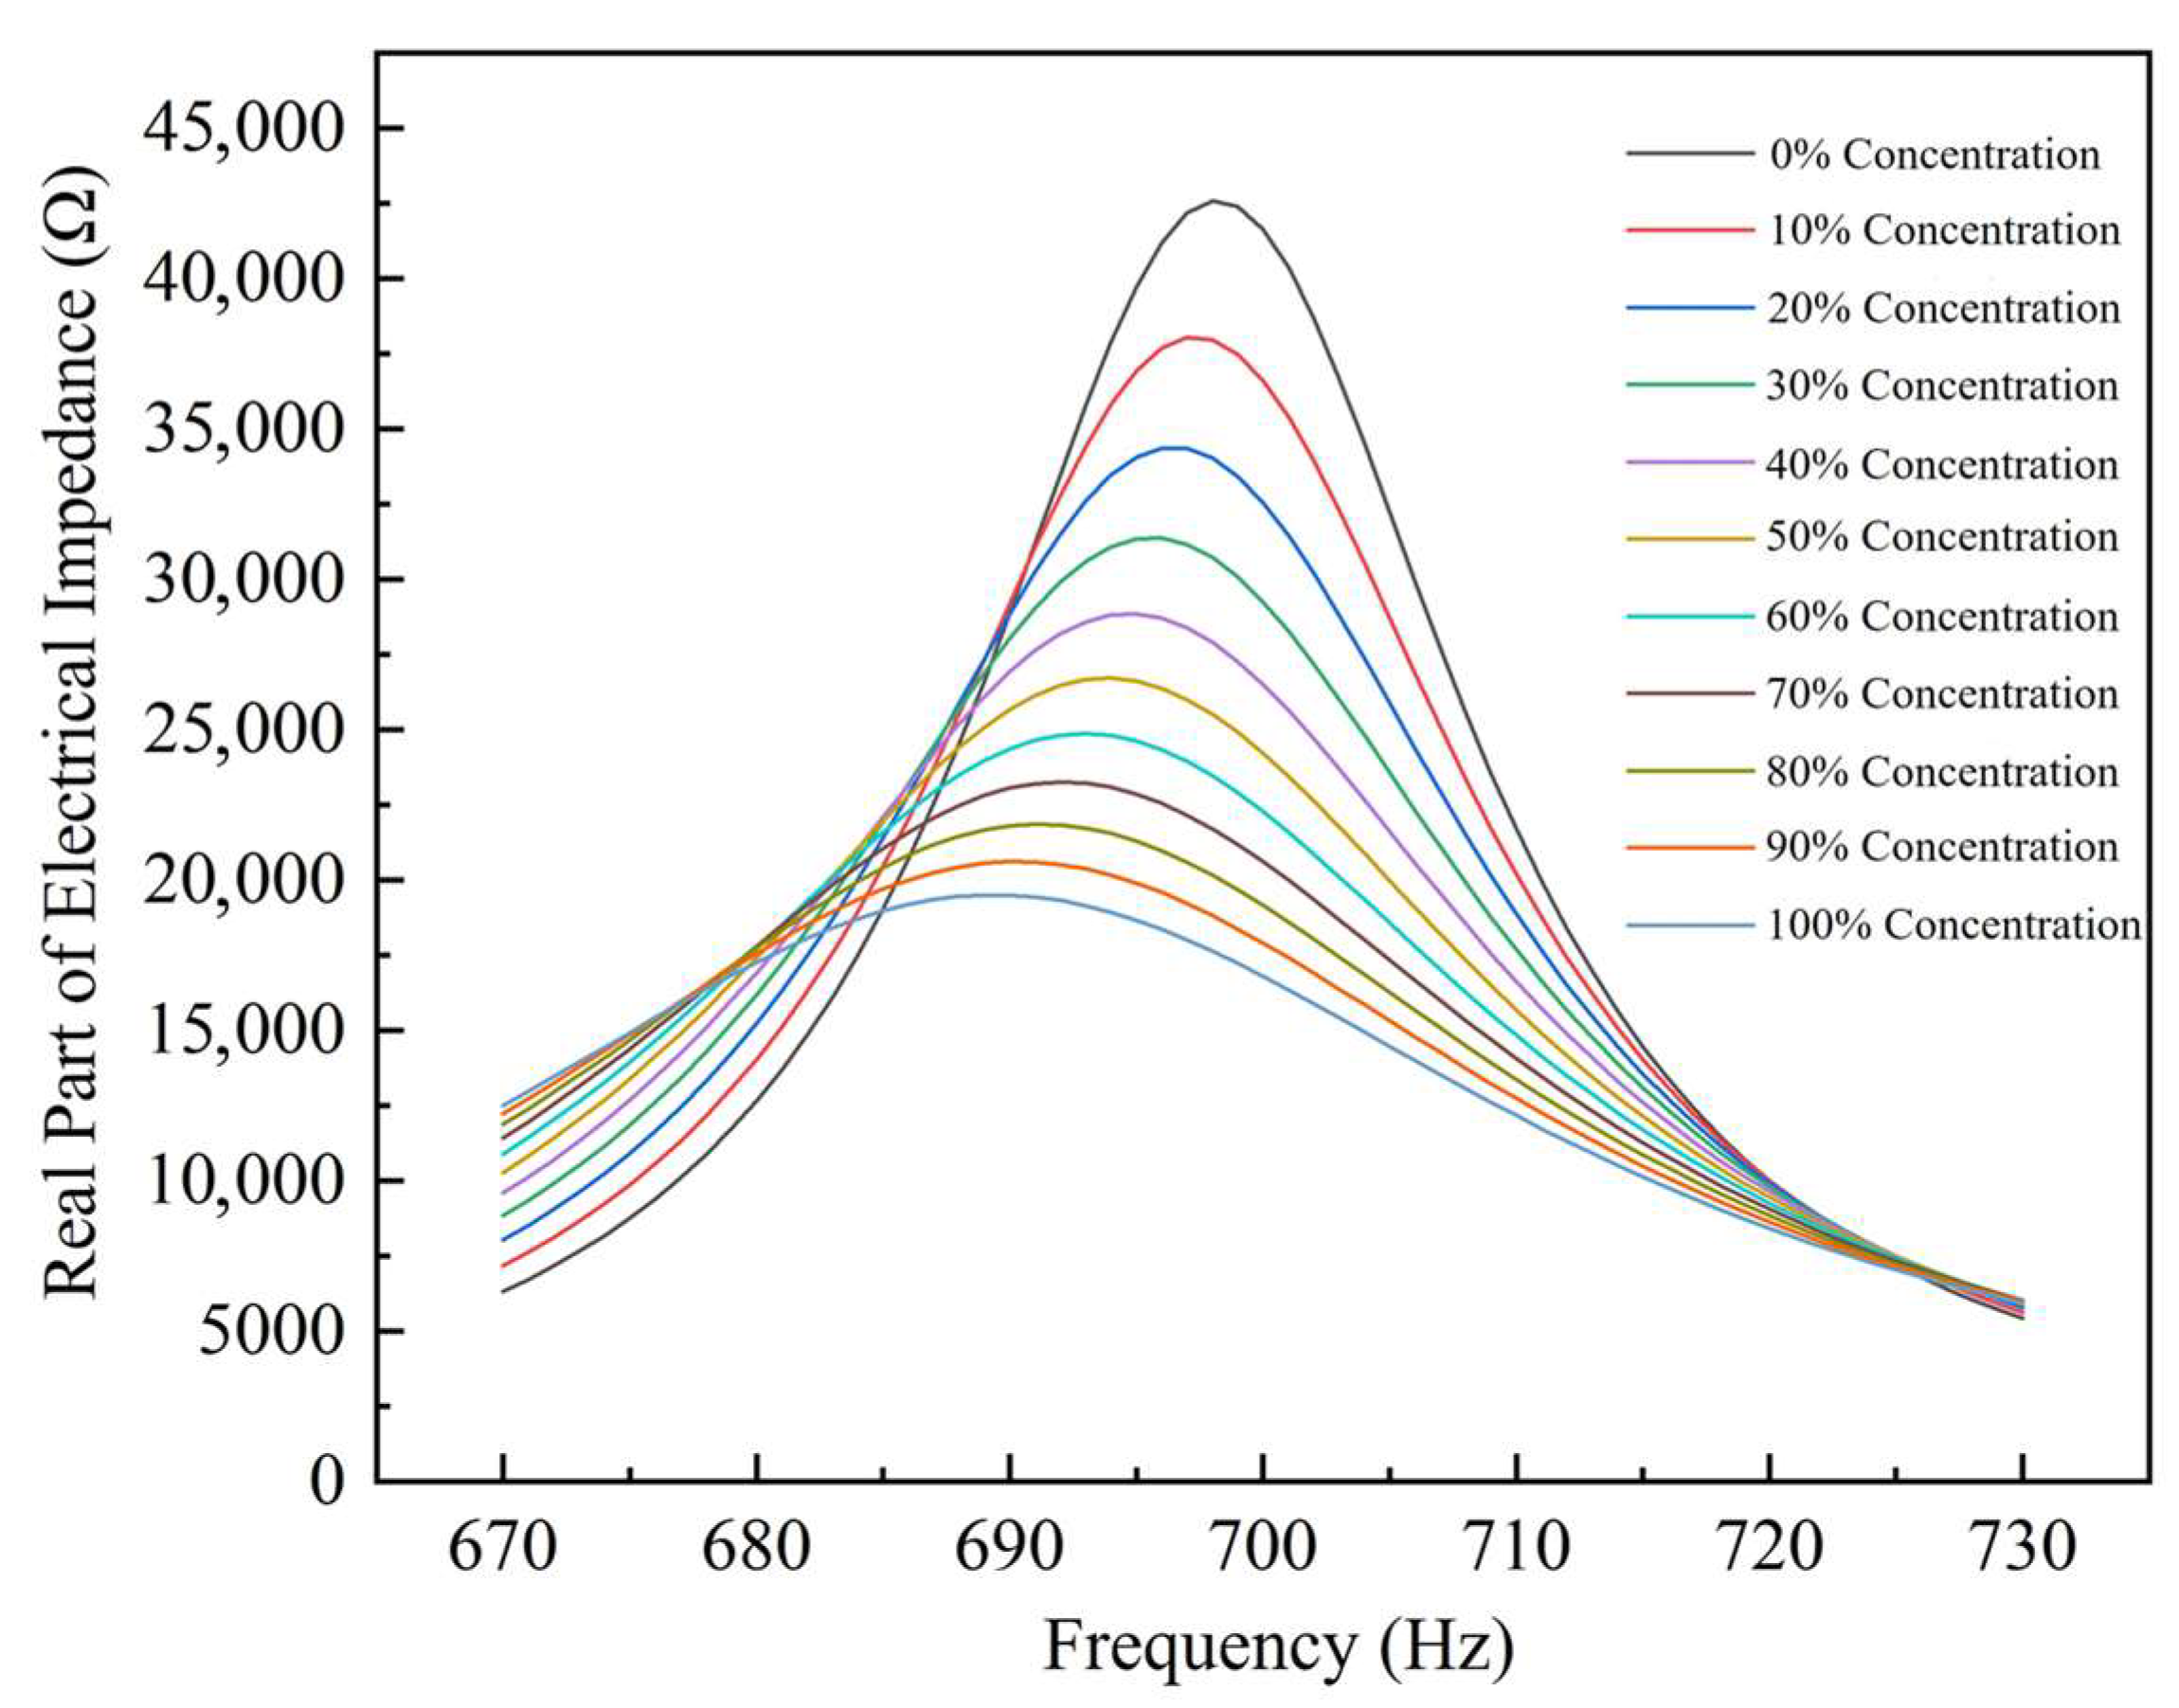
Solution concentration is prepared by percentage–weight mixing of glycerol and water. A frequency band centred near 697.78 Hz is selected to evaluate the real part of the actuator’s electrical impedance. The concentration parameter is scanned over [0%, 100%] with a step of 10%. The resulting mapping from concentration to the real part of impedance—reflecting changes in the effective interaction forces experienced by the actuator—is shown in Figure 11.
From Figure 11, as the thrombolytic solution concentration increases (i.e., as the thrombus dissolves), the real part of the piezoelectric impedance decreases monotonically, and the peak frequency shifts downward.
To obtain sufficient data for assessing IGWO-SVR performance, the concentration is scanned over [0%,100%] using two resolutions: a coarse step of 10% and a fine step of 0.1% (yielding 1001 samples in total for the fine scan). For each concentration, the bidirectional acoustic–solid FE model provides the resonance frequency and the real part of the electrical impedance. A representative excerpt of the concentration–frequency–real-impedance dataset is reported in Table 12.
We standardized all 1001 FE-generated samples using z-score (mean–variance) normalization and compared five detection models: Support Vector Regression (SVR), Random Forest (RF), Partial Least Squares Regression (PLSR), Grey-Wolf-optimized SVR (GWO-SVR), and the proposed IGWO-SVR. We randomly split the data into 80% for training and 20% for testing. The prediction results over the 1001 samples are shown in Figure 12, and the aggregate accuracy metrics are summarized in Table 13.
From Table 13 and Figure 12, IGWO-SVR delivers the best overall performance among SVR, RF, PLSR, GWO-SVR, and IGWO-SVR. It achieves R2 = 0.99999 on both the training and test sets, with RMSE of 0.06213 (training) and 0.04183 (test), indicating an excellent balance between fit and generalization, with extremely low error and high stability. These results verify that the proposed improvements to the Grey Wolf Optimizer effectively enhance traditional SVR.
The RF model attains a test RMSE of 0.06083—slightly higher than IGWO-SVR—while its test R2 is likewise close to 1 (0.99999). This suggests that the ensemble of decision trees captures complex nonlinear relationships without overfitting, exhibiting strong generalization.

4. Test and Discussion

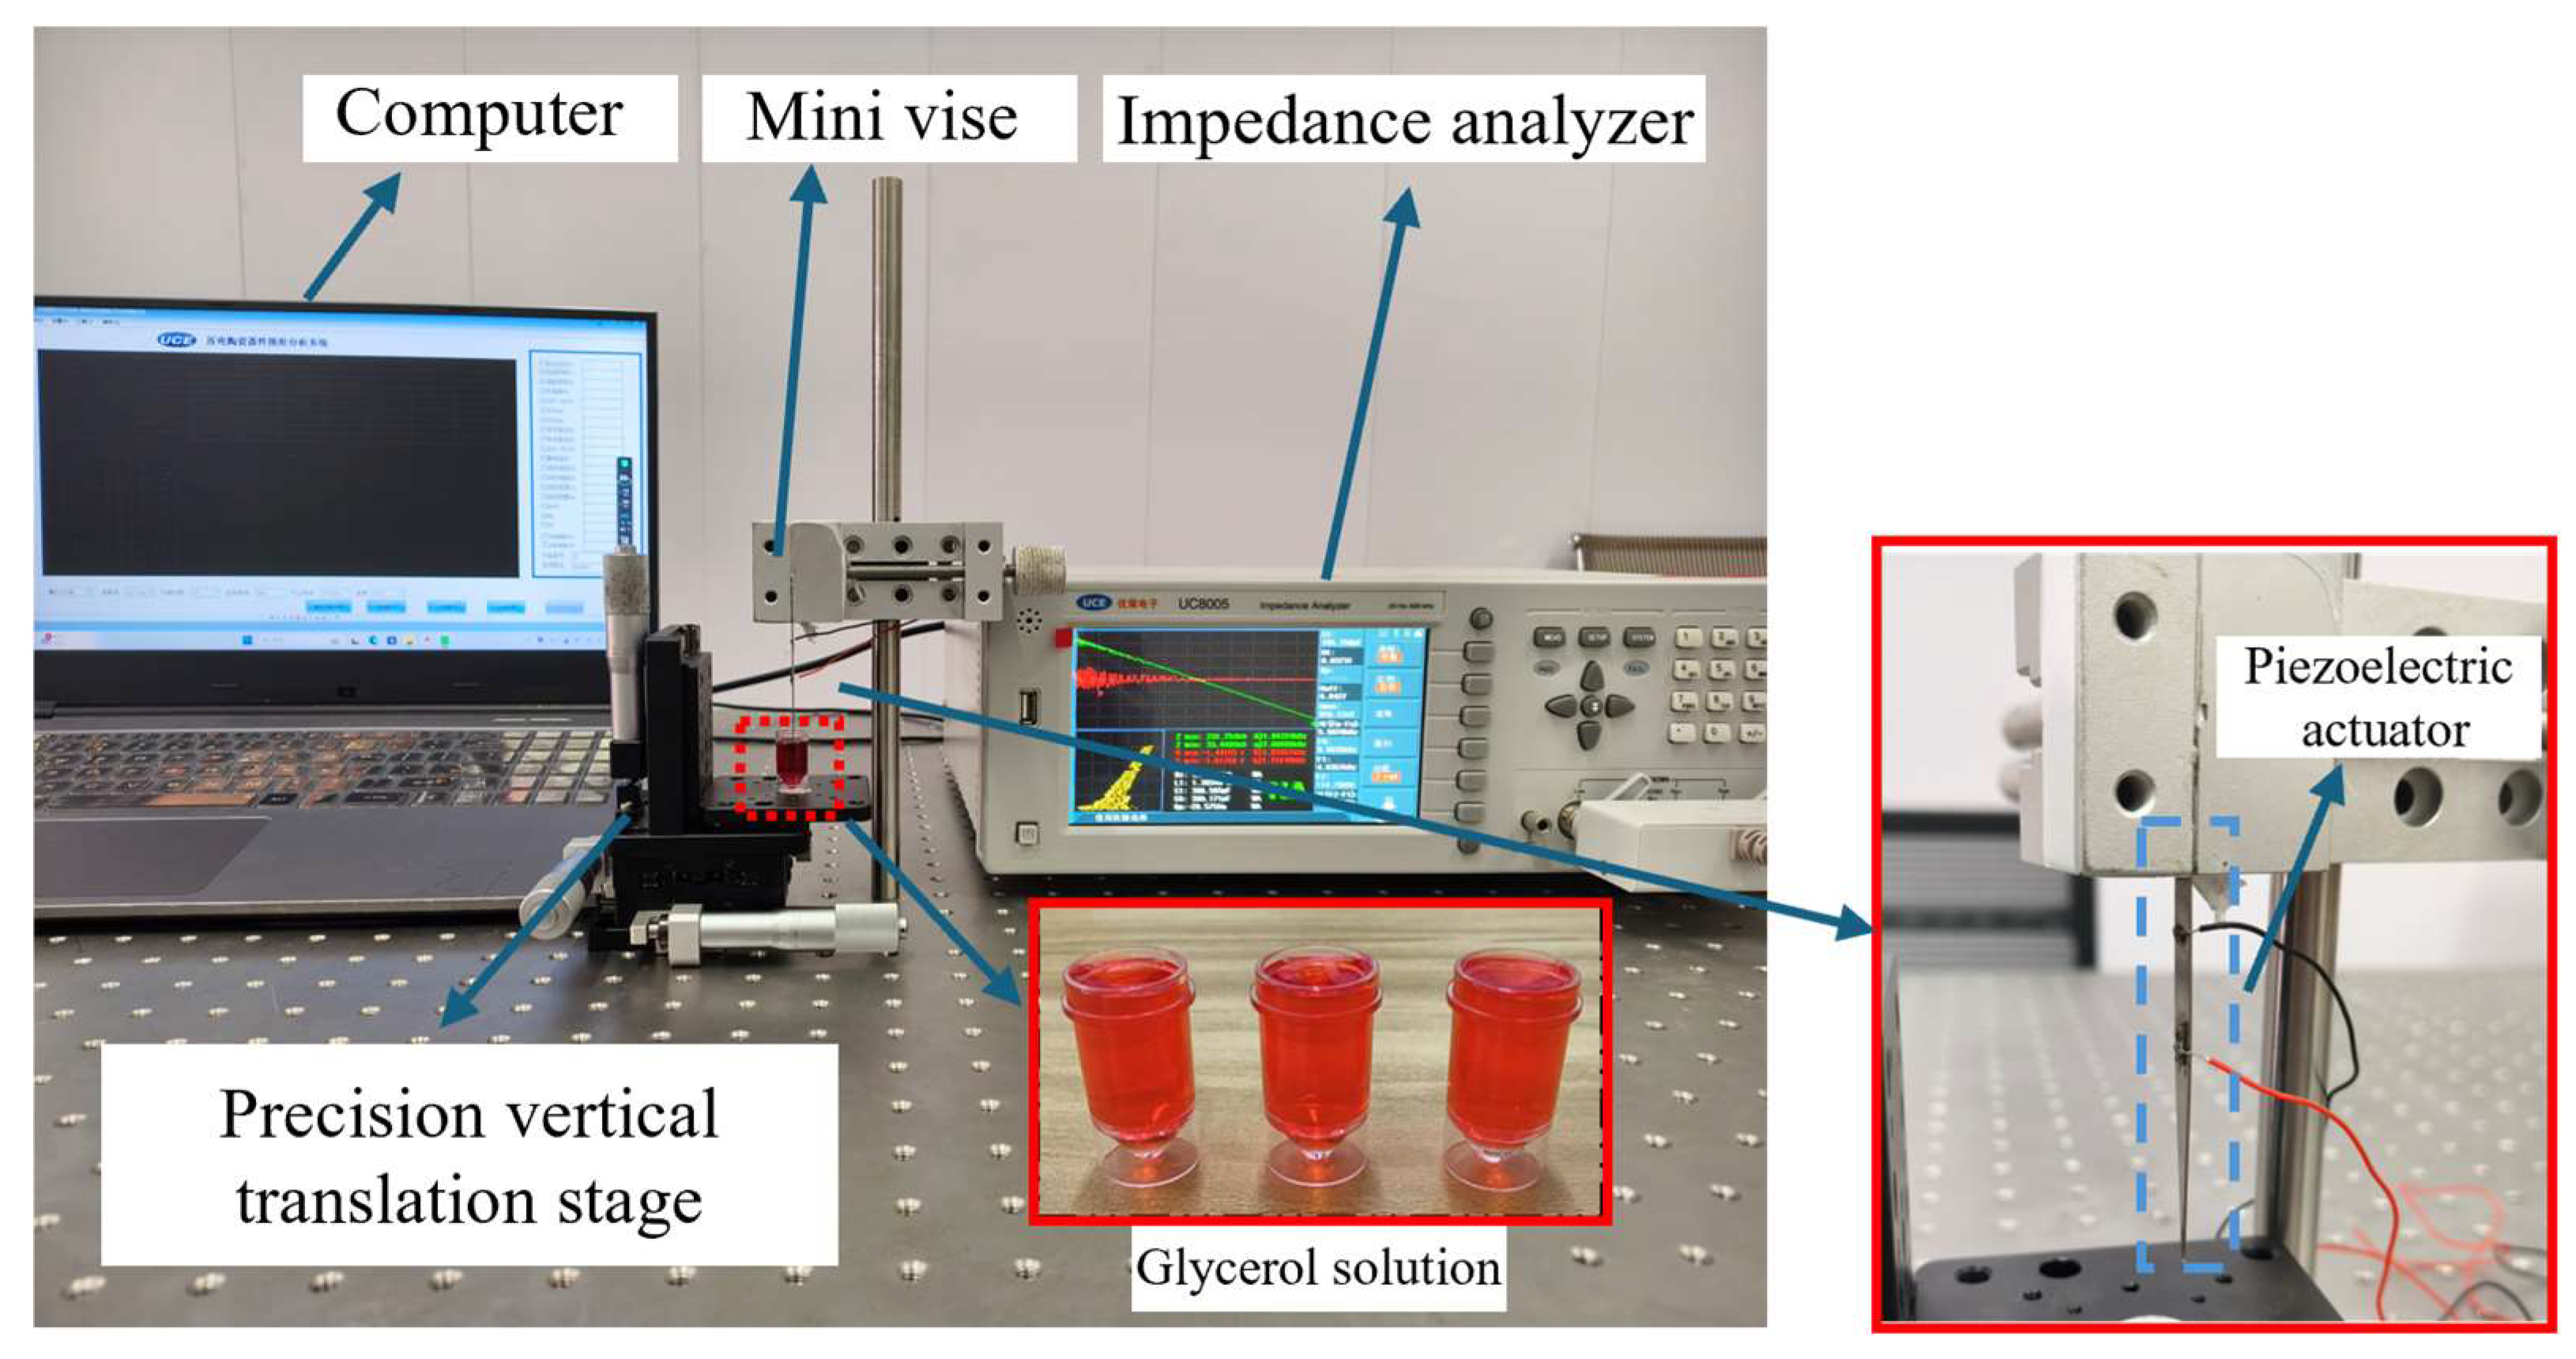
To validate the effectiveness of the IGWO-SVR concentration-detection algorithm, an experimental platform was set up as shown in Figure 13. The system centres on a UC8005 impedance analyzer and the conical actuator. The actuator is clamped with an aluminum mini-vise lined with insulating tape and fixed on the test bench; the solution container is mounted on a GM-V25M precision vertical stage providing 25 mm travel with three degrees of freedom. During experiments, the piezoelectric patch is connected to the impedance analyzer, and the actuator tip is immersed 5 mm into the prepared glycerol solution. The analyzer applies a 1 V sweep voltage to obtain impedance data. Variations in the peak of the real part of the impedance response near the resonance frequency are extracted to assess differences in impedance response across concentrations, thereby reflecting the sensitivity of concentration detection.
Considering that human vessels are small in diameter, whole blood coagulates readily and is difficult to store, and the use of real blood raises ethical concerns; a glycerol–water mixture was used as a blood surrogate. Moreover, the mixture of glycerol and water can represent blood viscosity well. A sample cup with a 1 cm inner diameter was employed. In this study, the glycerol concentration was mapped to the degree of thrombus dissolution: a higher glycerol percentage corresponds to a greater “dissolution” level.

4.1. Impedance Performance Test with the Optimal Structural Parameters

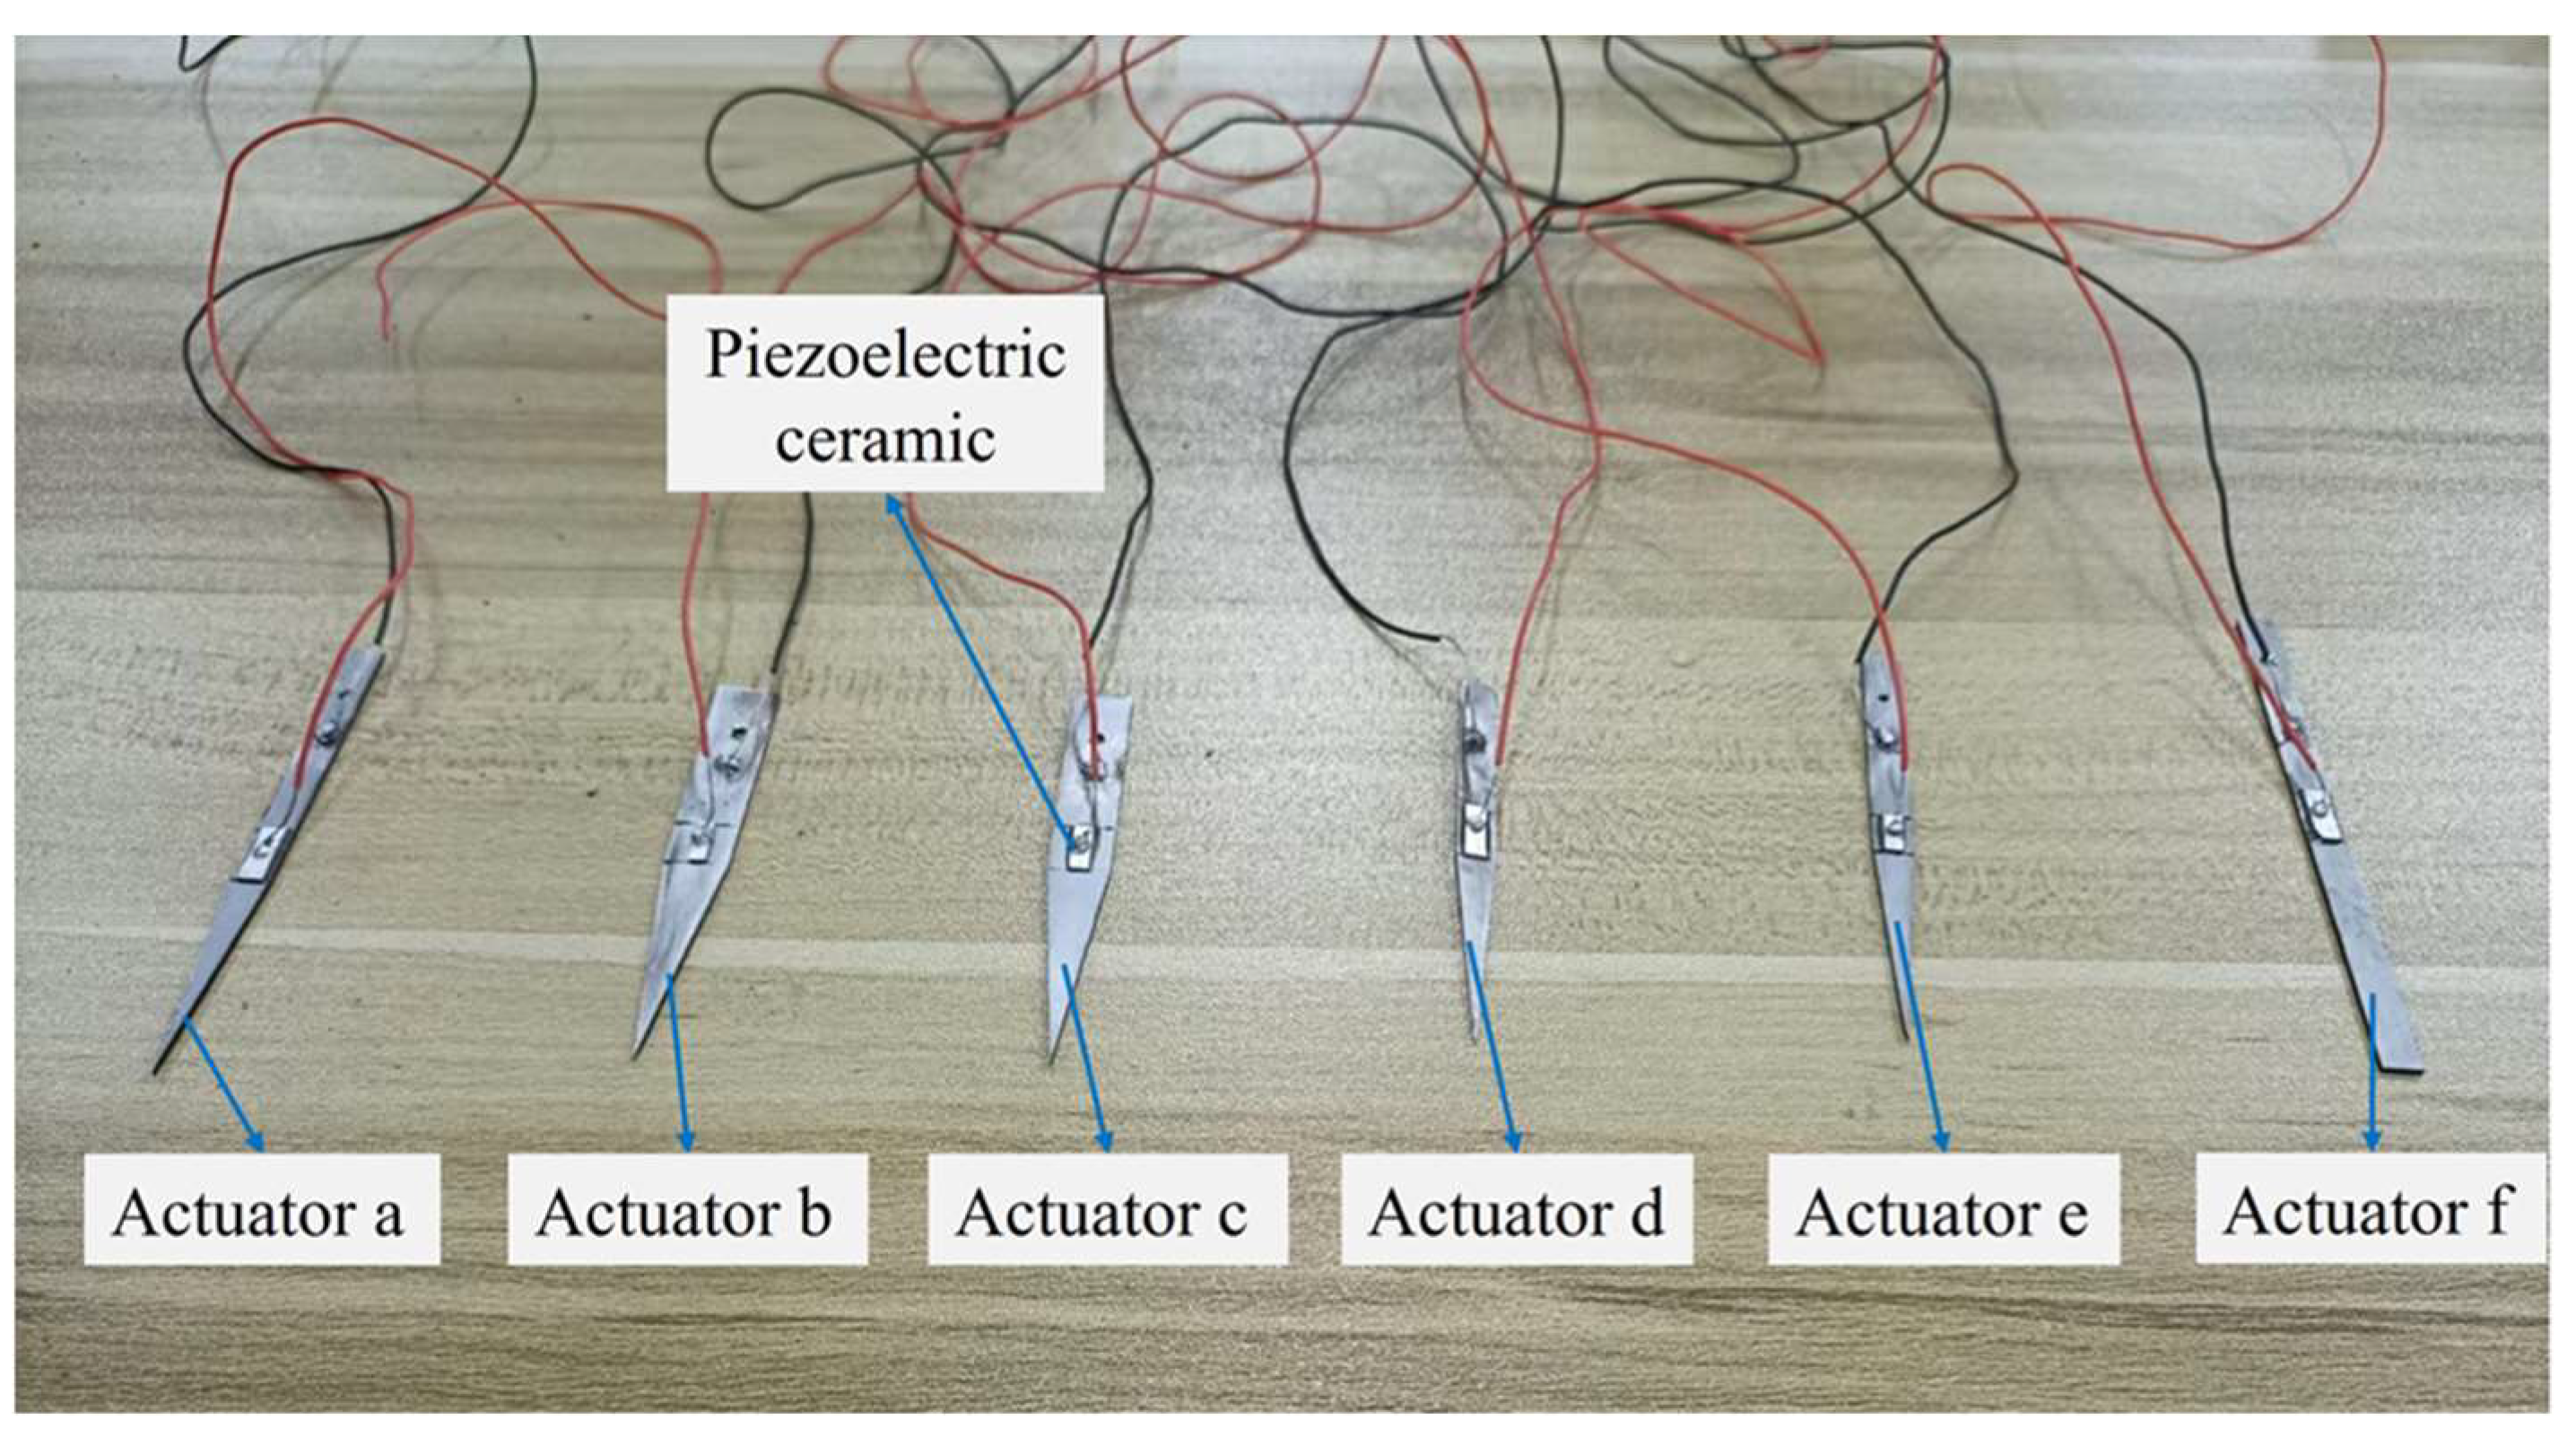
Based on the grey relational analysis (Table 8), prototypes were fabricated for the top five parameter combinations (highest grey relational grades) of the conical actuator. For stronger contrast, a cantilever-type actuator prototype was also fabricated using the parameter set with the highest grey relational grade. In total, six actuator prototypes were prepared, as shown in Figure 14. From highest to lower grey relational grades, the conical actuators are labelled from a to e. The actuator f is the cantilever-type device fabricated with the parameter set corresponding to the highest grey relational grade. The structural parameters of all prototypes are listed in Table 14, with actuator a being the conical actuator with the highest grey relational grade.
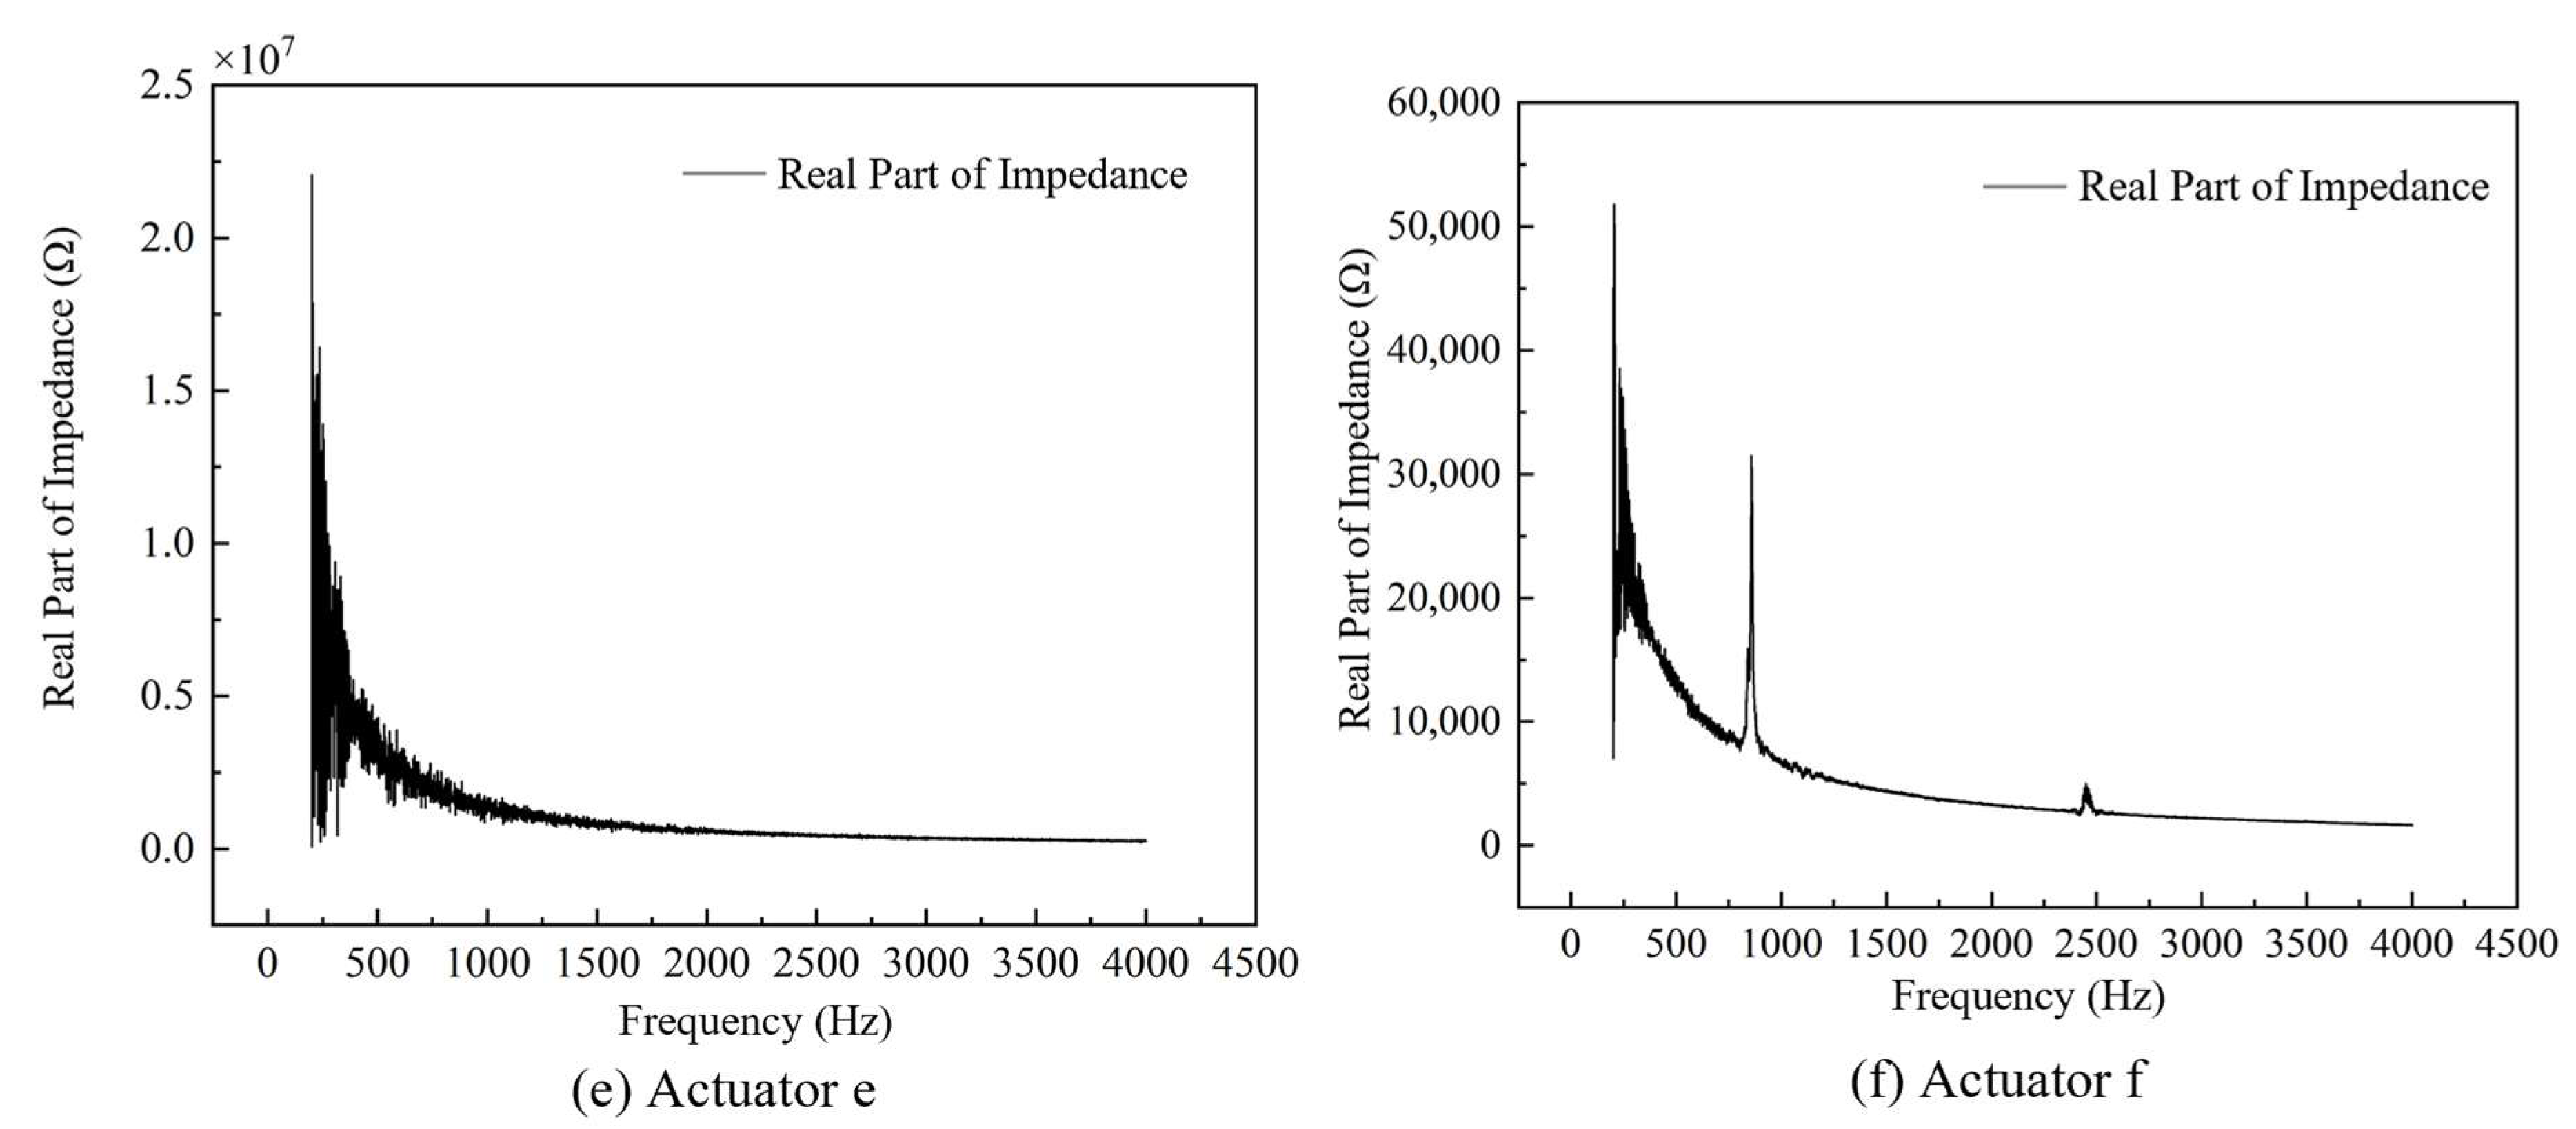
To evaluate the sensitivity intensity of the six actuator prototypes to blood concentration, an impedance analyzer was used to measure the real part of the electrical impedance around the first three resonance modes in a solution with a concentration of 10%. Because the first three resonances of all prototypes lie below 2000 Hz, the sweep range was set to 200–4000 Hz with an excitation amplitude of 1 V. The sweep results at 10% concentration are shown in Figure 15.
From Figure 15, actuators a–d and f exhibit pronounced real-impedance peaks in the 1–2 kHz range. Owing to geometric differences, the peak magnitudes vary across devices. Because the first-mode resonance peaks are more susceptible to noise, we directly inspect the peaks at the second resonance. There, actuator a shows the most prominent peak, indicating the strongest impedance feedback and, by inference, the highest sensitivity in solution.
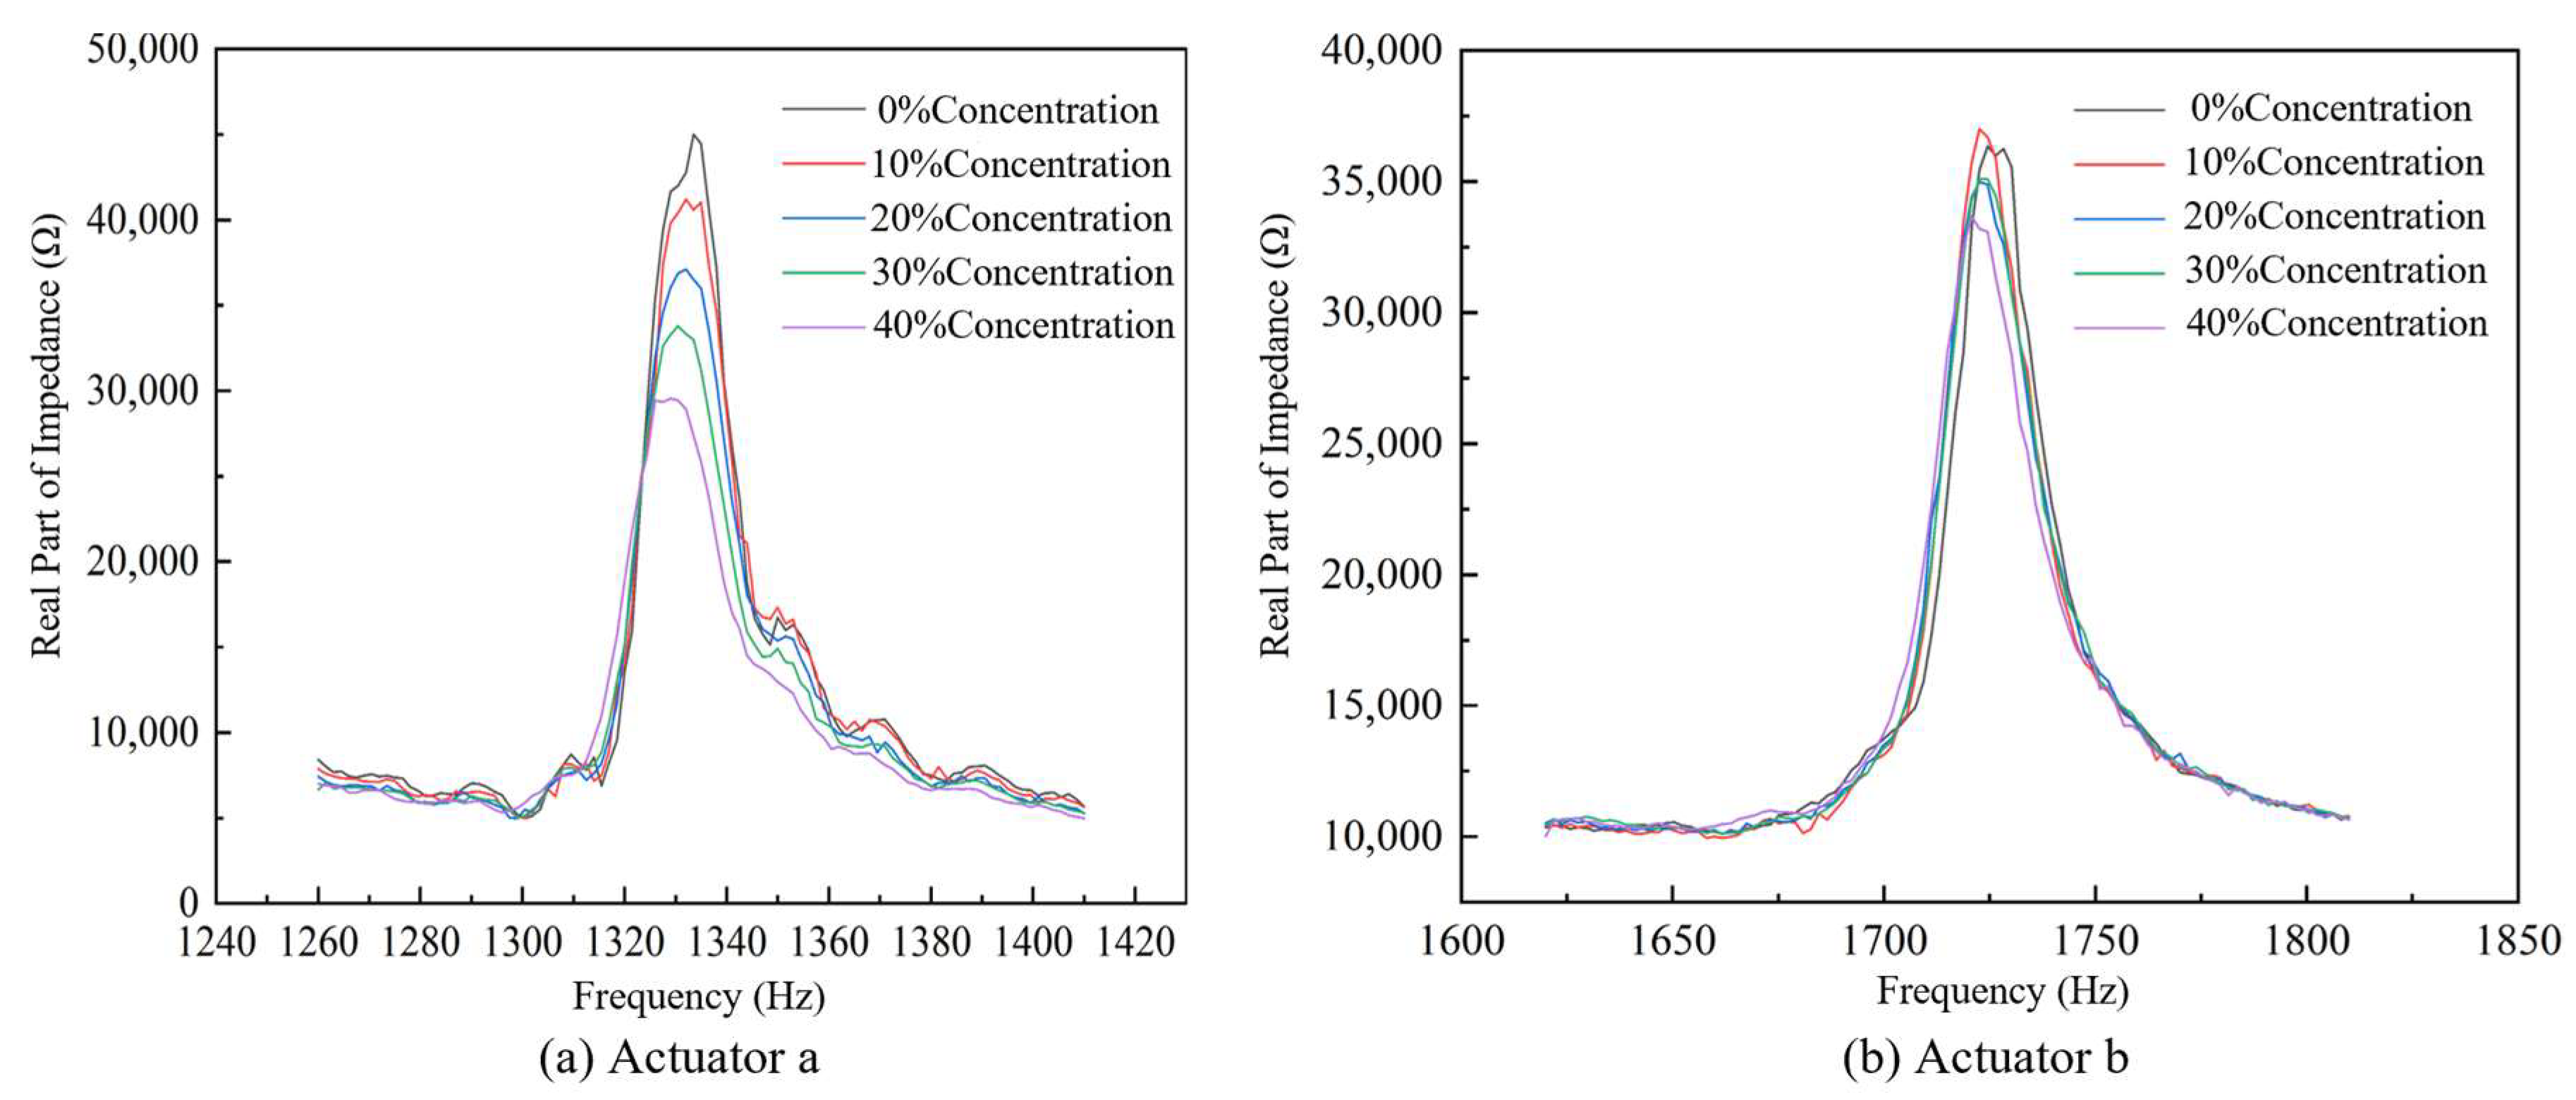
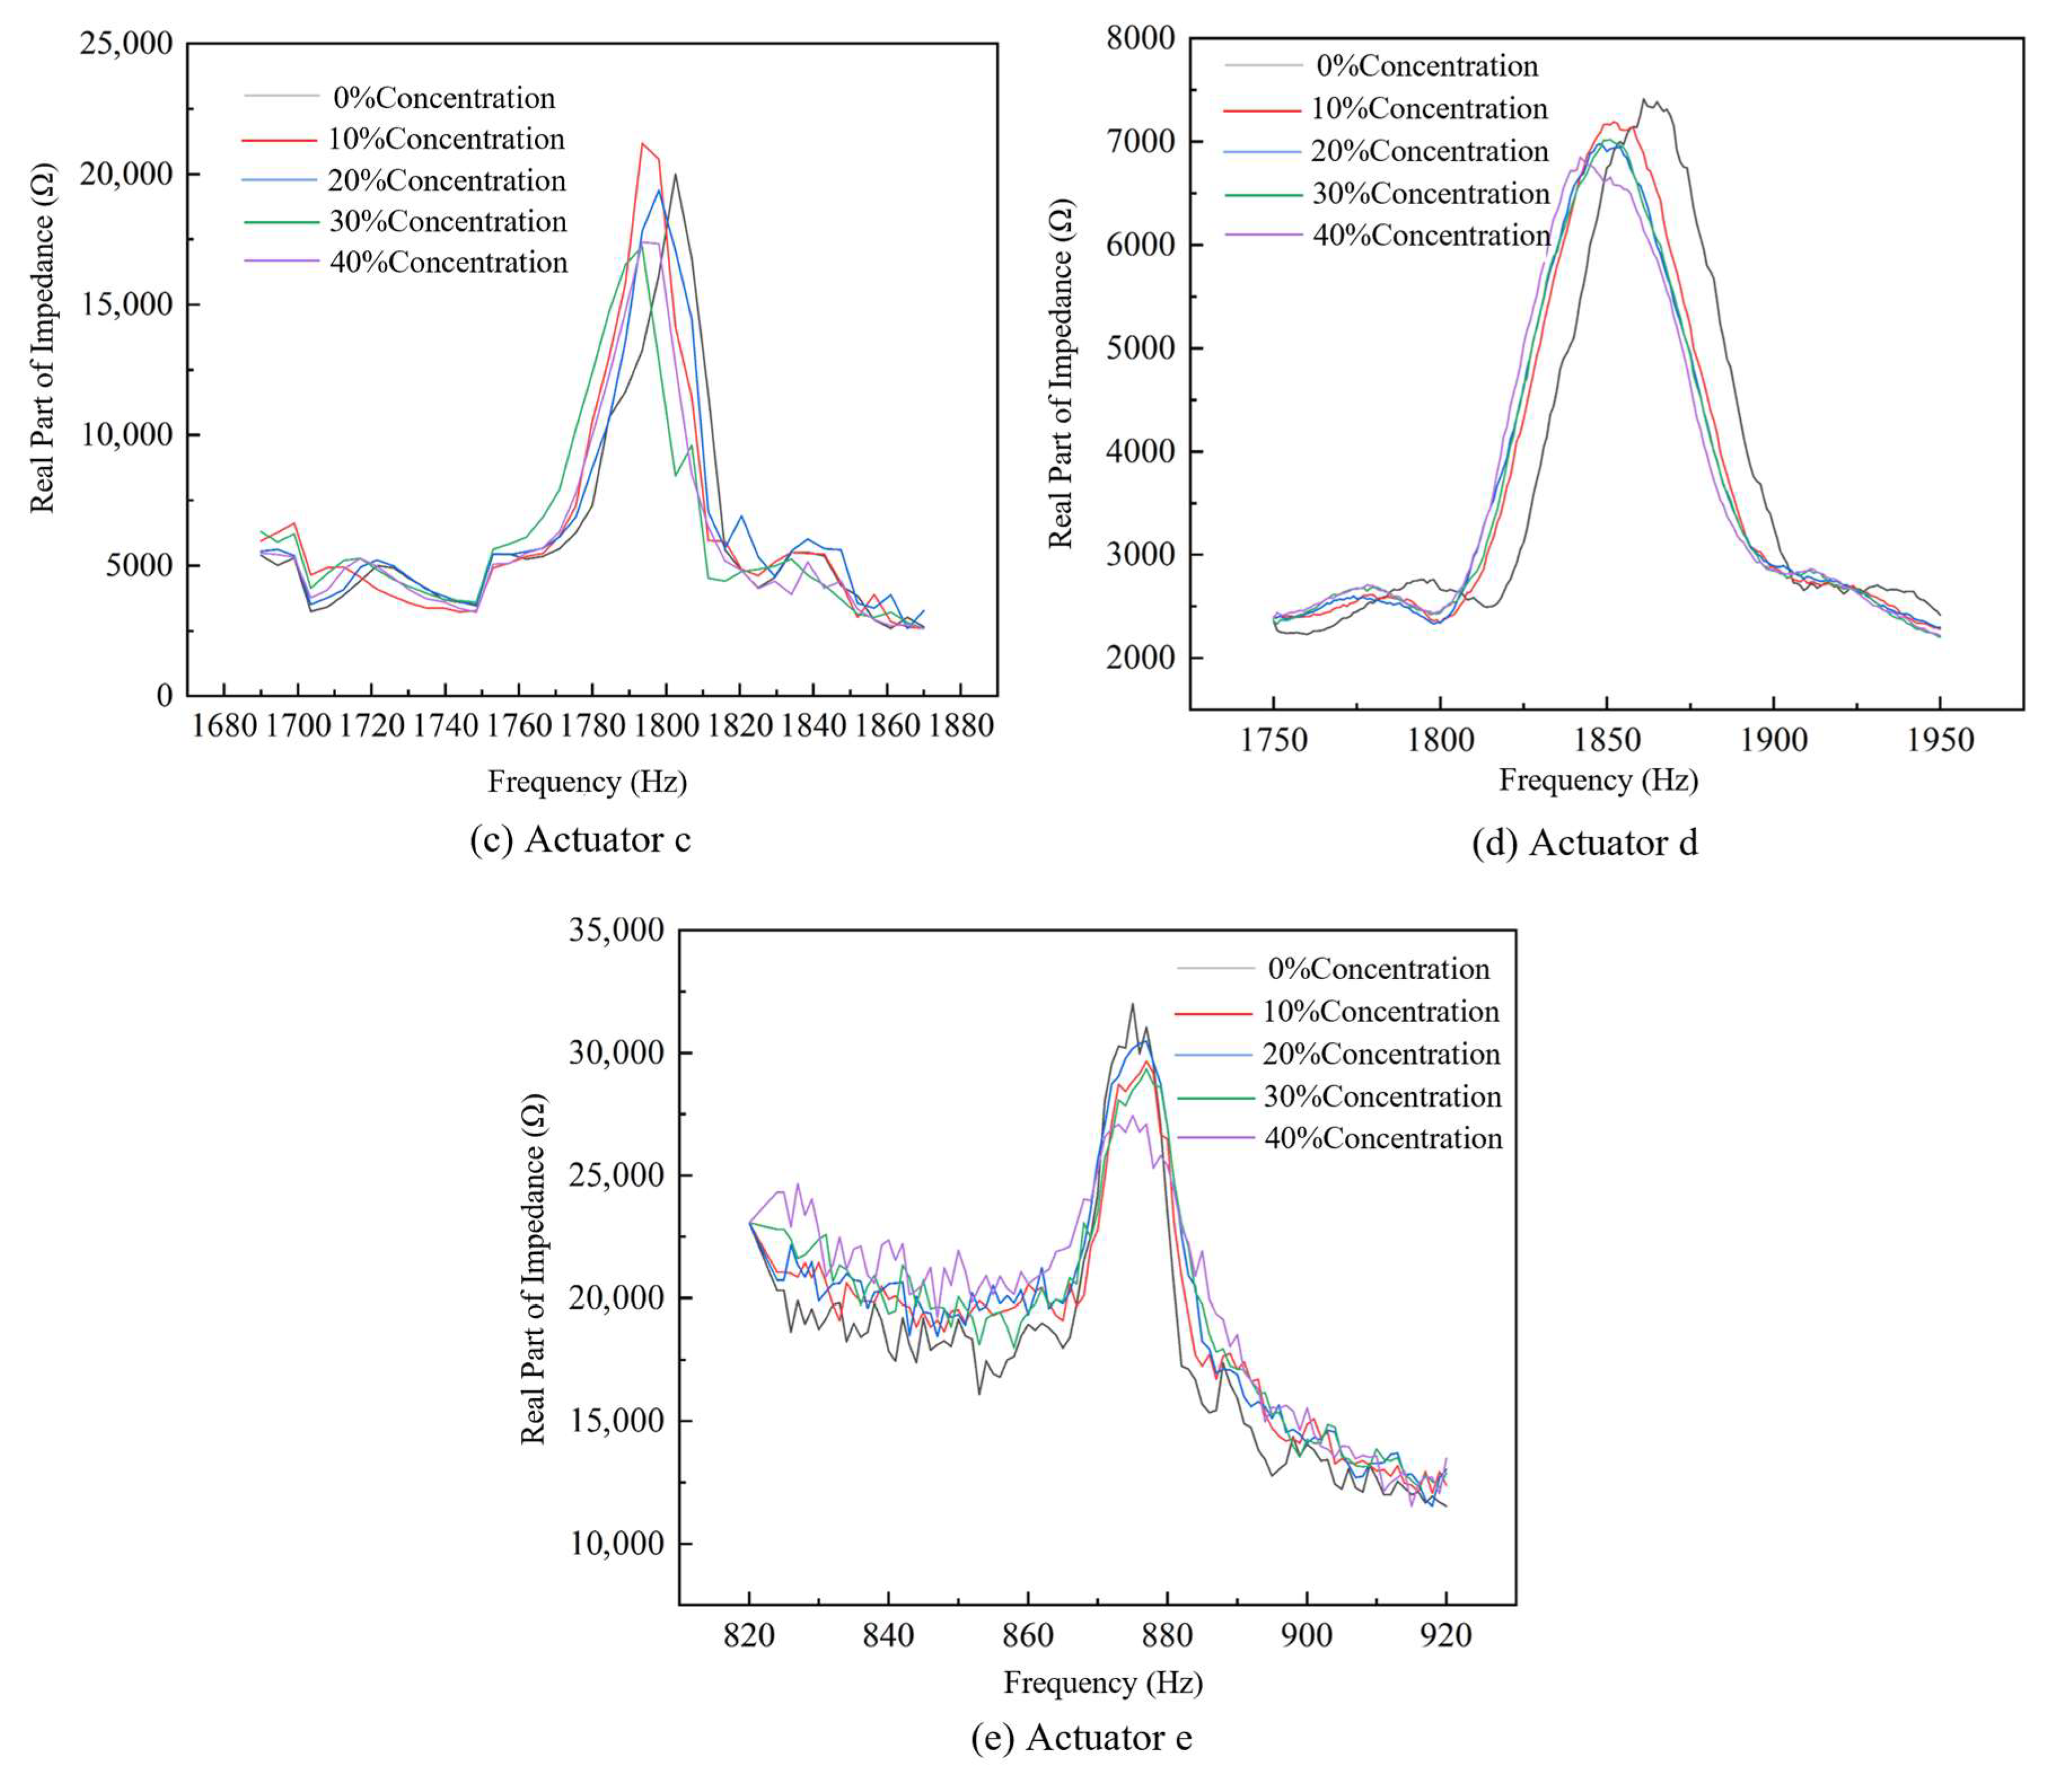
Additional sweeps were performed in the vicinity of each device’s resonance band across multiple concentrations. The resulting real-impedance curves are presented in Figure 16.
As seen in Figure 16, actuator a provides the clearest, most concentration-sensitive feedback: the real-impedance peaks are well-separated between concentrations, and the characteristic (peak) frequency exhibits a noticeable downward shift with increasing concentration. By contrast, actuators b–f show minimal separation of peak amplitudes across concentrations, indicating lower sensitivity and making them less suitable for concentration detection. These results identify actuator a as the preferred device for concentration sensing and corroborate the correctness of the grey relational-based parameter optimization.

4.2. Performance Validation of the IGWO–SVR Detection Algorithm

To evaluate the proposed IGWO–SVR model, real-part impedance measurements were performed across multiple solution concentrations using the optimally designed actuator a identified in the previous subsection. This algorithm was implemented using MATLAB 2024b on a personal computer equipped with an Intel i7-12700 CPU and 16GB of memory. For each prediction cycle, the average computing time was 28 ms, the system sampling frequency was 200 Hertz, and the total response delay from impedance acquisition to concentration output was 82 ms. According to the clinical thrombolysis guidelines of the American Heart Association in 2023 (FDA ultrasound safety in 2022), a real-time thrombus monitoring system should have a response delay of less than 0.1 s (100 ms) and a sound power density of less than 0.5 watts per square centimetre to avoid endothelial damage. The proposed IGWO-SVR detection framework meets these requirements, achieving a delay of 82 ms and a sound intensity of 0.36 watts per square centimetre.
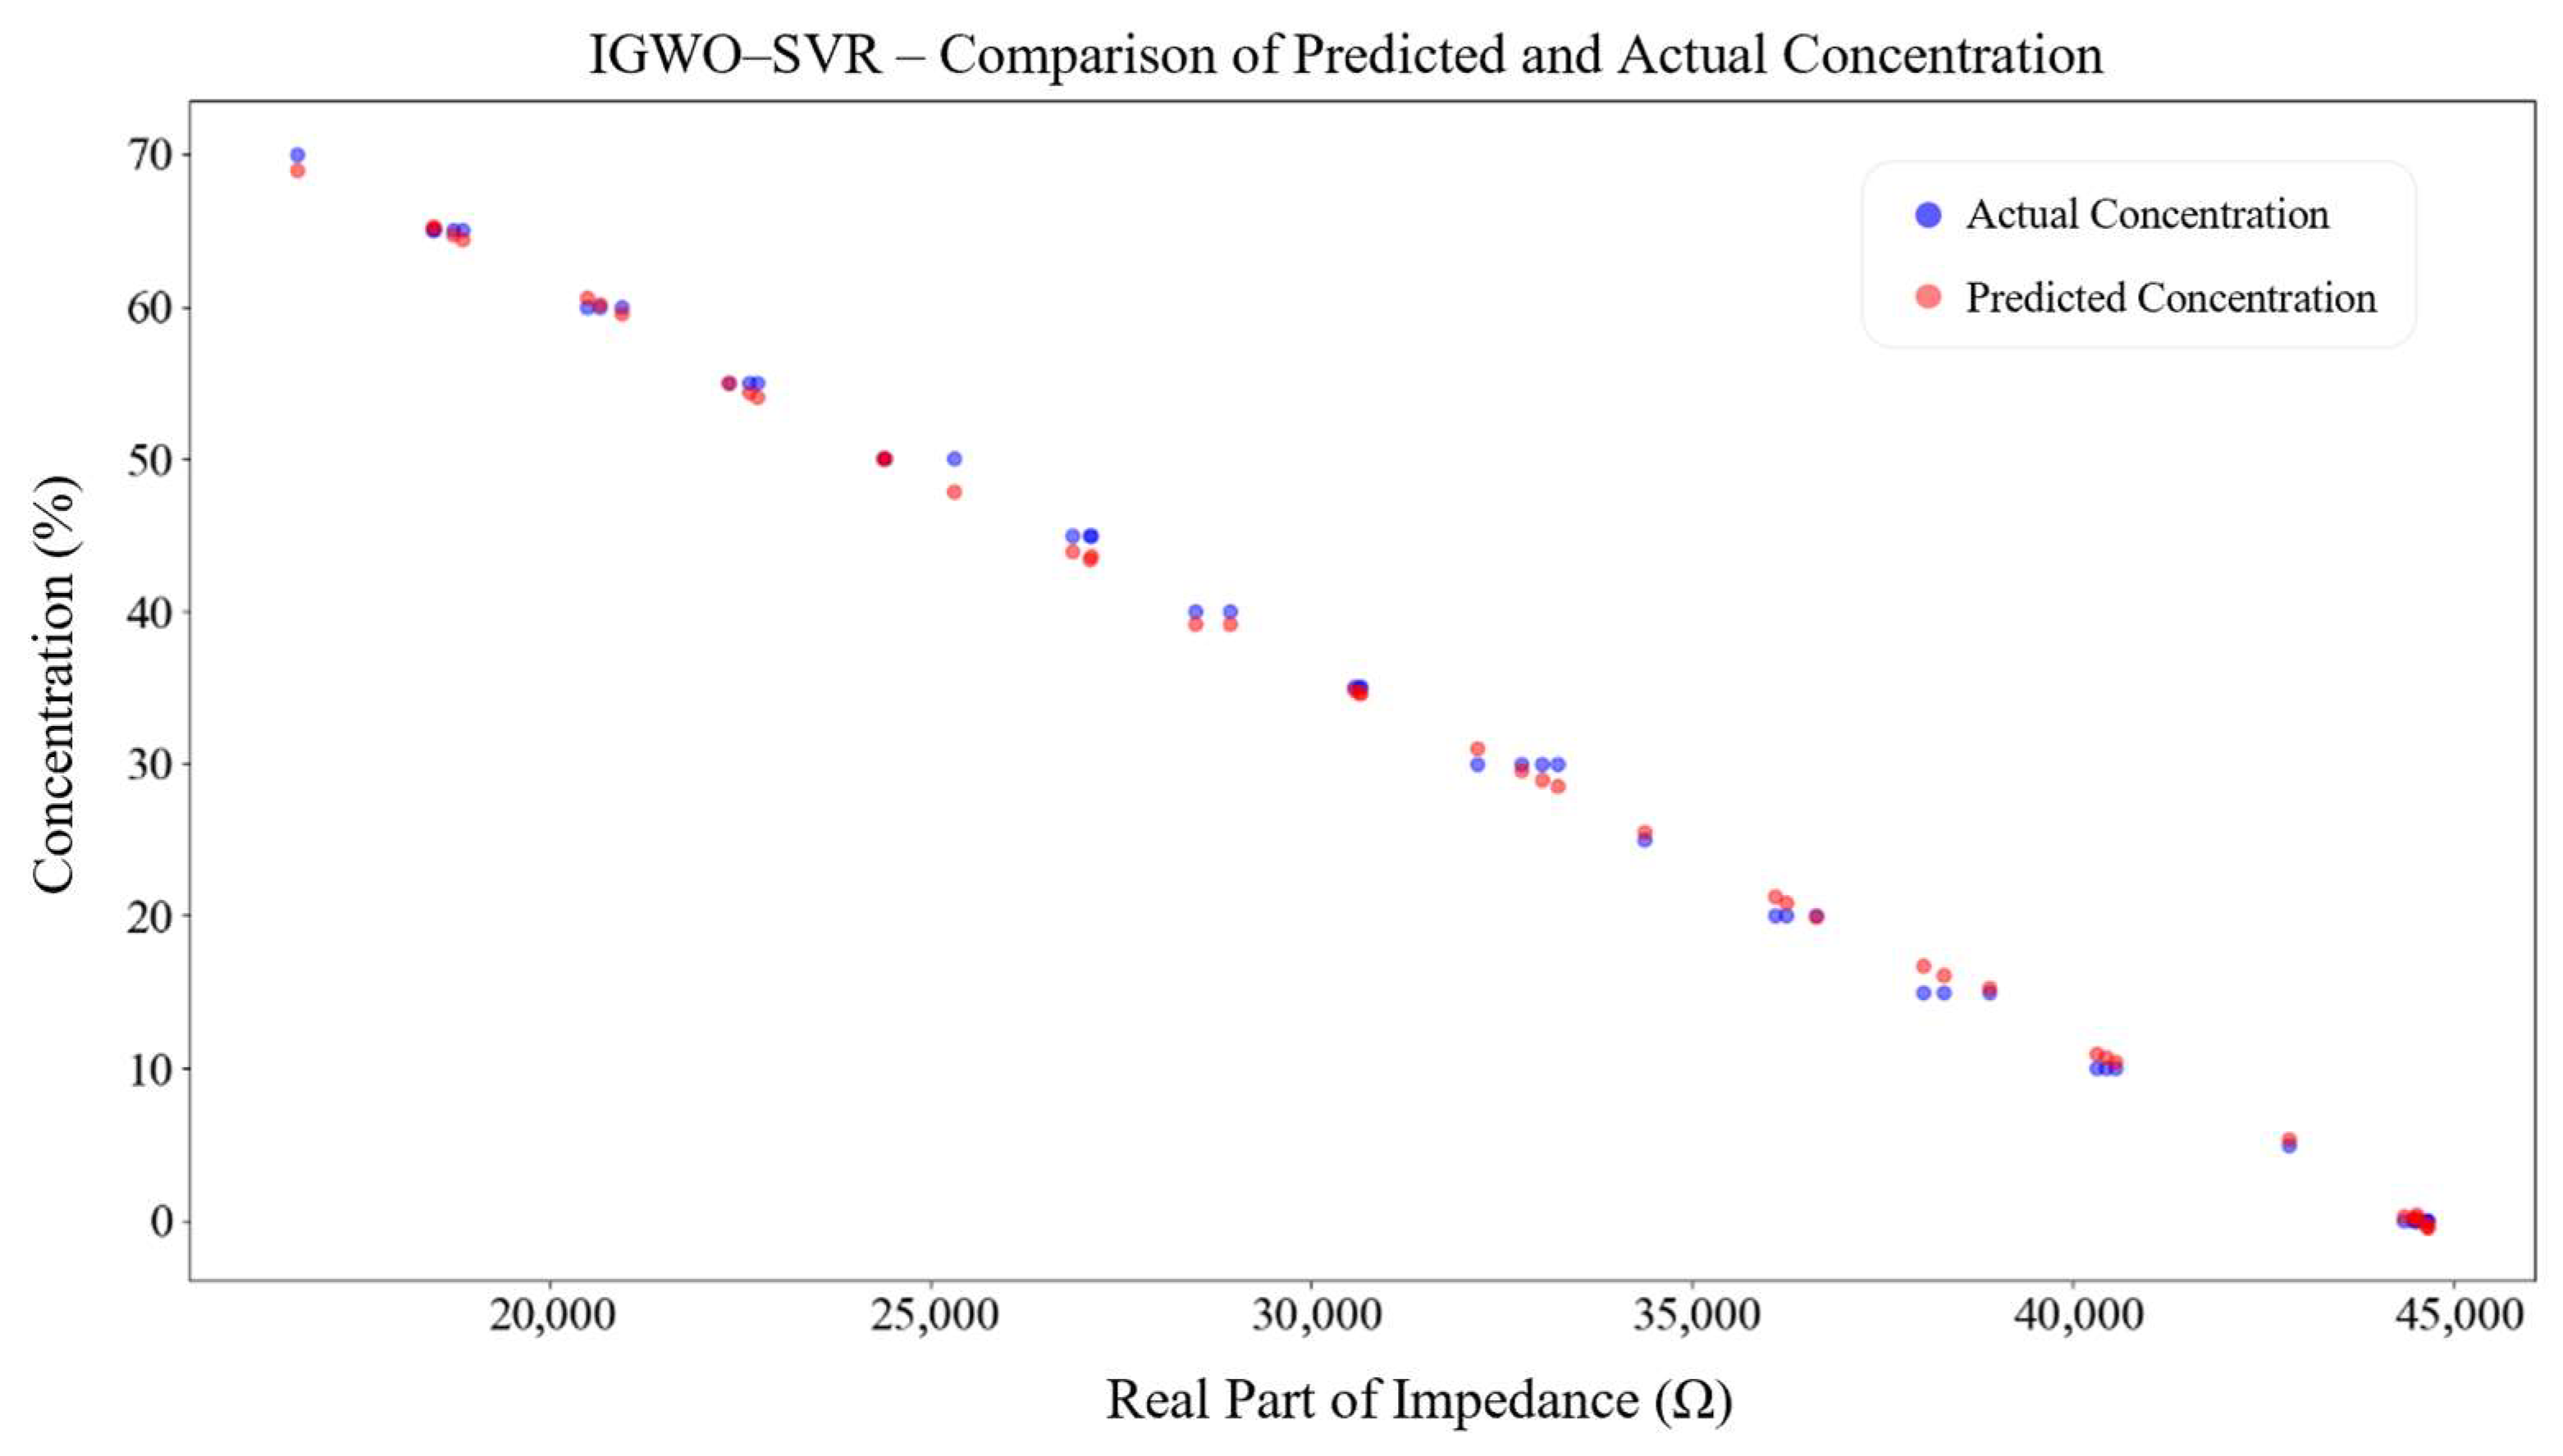
As shown in Figure 17, fifteen glycerol–water solutions were prepared with concentrations from 0% to 70% in 5% increments (15 bottles). Each concentration was measured 15 times, yielding 225 experimental samples. The impedance analyzer recorded the real part of the electrical impedance at the resonance region, and the data were transferred to a computer. To ensure commensurate scaling, impedance and frequency features were standardized via z-score (mean–variance) normalization. The normalized dataset was then used to train and test the IGWO–SVR model: a random 80/20 split was adopted, with 80% of the samples for training and 20% for testing. The detection outcomes are presented in Figure 18.
IGWO improves the global search behaviour and mitigates the tendency of conventional optimizers to fall into local optima, thereby supplying more suitable initial hyperparameters for SVR. As shown in Figure 18, IGWO–SVR maintains high fitting accuracy across all concentration ranges: errors are small in the low-concentration regime, and no evident overfitting is observed at medium-to-high concentrations. Comparative analyses further show that the model exhibits stable and robust performance under varying concentrations. The method accurately captures the nonlinear relationship between solution concentration and actuator impedance feedback and remains resilient under limited samples and noisy measurements—properties that support real-time concentration monitoring in clinical thrombolysis.
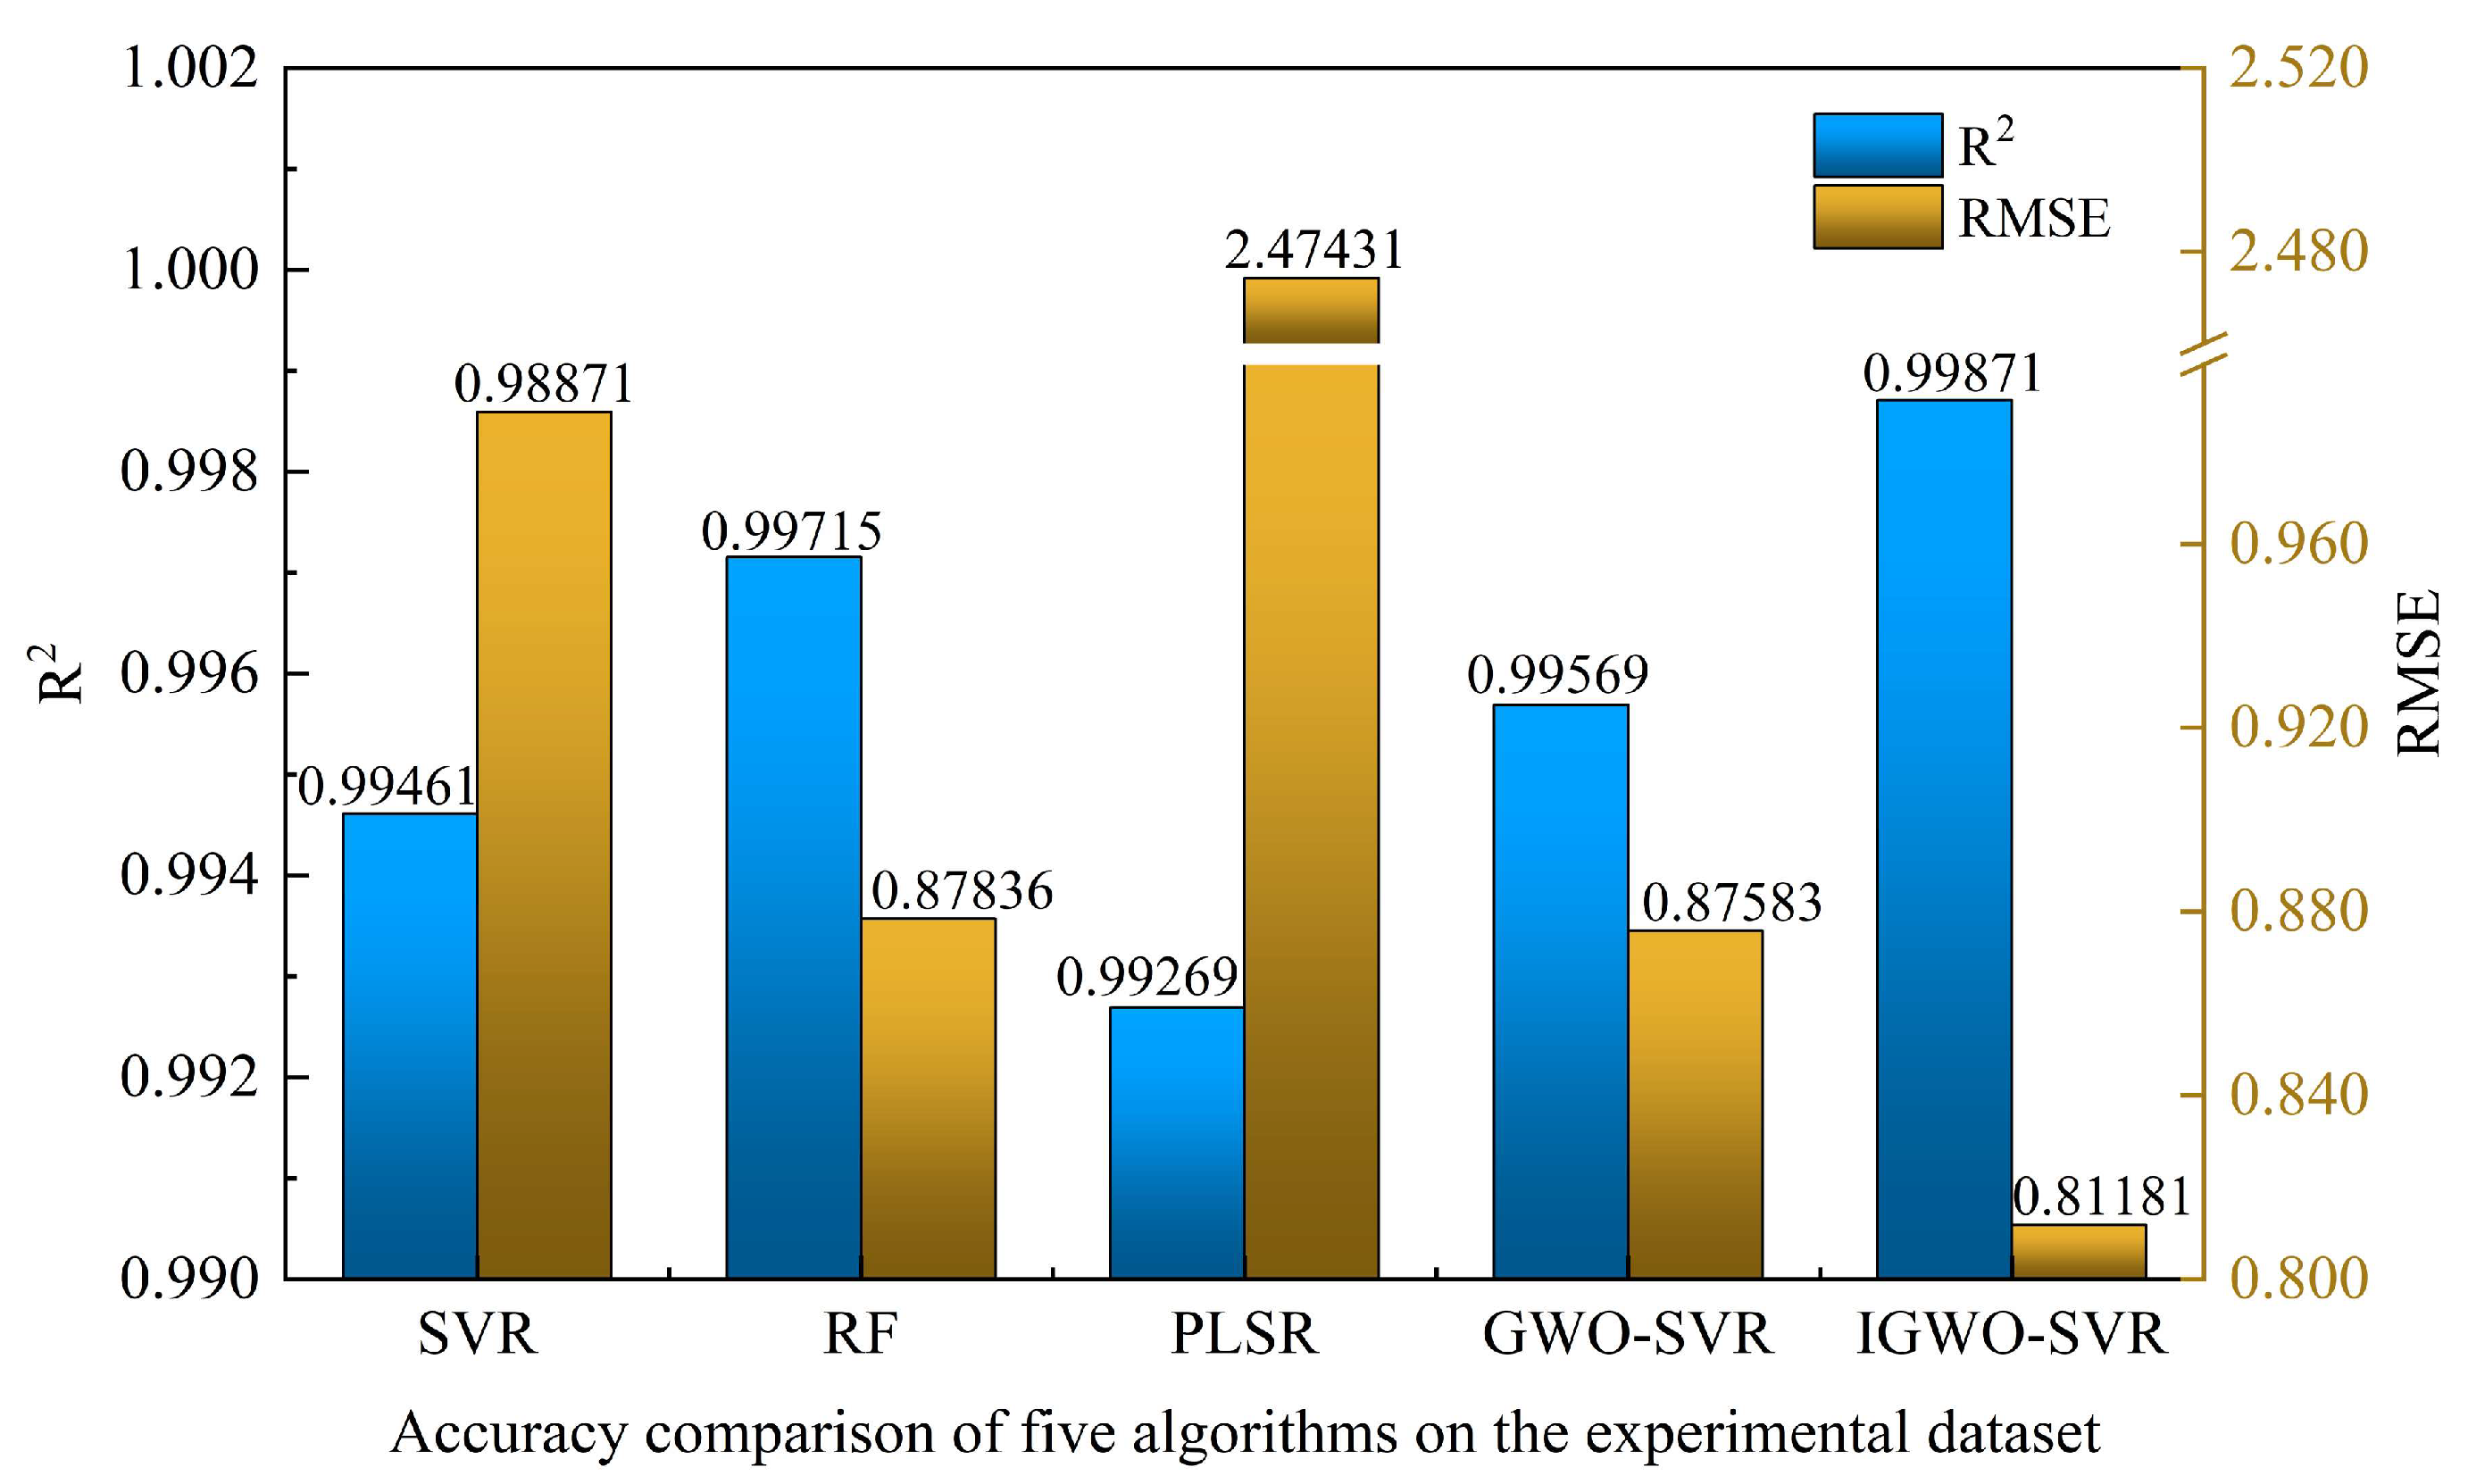
From Figure 19 and Table 15, the IGWO–SVR model achieves a coefficient of determination R2 = 0.99871 and a root-mean-square error RMSE = 0.81181, indicating near-ideal fit and low absolute error. Compared with the simulation-based evaluation, the experimental performance remains consistent; the relative error in R2 is only 0.12815%. Relative to plain SVR, IGWO–SVR yields a 0.41% increase in R2 and a 17.8% reduction in RMSE, corresponding to an overall accuracy gain of approximately 18%. Moreover, by introducing adaptive weight adjustment early in the search, the Improved Grey Wolf Optimizer rapidly approaches the global optimum while sustaining high accuracy in later iterations. Across multiple independent runs, IGWO demonstrates fast convergence and stable outcomes, underscoring its robustness and practical value.

5. Conclusions

(1)
The optimal geometry of the conical actuator is as follows: width 5 mm, thickness 1 mm, length 70 mm, and aperture 2 mm; piezoelectric patch length 8 mm, width 2 mm, and thickness 0.5 mm. The optimized actuator first exhibits a natural frequency of 697.78 Hz, a 42% increase in tip amplitude (2.7322 × 10⁻⁵ mm), and an output energy density of 3.3726 × 10⁻² W/mm3. The coupled acoustic–solid model further verifies strong tip–fluid interaction, with a sound pressure level of 120 dB.
(2)
An IGWO–SVR detection model was proposed. On 1001 simulated samples, the model achieved an R2 of 0.99999, with RMSE values of 0.06213 for training and 0.04183 for testing, outperforming conventional SVR and RF models. Experimental validation on 15 glycerol solutions reported an R2 of 0.99871 and an RMSE of 0.81181, with an average relative error of 0.12815%. The measured real-impedance peak values decreased from 42,587.36 Ω to 19,507.48 Ω. Therefore, the IGWO–SVR algorithm can accurately and in real time track the thrombolysis process, providing reliable technical support for dynamic clinical monitoring and decision-making.
(3)
In future studies, incorporating the viscoelastic variations in blood and thrombus under non-Newtonian flow conditions will enable a more realistic simulation of the mechanical behaviour during thrombus dissolution. In addition, the optimized actuator can be miniaturized through MEMS or laser micromachining technologies while maintaining resonance frequencies suitable for vascular thrombolysis. By integrating impedance sensing with microfluidic channels, real-time monitoring under physiological flow conditions can be achieved. Moreover, the Ti–6Al–4V substrate and parylene-coated PZT ensure excellent biocompatibility and corrosion resistance, enabling safe operation in blood-contact environments.

Author Contributions

Conceptualization, J.Y. and J.L.; methodology, J.Y., Y.S. and J.L.; software, Y.S., Y.J. and B.R.; validation, Y.S., B.R., P.Y. and H.Q.; formal analysis, J.Y., Y.S. and J.L.; investigation, J.Y., Y.S. and G.D.; resources, J.Y., Y.S. and Y.J.; data curation, Y.S. and Y.J.; writing—original draft preparation, J.Y. and Y.S.; writing—review and editing, J.Y. and J.L.; visualization, Y.S. and Y.J.; supervision, J.Y., G.D. and J.L.; project administration, J.Y. and J.L.; funding acquisition, J.Y. All authors have read and agreed to the published version of the manuscript.

Funding

This research was funded by the National Natural Science Foundation of China, grant numbers 82302400 and 51865021.

Data Availability Statement

Data available on request from the authors.

Conflicts of Interest

The authors declare no conflicts of interest.

Abbreviations

The following abbreviations are used in this manuscript:
SVRSupport Vector Machine Regression
GWOGrey Wolf Optimization
IGWOImproved Grey Wolf Optimization
RFRandom Forest
PLSRPartial Least Squares Regression

References

  1. Ferrari, A.J.; Santomauro, D.F.; Aali, A.; Abate, Y.H.; Abbafati, C.; Abbastabar, H.; Abd ElHafeez, S.; Abdelmasseh, M.; Abd-Elsalam, S.; Abdollahi, A.; et al. Global incidence, prevalence, years lived with disability (YLDs), disability-adjusted life-years (DALYs), and healthy life expectancy (HALE) for 371 diseases and injuries in 204 countries and territories and 811 subnational locations, 1990–2021: A systematic analysis for the Global Burden of Disease Study 2021. Lancet 2024, 403, 2133–2161. [Google Scholar]
  2. Naghavi, M.; Ong, K.L.; Aali, A.; Ababneh, H.S.; Abate, Y.H.; Abbafati, C.; Abbasgholizadeh, R.; Abbasian, M.; Abbasi-Kangevari, M.; Abbastabar, H.; et al. Global burden of 288 causes of death and life expectancy decomposition in 204 countries and territories and 811 subnational locations, 1990–2021: A systematic analysis for the Global Burden of Disease Study 2021. Lancet 2024, 403, 2100–2132. [Google Scholar] [CrossRef] [PubMed]
  3. Wang, G.; Fang, B.; Yu, X.; Li, Z. Interpretation of 2018 guidelines for the early management of patients with acute ischemic stroke. Zhong Hua Wei Zhong Bing Ji Jiu Yi Xue 2018, 30, 289–295. [Google Scholar]
  4. Li, G.S.; Zhao, X.Q. Interpretation of “Chinese Guidelines for the Diagnosis and Treatment of Acute Ischemic Stroke 2023”. Chin. J. Stroke 2024, 19, 956–961. [Google Scholar]
  5. Niu, G.Z. Interpretation of the Guidelines for Endovascular Interventional Treatment of Ischemic Cerebrovascular Diseases in Chin. In Proceedings of the 2011 Zhejiang Provincial Neurology Academic Conference, Lishui, China, 27 May 2011. [Google Scholar]
  6. Gupta, N.; Zhao, Y.Y.; Evans, C.E. The stimulation of thrombosis by hypoxia. Thromb. Res. 2019, 181, 77–83. [Google Scholar] [CrossRef]
  7. Roskam, J.; Hugues, J. The mechanism of arterial thrombus formation. Arch. Des Mal. Du Coeur Et Des Vaiss. 1954, 47, 545–556. [Google Scholar]
  8. Park, T.H.; Lee, J.S.; Park, S.; Ko, Y.; Lee, S.J.; Lee, K.B.; Lee, J.; Kang, K.; Park, J.; Choi, J.C.; et al. Safety and efficacy of intravenous recombinant tissue plasminogen activator administered in the 3- to 4.5-hour window in korea. J. Stroke Cerebrovasc. Dis. 2014, 23, 1805–1812. [Google Scholar] [CrossRef]
  9. Dachs, R.J.; Burton, J.H.; Joslin, J. A user’s guide to the NINDS rt-PA stroke trial database. PLoS Med. 2008, 5, 705–708. [Google Scholar] [CrossRef]
  10. Zhao, Q.Q.; Shan, W.Y.; Liu, L.; Fu, X.C.; Liu, P.; Hu, Y.Z. Predictors of functional outcome and hemorrhagic complications in acute ischemic stroke patients treated with intravenous thrombolysis-a retrospective analysis. Int. J. Clin. Pharmacol. Ther. 2017, 55, 893–900. [Google Scholar] [CrossRef]
  11. Liu, L.; Luo, G.Q.; Liu, Q.; Yang, Z.Y. Hemorrhagic risk factors after rt-PA thrombolysis in acute cerebral infarction. Eur. Rev. Med. Pharmacol. Sci. 2023, 27, 5542–5551. [Google Scholar]
  12. Son, S.; Choi, D.S.; Oh, M.K.; Hong, J.; Kim, S.; Kang, H.; Park, K.; Choi, N.; Kwon, O.; Lim, B.H. Comparison of solitaire thrombectomy and penumbra suction thrombectomy in patients with acute ischemic stroke caused by basilar artery occlusion. J. Neurointerventional Surg. 2016, 8, 13–18. [Google Scholar] [CrossRef]
  13. Hori, S.; Furudate, R.; Kumagai, I.; Aoyagi, C.; Hirota, N.; Yamamoto, T. Use of a stent-retriever for treatment of iatrogenic vasospasm secondary to mechanical thrombectomy. Clin. Neurol. Neurosurg. 2024, 236, 108107. [Google Scholar] [CrossRef]
  14. Lopez-Rueda, A.; Vargas, A.; Pinana, C.; Chirife, O.; Werner, M.; Aja, L.; Remollo, S.; Tomasello, Y.A. Angioplasty with a stent retriever to treat vasospasm secondary to subarachnoid hemorrhage due to an aneurysm: A multicenter study of safety and efficacy. Radiologia 2022, 64, 103–109. [Google Scholar] [CrossRef] [PubMed]
  15. Arai, D.; Ishii, A.; Chihara, H.; Ikeda, H.; Miyamoto, S. Histological examination of vascular damage caused by stent retriever thrombectomy devices. J. Neurointerventional Surg. 2016, 8, 992–995. [Google Scholar] [CrossRef]
  16. Dehmer, G.J.; Grines, C.L.; Bakaeen, F.G.; Beasley, D.L.; Beckie, T.M.; Boyd, J.; Cigarroa, J.E.; Das, S.R.; Diekemper, R.L.; Frampton, J.; et al. 2023 AHA/ACC clinical performance and quality measures for coronary. J Am Coll Cardiol 2023, 82, 1131–1174. [Google Scholar] [CrossRef] [PubMed]
  17. Alshekhlee, A.; Pandya, D.J.; English, J.; Zaidat, O.O.; Mueller, N.; Gupta, R.; Nogueira, R.G. Merci mechanical thrombectomy retriever for acute ischemic stroke therapy: Literature review. Neurology 2012, 79, S126–S134. [Google Scholar] [CrossRef]
  18. Jiang, Z.; Morita, M.; Watanabe, T.; Kato, S.; Suzuki, M. Study on in-vivo measurement of solubility for cerebral thrombus dissolution. Int. J. Appl. Electromagn. Mech. 2007, 24, 225–234. [Google Scholar] [CrossRef]
  19. Yang, J.; Rong, B.; Wang, L.; Morita, M.; Deng, G.; Jiang, Y.; Qian, J. Analysis and structure optimization of scissor-type micro-stirrer with the most effective output performance for thrombus dissolution in interventional therapy. Actuators 2023, 12, 60. [Google Scholar] [CrossRef]
  20. Lei, G.; Guo, Y.G.; Zhu, J.G.; Chen, X.M.; Xu, W.; Shao, K.R. Sequential subspace optimization method for electromagnetic devices design with orthogonal design technique. IEEE Trans. Magn. 2012, 48, 479–482. [Google Scholar] [CrossRef]
  21. Chiang, Y.M.; Hsieh, H.H. The use of the taguchi method with grey relational analysis to optimize the thin-film sputtering process with multiple quality characteristic in color filter manufacturing. Comput. Ind. Eng. 2009, 56, 648–661. [Google Scholar] [CrossRef]
  22. Tan, X.H.; Wang, L.G.; Wang, W.S. Multi-objective optimization in manufacturing engineering for slender pen rod injection molding quality based on grey correlation. In Proceedings of the 3rd International Conference on Mechanical Engineering, Industry and Manufacturing Engineering (MEIME 2013), Wuhan, China, 22–23 June 2013. [Google Scholar]
  23. Priyadarshini, M.; Pal, K. Grey-taguchi based optimizationof EDM process for titanium alloy. In Proceedings of the 4th International Conference on Materials Processing and Characterzation (ICMPC), Hyderabad, India, 14–15 March 2015. [Google Scholar]
  24. Ajoudanian, M.; Jiang, Z.; Morita, M.; Asme. Analysis and modeling of vibratable end-effector angle of catheter for thrombus dissolution. In Proceedings of the ASME Conference on Smart Materials Adaptive Structures and Intelligent Systems, Philadelphia, America, 28 September–1 October 2010. [Google Scholar]
  25. Yang, J.; Morita, M.; Jiang, Z. Design of a novel scissoring micro-stirrer for blood clot dissolution. Sens. Actuators A Phys. 2016, 248, 130–137. [Google Scholar] [CrossRef]
  26. Babatunde, H.A.; Collins, J.; Lukman, R.; Saxton, R.; Andersen, T.; Mcdougal, O.M. SVR chemometrics to quantify β-lactoglobulin and α-lactalbumin in milk using MIR. Foods 2024, 13, 166. [Google Scholar] [CrossRef]
  27. Fan, Y.Q.; Tang, X.M.; Hu, J.Y.; Ma, Y.; Yang, J.B.; Liu, F.Q.; Yi, X.F.; Liu, Z.Q.; Song, L.J.; Zheng, A.M.; et al. Synergy of pore size and silanols in an -SVR-type zeolite for efficient dynamic benzene/cyclohexane separation. Nat. Commun. 2024, 15, 7961. [Google Scholar] [CrossRef] [PubMed]
  28. Wu, C.; Fu, X.; Li, H.; Hu, H.; Li, X.; Zhang, L. A method based on improved ant colony algorithm feature selection combined with GWO-SVR model for predicting chlorophyll-a concentration in wuliangsu lake. Water Sci. Technol. A J. Int. Assoc. Water Pollut. Res. 2024, 89, 20–37. [Google Scholar] [CrossRef] [PubMed]
  29. Saraoglu, H.M.; Koçan, M. A study on non-invasive detection of blood glucose concentration from human palm perspiration by using artificial neural networks. Expert Syst. 2010, 27, 156–165. [Google Scholar] [CrossRef]
  30. Yang, Y.J.; Cui, J.H.; Luo, D.; Murray, J.; Chen, X.Y.; Hulck, S.; Tripp, R.A.; Zhao, Y.P. Rapid detection of SARS-CoV-2 variants using an angiotensin-converting enzyme 2-based surface-enhanced raman spectroscopy sensor enhanced by CoVari deep learning algorithms. ACS Sens. 2024, 9, 3158–3169. [Google Scholar] [CrossRef]
  31. Rao, Z.K.; Guo, B.Y.; Zu, J.X.; Zheng, W.Q.; Xu, Y.; Yang, Y.T. Construction of an ECL-DPV dual model biosensor for dopamine detection based on PSO-ANN algorithm. IEEE Sens. J. 2024, 24, 7463–7472. [Google Scholar] [CrossRef]
  32. Zhao, S.G.; Jiao, T.H.; Adade, S.; Wang, Z.; Wu, X.X.; Li, H.H.; Chen, Q.S. Based on vis-NIR combined with ANN for on-line detection of bacterial concentration during kombucha fermentation. Food Biosci. 2024, 60, 104346. [Google Scholar] [CrossRef]
  33. Zhang, B.; Ren, H.H.; Huang, G.Y.; Cheng, Y.Q.; Hu, C.Z. Predicting blood pressure from physiological index data using the SVR algorithm. BMC Bioinform. 2019, 20, 109. [Google Scholar] [CrossRef]
  34. Zhou, W.; Yan, Z.X.; Zhang, L.T. A comparative study of 11 non-linear regression models highlighting autoencoder, DBN, and SVR, enhanced by SHAP importance analysis in soybean branching prediction. Sci. Rep. 2024, 14, 5905. [Google Scholar] [CrossRef]
  35. Wu, R.; Liu, D.; Zheng, J.; Tong, J.; Ye, X. Optimization on main steam pressure of a steam turbine under low loads based on IGWO-SVM. J. Chin. Soc. Power Eng. 2024, 44, 1042–1050. [Google Scholar]
  36. Pao, Y.; Wu, Y.; He, Y.; Ge, X. A new AHP integrated with orthogonal design. Syst. Eng.-Theory Pract. 2005, 25, 123–127. [Google Scholar]
  37. Zhou, X.; Li, W.; Chen, G.; Huang, R. A method of nearly orthogonal experimental design. J. Air Force Eng. University. Nat. Sci. Ed. 2010, 11, 84–88. [Google Scholar]
  38. Li, G.; Fu, Q.; Sun, Y.; Feng, Y. Grey relational analysis model based on weighted entropy and its application. J. Water Resour. Water Eng. 2006, 17, 15–18. [Google Scholar]
  39. Mirjalili, S.; Mirjalili, S.; Lewis, A. Grey wolf optimizer. Adv. Eng. Softw. 2014, 69, 46–61. [Google Scholar] [CrossRef]
  40. Wang, S.L.; Fan, R.H.; Chen, X.Y.; Chen, H. Differential evolution with grey wolf adapting optimizer for multi-pid control optimizer. In Proceedings of the 2023 35th Chinese Control and Decision Conference (CCDC), Yichang, China, 20–22 May 2023. [Google Scholar]
  41. Webb, L. Mimicking blood rheology for more accurate modeling in benchtop research. Pegasus Rev. UCF Undergrad. Res. J. 2020, 12, 6. [Google Scholar]
  42. Sadek, S.H.; Rubio, M.; Lima, R.; Vega, E.J. Blood particulate analogue fluids: A review. Materials 2021, 14, 2451. [Google Scholar] [CrossRef]
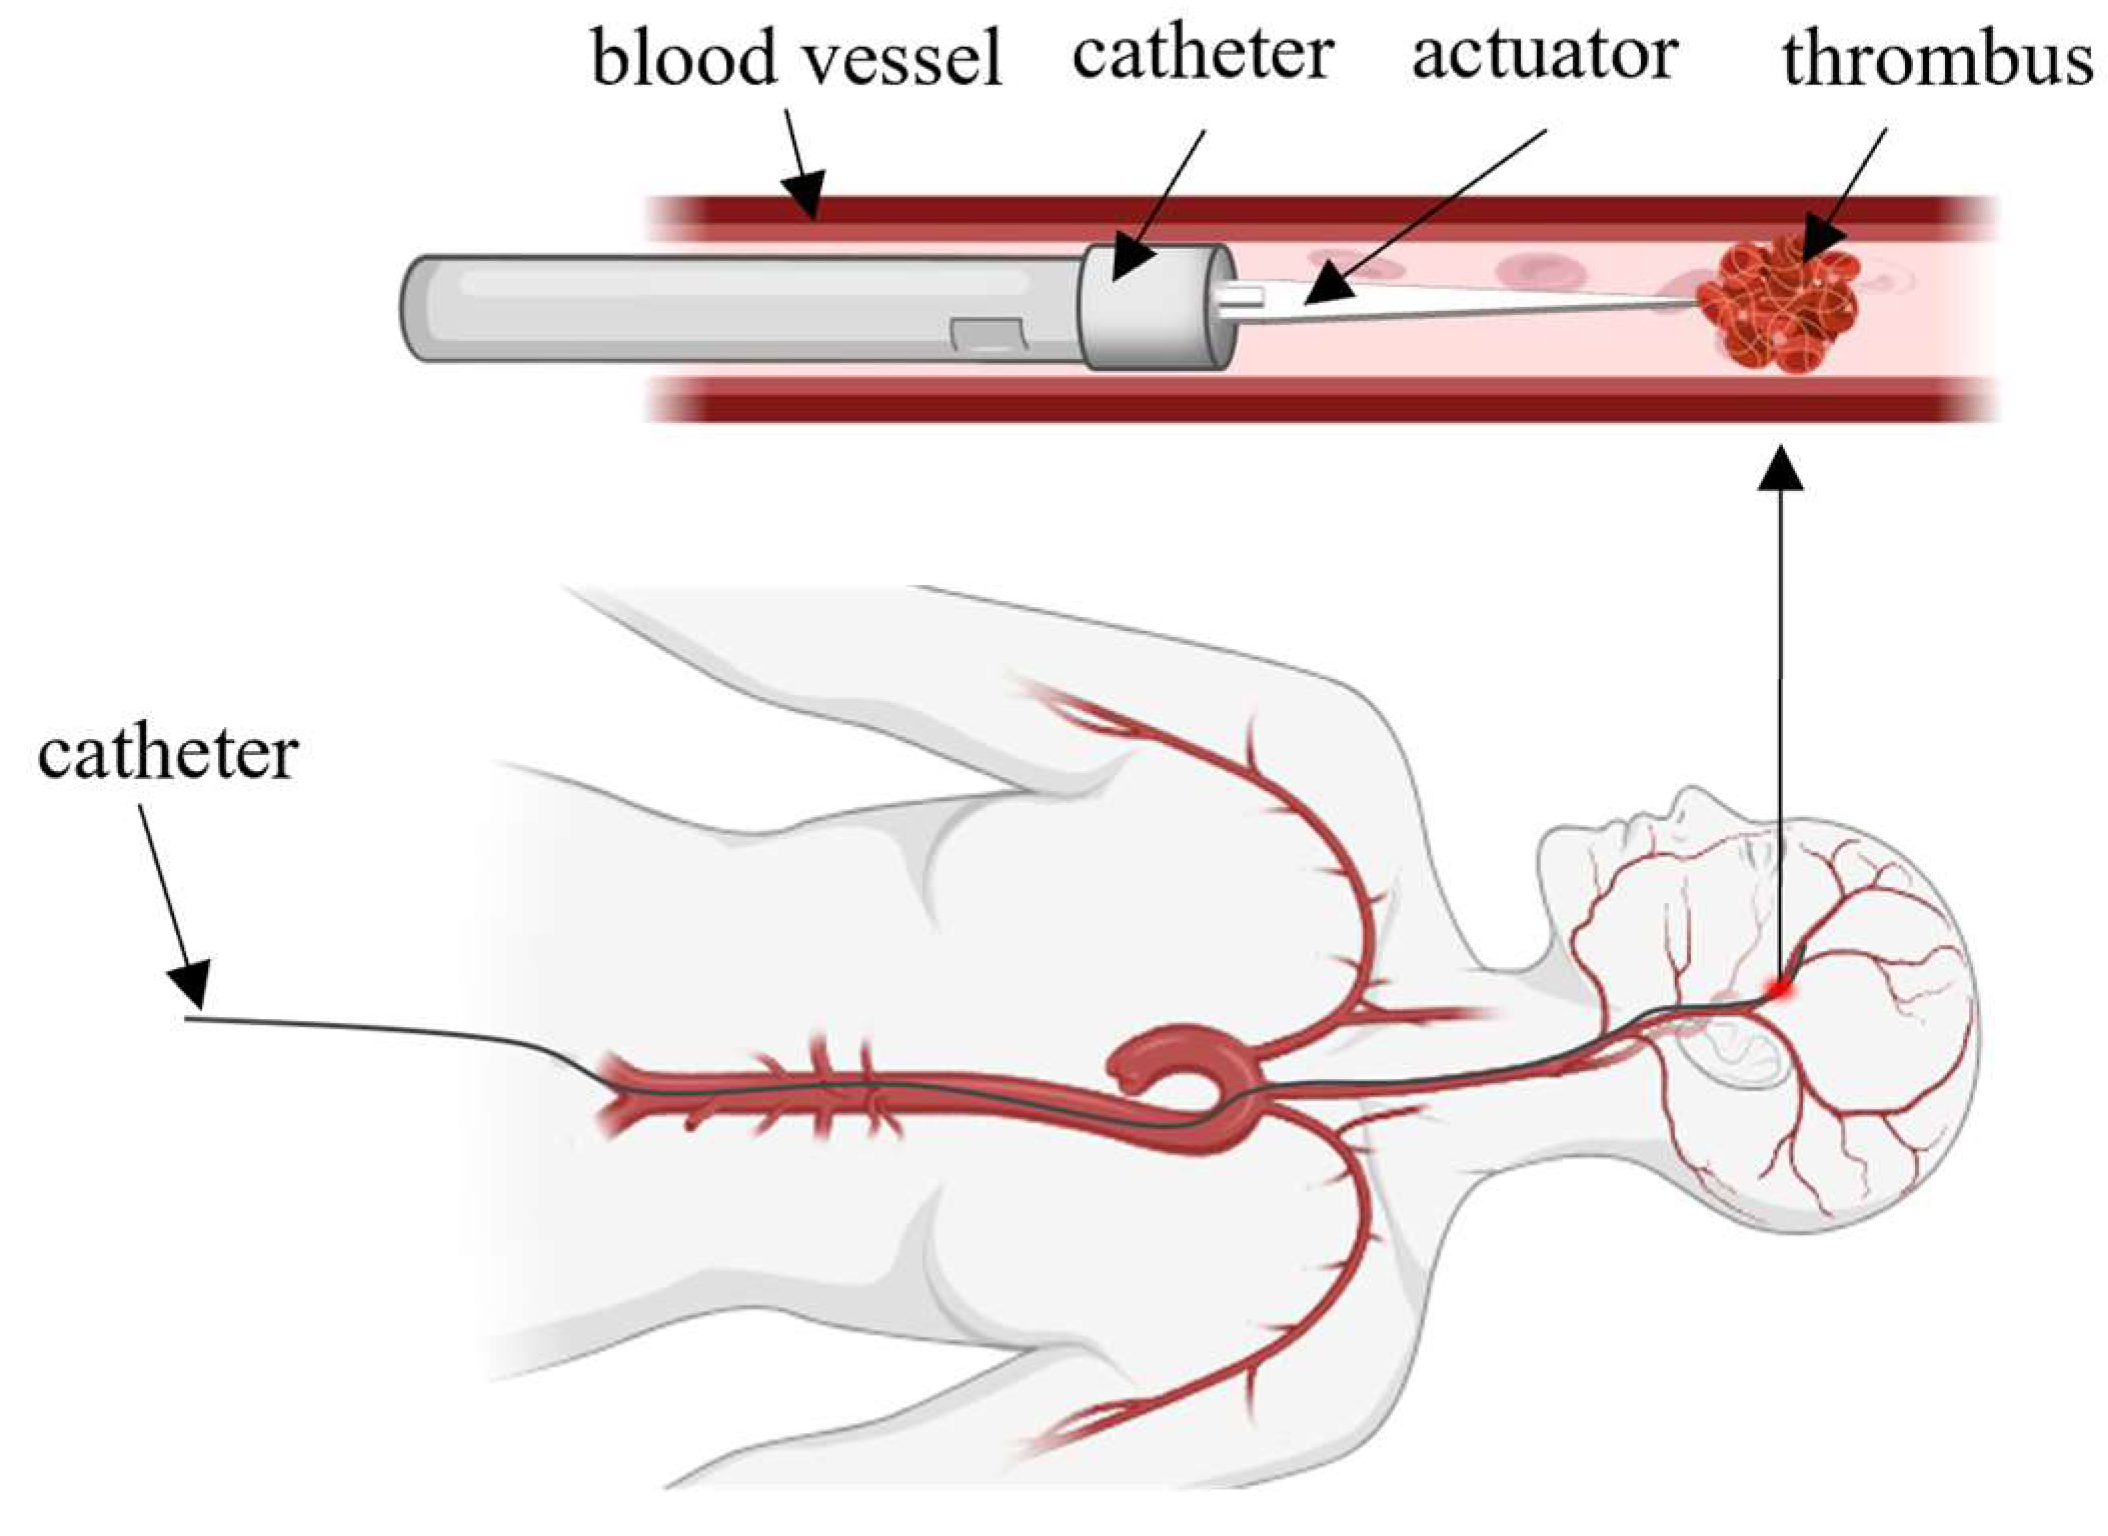
Figure 1. Schematic diagram of the operation of the fragmented thrombolytic actuator.
Actuators 14 00549 g001
Figure 2. Schematic of the actuator structure.
Actuators 14 00549 g002
Figure 3. Mesh model of the actuator.
Actuators 14 00549 g003
Figure 4. First three mode shapes of the piezoelectric actuator.
Actuators 14 00549 g004
Figure 5. Flowchart of the grey relational analysis procedure.
Actuators 14 00549 g005
Figure 6. Trends of mean grey relational grades across factor levels.
Actuators 14 00549 g006aActuators 14 00549 g006b
Figure 7. Convergence curves of different swarm intelligence algorithms on the benchmark functions.
Actuators 14 00549 g007
Figure 8. Flowchart of the IGWO-SVR model.
Actuators 14 00549 g008
Figure 9. Schematic diagram of bidirectional acoustic–solid coupling of the actuator.
Actuators 14 00549 g009
Figure 10. Simulation analysis of actuator sound pressure and sound pressure level.
Actuators 14 00549 g010
Figure 11. Real impedance of the actuator at different concentrations.
Actuators 14 00549 g011
Figure 12. Prediction results of the five detection models.
Actuators 14 00549 g012aActuators 14 00549 g012b
Figure 13. Experimental platform for thrombolytic solution concentration detection.
Actuators 14 00549 g013
Figure 14. Piezoelectric actuator prototypes (a–e: conical-tip; f: cantilever-type).
Actuators 14 00549 g014
Figure 15. Frequency–sweep responses (real impedance) of the six actuators at 10% concentration.
Actuators 14 00549 g015aActuators 14 00549 g015b
Figure 16. Real-impedance feedback of the six actuators across different solution concentrations.
Actuators 14 00549 g016aActuators 14 00549 g016b
Figure 17. Glycerol–water solution samples.
Actuators 14 00549 g017
Figure 18. IGWO–SVR detection results for thrombolysis effectiveness.
Actuators 14 00549 g018
Figure 19. Accuracy comparison of five algorithms on the experimental dataset.
Actuators 14 00549 g019
Table 1. Material properties of medical-grade 304 stainless steel and the piezoelectric patch.
MaterialsDensity
(×103 kg/m3)
Young’s Modulus (MPa)Poisson’s RatioElastic Coefficient
(×1010 Pa)
Piezoelectric Stress Coefficient (C/m2)Relative Dielectric Constant
304
stainless steel
7.93194,0200.3///
PZT-5H7.5// c E 11 = 12.72 e 15 = 17.03 ε 11 = 1704.4
c E 12 = 8.02
c E 13 = 8.47 e 31 = - 6.62 ε 22 = 1704.4
c E 33 = 11.74
c E 44 = 2.30 e 33 = 23.24 ε 33 = 1704.4
Table 2. Natural frequencies of the first three modes.
ModeFrequency (Hz)Amplitude (mm)
1st699.81.8 × 10−5
2nd1698.91.5 × 10−5
3rd2085.12.5 × 10−6
Table 3. Factors and levels for the actuator’s orthogonal experiment.
FactorActuator Width
w a /mm
Actuator Thickness
t a /mm
Actuator Length
l a /mm
Aperture Size
h a /mm
Ceramic Length
l p /mm
Ceramic Width
w p /mm
Ceramic Thickness
t p /mm
Level
15.000.5060061.500.10
26.500.7565171.750.30
38.001.0070282.000.50
Table 4. Experimental results for tip amplitude and output energy of the conical piezoelectric actuator.
Sequence w a /mm t a /mm l a /mm h a /mm l p /mm w p /mm t p /mm z a /mm μ a /W·mm3
150.560061.50.12.4 × 10−57.3 × 10⁻⁵
250.7565171.750.38.4 × 10−53.8 × 10⁻³
351702820.52.7 × 10−53.3 × 10⁻²
46.50.5601720.51.5 × 10−48.3 × 10⁻⁴
56.50.7565281.50.19.8 × 10−67.5 × 10⁻⁵
66.5170061.750.31.6 × 10−41.5 × 10⁻³
780.565081.750.51.1 × 10−51.6 × 10⁻⁴
880.75701620.15.3 × 10−51.9 × 10⁻⁵
98160271.50.34.2 × 10−47.8 × 10⁻⁴
1050.570271.750.14.3 × 10−50.5 × 10⁻⁴
1150.75600820.32.5 × 10−49.4 × 10⁻³
125165161.50.55.2 × 10−52.0 × 10⁻²
136.50.5652620.38.4 × 10−71.5 × 10⁻⁴
146.50.7570071.50.59.0 × 10−51.2 × 10⁻³
156.5160181.750.11.9 × 10−45.2 × 10⁻⁴
1680.570181.50.33.7 × 10−52.9 × 10⁻⁵
1780.7560261.750.54.6 × 10−47.2 × 10⁻⁴
1881650720.15.7 × 10−51.2 × 10⁻⁴
Table 5. S/N values under different structural parameter combinations.
Sequence S / N za S / N μ a
16.246.03
26.786.51
36.279.54
47.356.12
56.116.03
67.436.21
76.116.04
86.506.02
99.346.12
106.416.02
118.147.16
126.498.29
136.026.04
146.836.17
157.646.09
166.366.02
179.546.11
186.546.03
Table 6. Results of the improved entropy–weight calculations.
Evaluation IndicatorComentropyEntropy Weight
Tip Displacement Amplitude0.97610.5003
Tip Output Energy0.97940.4997
Table 7. Results of the grey relational analysis.
Test NumberTip Lateral DisplacementTip Output EnergyGrey Relational GradeRank
x i S / N i ξ i x i S / N i ξ i α
12.05146.2410.34522.00166.02750.33360.339415
22.18216.77750.37942.11496.50580.36100.37029
32.05776.26760.34673.00009.54241.00000.67341
42.32977.3460.42722.02416.12460.33880.3838
52.01976.10570.33782.00176.0280.33370.335817
62.35237.42990.43572.04316.20580.34320.38937
72.02176.11430.338220,04360,3930.33430.336216
82.11386.50130.36072.00006.02060.33330.347012
92.93229 34390.88062.02286.11910.33850.60963
102.09256.41330.35522.0016.02490.33360.344413
112.55228.13830.52752.279571,5680.40970.46844
122.11086.48890.35992.59858.29450.55460.45715
132.00006.02060.33332.00376.03670.33420.333718
142.19466.82710.3832.03466.16960.34120.362110
152.40937.63780.45842.0156.08550.33670.39766
162.07986.36040.35212.00036.02190.33340.342814
173.00009.54241.00002.02076.11000.33800.66912
182.12306.53900.36312.00296.03310.33400.348411
Table 8. Mean–range analysis of grey relational grades.
Item w a t a l a h a l p w p t p
ξ 1 0.44210.34660.47780.37400.42260.40780.3521
ξ 2 0.36690.42540.36360.38290.40290.41780.4190
ξ 3 0.44220.47920.40980.49430.42570.42560.4802
Range0.07530.13260.11420.12030.02280.01780.1281
Table 9. Benchmark test functions.
FunctionFunction ExpressionDimensionHunting ZoneLeast Value
f1 f ( x ) = i = 1 n x i 2 30[−100,100]0
f2 f ( x ) = i = 1 n x i + i = 1 n | x i | 30[−10,10]0
f3 f ( x ) = i = 1 n ( j = 1 i x j ) 2 30[−100,100]0
f4 f ( x ) = max i x i , 1 i n 30[−100,100]0
f5 f ( x ) = i = 1 n [ x i 2 10 cos ( 2 π x i ) + 10 ] 30[−5.12,5.12]0
f6 f ( x ) = 1 4000 i = 1 n x i 2 i = 1 n cos ( x i i ) + 1 30[−50,50]0
Table 10. Reports the comparative outcomes of different swarm intelligence algorithms on the benchmark functions.
Statistical MagnitudeAlgorithm f 1 f 2 f 3 f 4 f 5 f 6
Average valueGA1.61 × 1023.52 × 101.11 × 1043.30 × 105.27 × 1021.48
PSO3.29 × 10−54.82 × 10−26.88 × 101.156.39 × 101.98 × 10−2
GWO2.02 × 10−271.40 × 10−152.55 × 10−47.12 × 10−77.362.63 × 10−3
HPA01.14 × 10−2225.91 × 1045.19 × 102.18 × 1046.15
IGWO01.06 × 10−25102.25 × 10−24300
Standard deviationGA5.46 × 107.792.73 × 1035.651.10 × 1021.24 × 10−1
PSO5.37 × 10−54.79 × 1023.21 × 102.70 × 10−11.90 × 102.13 × 10−2
GWO3.25 × 10−271.29 × 10−151.12 × 10−37.50 × 10−74.526.99 × 10−3
HPA005.74 × 1044.783.55 × 1031.10
IGWO000000
Table 11. Parameters for boundary conditions setting in the bidirectional sound–Earth structure coupling finite element model.
RegionBoundary NamePhysical TypeBoundary Condition ExpressionPhysical Significance
Bottom of actuatorFixed constraintStructural mechanicsu = v = w = 0Simulated fixed support
Piezoelectric crystal surfaceElectrode excitationElectric field V p = V 0 sin ( 2 π f t ) Drive voltage excitation
Contact surface between actuator and liquidSound–solid couplingCoupling P   continuous ,   v n continuousPressure and velocity matching
Upper surface of liquidFree surfaceSound fieldP = 0Simulated liquid surface
Side wall/bottom of liquidRigid boundarySound field ə p ə n = 0 Simulated container wall
Outer boundary of liquidAbsorbing boundarySound field ə p ə n = j k p Avoid sound reflection
Table 12. Excerpt of the FE-simulated dataset (solution of concentration–resonance frequency–real-impedance).
Concentration of Thrombolytic Solution (%)Response Frequency (Hz) Real   Part   of   Impedance   ( Ω )
069842,587.3641
2269642,541.8617
5069442,496.3593
7069242,450.8569
10068919,507.4789
Table 13. Accuracy of the five detection models.
Detection AlgorithmTraining SetTesting Set
R2RMSER2RMSE
SVR0.999890.298710.999890.29709
RF0.999990.078360.999990.06083
PLSR0.992692.474310.993622.29031
GWO-SVR0.999970.075830.999980.18759
IGWO-SVR0.999990.062130.999990.04183
Table 14. Structural parameters of the actuator prototypes.
ActuatorActuator Body StructurePiezoelectric Ceramic Structure
Width (mm)Thickness (mm)Length (mm)Aperture Size (mm)Length (mm)Width (mm)Thickness (mm)
Actuator a51702820.5
Actuator b80.7560261.750.5
Actuator c8160271.50.3
Actuator d50.75600820.3
Actuator e5165161.50.5
Actuator f51702820.5
Table 15. The average error and standard deviation of 15 experiments for five algorithms.
AlgorithmMean Error (%)Standard Deviation (%)Min–Max Error (%)
SVR1.450.121.21–1.67
RF1.180.100.95–1.33
PLSR0.980.080.82–1.15
GWO-SVR0.870.060.74–0.96
IGWO-SVR0.720.040.68–0.80
Disclaimer/Publisher’s Note: The statements, opinions and data contained in all publications are solely those of the individual author(s) and contributor(s) and not of MDPI and/or the editor(s). MDPI and/or the editor(s) disclaim responsibility for any injury to people or property resulting from any ideas, methods, instructions or products referred to in the content.