Abstract
Low-gravity and microgravity simulation devices for training astronauts to manipulate objects under terrestrial conditions are critical for improving operational performance and efficiency in extraterrestrial environments while minimizing risk. To this end, a rigid-suspension-type astronaut operational training system (RSAOTS) was developed, which can precisely simulate the motion characteristics of target objects in low/microgravity environments. In the RSAOTS, to realize rapid and extensive inertial motion of the target object along non-gravity axes, we designed a non-gravity axes tracking system (NGATS). The NGATS adopts an X-Y-X Cartesian robot configuration and is driven by timing belt linear modules. The composite compliance control strategy of NGATS comprises two loops: the inner loop uses active disturbance rejection control to precisely control motion, whereas the outer loop integrates human–robot interaction admittance control with constraint disturbance force control. This control strategy effectively minimizes the constraint disturbance force exerted by the NGATS on the target object, retaining only its inertial characteristics along the non-gravity axes. The feasibility of the NGATS configuration and composite control strategy was validated through microgravity environment simulation experiments conducted along the non-gravity axes. Experimental results show that for target objects with a mass of 37.5 kg, the NGATS adopts the proposed control strategy, the root mean squared errors of the constraint disturbance force are 0.1828 N in the X-axis and 0.3321 N in the Y-axis.
1. Introduction
With the continuous advancements in science and technology, the human exploration of outer space has expanded. Currently, both the International Space Station and the Chinese Space Station have achieved long-term human presence [1,2,3]. Moreover, astronauts have conducted numerous experiments and maintenance tasks aboard space stations [3]. In the near future, humans are expected to return to the Moon. China and the United States have established schedules for lunar missions [4,5]. As task complexity continues to increase, extravehicular activities such as exploration and maintenance have become more complex and diverse [6]. Because of the differences in the gravitational environment of extra-terrestrial operations and terrestrial conditions, the motion of objects under the same operating force is not the same. When astronauts perform tasks such as moving objects or using tools during maintenance operations in extraterrestrial environments, improper operations may lead to equipment damage, and in severe cases, could endanger lives [7,8]. Therefore, to enable astronauts to better adapt to the target operational environment and perform their assigned tasks more safely, a ground-based experimental facility that can accurately simulate the extraterrestrial low-gravity environment must be established for low-gravity simulation training.
Current astronaut training based on low-gravity or microgravity simulation systems primarily focuses on two categories of objectives [9,10]: one trains the posture and movement of astronauts, whereas the other is dedicated to astronaut operational training. Among these, the posture and movement training of astronauts using simulated low-gravity equipment for extravehicular activities on a space station or surface operations in a planetary environment is essentially adaptability training for low-gravity environments. Astronaut operational training, by contrast, refers to the use of simulated low-gravity devices to replicate the force and motion characteristics of target objects in a low-gravity environment, enabling astronauts to learn how to manipulate an object with a large mass under such conditions and prevent safety incidents resulting from improper operation.
Currently, the main low-gravity simulation methods used for astronaut posture and movement training are the parabolic flight method [11,12], neutral buoyancy pool method [13,14,15,16], and multi-rope suspension methods [17,18]. These methods are primarily used for astronaut posture and movement training because of their unique characteristics. By contrast, air levitation/magnetic levitation and suspension methods have the advantages of lower reuse costs, shorter preparation times, and no restrictions on single training sessions, making them more suitable for astronaut operational training. Air and magnetic levitation are similar; they use the buoyancy of gas or magnetic fields to compensate for excess gravity, thereby simulating the motion state of objects in a low-gravity environment [19,20,21,22]. Suspension methods for simulating low-gravity and microgravity primarily use suspension ropes to generate a tensile force in the direction of gravity to compensate for the excess gravity of objects, thereby simulating the movement of objects in a low microgravity environment [7,23,24,25,26,27,28,29,30].
To simulate a low-gravity environment using the suspension method, it is necessary to design a suspension point tracking subsystem. The active response gravity offload system tracks a suspension point through a mechanism similar to that of a bridge crane. It measures the angle error of the hoist rope using laser sensors and measures the length of the hoist rope using encoders. It then drives the tracking system to eliminate the swing angle of the hoist rope through proportional-derivative and nonlinear control based on the Lyapunov method [25]. The walking anti-gravity machine achieves a suspension point tracking through an X-Y stage system composed of a timing-belt-driven linear module and a stepper motor. It measures the swing angle of the suspension rope using an angle measurement system similar to a handle joystick and eliminates the swing angle of the suspension rope by controlling the speed of the X-Y stage system [26]. The 1/6 g environment simulation system utilizes a permanent magnet synchronous linear motor to drive a magnetic levitation crane, allowing the suspension point to accurately track the motion of a lunar rover [27]. The gravity compensation system of mesh antennas uses sliders and rails to passively follow mesh antennas deployment [28]. The active suspension gravity compensation system was designed with a gear rack mechanism and buffer auxiliary spring to replace the traditional suspension rope for gravity field compensation. The tilt angle of the gravity compensation mechanism is measured using a tilt sensor, and active control of the X-Y linear module eliminates the swing angle of the suspended target [29,30].
Most existing suspension systems use cable suspension methods. In these systems, the swing angle of the cable is actively eliminated by controlling the motion of the suspension points. Swing angles are typically measured using sensors such as vision systems, lasers, and gyroscopes. However, the cable suspension will inevitably generate cable swing angles, and the horizontal component of the suspension force thus generated will affect the accuracy of the HRI force. In addition, such schemes are highly dependent on the measurement accuracy of the cable angle, and at the same time, an accurate dynamic model needs to be established to control the precise movement of the suspension point.
In response to the existing problems of the current cable suspension method for simulating microgravity equipment. In this study, a rigid suspension-type astronaut operational training system (RSAOTS) is investigated. It consists of a gravity-compensated suspension system (GCSS) and a non-gravity axes tracking system (NGATS), which is the focus of this paper. Compared with the existing suspension-type simulated microgravity equipment, RSAOTS uses rigid suspension rods instead of suspension cables. Rigid suspension eliminates swing and thereby improves the accuracy of gravity compensation [31,32], but creates challenges for the design of non-gravity tracking systems. Because of the high rigidity of the suspension system, if the NGATS cannot perfectly follow the target object in the non-gravity axes, the target object will be affected by the constraint disturbance force generated by the NGATS. This makes it impossible for the training system to accurately reproduce the force movement state of the target object in the non-gravity plane, thereby reducing the effectiveness of training.
To address this issue, the NGATS was developed in this study. To enable the target object to move purely inertially without resistance along the non-gravity axes. NGATS employs multiple force sensors to measure the constraint disturbance force and HRI force exerted by NGATS and the trainer on the target object, and controls the suspension point through admittance control strategy. Compared with the existing schemes, it controls the suspension point more directly. To ensure the safety of NGATS and to guarantee the accuracy of the suspension point motion, a hybrid control strategy combining human–robot interaction (HRI) admittance control with an active disturbance rejection controller (ADRC) is proposed. The ADRC ensures the accuracy of the suspension point motions. The HRI force admittance controller establishes a relationship between the HRI forces and the motion of the target object, enabling NGATS compliance. This ensures that the NGATS operates in a safe motion state, ensuring the safety of the trainees. The constraint disturbance force controller reduces the constraint disturbance forces between the NGATS and target object, enhancing the perceived inertial force accuracy of the target object for trainees and further improving training effectiveness. Compared with the existing research, this paper proposed a design scheme for the non-gravity axis tracking system of the rigidly suspended astronaut operation training system, including its mechanical structure, sensor layout and control strategy, proposed a scheme for establishing a dynamic model for the X-Y-X Cartesian robot using timing belt-driven linear modules, and designed a composite control strategy for the structure and function of NGATS. The experiments validated the feasibility of the NGATS configuration and the composite control strategy. The results demonstrate that for the non-gravity axes, NGATS achieves system compliance during dynamic motion and significant external force disturbances. It precisely tracks the suspension point of a target object while ensuring operator safety.
The structure of this paper is organized as follows: Section 2 elucidates the working principles of the RSAOTS and the NGATS, with an emphasis on the mechanical design and dynamic analysis of the NGATS. Section 3 introduces the proposed composite compliance control strategy. Section 4 presents the experimental results and discussion, including single-axis tracking control experiment and the NGATS operation control experiment. The performance of the composite compliance control strategy was analyzed. Section 5 summarizes the research findings, discusses the limitations of the current work, and outlines potential directions for future research.
2. Working Principle and Mechanism Design
2.1. RSAOTS
The RSAOTS (Figure 1) uses a suspension system [32,33] to compensate for the difference between the “extra-terrestrial gravity” and “surface gravity” of the target object in the direction of gravity, allowing astronauts to experience the gravity and inertial forces of a low-gravity or microgravity environment during training. Along the non-gravity axes, the NGATS follows the movement of the target object, allowing astronauts to feel only its inertial force. This enables trainee astronauts to experience force sensations similar to those encountered when handling or operating the target object in low-gravity or microgravity environments.
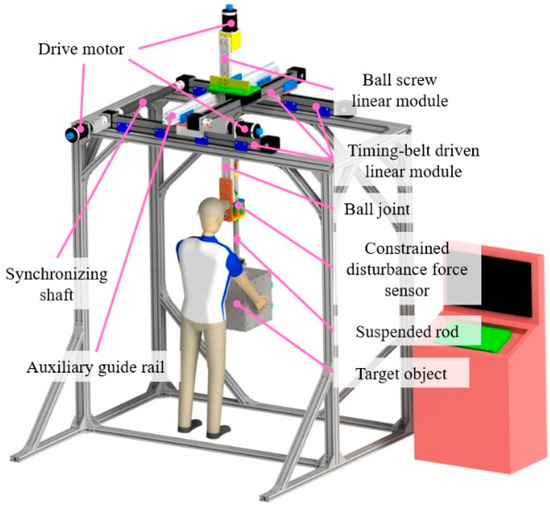
Figure 1.
Overall structure of the rigid suspension-type astronaut operational training system (RSAOTS).
The RSAOTS (Figure 2a) consists of the Gravity Compensation Suspension System (GCSS (Figure 2b) and the NGATS (Figure 2d). In a previous study, our team conducted in-depth research on a GCSS [32,33], which is driven using a ball screw linear module. A tension sensor installed on the GCSS (Figure 2c) measures the suspension force and uses a suspension force control strategy to precisely compensate for the excess gravity of the target object, thereby simulating a low-gravity field in a terrestrial environment.
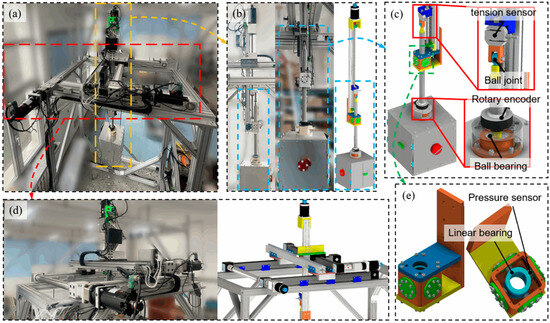
Figure 2.
RSAOTS: (a) overall structure; (b) gravity compensation suspension system (GCSS); (c) connection and sensors on GCSS; (d) non-gravity axes tracking system (NGATS); (e) constraint disturbance force sensor.
On the non-gravity axes, NGATS precisely tracks the target object at the suspension point, thereby simulating its inertial motion characteristics. The constraint disturbance force sensor (Figure 2e) measures the contact force between the suspension rod and training device in the non-gravity axes. Using a composite compliant control strategy, the constraint disturbance force applied by the RSAOTS to the target object in the non-gravity axes is eliminated, leaving only the target object’s inertial force. This enables the target object to move freely along the non-gravity axes with pure inertia and no resistance.
The schematic diagram of RSAOTS is shown in Figure 3. It demonstrates the cooperative working mechanism among the three core modules of RSAOTS: GCSS-NGATS-Target Object, and how it realizes the interaction function between the target object and the astronaut.
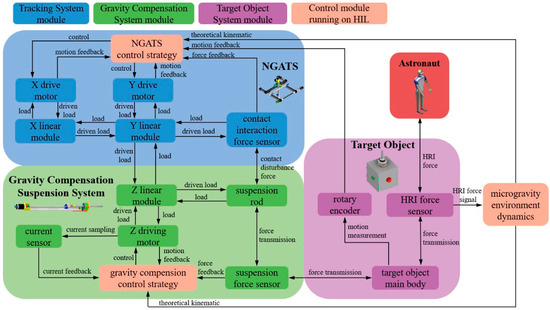
Figure 3.
Schematic diagram of the RSAOTS.
2.2. NGATS
As shown in Figure 4, the NGATS consists of three timing-belt driven linear modules arranged in an X-Y-X Cartesian robot configuration. The three linear modules are driven by two direct current (DC) servomotors. The two X-axis linear modules transmit power via a synchronous shaft to ensure synchronized motion. To enable the training device to suspend a 100 kg target object as required, an auxiliary rail was added to the Y-axis to help bear the torsional torque on the Y-axis linear module slide.
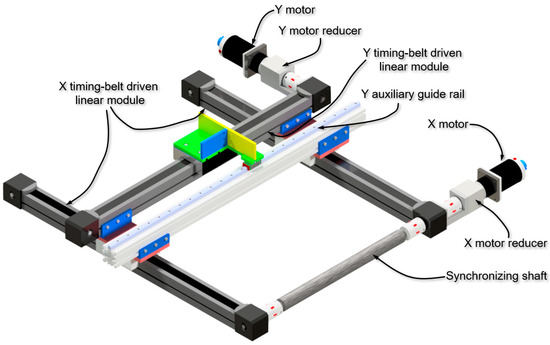
Figure 4.
The transmission structure of the NGATS.
The NGATS controls the suspension points to follow the movement of the target object on the non-gravity axes, thereby maintaining the constraint disturbance force at zero. This eliminates the unnecessary influence of NGATS on the movement of the work target and ensures that the target object moves in a pure inertial manner without resistance in the non-gravity plane.
2.2.1. Mathematical Model of the NGATS
A simplified diagram of the NGATS is shown in Figure 5, and the variables are defined in Table 1. For the NGATS, the generalized coordinates are defined as , where corresponds to the position along the X-axis at the center of the Y linear module and corresponds to the position of the slide on the Y linear module relative to the linear module. Angle is the rotation angle of the Y-axis linear module, and and are the rotation angles of the drive shafts of the drive motors, which provide drive along the X-axis and Y-axis, respectively.
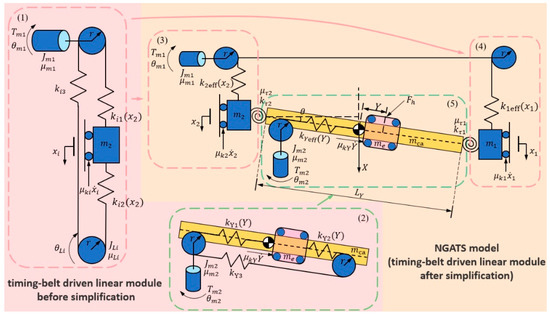
Figure 5.
Schematic diagram of the NGATS.

Table 1.
Nomenclature for the NGATS.
In the NGATS, the timing belt-driven linear modules are driven by DC servomotors, causing the timing-belt to drive the slider. The linear module can be represented as a spring–mass system. Given some assumptions and dynamic analysis, a sixth-order dynamic model of the timing-belt linear module can be derived.
Because the drive end and slider dominate the dynamics in the timing belt-driven linear module model, the dynamics of the free end can be ignored [34,35,36]. The equivalent spring coefficient of the simplified model can be expressed as follows [35,36] (i = 1, 2):
where , , , and are the elastic coefficients of different position timing belt, which change with the position of the slide; and are the elastic coefficients of the lower timing belt. The is the equivalent spring coefficient of the X linear module, is the equivalent spring coefficient of the Y linear module.
Based on the dynamic modeling method for the X-Y-X Cartesian robot driven by linear motors as described in [37], a dynamic model is established for the NGATS driven by timing belt-driven linear modules. Using the Lagrange–Euler equations, the following dynamic model of the NGATS was derived for the timing belt-driven linear module in the NGATS (Figure 5):
Here, , , , and represent the inertia matrix, Coriolis and centripetal acceleration matrix, viscous damping matrix, and stiffness matrix, respectively. The vectors represent the unknown disturbance, input force, and nonlinear friction vector, respectively, where . and are the X-axis and Y-axis components of the operating force acting on the target object; represents the torque sustained by the Y linear module; and are the driving torque generated by the X and Y motors, respectively. Specific details of this matrix are provided in the Appendix A.
To analyze the motion control problem of the system, we define vector . Equation (3) can be rewritten in state space form as
where
In this study, denotes an identity matrix, denotes an zero matrix, and vector denotes the vector composed of the actual speeds of each axis and the rotational speeds of each motor. and represent the actual movement speeds along the X-axis and Y-axis, respectively; is the actual angular velocity of rotation along the Y-axis; and are the actual rotational angular velocities of the X and Y motor shafts, respectively. Vector represents the measurement noise. Vector .
2.2.2. Constraint Disturbance Force Analysis of NGATS
As shown in Figure 6, when the target object is subjected to external forces and moves along the non-gravitational axes (XY axes), the motion state of the suspension point of the NGATS differs from that of the suspension position of the target object, that is, when and are not synchronized, the suspension rod segment will bend. Point is a constraint point. Hence, by installing force sensors at , the constraint disturbance force can be measured.
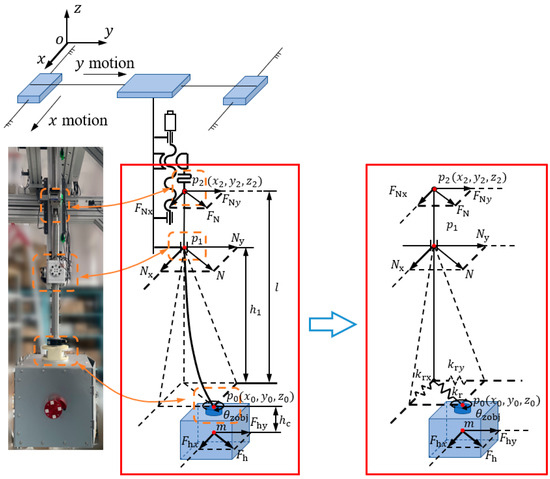
Figure 6.
Effect of suspension rod deflection on the system when an operating force is applied.
The force conditions in Figure 6 yield the following force equilibrium equation for the target object:
where , represents the operation force vector, , is the elastic coefficient matrix, , represents the distance of the points and in the non-gravitational axes, where , , and , is the acceleration vector of the target object being operated.
The equivalent stiffness at the end of the suspension rod was analyzed. Because the suspension rod has a high bending stiffness and produces little deflection deformation, it can be assumed that the distance in the z-direction from to is equal to the rod length. When the target object is subjected to , the suspension rod can be treated as a cantilever beam from the position of the constraint disturbance force sensor. At this point, the maximum deflection at the end of the suspension rod is as follows:
where is the z-direction distance from the suspension position of the workpiece to the force measurement point ; is the elastic modulus of the suspension rod; and is the sectional moment of inertia of the suspension rod.
The equivalent stiffness at the end of the suspension rod is the ratio of the force to the corresponding displacement. From Equation (12), its projections and on the X- and Y-axes are
When the shape and material of the suspension rod remain unchanged, the equivalent stiffness at the end of the suspension rod is related to the position of the target object in the Z-direction.
The relationship between constraint disturbance force and NGATS suspension point movement is as follows. Because the suspension rod is constrained by the linear bearings in the constraint disturbance force sensor, it does not rotate along the X- or Y-axes. When the mass of the suspension rod is ignored, the force balance equations for the suspension rod in the X and Y directions can be expressed as
From Equations (14) and (15), we obtain the following for the constraint disturbance force :
where
When perfectly follows the movement of the target object, that is and , from Equation (16), we know that and .
Therefore, when , the NGATS does not exert any constraint disturbance force on the target object. This enables the target object to move inertially without resistance in the non-gravitational plane. Theoretically, provided that is precisely controlled, the servo system can achieve frictionless dynamic tracking of the target object. Therefore, the constraint disturbance force can be used as an evaluation criterion for the effectiveness of the servo control, and it is essential for accurately simulating the motion characteristics of a target object in an extraterrestrial environment.
3. Composite Compliance Control Strategy for NGATS
3.1. Overall Structure of the Control Strategy
The NGATS model has parameter uncertainties and friction nonlinearities that make it difficult to control the constraint disturbance force precisely. To effectively improve the ability of NGATS to adapt to external environmental disturbances and uncertainties, a composite compliant control strategy was designed based on its structural characteristics, as shown in Figure 7. The main modules are as follows:
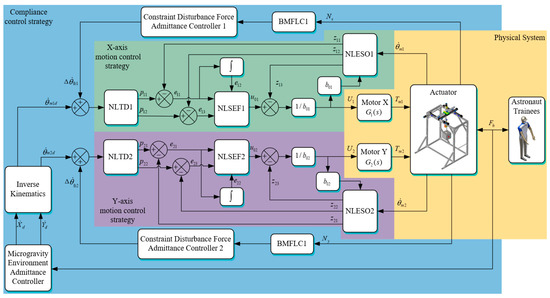
Figure 7.
Block diagram of the composite compliant control strategy.
- 1.
- HRI Force Admittance Controller: Based on the microgravity environment model of the target object, an HRI force admittance controller was designed to convert the HRI force on the non-gravity axes into the desired motion state of the NGATS suspension point.
- 2.
- Constraint Disturbance Force Controller: As stated in Section 2.2.2, when the NGATS suspension point and target object are not in the same state of motion, or . Therefore, a constraint disturbance force controller can be designed to convert the value of into a compensation value for the NGATS motion state. This compensates for the desired speed of motion.
- 3.
- Motion Control Strategy: Motion control is applied to the NGATS suspension points in conjunction with an admittance controller to achieve compliance control. The motion control strategy adopts an ADRC structure. A nonlinear tracking differentiator (NLTD) smooths the input signal to reduce the impact of signal changes in the initial stage of the system and obtain an approximate value of the differential of the speed input. A nonlinear extended state observer (NLESO) estimates and eliminates the lumped disturbance of the system. The drive voltage of the DC servo motor is controlled using a nonlinear state error feedback (NLSEF) control law.
The composite control strategy utilizes the HRI force admittance controller to convert the HRI force into the desired motion state of the NGATS suspension point. Using the motion-control strategy, the motion of the suspension point is controlled to follow this desired motion state. Under the influence of the HRI force admittance controller, NGATS achieves compliant control by simulating the motion characteristics of the target object in a non-gravitational plane under the influence of operational forces in an extraterrestrial environment. In cases where there is a constraint disturbance force between the NGATS and target object, the constraint disturbance force controller minimizes the impact of the constraint disturbance force on the target object, enabling the target object to achieve pure inertial, frictionless motion along the non-gravity axes.
3.2. Motion Control Strategy
Equations (4) and (16) indicate that uncertainties and nonlinear factors exist in the NGATS model. Therefore, a control method that does not rely on the system dynamic model, but can still achieve good control performance, is required. Therefore, the ADRC [38] is used to control the speed of the NGATS. ADRC has the ability to achieve good control performance without relying on the system dynamic model.
- (1)
- NLTD
Because the output of the admittance controller may undergo sudden changes, these signals may impact the mechanical system when used as inputs for motion control. The NLTD smooths the input signals of the speed controller by introducing a transition stage, thereby reducing the impact of sudden changes in the input signals on the mechanical system during the initial stage and obtaining an approximate value of the differential of the speed input.
The discrete form of the NLTD is
where h is the step size, subscript represents the X drive unit, represents the Y drive unit, and is the fastest control synthesis function, whose algorithm is as follows:
where is a variable independent of step size . Its value is selected to be sufficiently greater than to eliminate the overshoot phenomenon in . Finally, is the speed tracking factor.
- (2)
- NLESO
Factors such as the variable stiffness characteristics of the suspension rods in the NGATS, nonlinear friction in the linear modules, and changes in the inertia of the target object can affect the motion control accuracy of the system. The NLESO module is designed to integrate the uncertainties and external disturbance factors into a lumped disturbance, which is then estimated and eliminated. The discrete form of the NLESO is as follows:
where is the observed angular velocity, is the observed angular acceleration, is the observed set of lumped disturbances, and subscript represents the X drive unit, whereas represents the Y drive unit. Parameters , , , , , , and are adjustable parameters, and is a nonlinear function, calculated as
In Equation (20), ultimately compensates for the controller output, enabling the motion control strategy to actively resist disturbances. The calculation of the compensation control output is as follows:
where is the control component of the X or Y drive unit of the NLSEF; subscript represents the X drive unit and represents the Y drive unit.
- (3)
- NLSEF
When the NLESO compensates for the lumped disturbance, the NGATS model, which is full of disturbances, uncertainties, and nonlinearities, can be converted into a standard system model, thereby simplifying the design and adjustment parameters of the NLSEF in the control system. The NLSEF comprises the following form:
where subscript represents the X drive unit and represents the Y drive unit; , , and are gain coefficients; and , ,’ , and are undetermined constants.
3.3. Compliance Control Strategy
The process of astronauts using the NGATS in simulated operational training is a physical HRI system that ensures astronaut safety. The HRI force admittance controller and constraint disturbance force controller are designed to achieve active compliance control of the NGATS. This improves the HRI safety and provides the precise expected motion states for the motion control strategy, thereby restoring the non-gravity plane motion state of the operational target object.
3.3.1. HRI Force Admittance Controller
To improve the effectiveness of astronaut training, the NGATS must simulate the inertial sensation of astronauts operating on target objects on non-gravity axes. If air resistance is not considered, the force–motion model of the target object is equivalent to a pure mass system without springs or dampers. By adjusting the mass coefficient of different target objects, the force-motion states of target objects with different masses can be simulated.
The HRI admittance controller uses the initial velocities and of the target object on a non-gravity plane and operating forces and to plan the desired velocities and based on the motion laws of the target object in a microgravity environment [8,33].
The HRI force admittance controller is expressed as follows:
where , . As shown in Equation (23), the HRI admittance controller is equivalent to a pure mass-coefficient admittance controller with no damping or elasticity coefficients. Using the parameter information from the microgravity environment and the target object, a relationship can be established between and the motion of the target object, thereby achieving compliance in the NGATS. This ensures that the NGATS operates in a safe motion state, thereby guaranteeing the safety of the trainee operators.
3.3.2. Constrained Disturbance Force Controller
Because of the parameter uncertainty and nonlinearity inherent in NGATS dynamics, the compliance control strategy achieved solely through the HRI force admittance controller and motion control strategy does not guarantee complete motion synchronization between the NGATS suspension point and target object. This results in a constraint disturbance force. The constraint disturbance force can affect the simulation accuracy of the HRI forces, thereby reducing the astronaut’s perception of the accuracy of the forces caused by the inertia of the target object.
Therefore, it is necessary to design a constraint disturbance force controller and establish the constraint disturbance force outer loop to eliminate its influence on the restoration of the HRI forces. This section first addresses the issue of tremor signals in the constraint disturbance force sensor caused by small vibrations in the suspension rod. A band-limited multiple Fourier linear combiner (BMFLC) is used to eliminate the influence of these tremor signals. Subsequently, the constraint disturbance force controller, designed to compensate for the desired motion, is described.
When there is a positional error between points and and no at the end, the natural frequency of the suspension rod causes it to vibrate. Once the suspension rod exhibits even minor vibrations, the constraint disturbance force sensor generates tremor signals. To eliminate the tremor signals caused by the suspension rod’s vibrations and provide a stable input signal for the constraint disturbance force controller, the BMFLC is used.
The BMFLC algorithm at time k is expressed as follows [39]:
where , represents the step size, as shown in Figure 8. Here, and are the frequency bands of the tremor signal to be extracted, and and are the adaptive weight coefficients.
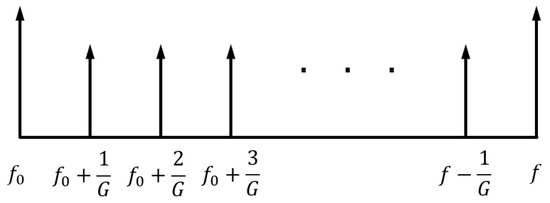
Figure 8.
Band-limited multiple Fourier linear combiner (BMFLC) fundamental frequency point distribution.
Weight coefficients and are updated using the least mean squares algorithm [39] as follows:
where and are the weight and reference input vectors, respectively, is the input signal, and is the adaptive gain parameter. As shown in Figure 9 and Equation (26), subtracting input signal from tremor signal fitted by the BMFLC yields output signal , which filters out the tremor signal.
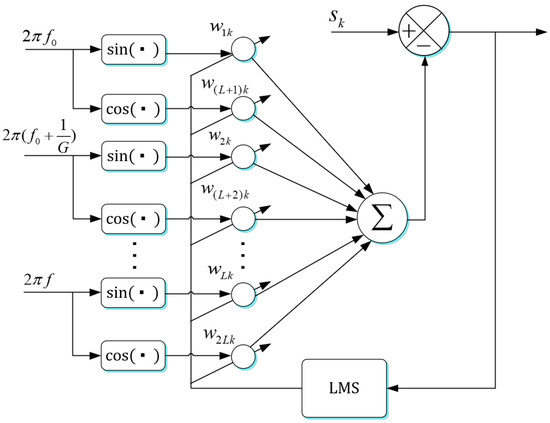
Figure 9.
BMFLC structure.
Using the least mean squares algorithm, the weight coefficients of the BMFLC are updated in real time along with the input signal. The BMFLC can accurately separate vibration signals in the frequency band from to . The constraint disturbance force sensor signal during a follow-up experiment was used to observe the filtering effect, as shown in Figure 10. Here, mm, and the parameters of the BMFLC are listed in Table 2.

Figure 10.
BMFLC filtering results: (a) signal before filtering; (b) separated tremor signal; (c) signal after filtering.

Table 2.
BMFLC parameter selection.
Because of the asynchronous motion of suspension points p2 and p0 of the target object, the suspension rod generates a constraint disturbance force on the motion of the target object in a nongravitational plane, thereby affecting the expected motion of the target object under the action of .
Equations (13)–(15) reveal that
When the target object moves purely inertially without resistance in a nongravitational plane, we have
where , represents the ideal acceleration vector of the target object.
Combining Equations (28) and (29) yields
where , which represents the difference in the acceleration of the non-gravity plane work target. Equations (29) and (30) show that the constraint disturbance force changes the motion state of the target object, preventing it from perfectly simulating the force motion in the target environment. Therefore, a constraint disturbance force controller was designed to compensate for the motion state of the follow-up system and eliminate the constraint disturbance force.
The constraint disturbance force controller is represented as follows:
In this equation, , where are the compensation velocities of the contact forces in the X and Y directions, respectively; () is the control coefficient of the constraint disturbance force controller; (), where are the transmission ratios of the linear modules in the X and Y directions, respectively, from the translational motion of the sliding table to the rotational motion of the motor shaft. In this study, .
By compensating for the expected motion velocity of the NGATS suspension point, the influence of the constraint disturbance force on the motion of the target object is reduced, further improving the HRI accuracy provided by the NGATS to the trainees in the non-gravity plane.
4. Experimental Results and Discussion
The experimental system used the dSPACE 1102 from dSPACE, Paderborn, Germany hardware-in-the-loop real-time simulation system as its core, with an Industrial Personal Computer (IPC) as the host computer of the control system and an STM32F103 from STMicroelectronics, Geneva, Switzerland as the follower device. The sampling frequency of the control system was set to 1 KHz. The electrical hardware structure of the system is shown in Figure 11. The values of each parameter in the control strategy are shown in Table 3 and Table 4. Among them, the PID controller in the comparative experiment adopts the parallel form as shown in Equation (32).
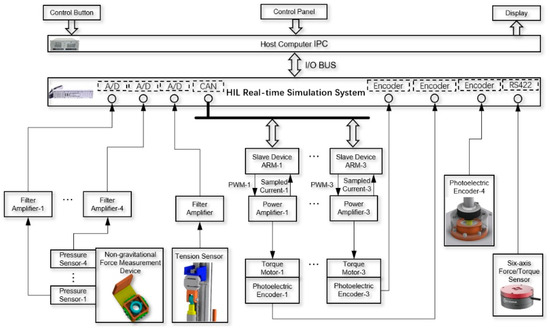
Figure 11.
Electrical hardware structure.

Table 3.
ADRC controller and constraint disturbance force controller parameters.

Table 4.
PID controller parameters.
4.1. Single Degree-of-Freedom Tracking Control Experiment and Analysis
4.1.1. Experimental Design of Single Degree-of-Freedom Tracking Control Experiment
To verify the effectiveness of the NGATS control strategy, control experiments were conducted in the X direction.
- (1)
- Experimental Method
In the experiment, two groups of target objects with masses of 17.5 kg and 37.5 kg were used to test the effect of mass changes on the control strategy. For each mass group, the following composite control strategies were used for the experiments: an HRI force admittance controller plus a proportional–integral–derivative (PID) speed controller (A-PID), an HRI force admittance controller plus the ADRC composite control strategy (A-ADRC), and an HRI force admittance controller plus the ADRC and constraint disturbance force controller (ACDFC) composite control strategy (ACDFC-ADRC; the overall control strategy proposed in this article). The experimental results are shown in Figure 12, Figure 13, Figure 14, Figure 15, Figure 16 and Figure 17.
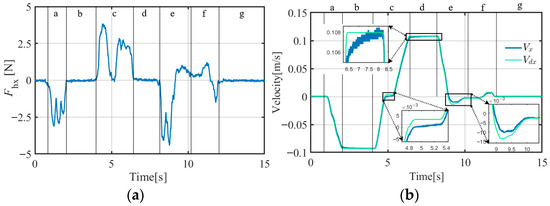
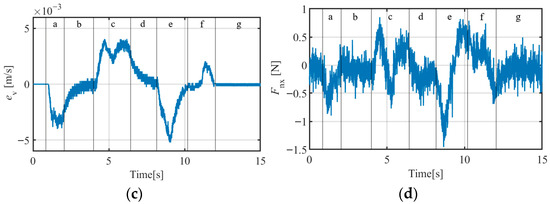
Figure 12.
X-direction experimental curves for the human–robot interaction (HRI) force admittance controller and proportional–integral–derivative (PID) speed controller (A-PID; target object mass = 17.5 kg): (a) operating force curve; (b) velocity curve; (c) velocity error curve; (d) constraint disturbance force curve.
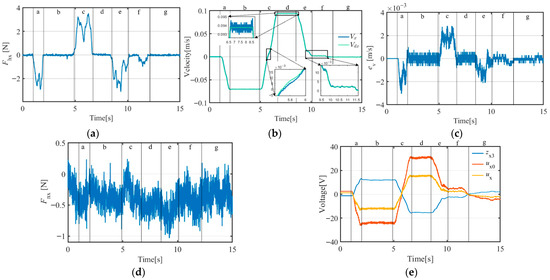
Figure 13.
X-direction experimental curves for the HRI force admittance controller plus the active disturbance rejection controller (ADRC) composite control strategy (A-ADRC: target object mass = 17.5 kg): (a) operating force curve; (b) velocity curve; (c) velocity error curve; (d) constraint disturbance force curve; (e) output of ESO (), NLSEF (), and ADRC () curves.


Figure 14.
X-direction experimental curves for the HRI force admittance controller plus the ADRC and constraint disturbance force controller (ACDFC) composite control strategy (ACDFC-ADRC; target object mass = 17.5 kg): (a) operating force curve; (b) velocity curve; (c) velocity error curve; (d) constraint disturbance force curve; (e) output of ESO (), NLSEF (), and ADRC () curves.
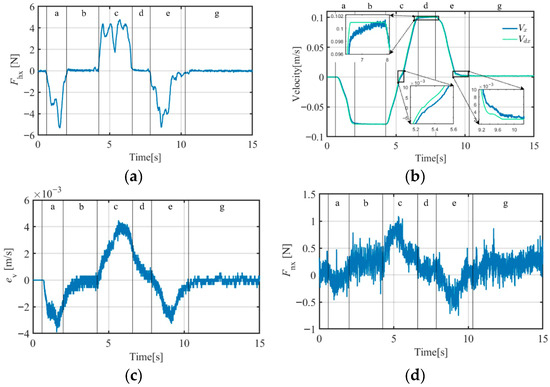
Figure 15.
X-direction A-PID experimental curves (target object mass = 37.5 kg): (a) operating force curve; (b) velocity curve; (c) velocity error curve; (d) constraint disturbance force curve.


Figure 16.
X-direction A-ADRC experimental curves (target object mass = 37.5 kg): (a) operating force curve; (b) velocity curve; (c) velocity error curve; (d) constraint disturbance force curve; (e) output of ESO (), NLSEF (), and ADRC () curves.
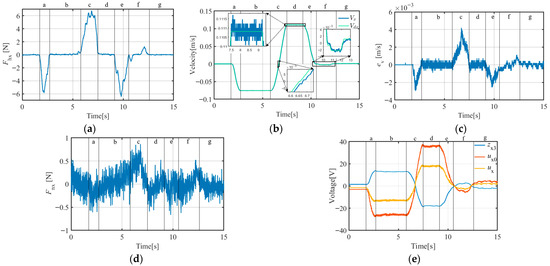
Figure 17.
X-direction ACDFC-ADRC experimental curves (target object mass = 37.5 kg): (a) operating force curve; (b) velocity curve; (c) velocity error curve; (d) constraint disturbance force curve; (e) output of ESO (), NLSEF (), and ADRC () curves.
- (2)
- Experimental Details
The experimental process consisted of the following steps:
- Before the experiment, the target object was suspended at the start position.
- The trainer applied an operating force to the target object along the X-axis, causing the target object to accelerate forward. This is the forward-thrust segment, referred to as segment a.
- Once the target object reached a certain speed, the trainer ceased to apply the operating force and the target object moved freely forward. This is the forward inertial segment, referred to as segment b.
- The trainer applied a reverse operating force to the target object, causing it to decelerate until its speed reached zero, and then accelerate in the opposite direction. This is the reverse thrust segment, which is referred to as segment c.
- After reaching a certain speed, the trainer stopped applying the operating force, and the workpiece moved freely in the reverse direction. This is the reverse inertial segment, referred to as segment d.
- The trainer applied a braking operating force to decelerate the target object and stop its movement. This braking segment is referred to as segment e.
- If the target object did not fully stop during segment e, the trainer adjusted the operating force to bring it to a complete stop. This is the adjustment segment, referred to as segment f. If the operator applied the operating force with high precision during segment e, the target object was effectively stopped during segment e (Figure 13 and Figure 14), and segment f was not required.
- After the target object was stopped, the operator stopped applying the operating force, and the target object came to a stop or remained in inertial motion at an extremely low speed. This segment is referred to as segment g.
4.1.2. Analysis of the Single Degree-of-Freedom Tracking Control Experimental Results
The root mean squared error (RMSE) results for the actual and planned speeds for the three control strategies are listed in Table 5, and the RMSEs of the constrained disturbance force are listed in Table 6.

Table 5.
Root mean squared error (RMSE) of speed in the X-direction control experiment.

Table 6.
RMSE results of the constraint disturbance force in the X-direction control experiment.
- (1)
- Analysis of the Motion Control Strategies
As can be seen from Figure 12, Figure 13, Figure 14, Figure 15, Figure 16 and Figure 17, the A-ADRC strategy has better tracking performance than the A-PID strategy, especially during the inertial segments (segments b, d, and g). A-ADRC converges speed errors significantly faster, and the motion simulation of the target object is better in the inertial segments. During the operator force application segments (segments a, c, and e), the ADRC motion control strategy exhibited smaller peak speed errors.
The data in Table 5 reveal that the difference in the speed RMSE results of A-ADRC and ACDFC-ADRC is small. This may be because the added constraint disturbance controller in the ACDFC-ADRC strategy compensates for the desired speed, which is equivalent to a feedforward signal in the motion closed loop and does not affect its structure. Therefore, there was no significant change in the motion RMSE of the ACDFC-ADRC and A-ADRC control strategies. Additionally, compared with the A-PID strategy, the A-ADRC and ACDFC-ADRC strategies exhibited lower RMSE results for speed.
- (2)
- Effectiveness of the Constrained Disturbance Forces
A comparison of the data in Table 6 and Figure 12d, Figure 13d, Figure 14d, Figure 15d, Figure 16d and Figure 17d reveals that the A-ADRC strategy has a better ability to control the constrained disturbance forces than the A-PID strategy. After adding the constrained disturbance force controller, the constrained disturbance forces in the system were further controlled and the RMSEs of the constrained disturbance forces were reduced.
After adding the constraint disturbance compensator, the constraint disturbance was further controlled, and the ACDFC-ADRC control strategy further eliminated the constraint disturbance. This indicates that the constraint disturbance compensator is effective.
- (3)
- Summary
Control experiments on target objects of different masses reveal that the ACDFC-ADRC control strategy proposed in this study was stable and robust in the X-axis experiment performed on the NGATS.
4.2. NGATS Operation Control Experiment and Analysis
4.2.1. Experimental Design of NGATS Operation Control Experiment
To evaluate the tracking performance of the tracking system and the composite compliance control strategy, tracking control experiments were conducted on the non-gravity axes (X- and Y-axes).
- (1)
- Experimental Method
Experiments were conducted using two types of target objects with masses of 17.5 kg and 37.5 kg. When the trainers began the experiment, the direction in which they pushed the target object was as shown in Figure 18. Within each mass group, experiments were conducted using the A-PID, A-ADRC, and ACDFC-ADRC strategies, and the experimental curves are shown in Figure 19, Figure 20, Figure 21, Figure 22, Figure 23, Figure 24, Figure 25, Figure 26, Figure 27, Figure 28, Figure 29 and Figure 30.
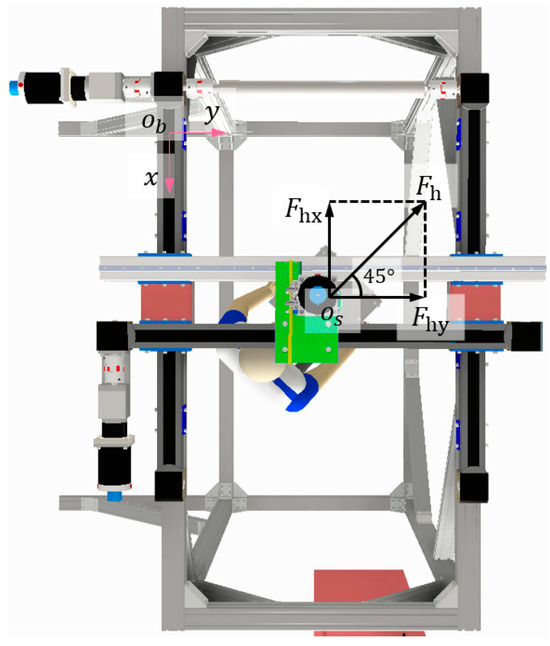
Figure 18.
Direction of the operating force.
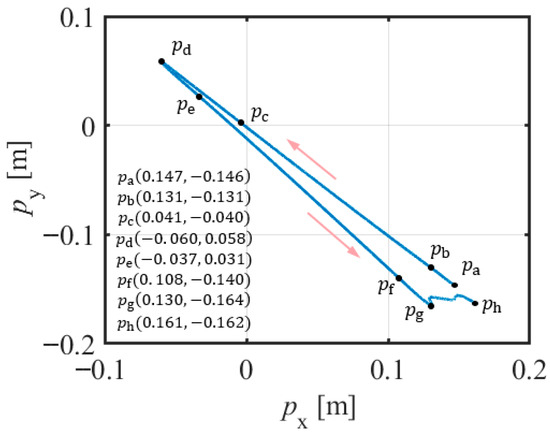
Figure 19.
Motion trajectory of the target object (target object mass = 17.5 kg) during the A-PID experiment.
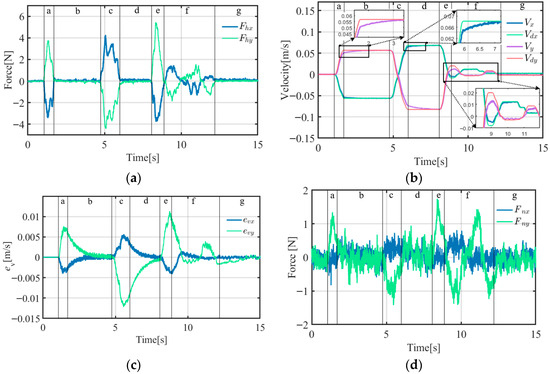
Figure 20.
A-PID experimental curves (target object mass = 17.5 kg): (a) operating force curve; (b) velocity curve; (c) velocity error curve; (d) constraint disturbance force curve.
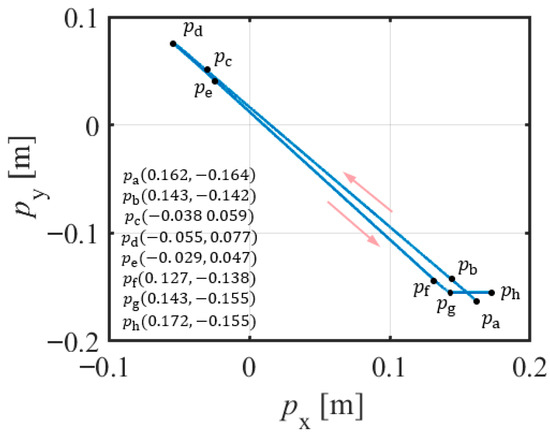
Figure 21.
Motion trajectory of the target object (target object mass = 17.5 kg) during the A-ADRC experiment.
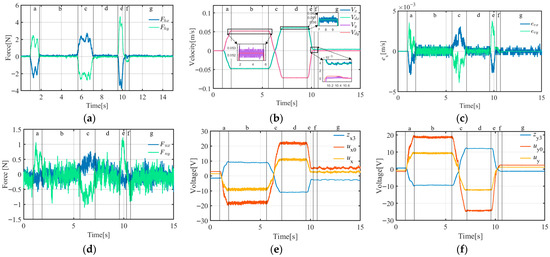
Figure 22.
A-ADRC experimental curves (target object mass = 17.5 kg): (a) operating force curve; (b) velocity curve; (c) velocity error curve; (d) constraint disturbance force curve; (e) output of ESO (), NLSEF (), and ADRC () curves on the X-axis; (f) output of ESO (), NLSEF (), and ADRC () curves on the Y-axis.
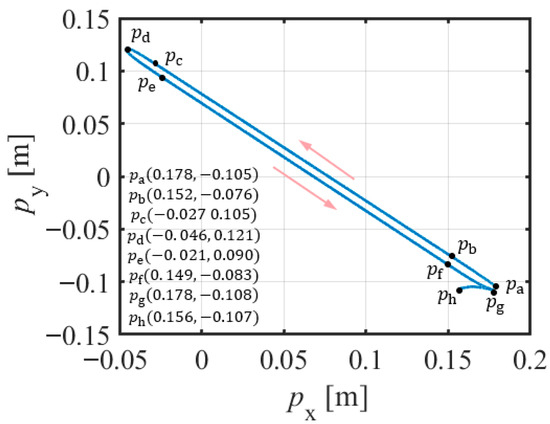
Figure 23.
Motion trajectory of the target object (m = 17.5 kg) during the ACDFC-ADRC experiment.
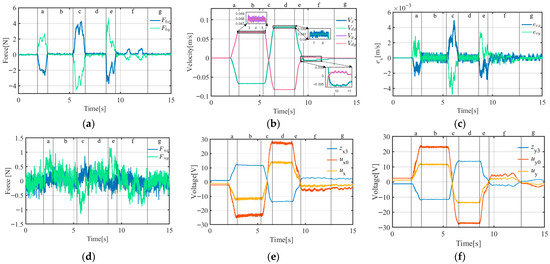
Figure 24.
ACDFC-ADRC experimental curves (target object mass = 17.5 kg): (a) operating force curve; (b) velocity curve; (c) velocity error curve; (d) constraint disturbance force curve; (e) output of ESO (), NLSEF (), and ADRC () curves on the X-axis; (f) output of ESO (), NLSEF (), and ADRC () curves on the Y-axis.
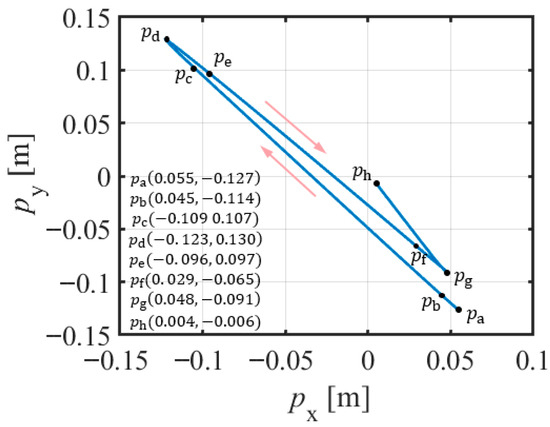
Figure 25.
Motion trajectory of the target object (target object mass = 37.5 kg) during the A-PID experiment.
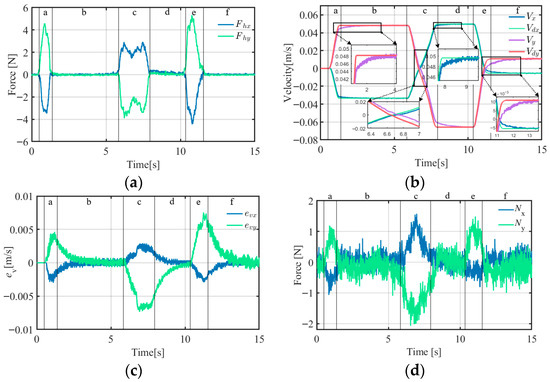
Figure 26.
A-PID experimental curves (target object mass = 37.5 kg): (a) operating force curve; (b) velocity curve; (c) velocity error curve; (d) constraint disturbance force curve.
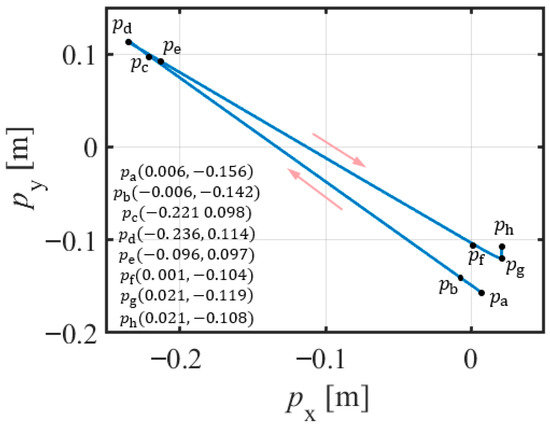
Figure 27.
Motion trajectory of the target object (target object mass = 37.5 kg) during the A-ADRC experiment.
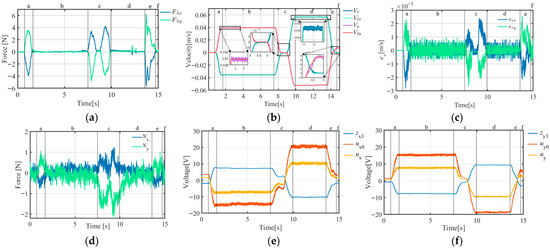
Figure 28.
A-ADRC experimental curves (target object mass = 37.5 kg): (a) operating force curve; (b) velocity curve; (c) velocity error curve; (d) constraint disturbance force curve; (e) output of ESO (), NLSEF (), and ADRC () curves on the X-axis; (f) output of ESO (), NLSEF (), and ADRC () curves on the Y-axis.
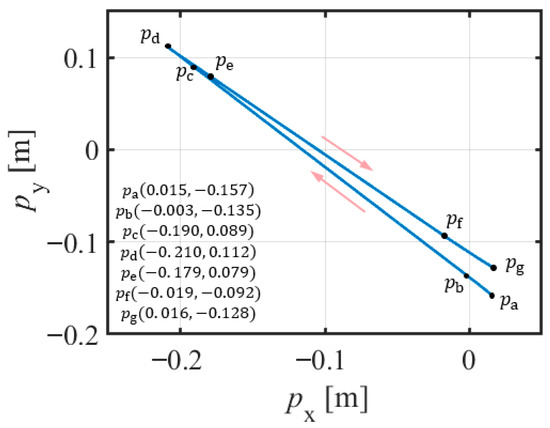
Figure 29.
Motion trajectory of the target object (target object mass = 37.5 kg) during the ACDFC-ADRC experiment.
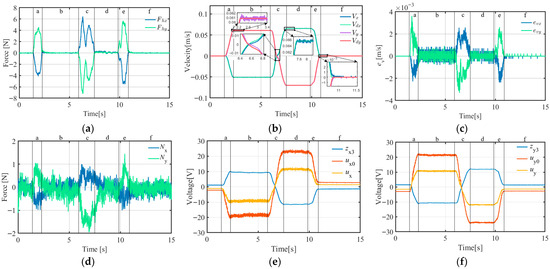
Figure 30.
ACDFC-ADRC experimental curves (target object mass = 37.5 kg): (a) operating force curve; (b) velocity curve; (c) velocity error curve; (d) constraint disturbance force curve; (e) output of ESO (), NLSEF (), and ADRC () curves on the X-axis; (f) output of ESO (), NLSEF (), and ADRC () curves on the Y-axis.
- (2)
- Experimental Details
The experimental process consisted of the following steps:
- Before the experiment, the target object was suspended at start position .
- The trainer applied an operational force to the target object at an angle of 135° in the positive direction of the X-axis, causing the target object to accelerate. This segment was the positive-thrust segment and is referred to as segment a.
- After the target object reached a certain speed, the trainer ceased to apply the operational force at position , allowing the target object to move freely in the positive direction. This segment was the positive inertial segment and is referred to as segment b.
- At position , the trainer applied a reverse operational force to the target object, causing it to decelerate under the force until its velocity reached zero at turning point . It then accelerated in the reverse direction, forming a reverse thrust segment referred to as segment c.
- After the target object reached a certain reverse velocity, the trainer ceased to apply an operational force at point , allowing the target object to move freely in the reverse direction. This was the reverse inertial segment, referred to as segment d.
- At position , the trainer applied a braking force to decelerate the target object to bring it to a stop at position . This was the braking segment and is referred to as segment e.
- When the trainer did not complete the target task at position , the operator applied an operating force to stop the movement of the target task. The experiment ended at ; this section was the adjustment section, and is referred to as section f.
- After the target object was stopped, the operator ceased to apply the operating force. At this point, the target object was either stationary or in a state of inertial motion at an extremely low velocity. This segment is referred to as segment g.
4.2.2. Analysis of the NGATS Operation Control Experimental Results
The RMSE values of the actual and planned speeds for the three control strategies are listed in Table 7. The RMSE results of the constrained disturbance forces are listed in Table 8.

Table 7.
Speed RMSE of the three control strategies.

Table 8.
RMSE of the constrained disturbance forces.
- (1)
- Analysis of Motion Control Strategies
A comparison of the data in Table 7 and Figure 19, Figure 20, Figure 21, Figure 22, Figure 23, Figure 24, Figure 25, Figure 26, Figure 27, Figure 28, Figure 29 and Figure 30 reveals that A-ADRC can control the speed errors better than A-PID. In the inertial segments (segments b, d, and f), the speed errors of the ADRC motion control strategy converged more quickly, whereas in the dynamic segments (segments a, c, and e), the peak motion errors of A-ADRC were smaller.
Compared with the experiment described in Section 3.1, the velocity RMSE in the X-direction was slightly reduced. This may be because in the single degree-of-freedom experiment, the operating force had a small Y-direction component, which increased the friction of the X-module movement. When the Y-direction follow-up motion was added, the Y-direction constraint disturbance force was reduced, thereby reducing the impact of friction on the X-direction follow-up control.
When using the A-PID scheme, the Y module had a higher speed RMSE than the X module. This may be because the Y module, which uses an auxiliary rail plus timing-belt driven linear module, has more complex nonlinear friction than the X module, which uses a dual timing-belt driven linear module plus a synchronous shaft, thereby affecting the motion control accuracy of the PID.
When using A-ADRC and ACDFC-ADRC, the difference in the RMSE for the speed of the X- and Y-modules was smaller. A-ADRC has a lower RMSE for speed than A-PID. This may be because the NLESO in the ADRC strategy can estimate and compensate for nonlinear friction as a lumped disturbance, reducing the impact of external disturbances on the motion control accuracy of the module and improving the motion control accuracy.
- (2)
- Effectiveness of the Constraint Disturbance Forces
The data in Table 8 and Figure 19, Figure 20, Figure 21, Figure 22, Figure 23, Figure 24, Figure 25, Figure 26, Figure 27, Figure 28, Figure 29 and Figure 30 demonstrate that A-ADRC has a superior constraint disturbance force control ability than A-PID. This may be attributed to the ADRC strategy’s higher speed tracking accuracy, enabling the suspension point p2 to more precisely align with the target object’s suspension position p0. As shown in Equation (18), the improved motion tracking accuracy facilitates more effective control of the constraint disturbance forces.
The constraint disturbance force controller in the ACDFC-ADRC strategy further controlled the constraint disturbance force, indicating its effectiveness.
- (3)
- Effectiveness of task training
A simulated microgravity task training experiment was conducted using the mechanical configuration and the composite compliant control strategy proposed in this study. When carrying out the 17.5 kg and 37.5 kg tasks, the RMSE results between the planned velocity and actual velocity in the X direction was m/s and , respectively, and in the Y direction: and , respectively. The RMSE of the constraint disturbance force in the X direction is: 0.1828 N and 0.4765 N, and in the Y direction: 0.3321 N and 0.6656 N. The mechanical configuration of the NGATS and the ACDFC-ADRC control strategies achieved high-precision motion control throughout the entire process of the simulated microgravity operational training experiment, effectively controlled the constraint disturbance forces, and reduced their impact on the accuracy of the simulated microgravity operational training.
5. Conclusions
This study proposed the NGATS for a RSAOTS that can control the suspension point to precisely follow the operation target in a ground environment. Combined with a gravity compensation suspension system [32,33], this meets the need for long-term, low-cost astronaut operational training in a terrestrial environment.
NGATS was designed based on the requirements for the rapid and large-range tracking of suspension points in non-gravity planes during low microgravity simulation training. To address factors such as parameter uncertainty, structural parameter changes, and external disturbances in the NGATS model, a composite compliant control strategy was designed to effectively improve the force interaction simulation accuracy of the target object in non-gravity planes during low microgravity simulation training.
To address issues such as parameter uncertainty, parameter changes, and friction nonlinearity in the NGATS model, ADRC was used for motion control. By compensating for the lumped disturbances in the NLESO compensation system, the motion control accuracy of the suspension points in the NGATS is improved.
To establish the relationship between the HRI forces and motion of the target object as well as to achieve the compliance of NGATS, an HRI force admittance controller was designed to provide precise desired motion states for the motion control strategy, restoring the motion state of the target object in a non-gravitational plane, and thereby enhancing HRI safety.
To address the issue of constraint disturbance forces applied by the NGATS to the target object, a constraint disturbance force controller was designed to improve the accuracy of the tracking system, reduce the impact of constraint disturbance forces on the motion of the target object, and enhance the precision of the training system in simulating microgravity environmental characteristics.
The effectiveness of the NGATS structure and the ACDFC-ADRC control strategy was verified through experiments. The experimental results showed that the rigid suspension on the NGATS of the target object reflected the pure inertial and frictionless motion characteristics in the non-gravity plane. This resulted in accurate HRI forces for astronauts when operating the target object during simulated low microgravity training.
This study provides an effective method for addressing the issue of non-gravity plane tracking in ground-based simulation training devices for astronauts. This method enables the dynamic simulation of objects of varying masses under non-gravity plane conditions, making it suitable for virtual material handling training in ground-based environments. This method can also be applied to experiments that require low microgravity motion simulations, such as planetary rover simulations of target gravity environments and satellite docking ground verification tests.
Experimental results indicate that the composite compliant control strategy employed in this paper can mitigate the impact of constrained disturbance forces in NGATS but cannot eliminate them entirely. Furthermore, the stability of this control strategy during long-term operation requires further research and validation. In our future work, we will focus on optimizing the control strategy for NGATS to enhance its compensation accuracy under complex operating conditions. Concurrently, we will conduct in-depth analysis and refinement of the control strategy’s stability to improve its safety performance in simulated low-gravity and microgravity environments. These enhancements will improve the accuracy and safety of the NGATS in human–robot interaction training, enabling it to more effectively support astronauts in adapting to and coping with microgravity environments during long-duration missions.
Author Contributions
Conceptualization, Z.W. and L.Z.; Data curation, Z.W., F.X. and Y.F.; Formal analysis, Y.F. and B.X.; Funding acquisition, L.Z.; Investigation, Z.W. and B.X.; Methodology, Z.W. and L.Z.; Project administration, L.Z.; Resources, L.Z.; Software, Z.W. and F.X.; Supervision, L.Z.; Validation, L.Z., F.X. and Y.F.; Writing—original draft, Z.W.; Writing—review & editing, L.Z. All authors have read and agreed to the published version of the manuscript.
Funding
This research was supported by the National Natural Science Foundation of China (No. 61773007).
Informed Consent Statement
Informed consent was obtained from all subjects involved in the study.
Data Availability Statement
The original contributions presented in this study are included in the article. Further inquiries can be directed to the corresponding author.
Conflicts of Interest
The authors declare no conflicts of interest.
Abbreviations
The following abbreviations are used in this manuscript:
| RSAOTS | Rigid suspension-type astronaut operational training system |
| NGATS | Non-gravity axes tracking system |
| HRI | human–robot interaction |
| ADRC | active disturbance rejection controller |
| DC | direct current |
| GCSS | gravity compensation suspension system |
| NLTD | Nonlinear tracking differentiator |
| NLESO | Nonlinear extended state observer |
| NLSEF | Nonlinear state error feedback |
| BMFLC | Band-limited multiple Fourier linear combiner |
| ACDFC | Constraint disturbance force controller |
| RMSE | Root mean squared error |
| A-PID | HRI force admittance controller plus PID speed controller |
| A-ADRC | HRI force admittance controller plus ADRC speed controller |
| ACDFC-ADRC | A-ADRC plus constraint disturbance force controller (ACDFC) |
Appendix A
The matrices in Equation (3) are as follows:
where
References
- Li, X.D.; Xie, Y.; Tian, Y.M.; An, F.J. A Study on the Design and Implementation Technologies of EVA at the China Space Station. Aerosp. Basel 2024, 11, 264. [Google Scholar] [CrossRef]
- Dev, S.I.; Khader, A.M.; Begerowski, S.R.; Anderson, S.R.; Clément, G.; Bell, S.T. Cognitive performance in ISS astronauts on 6-month low earth orbit missions. Front. Physiol. 2024, 15, 1451269. [Google Scholar] [CrossRef] [PubMed]
- Wang, X.; Zhang, Q.; Wang, W. Design and Application Prospect of China’s Tiangong Space Station. Space-Sci. Technol.-China 2023, 3, 0035. [Google Scholar] [CrossRef]
- Peng, Q.; Wang, P.; Xing, L. Considerations on several issues of China’s manned lunar scientific research and test station. J. Astronaut. 2023, 44, 1436–1446. [Google Scholar]
- Creech, S.; Guidi, J.; Elburn, D. Artemis: An Overview of NASA’s Activities to Return Humans to the Moon. In Proceedings of the 2022 IEEE Aerospace Conference (AERO), Big Sky, MT, USA, 5–12 March 2022. [Google Scholar]
- Gast, M.A.; Moore, S.K. A glimpse from the inside of a space suit: What is it really like to train for an EVA? Acta Astronaut. 2011, 68, 316–325. [Google Scholar] [CrossRef][Green Version]
- Xue, F.; Zhang, L.X.; Li, L.L.; Wang, Z.H.; Song, D. A New Composite Control Strategy for an Astronaut Virtual Operation Training System Based on Cable-Driven Technology. Actuators 2023, 12, 384. [Google Scholar] [CrossRef]
- Lin, L.J.; Wang, L.; Chang, Y.; Zhang, L.X.; Xue, F. 6-Dimensional Virtual Human-Machine Interaction Force Estimation Algorithm in Astronaut Virtual Training. Machines 2023, 11, 46. [Google Scholar] [CrossRef]
- Keime, M.; Chomienne, L.; Goulon, C.; Sainton, P.; Lapole, T.; Casanova, R.; Bossard, M.; Nicol, C.; Martha, C.; Bolmont, B.; et al. How about running on Mars? Influence of sensorimotor coherence on running and spatial perception in simulated reduced gravity. Front. Physiol. 2023, 14, 1201253. [Google Scholar] [CrossRef]
- Zhang, Y.; Richards, J.T.; Hellein, J.L.; Johnson, C.M.; Woodall, J.; Sorenson, T.; Neelam, S.; Ruby, A.M.J.; Levine, H.G. NASA’s ground-based microgravity simulation facility. In Plant Gravitropism: Methods and Protocols; Springer: Berlin/Heidelberg, Germany, 2021; pp. 281–299. [Google Scholar]
- Zhu, Z.H.; Kang, J.J.; Bindra, U. Validation of CubeSat tether deployment system by ground and parabolic flight testing. Acta Astronaut. 2021, 185, 299–307. [Google Scholar] [CrossRef]
- Caprace, D.G.; Gontier, C.; Iranmanesh, M.; Scoubeau, M.; Pletser, V. Experimental Characterization of Weightlessness During Glider Parabolic Flights. Microgravity Sci. Technol. 2020, 32, 1121–1132. [Google Scholar] [CrossRef]
- Sun, C.; Yuan, J.P.; Zhu, Z.X. Neural adaptive control for a ground experiment of the space proximity operation in a six-degree-of-freedom micro-gravity simulation system. Chin. J. Aeronaut. 2020, 33, 2420–2433. [Google Scholar] [CrossRef]
- Jenkin, H.; Jenkin, M.; Harris, L.R.; Herpers, R. Neutral buoyancy and the static perception of upright. npj Microgravity 2023, 9, 52. [Google Scholar] [CrossRef]
- Hart, S.; Sanchez, E.; Malik, H.; Lightsey, E.G.; Romero-Calvo, A. Neutral buoyancy testing of low-gravity fluid management. AIAA J. 2024, 62, 858–863. [Google Scholar] [CrossRef]
- Bury, N.A.; Jenkin, M.; Allison, R.S.; Herpers, R.; Harris, L.R. Vection underwater illustrates the limitations of neutral buoyancy as a microgravity analog. npj Microgravity 2023, 9, 316–325. [Google Scholar] [CrossRef] [PubMed]
- Totman, C.; Perusek, G.; Grodsinsky, C.; Humphreys, B.; Sheehan, C. Ground-Based Simulations of ISS Exercise Countermeasures at NASA Glenn Research Center’s Exercise Countermeasures Laboratory: Compliant Interface Dynamics Using a Floating Treadmill. In Proceedings of the 46th AIAA Aerospace Sciences Meeting and Exhibit, Reno, Nevada, 7–10 January 2008; p. 804. [Google Scholar]
- Perusek, G.P.; DeWitt, J.K.; Cavanagh, P.R.; Grodsinsky, C.M.; Gilkey, K.M. Zero-gravity locomotion simulators: New ground-based analogs for microgravity exercise simulation. In Proceedings of the ESA Symposium: Technology for Artificial Gravity and Microgravity Simulation, Noordwijk, The Netherlands, 10–12 December 2007. [Google Scholar]
- Wei, Y.Q.; Yang, X.; Xu, Z.G.; Bai, X.L. Novel ground microgravity experiment system for a spacecraft-manipulator system based on suspension and air-bearing. Aerosp. Sci. Technol. 2023, 141, 108587. [Google Scholar] [CrossRef]
- Zhou, R.; Zhou, Y.F.; Chen, X.D.; Hou, W.J.; Wang, C.; Wang, H.; Jiang, W. Gravity compensation method via magnetic quasi-zero stiffness combined with a quasi-zero deformation control strategy. Sci. China Technol. Sci. 2022, 65, 1738–1748. [Google Scholar] [CrossRef]
- Chen, R.; Chen, Z.; Bai, Y.; Zhao, Y.; Yao, W.; Wang, Y. Ground experiment of safe proximity control for complex-shaped spacecraft. IEEE Trans. Ind. Electron. 2022, 70, 11535–11543. [Google Scholar] [CrossRef]
- Wapman, J.D.; Sternberg, D.C.; Lo, K.; Wang, M.; Jones-Wilson, L.; Mohan, S. Jet Propulsion Laboratory Small Satellite Dynamics Testbed Planar Air-Bearing Propulsion System Characterization. J. Spacecr. Rocket. 2021, 58, 954–971. [Google Scholar] [CrossRef]
- Sun, H.N.; Tang, X.Q.; Ge, S.S. Advancing Mars Exploration: Development of a Large-Scale Gravity Compensation System for Landers during Descent. IEEE Trans. Aerosp. Electron. Syst. 2025, 61, 6697–6710. [Google Scholar] [CrossRef]
- Jiao, B.B.; He, B.Y.; Zhang, Y.H.; Niu, L.W.; Yue, S.L.; Ma, J.M. Adjustable Stiffness CLSM and Its Application in a Gravity Off-Load System. J. Aerosp. Eng. 2025, 38, 04025015. [Google Scholar] [CrossRef]
- Dungan, L.K.; Valle, P.S.; Bankieris, D.R.; Lieberman, A.P.; Redden, L.; Shy, C. Active Response Gravity Offload and Method. U.S. Patent 9,194,977 B1, 24 November 2015. [Google Scholar]
- Han, O.; Kienholz, D.; Janzen, P.; Kidney, S. Gravity-off-loading system for large-displacement ground testing of spacecraft mechanisms. In Proceedings of the 40th Aerospace Mechanisms Symposium Cleveland, Cocoa Beach, FA, USA, 12–14 May 2010; pp. 119–132. [Google Scholar]
- Ma, L.; Xu, R.H.; Song, H.L.; Liu, S.K. Research on 1/6 g Environment Simulation System Based on Magnetic Levitation Suspension. IEEE Access 2024, 12, 65716–65735. [Google Scholar] [CrossRef]
- Zhao, Z.H.; Fu, K.J.; Li, M.; Li, J.Y.; Xiao, Y. Gravity compensation system of mesh antennas for in-orbit prediction of deployment dynamics. Acta Astronaut. 2020, 167, 1–13. [Google Scholar] [CrossRef]
- Jia, J.; Jia, Y.M.; Sun, S.H. Preliminary design and development of an active suspension gravity compensation system for ground verification. Mech. Mach. Theory 2018, 128, 492–507. [Google Scholar] [CrossRef]
- Duan, M.; Jia, J.; Ito, T. Fast terminal sliding mode control based on speed and disturbance estimation for an active suspension gravity compensation system. Mech. Mach. Theory 2021, 155, 104073. [Google Scholar] [CrossRef]
- Wang, Z.H.; Zhang, L.X.; Xue, F.; Fan, Y.H.; Kong, X.X. Design and control strategy of gravity compensation system for rigid suspension-type astronauts operation training system. J. Mech. Eng. Sci. 2025, 239, 6996–7012. [Google Scholar] [CrossRef]
- Wang, Z.H.; Zhang, L.X.; Xue, F.; Chen, X.Y. Gravity compensation control strategy of astronaut microgravity operation training system. J. Astronaut. 2022, 43, 1268. [Google Scholar]
- Nevaranta, N.; Parkkinen, J.; Lindh, T.; Niemelä, M.; Pyrhönen, O.; Pyrhönen, J. Online estimation of linear tooth belt drive system parameters. IEEE Trans. Ind. Electron. 2015, 62, 7214–7223. [Google Scholar] [CrossRef]
- Parkkinen, J.; Jokinen, M.; Niemela, M.; Lindh, T.; Pyrhonen, J. Motion synchronization of two linear tooth belt drives using cross-coupled controller. In Proceedings of the 2013 15th European Conference on Power Electronics and Applications (EPE), Lille, France, 2–6 September 2013; pp. 1–7. [Google Scholar]
- Hace, A.; Jezernik, K.; Sabanovic, A. SMC with disturbance observer for a linear belt drive. IEEE Trans. Ind. Electron. 2007, 54, 3402–3412. [Google Scholar] [CrossRef]
- Han, J. From PID to active disturbance rejection control. IEEE Trans. Ind. Electron. 2009, 56, 900–906. [Google Scholar] [CrossRef]
- Wang, W.X.; Ma, J.; Cheng, Z.L.; Li, X.C.; de Silva, C.W.; Lee, T.H. Global Iterative Sliding Mode Control of an Industrial Biaxial Gantry System for Contouring Motion Tasks. IEEE/ASME Trans. Mechatron. 2022, 27, 1617–1628. [Google Scholar] [CrossRef]
- Veluvolu, K.C.; Latt, W.T.; Ang, W.T. Double adaptive bandlimited multiple Fourier linear combiner for real-time estimation/filtering of physiological tremor. Biomed. Signal Process. Control 2010, 5, 37–44. [Google Scholar] [CrossRef]
- Widrow, B.; Stearns, S.D. Adaptive Signal Processing Prentice-Hall; Prentice-Hall, Inc.: Upper Saddle River, NJ, USA, 1985; p. 52. [Google Scholar]
Disclaimer/Publisher’s Note: The statements, opinions and data contained in all publications are solely those of the individual author(s) and contributor(s) and not of MDPI and/or the editor(s). MDPI and/or the editor(s) disclaim responsibility for any injury to people or property resulting from any ideas, methods, instructions or products referred to in the content. |
© 2025 by the authors. Licensee MDPI, Basel, Switzerland. This article is an open access article distributed under the terms and conditions of the Creative Commons Attribution (CC BY) license (https://creativecommons.org/licenses/by/4.0/).