1. Introduction
Optimizing light conditions, specifically PAR, is crucial for maximizing plant growth and yield in greenhouse environments [
1]. Traditional greenhouses often rely on passive shading methods (e.g., coatings, screens) or supplementary artificial lighting, which may lack dynamic responsiveness or incur significant energy costs [
2]. Smart greenhouses aim to automate environmental control, but regulating incoming natural light dynamically, particularly reducing excessive sunlight efficiently, remains a challenge [
3,
4].
Smart window technologies offer potential solutions for active light modulation [
3]. Among these, Polymer-Dispersed Liquid Crystal (PDLC) films stand out due to their fast-switching times, high transmittance, and light-scattering properties in the opaque state, which can create beneficial diffuse light conditions for plants [
5,
6,
7]. PDLCs transition from opaque (scattering) to transparent when an AC voltage is applied, allowing for controllable light transmission [
6,
8,
9].
Previous work by the authors established a control-oriented model for PDLC films used as actuators in a feedback loop to regulate PAR levels [
10]. That study demonstrated the feasibility of using a PI controller to achieve disturbance rejection and setpoint tracking under controlled laboratory conditions using artificial light sources. A model incorporating linear dynamics and nonlinear static transmittance was proposed and validated against lab experiments.
However, the practical applicability of PDLC control systems in real-world agricultural settings necessitates validation beyond the laboratory. Natural sunlight presents far more complex and dynamic disturbances due to sun movement, varying cloud cover, and changing weather patterns. Furthermore, factors like the angle of incidence of sunlight and the specific design of the greenhouse structure can influence performance.
This paper extends the prior research by presenting results from an in situ validation and performance analysis of the PDLC control system. This work introduces several novel elements:
Experimental Setup: A dedicated Mini Greenhouse (MGH) test rig was constructed with PDLC films mounted at a 45° angle, representing average sun incidence angles relevant to the testing location (northeastern Ohio) [
11].
In Situ Validation: The system was deployed in a real greenhouse and tested over several weeks under diverse, natural environmental conditions (sunlight, clouds, rain, snow).
Performance Analysis: System performance, including setpoint tracking and real-world disturbance rejection, was evaluated at different PAR setpoints (4 PAR and 10.5 PAR) relevant to plant growth under these real-world conditions. The controllable transmittance range was characterized.
Extended Modeling and Simulation: The control-oriented model was refined based on updated system identification (including driver selection, resistor tuning, and refined dynamic and static PDLC models) and validated against the collected in situ data, incorporating a calculated structural light reduction factor.
The goal of this work is to demonstrate the robustness and practical viability of using dynamically controlled PDLC films for PAR regulation in smart greenhouses under realistic operating conditions, thereby bridging the gap between laboratory feasibility and real-world application. The validated simulation model also serves as a tool for future optimization and design.
The remainder of this paper is organized as follows:
Section 2 details the extended experimental setup and the refined control-oriented model.
Section 3 presents the results from the in situ testing and simulation validation.
Section 4 discusses the findings and their implications. Finally,
Section 5 provides concluding remarks.
2. Materials and Methods
This section details the experimental system and modeling approach used in this study, emphasizing the extensions compared to the previously published work [
10].
2.1. Control Scheme
The core feedback control scheme utilizes a PI control law implemented on a microcontroller (Arduino Due) to regulate PAR levels measured by a custom sensor, consistent with the approach in [
10].
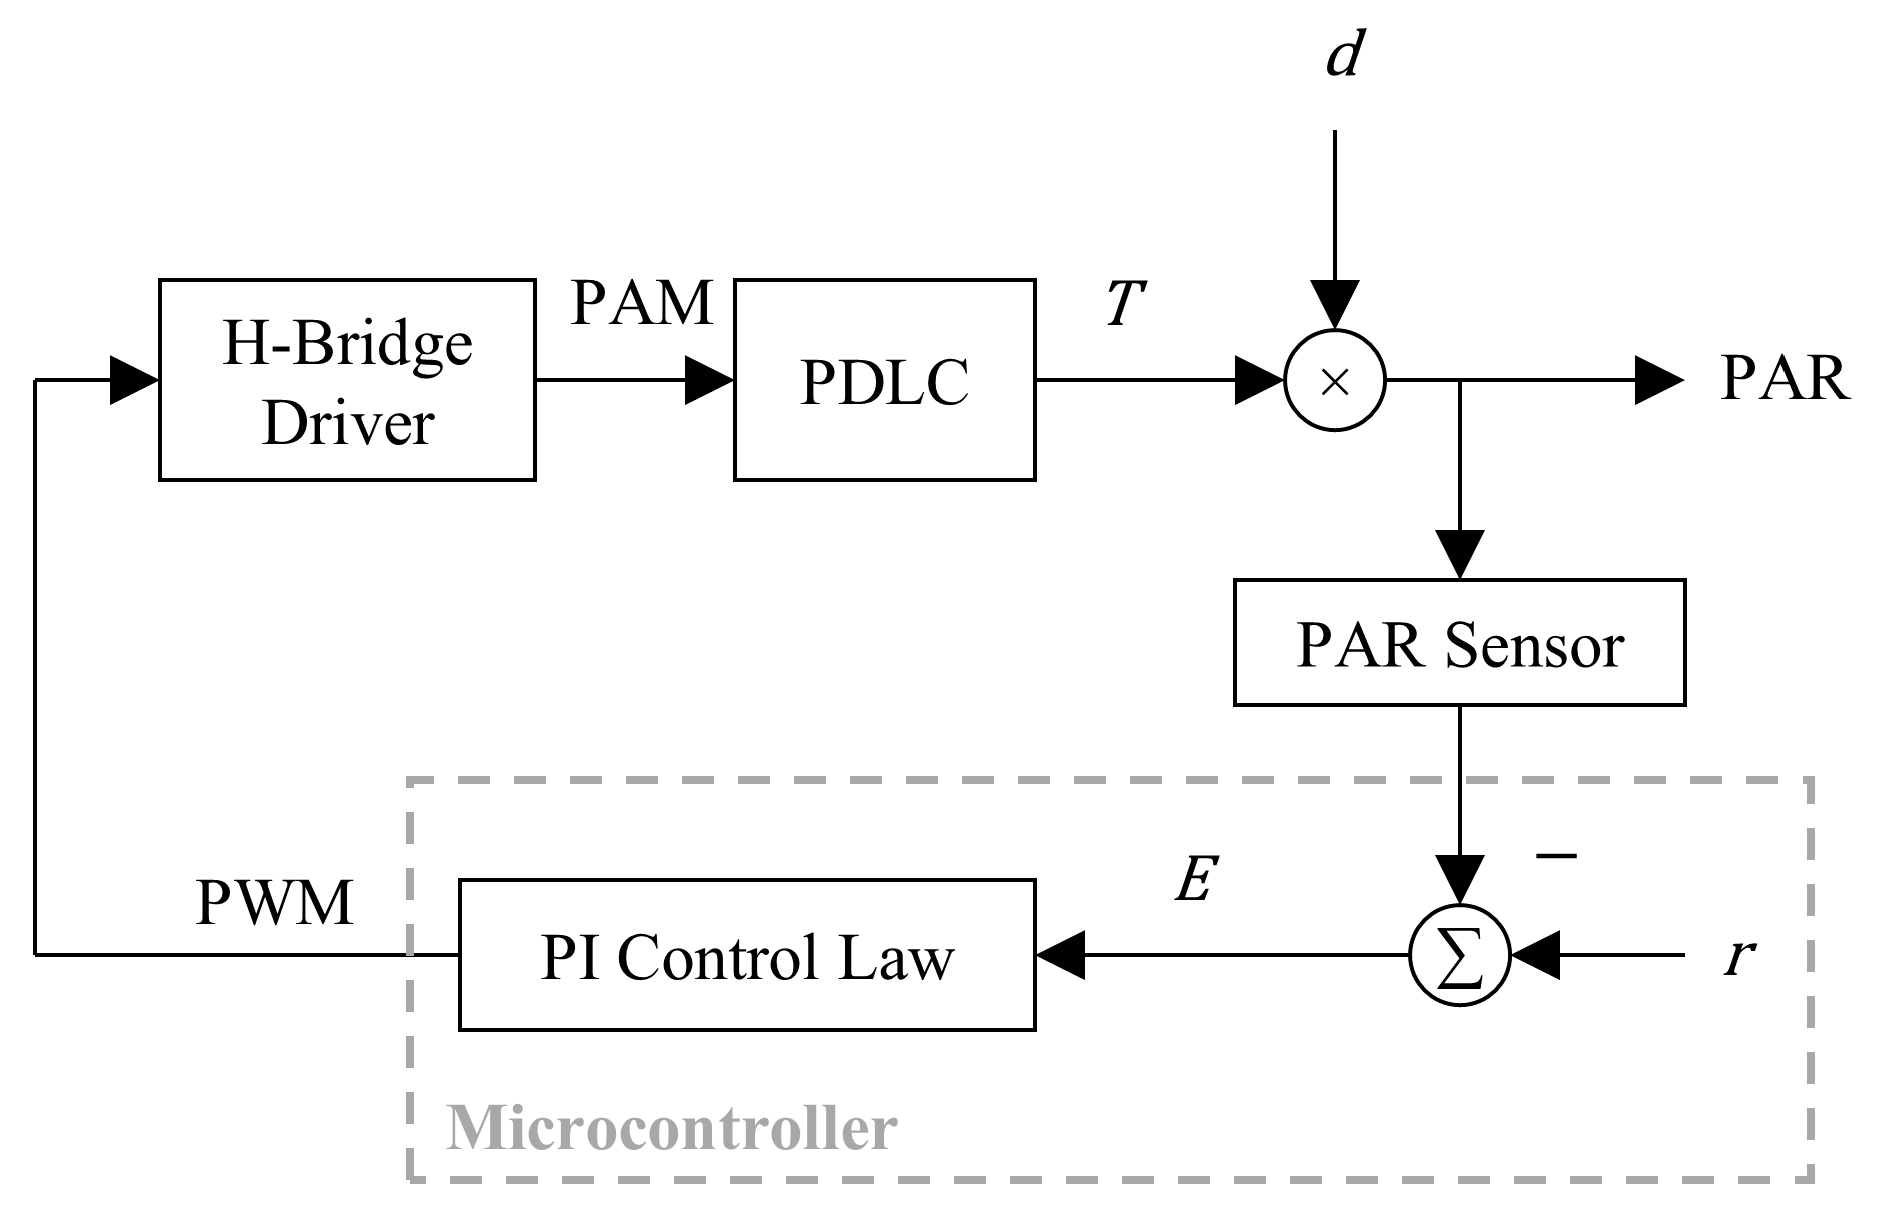
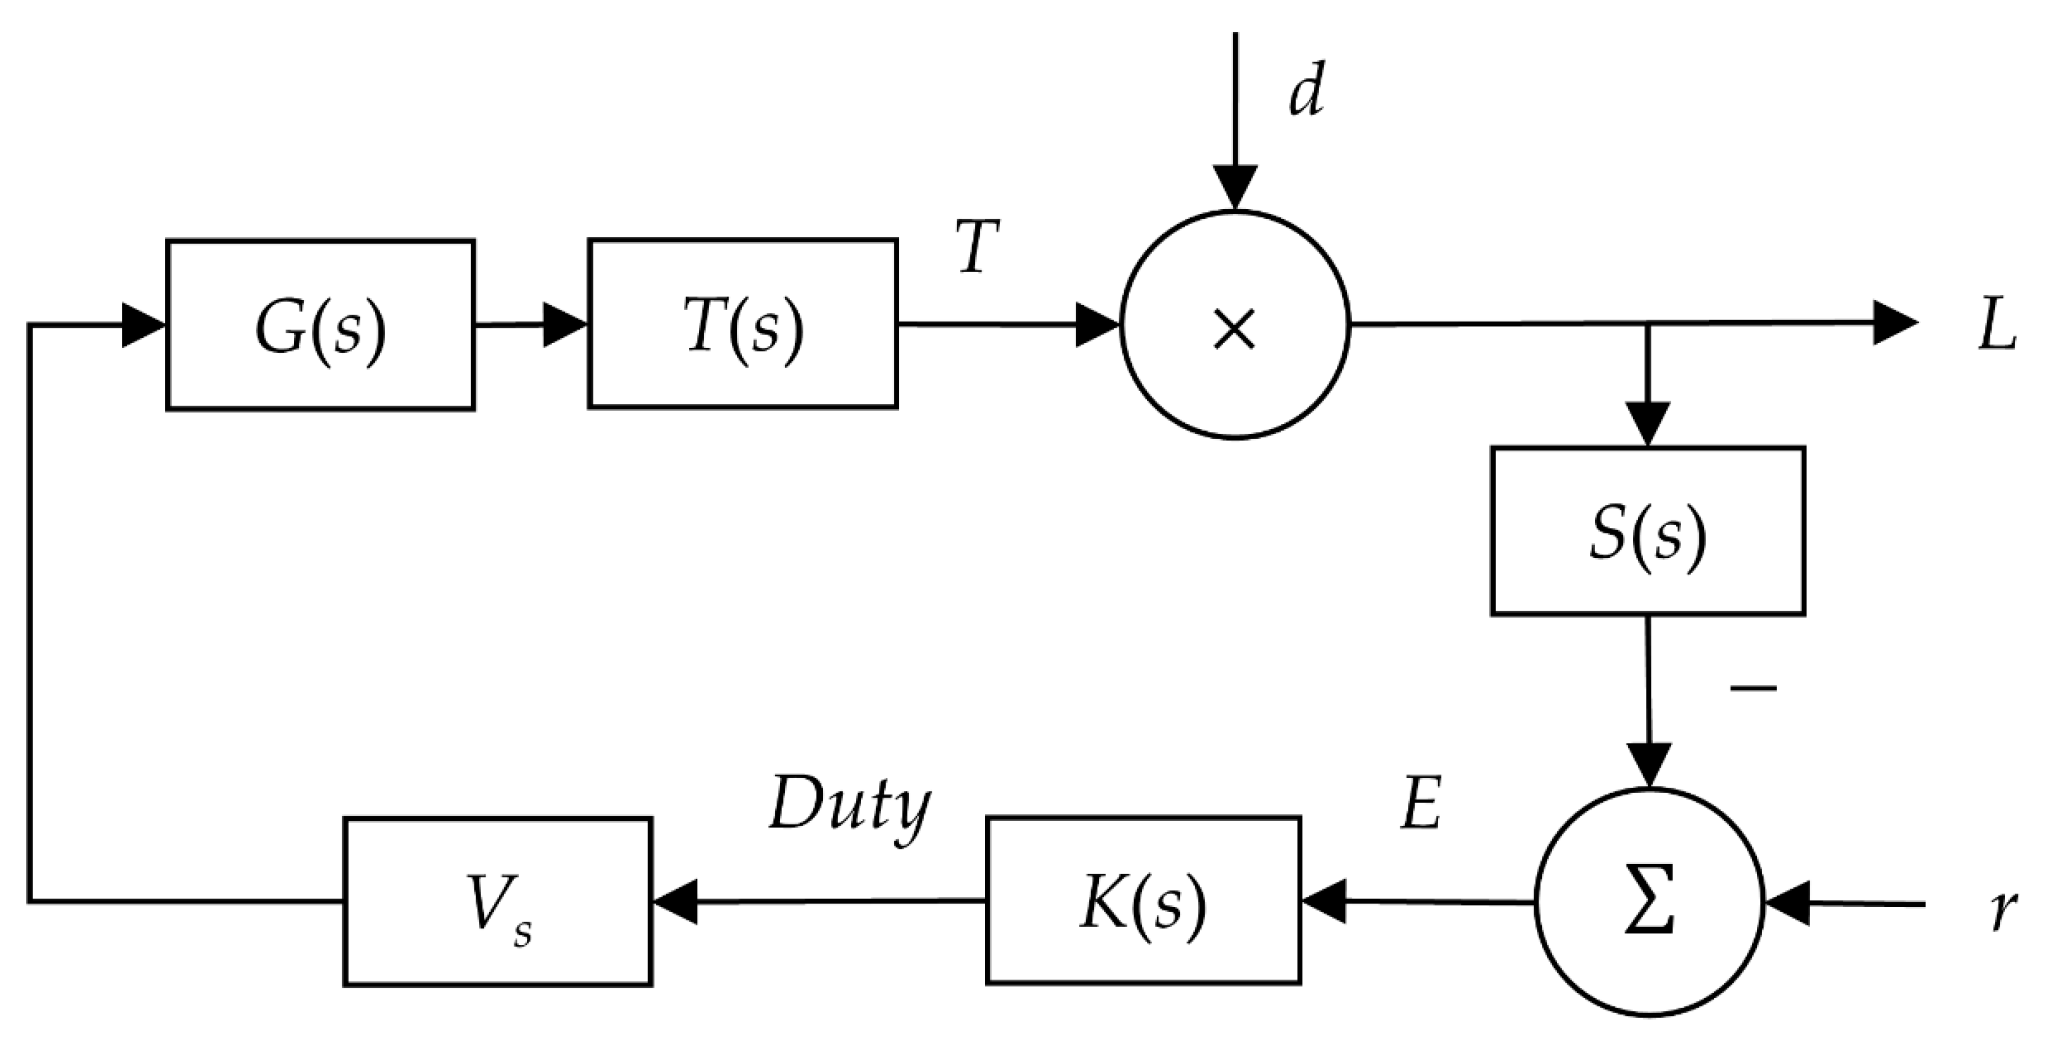
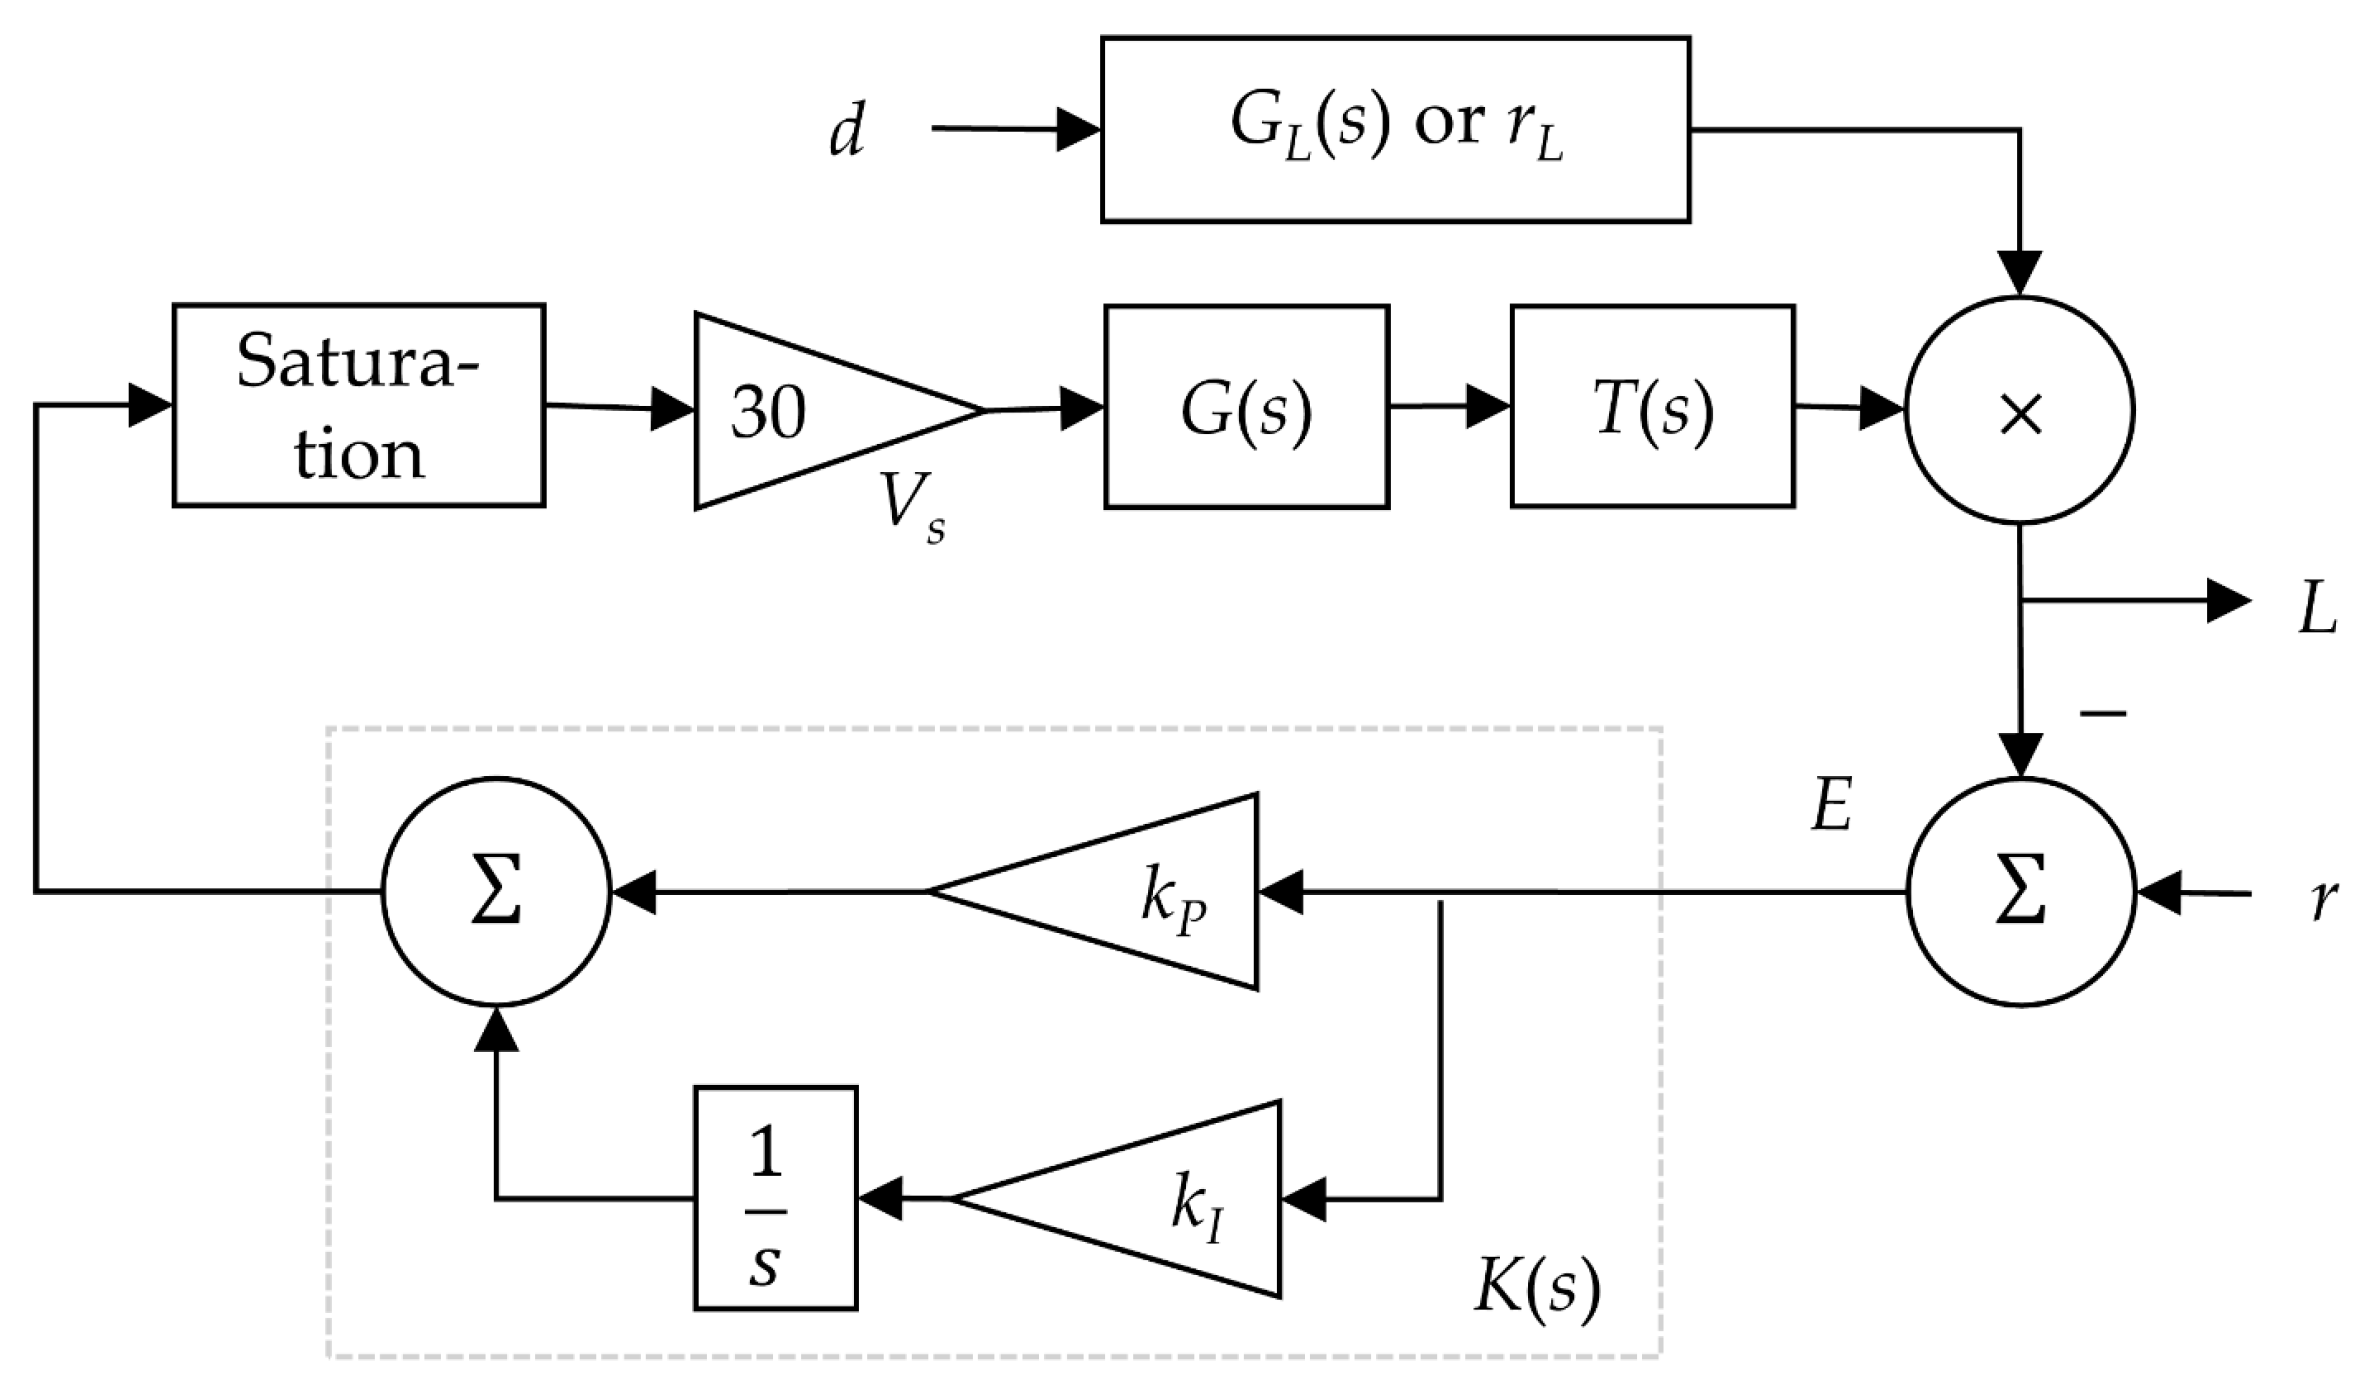
Figure 1 shows the control block diagram, illustrating the signal flow between the sensor, controller, driver, and PDLC film. The error,
E, between the desired PAR setpoint,
r, and the measured PAR signal is used to calculate a Pulse Width Modulation (PWM) control signal. This PWM signal dictates the operation of an H-bridge driver, which generates the necessary AC Pulse Amplitude Modulation (PAM) voltage to control the transmittance,
T, of the PDLC film. The measured PAR is the product of the incident light, the disturbance,
d, and the PDLC transmittance. The PI control law aims to minimize the error, thereby maintaining the desired PAR level despite variations in the disturbance.
The PI controller transfer
K(
s) is given by:
The gains were manually tuned based on experimental performance. The values used for the in situ experiments and simulations presented here are shown in
Table 1.
A derivative term was not used to avoid amplifying noise and potential flickering. The control loop and PWM generation operated at 1 kHz, producing a 100 Hz equivalent PAM frequency for the PDLC. Saturation limits were implemented on the integrator term and the final PWM output in the microcontroller code and mirrored in the simulation.
2.2. Extended Experimental Setup
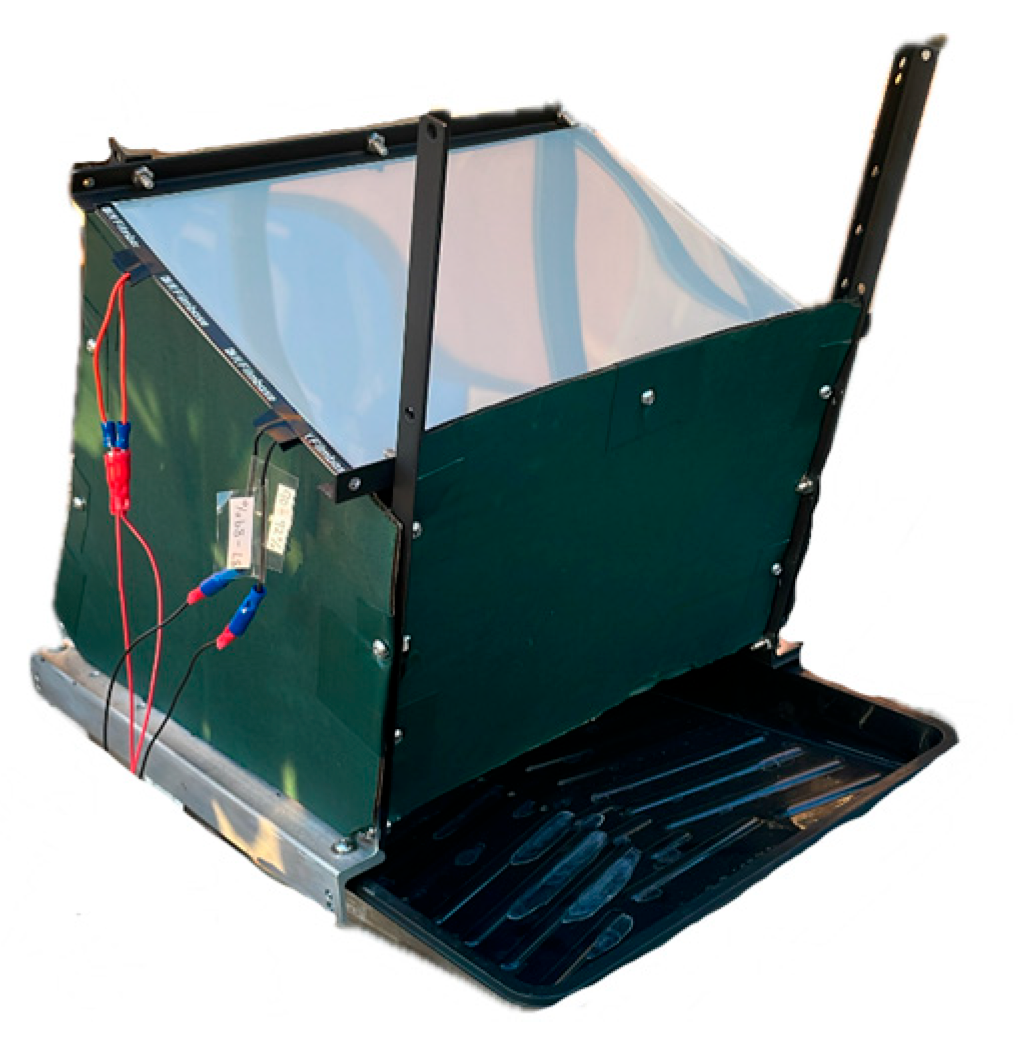
The experimental validation was performed using a custom-built Mini Greenhouse (MGH) test rig. A photograph showing the constructed MGH is presented in
Figure 2.
2.2.1. Mini Greenhouse (MGH) Structure
The MGH featured an aluminum frame (305 mm
2 base area) holding two layered PDLC film sheets (190 mm × 270 mm each, FILMBASE manufacturer, Shenzhen, China), wired in parallel. The PDLC films were mounted at a 45° angle relative to the horizontal base. This angle was chosen to approximate the average solar elevation angle in northeastern Ohio (latitude approx. 41° N) [
11], where the tests were conducted. The frame was painted black, and matte green cardboard walls were attached to minimize internal reflections. A water tray formed the base, holding the PAR sensor. For in situ tests, this PDLC-MGH was placed inside a larger greenhouse structure.
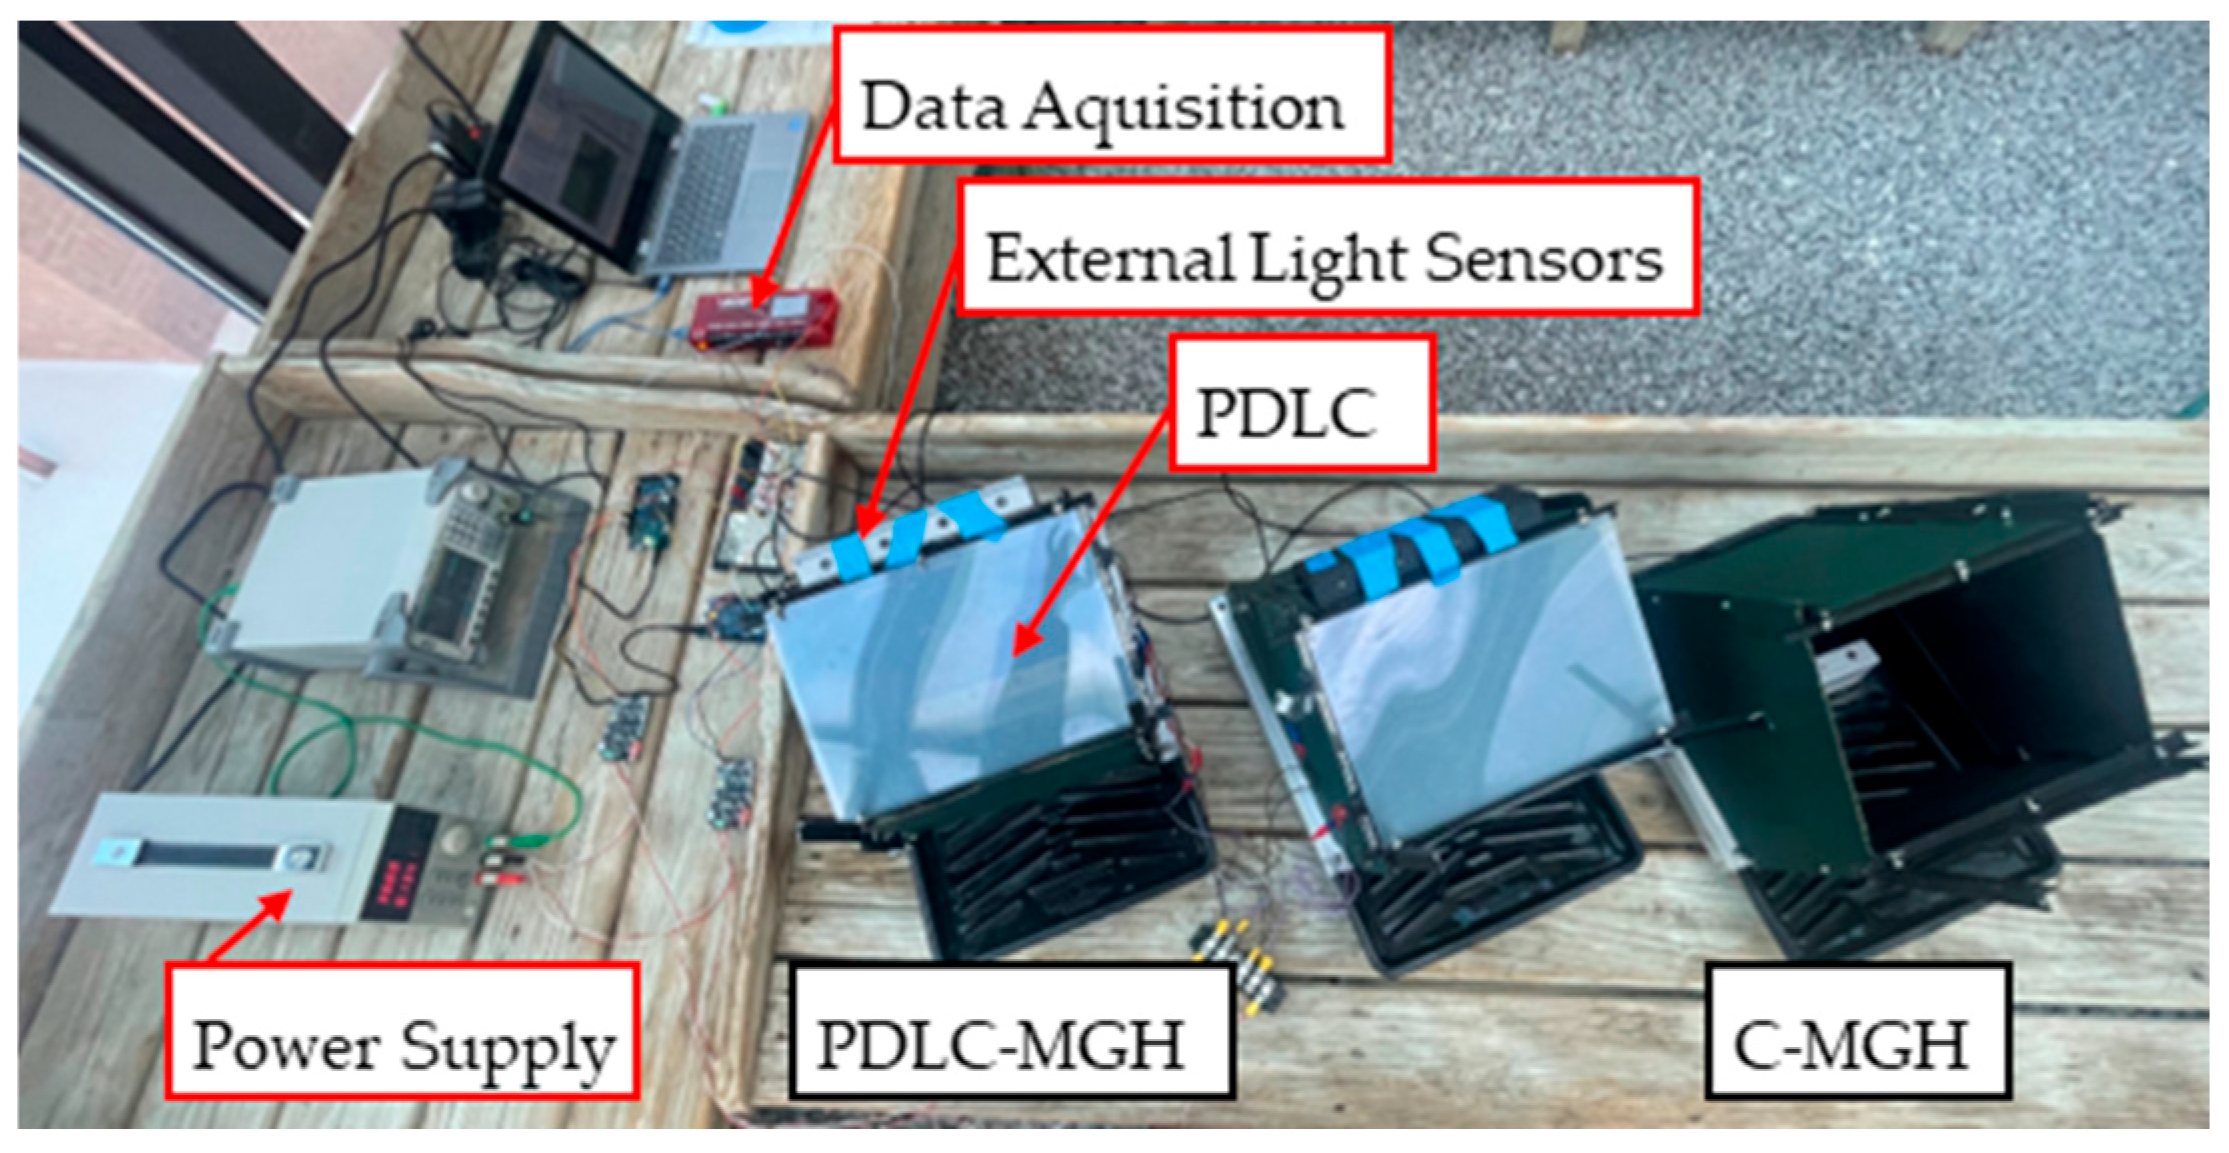
Figure 3 shows the arrangement of the MGHs and data logging equipment during the in situ tests. A second, identical MGH structure without PDLC films the Control MGH (C-MGH), was placed nearby for comparative light measurements. The third MGH was used for a different experiment and will not be further mentioned.
2.2.2. PAR Sensor
The custom PAR sensor, including the circuit design previously reported [
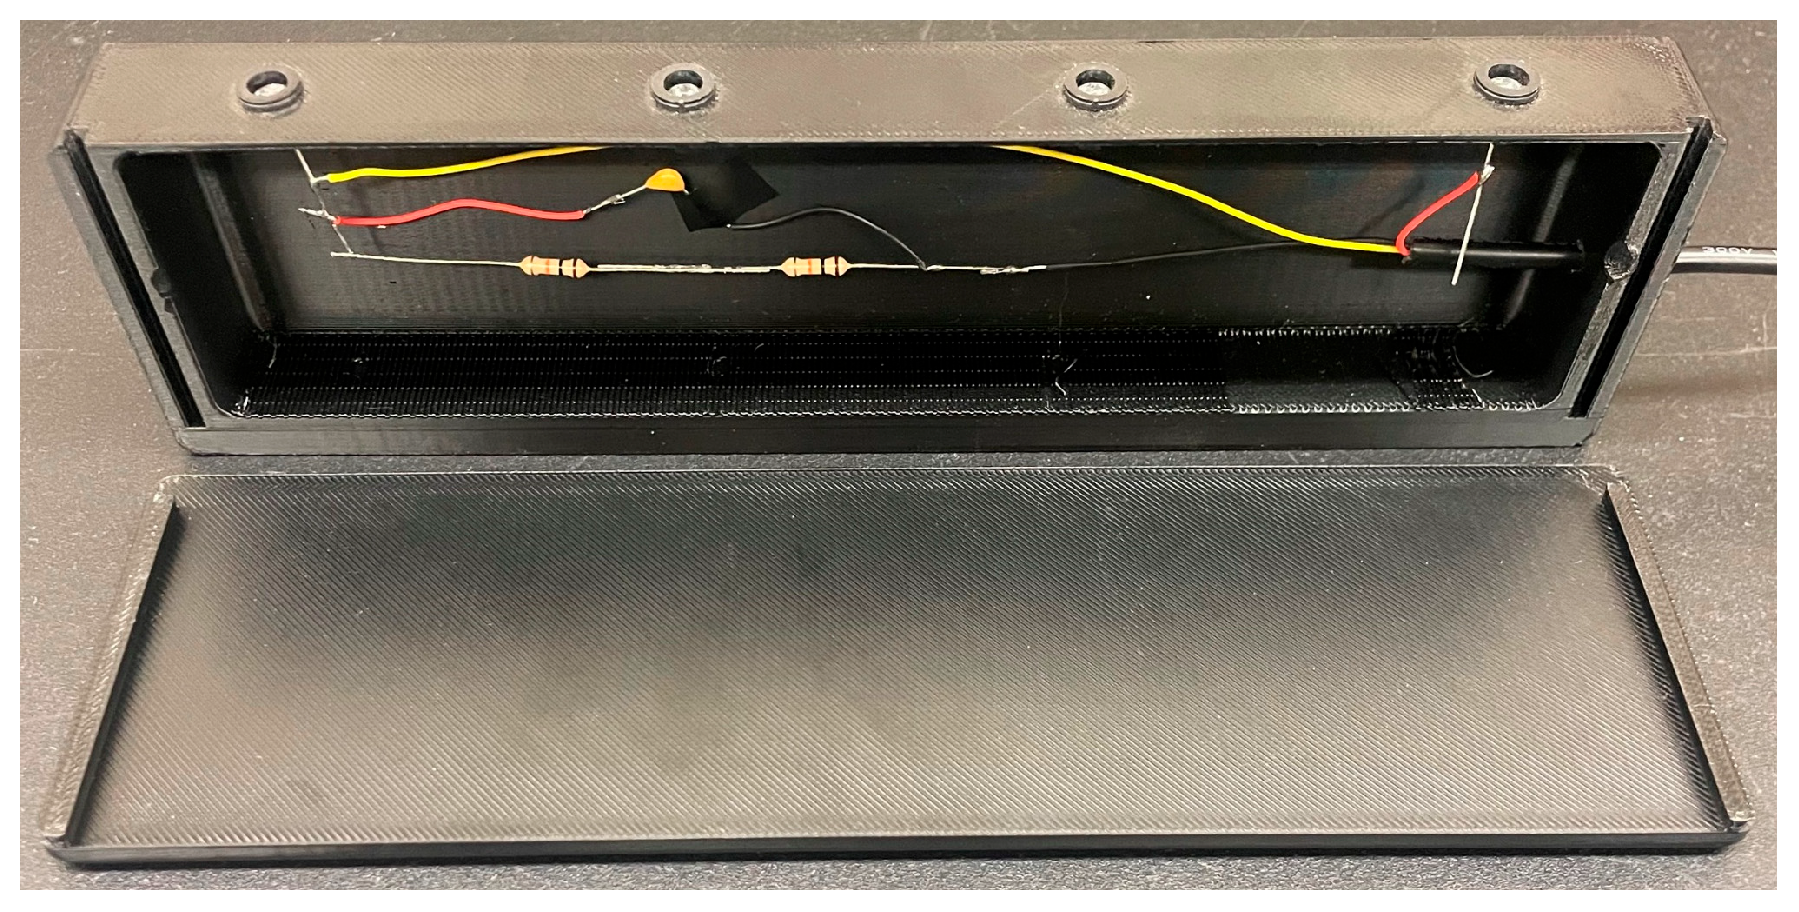
10], consists of four photodiodes (ams-OSRAM SFH 203 P) distributed within the MGH base. A photograph of the assembled sensor in its protective case is provided in
Figure 4. The photodiodes cover the PAR spectrum (400–700 nm). The sensor circuit includes two 10 kΩ resistors and a filtering capacitor of 0.1 µF and provides a voltage output proportional to the measured PAR. As detailed in previous work [
10], calibration was performed against a commercial PAR meter (AccuPAR LP-80) under natural sunlight, yielding the linear transfer function:
For in situ tests, PAR sensors were placed inside the PDLC-MGH, inside the C-MGH, and outside (on top) of the MGHs to measure incident light.
2.2.3. PDLC Electrical Circuit and Driver
The electrical circuit model assumes the two parallel PDLC films behave as a parallel resistor,
, and capacitor,
C, combination, placed in series with an external resistor,
. The equivalent circuit diagram used for modeling is equivalent to [
10]. Component values used in this study are shown in
Table 2.
The value of
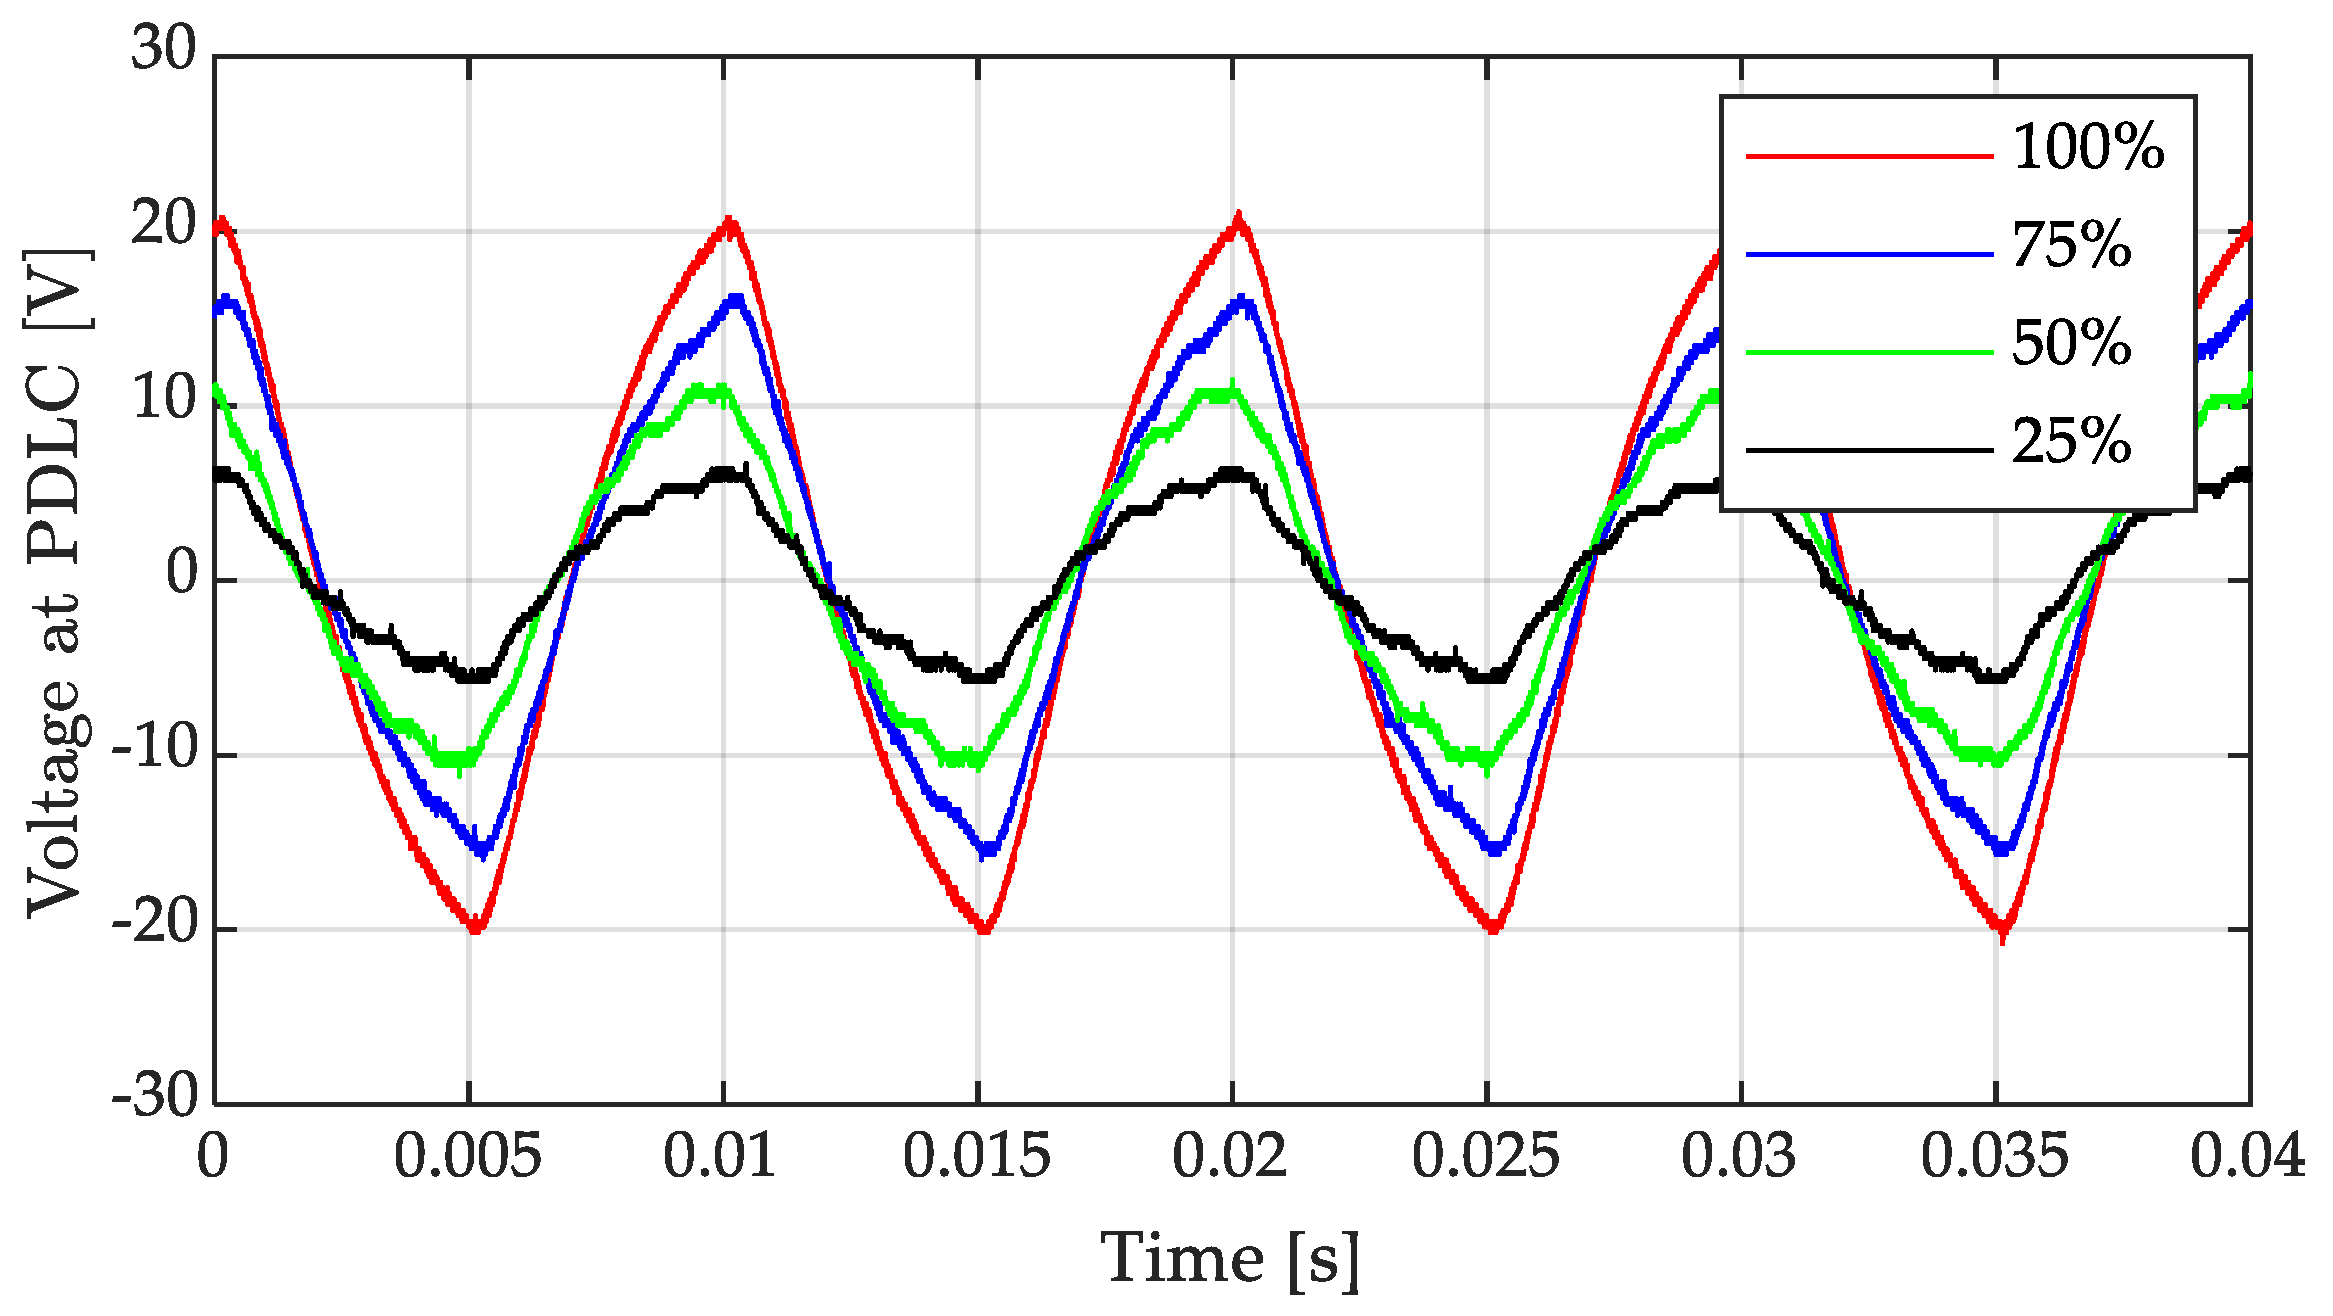
was specifically selected through testing to optimize the PAM waveform shape, waveform examples at different duty cycles are illustrated in
Figure 5 and minimize ripple across the PDLC when driven by the PWM signal.
Figure 5 shows the experimental PAM throughput voltage results. PWM is at 1 kHz for a 100 Hz PAM square wave to driver resulting in an approximate sine wave across PDLC load.
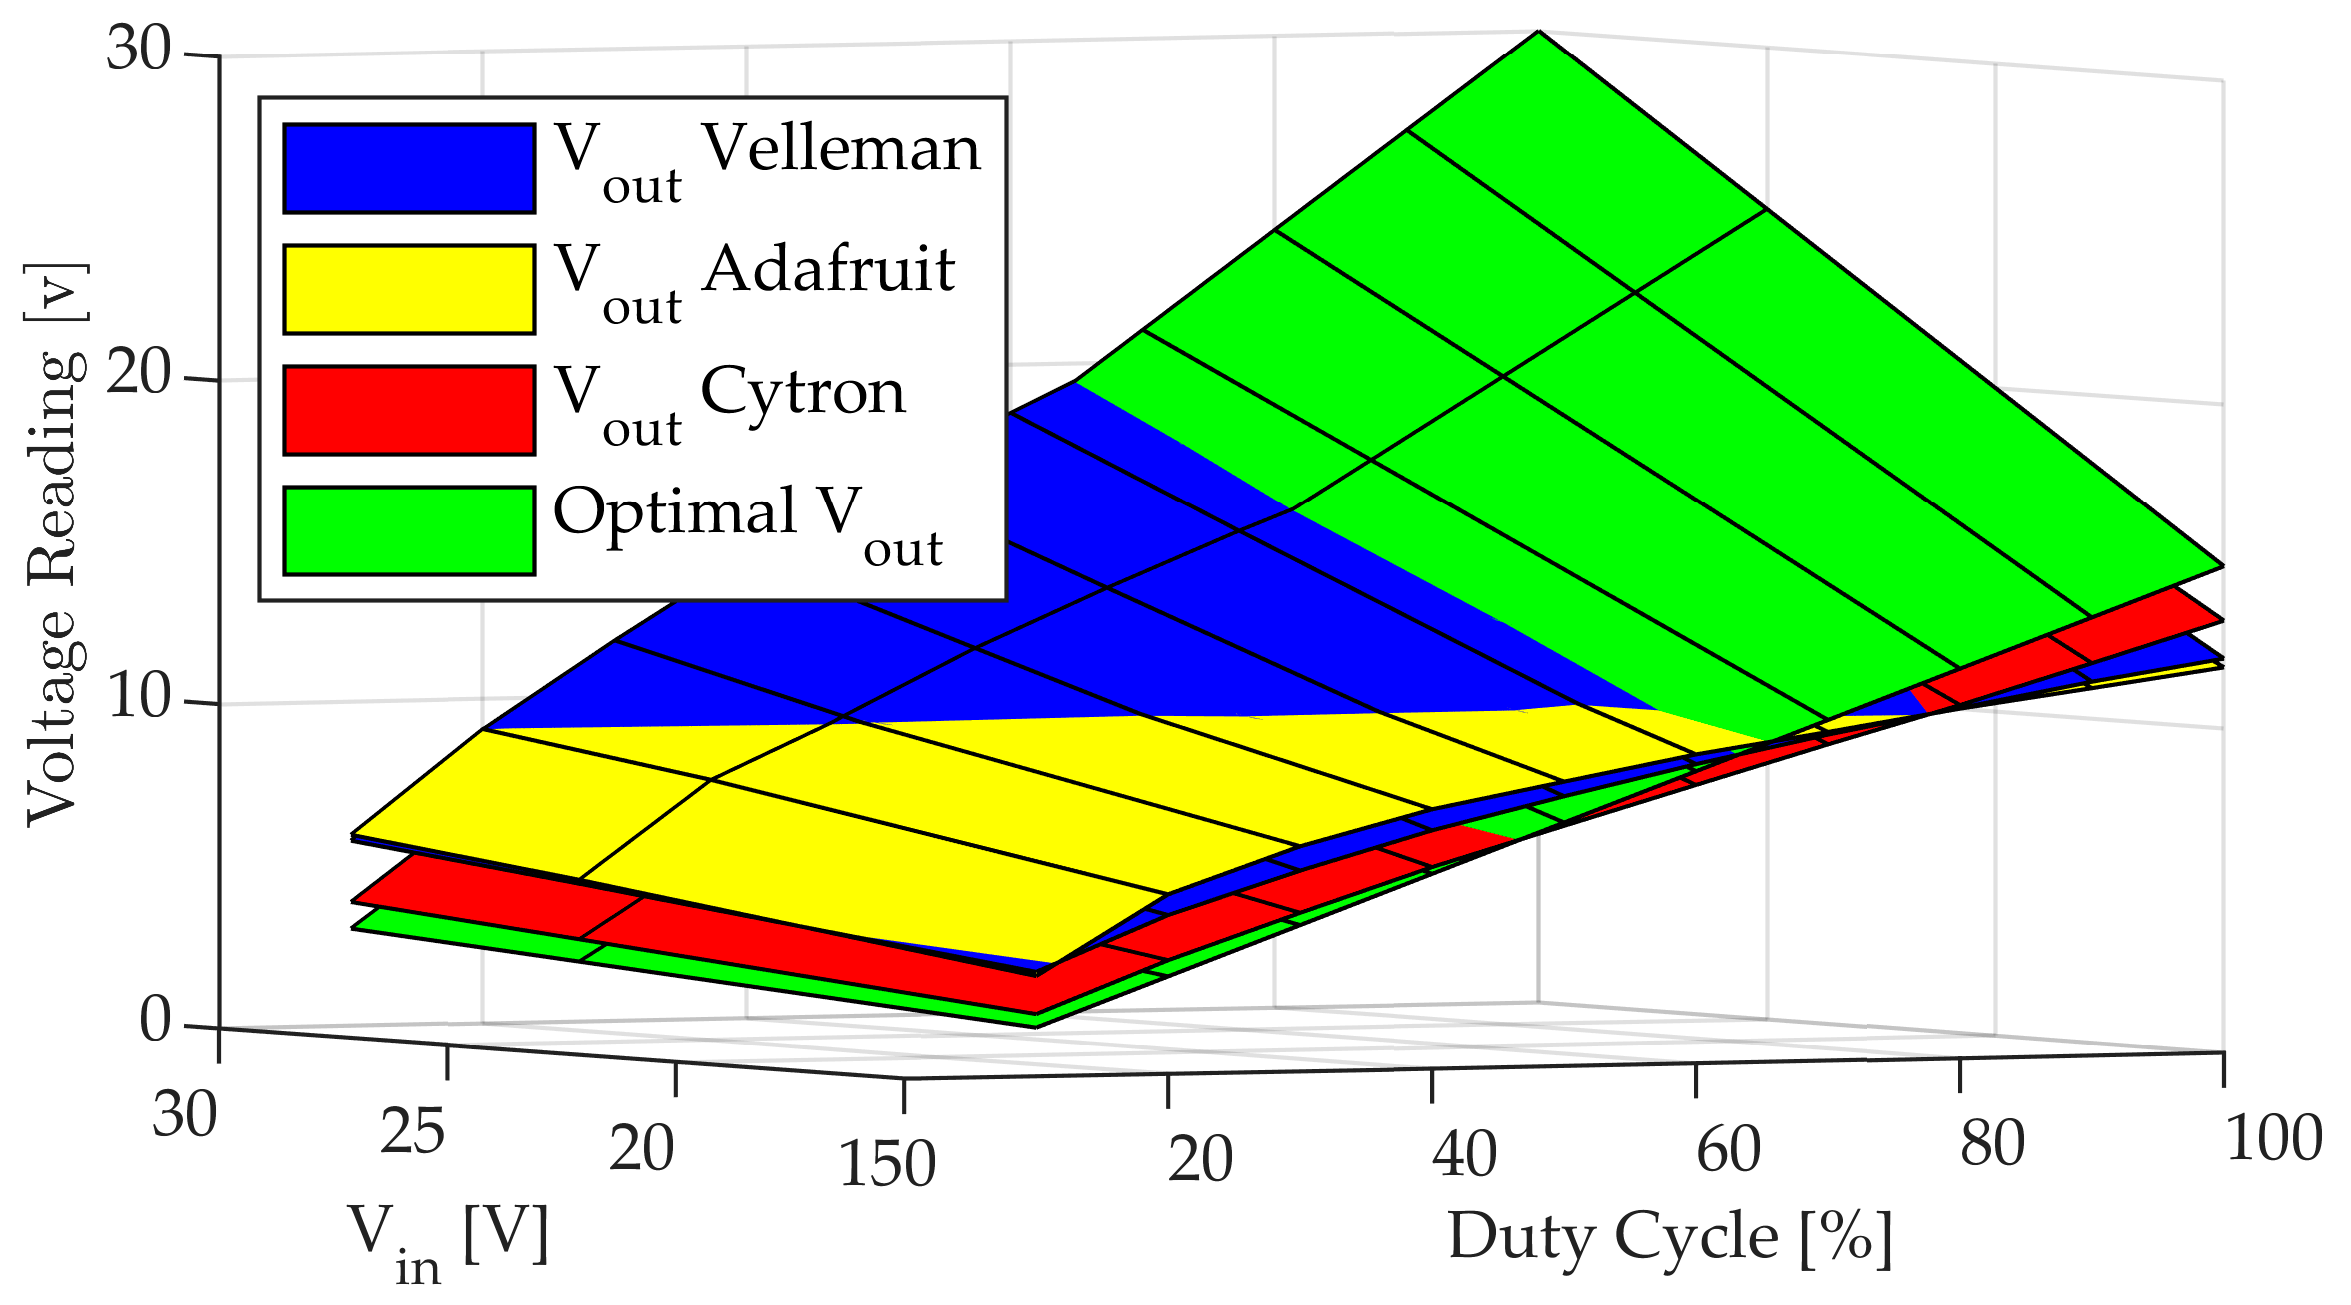
A key hardware update was the selection of the H-bridge driver. Three drivers were evaluated in this study. Their voltage output characteristics are compared in
Figure 6, with the Cytron MD10C R3 being chosen for the final experiments due to its superior performance in delivering the desired voltage amplitude compared to the Velleman KA03 used previously [
10]. The supply voltage
was set to 30 V.
2.2.4. Data Acquisition
For laboratory tests, PAR sensor data was logged using a Siglent oscilloscope. For the in situ tests, a LabJack U6 data logger was used to record PAR levels from all three sensors over extended periods.
2.3. Control-Oriented Model Refinements
The structure of the control-oriented model, conceptually shown in
Figure 7, remains the same as presented previously [
10], separating the PDLC response into a dynamic part,
G(
s), and a static transmittance part,
T(
s). The identification of these functions was refined based on data collected with the final experimental setup. Note that
S(
s) represents the PAR sensor, which is defined in
Section 2.2.2.
2.3.1. Dynamic Model
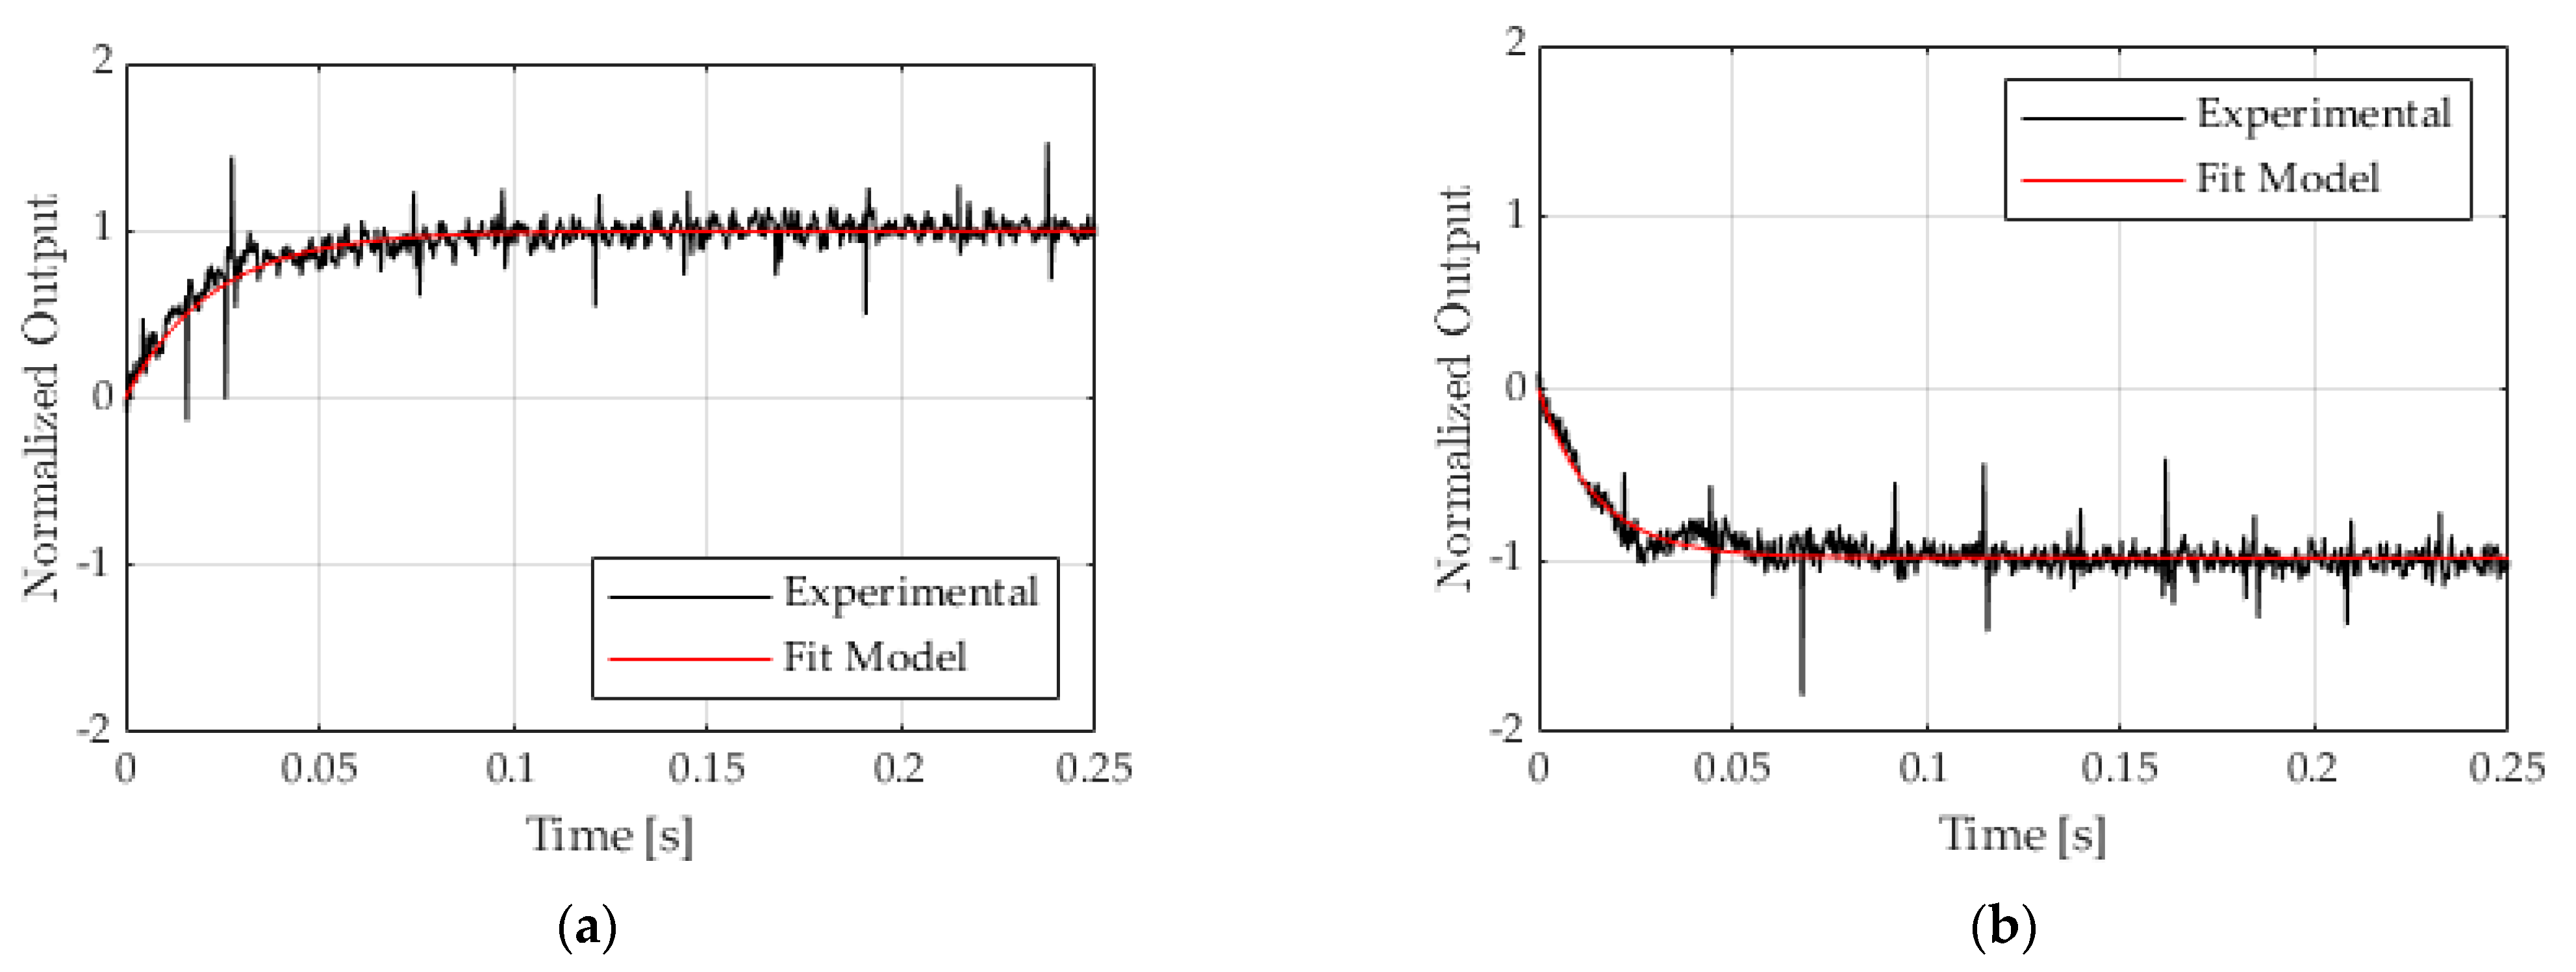
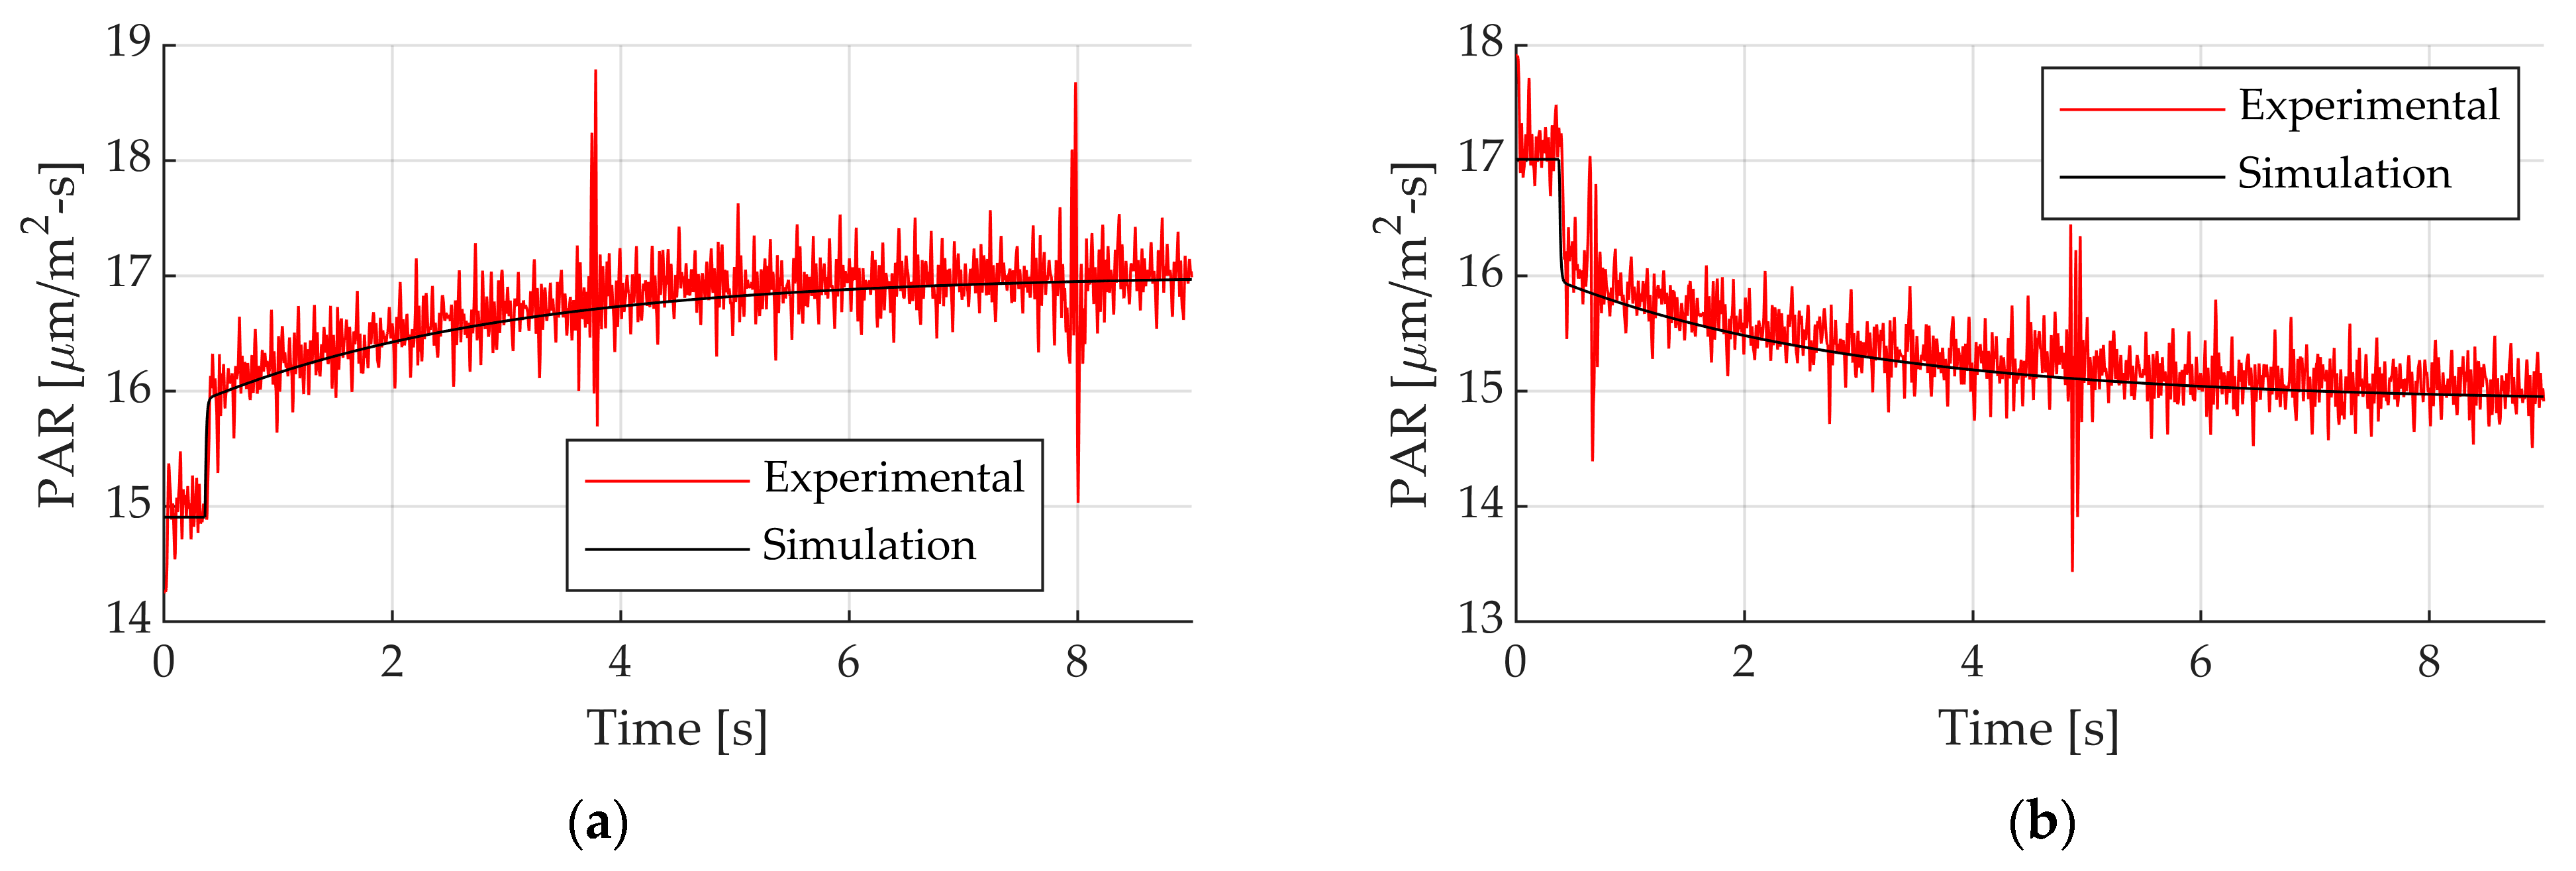
Open-loop step response tests were conducted, using 30% to 70% duty cycle steps.
Figure 8 shows the normalized experimental step response data for step-up and step-down inputs, along with the first-order simulation fit. The data is fitted to a first-order transfer function:
The averaged parameters identified were
and
. This differs from the third-order model presented in [
10].
2.3.2. Static Transmittance Model
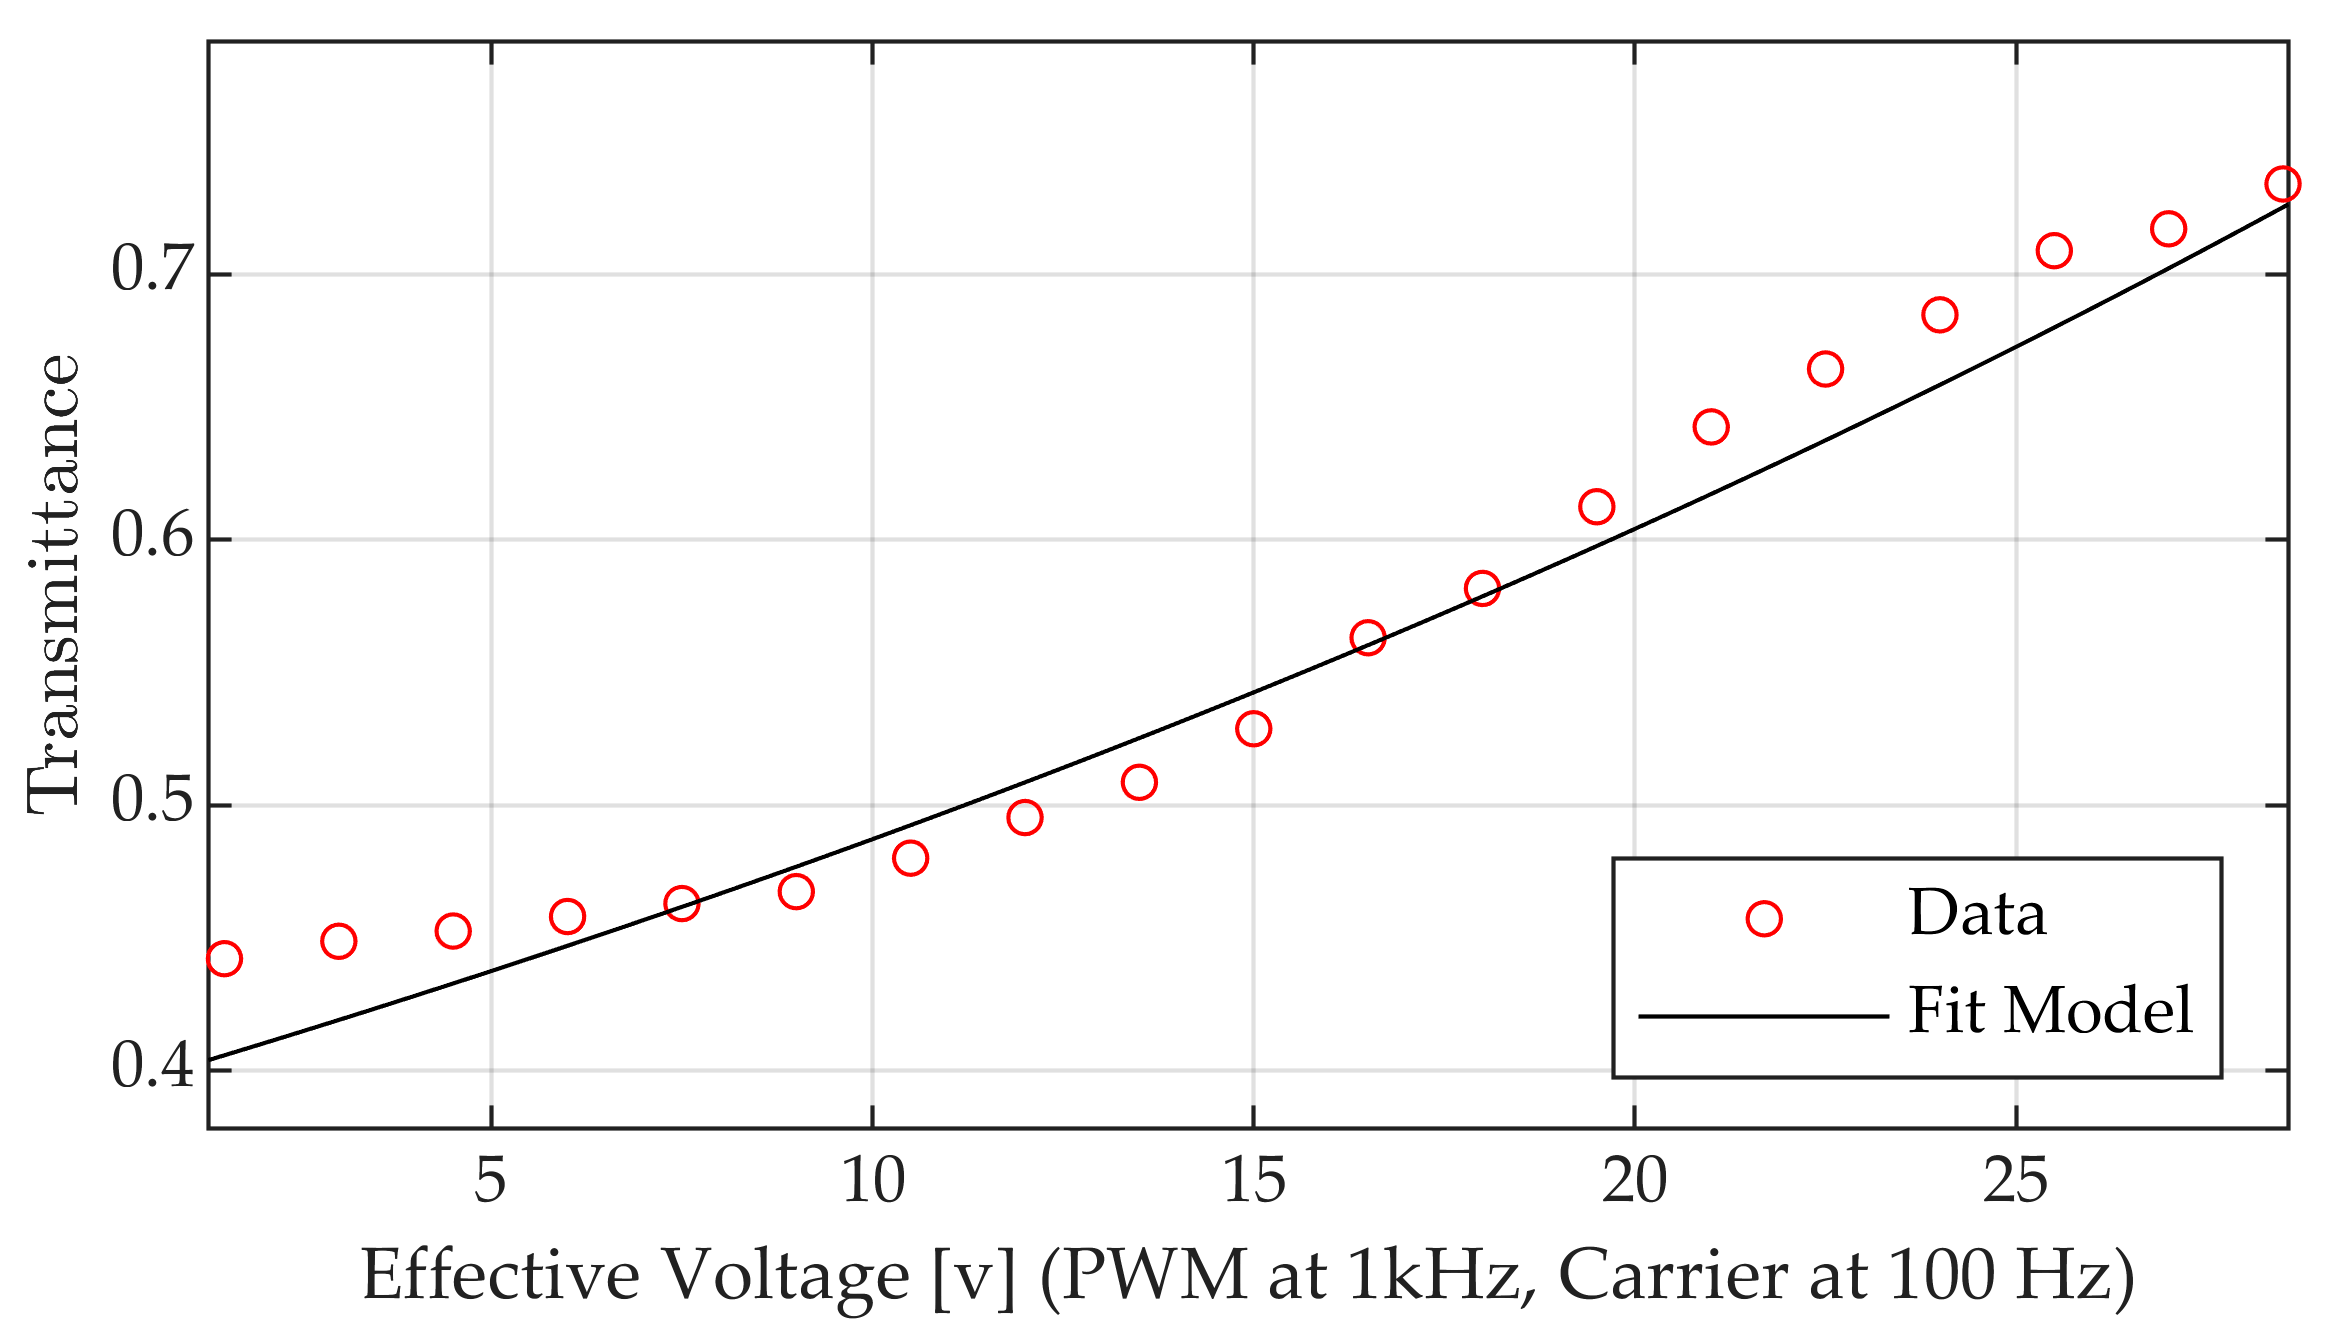
Quasistatic transmittance was measured by stepping the PAM voltage from 0 to 30 V.
Figure 9 displays the derived transmittance data points plotted against equivalent voltage and the fitted exponential model. The relationship between equivalent PAM voltage and transmittance was modeled using an exponential function:
The parameters fitted were
and
. This differs from the biquadratic rational function used in [
10]. The simpler shape can be attributed to the improved driving scheme developed in
Section 2.2.3. This leads to more consistent control over the operation range.
2.4. Simulation Setup
Simulations of the PDLC control system were performed using MATLAB (R2024a) Simulink (ode45 solver). Block diagrams illustrating the simulation structure for both laboratory and in situ conditions are provided in
Figure 10. The simulation incorporated the PI controller, supply voltage scaling (
), the dynamic model
, and the static transmittance model
.
For laboratory simulations, the dynamics of the artificial light source were modeled using a state-space system,
, given by:
However, for in situ simulations, measured outside PAR data served as the direct input disturbance history. To accurately represent the actual incident light, d, reaching the PDLC plane within the experimental setup, the measured outside PAR was scaled by a light reduction ratio . This ratio is calculated by comparing light levels inside the C-MGH to those measured outside (). The disturbance measured in the C-MGH was not used directly due to shadows that influenced the light levels; the shadows in the PDLC MGH from the beams of the greenhouse site were different than those on the C-MGH because of the 19 ½ inch distance between the MGHs. The -Factor represents the influence of the cardboard walls of the MGH test rig, such that the outside light can be used for the simulation. Initial conditions for each simulation were set to match the starting conditions of the corresponding experiment. This approach allowed the simulation to accurately reflect the conditions experienced by the PDLC within the test setup, enabling a meaningful validation against the in situ experimental data.
3. Results
This section presents key experimental and simulation results, focusing on the novel in situ validation.
3.1. Laboratory Control Performance and Simulation Validation
Initial tests revalidated the PI controller’s performance in the laboratory using the updated MGH setup. Disturbance rejection and setpoint tracking tests confirmed the controller’s ability to counteract abrupt light changes and track setpoints within approximately 7 s, consistent with [
10]. Representative experimental results for disturbance rejection and setpoint tracking tests in the laboratory are shown in
Figure 11 and
Figure 12.
The simulation model was validated against laboratory data, showing close agreement for both disturbance rejection and setpoint tracking tests. This confirms the simulation’s ability to replicate behavior under controlled conditions.
Figure 11 and
Figure 12 compare the simulated outputs directly against the experimental data for lab disturbance rejection and setpoint tracking.
3.2. In Situ Performance Under Natural Light
Extensive in situ testing of the PDLC control system was conducted over several weeks in a real greenhouse environment to evaluate its performance under natural light conditions. Representative days with varying cloud cover and weather were analyzed to characterize the system’s ability to maintain desired PAR setpoints.
The PDLC control system’s performance was evaluated in the greenhouse environment over several weeks, focusing on representative days for two primary PAR setpoints: 4 PAR and 10.5 PAR.
3.2.1. Performance with 4 PAR Setpoint
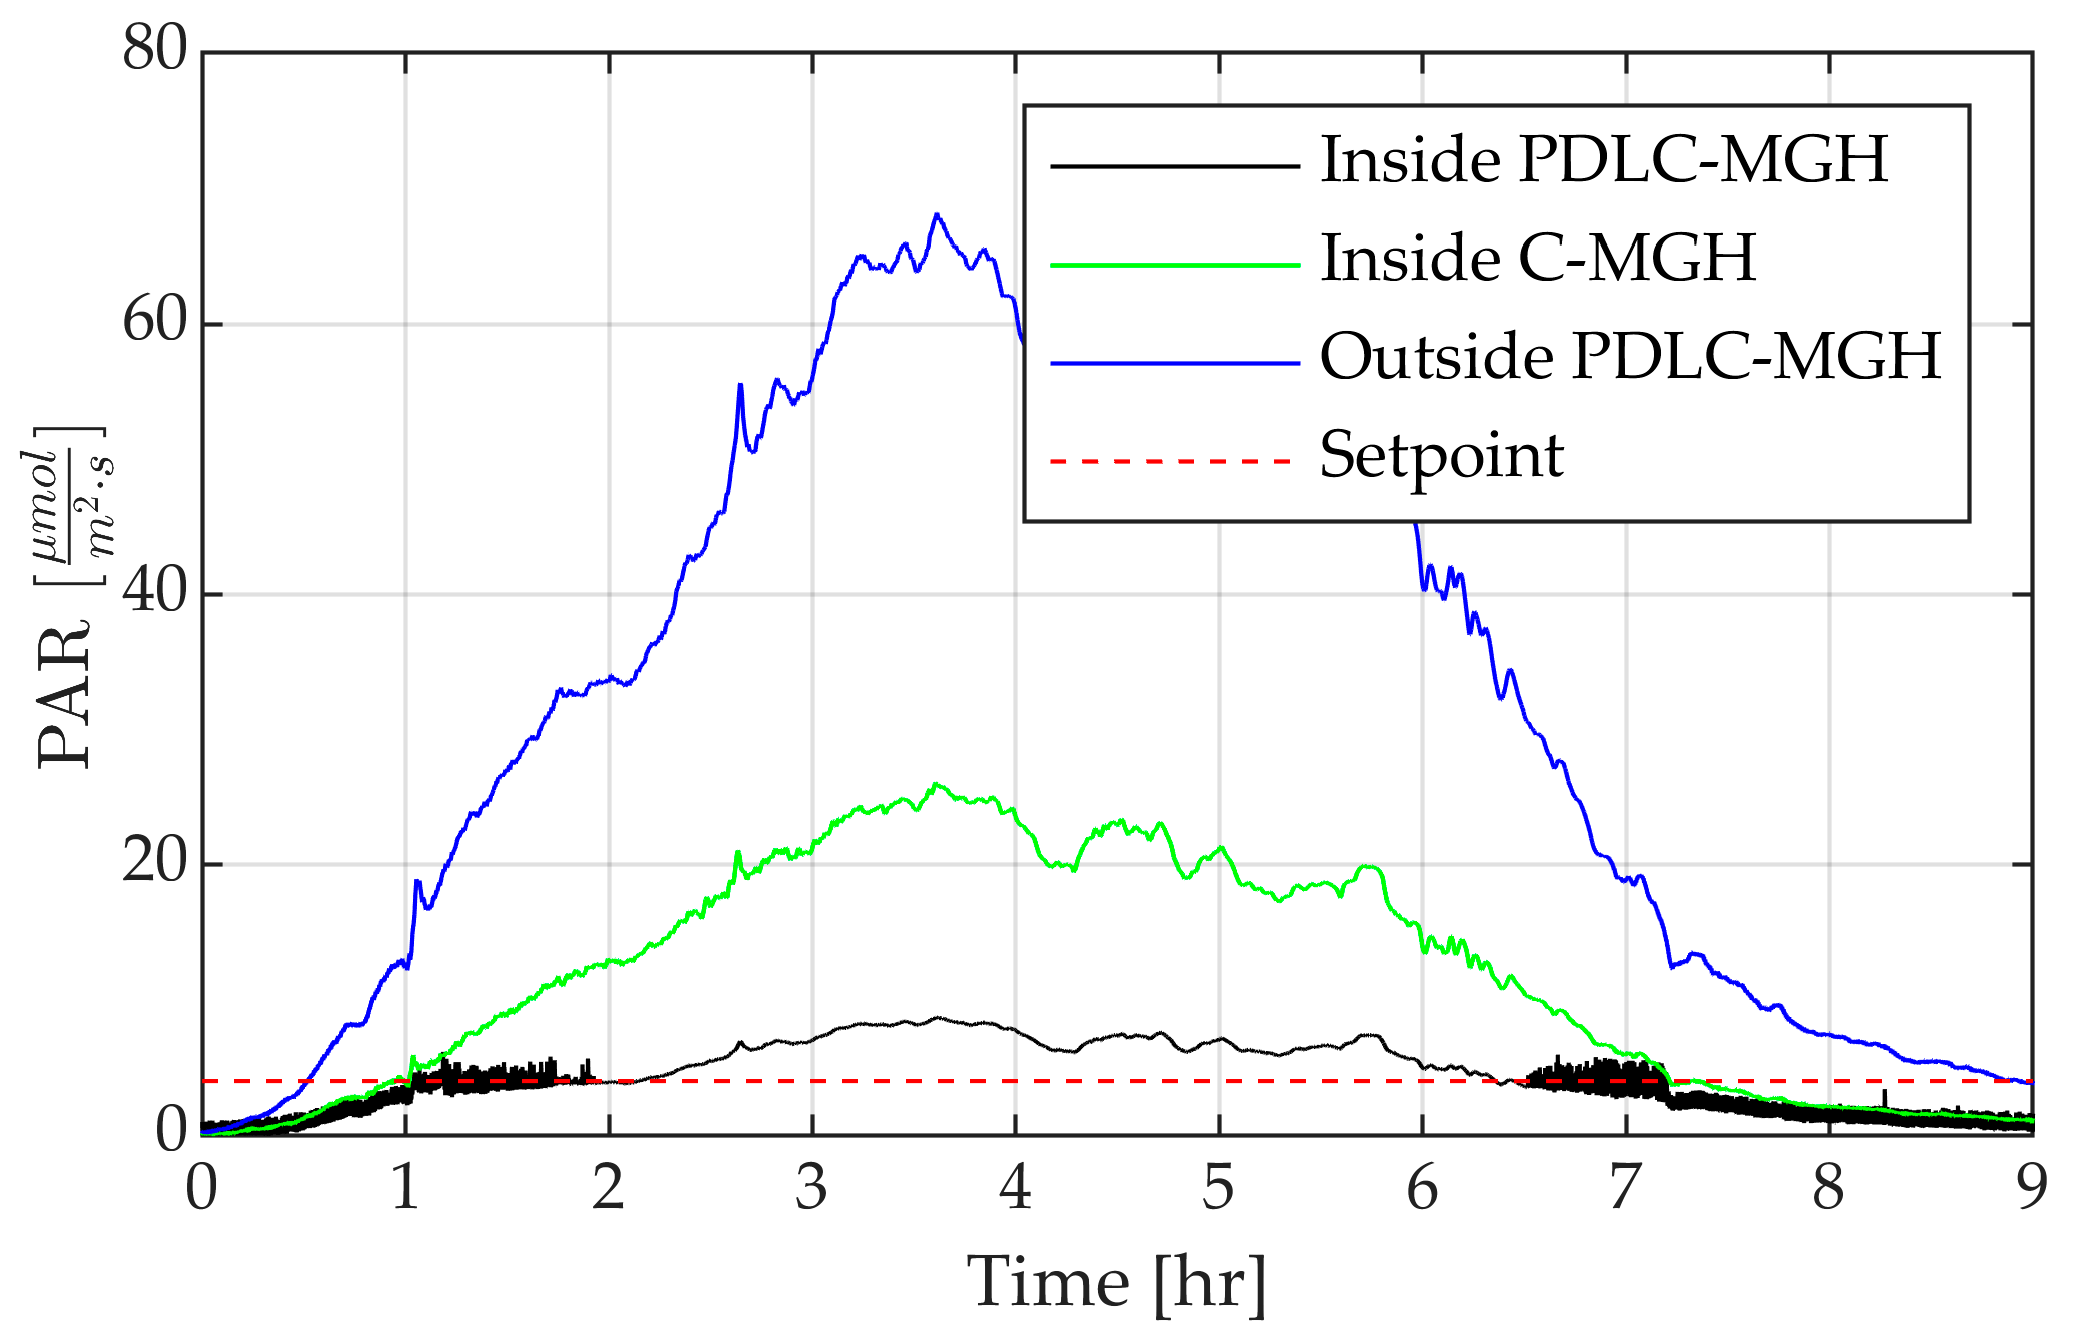
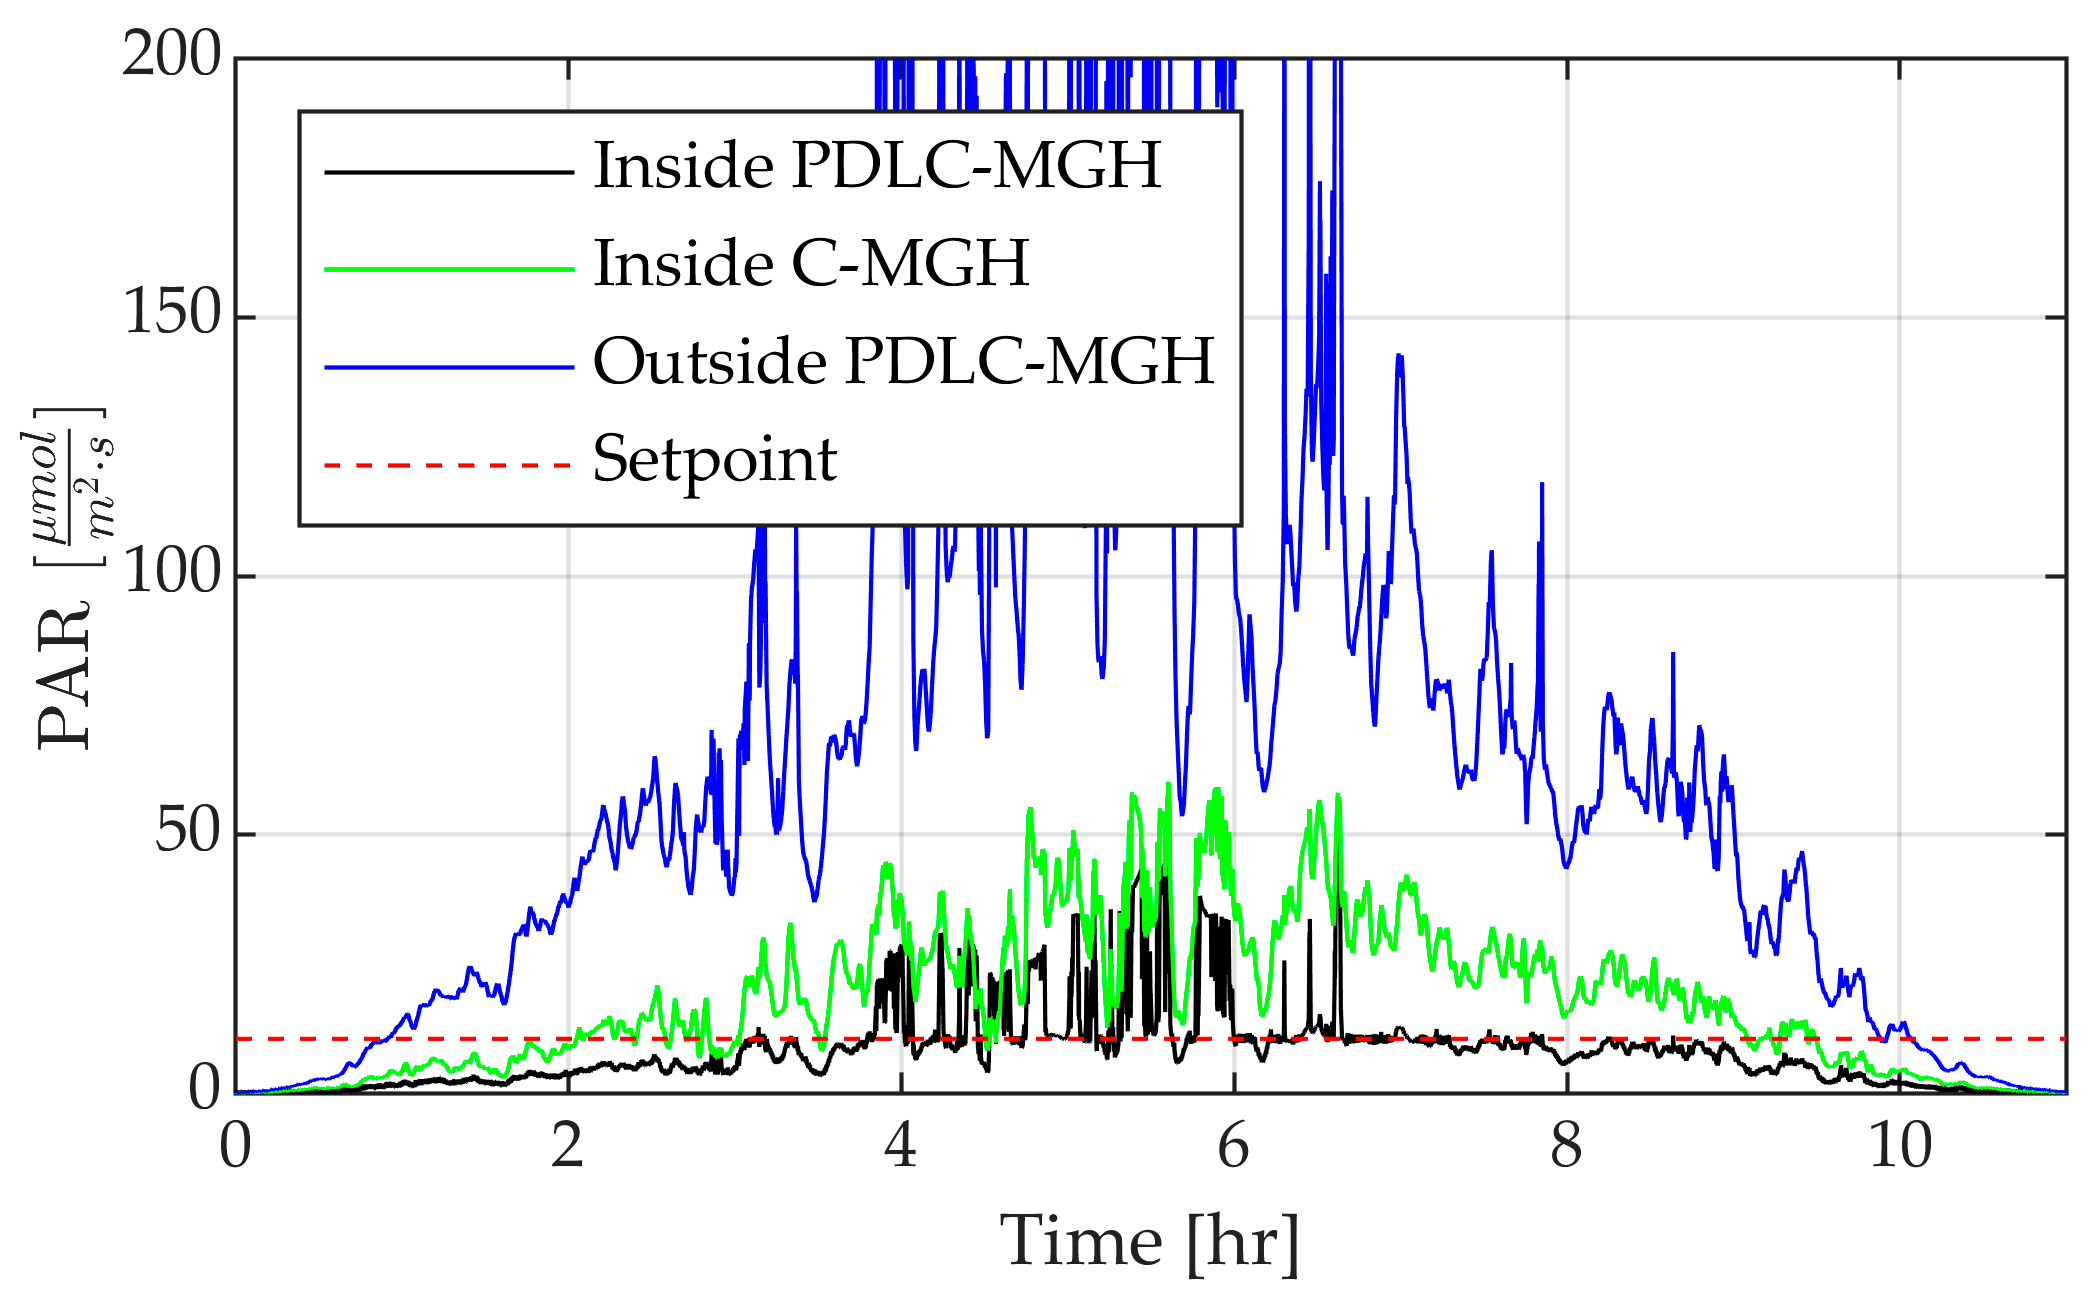
With a setpoint of 4 PAR, the controller effectively maintained the target PAR level when incident light ranged between approximately 12 and 33 PAR. This demonstrated the system’s ability to compensate for natural fluctuations caused by clouds. This performance corresponded to a required PDLC transmittance range of approximately 33.3% to 80%, referenced to the light levels measured in the Control Mini Greenhouse (C-MGH) as shown
Figure 13 on a cloudy day. Between 1 and 2 h and again around 6.5 to 7.25 h (dusk and dawn), the outside light is in the controllable range, and the setpoint is achieved. In those time ranges, the PI control law responds with a request voltage which accumulates to a value between 0 and 30 v which results in zero error. However, in other time ranges, the error signal is limited by an anti-windup logic such that the request voltage saturates at either 0 or 30 v.
3.2.2. Performance with 10.5 PAR Setpoint
At a higher setpoint of 10.5 PAR, the controller continued to show robust tracking. Under conditions with highlight fluctuations as shown in
Figure 14, the system’s controllable range corresponded to outside incident PAR levels of roughly 60 PAR to 120 PAR. This required a transmittance between approximately 27% and 61%, referenced to the C-MGH light. Notably, the 10.5 PAR setpoint demonstrated a wider controllable incident light range of approximately 60 PAR, compared to the 4 PAR setpoint which is at approximately 21 PAR.
3.2.3. Structural Light Reduction Factor
Comparison between PAR outside the MGHs and inside the C-MGH yielded a consistent light reduction ratio of , attributed to the GH site structure as mentioned.
3.3. Simulation Validation (In Situ Conditions)
The simulation model was validated using in situ data. Comparisons showed strong agreement between simulated and experimentally measured PAR under the PDLC for both setpoints under dynamic real-world conditions.
Figure 15a,b present the simulation results overlaid with experimental data for the 4 PAR and 10.5 PAR setpoint tests, respectively. The simulation accurately captured key aspects of the system’s behavior, including periods of regulation, saturation limits, and responses to fluctuating incident light, thereby confirming the robustness and predictive capability of the model.
4. Discussion
The results significantly extend the validation of PDLC films for dynamic light control in smart greenhouses beyond the laboratory [
10]. The in situ testing provides crucial insights into real-world performance under complex, natural disturbances. The PI control scheme successfully regulated PAR levels under fluctuating natural sunlight, tracking both low (4 PAR) and moderate (10.5 PAR) setpoints within the PDLC’s modulation range. This confirms the potential for creating specific, stable light environments adaptable to external conditions.
The characterization of the controllable PAR range revealed operational limits. The observed in situ transmittance range (roughly 27–80%) aligns reasonably well with lab measurements. Higher PAR setpoints correspond to wider controllable ranges of incident light, suggesting better applicability for brighter conditions.
The identification of the structural light reduction factor was critical for validating the simulation with this test rig and highlights the importance of mini greenhouse and big greenhouse geometry. The successful validation of the simulation against in situ data confirms that the control-oriented model accurately captures real-world behavior. This validated simulation is a powerful tool for prediction, optimization, and future development.
Compared to the previous publication [
10], this work provides essential real-world validation, confirms robustness against complex disturbances, and provides data on relevant operational ranges. Hardware refinements and updated models also represent advances. Limitations include testing primarily during lower-light winter months and the specific MGH geometry.
5. Conclusions
This study successfully extended previous laboratory work [
10] by demonstrating the in situ performance and validating a refined control-oriented model of a PDLC-based dynamic light control system for smart greenhouses. Experiments under natural, fluctuating environmental conditions showed the PI-controlled system effectively regulated PAR levels. Key contributions include testing with an angled PDLC setup, performance evaluation under real-world conditions at multiple PAR setpoints, characterization of the controllable light range, and validation of an extended simulation model using in situ data.
The findings confirm the practical viability of using PDLC films as actuators for dynamic PAR control in agricultural settings, offering potential for more energy-efficient and precisely controlled environments. The demonstrated technology can be utilized in a smart greenhouse for applications such as (1) optimizing natural lighting conditions for maximized plant growth, (2) replacing artificial growing lights with more power efficient PDLCs, and (3) conducting seed germination experiments. The validated simulation model provides a valuable tool for future system design and optimization. This work establishes a strong foundation for applying PDLC technology in smart agriculture.
Future work should include testing with a full PDLC MGH during higher irradiation periods, investigating newer materials for PDLCs and drivers, and conducting long-term plant growth studies in a full-scale PDLC smart greenhouse.
