Abstract
To improve the output displacement of piezoelectric actuators, a linear piezoelectric actuator based on a multistage amplifying mechanism with a small volume, large thrust, high resolution, high precision, and fast response speed is proposed. However, inherent nonlinear characteristics, such as hysteresis and creep, significantly affect the output accuracy of piezoelectric actuators and may cause system instability. Therefore, a complex nonlinear hysteresis mathematical model with a high degree of fit was established. A Play operator was introduced into the backpropagation neural network, and a genetic algorithm (GA) was used to reduce the probability of the fitting of the neural network model falling into a local minimum. Moreover, simulation and experimental test platforms were constructed. The results showed that the maximum displacement of the actuator was 558.3 μm under a driving voltage of 150 V and a driving frequency of 1 Hz. The complex GA-BP neural network model of the piezoelectric actuator not only exhibited high modeling accuracy but also solved the problems of strong randomness and slow convergence. Compared with other control algorithms, the GA-BP fuzzy PID control exhibited higher control precision.
1. Introduction
Piezoelectric actuators use the inverse piezoelectric effect of piezoelectric materials to convert electrical energy into mechanical energy to achieve movement output, and they are widely used in fields such as robotics [1], precision instrumentation [2], nanoscale positioning [3], and bioengineering [4].
Linear piezoelectric actuators use an amplification mechanism to amplify the axial deformation of a piezoelectric ceramic stack to actuate an object. Various linear piezoelectric actuators have been developed for this purpose. Gao et al. [5] proposed an inchworm-type piezoelectric actuator with adaptive clamping ability based on the feedback control of a photoelectric sensor and a permanent magnet; a maximum thrust of 15 g was achieved by the actuator under excitation voltage with an amplitude of 150 V and a frequency of 40 Hz. He et al. [6] developed a linear piezoelectric motor with variable stiffness and asymmetric resonance. Under the excitation of a 240 Vp-p first-order resonance signal, the corresponding output speeds of the motor prototype were 16.116, 20.457, and 25.015 mm/s. When the stiffness adjustment positions were at 2 mm, the maximum load of the motor prototype reached 450 g. Piezoelectric linear actuators have important applications in the field of lens movement and focusing, and the piezoelectric drive of the lens micro-displacement moving mechanism has a wide range of applications in many fields. For example, in microstructures, surface topography measurement can be used as a probe microscope scanning platform, combined with a micropincer or microprobe, to realize the capture of cells and applied in component extraction [7,8,9]. Furthermore, Mohammadzaheri et al. [10] studied micro/nanopositioners based on piezoelectric actuators and their role in conserving ecosystem biodiversity and enabling sustainable manufacturing. These positioners are precise at micro/nanometer resolutions and have improved and assisted in reproduction and somatic cell nuclear transfer, playing an increasingly important role in protecting endangered species from extinction.
Hysteresis nonlinearity has a significant effect on the performance of piezoelectric actuators. Many researchers have proposed modeling methods for the hysteresis phenomenon, which can be divided into three categories: physical, phenomenological, and intelligent models.
Physical models include the Duhem and Bouc–Wen models, which are modeled based on material characteristics. For example, Chen et al. proposed a dual-input dual-output (DIDO) model based on the Duhem hysteresis model to describe the dynamic behavior of biaxial piezoelectricity [11]. Kim et al. combined the Bouc–Wen model with a piecewise linear function to fit the hysteresis phenomenon with asymmetric strength degradation [12]. The modeling method is easy to understand, but the actual causes of hysteresis characteristics are not completely clear, and piezoelectric actuators using different materials must be modeled separately; therefore, the adaptability is not high [13,14,15].
Phenomenological models include the Preisach, Maxwell, and Preisach–Ishlinkskii models. The hysteresis curve is described based on the surface phenomenon of hysteresis and from the perspective of pure mathematics [16,17,18]. Krasnoselskii extended the original Preisach model to describe hysteretic nonlinearity mathematically [19]. Liu et al. proposed a dynamic left-right PI model and based on this model, established a rate-dependent hysteresis link model [20].
With the development of computers, computer-based intelligent modeling methods have rapidly emerged, usually achieving fitting through multiple iterations [21,22]. Gan proposed a polynomial model with higher modeling accuracy than the traditional PI model [23]. Coelho et al. introduced an exponential distribution probability operator (MOPSO-E) into the particle swarm optimization algorithm [24], and Rosli et al. introduced dynamic discovery probability and a step factor into the traditional cuckoo algorithm [25].
To improve the nonlinear hysteresis phenomenon of piezoelectricity, scholars have proposed a variety of compensation control schemes, including feedforward control, feedback control, and a combination of the two. Feedforward control mainly uses hysteresis modeling and introduces an inverse model to compensate for the nonlinear hysteresis phenomenon; however, the control effect depends on the modeling accuracy. PID control is the simplest and easiest scheme to implement for feedback control. Wang et al. designed a controller for the linear and nonlinear parts of the Hammerstein and adopted PI feedback control [26]. In addition, there are several intelligent control methods such as sliding mode, robust, and adaptive control [27,28,29]. Li et al. designed an internal model control algorithm based on an established intelligent model to track piezoelectric actuators [30]. Pugi et al. [31] presented an innovative planar piezoelectric actuation stage for the vibration control of rotating machinery. Innovative design methodologies have been proposed to optimize the equivalent impedance of the actuation stage to obtain ideal isotropic behavior.
As shown in the above analysis, there have been several achievements in the study of piezoelectric hysteresis. The physical model method is easy to understand, but the actual causes of hysteresis characteristics are not fully understood. Piezoelectric actuators using different materials must be modeled separately; therefore, they are not highly adaptable. The phenomenological model is simple and easy to analyze. However, fitting the asymmetric hysteresis phenomenon is difficult because it is composed of multiple symmetrical hysteresis elements. The intelligent modeling method can realize fitting through several iterations. Therefore the calculation time is too long, and the selection of the initial parameter values has a significant influence on the fitting results.
In this study, a linear piezoelectric actuator based on a multistage amplification mechanism is investigated. As shown in Ref. [32], an output characteristic model of the proposed actuator is developed, and a feedforward PID control model is established. The piezoelectric actuator proposed in this study can be used for the precise positioning of objects, movement of lenses, and focus adjustment and has strong application prospects.
To improve the control accuracy of the piezoelectric actuator, a Play operator is introduced into the backpropagation (BP) neural network to model the proposed linear piezoelectric actuator, and a genetic algorithm (GA) is applied to optimize the initial value and hence solve the shortcomings of strong randomness and slow convergence. In addition, because the three control parameters of a PID controller typically rely on experience to obtain a fixed value through trial and error, it is difficult to reach the optimal value. Owing to the fixed control parameters, particularly the fixed integral coefficient, the effect of deviation is reduced, resulting in the control of highly nonlinear systems and limited performance. To better adapt to industrial applications, a corresponding fuzzy controller is designed to automatically adjust the PID controller parameters for the proposed linear piezoelectric actuator, and the system performance and ability to adapt to the operating conditions are improved.
2. Design Model of a Piezoelectric Actuator
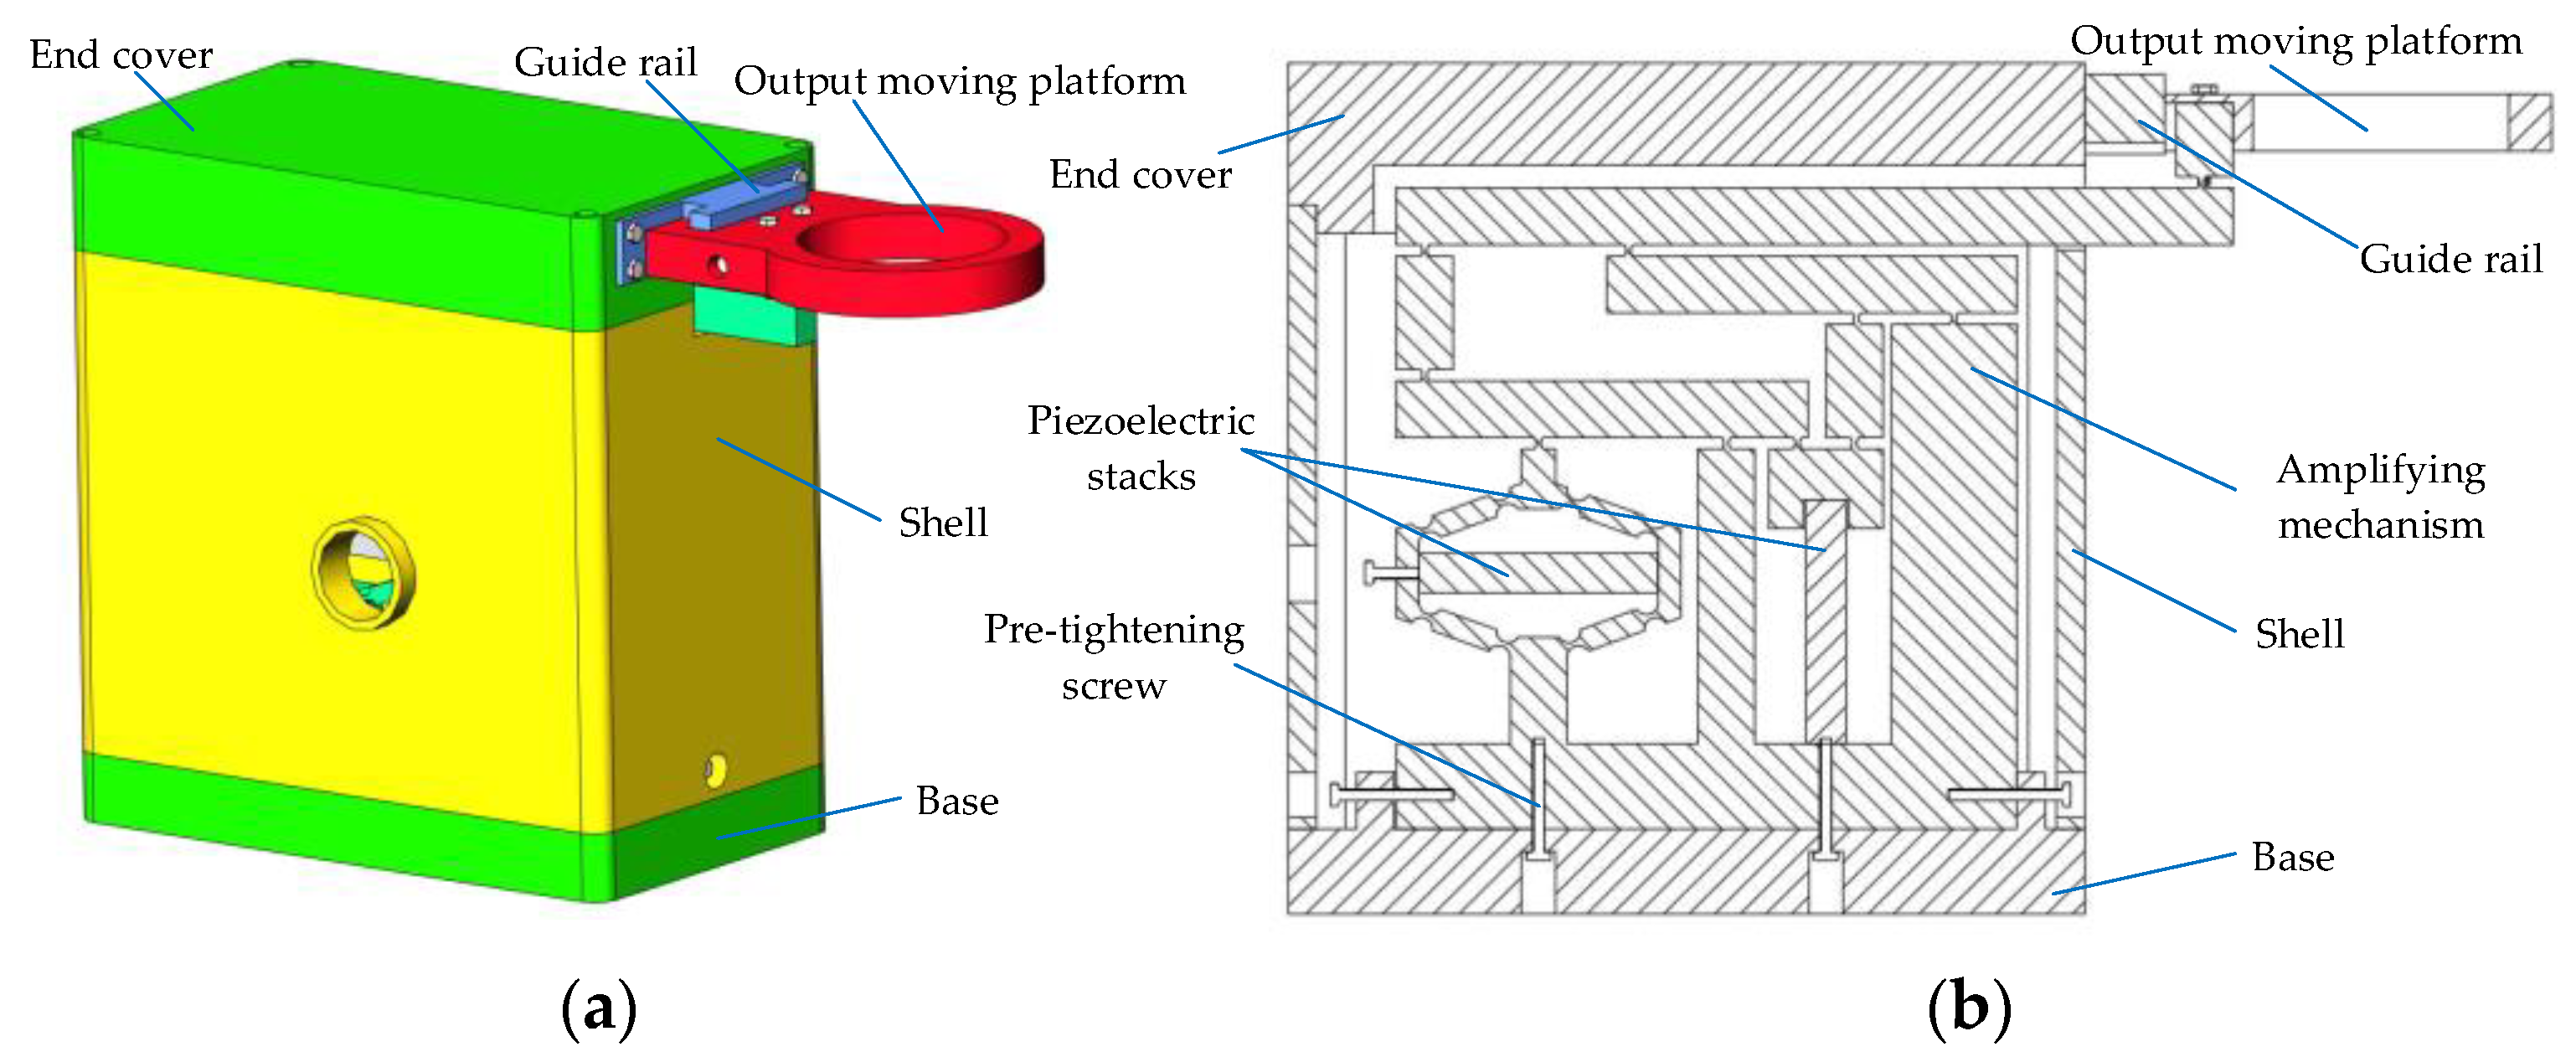
A linear piezoelectric actuator was designed, and its structure is shown in Figure 1 [32]. It primarily consists of an amplification mechanism, output mechanism, and auxiliary assembly mechanism. The amplification mechanism comprises two piezoelectric stacks and a flexible hinge amplifying mechanism, the output mechanism comprises a guide rail and an output moving platform, and the auxiliary assembly mechanism comprises a base, a shell, an end cover, and two pre-tightening screws.
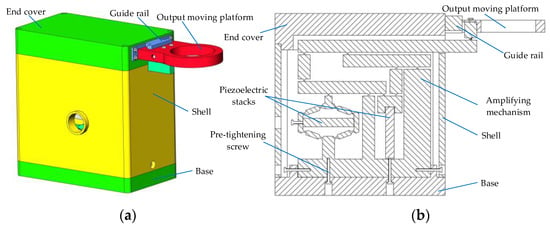
Figure 1.
Structure of the multi-range linear piezoelectric actuator (Ref. [21]): (a) the assembly drawing; (b) 2D drawing.
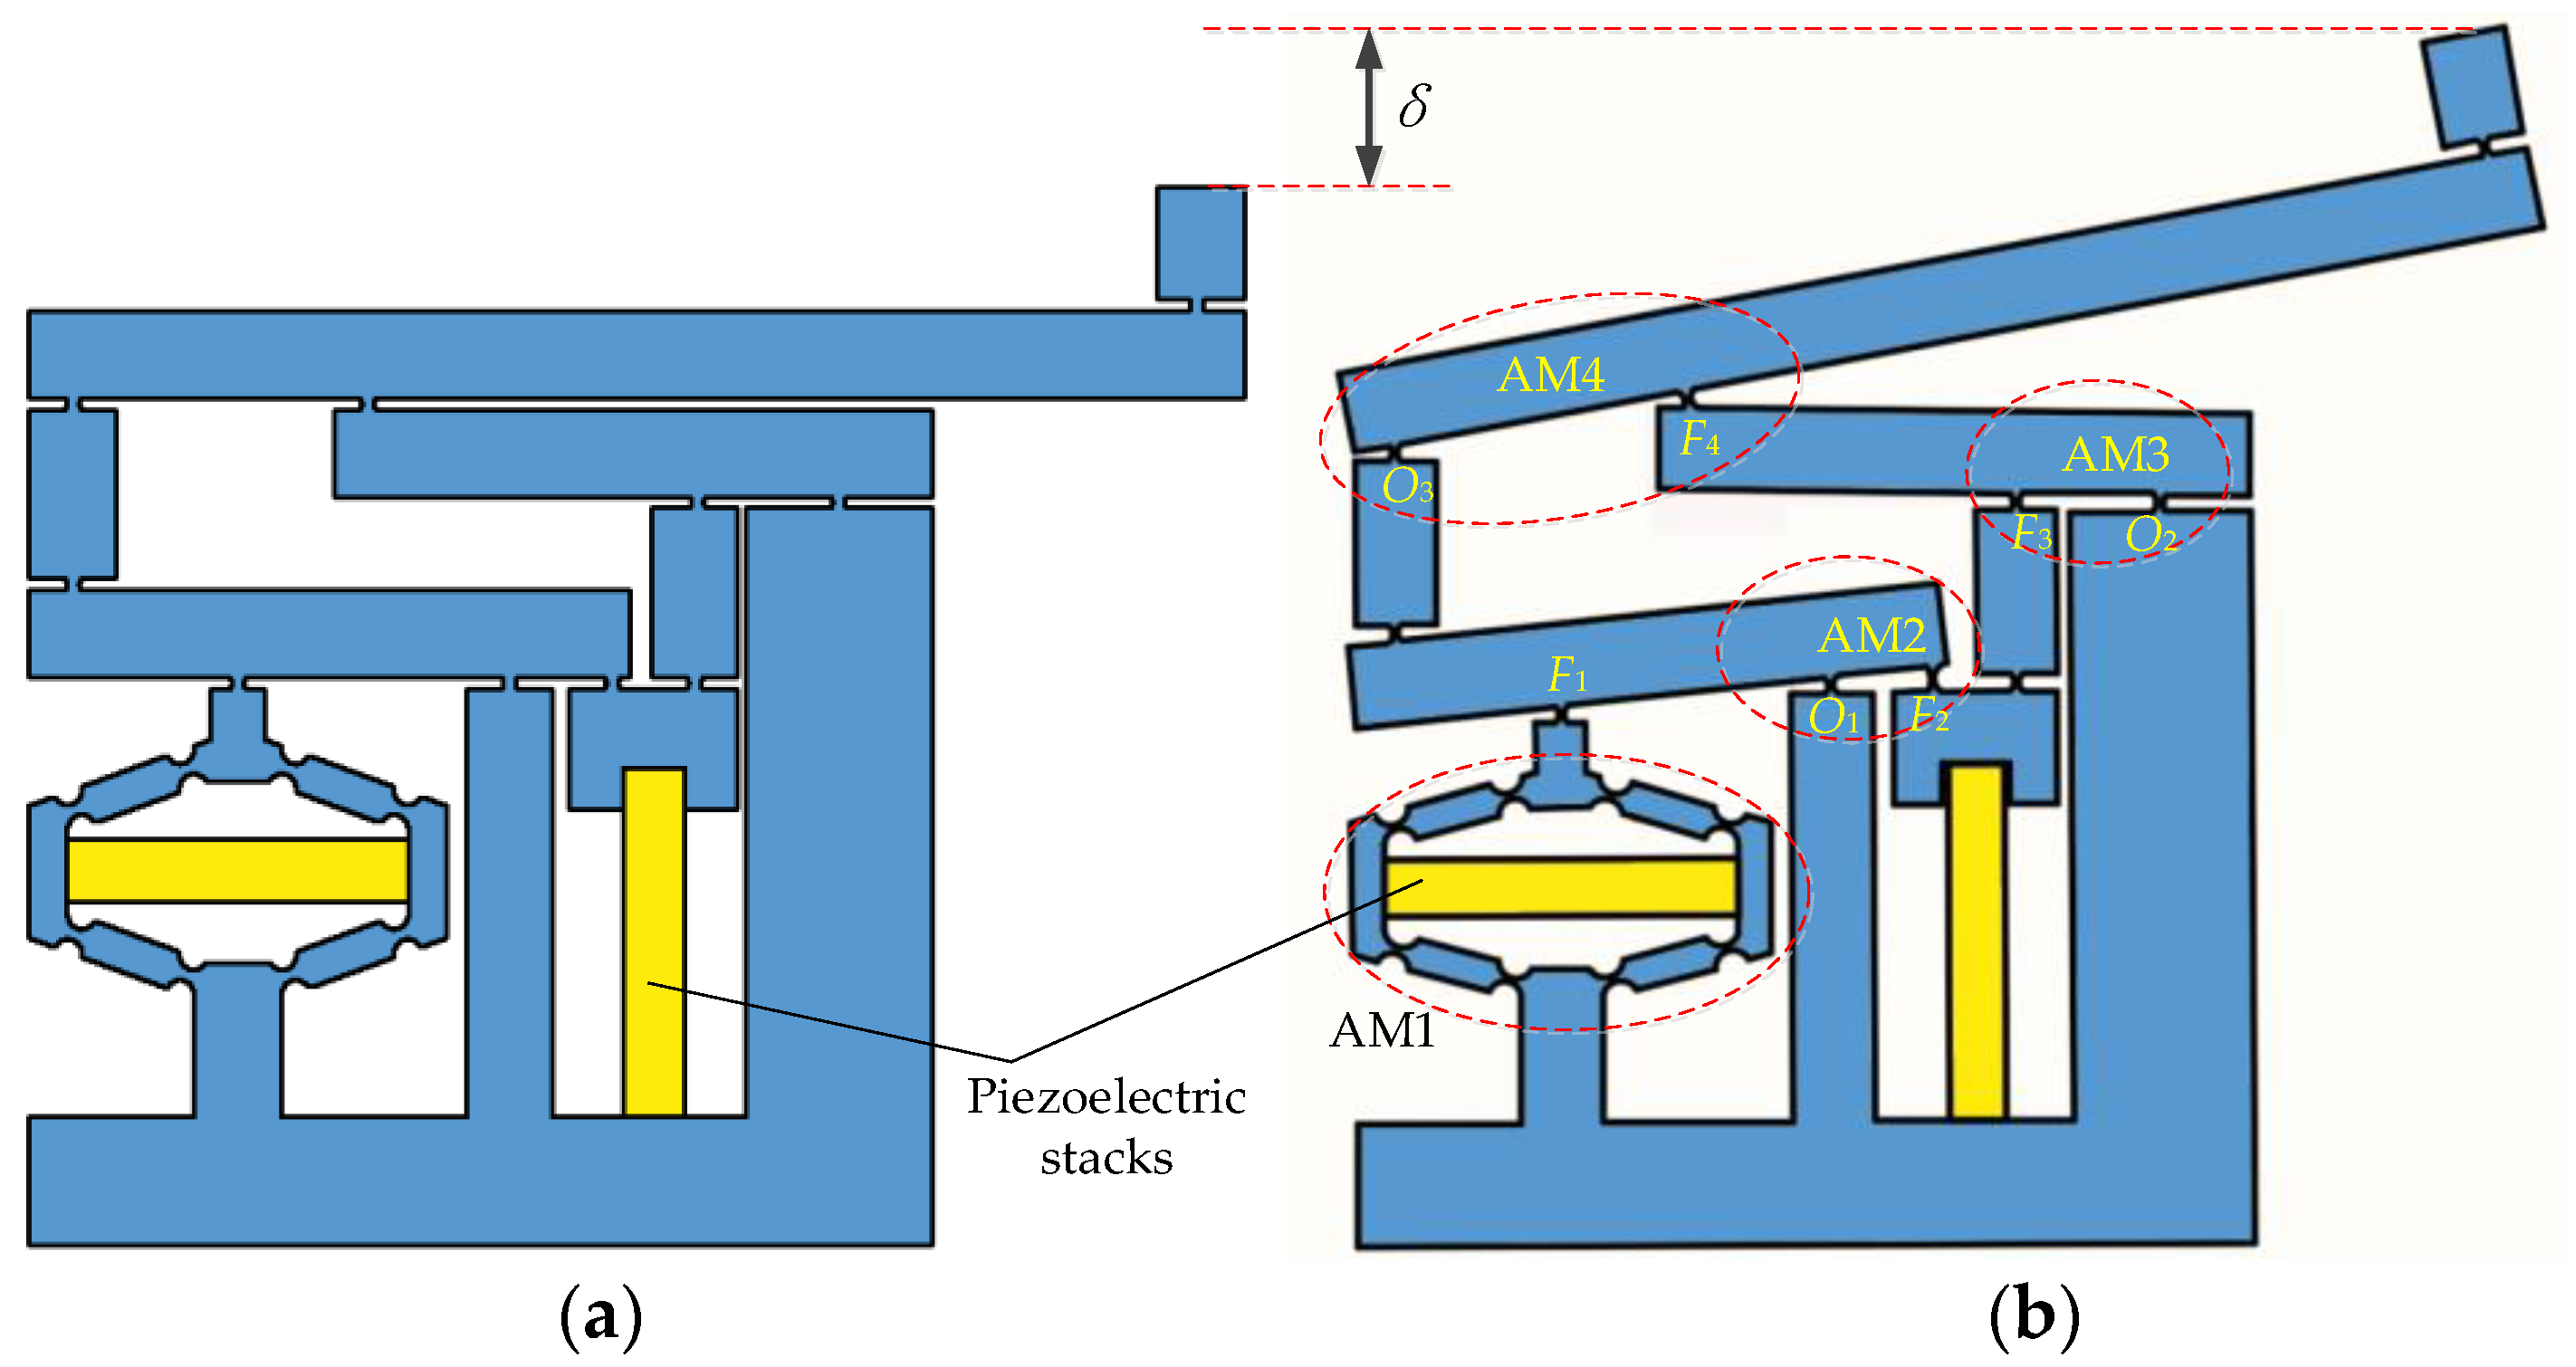
The working principle of the displacement amplification mechanism is shown in Figure 2. The displacement amplifying mechanism consists of four small amplification mechanisms: AM1–AM4. The amplification mechanism AM1 is deformed under the influence of the transverse piezoelectric stack, which lowers the position of the F1 point. The amplification mechanisms AM2–AM4 are composed of levers, and the pointers are O1, O2, and O3, respectively. When the vertical piezoelectric stack is operated, the force point positions (F2 and F3) of AM2 and AM3 increase. Under the action of levers AM2 and AM3, the position of the pointer O3 of AM4 is lowered, and the position of the force point F4 increases, thus realizing the multi-stage amplification of the output displacement of the piezoelectric stack. In turn, the multi-stage amplification produces a displacement δ.
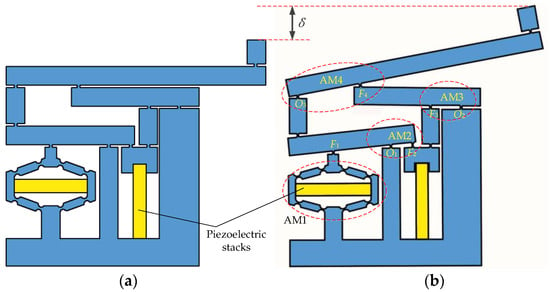
Figure 2.
Working principle of the displacement amplifying mechanism: (a) undeformed; (b) deformed.
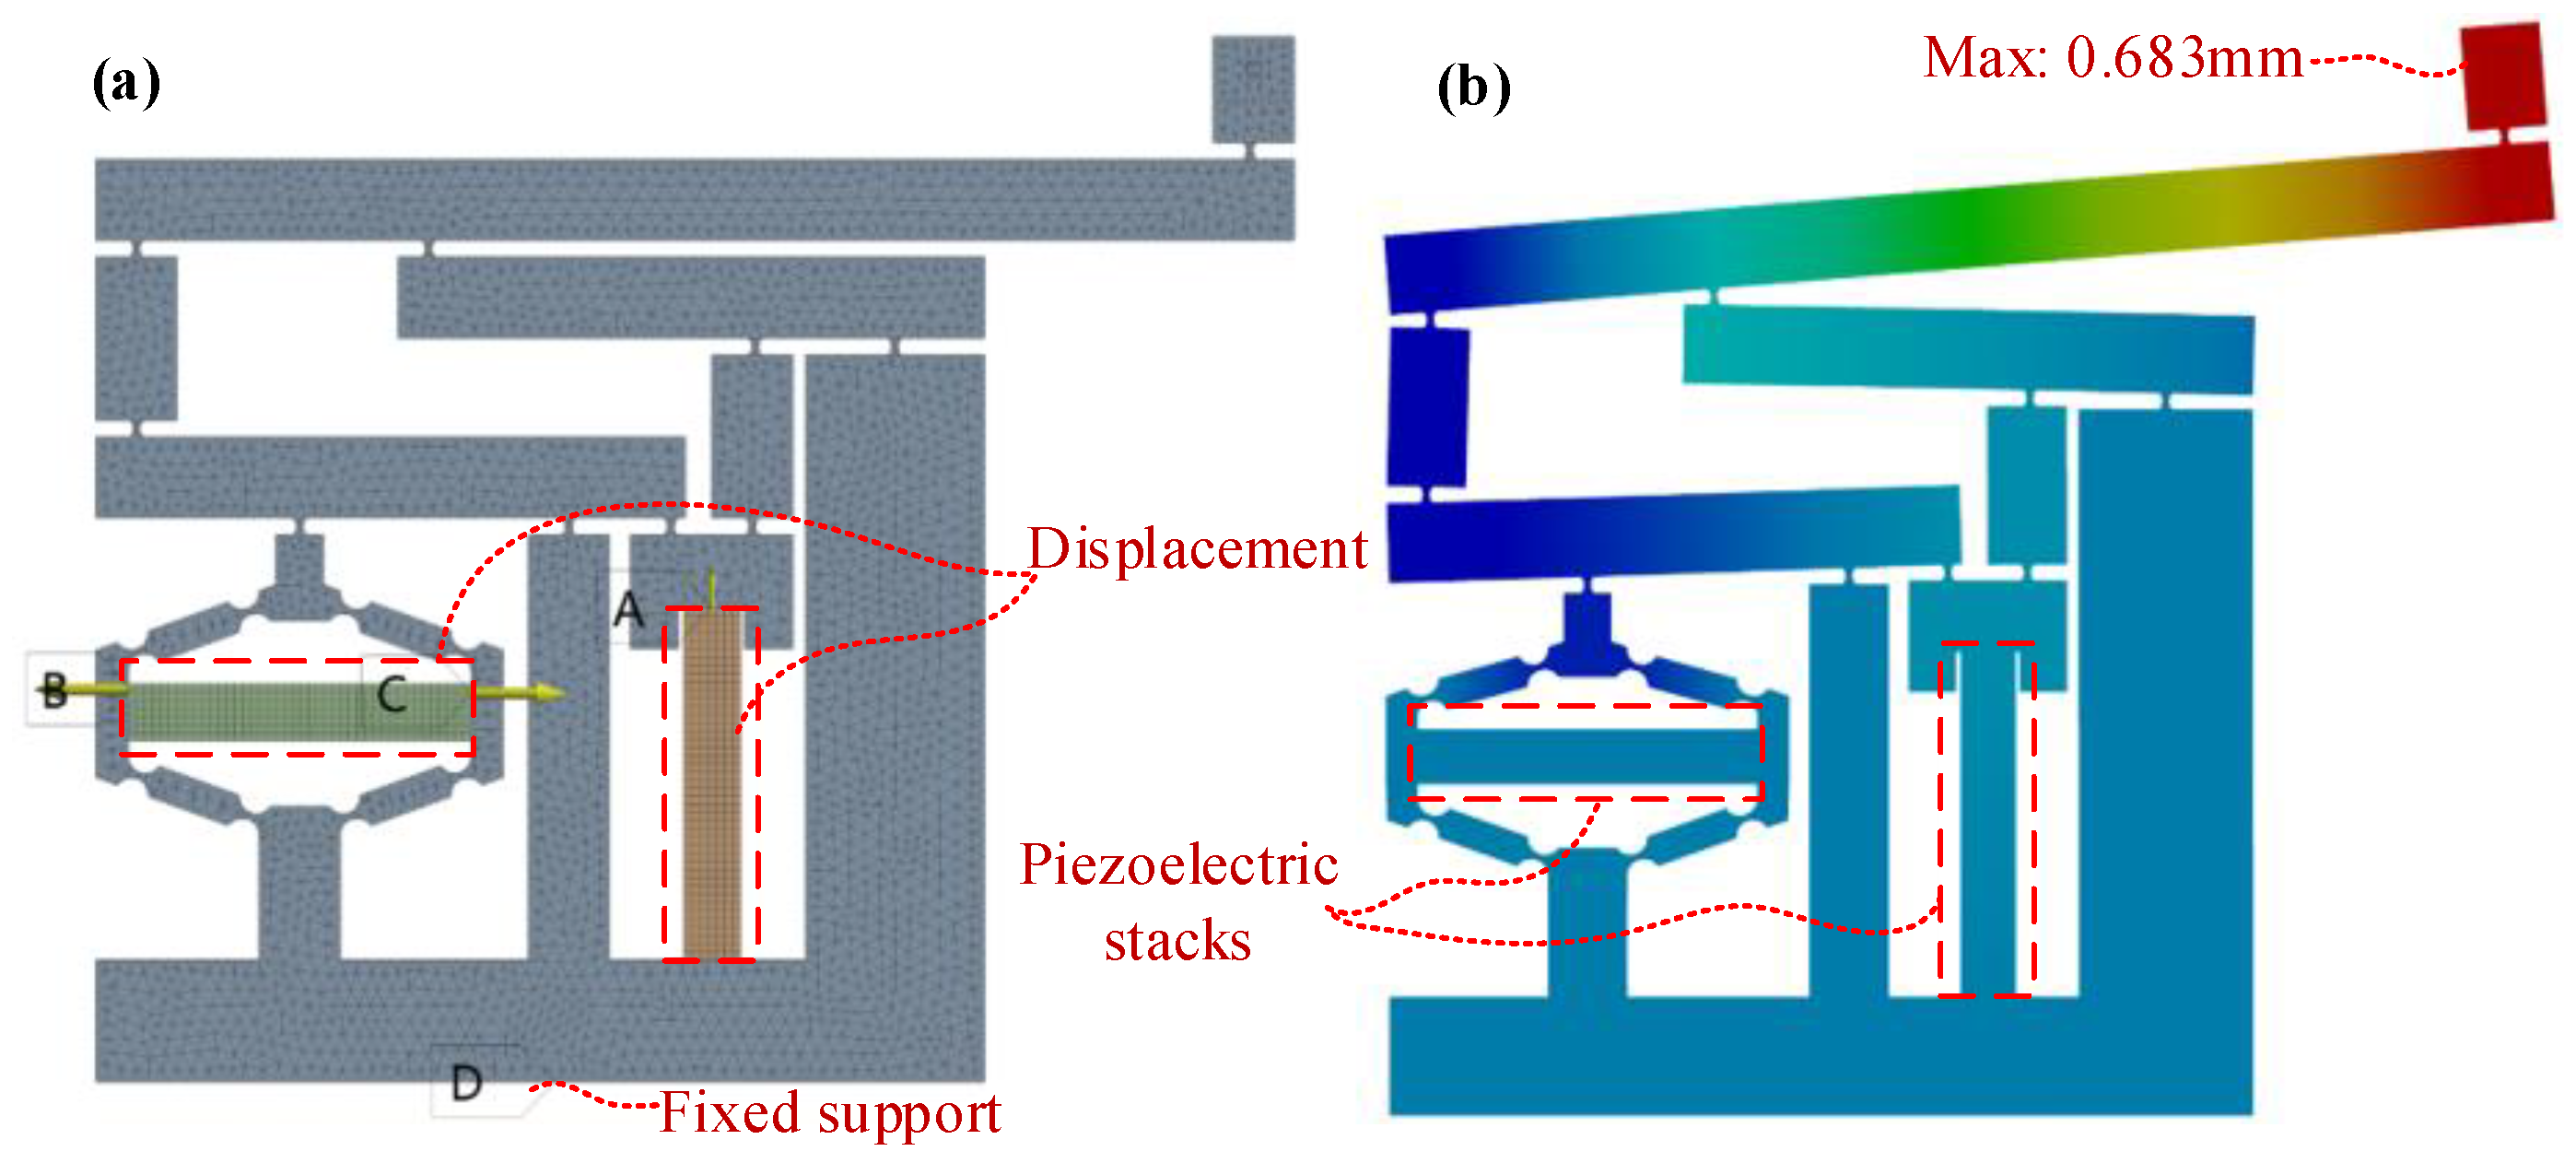
To analyze the amplification ratio of the displacement amplification mechanism of the piezoelectric actuator, a finite element analysis of the amplification mechanism was performed [33], as shown in Figure 3. The output displacements of the piezoelectric actuator for different load cases are considered in the finite element analysis, and the results are shown in Table 1.
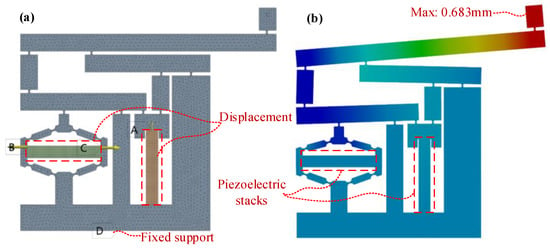
Figure 3.
Finite element analysis of the displacement amplifying mechanism: (a) mesh model; (b) deformation results.

Table 1.
Results of the magnification ratio of the displacement amplification mechanism.
The results show that the output displacement of the piezoelectric actuator without load is the largest, with a maximum value of 638 μm and an amplification of 22.77. The amplification of the piezoelectric actuator decreases as the load increases. When the load is 200 g, the amplification is 21.82.
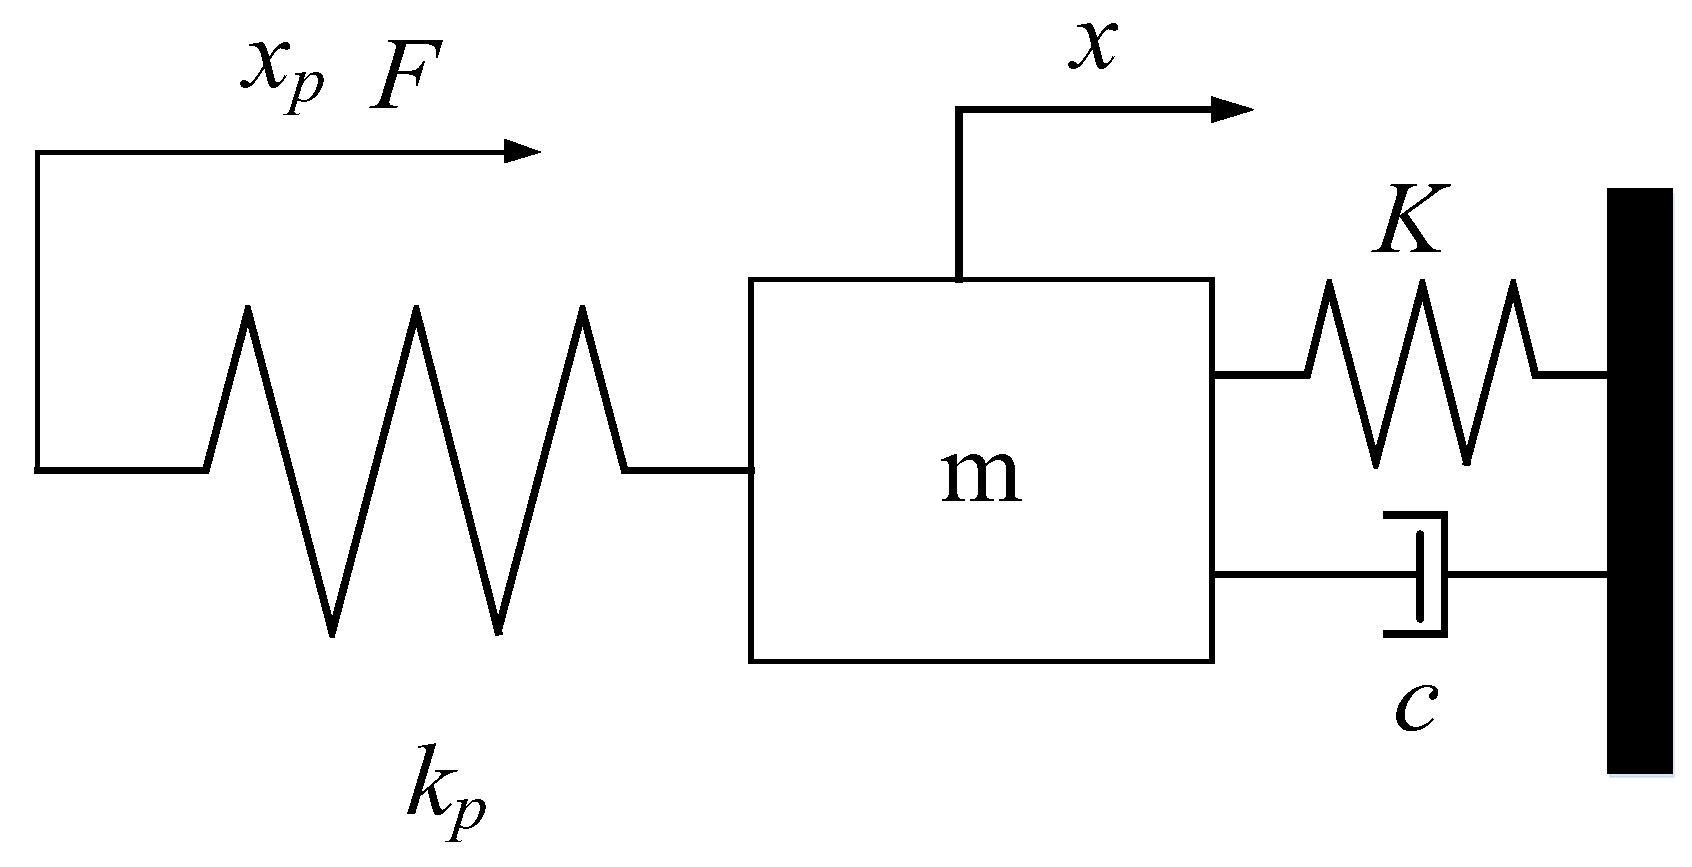
The motion characteristics of the moving mechanism of the piezoelectric actuator are among the elements that affect the control accuracy, and it is necessary to construct a dynamic model for the subsequent control simulation. Because the moving mechanism can be reduced to a mass block, and the piezoelectric amplification mechanism can be simplified to spring and damping, the equivalent dynamic model is shown in Figure 4.
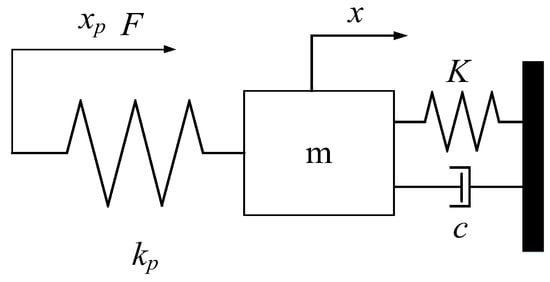
Figure 4.
Equivalent dynamic model.
From Figure 4, the differential equations of the equivalent model are as follows:
where kp is the stiffness of the piezoelectric stack, m, c, and K are the equivalent mass of the moving mechanism, damping of the amplifying mechanism, and stiffness, respectively, xp is the telescopic displacement of the piezoelectric stack, x is the output displacement of the mechanism, and F is the output force of the piezoelectric stack.
Applying the Rasch transform to the above equation yields the following:
By transforming Equation (2), the transfer function of the system can be obtained as follows:
where ωn is the natural frequency, and ξ is the damping ratio. Their expression can be written as follows:
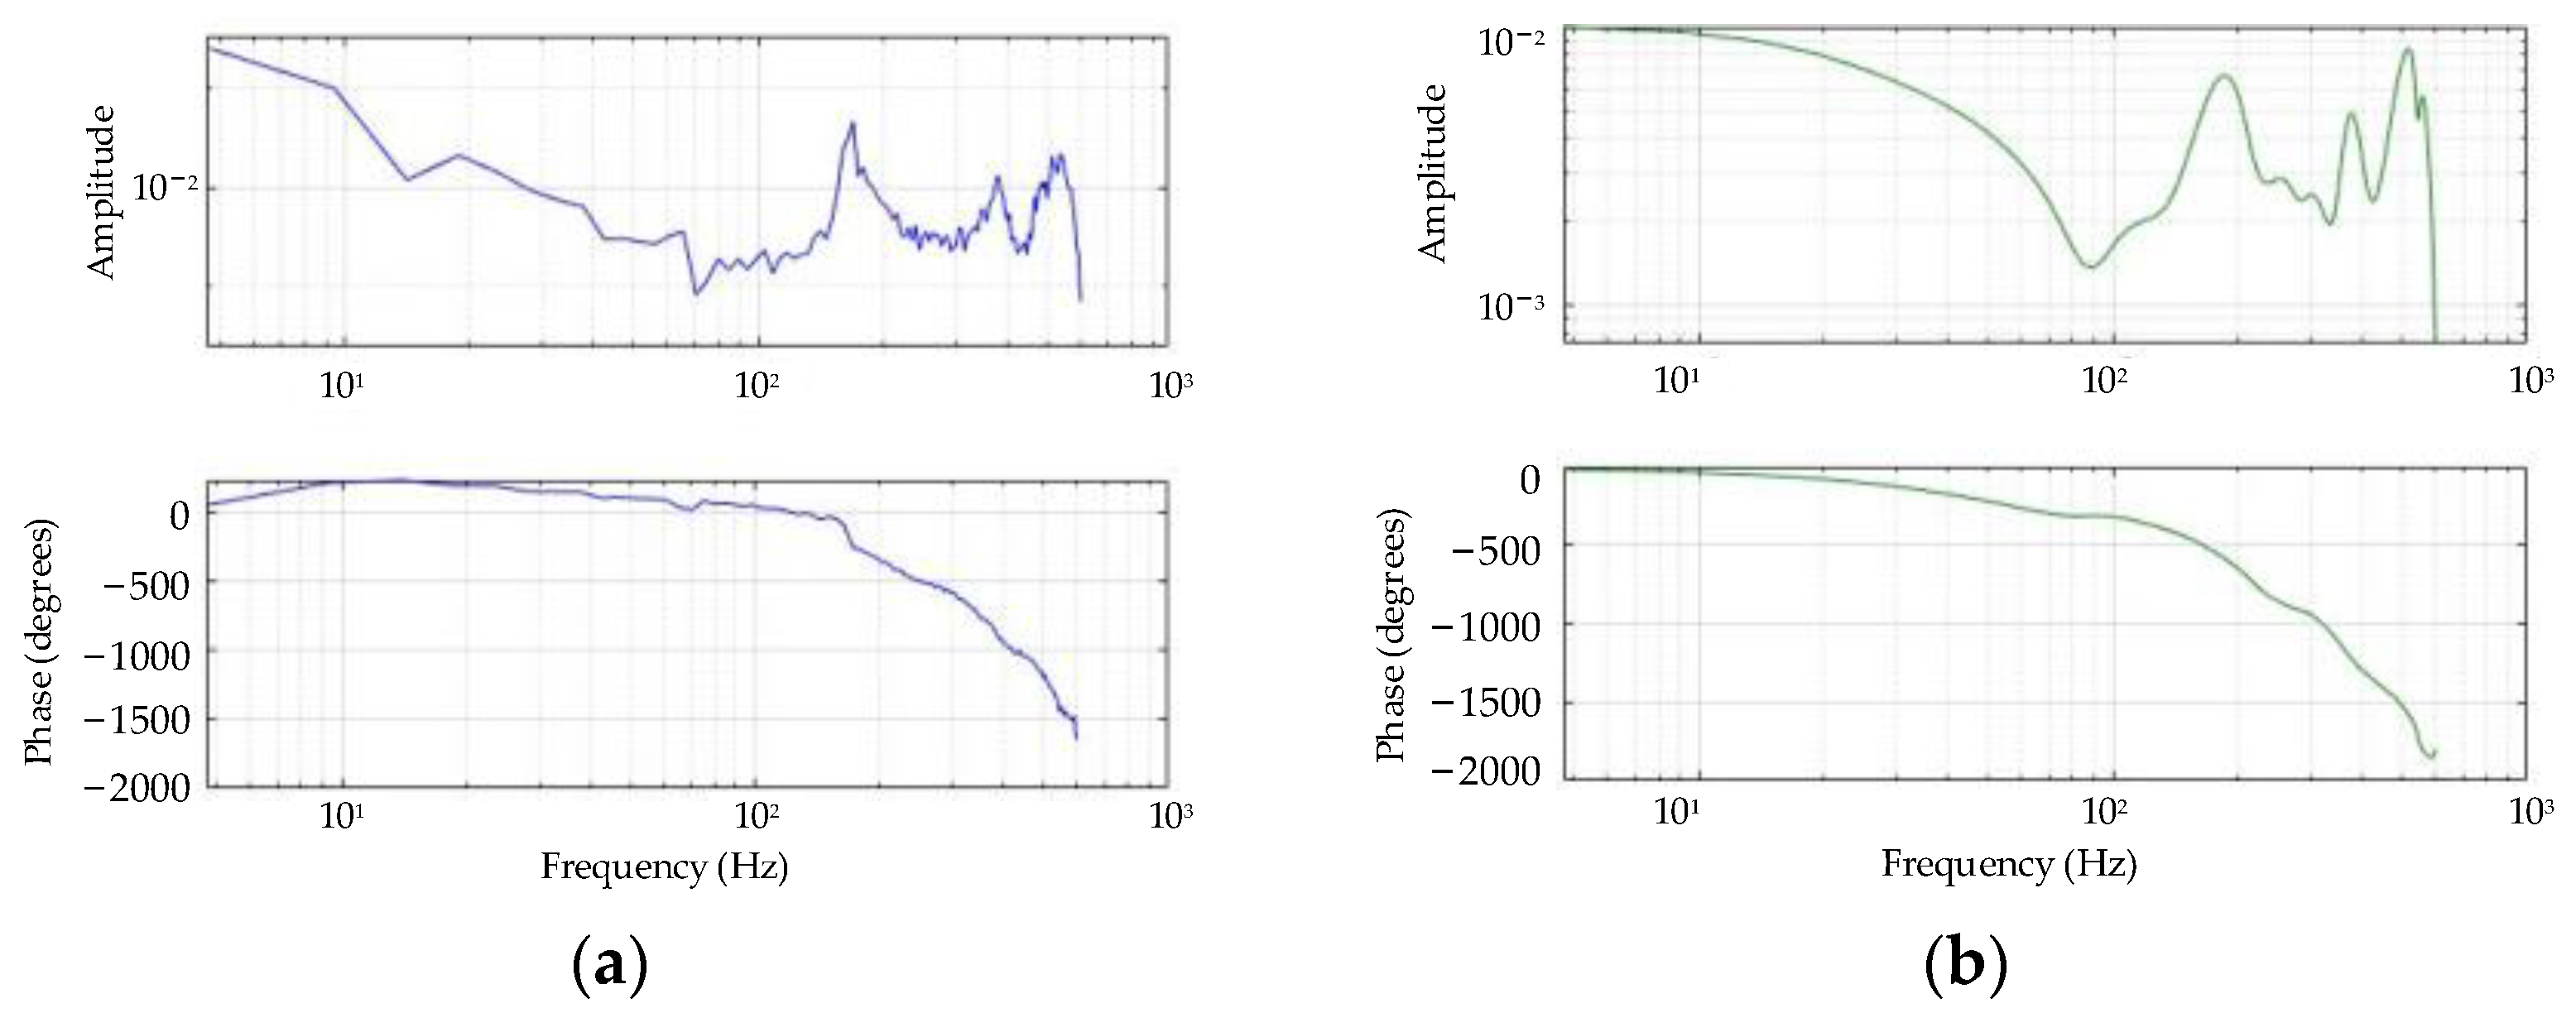
The data collected from the piezoelectric actuator were systematically identified, as shown in Figure 5. The simulation results are essentially the same as the experimental results from the Bird’s plot, and the transfer function simulation results are considered reliable.
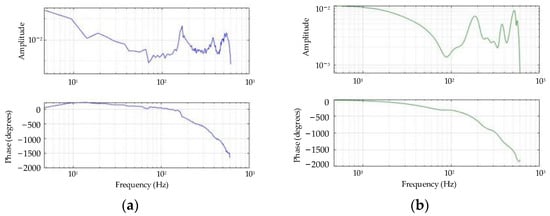
Figure 5.
Model identification based on frequency response method: (a) experimental results; (b) system identification.
From Figure 5, it is known that the transfer function of the piezoelectric actuator obtained via system identification under an excitation signal is as follows:
3. Hysteretic Nonlinear Model
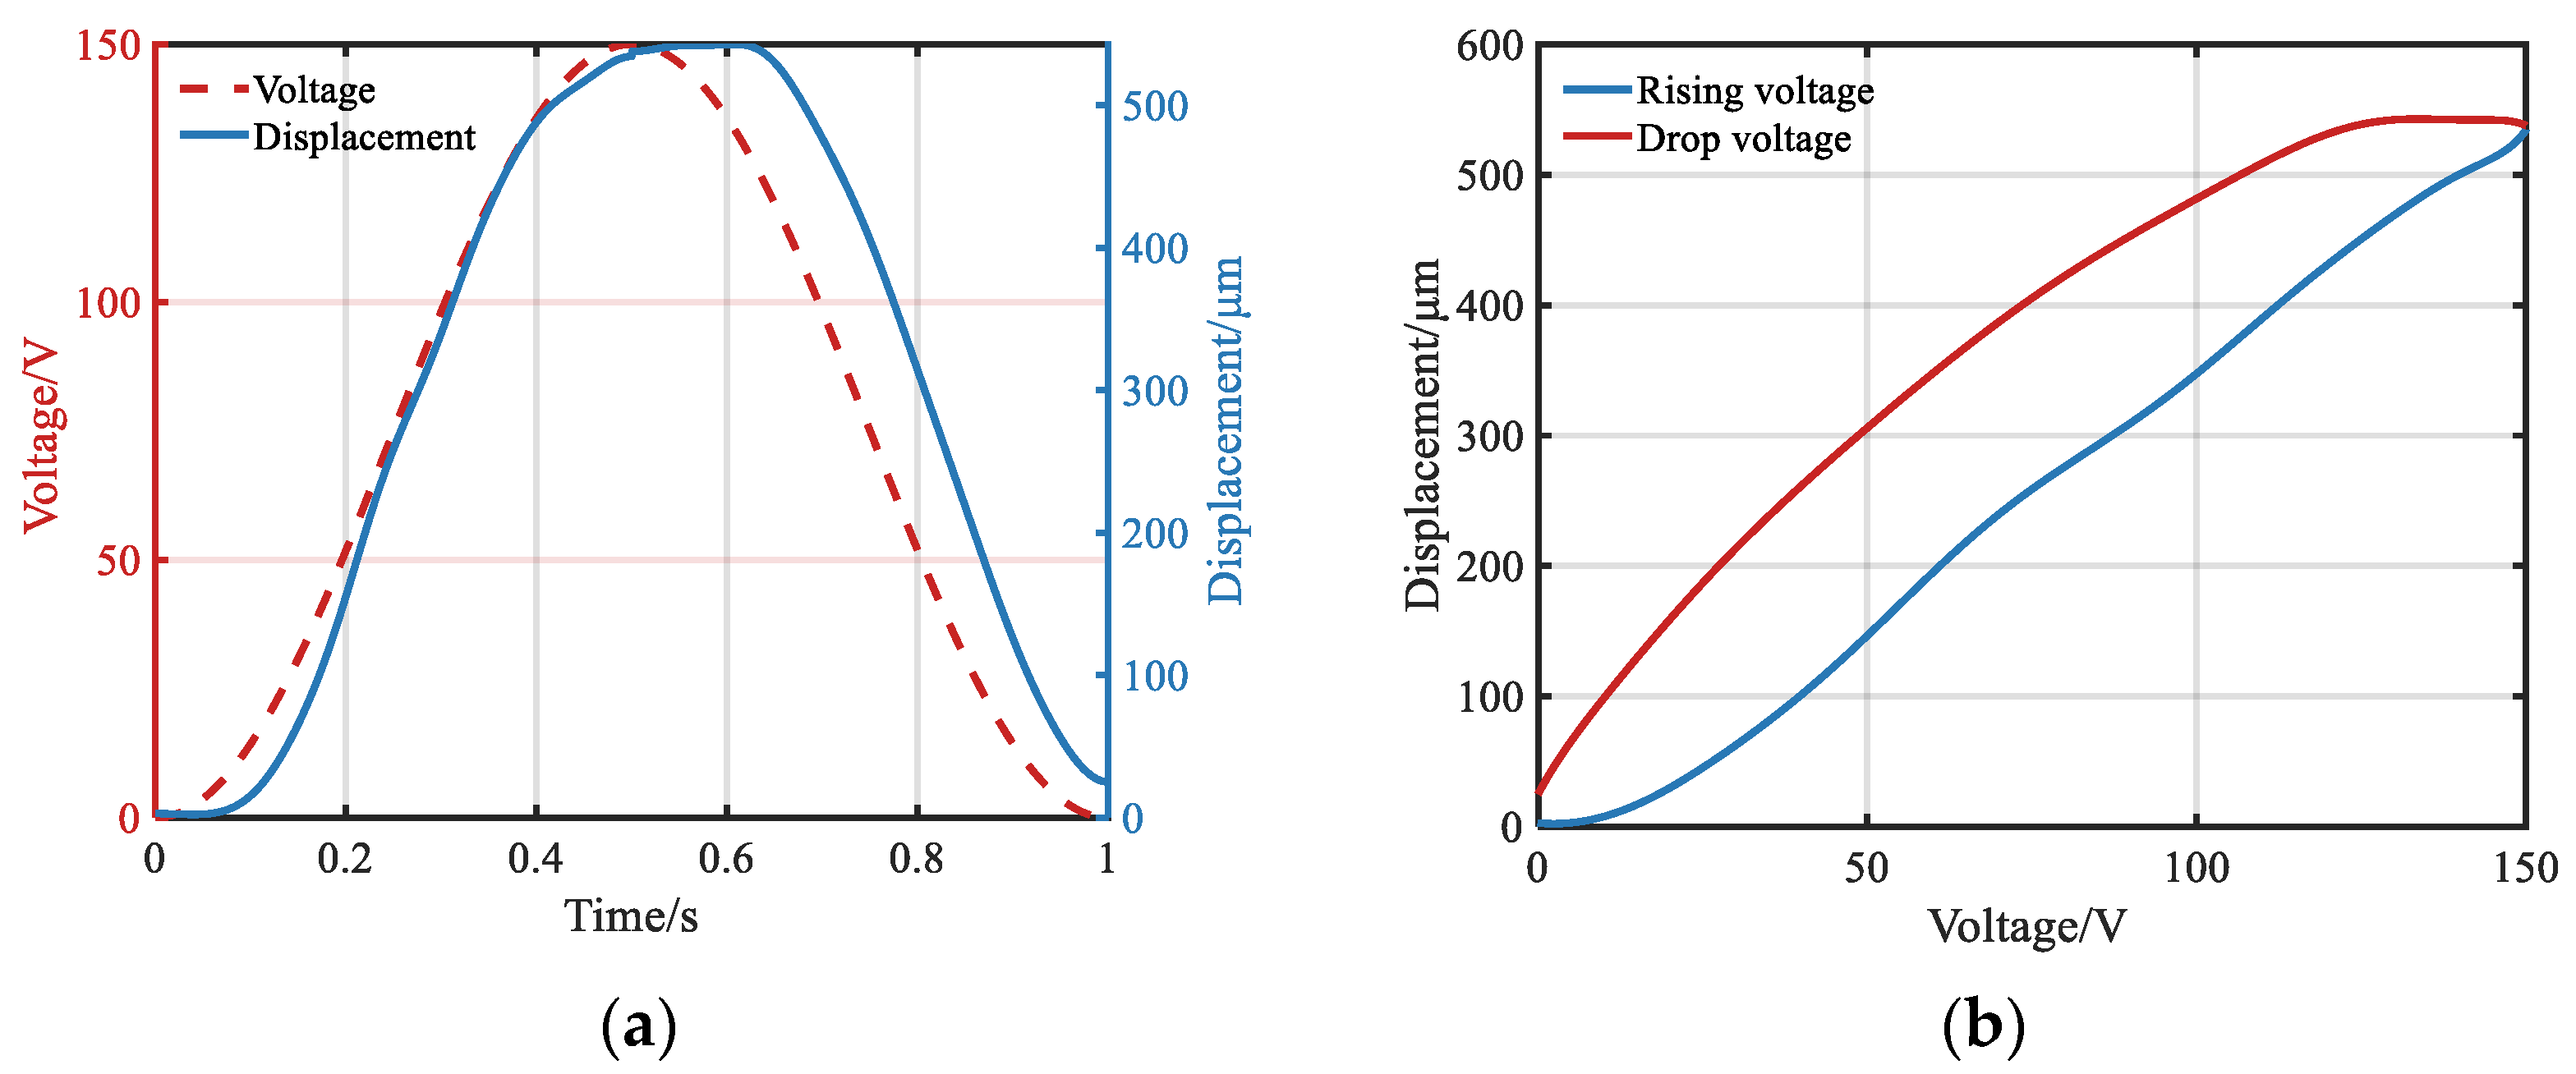
The structure designed in this study primarily applies an inverse piezoelectric effect. The piezoelectric material deforms when the voltage is input; however, the piezoelectric material itself has nonlinear hysteresis characteristics. The measured piezoelectric hysteresis curve is shown in Figure 6. The input voltage was a sine wave with a positive bias, the maximum voltage was 150 V, and the frequency was 1 Hz. In other words, there were two output displacements under the same input voltage, indicating a multi-mapping relationship. Moreover, there was a significant difference between the output displacements of the rising and falling sections when the input voltages were the same. The nonlinear hysteretic characteristics of the piezoelectric stack reduced the open-loop control precision and closed-loop working bandwidth of the lens microdisplacement moving mechanism, which easily causes instability in the system and limits its application in adaptive optical systems.
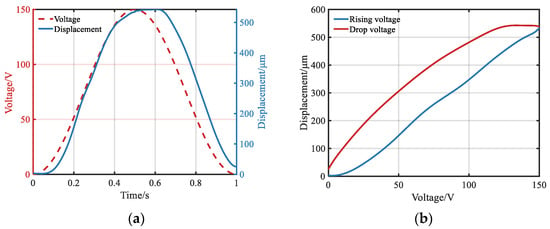
Figure 6.
Hysteresis curve of the piezoelectric actuator: (a) input voltage and output displacement comparison diagram; (b) hysteresis curve.
A control model must be established to eliminate piezoelectric hysteresis nonlinearity. The commonly used Preisach–Ishlinskii model is composed of a linear superposition of multiple Play operators with different threshold values, r. The expression is as follows:
where wi and ri are the weights and thresholds of each operator, respectively, and n is the total number of operators.
Because the Play hysteresis operator is a symmetrical parallelogram and the hysteresis curve of the microdisplacement mechanism of the piezoelectric lens is not completely symmetric, the model obtained by the superposition of the Play operator cannot perfectly fit the actual hysteresis curve. Here, the BP neural network can be used in combination with the PI hysteresis model, and neural network modeling is categorized as “black box” modeling. Hence, the improved hysteresis model can be accurately modeled and easily combined with the controller design.
Because the piezoelectric stack has multivalued mapping characteristics, the neural network can only approximate a continuous single-valued mapping curve. The overall aim of this study is to extend the input space of the neural network, as shown in Figure 7. First, the hysteresis characteristics were introduced into the input layer, and the output x(t) was introduced after a small amount of the superimposed Play hysteresis operator. Subsequently, the input u(t) of the hysteresis object was added. Finally, considering the memory characteristics of the hysteresis, the output f(t − T) at the last moment of the hysteresis object was added as the input layer of the BP neural network.

Figure 7.
The overall construction of the BP neural network.
The most important factor in the hidden layer is the number of neuron nodes. By adjusting this number, the training accuracy of the neural network can be improved or the learning and training time can be accelerated, which mainly follows the following equation:
where nin and nout are the numbers of neurons in the input and output layers, respectively, and k is a constant, usually between one and five. Finally, 12 neuron nodes were selected after several attempts.
For the excitation function connecting each layer, the output layer of the feedforward neural network adopts a purely linear excitation function, and the hidden layer adopts a long-sigmoid excitation function. Therefore, the mathematical relationship between the i-th input layer of the BP neural network and the j-th neuron in the hidden layer can be expressed as
The mathematical relationship between the j-th neuron in the hidden layer of the BP neural network and the output layer can be expressed as follows:
Finally, the Levenberg–Marquardt training function was used to perform error BP, and the weight, wij, and threshold, rj, in Equation (8) and the weight, wj1, threshold, θ, and constant coefficients, k and b, in Equation (9) were constantly modified to ensure that the error reached the expected value to complete the fitting of the hysteresis model.
The above methods have several disadvantages such as strong randomness, falling easily into a local minimum, and a slow convergence rate. In particular, the selection of the initial value for each parameter directly affects the accuracy and learning efficiency of the final fitting results.
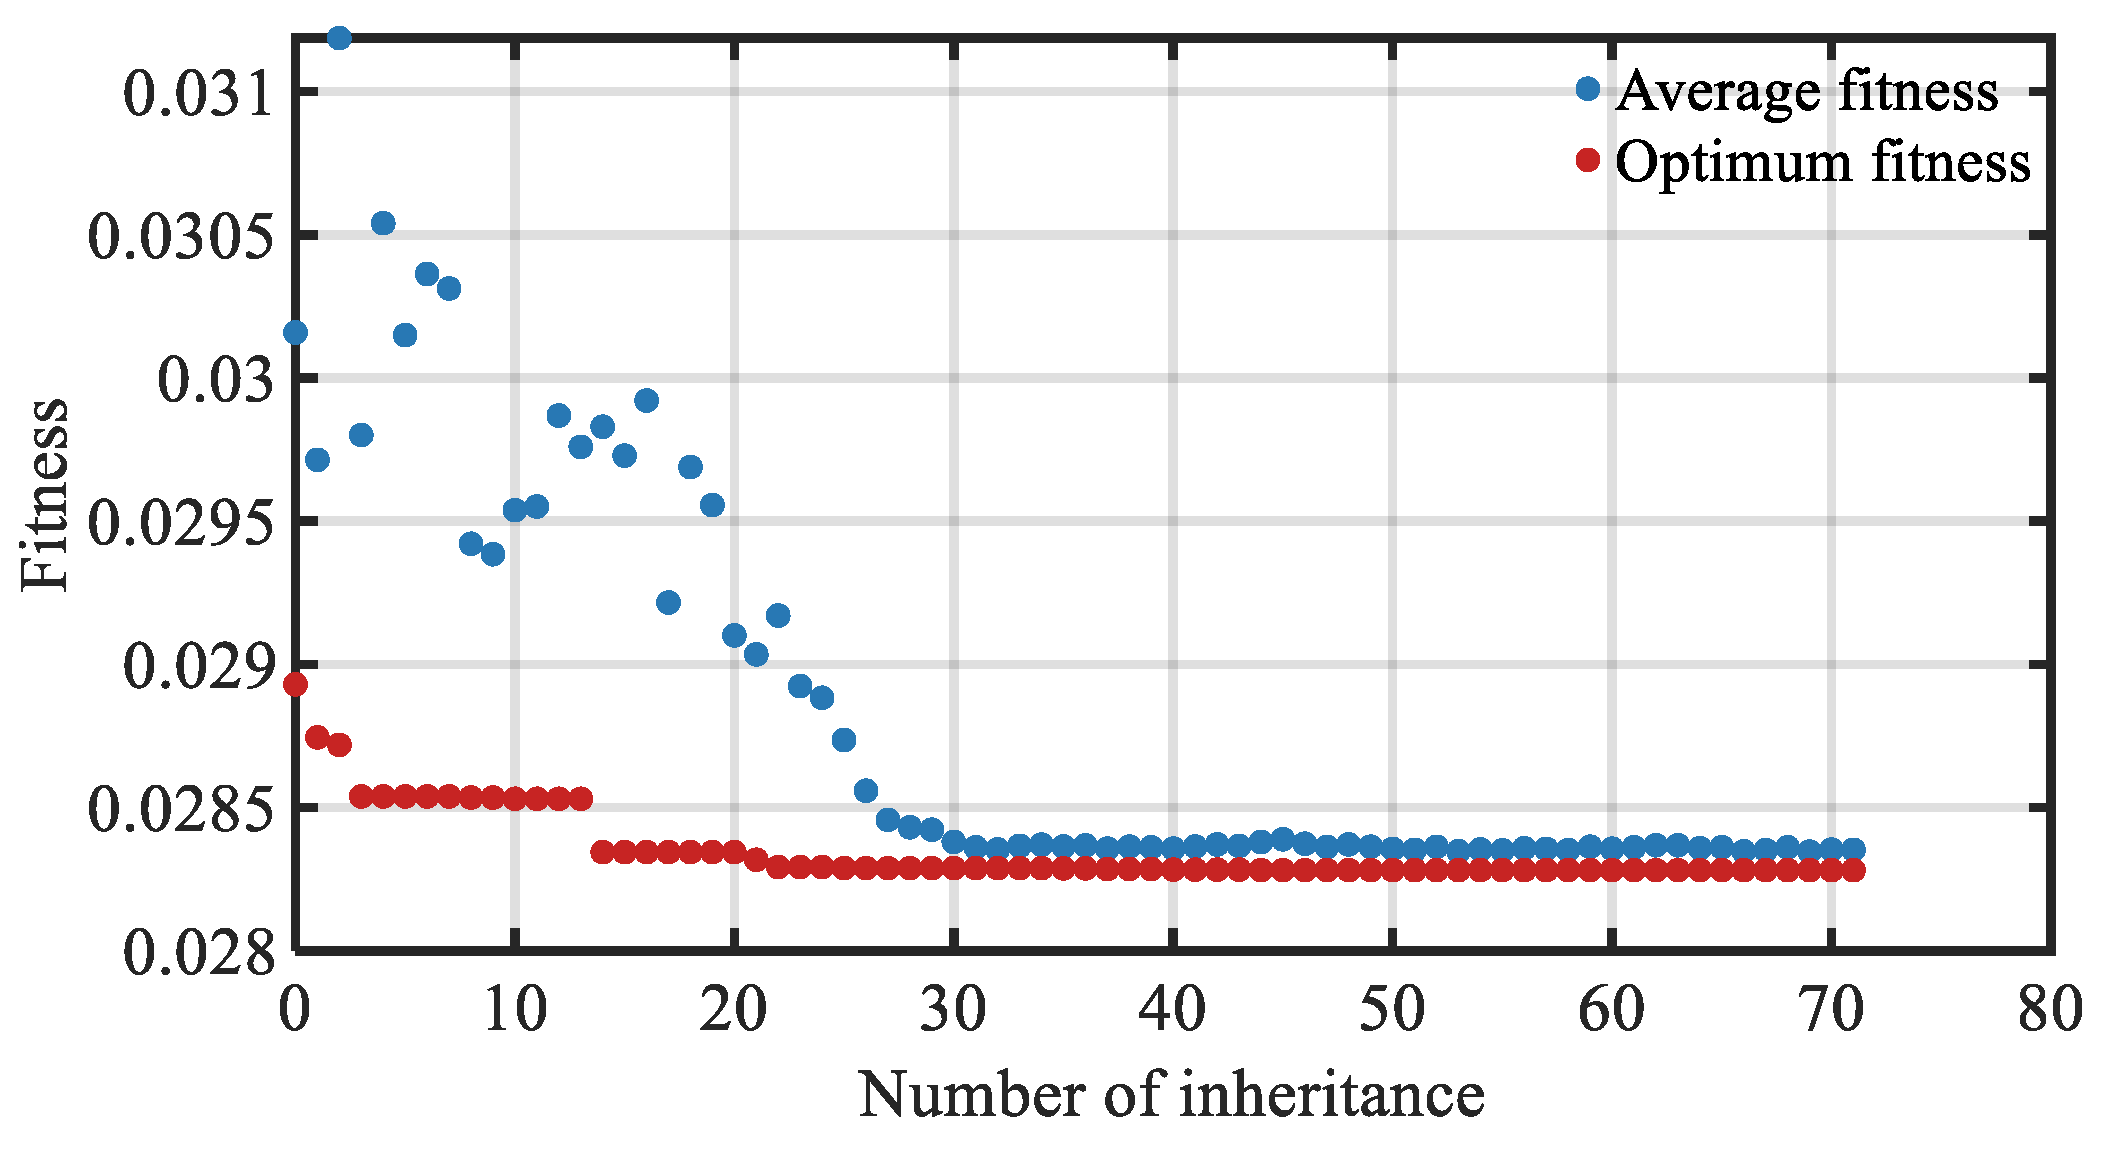
The basic idea of a GA is to begin with multiple solutions and iterate them gradually through certain rules to generate new solutions until the conditions are satisfied. After the initial weights and thresholds are selected and the parameters are cascaded, m random individuals are generated to form the initial population. The population size, m, was set to 200. Finally, the genetic operation with a maximum iteration number of 80, crossover probability of 0.8, and mutation probability of 0.05 was set to obtain the best-fit individual. The fitness function, Fi, is the mean square error between the fitting and experimental results, which is the evaluation standard for the quality of individuals in the group.
In this study, roulette selection was adopted for the selection operation, and the selection rate was proportional to fitness—that is, the higher the fitness of an individual, the greater the chance of selection. Therefore, the probability Pi of each individual being selected was
A two-point crossover was selected as the crossover operation; in other words, two crossover points were randomly set in the individual coding string, and individuals exchanged genes between the crossover points.
Finally, the mutation operator used in this study is a Gaussian mutation, and the original gene value was replaced by random numbers with a normal distribution.
After setting the above conditions, the genetic iterations began, as shown in Figure 8. The average fitness reflected the global optimality in the population, and the best fitness reflected the local optimality in the population. As shown in the figure, the first 20 generations were chaotic, and the fitness of the 20th generation by the 30th generation began to converge gradually. When inherited to the 71st generation, the average and best fitnesses were close and almost unchanged. Here, therefore, the iteration was terminated in advance, and the optimization was completed.
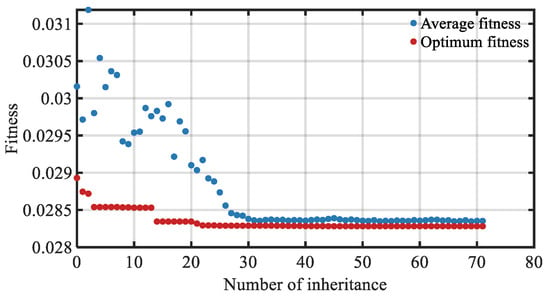
Figure 8.
The iterative process of a genetic algorithm.
4. Compound Control
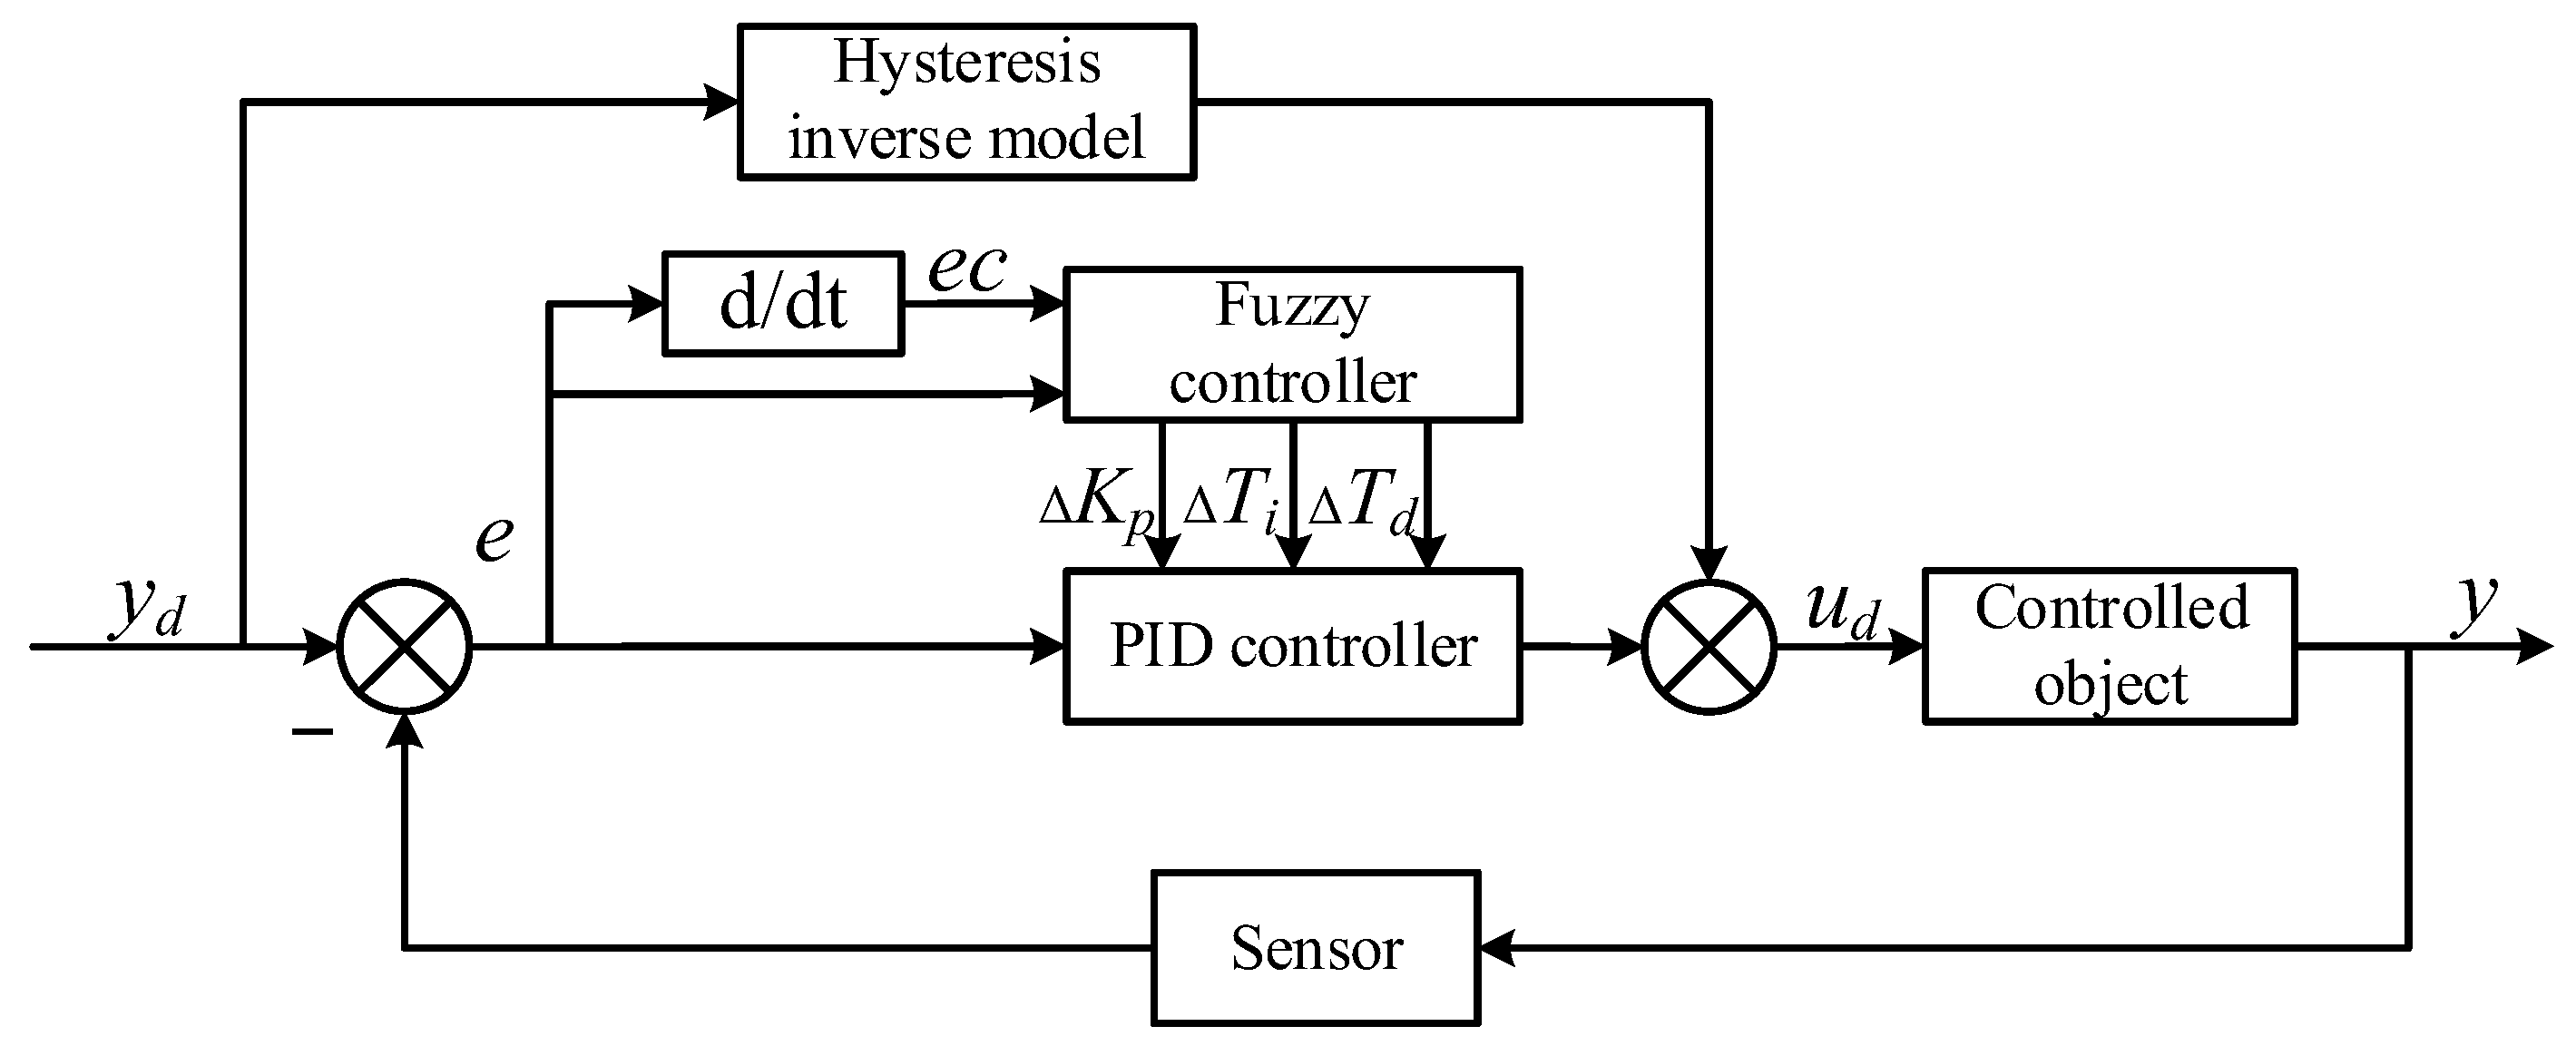
Feedforward control is an open-loop control with uncertainty in the model parameters and unpredictable interference. Compared to feedback control, the disadvantage is that parameters cannot be adjusted in time after identification. However, feedback control does not compensate for hysteresis nonlinearity in advance, and the speed is slower than that of feedforward control. Therefore, feedforward and feedback controls were combined. First, the feedforward controller was used to compensate for the hysteresis nonlinearity, and then the feedback controller was utilized to compensate for the modeling errors and other disturbances, thus forming a composite control, as shown in Figure 9.
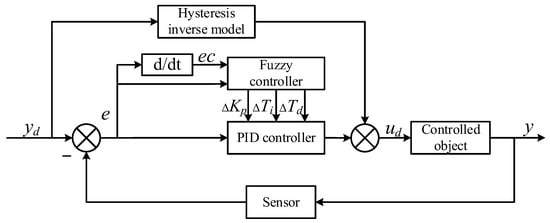
Figure 9.
The principle of compound control.
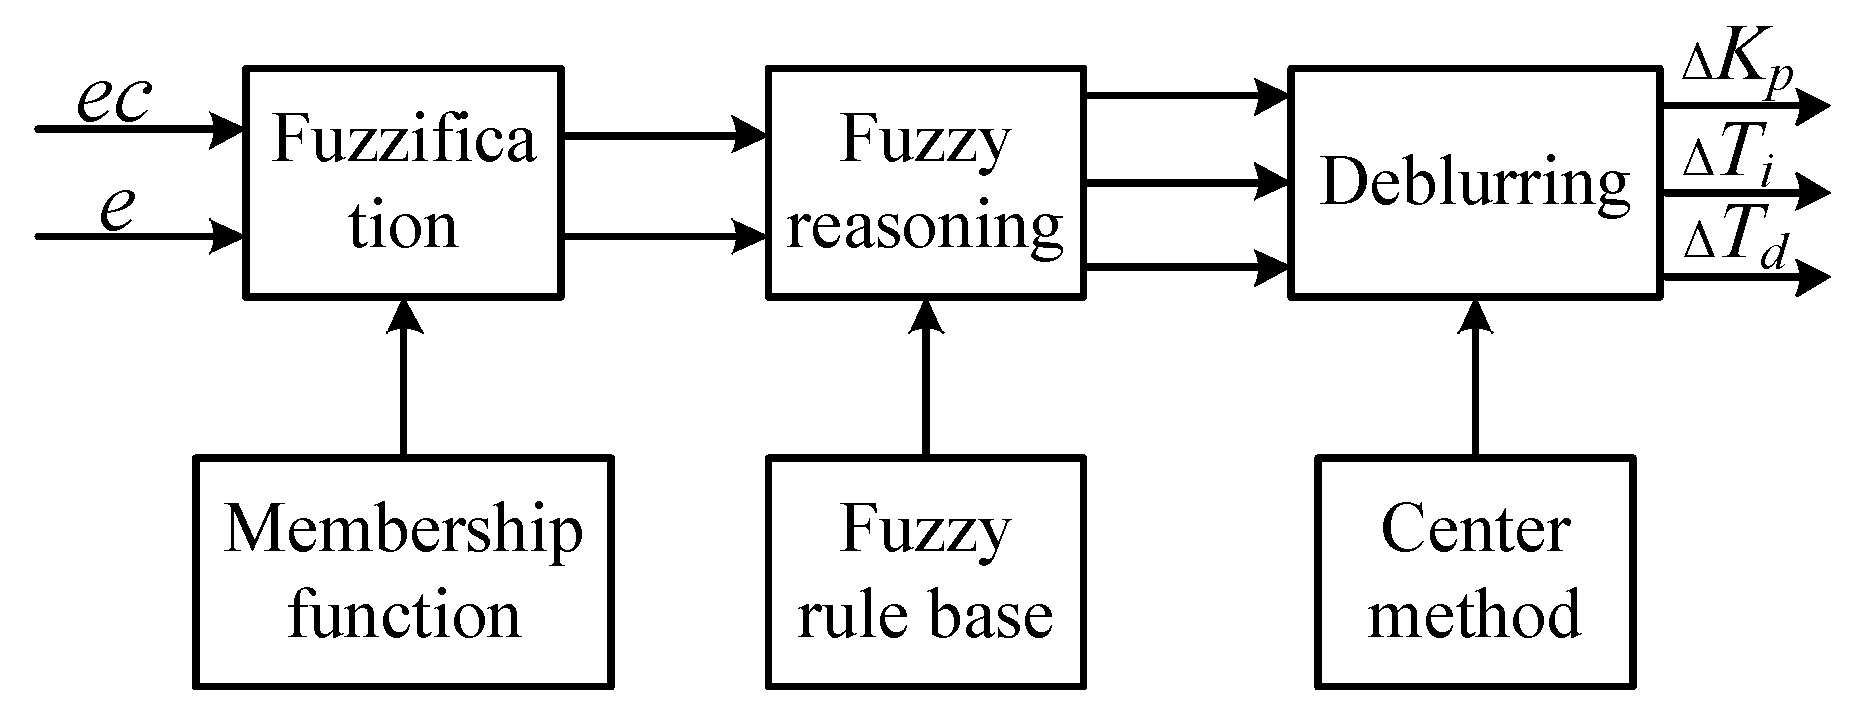
Fuzzy PID with an adaptive ability was adopted for the feedback controller. The deviation e, obtained by subtracting the actual displacement from the ideal displacement measured by the sensor, was selected. The deviation change rate ec, obtained by differentiating the deviation, was used as the input. To make full use of prior experience to develop appropriate fuzzy rules, the real-time online adjustment of PID parameters was applied in the case of dynamic system changes, and a two-input and three-output control module with adaptive ability, robustness, simple structure, convenient modification, and easy implementation was constructed. A fuzzy controller is typically composed of fuzzy, fuzzy rule establishment, and unfuzzy, as shown in Figure 10.
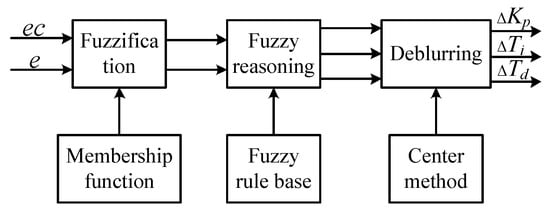
Figure 10.
The control process of fuzzy PID.
The input and output of the fuzzy controller are both exact values, and the fuzzy logic controller deals with fuzzy values; therefore, fuzzy processing is required.
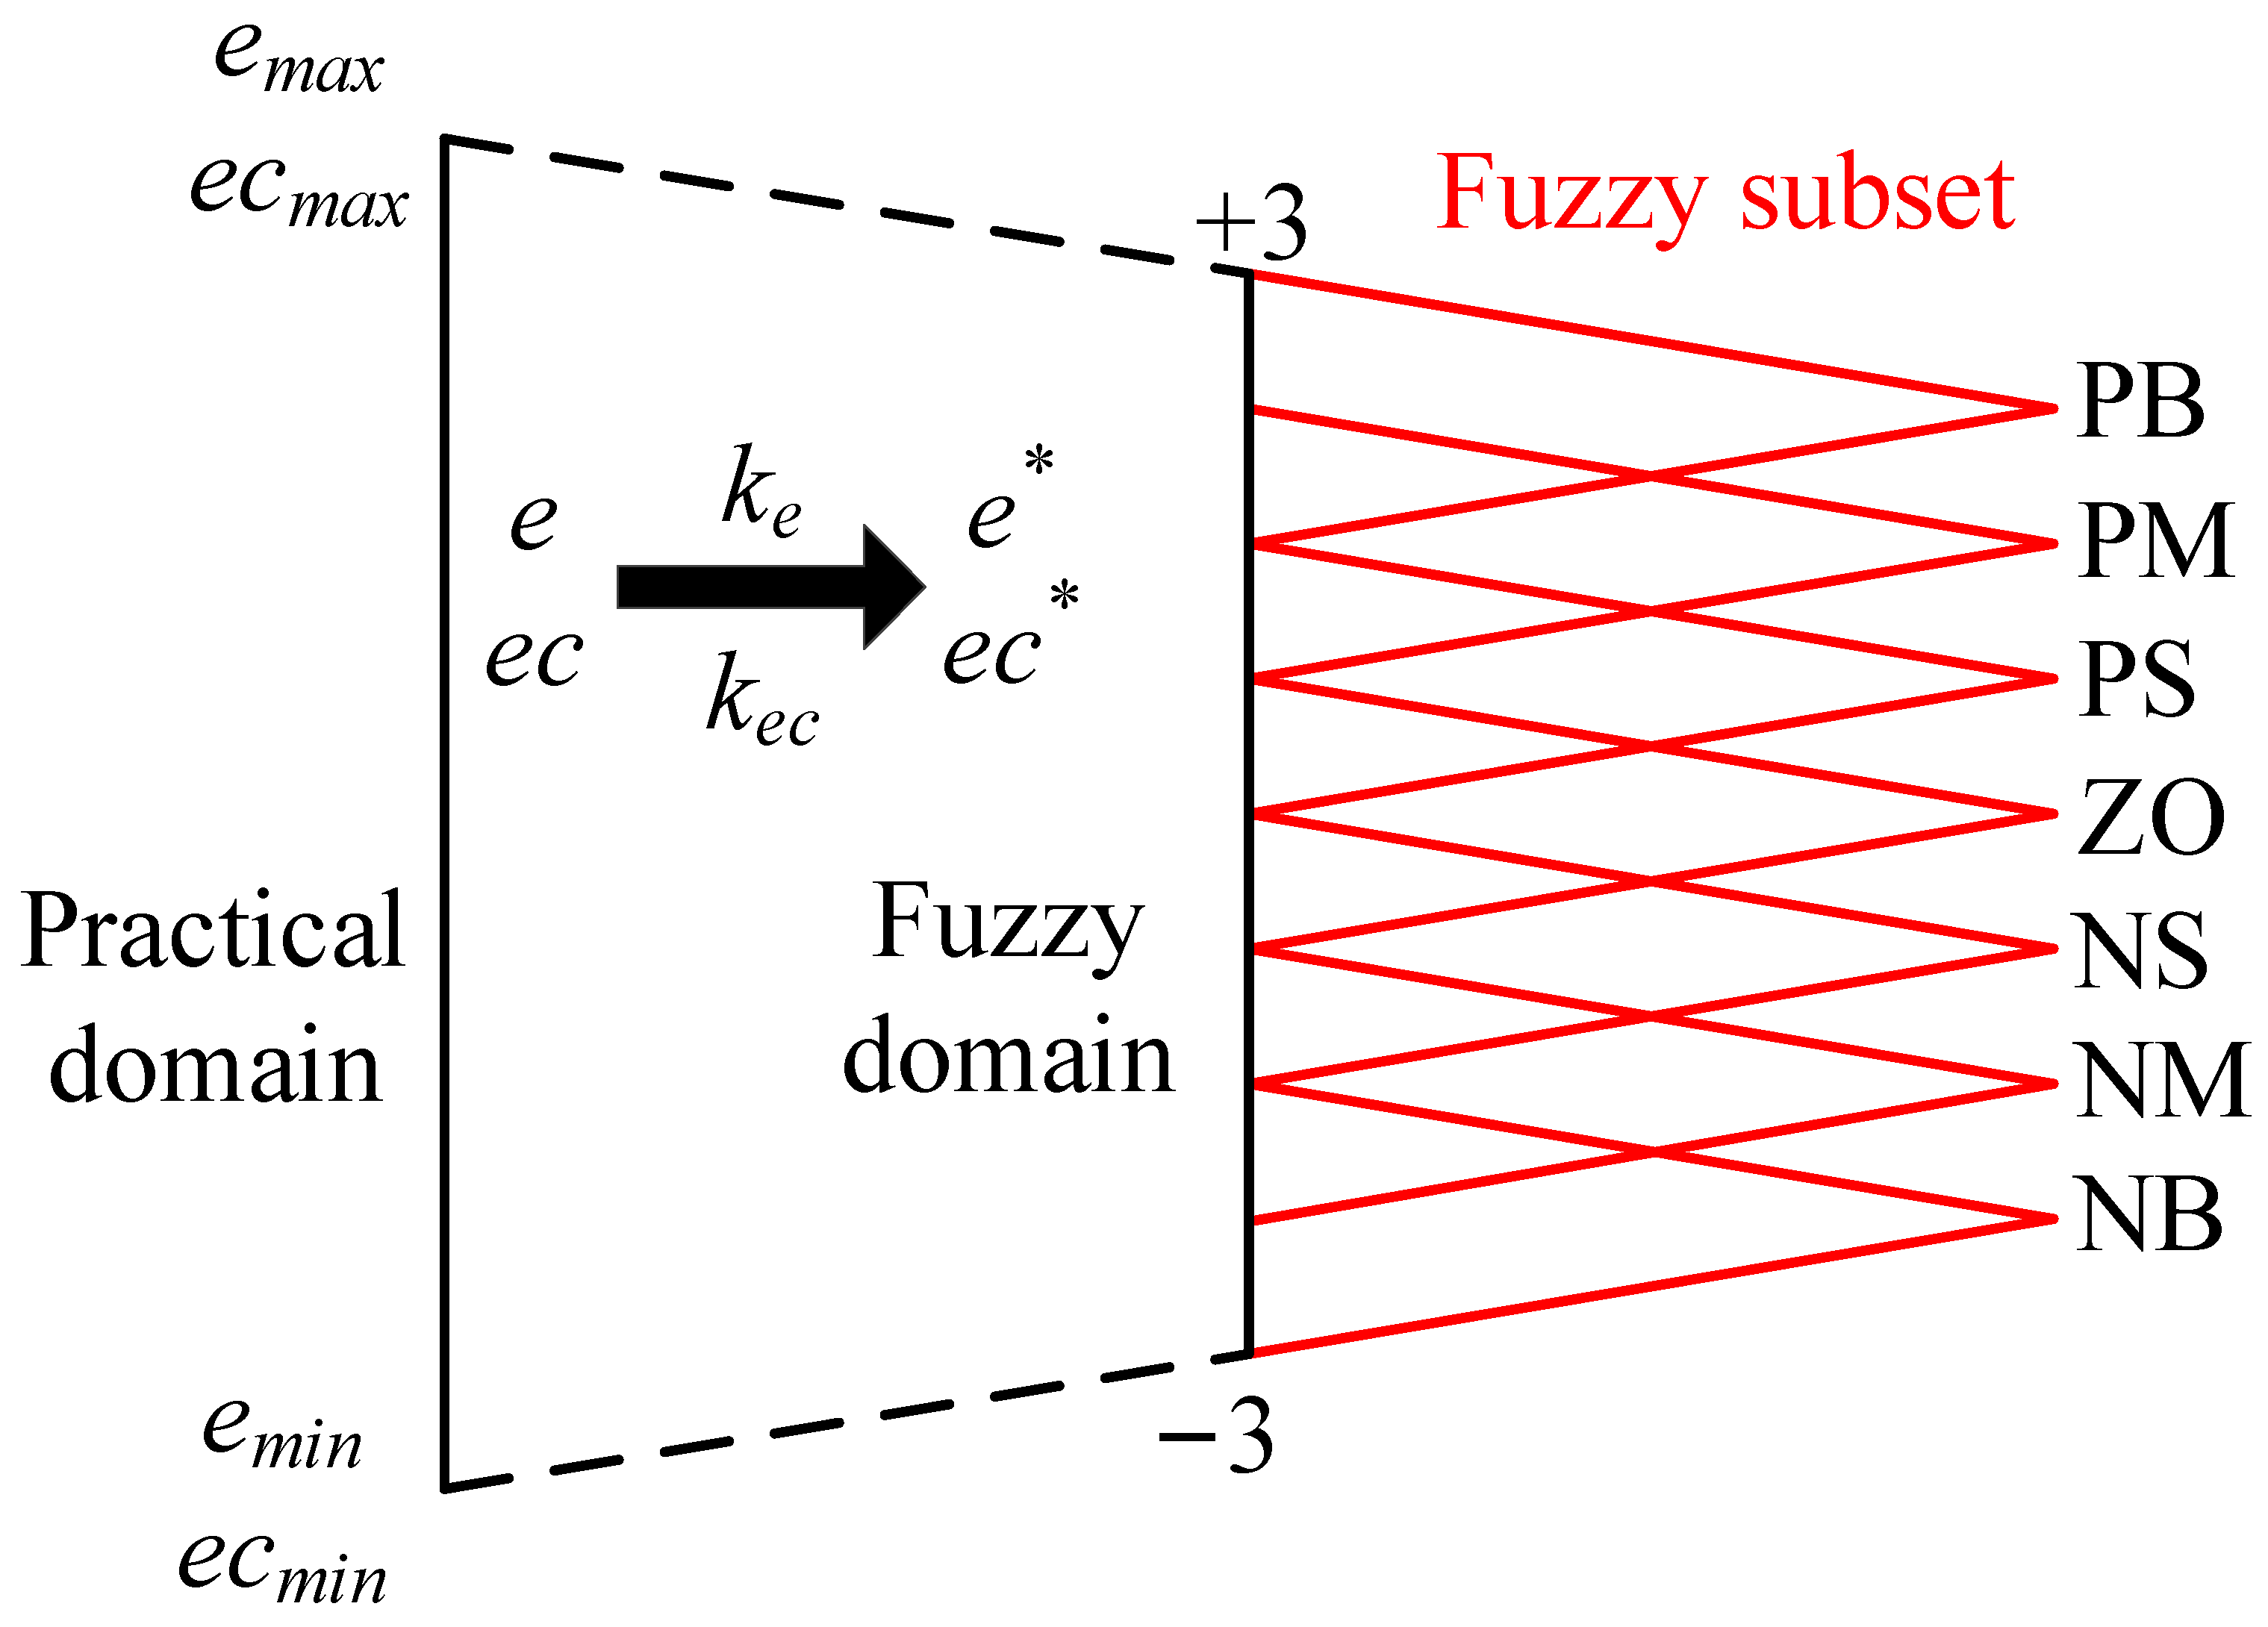
Because the actual variation ranges of e and ec cannot satisfy the requirements of the fuzzy controller integer theory domain, a scale change is required. If the actual change ranges of e and ec are [emin, emax] and [ecmin, ecmax], respectively, and the required domains are [e*min, e*max] and [ec*min, ec*max], respectively, the change formula is
where ke and kec are the scale factors of e and ec, respectively, as follows:
To simplify the fuzzy rule and make it easy to read, the parameters were finally scaled to the appropriate range after several changes according to the actual situation. The quantization domain range of e and ec was defined as (−3,3), and the quantization domain range of ΔKp, ΔTi, and ΔTd was similarly defined as (−3,3).
After processing, the discussion domain was divided into multiple language variables to express the required fuzzy subset, which was further divided into seven language variables: negative big (NB), negative medium (NM), negative small (NS), zero (ZO), positive small (PS), positive median (PM), and positive big (PB). Finally, the triangular membership function was selected, and the final fuzzy process is shown in Figure 11.
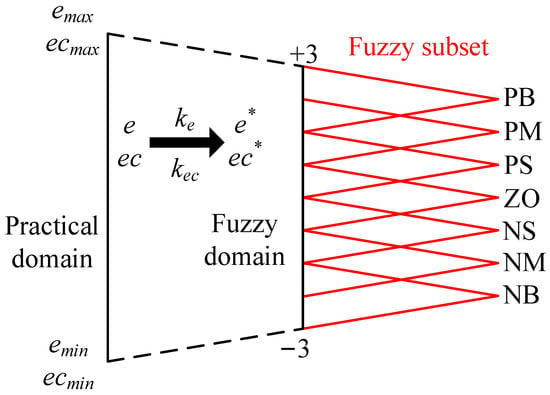
Figure 11.
The process of fuzzification.
Fuzzy rules are composed of a series of fuzzy implication relations, which can be expressed by if-then statements. The proportional link, Kp, can speed up the response, but if it is too large, it leads to an overshoot. The integration link, Ti, can eliminate static errors; however, it can easily cause integral saturation and overshoot in the early stages. The differential link, Td, can anticipate and act before the deviation becomes large; however, this increases the adjustment time. Based on the above experience, the general ideas for establishing fuzzy rules are as follows:
- (1)
- When e is large, Kp should be set to a large value to ensure system response speed. Meanwhile, to avoid a large overshoot in the system and limit the integration function, Ti should be set to zero and Td should be set to a smaller value.
- (2)
- When e is medium, the Kp value should be reduced. Simultaneously, to prevent the system from becoming unstable owing to noise, the value of Ti should be increased appropriately to reduce the time to reach a steady state.
- (3)
- When e is small, to reduce the steady-state time of the system and avoid a decrease in adjustment accuracy caused by steady-state errors, Kp and Ti should be set to larger values. The Td value is mainly adjusted based on the absolute value of ec. When the absolute value of ec is large, the Td value is small to prevent multiple shocks in the system. In other cases, the Td value is medium.
Based on the general method of establishing fuzzy rules, a detailed design of the fuzzy rules with three link coefficients is presented in Table 2, Table 3 and Table 4.

Table 2.
Fuzzy control rules for ΔKp.

Table 3.
Fuzzy control rules for ΔTi.

Table 4.
Fuzzy control rules for ΔTd.
Finally, the variation in the PID parameters, deduced using the fuzzy rules above, is fuzzy and can only be obtained through defuzzification. As shown in this section, the center-of-gravity method is selected. Its principle is to obtain the center of gravity of all elements in the set of fuzzy inference results and take the element corresponding to the center of gravity as the exact value after fuzzy. The theoretical calculation formula is as follows:
where M is the degree of membership, and F is the fuzzy quantization value.
5. Simulation and Experimental Test
5.1. Simulation and Verification of the Model
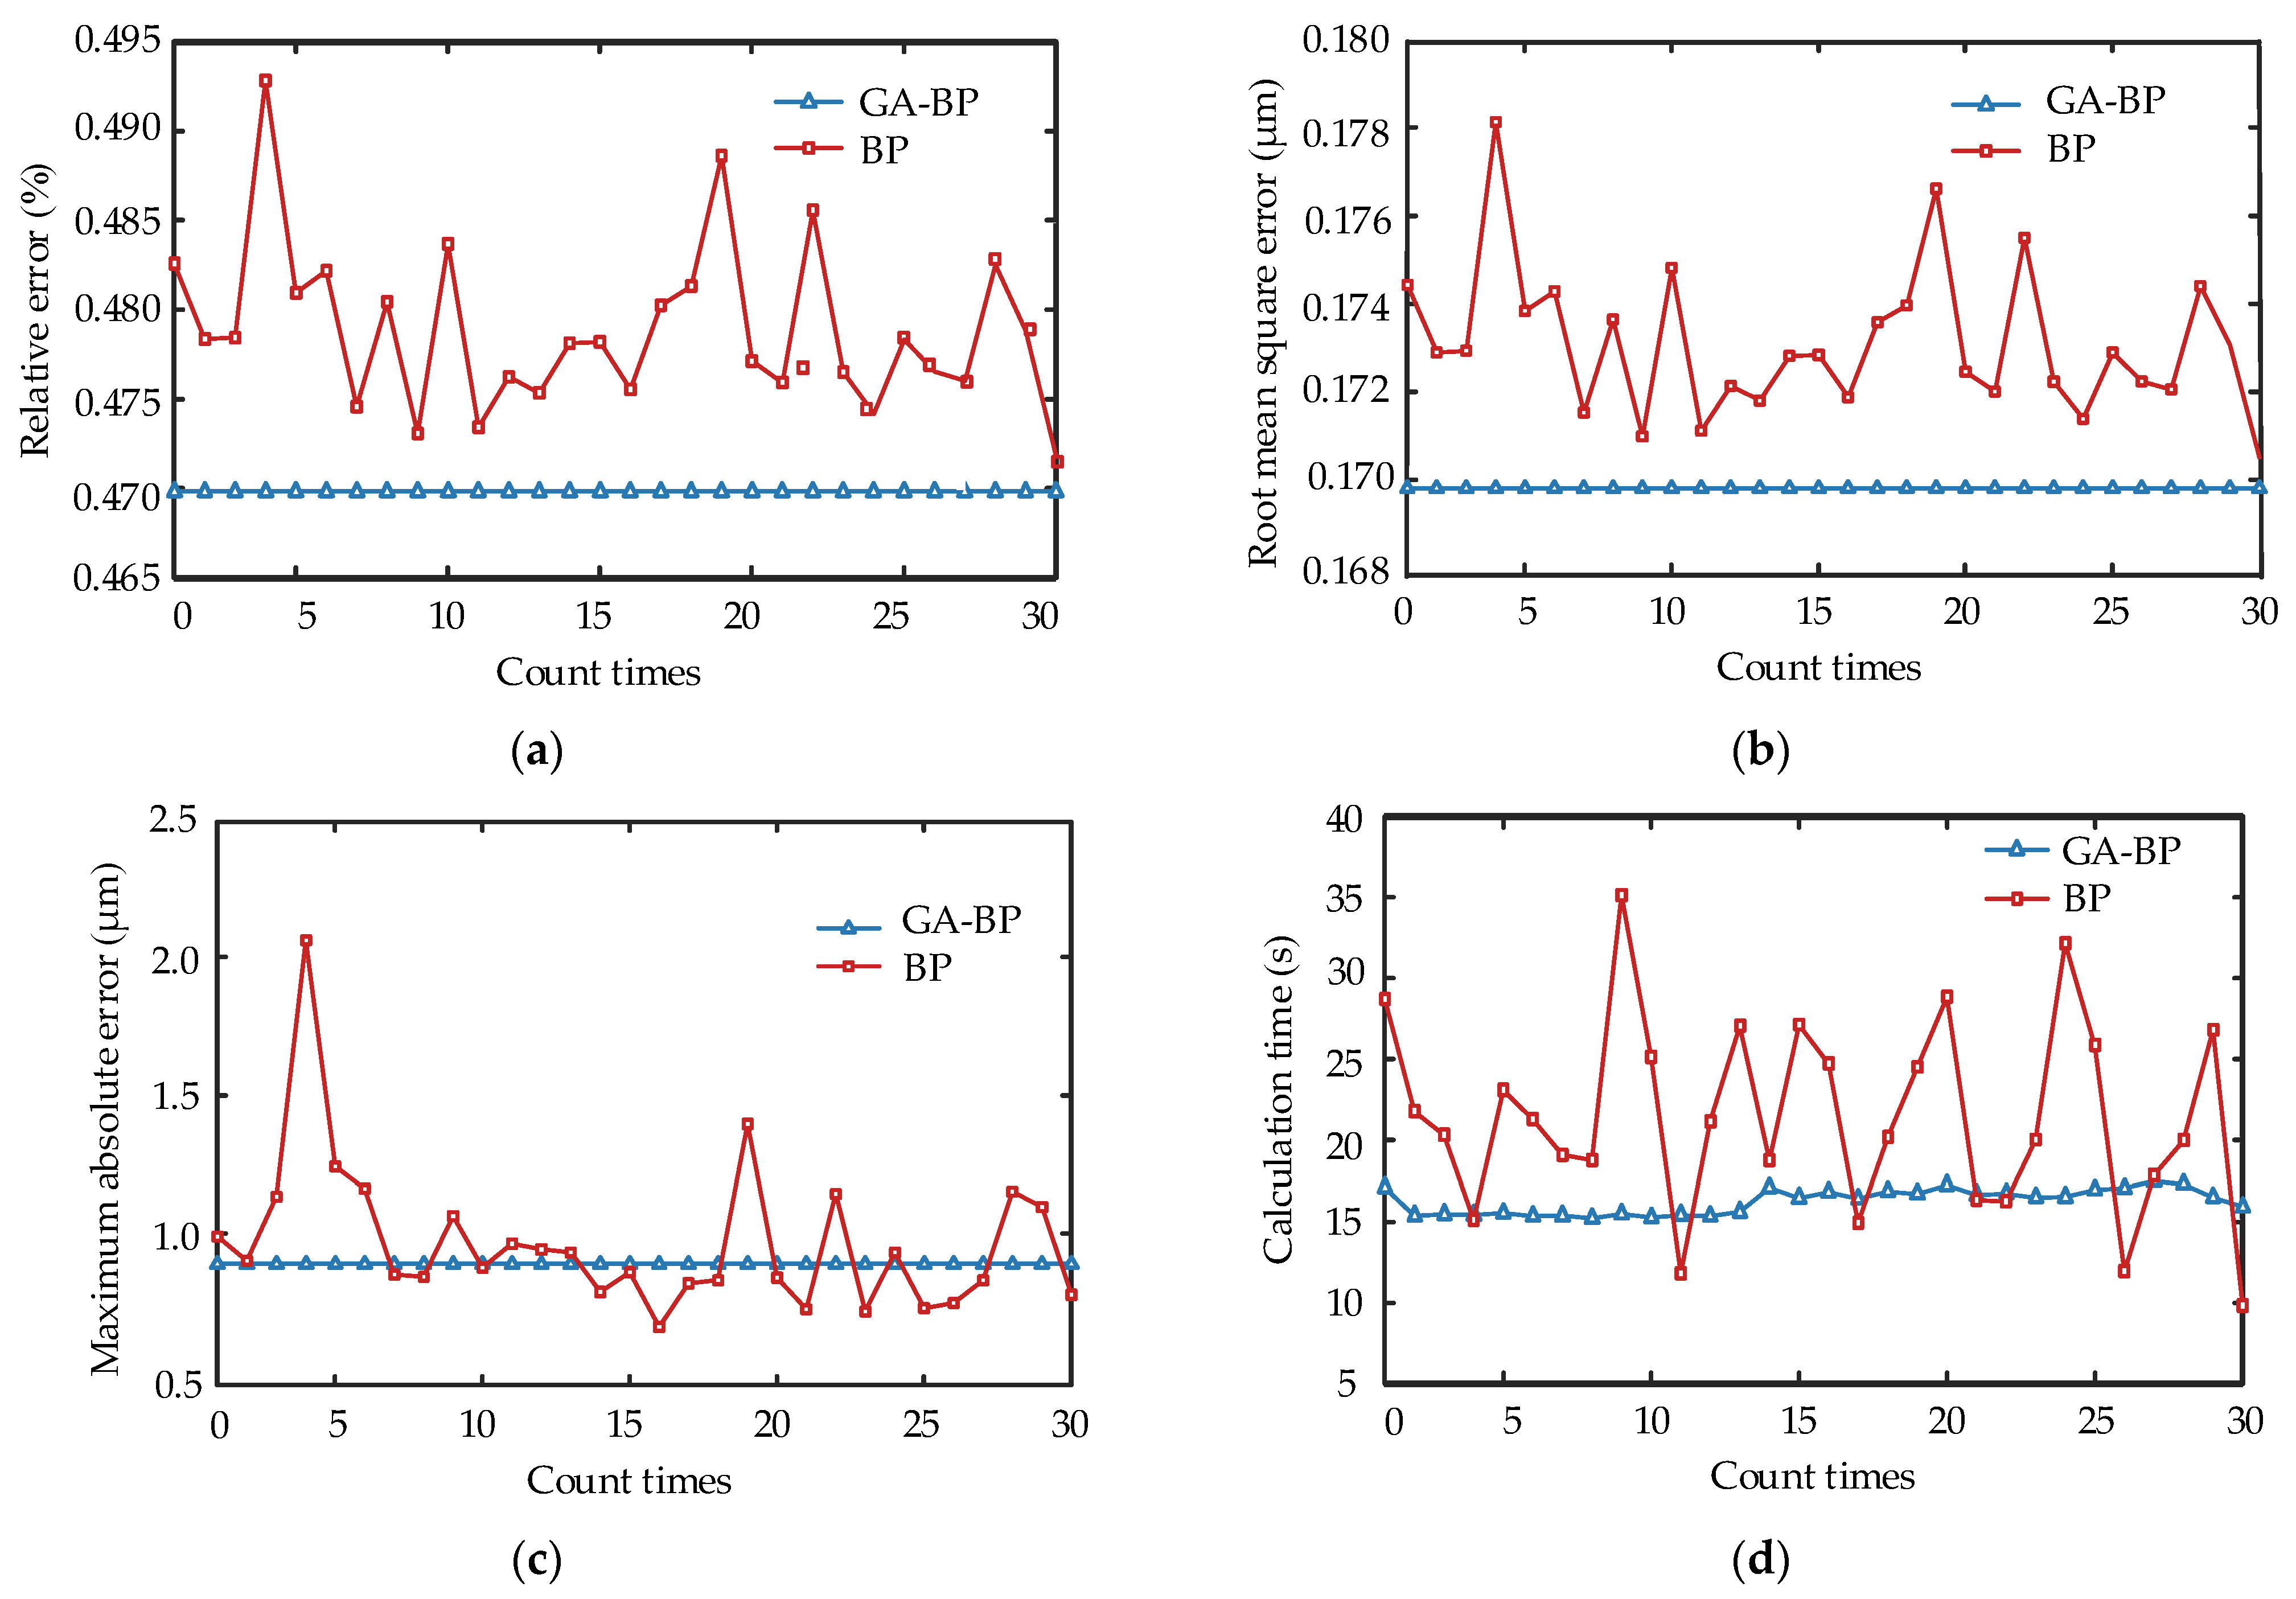
To verify the advantages of the GA-BP, the BP and GA-BP neural networks were run 30 times for fitting. The largest number of training iterations was set to 104, the training precision target was 10−7, the training speed was 0.05, and the rest were default values. A performance comparison is shown in Figure 12. The BP neural network improved by the GA exhibited the same operational results every time. Although the maximum absolute error (MAE) and running time were slightly worse than those of the BP neural network, the relative error (RE) and root mean square error (RMSE) were smaller than those of the BP neural network. This shows that the GA-BP neural network can determine the global optimal solution, which has a higher fitting effect. Therefore, the superiority of the GA-BP neural network was verified.
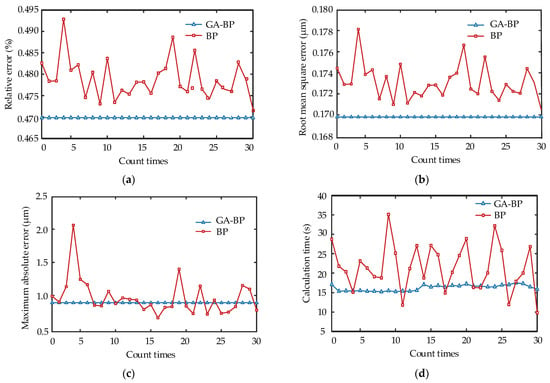
Figure 12.
Comparison of GA-BP and BP neural network algorithms: (a) relative errors; (b) root mean square errors; (c) maximum absolute errors; (d) computation times.
To explore the advantages and disadvantages of each algorithm, three performance indexes–RE, RMSE, and MAE–were calculated, as listed in Table 5. The PI model had a simple structure, which made it easy to find the inverse model, but exhibited a poor fitting effect, whereas the polynomial and MPI models exhibited a good fitting effect but were more complex, making it difficult to find the inverse models. However, in the BP neural network, especially the BP neural network improved by the GA, both the overall and local errors were considerably smaller than those in the above model.

Table 5.
The fitting results of each algorithm.
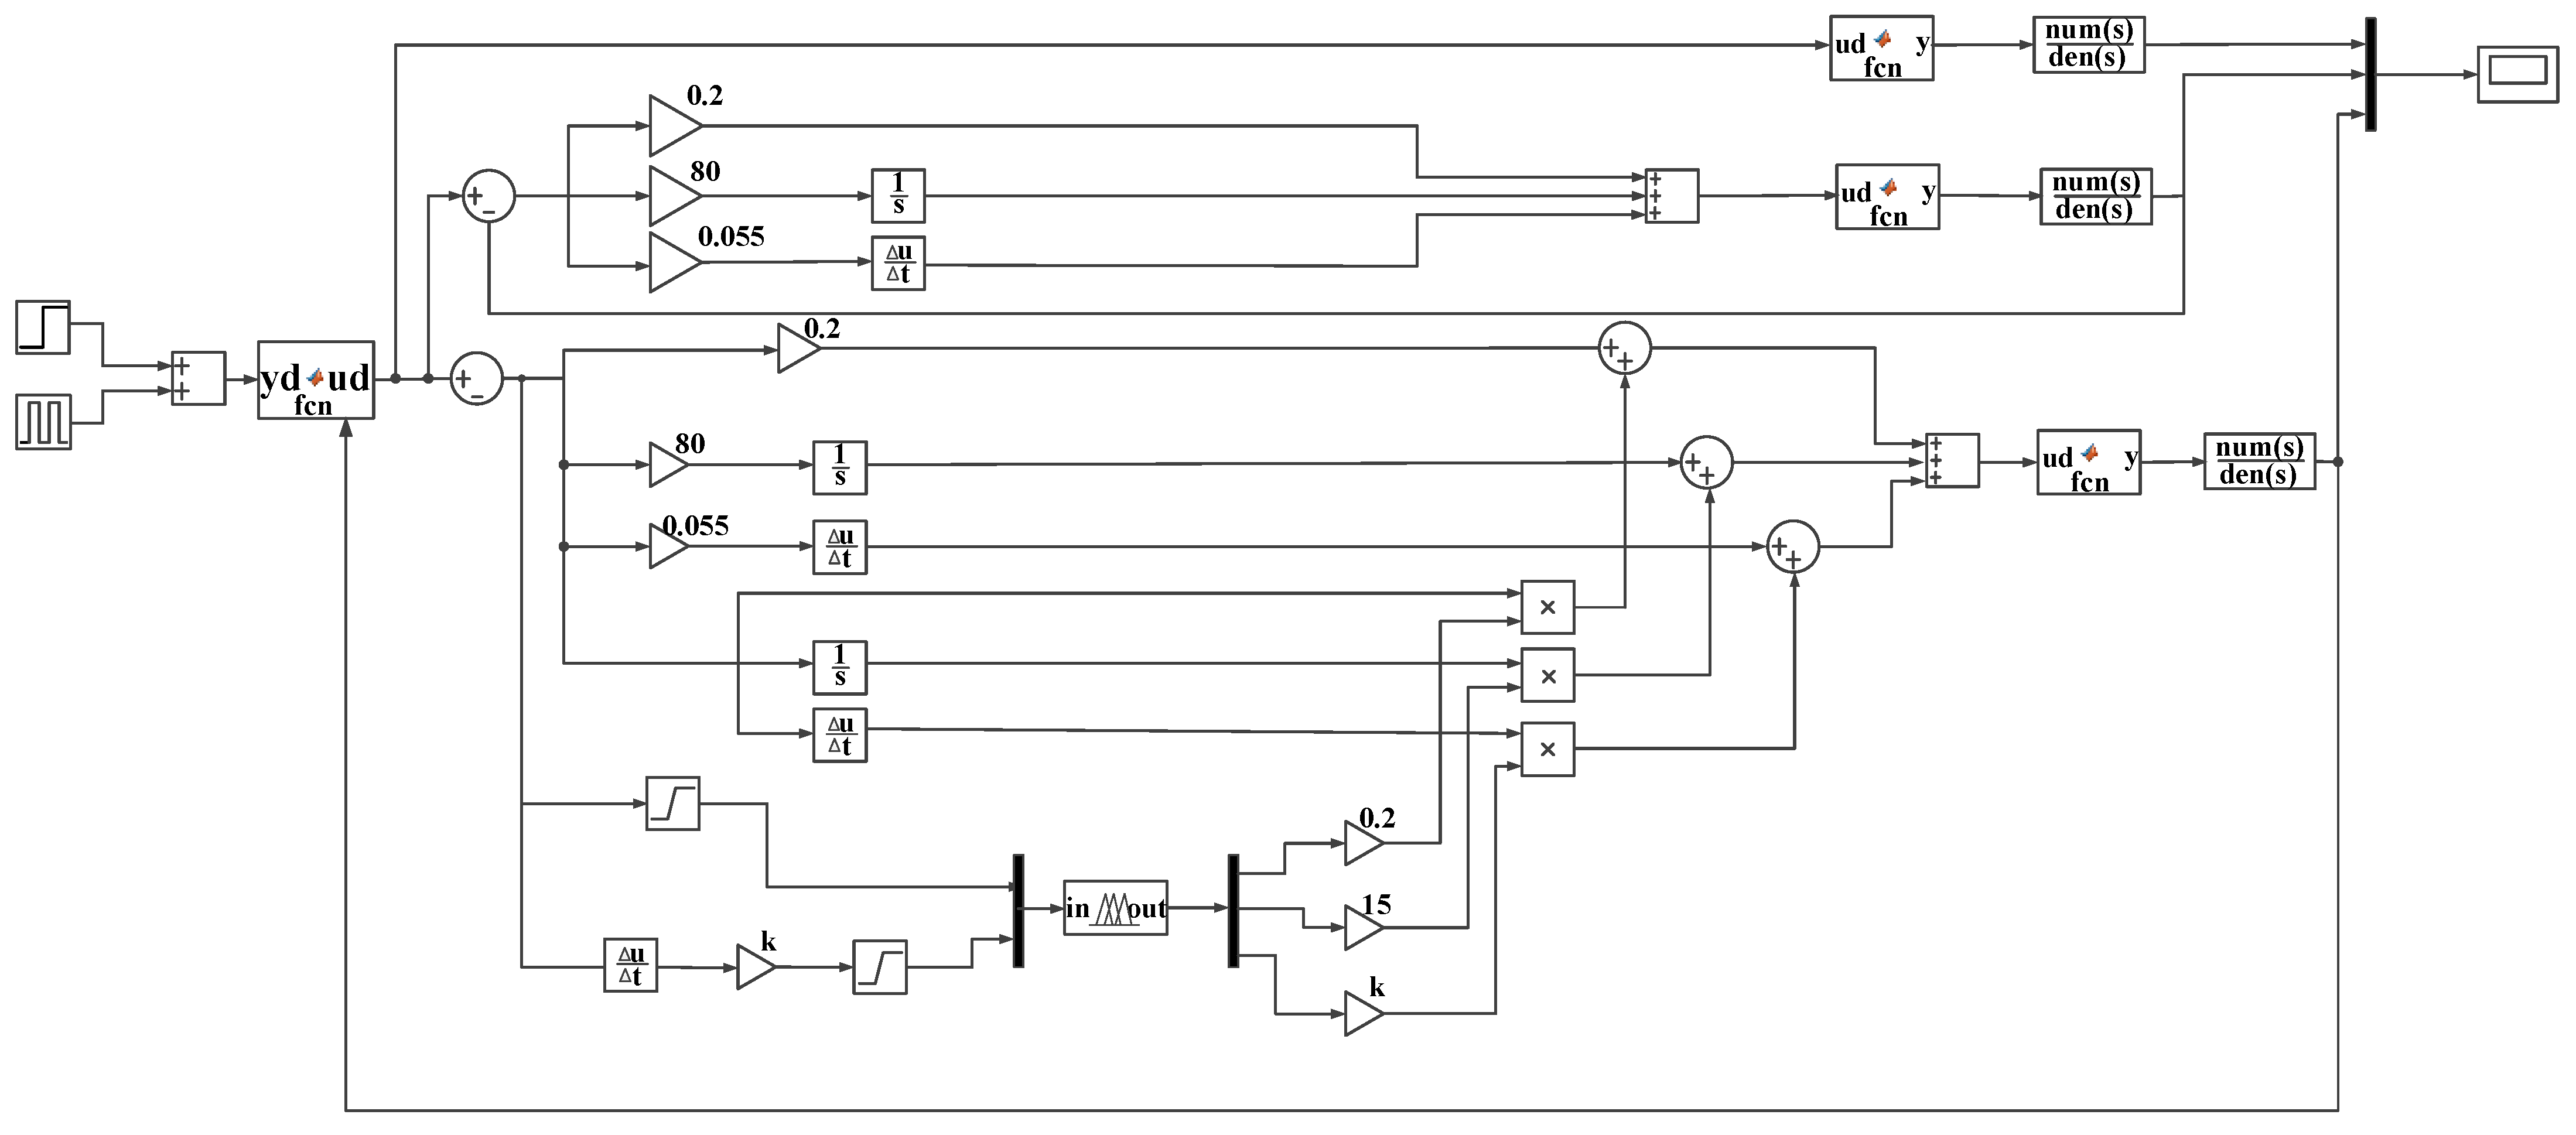
To verify the composite control method, a simulation model was established in the MATLAB/Simulink environment, and a simulation analysis was conducted. The simulation model is shown in Figure 13. The PID controller was set to be consistent with the initial value of the fuzzy PID controller, where the proportional coefficient Kp was 0.2, the integral coefficient Ti was 80, and the differential coefficient Td was 0.055.
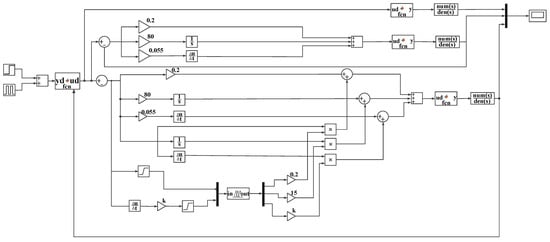
Figure 13.
Simulation model of compound control.
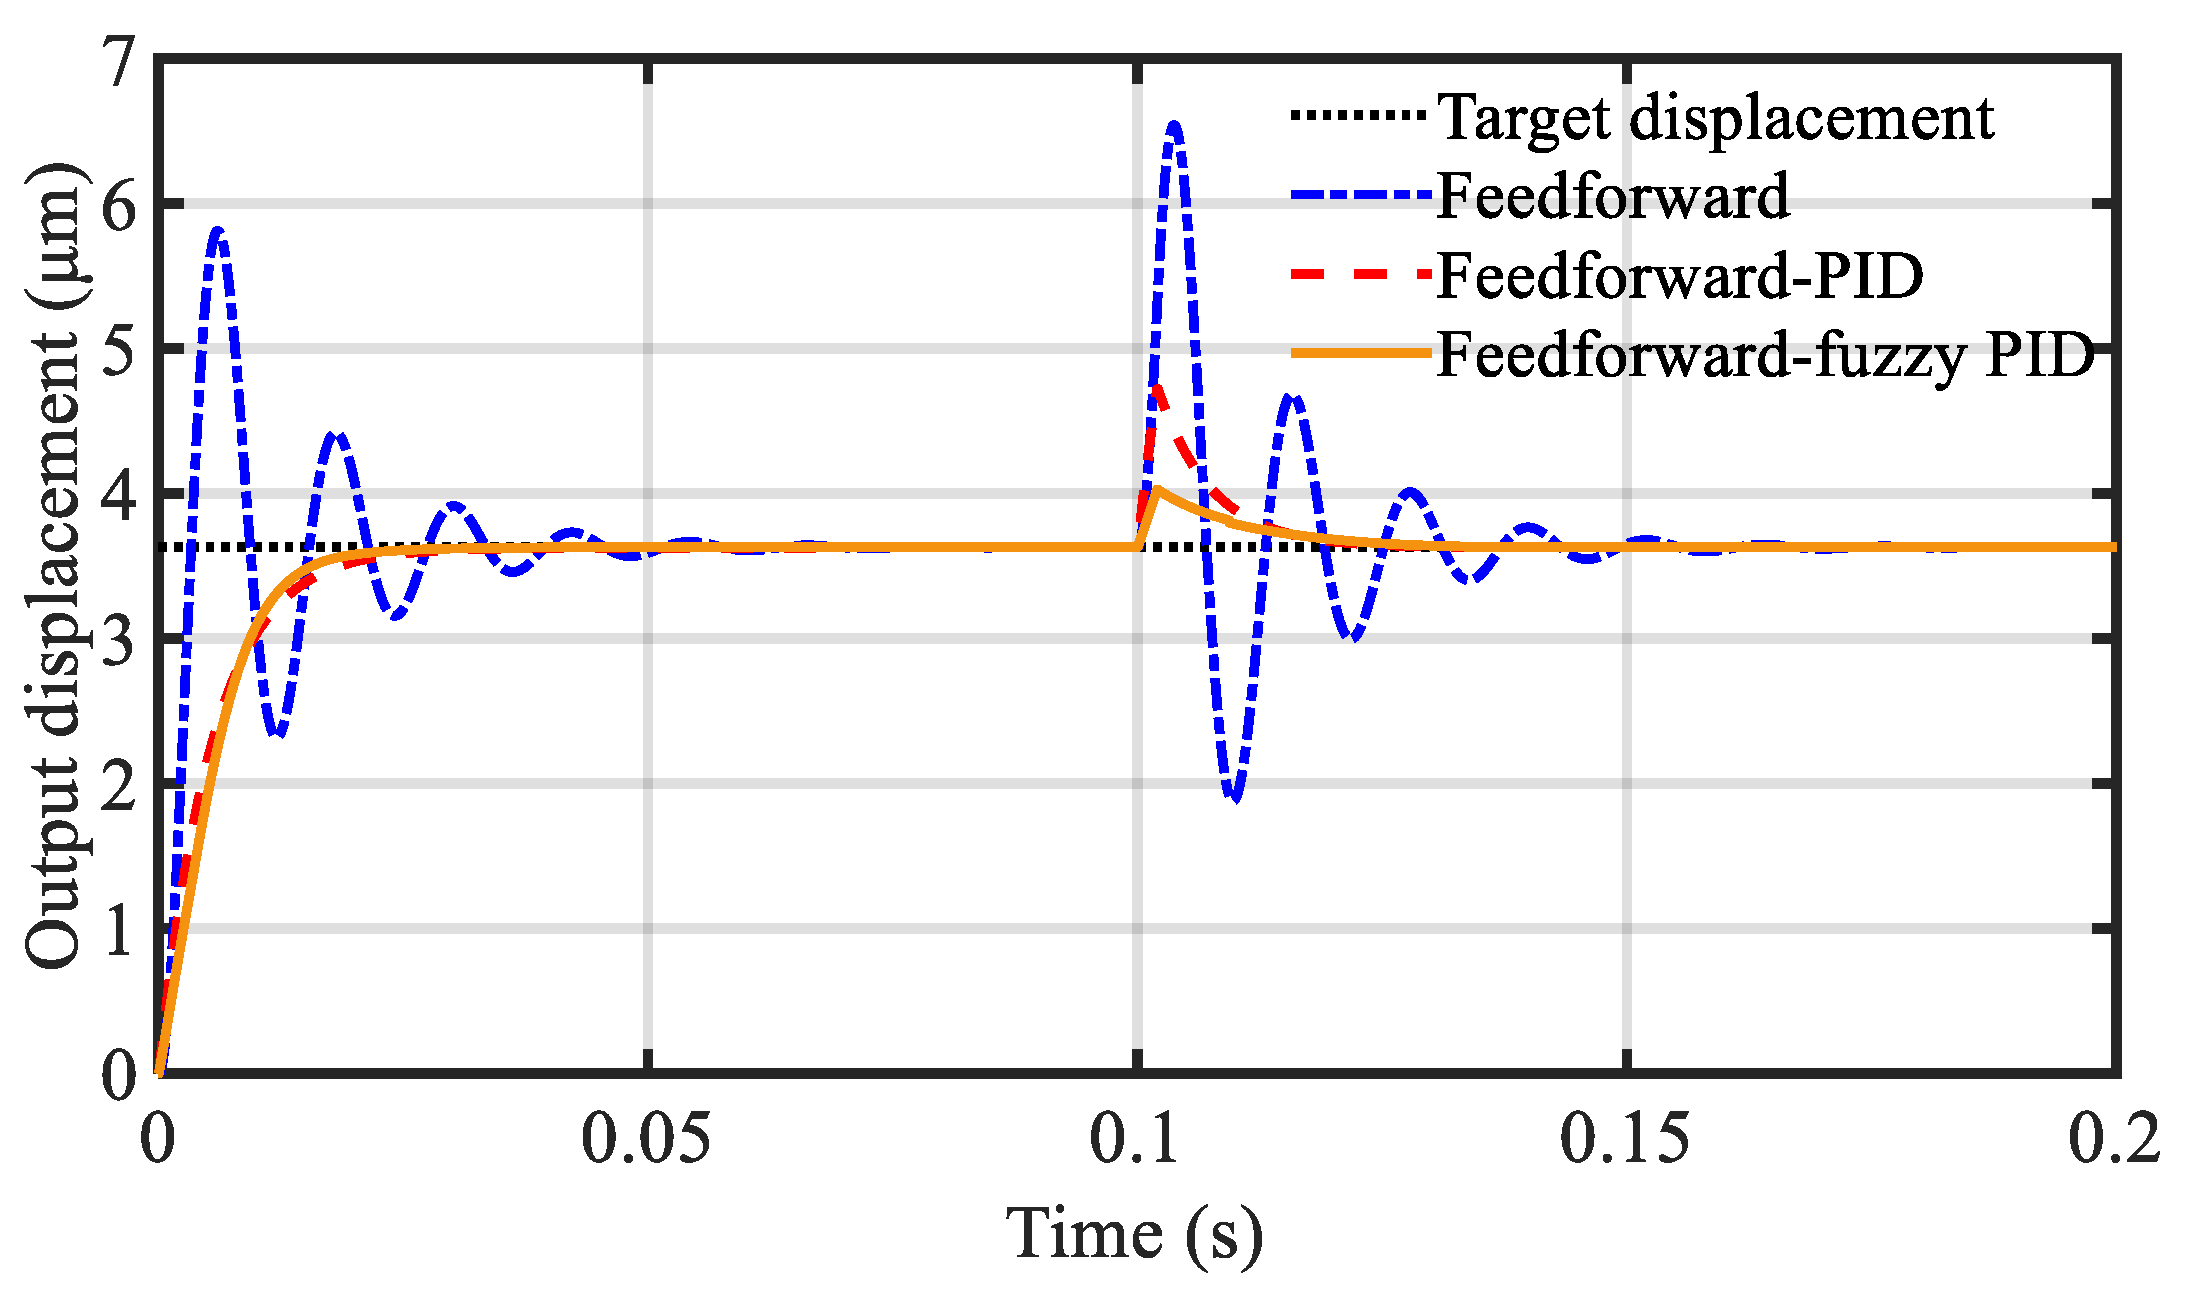
A step signal with a maximum value of 1 was inputted at an initial time of 0 s, and an instantaneous interference signal with a value of 1 was introduced at 0.1 s. The results of each control scheme are shown in Figure 14.
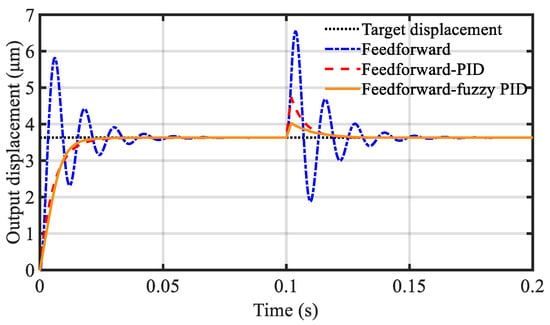
Figure 14.
Comparison of the results of each control scheme.
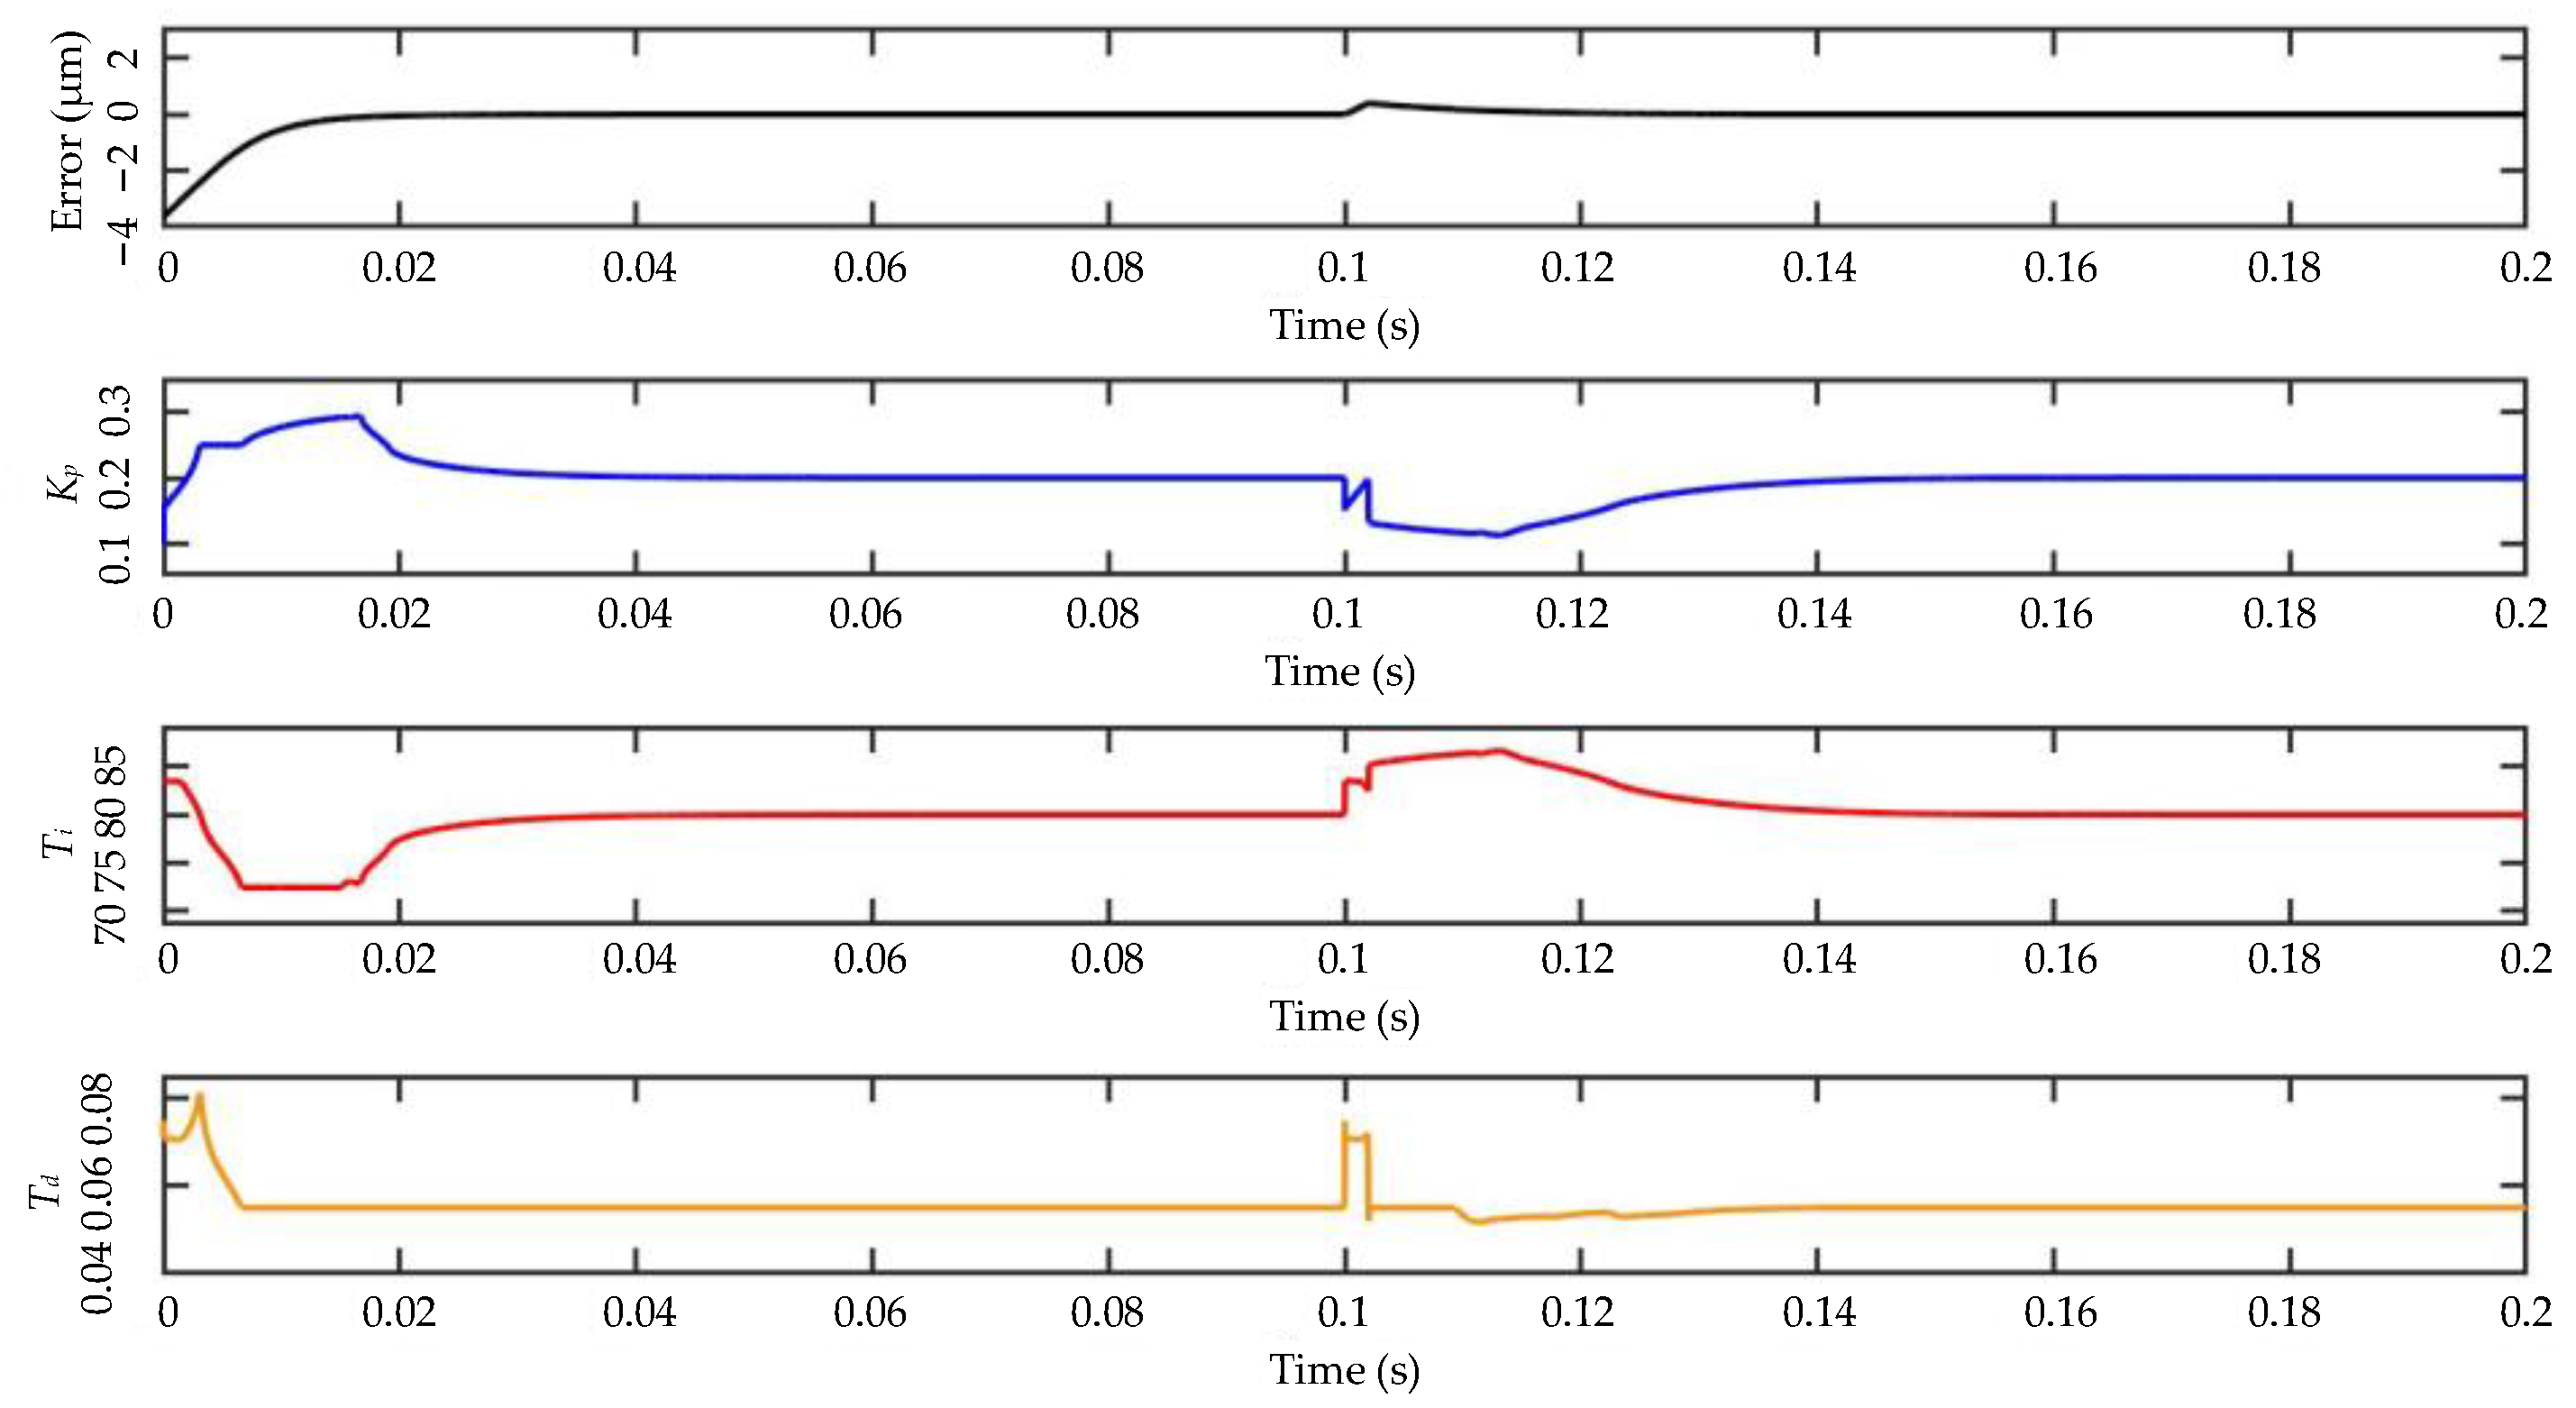
By analyzing the figure above and combining it with the parameters of the fuzzy PID, as shown in Figure 15, it can be observed that when feedforward control was simply used, the vibration phenomenon occurred under the step signal owing to the influence of the elastic deformation of the structure, and the system became stable at approximately 0.08 s. The adjustment time of the feedforward PID control system was approximately 0.04 s, whereas the adjustment speed of the feedforward fuzzy PID control system was slightly slower than that of the PID control before 0.00882 s. Then, the convergence speed gradually increased and became stable at approximately 0.035 s. This was because the role of the scale term in the PID controller began to decrease with the reduction in error, whereas the fuzzy PID gradually increased the scale coefficient with the reduction in error; hence, it could reach the set goal faster. When interference occurred, with the overshots of the feedforward control system, the feedforward PID control system was 29.30% and those of the feedforward fuzzy PID control system were 80.09%, 29.30%, and 10.35%, respectively. The results show that the feed-forward fuzzy PID control system had a high response speed, small overshoot, and good anti-interference performance.
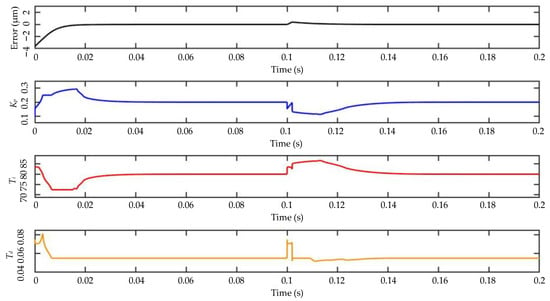
Figure 15.
The parameters of fuzzy PID.
5.2. Experiment of Compound Control
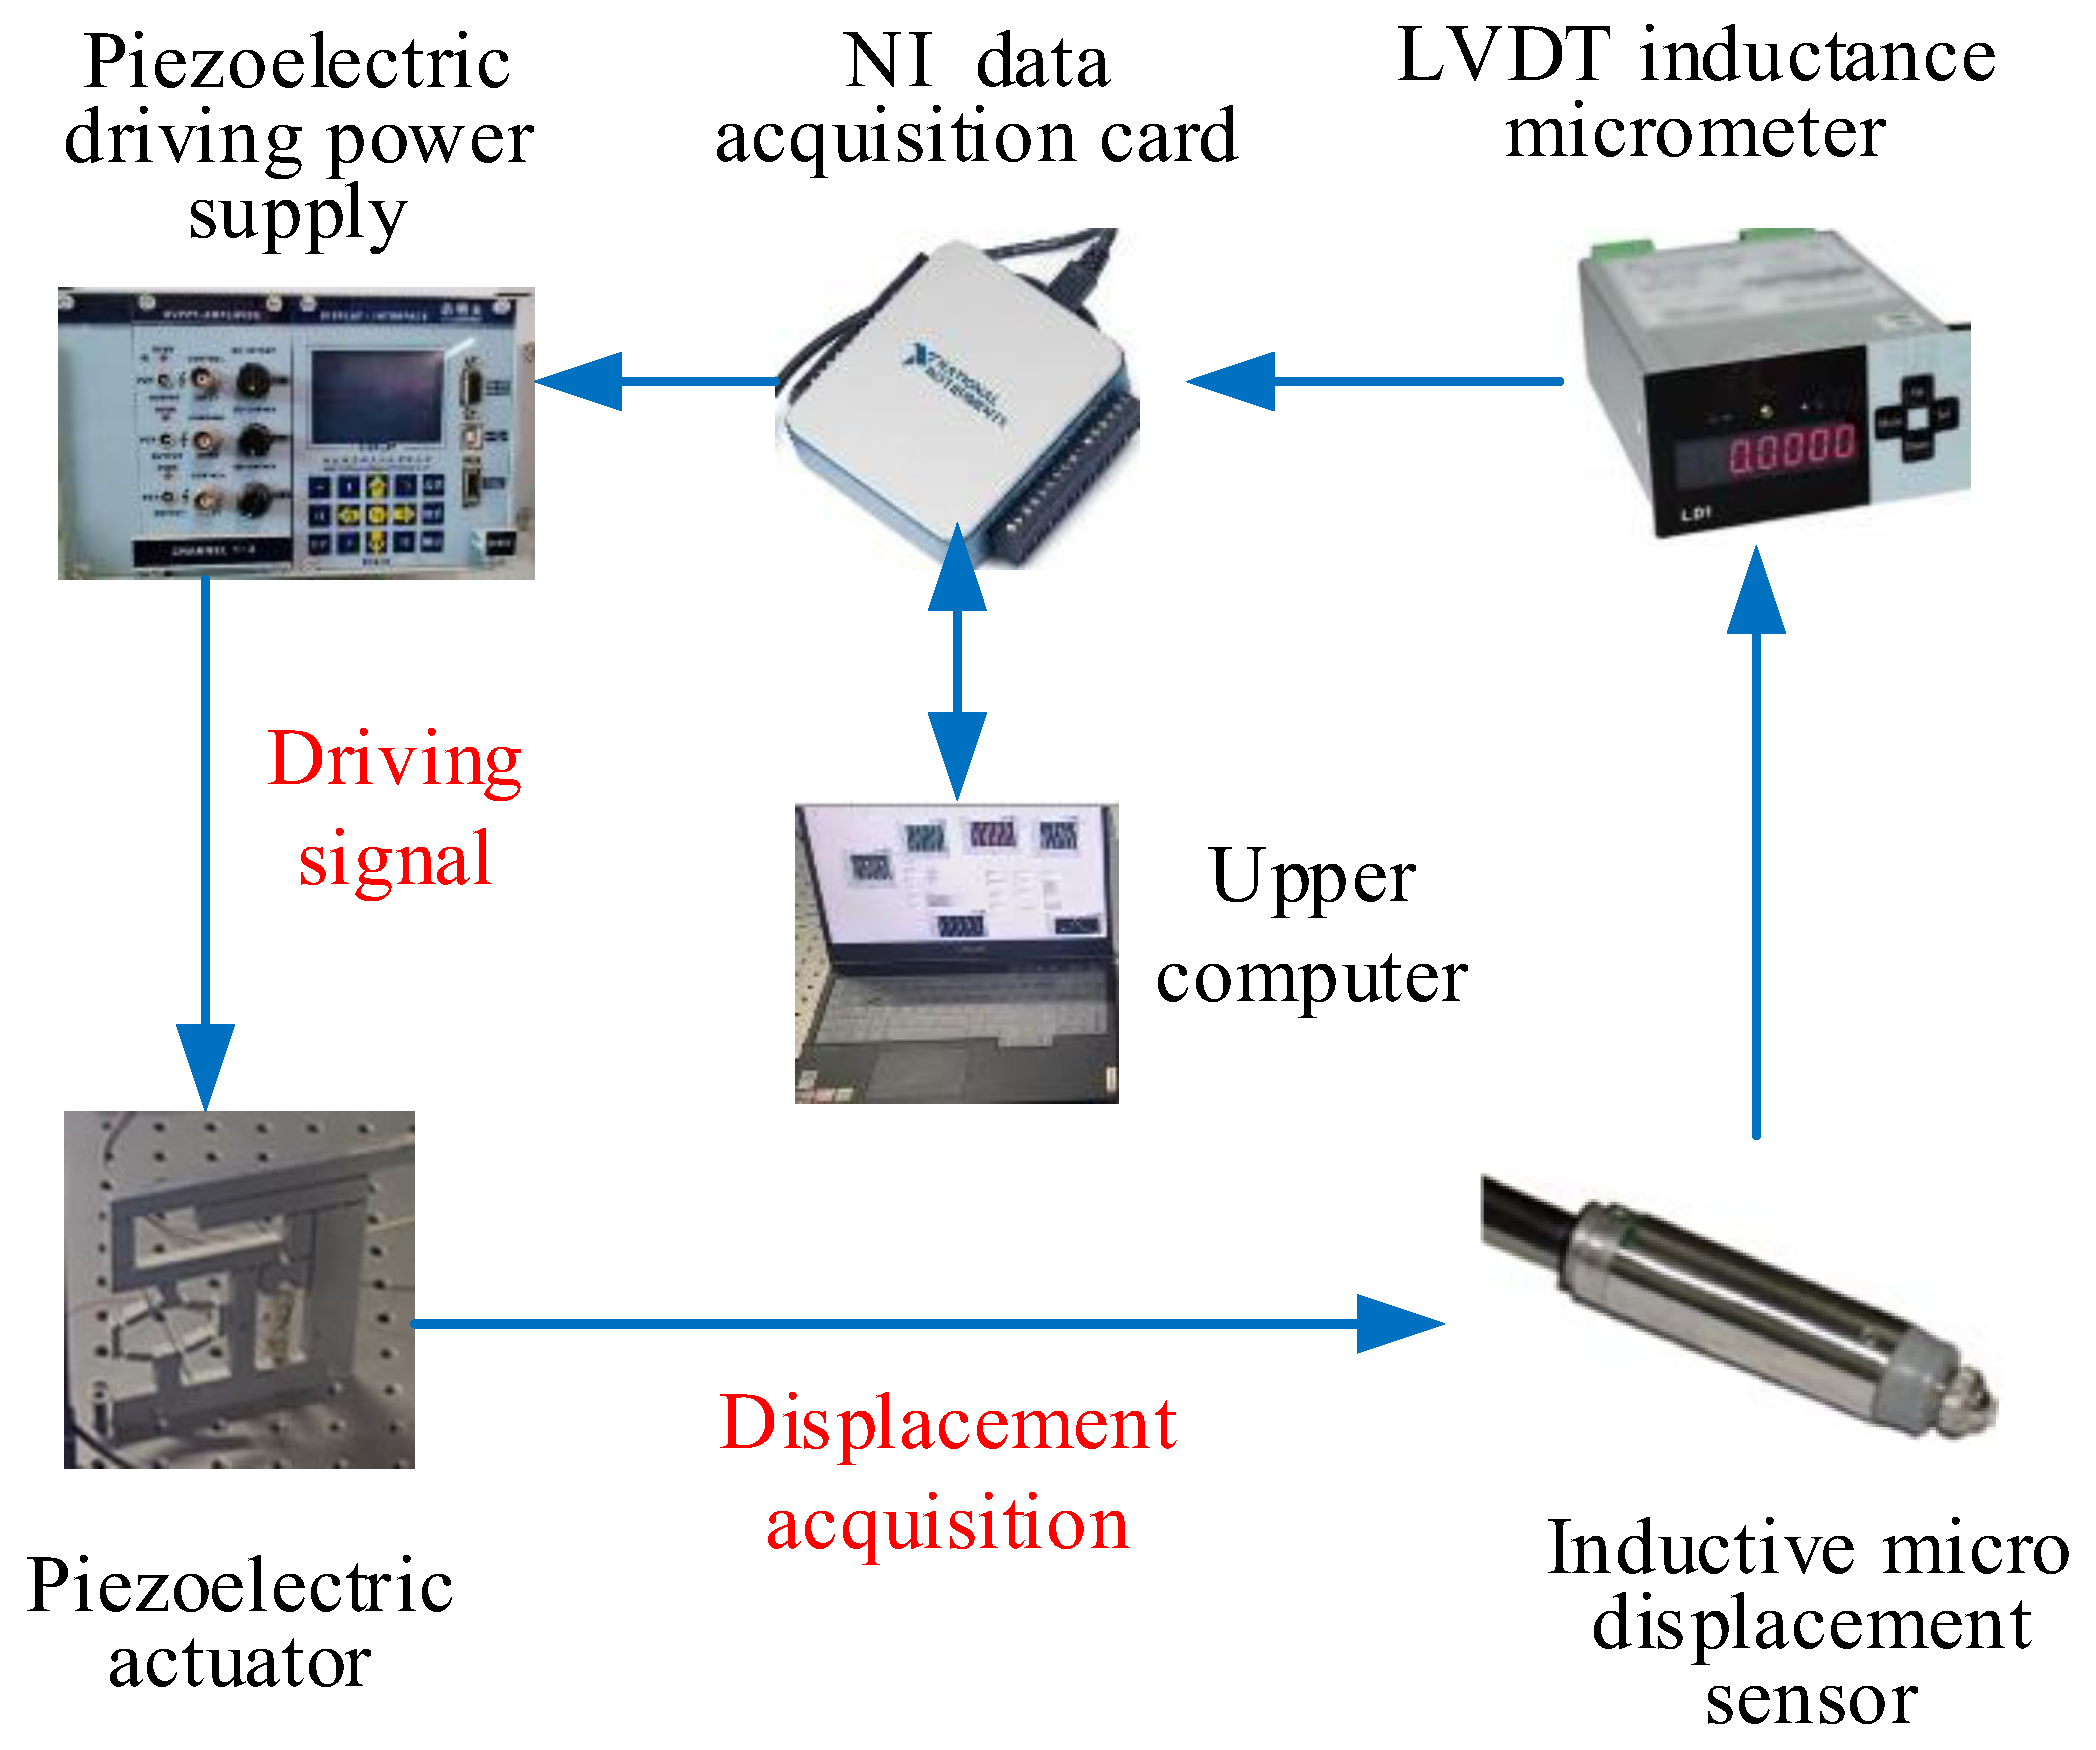
The advantages of the GA-BP feedforward fuzzy PID control were further verified through experiments on the proposed piezoelectric actuator. The experimental test system for the piezoelectric driver is shown in Figure 16. An MTP150/7×7/39.1 type piezoelectric ceramic stack (Core Tomorrow Co., Ltd., Harbin, China) was used for the experiment. The driving voltage of the piezoelectric stack was 0–150 V, and the output displacement under a driving voltage of 150 V was 38 μm. The host computer used LabVIEW and MATLAB to develop an upper computer platform for realizing the control scheme. The NI USB-6001 data acquisition card was connected to the host through a serial port and was responsible for sending the driver signals and receiving the acquisition signals. An E01.C series with modular driving power supply from Harbin Core Tomorrow Science & Technology Co., Ltd. (Harbin, China) was used. Through its internal voltage and power amplifier circuit, the external analog signal was amplified with output to the piezoelectric ceramic to achieve microdisplacement. An LVDT inductive displacement sensor was used. After the microdisplacement was measured by the probe, the displacement signal was converted into an electrical signal and inputted to the data acquisition card to realize closed-loop control.
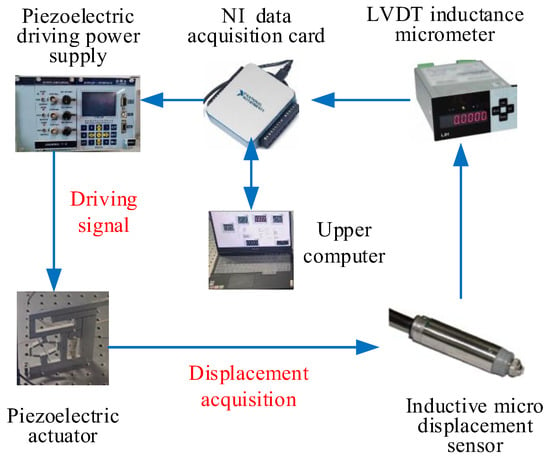
Figure 16.
Experimental test system for the piezoelectric actuator (Ref. [21]).
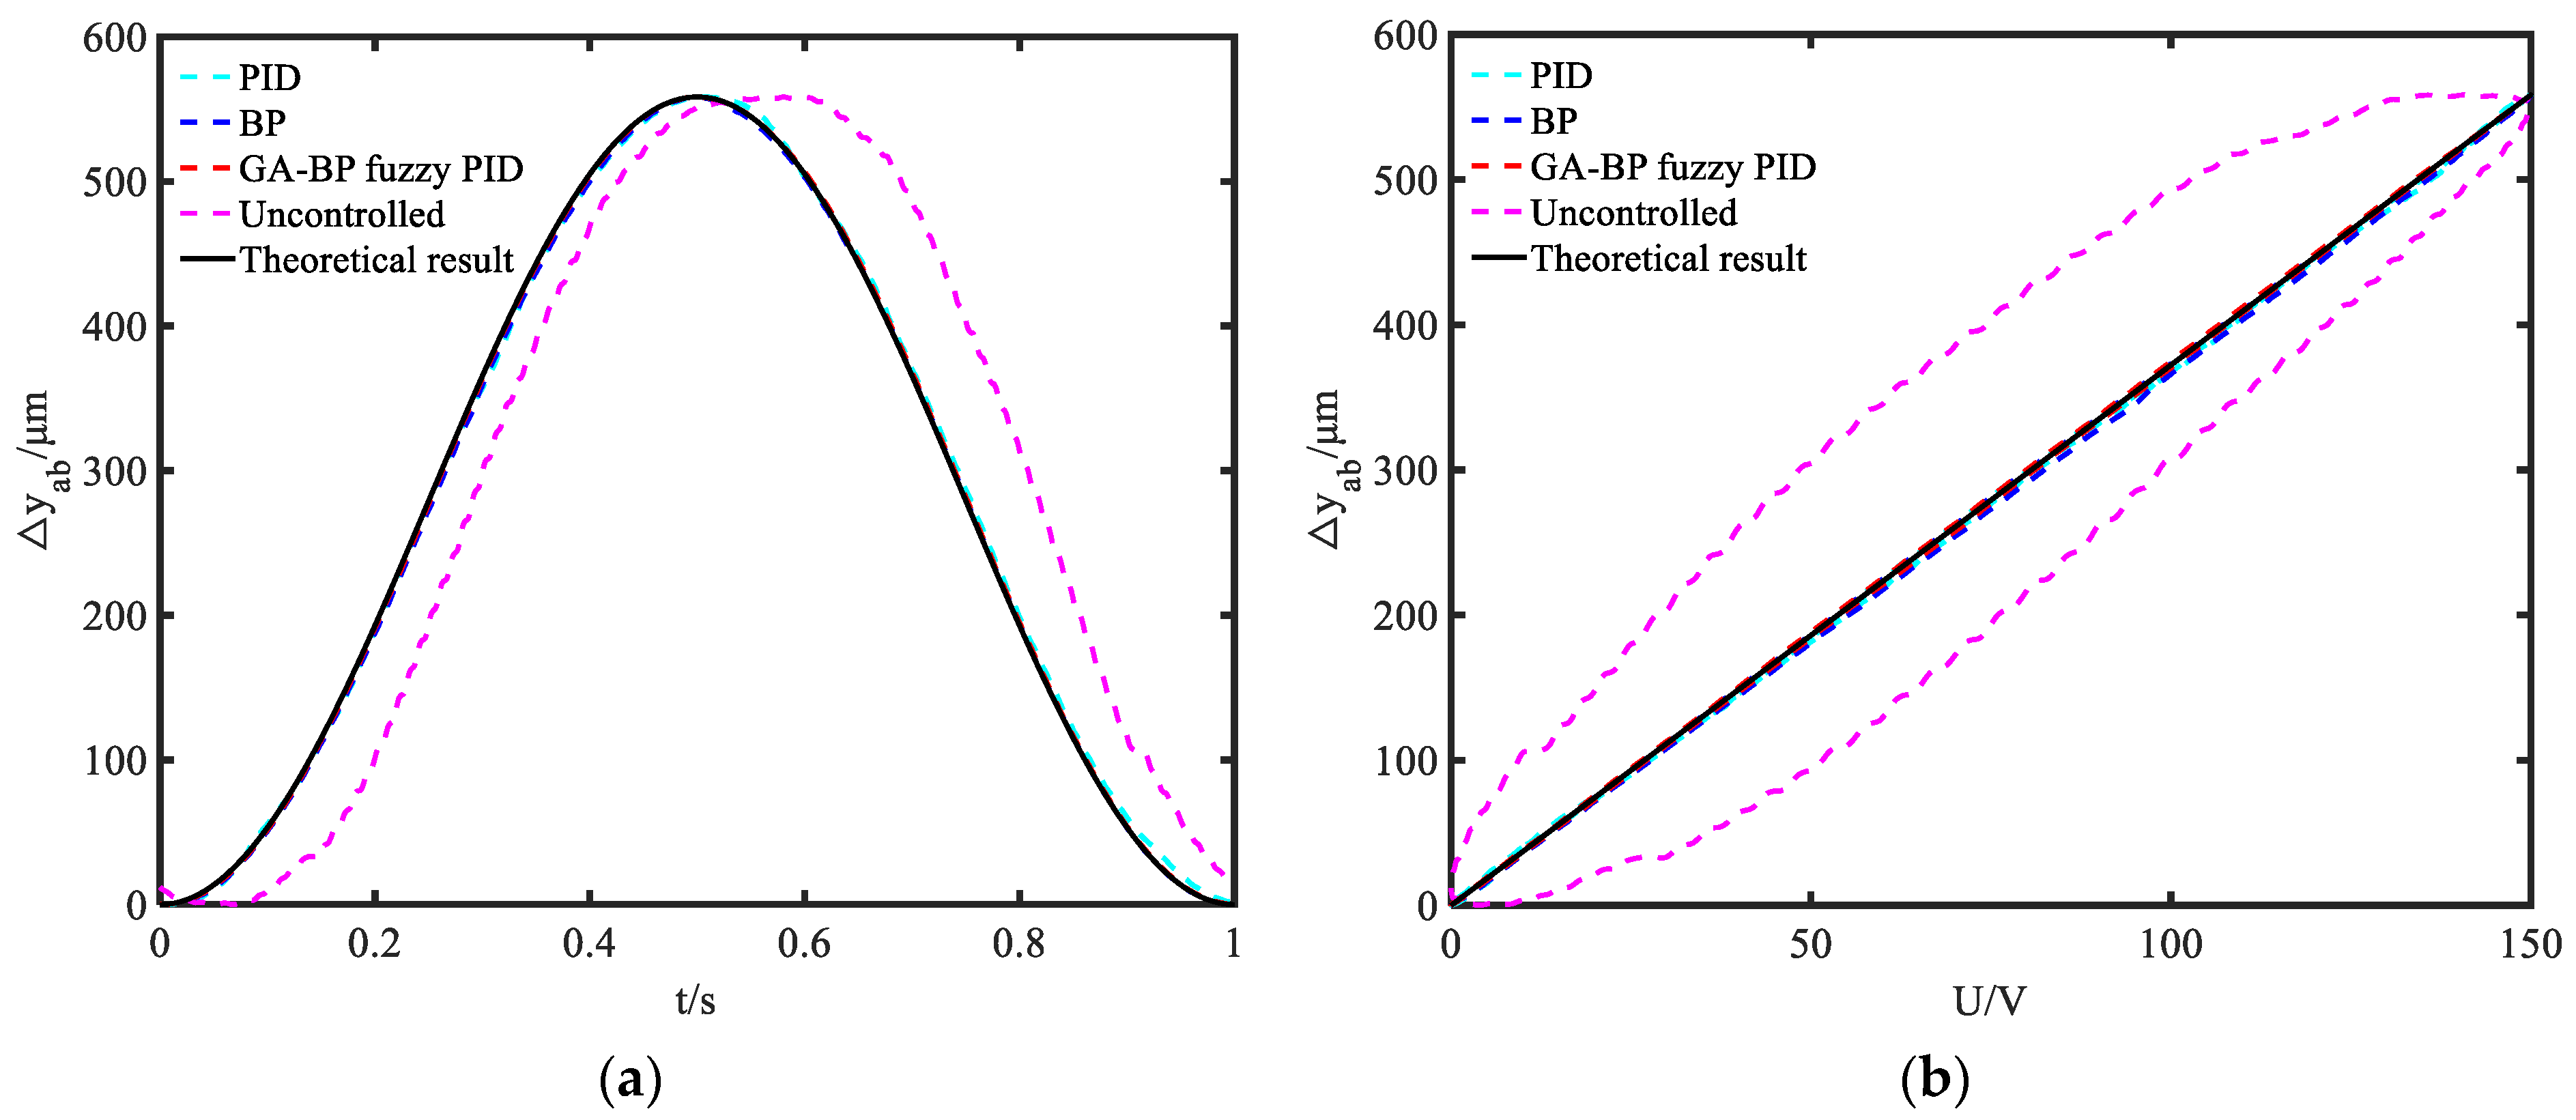
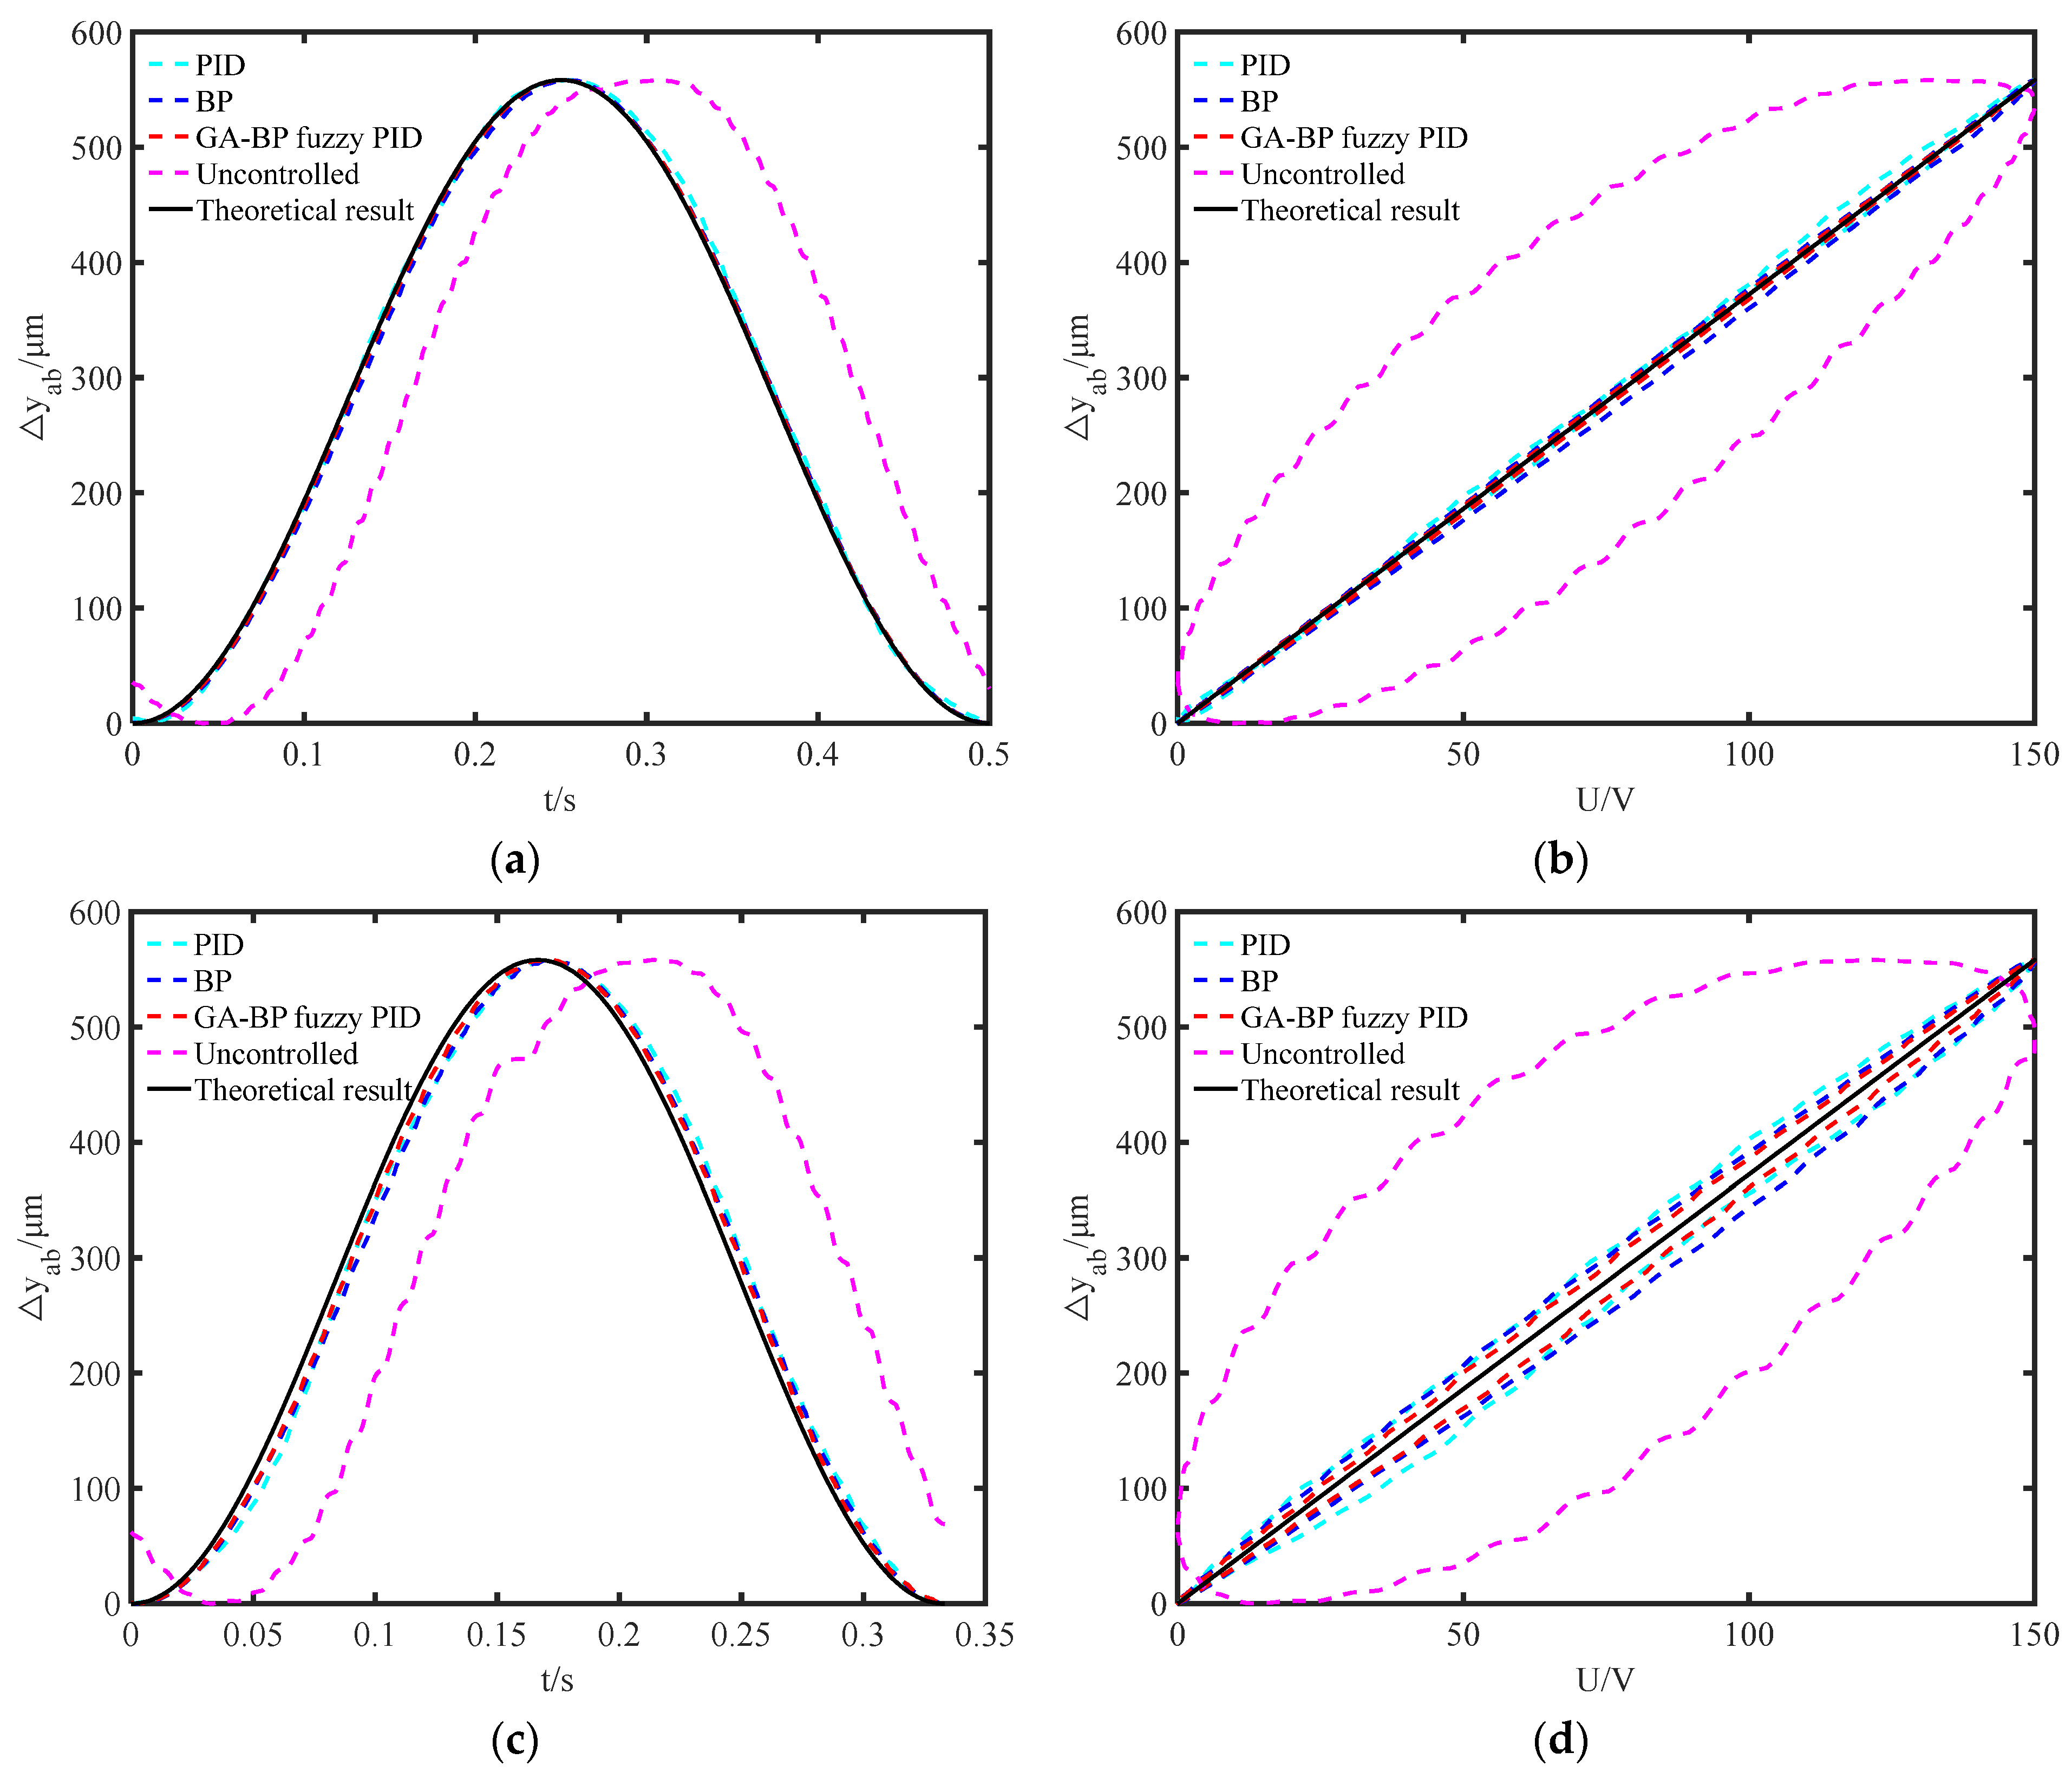
A comparison of the PID control, BP control, GA-BP fuzzy PID control, uncontrolled displacement, and ideal displacement when the piezoelectric ceramics at both ends were operated at 1 Hz is shown in Figure 17.
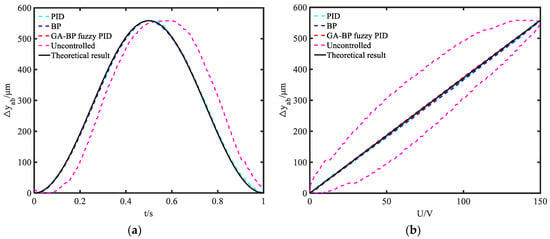
Figure 17.
Output characteristics of the piezoelectric actuator at 1 Hz: (a) displacement varies with time; (b) displacement varies with voltage.
Figure 17a shows that the displacement of the proposed actuator varied with time. The curve in Figure 17a shows the hysteresis characteristics of the piezoelectric actuator. To compare the nonlinearity phenomenon, Figure 17b is introduced. The curves in Figure 17b show that the output displacement changed with the voltage. The degree of nonlinearity of the actuator was observed by comparing the fitting degree of the curve under each type of control with the ideal result curve.
A comparison of the PID control, BP control, GA-BP fuzzy PID control, uncontrolled displacement, and ideal displacement at 2 Hz and 3 Hz is shown in Figure 18. To determine the compensation effect of the output displacement of the piezoelectric actuator under different control schemes, the average absolute errors of the PID, BP feedforward, and GA-BP fuzzy PID controls at different frequencies were studied, as shown in Table 6.
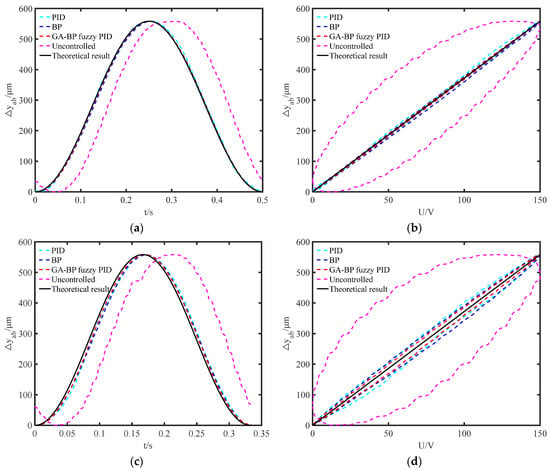
Figure 18.
Output characteristics of the proposed piezoelectric actuator: (a) displacement varies with time at 2 Hz; (b) displacement varies with voltage at 2 Hz; (c) displacement varies with time at 3 Hz; (d) displacement varies with voltage at 3 Hz.

Table 6.
The average absolute error of each control scheme.
According to the time–displacement curves at each frequency, the maximum output displacement was 558.3 μm. As the input voltage frequency increased, the output hysteresis of the piezoelectric ceramics gradually increased. At low frequencies, there was little difference among the PID, BP feedforward, and GA-BP fuzzy PID controls, and the GA-BP fuzzy PID control was better than the others. However, under the conditions of constant sampling points and high frequencies, the delay compensation results of the simple PID and BP feedforward control schemes were not ideal. When the error increased, the delay compensation results were ideal because the feedforward PID and GA-BP fuzzy PID composite control schemes combined the advantages of feedforward and feedback control.
By comparing the voltage–displacement curves, the four control schemes were found to be linear and showed some improvement compared to the control without. The control effect of BP feedforward control was better than that of PID control at low frequencies; therefore, the fitting degree of the BP neural network modeling was higher. However, because piezoelectric ceramics are dynamic models that are subject to disturbances, the control effect began to decrease at high frequencies. The PID control could not adjust the nonlinearity in time at low frequencies; however, at high frequencies, owing to large errors, the effect was more obvious. In the GA-BP fuzzy PID control, the feedforward control model was more accurate, while the feedback module introduced a fuzzy algorithm, could produce dynamic adjustment to interference, and exhibited strong anti-interference.
In this study, the control effect was better when the frequency was lower; however, with an increase in the frequency, the control accuracy decreased. This is because the piezoelectric actuator designed in this study is a multi-stage amplification mechanism—when the frequency is higher, the structure does not react, and thus the control effect is weakened. In addition, this study used the NI USB-6001 data acquisition card, which is a low-end product. When the frequency increases, processing data lags, resulting in poor control.
To validate the advantages of the piezoelectric actuator proposed in this study, the actuator was compared with existing piezoelectric actuators, as shown in Table 7.

Table 7.
Comparation of several piezoelectric actuators.
This comparison revealed that the piezoelectric actuator designed in this study had a larger output displacement and load. The resolution of the proposed piezoelectric actuator was 0.1 μm, which is considerably better than that of others in literature. In addition, the maximum amplification in this study was 21.55, which enabled the conversion of the small displacement of the piezoelectric stack into a larger practical displacement. At the same time, this study used the GA-BP fuzzy PID control method, which greatly improved the control accuracy of the piezoelectric actuator, and the control error was only 0.23% when the driving frequency was 1 Hz.
6. Conclusions
In this study, a large displacement linear piezoelectric actuator was proposed. A feedforward fuzzy self-tuning PID control scheme was designed for the piezoelectric actuator based on fuzzy control. To verify the advantages of the different control models, the PI, polynomial, and MPI models and the BP neural network were simulated and compared. Simulation experiments on the disturbance state were also conducted in Simulink and compared with feedforward control and feedforward PID control. Control experiments on the piezoelectric actuator were performed according to different control schemes. The results revealed the following:
- (1)
- The maximum output displacement of the proposed piezoelectric actuator was 558.3 μm under a driving voltage of 150 V and a driving frequency of 1 Hz.
- (2)
- The proposed GA-BP neural network model solved problems, such as strong randomness, falling easily into the local optimal solution, and slow convergence of the BP neural network, while ensuring modeling accuracy.
- (3)
- The stability adjustment time of the feedforward fuzzy PID control was 11% and 22% of that of the feedforward fuzzy PID control. When interference occurred, the overshoot was reduced by 69.74% compared to the feedforward control.
- (4)
- The feedforward fuzzy PID control system has the advantages of a fast response speed and strong anti-interference ability.
Author Contributions
Conceptualization, C.L.; Investigation, Y.T.; Validation, H.L.; Writing—original draft, H.L.; Writing—review & editing, C.L. All authors have read and agreed to the published version of the manuscript.
Funding
This research was funded by the Open Fund for Jiangsu Key Laboratory of Advanced Manufacturing Technology (HGAMTL-2102), National Natural Science Foundation of China (51905228) and QingLan Project of Jiangsu Province of China (No. 1024902201).
Data Availability Statement
All relevant data are within the paper.
Conflicts of Interest
The authors declare no conflicts of interest.
References
- Xu, Z.; Wang, Y.; Chen, C. Micro converter with a high step-up ratio to drive a piezoelectric bimorph actuator applied in mobile robots. Int. J. Adv. Robot. Syst. 2018, 15, 1–9. [Google Scholar] [CrossRef]
- Qiao, P.; Yang, J.; Dai, C.; Xiao, X. Design of composite disturbance observer and continuous terminal sliding mode control for piezoelectric nanopositioning stage. Electronics 2021, 10, 2242. [Google Scholar] [CrossRef]
- An, D.; Yang, Y.; Xu, Y.; Shao, M.; Shi, J.; Yue, G. Compensation of hysteresis in the piezoelectric nanopositioning stage under reciprocating linear voltage based on a mark-segmented PI model. Micromachines 2020, 11, 9. [Google Scholar] [CrossRef] [PubMed]
- Wang, G.; Xu, Q. Design and precision position/force control of a piezo-driven microinjection system. IEEE/ASME Trans. Mechatron. 2017, 22, 1744–1754. [Google Scholar] [CrossRef]
- Gao, Y.; Wen, J.; Ma, J.; Zhang, Y.; Wang, R.; Hu, Y.; Li, J. A self-adapting linear inchworm piezoelectric actuator based on a permanent magnets clamping structure. Mech. Syst. Signal Process. 2019, 132, 429–440. [Google Scholar] [CrossRef]
- He, L.; Yue, X.; Dou, H.; Ge, X.; Wan, Z.; Qian, A. Research on variable stiffness asymmetrical resonant linear piezoelectric actuator based on multi-modal drive. Smart Mater. Struct. 2024, 33, 015032. [Google Scholar] [CrossRef]
- Das, T.; Shirinzadeh, B.; Al-Jodah, A.; Ghafarian, M.; Pinskier, J. A novel compliant piezoelectric actuated symmetric microgripper for the parasitic motion compensation. Mech. Mach. Theory 2021, 155, 104069. [Google Scholar]
- Woody, S.; Smith, S. Design and performance of a dual drive system for tip-tilt angular control of a 300 mm diameter mirror. Micromachines 2006, 16, 389–397. [Google Scholar]
- Wei, J.; Qiu, Z.; Han, J.; Wang, Y. Experimental Comparison Research on Active Vibration Control for Flexible Piezoelectric Manipulator Using Fuzzy Controller. J. Intell. Robot. Syst. 2010, 59, 31–56. [Google Scholar] [CrossRef]
- Mohammadzaheri, M.; Soltani, P.; Ghodsi, M. Micro/nanopositioning systems with piezoelectric actuators and their role in sustainability and ecosystems. In Ecomechatronics: Challenges for Evolution, Development and Sustainability; Springer International Publishing: Berlin/Heidelberg, Germany, 2022; pp. 233–250. [Google Scholar]
- Chen, Q.; Yang, Z.; Fu, Z. A systematic identification approach for biaxial piezoelectric stage with coupled Duhem-type hysteresis. COMPEL Int. J. Comput. Math. Electr. 2021, 40, 358–372. [Google Scholar] [CrossRef]
- Kim, S.Y.; Lee, C. Description of asymmetric hysteretic behavior based on the Bouc-Wen model and piecewise linear strength-degradation functions. Eng. Struct. 2019, 181, 181–191. [Google Scholar] [CrossRef]
- Hamimid, M.; Feliachi, M.; Mimoune, S. Modified Jiles–Atherton model and parameters identification using false position method. Phys. B Condens. Matter 2010, 405, 1947–1950. [Google Scholar] [CrossRef]
- Ikhouane, F. A Survey of the Hysteretic Duhem Model. Arch. Comput. Methods Eng. 2018, 25, 965–1002. [Google Scholar] [CrossRef]
- Xu, R.; Zhou, M. Sliding mode control with sigmoid function for the motion tracking control of the piezo-actuated stages. Electron. Lett. 2017, 53, 75–77. [Google Scholar] [CrossRef]
- Hu, H.; Mrad, R. On the classical Preisach model for hysteresis in piezoceramic actuators. Mechatronics 2003, 13, 85–94. [Google Scholar] [CrossRef]
- Ruderman, M. Presliding hysteresis damping of LuGre and Maxwell-slip friction models. Mechatronics 2015, 30, 225–230. [Google Scholar] [CrossRef]
- Tan, U.; Latt, W.; Shee, C.; Riviere, C.N.; Ang, W.T. Feedforward Controller of Ill-Conditioned Hysteresis Using Singularity-Free Prandtl–Ishlinskii Model. IEEE/ASME Trans. Mechatron. 2009, 14, 598–605. [Google Scholar]
- Ikhouane, F.; Rodellar, J. Systems with Hysteresis: Analysis, Identification and Control Using the Bouc-Wen Model; John Wiley & Sons: West Sussex, UK, 2007. [Google Scholar]
- Liu, X.; Wu, Y.; Zhang, Y.; Wang, B.; Peng, H. Inverse model-based iterative learning control on hysteresis in giant magnetostrictive actuator. J. Intell. Mater. Syst. Struct. 2014, 25, 1233–1242. [Google Scholar] [CrossRef]
- Ma, L.; Shen, Y.; Li, J. A neural-network-based hysteresis model for piezoelectric actuators. Rev. Sci. Instrum. 2020, 91, 015002. [Google Scholar] [CrossRef]
- Bashash, S.; Jalili, N. A Polynomial-Based Linear Mapping Strategy for Feedforward Compensation of Hysteresis in Piezoelectric Actuators. J. Dyn. Syst. Meas. Control. 2008, 130, 031008. [Google Scholar] [CrossRef]
- Gan, J.; Zhang, X.; Wu, H. Tracking control of piezoelectric actuators using a polynomial-based hysteresis model. AIP Adv. 2016, 6, 065204. [Google Scholar] [CrossRef]
- Coelho, L.; Guerra, F.; Leite, J. Multiobjective Exponential Particle Swarm Optimization Approach Applied to Hysteresis Parameters Estimation. IEEE Trans. Magn. 2012, 48, 283–286. [Google Scholar] [CrossRef]
- Rosli, R.; Mohamed, Z. Optimization of modified Bouc–Wen model for magnetorheological damper using modified cuckoo search algorithm. J. Vib. Control. 2021, 27, 1956–1967. [Google Scholar] [CrossRef]
- Wang, Y.; Guo, Y.; Mao, J. Rate-dependent modeling and tracking control of piezoelectric actuators. Opt. Precis. Eng. 2014, 22, 616–625. [Google Scholar] [CrossRef]
- Alem, S.F.; Izadi, I.; Sheikholeslam, F. Adaptive Sliding Mode Control of Hysteresis in Piezoelectric Actuator. Ifac Pap. 2017, 50, 15574–15579. [Google Scholar] [CrossRef]
- Zhang, X.; Wang, C.; Liu, J.; Yan, R.; Cao, H.; Chen, X. Robust active control based milling chatter suppression with perturbation model via piezoelectric stack actuators. Mech. Syst. Signal Process. 2019, 120, 808–835. [Google Scholar] [CrossRef]
- Zhou, M.; Zhang, Y.; Ji, K.; Zhu, D. Model reference adaptive control based on KP model for magnetically controlled shape memory alloy actuators. J. Appl. Biomater. Funct. Mater. 2017, 15, S31–S37. [Google Scholar] [CrossRef] [PubMed]
- Li, P.; Wang, X.; Zhao, L.; Zhang, D.-F.; Guo, K. Dynamic linear modeling, identification and precise control of a walking piezo-actuated stage. Mech. Syst. Signal Process. 2019, 128, 141–152. [Google Scholar] [CrossRef]
- Pugi, L.; Abati, A. Design optimization of a planar piezo-electric actuation stage for vibration control of rotating machinery. Meccanica 2020, 55, 581–596. [Google Scholar] [CrossRef]
- Tong, Y.; Li, C.; Fang, J.; Xing, J. Design and experiment of a large displacement linear piezoelectric actuator. Int. J. Appl. Electromagn. Mech. 2023, 72, 175–197. [Google Scholar] [CrossRef]
- Ghodsi, M.; Ueno, T.; Modabberifar, M. Quality Factor, Static and Dynamic Responses of Miniature Galfenol Actuator at Wide Range of Temperature. Int. J. Phys. Sci. 2010, 6, 8143–8150. [Google Scholar]
- Ling, J.; Chen, L.; Feng, Z.; Zhu, Y. Development and test of a high speed pusher-type inchworm piezoelectric actuator with asymmetric driving and clamping configuration. Mech. Mach. Theory 2022, 176, 104997. [Google Scholar] [CrossRef]
- Li, J.; Huang, H.; Zhao, H. A Piezoelectric-Driven Linear Actuator by Means of Coupling Motion. IEEE Trans. Ind. Electron. 2018, 65, 2458–2466. [Google Scholar] [CrossRef]
- Wang, J.; Qin, F.; Li, L.; Liu, Z.; Zhao, H. A linear piezoelectric actuator with high flexibility flexible mechanism designed by the bidirectional parasitic motion principle. Rev. Sci. Instrum. 2020, 91, 045005. [Google Scholar] [CrossRef]
- Yu, S.; Xie, M.; Wu, H.; Ma, J.; Wang, R.; Kang, S. Design and control of a piezoactuated microfeed mechanism for cell injection. Int. J. Adv. Manuf. Technol. 2019, 105, 4941–4952. [Google Scholar] [CrossRef]
Disclaimer/Publisher’s Note: The statements, opinions and data contained in all publications are solely those of the individual author(s) and contributor(s) and not of MDPI and/or the editor(s). MDPI and/or the editor(s) disclaim responsibility for any injury to people or property resulting from any ideas, methods, instructions or products referred to in the content. |
© 2024 by the authors. Licensee MDPI, Basel, Switzerland. This article is an open access article distributed under the terms and conditions of the Creative Commons Attribution (CC BY) license (https://creativecommons.org/licenses/by/4.0/).

