Article

Assessment of the Dynamic Range of Magnetorheological Gradient Pinch-Mode Prototype Valves

1
Faculty of Mechanical Engineering, Brno University of Technology, 616 69 Brno, Czech Republic
2
Faculty of Electrical and Computer Engineering, Cracow University of Technology, 31-155 Cracow, Poland
3
Department of Process Control, AGH University of Krakow, 30-059 Cracow, Poland
4
Centre of Polymer Systems, Tomas Bata University in Zlín, 760 01 Zlín, Czech Republic
5
Department of Production Engineering, Faculty of Technology, Tomas Bata University in Zlín, 760 01 Zlín, Czech Republic
*
Author to whom correspondence should be addressed.
Actuators 2023, 12(12), 449; https://doi.org/10.3390/act12120449
Submission received: 10 October 2023 / Revised: 30 November 2023 / Accepted: 1 December 2023 / Published: 4 December 2023
(This article belongs to the Special Issue Magnetorheological Actuators and Dampers)

Abstract

:
Magnetorheological (MR) fluids have been known to react to magnetic fields of sufficient magnitudes. While in the presence of the field, the material develops a yield stress. The tunable property has made it attractive in, e.g., semi-active damper applications in the vibration control domain in particular. Within the context of a given application, MR fluids can be exploited in at least one of the fundamental operating modes (flow, shear, squeeze, or gradient pinch mode) of which the gradient pinch mode has been the least explored. Contrary to the other operating modes, the MR fluid volume in the flow channel is exposed to a non-uniform magnetic field in such a way that a Venturi-like contraction is developed in a flow channel solely by means of a solidified material in the regions near the walls rather than the mechanically driven changes in the channel’s geometry. The pinch-mode rheology of the material has made it a potential candidate for developing a new category of MR valves. By convention, a pinch-mode valve features a single flow channel with poles over which a non-uniform magnetic field is induced. In this study, the authors examine ways of extending the dynamic range of pinch-mode valves by employing a number of such arrangements (stages) in series. To accomplish this, the authors developed a prototype of a multi-stage (three-stage) valve, and then compared its performance against that of a single-stage valve across a wide range of hydraulic and magnetic stimuli. To summarize, improvements of the pinch-mode valve dynamic range are evident; however, at the same time, it is hampered by the presence of serial air gaps in the flow channel.

1. Introduction

Magnetorheological (MR) fluids are known representatives of smart materials that react to magnetic fields. The material itself is a suspension of fine, micron-sized, soft magnetic particles [1,2]. It is known to exhibit Newtonian fluid-like properties while in the absence of a magnetic field. However, as soon as it is magnetized, the particles in the material form chain structures resulting in a resistance-to-flow build-up or a yield stress increase in the material [3]. In comparison to the off-state (zero field) behavior, the material exhibits typical Bingham plastic or pseudo-solid characteristics; the material’s field-induced yield stress has to be overcome to initiate a flow.
Since its discovery in the mid-20th century, the technology has been commercialized primarily in semi-active vehicle suspension systems (in the form of continuously variable MR fluid-based dampers) [4,5], MR powertrain mounts [6,7], or civil engineering applications [8,9,10]. The technology is valveless, contrary to conventional semi-active valve-based dampers. In MR dampers, pistons have no moving components; the adjustments of the output are solely performed by means of a magnetic field and modifications of the fluid rheology. The core element of the MR damper is a simple fixed air-gap solenoid with at least one radial or planar, or an annular flow channel. With the fluids energized by the magnetic flux induced by the solenoid, the changes in the rheology of the material can be utilized in real time [11,12] to follow the load changes.
MR fluid-based devices are known to operate in one of the fundamental operating modes, flow [13], shear [14], squeeze, and gradient pinch [15,16,17], of which the latter has been researched and explored to a minor extent. In comparison, flow-mode and shear-mode prototypes have been commercialized, as already stated above, and there is a long and generous record of the research that has been conducted in this regard [18,19,20].
Prototype pinch-mode valve designs are few, and the research published regarding modeling has been sparse to date, in this regard, in comparison to the other operating modes. Considering the configuration of the two key elements forming each MR device, namely, a solenoid (incl. flow channel) and MR fluid, exploiting the rheology of the material in the pinch mode is executed here in a distinct manner. In the pinch mode, only a relatively small volume of the MR fluid is energized (in comparison with the other operating modes), and the magnetic field distribution in the flow channel is intentionally non-uniform. As such, the fluid volume in the flow channel is exposed to the non-uniform magnetic field in such a way that the flux density is highest in the areas adjacent to the channel surface(s) (walls) and lowest in the center of the flow path. This results in a Venturi-like variable and magnetic field-dependent contraction, but is accomplished solely through material means and not by manipulating the channel’s geometry (size; cross-section area) as in the solenoid-operated variable orifice valves [21]. For comparison, in the flow mode, the fluid flow is driven by a pressure gradient across the flow channel, and a magnetic flux crosses it in the direction perpendicular to the flow to energize the fluid volume, and thus induces the yield stress change in the material. A similar orientation of the magnetic flux relative to the fluid flow can be observed in shear-mode prototypes (rotary brakes or clutches) [14] or small-stroke squeeze-mode vibration mounts [22]. In essence, the entire volume of the fluid should be energized for an optimum performance. Based on the state of the art and our own research [15,16,17], it is expected that implementing pinch-mode MR valves may widen the MR fluid application scope and deliver benefits that are difficult to achieve with MR devices based on the other operating principles. For instance, the experiments of pinch-mode inventors [16] with such MR valves have presented changes in the pressure drop vs. flow-rate curve slope driven by a magnetic field [15,16,17]. For comparison, conventional semi-active MR valves allow for modifying the breakaway pressure drop at a zero flow rate, only upon the action of the magnetic field; the pressure drop increase change rate with the flow rate does not change at a constant magnetic field strength. With such valves, the variable slope-type characteristics can only be achieved with flow-mode valves at the cost of employing expensive electronics or complex designs of MR valves [23]. It is, therefore, speculated that this may contribute to developing a new category of controlled MR valves.
To date, the previous state of the art of the authors in the field has involved the magnetostatic-sizing studies of a prototype flow bench, computational fluid dynamics (CFDs) analyses, as well as extensive experimental studies [15,16] involving a single-stage pinch-mode valve assembly. Generally, the obtained results prove the pinch-mode principle; however, at the same time, the outcome of the experiments show the need for increasing the dynamic range of the examined valves. In this paper, the authors propose a realization of the improvement by employing a serial multi-stage pinch-mode valve. The intent of the work is to extend the research conducted by Lee et al. [15]; however, flow characterization is to be conducted within a far lower flow rate range (below 1 L/min) and using a flow channel configuration (circular thru-hole), which the authors consider to be more adequate for this particular operating mode. Additionally, the fluid’s behavior at low flow rates is of interest for microfluidic systems. Moreover, the fluid in the pinch-mode valve, in a study performed by Lee et al. [15], was energized asymmetrically in the annulus, whereas in the examined configuration, the valve’s principle was that of a long restrictive orifice, which, according to the authors, was also more in line with the original pinch-mode valve patent application [17] and where most performance benefits were foreseen.
To summarize, the authors commence the study by highlighting the pinch-mode operating principles in Section 2, and the key details of the developed test rig (flow bench) experimental procedure are highlighted in Section 3. The MR pinch-mode valve structures are highlighted in Section 4. The material in the section is complemented by revealing crucial elements of the magnetostatic finite-element (FE) analyses involving the developed prototypes incl. model verification. The performance of both valves is compared in Section 5 and the conclusions are drawn in Section 6.

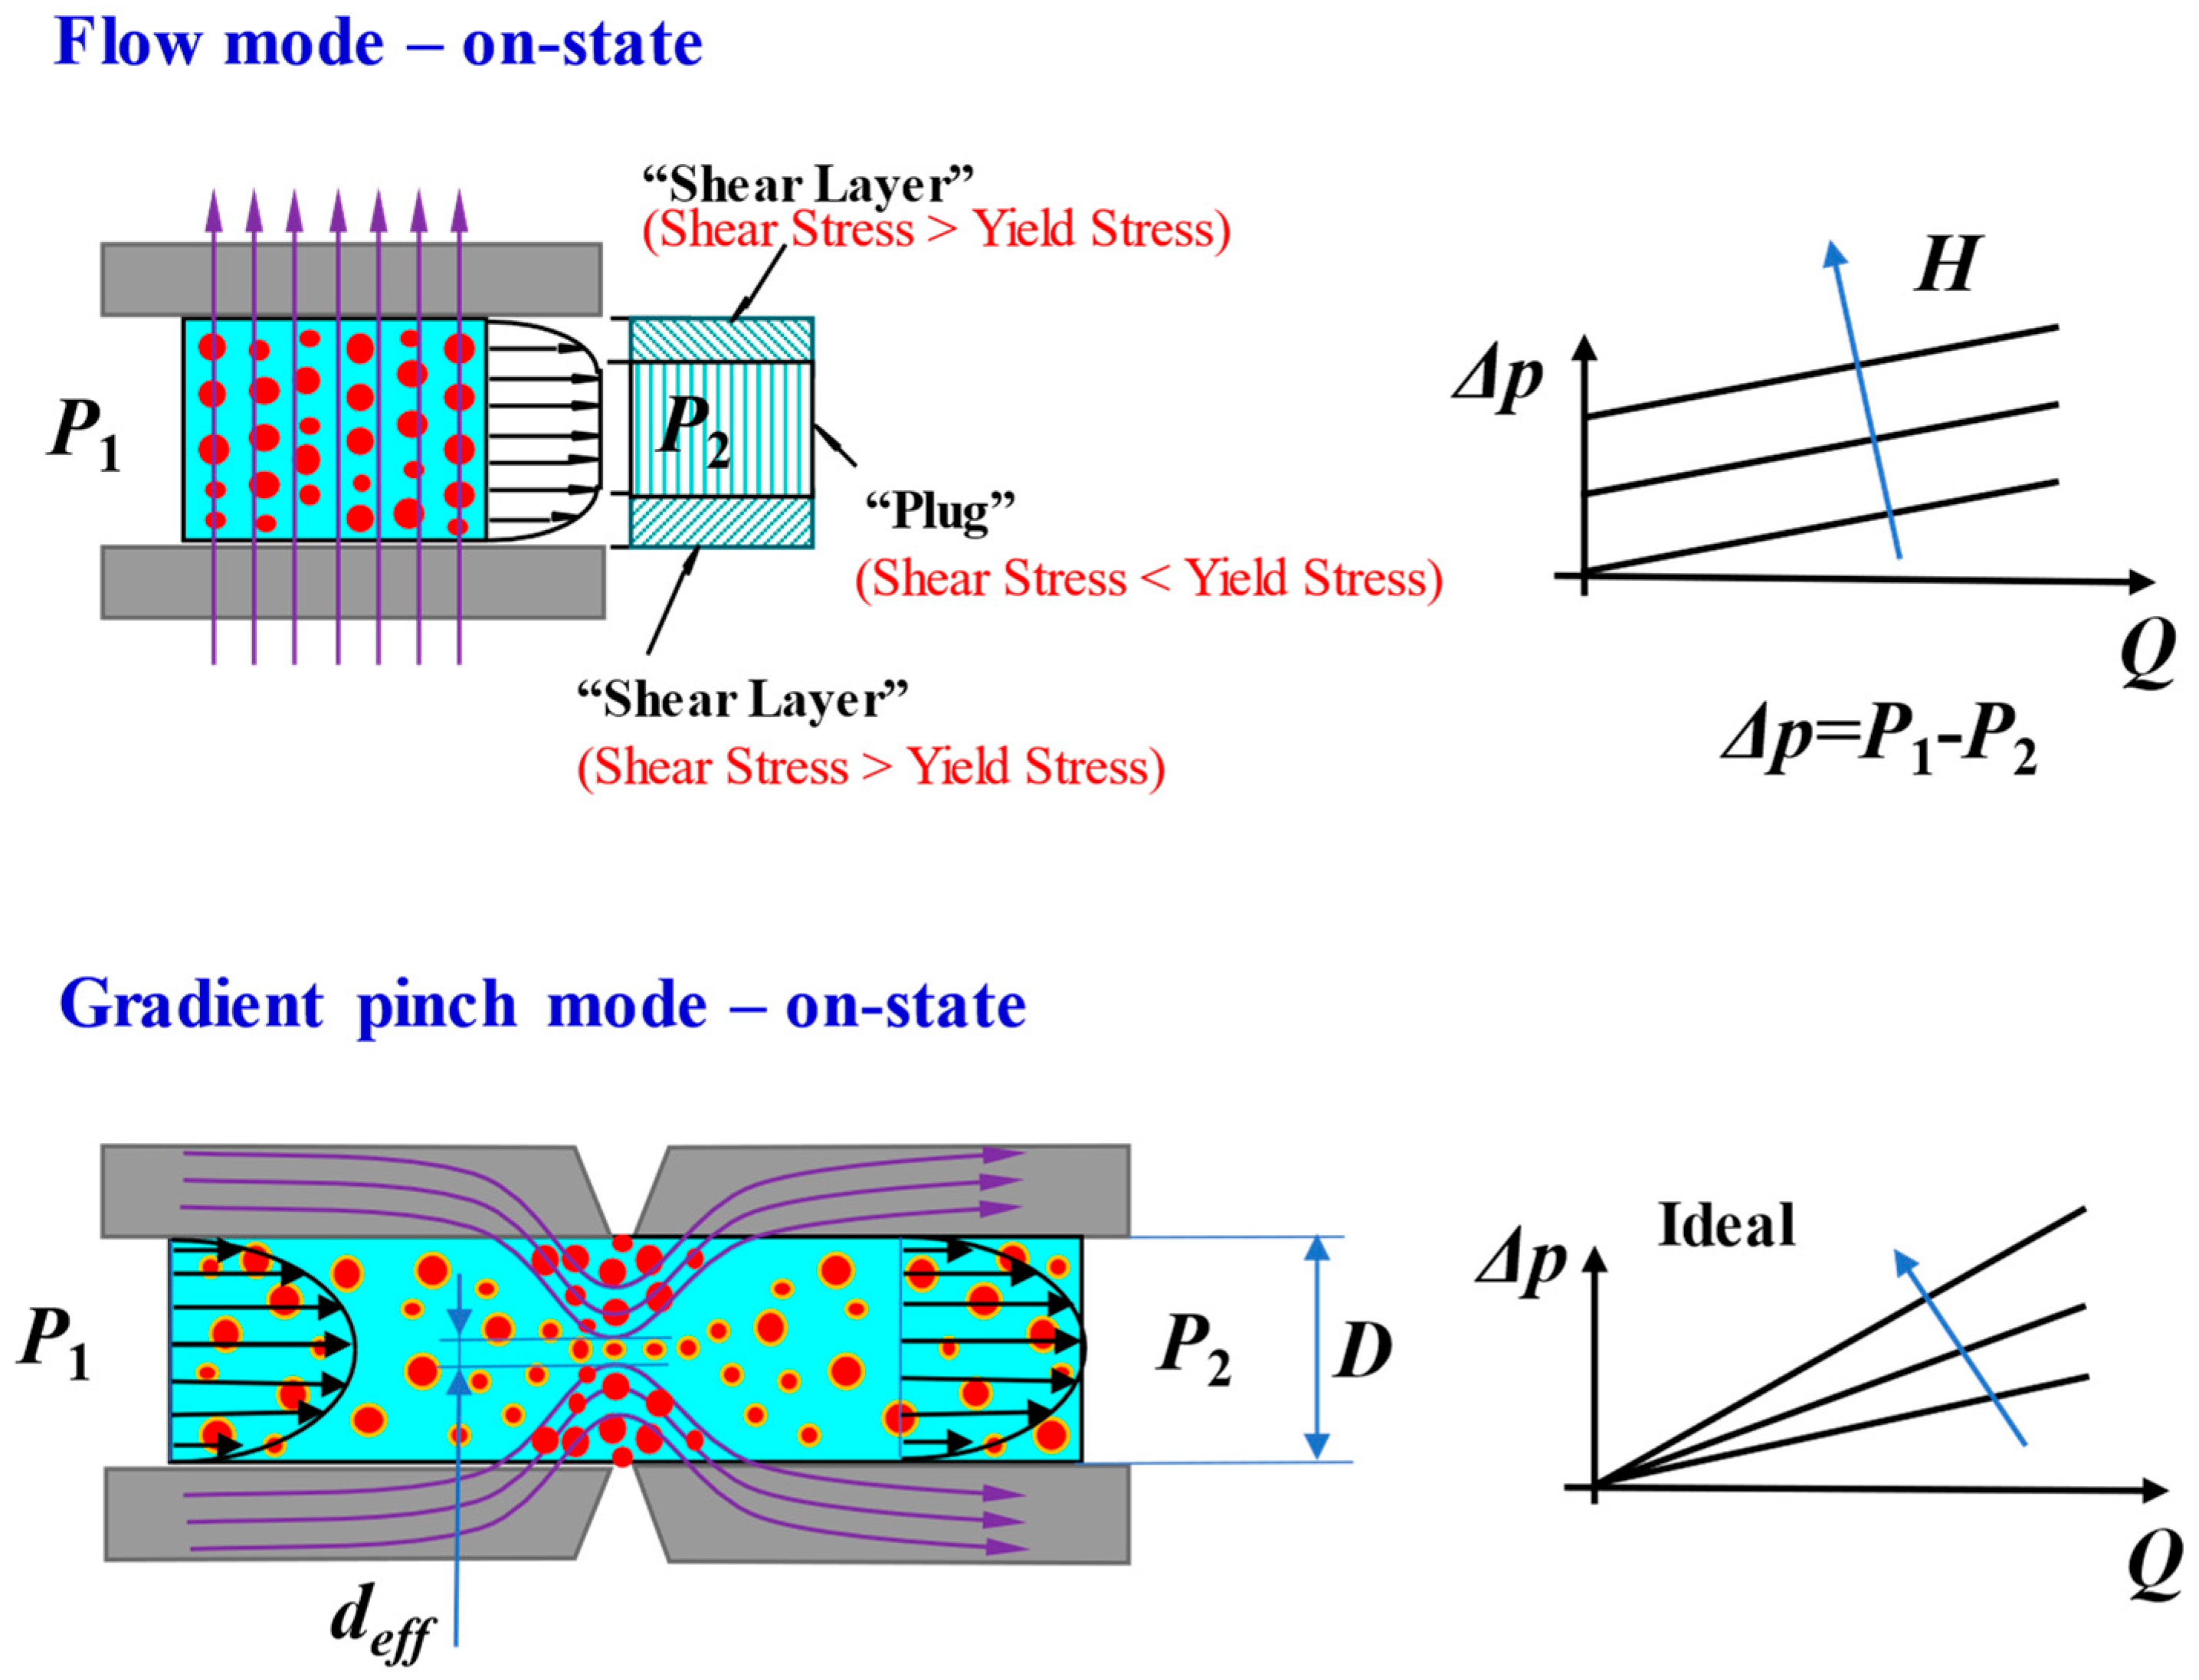
2. Pinch-Mode Fundamentals

As previously mentioned, MR fluids can be operated in at least one of the four fundamental operating modes of which the so-called pinch mode is the least explored. Figure 1 reveals the pinch-mode principle. As shown, the main difference is in the distribution of the magnetic field (purple arrows). In comparison to the other operating modes, the magnetic poles are orientated in the direction parallel to the fluid flow, which results in a non-uniform distribution of the magnetic field. The field’s concentration is the largest in the near-wall zones, and, ideally, zero at the center of the gap. Effectively, it traps the particles in the high-flux-density zones and, at the same time, it allows them to pass freely through the central region. The effective diameter, deff, of the flow channel is magnetic field-dependent, and it varies from deff = D (off-state), where D—diameter of the flow channel, to deff = 0 (max. magnetic field strength). This ideally leads to a change in the pressure drop Δp vs. flow rate, Q, curve’s slope of the MR valve (see Figure 1).
As a remainder, in the flow mode, the magnetic flux travels through the flow gap in the direction perpendicular to the fluid flow. When magnetized, the particles form chain structures that need to be broken to initiate the flow through the gap. On the macro-scale, the flux energizes the fluid, thus inducing a yield stress. The yield stress must be overcome to initiate the flow (plug flow). In the region where the shear stress is higher than the yield stress (shear layer), the MR fluid starts to flow. The behavior of the fluid in this mode can be best described by the pressure drop (Δp) vs. flow rate (Q) relationship presented in Figure 1. In comparison with the (idealized) gradient pinch mode, only the threshold pressure varies with the magnetic field; the curve’s slope is invariant of the magnetic field strength, H, or the magnetic flux density, B.

3. Experimental Procedure
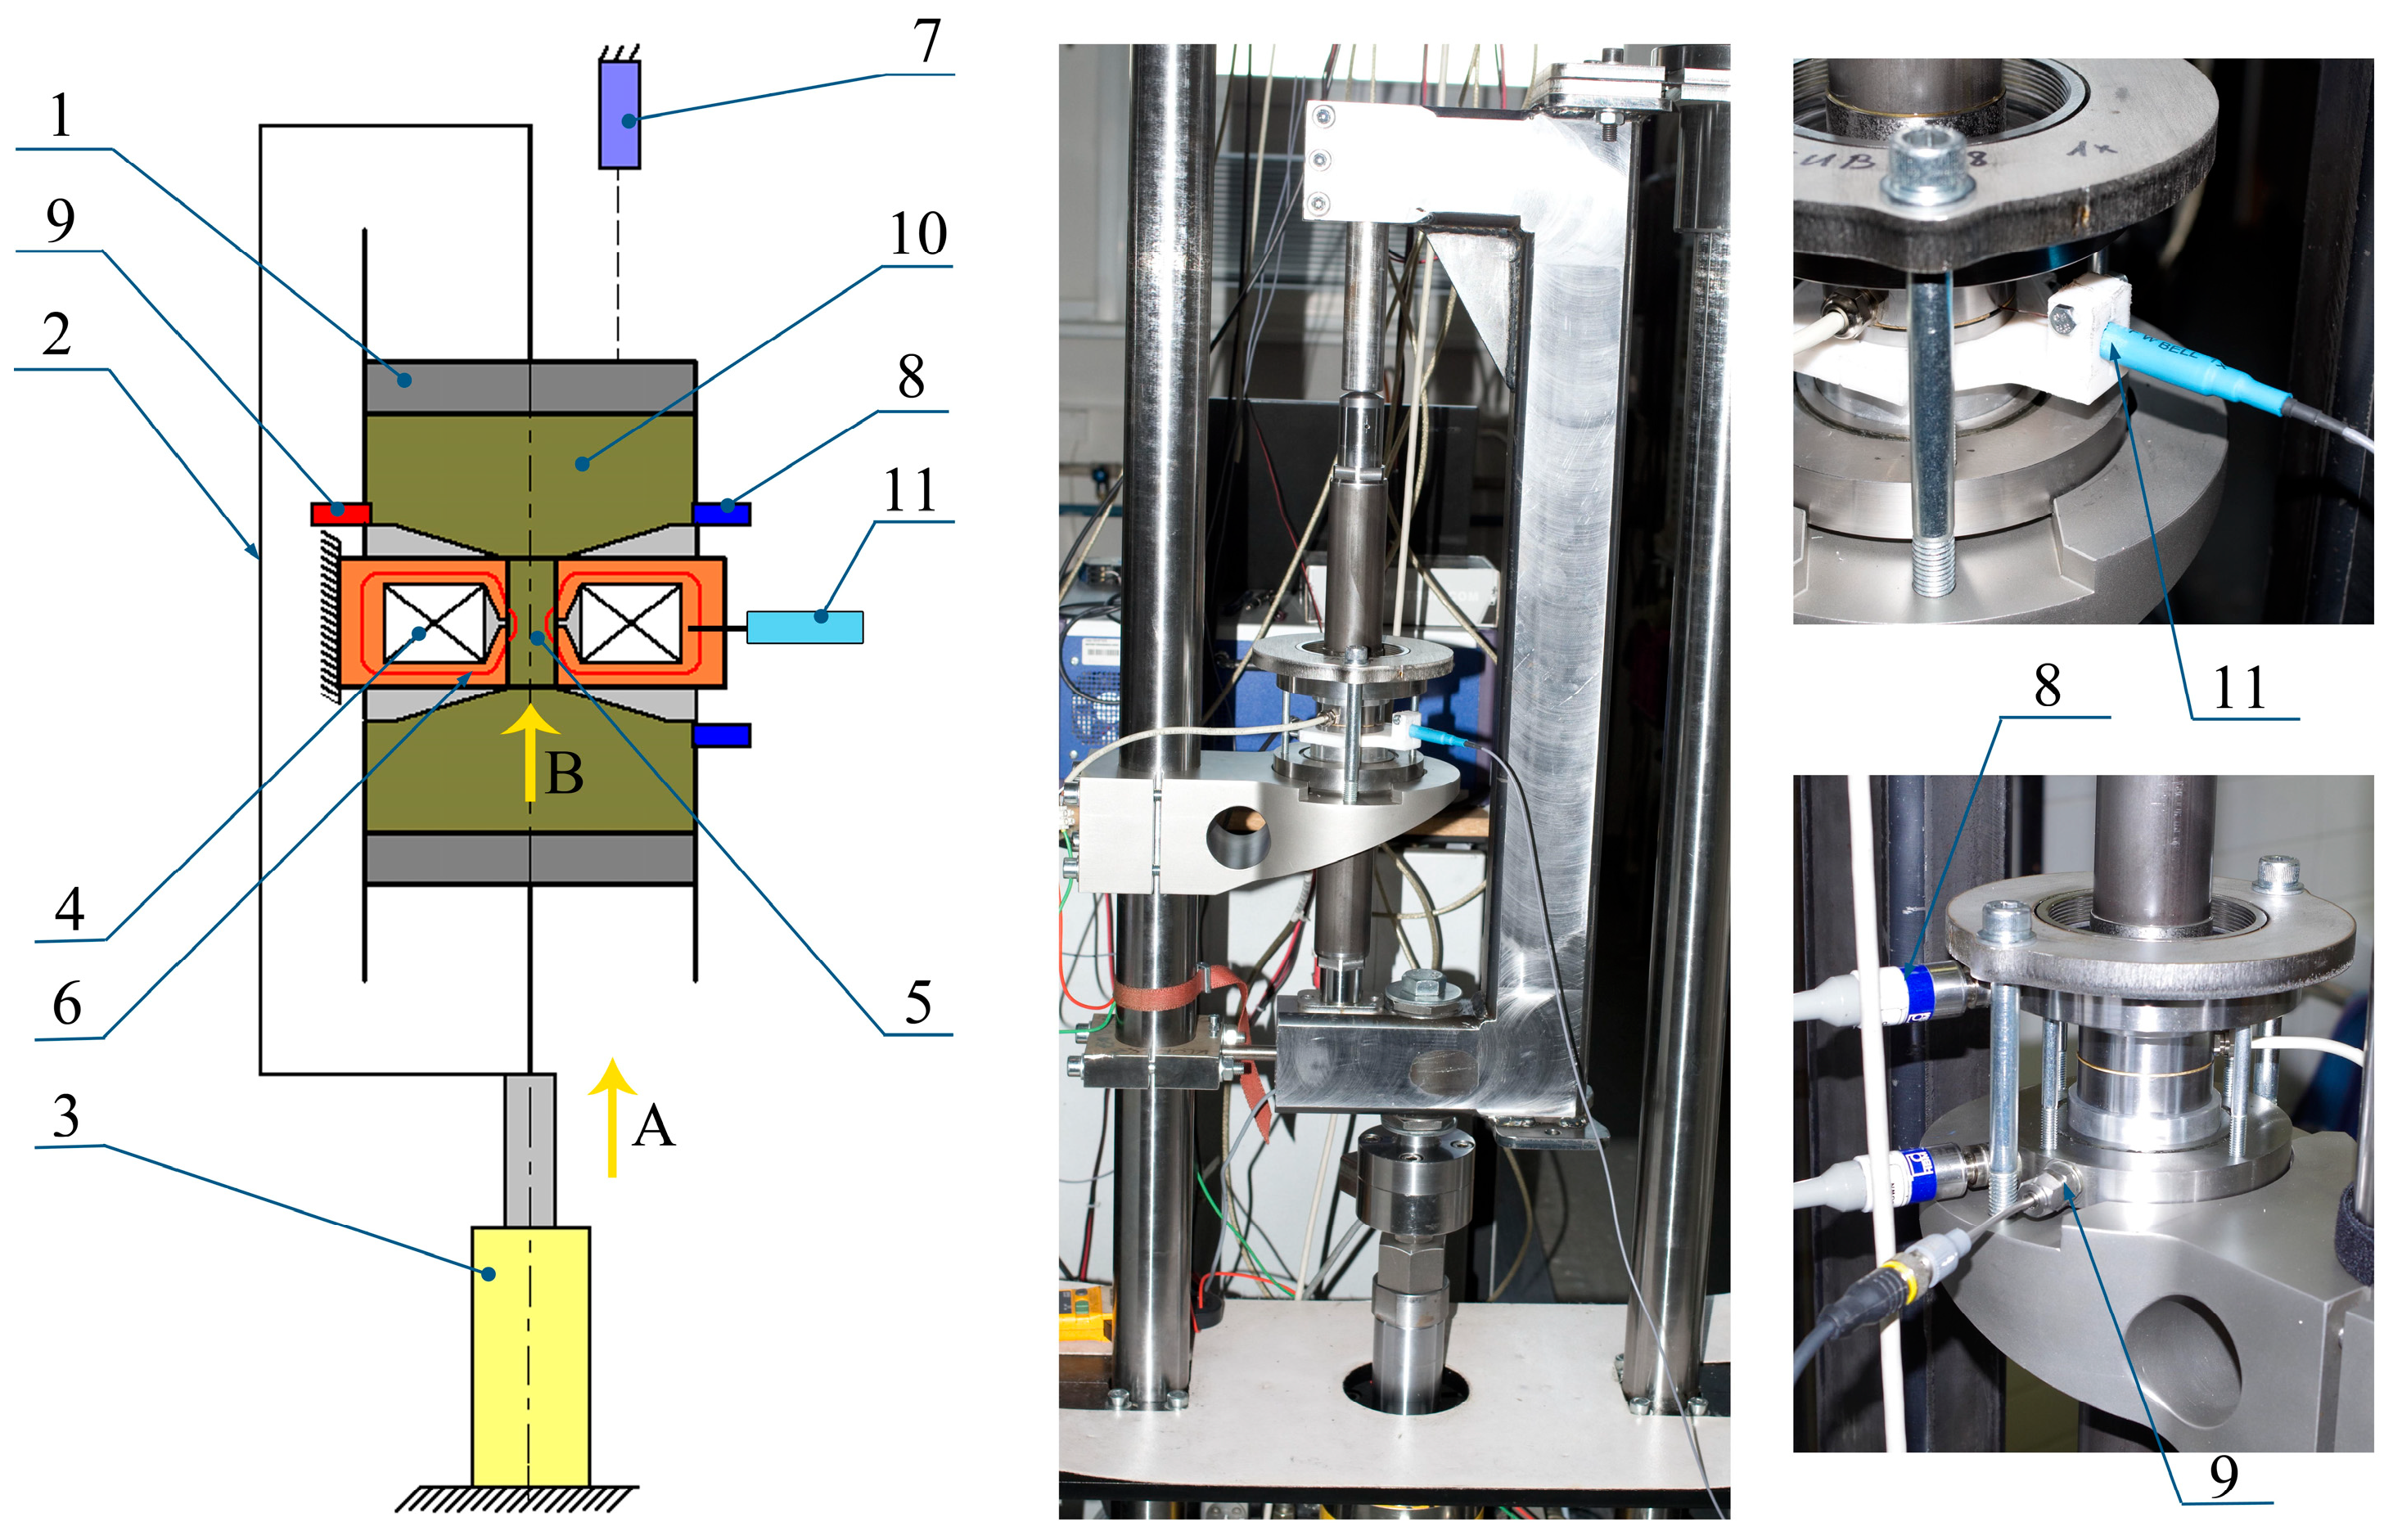
3.1. Test Rig

To conduct the research, an in-house rig for testing MR valves at the Brno University of Technology was modified and developed—see Figure 2. In a similar configuration, the test rig was used in [16,24]. It incorporated a hydraulic dynamometer (3), rheometer (4), and rigid frame (2). The Inova hydraulic dynamometer (Inova s.r.o, Praha, Czechia), AH 40–150 (see the arrow A), forced the fluid through the valve (as indicated by arrow B). The fluid in the gap was exposed to the magnetic field characterized by the field strength, H, and flux density, B (5). The MR pinch valve (4) was located between the floating pistons (1) and was stationary. The pressure drop across the valve was monitored with two pressure sensors: (8) HBM P8AP with pressure range of 10 bar(Hottinger Brüel & Kjaer GmbH, Darmstadt, Germany). The MR fluid temperature was measured using the sensor PT100 located near the entrance to the MR pinch valve (9). The position of the floating piston (7) was monitored by the resistance position sensor RC13 supplied by Megatron (Megatron Elektronik, Putzbrunn, Germany). The fluxmeter Bell 5180 (OECO LLC, Milwaukie, OR, USA) with the ultra-thin transverse probe STB1X-0201 was used for monitoring the magnetic flux in the magnetic circuit. The probe was located in the air gap located in the solenoid’s core (11). Also, the Fluke i30 (Fluke Corporation, Eindhoven, The Netherlands) current clamp was used to monitor the electric current supplied to the coil. All signals were recorded at the sampling frequency of 1 kHz with the data analyzer Dewe-800 (Dewetron, Grambach, Austria).

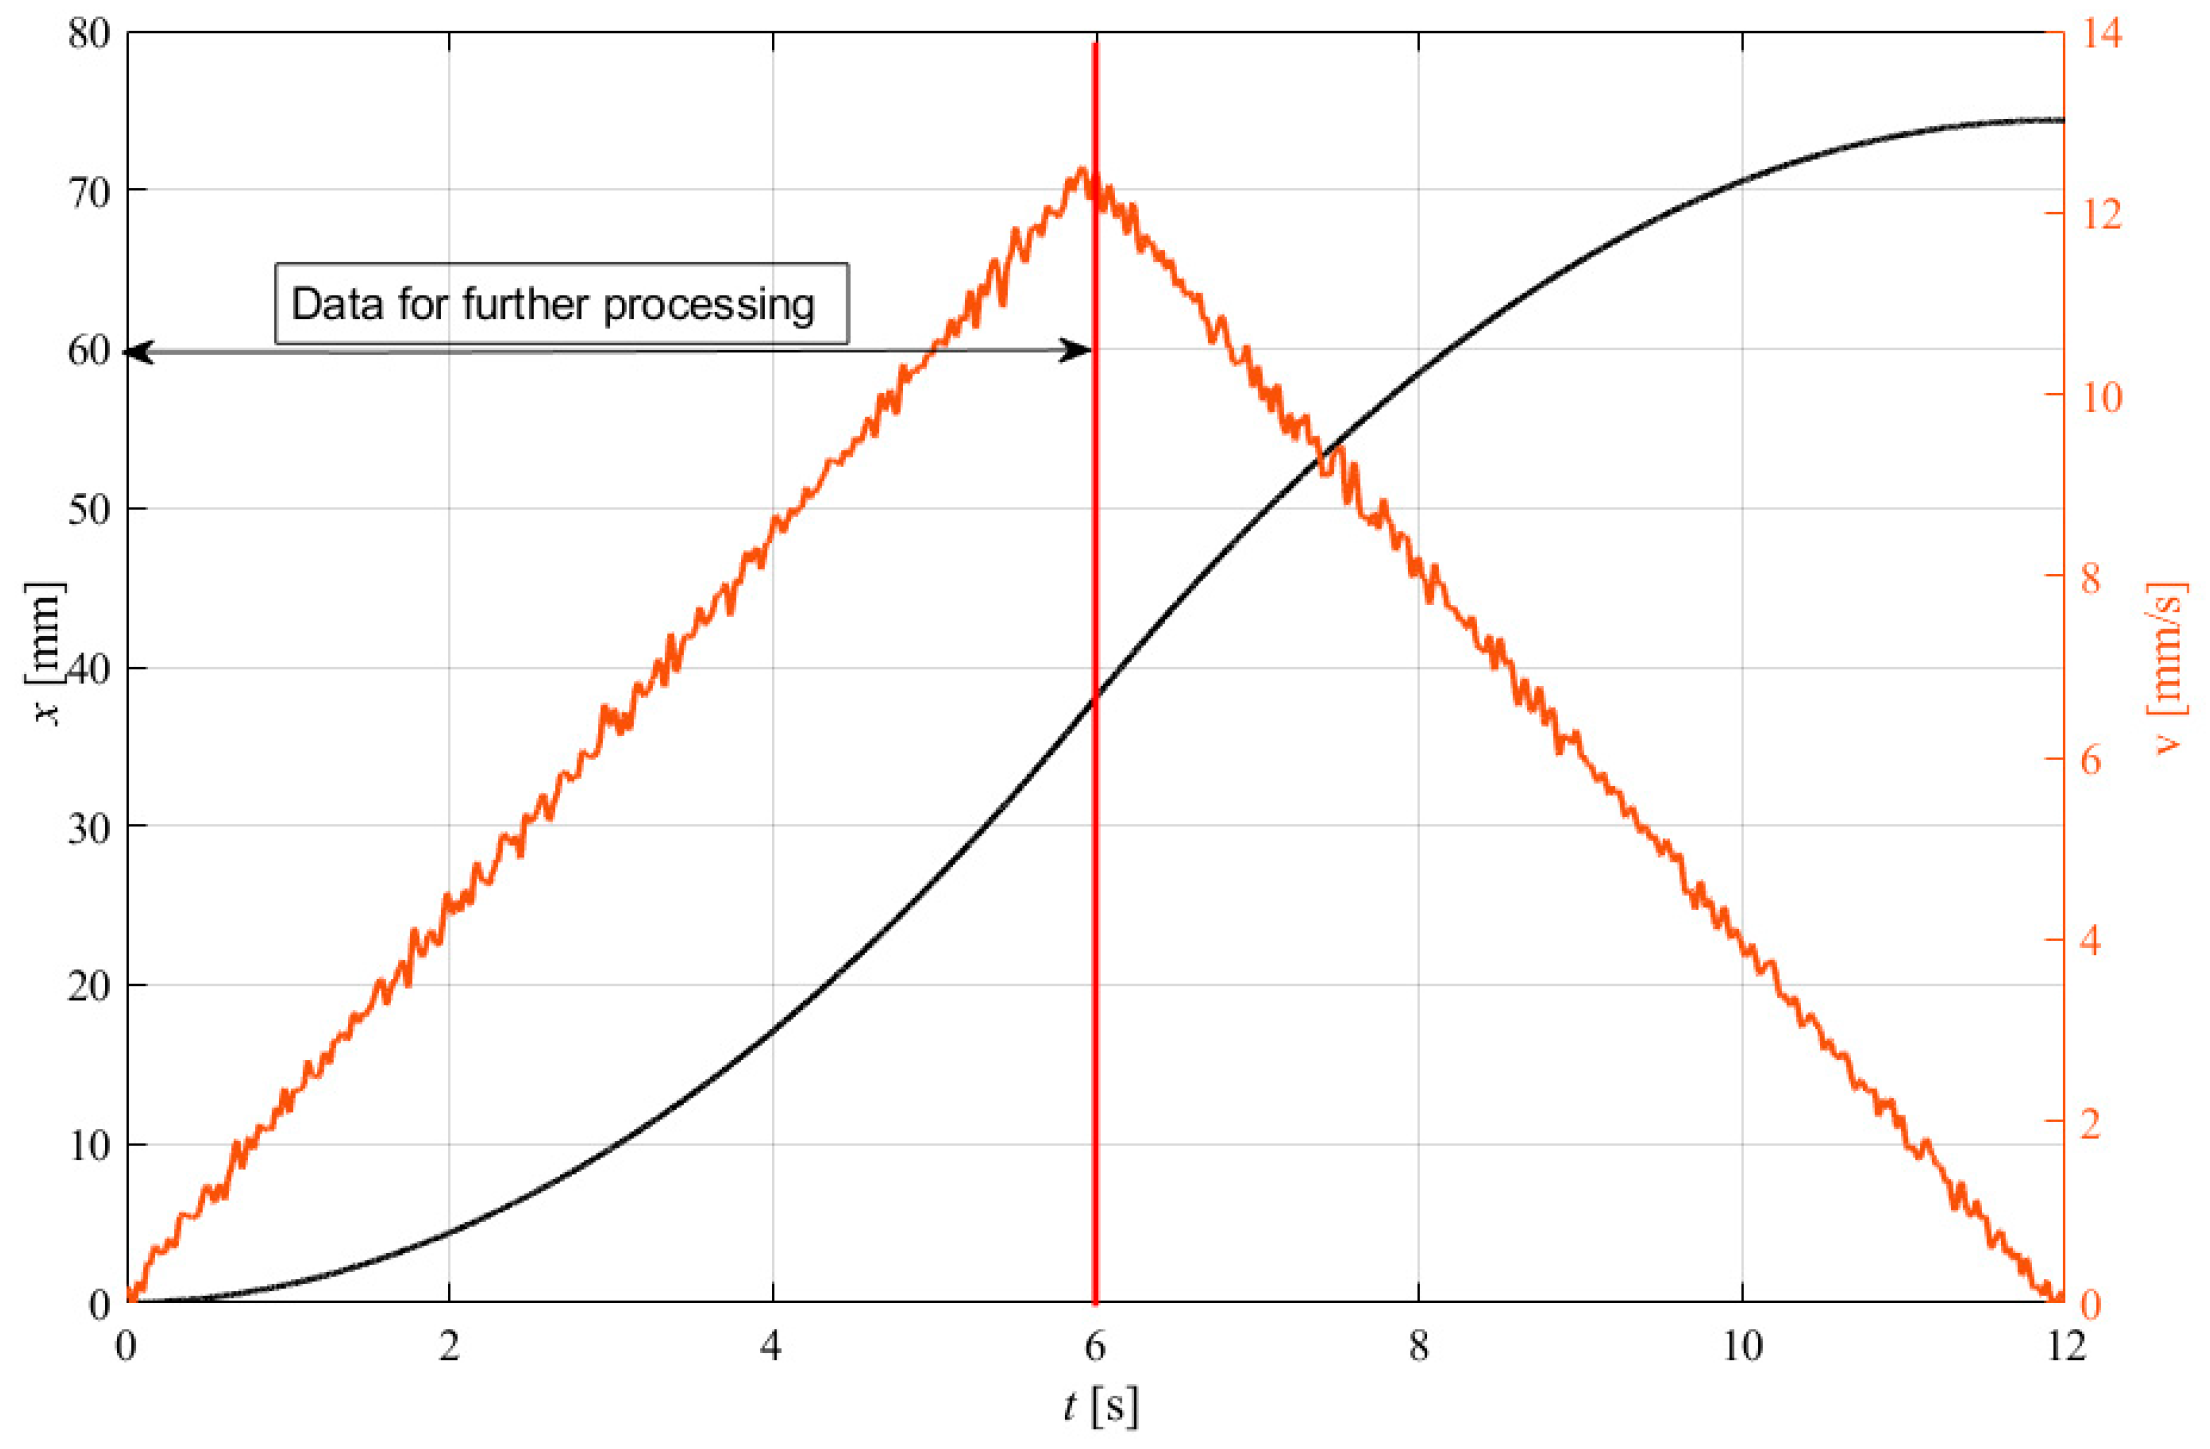
3.2. Test Plan, Material Description, and Data Post-Processing Method

To perform the valve experiments, the MR fluid MRF-122EG manufactured by Lord Corp. (Baltimore, MD, USA) was used in the tests. The experimentally determined viscosity of this fluid was 0.056 Pa.s (at the ambient temperature of T = 30 °C). The MR fluid contained CIP (carbonyl iron powder) spherical particles (average diameter of the particles—2.1 µm). The MR fluid was homogenized for 1 h before filling it into the rheometer. The input displacement waveform was designed to be a linearly increasing function of the floating piston velocity—see Figure 3. It was a constant acceleration input (A = 2 mm/s2). The measurements were performed within the coil excitation range from I = 0 A to I = 3 A (900 A.t) in the single-stage case and within the current range from 0 to 3.4 A (1190 A.t) in the case of the three-stage valve. Data post-processing involved filtering the signals by means of a moving average filter only (50 samples; time increment—50 ms).
To determine the relationship between the input flow rate, Q, through the valve and the resulting pressure drop, the simple linear regression model was applied as follows:
Δp(B,Q) = k(B).Q + ΔpOFF(B)
where Δp(B,Q) is the valve pressure drop, k(B) refers to the pressure–flow rate curve slope at a given magnetic flux density level, B (or the coil current I), and ΔpOFF is the pressure offset. The coefficients k(B) and ΔpOFF were determined using the least squares curve fit approach. To normalize the slope k change with the magnetic field, the dimensionless slope factor K was introduced:
K(B) = k(B)/k(B = 0)
Similarly, the dynamic range (valve gain), F, can be calculated as:
F(B,Q) = Δp(B,Q)/Δp(0,Q)

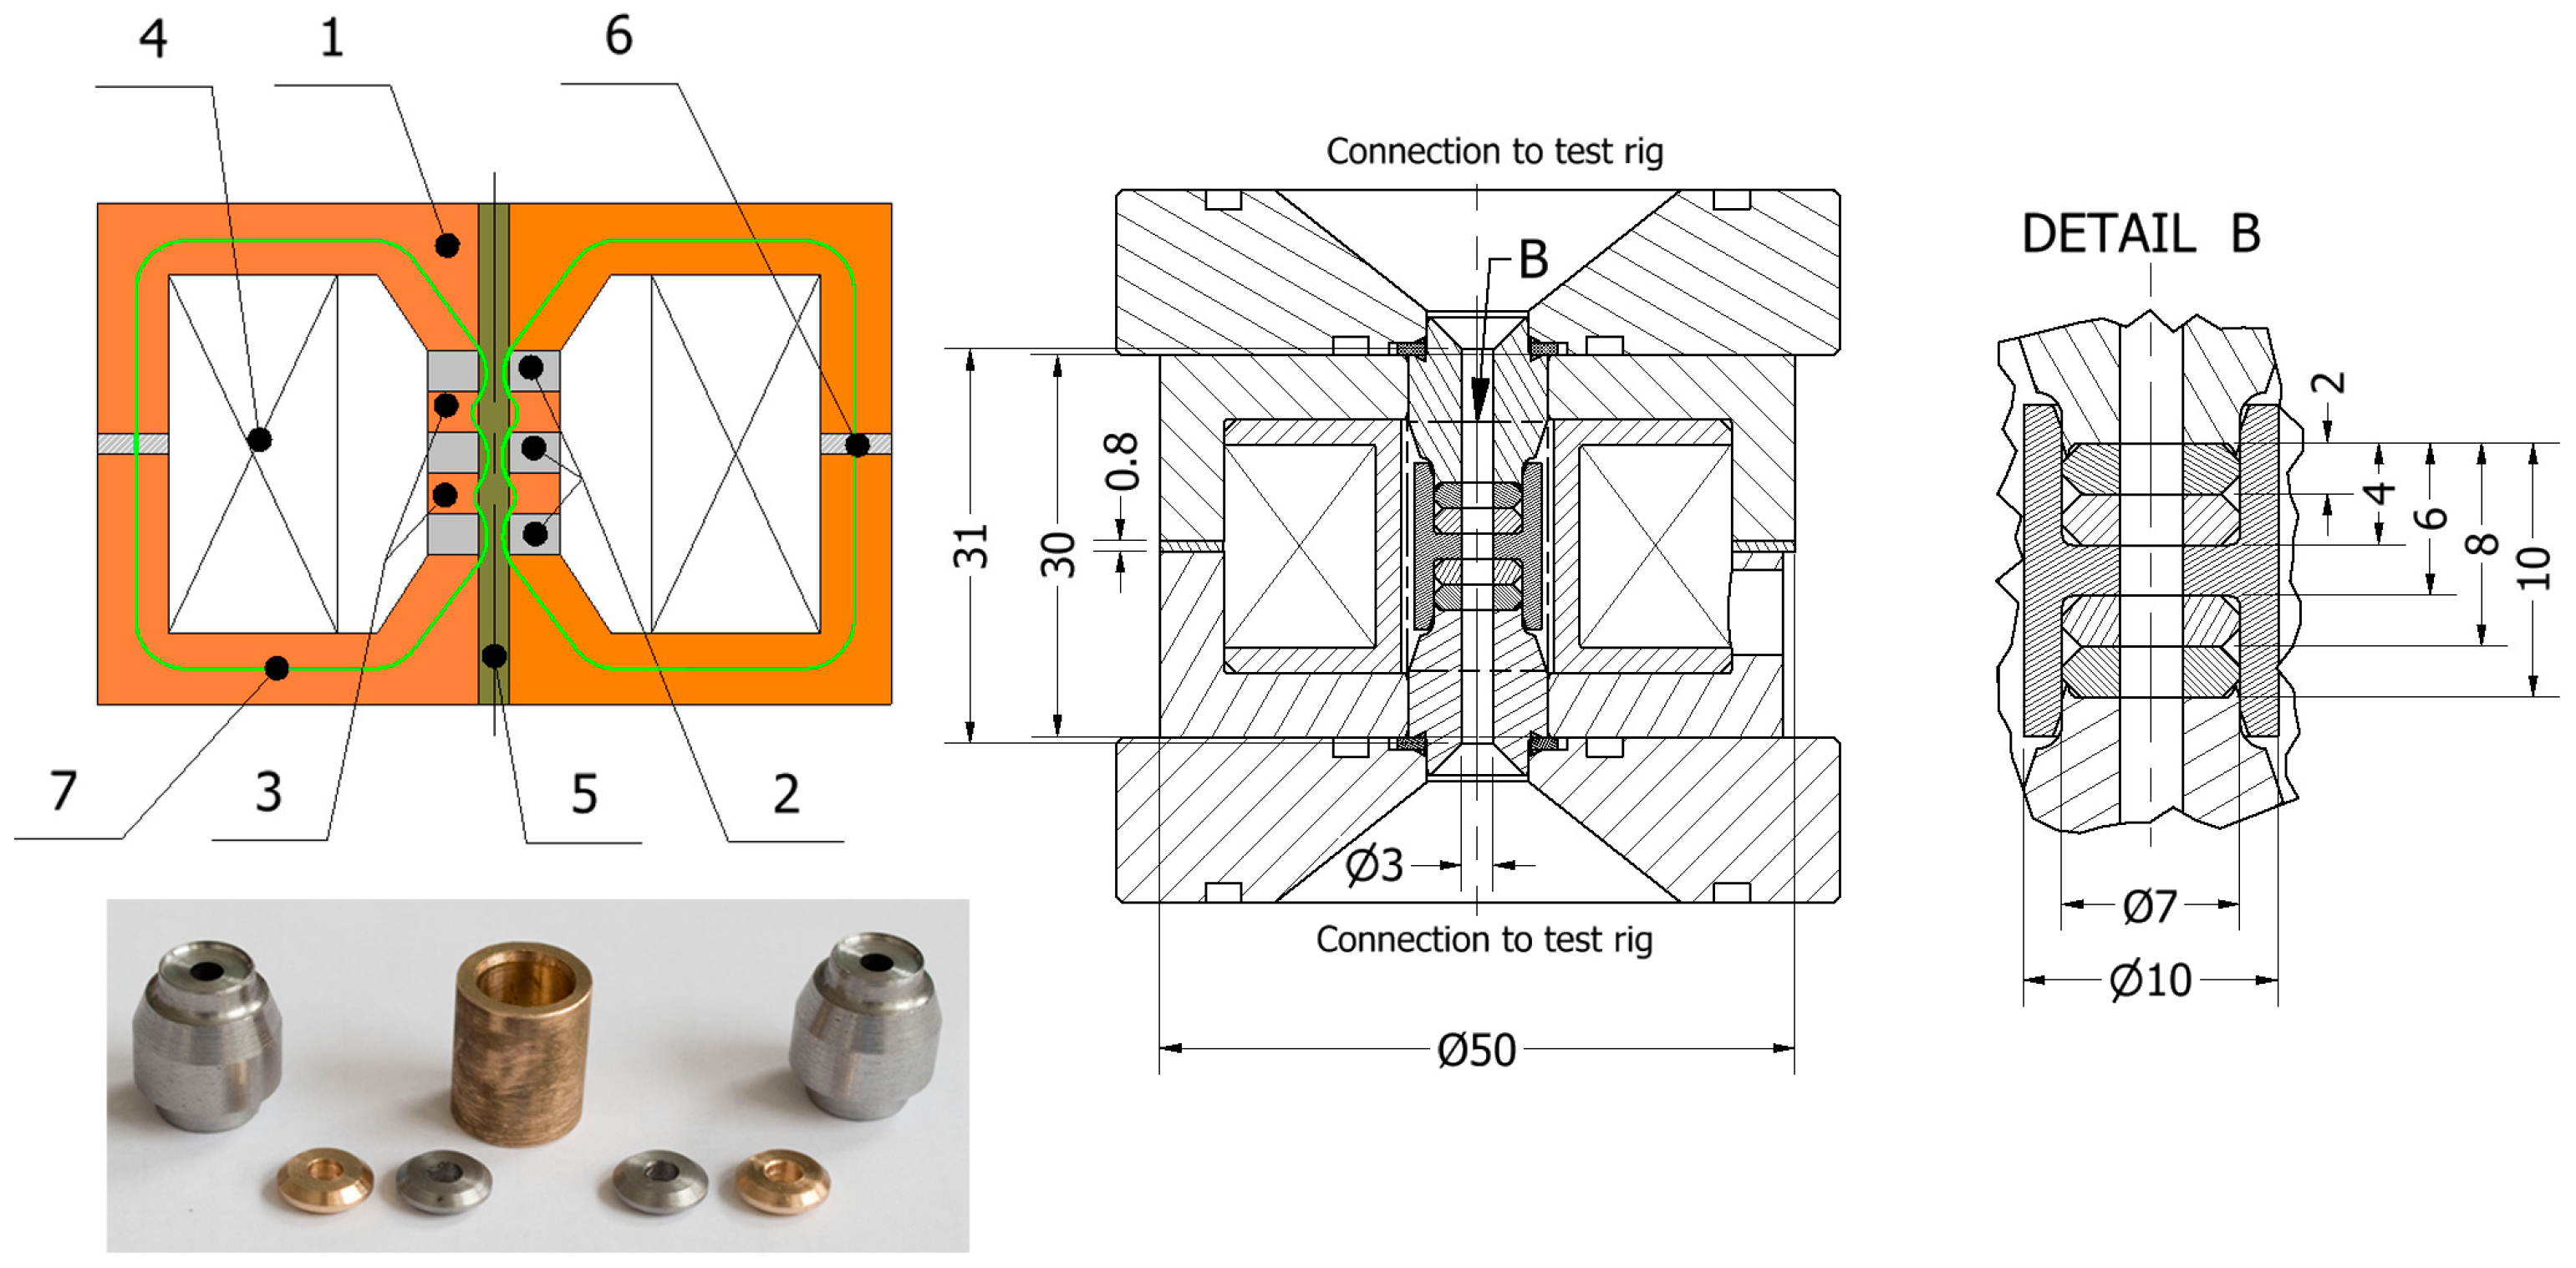
4. MR Pinch-Mode Valves

4.1. Single-Stage Prototype

To study the behavior of the MR fluid in the pinch mode, the authors developed a single-stage MR pinch-valve concept (see Figure 4). The MR pinch valve incorporated a thru-hole circular channel (diameter: D = 3 mm) (4), magnetic core assembly (1), and electromagnetic coil with N = 300 wire turns (3). The magnetic core assembly revealed two magnetic pole pieces (1), a bronze non-magnetic spacer (2), and an air gap (5). The air gap (size—0.8mm) was used for monitoring the magnetic flux (6) in the circuit by means of the transverse Hall probe. The magnetic core was manufactured using a low-carbon steel alloy (grade: 11SMn30). The key dimensions, incl. the prototype valve’s photo, can be seen in the illustration below.

4.2. Three-Stage Prototype

The three-stage prototype in Figure 5 is likely to present a greater dynamic range in comparison with the single-stage valve by employing a series of three pinch gaps in the flow channel. The components (1, 5, and 6) in Figure 5 are shared with the single-stage valve. Moreover, the number of coil wire turns (4) increased for the 3-stage valve; the coil’s wire-turn number was N = 350. The purpose of the increased wire-turn number was to compensate for the additional air gaps in between the spacers (2). The flow thru-hole circular channel’s diameter (channel axis marked in red) was also equal to D = 3 mm. In this configuration, the active zone was composed of the three pinch gaps formed by the three bronze non-magnetic spacers (2) and two low-carbon magnetic poles (3). Again, the key dimensions can be seen in the figure below.

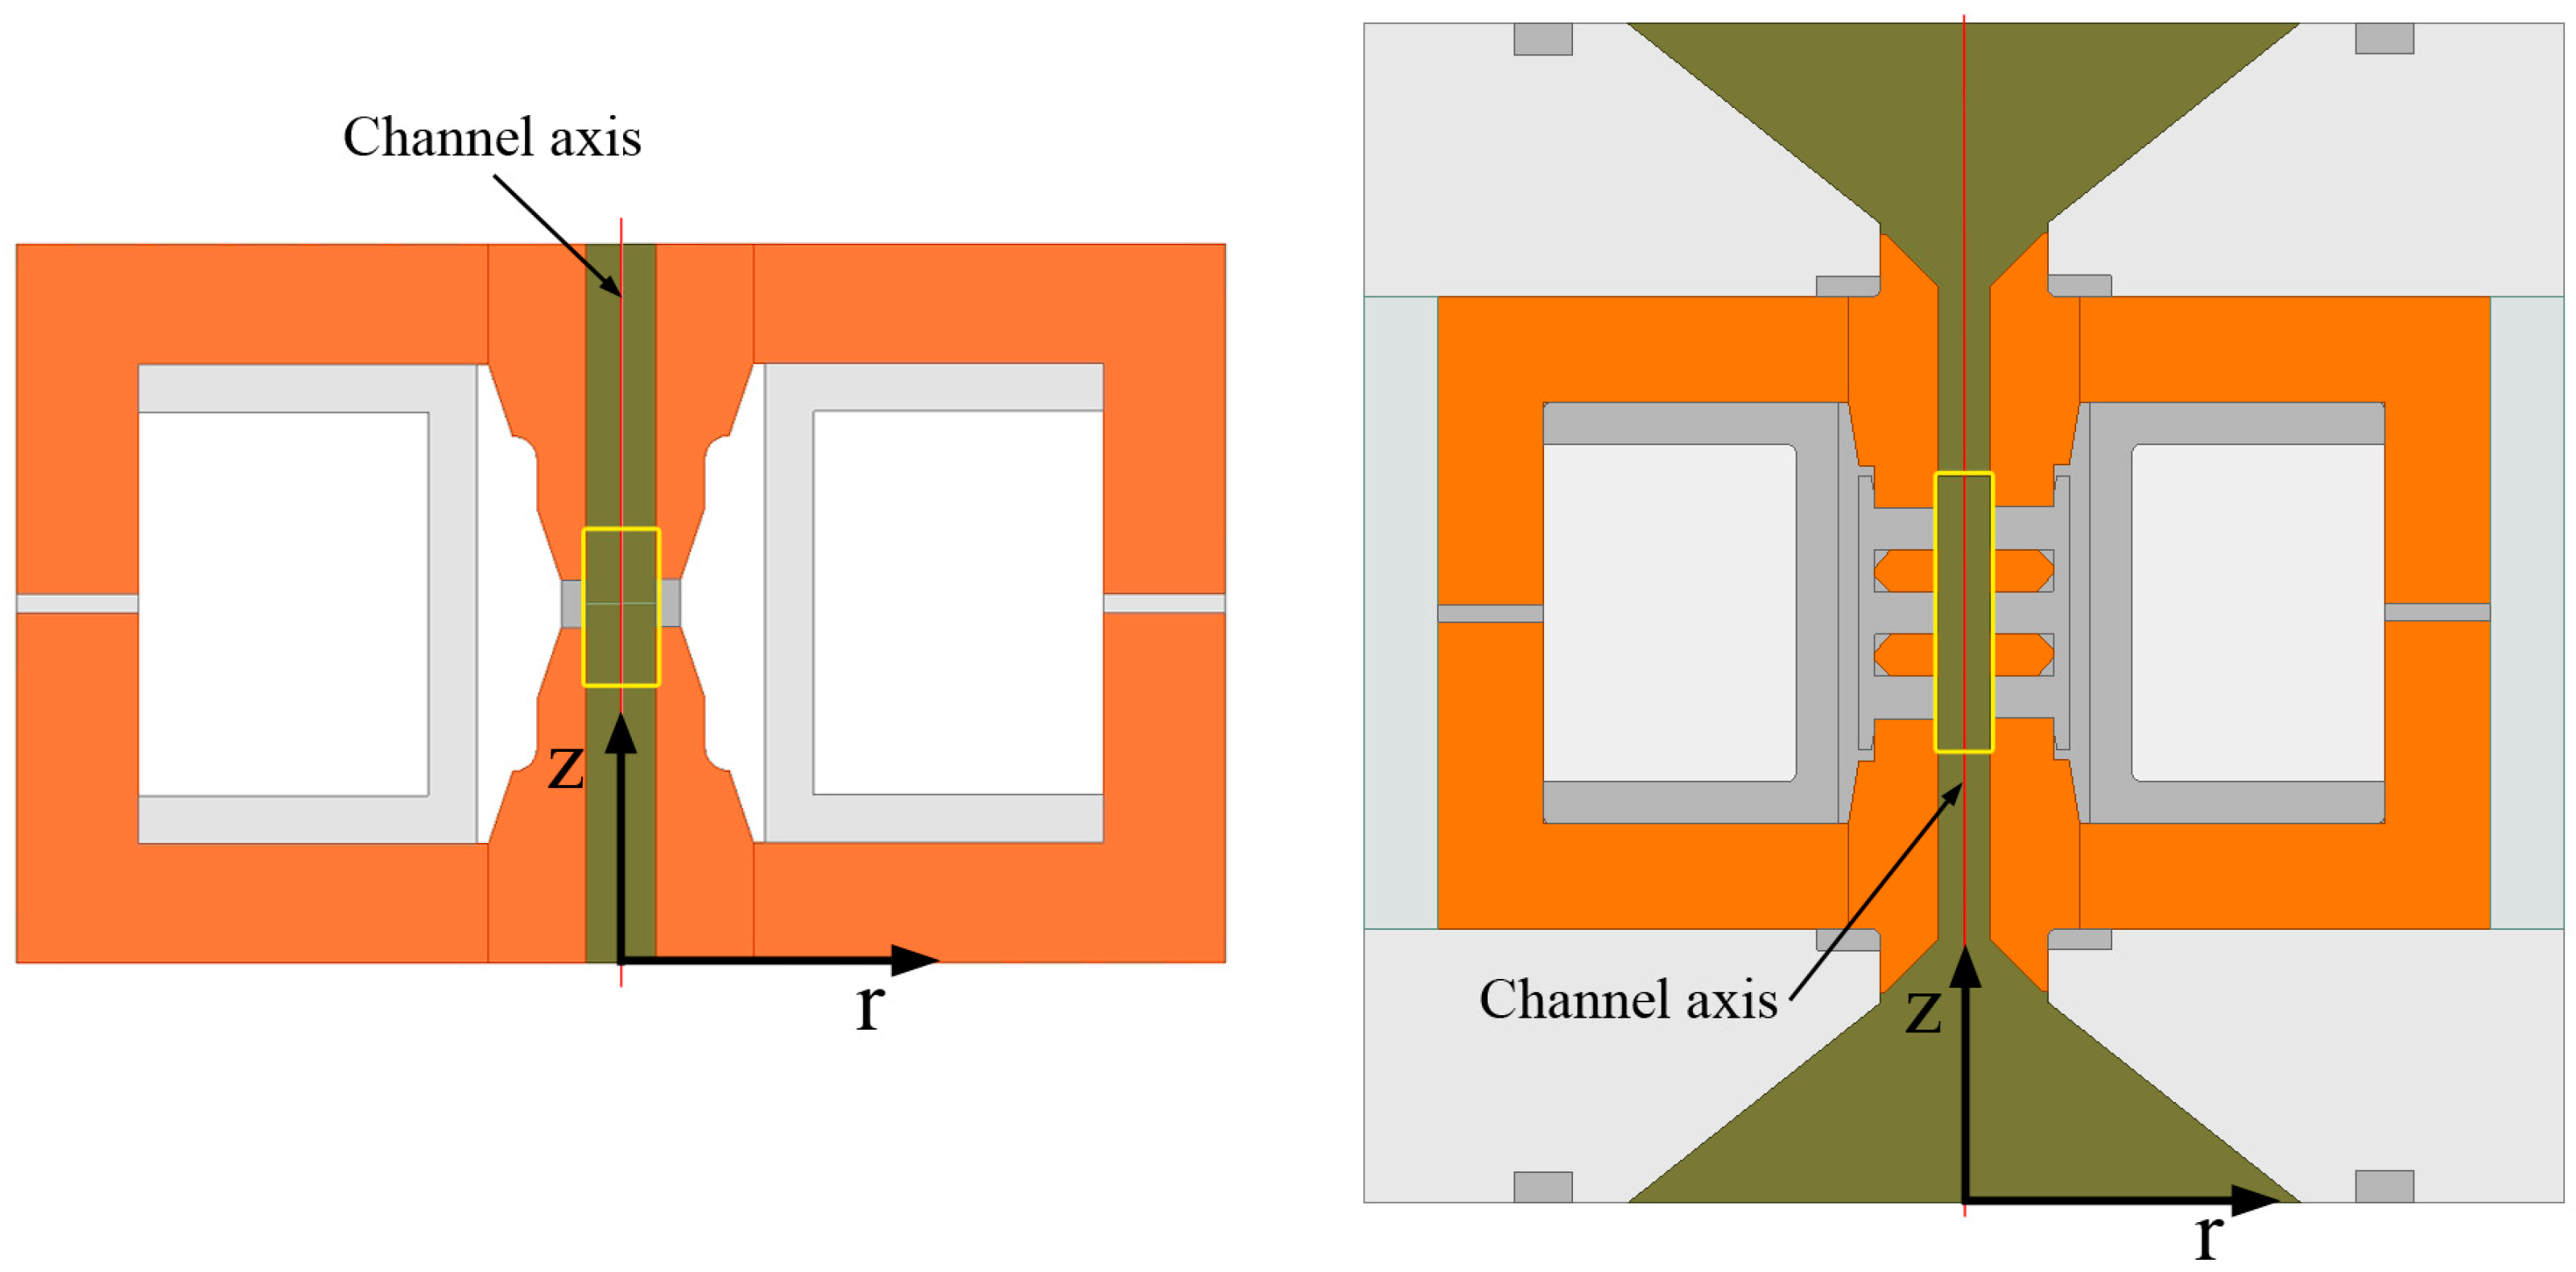
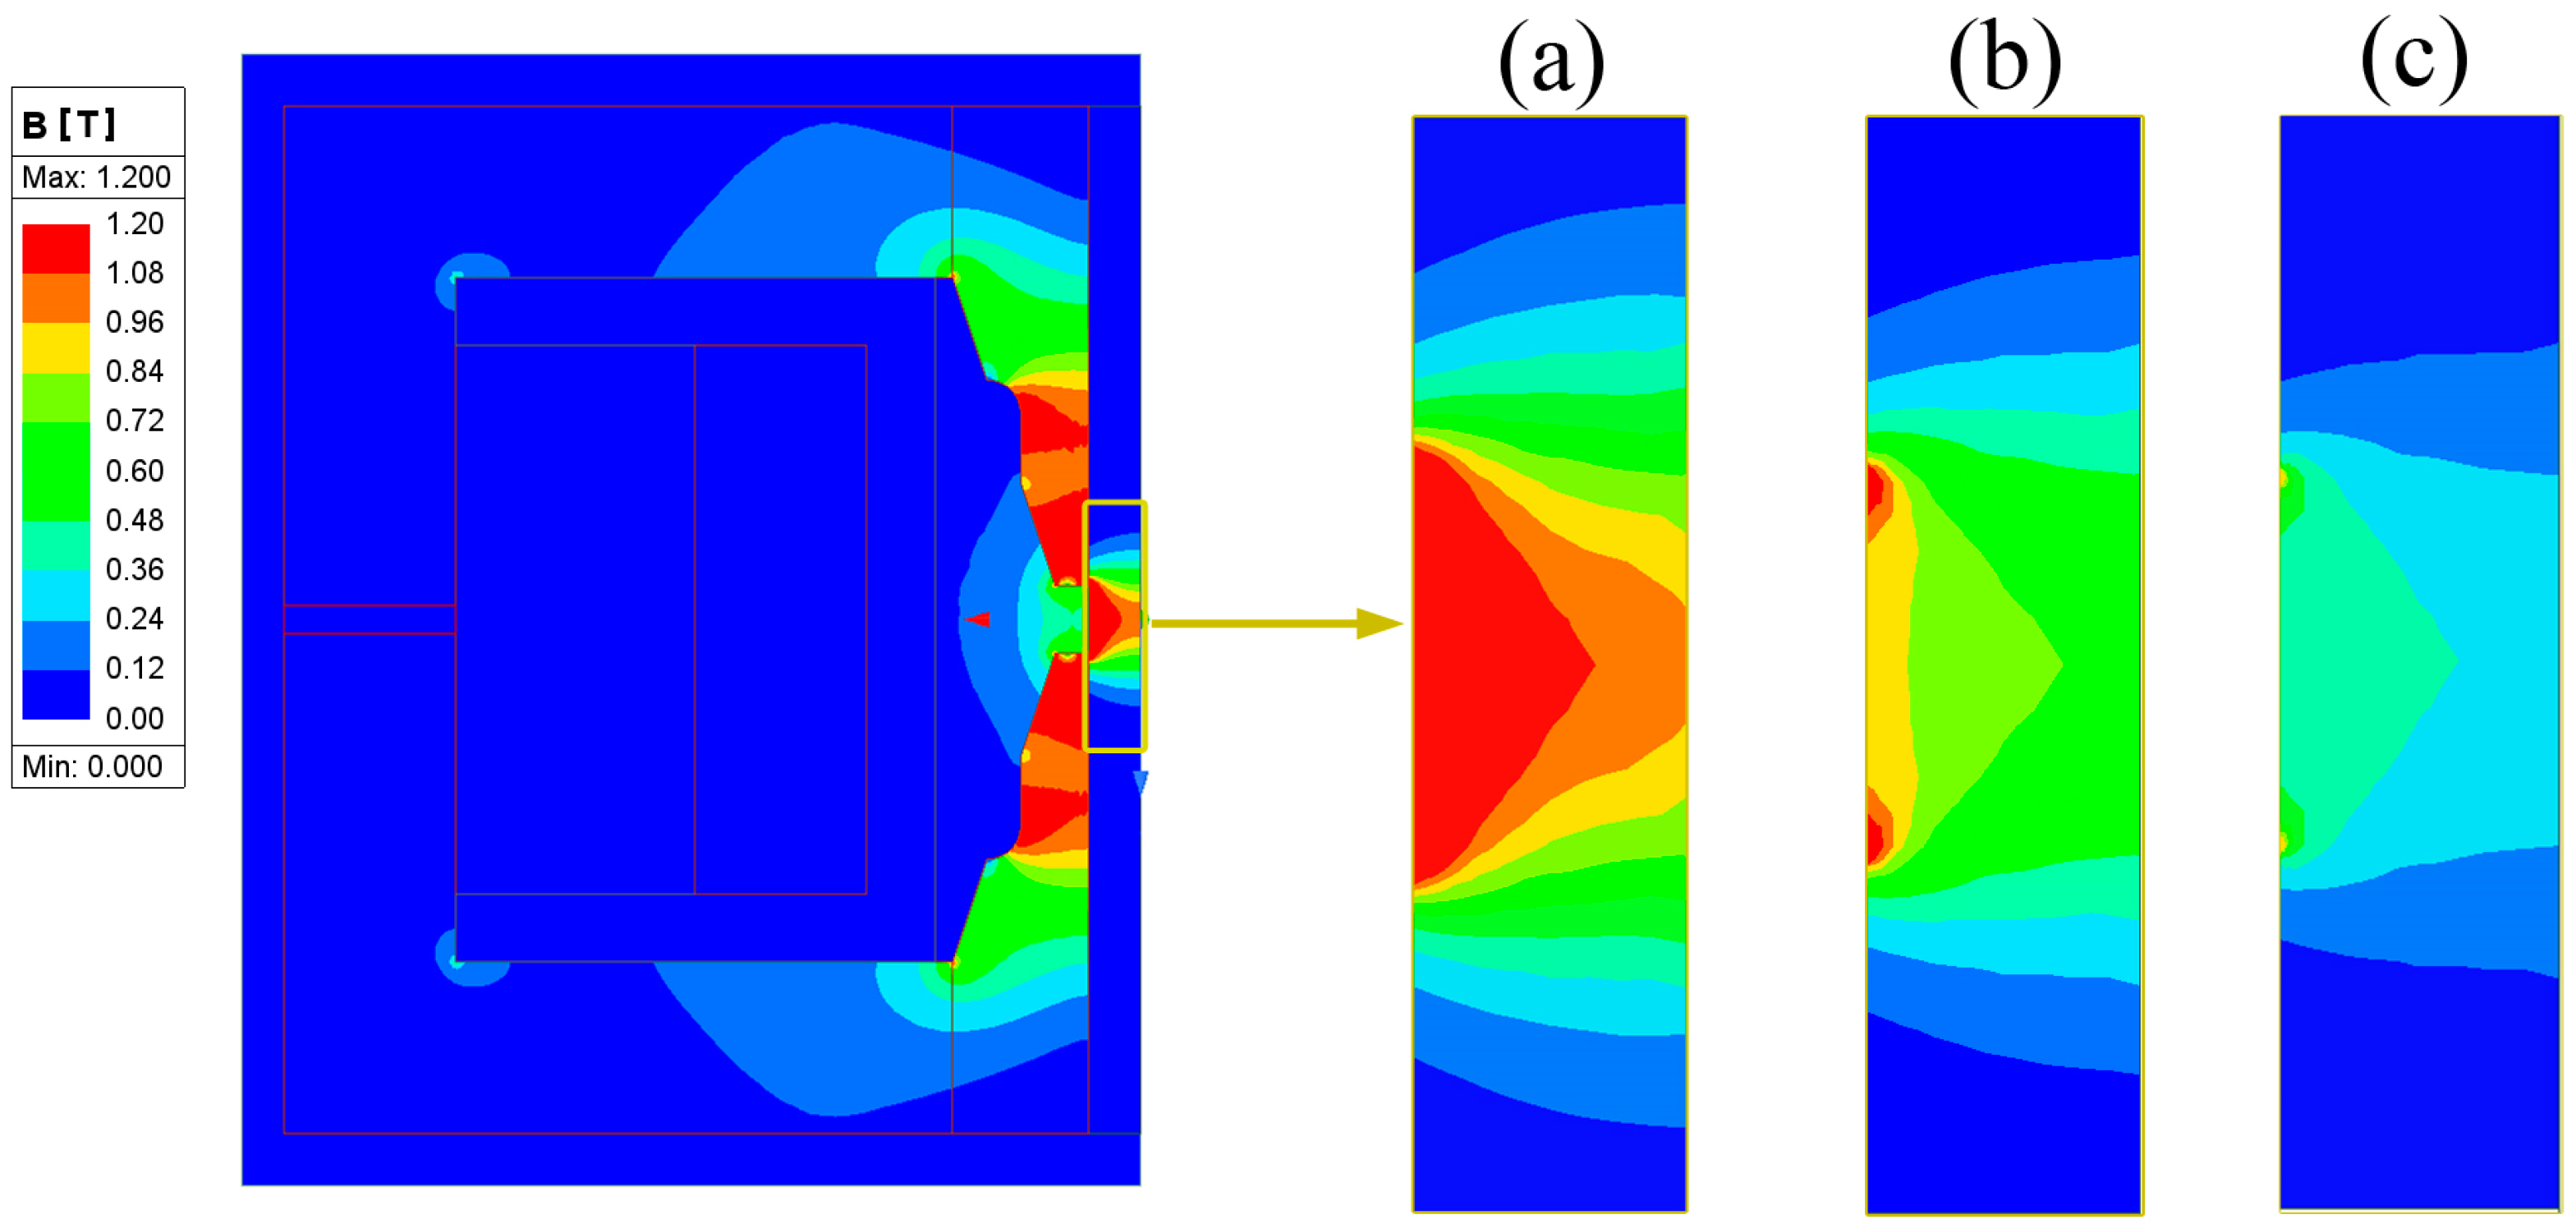
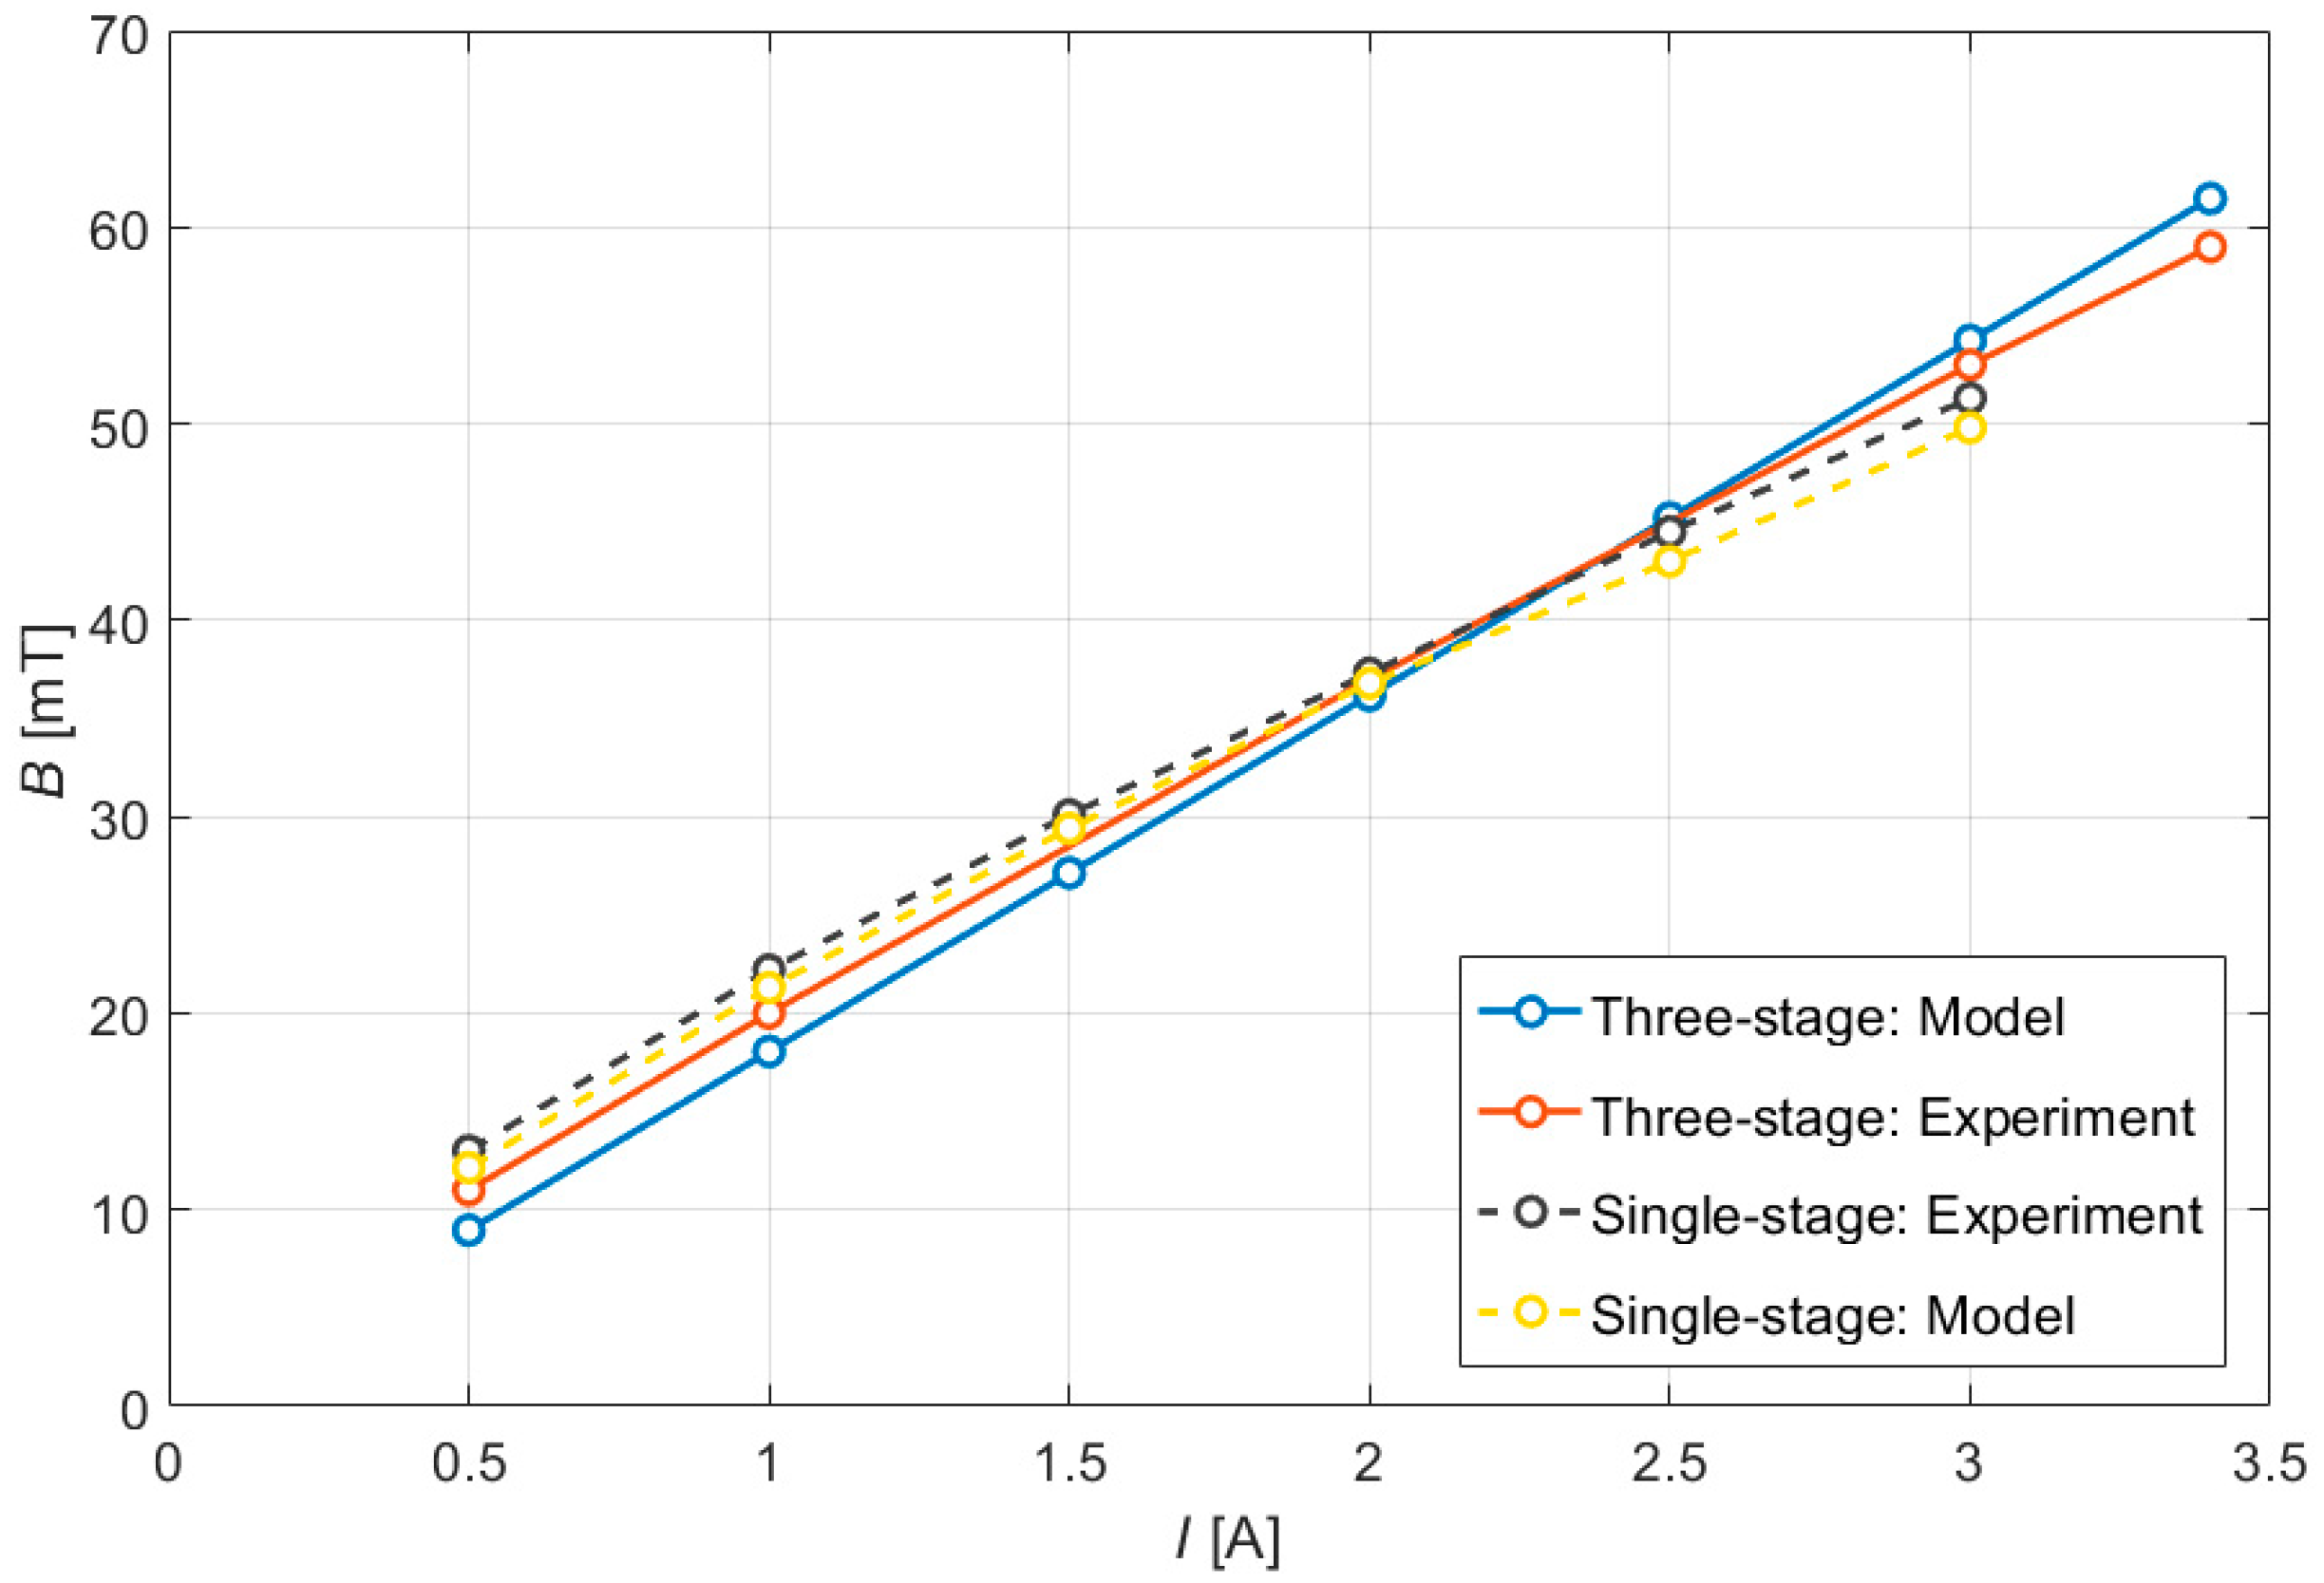
4.3. FE Magnetostatic Analysis and Experimental Validation

Carrying out a magnetostatic analysis was crucial for estimating the flux in the flow channel as well as the comparing the two valve assemblies. The magnetostatic analysis was performed using Ansys Electronics Desktop 2023 R1. To develop the FE model, the authors assumed the valve to be axially symmetrical around the centerline (red line) in a cylindrical coordinate system (r–z). Figure 6 reveals the simplified geometry of the FE (finite-element) models. The following material properties were assumed for the specific components in the circuit: orange—low-carbon alloy steel 11SMn30, green—MR fluid MRF-122EG, and gray—bronze or aluminum. The magnetization curve of the 11SMn30 alloy was based on the data provided in [12]. The gap in the upper section of the core was for monitoring the flux induced in the structure (see Figure 4, position 6).
The mesh size in the active zone (flow channel and pinch gaps) was set to be equal to 0.2 mm, and in the remaining portion of the solenoid it was set to 0.5 mm. Such a fine mesh was chosen due to the accurate description of the magnetic flux density map in the active zone since there was a relatively great change in the magnetic flux density level within the relatively small region. The final value of the mesh size was determined following the mesh sensitivity analysis outcome.
As previously mentioned, the verification of the numerical results was conducted by the authors via the measurements of the magnetic flux density in the air gap. The magnetic flux density was measured using a fluxmeter (F.W. Bell 5180) and by means of a transverse probe (STB1X-0201). The supplied current was measured with Fluke i30 current clamps. Figure 7 shows the comparison of the results obtained from the model against the experimental data. To accomplish the measurements, the flux probe was inserted into the air gap (Figure 2). It is evident that the agreement between the experiment and the model is good. The relative error did not exceed 15%. It can also be argued that both valves revealed nearly identical electric current vs. magnetic flux characteristics. At lower electric currents, the single-stage valve’s output (magnetic flux density B) slightly exceeded the output of the three-stage valve, and it was inferior at the currents higher than 2 A.

5. Magnetostatic Analysis and Laboratory Test Results

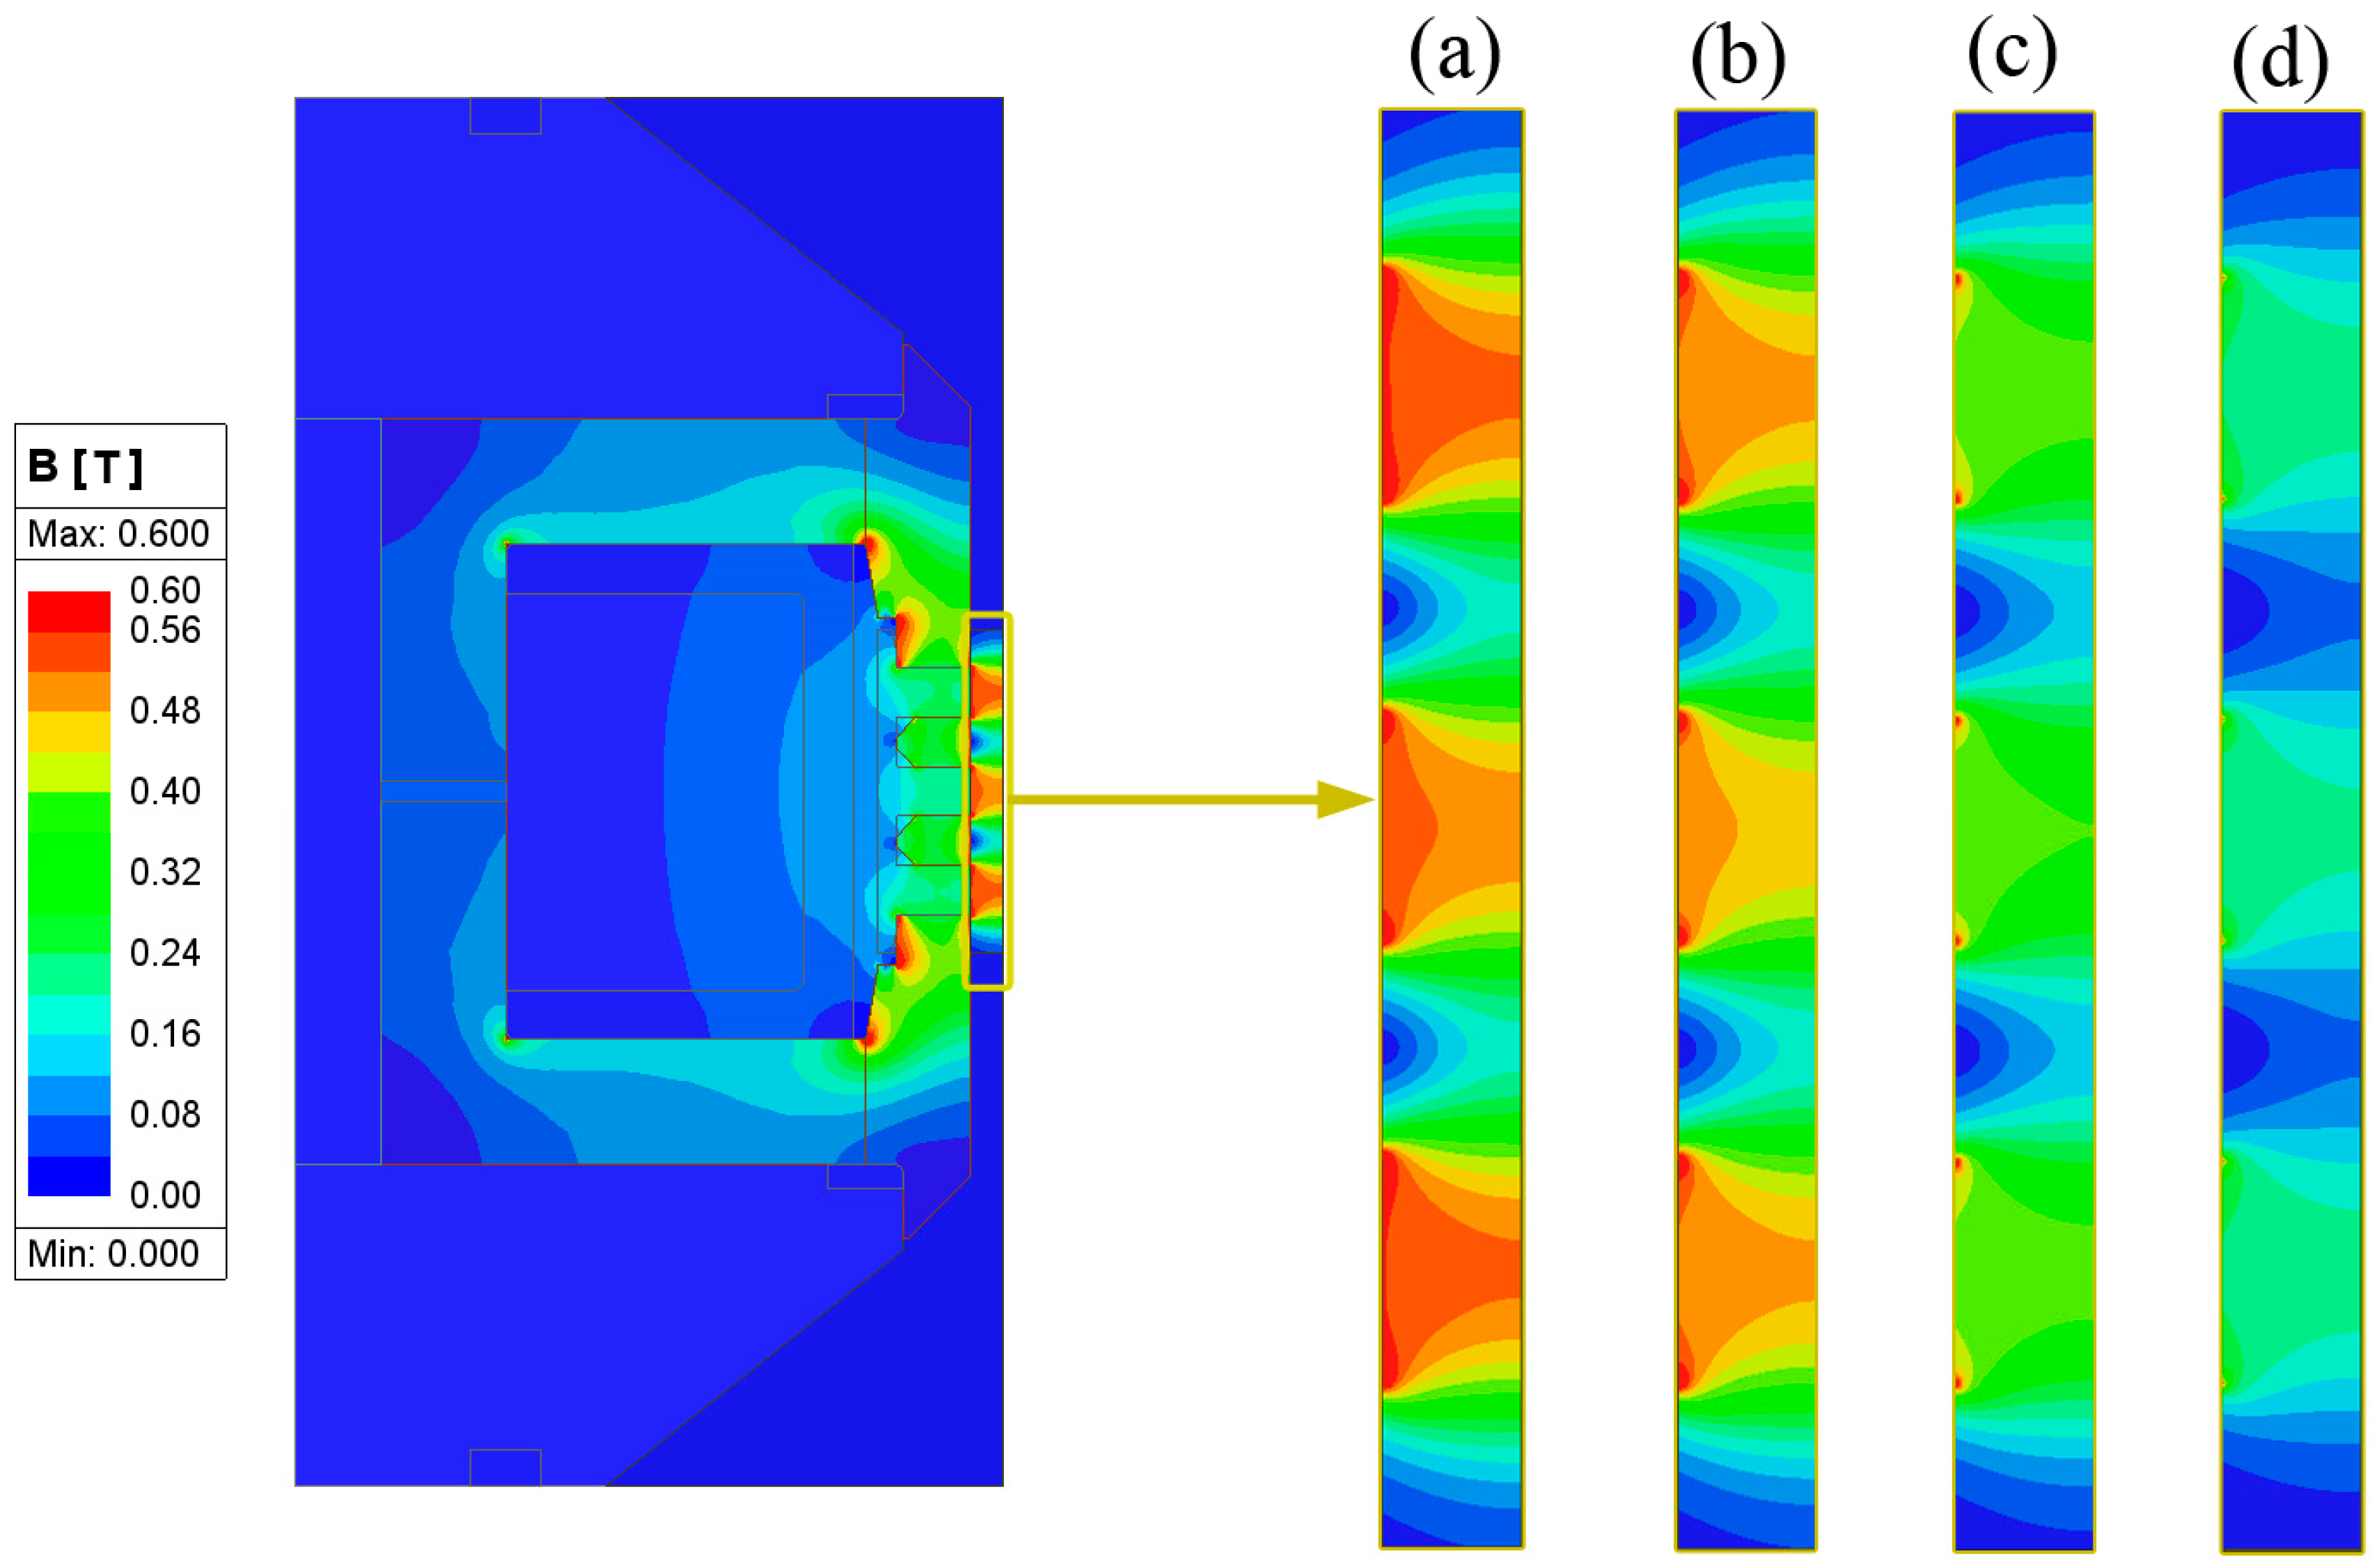
5.1. FE Calculations

Figure 8 shows the magnetic flux density map in the single-stage pinch valve at I = 3 A and in more detail at the current levels I = 3 A (a), I = 2 A (b), and I = 1 A (c). In this prototype, the MR fluid magnetization was higher compared to the three-stage pinch valve (Figure 9). The maximum magnetic flux density, B, in the single-stage valve was roughly B = 900 mT compared to the output flux density, B = 550 mT, of the three-stage pinch valve. The magnetic flux density maps of the single-stage valve were similar to those of the three-stage pinch valve (side pinch gaps only).
Figure 9 (left) shows the magnetic flux density map for the three-stage valve at the electric current level of I = 3.4 A. In more detail, the flux density map for the active zones can be seen in Figure 9 (right) at I = 3.4 A (a), I = 3 A (b), I = 2 A (c), and I = 1 A (d). It can be seen that the magnetic flux density map distribution over the middle pinch gap is different when compared to the neighbors. This is likely due to the flux leakage between the neighboring poles. As seen in Figure 9, there is significant flux leakage between the neighboring poles. Instead of traveling into the flow channel only, a portion of the flux bypasses it, thus degrading the magnetic circuit performance. This is, however, an inherent feature of the multi-stage configuration, and a challenge for future works.
It is crucial to notice the limitations of the magnetic model. The MRF fluid properties were assumed to be time-invariant. Moreover, it was assumed that the MR fluid was homogenous in the control volume. However, it can be expected that the magnetophoretic force [25] causes the migration of particles in the fluid due to the magnetic flux density gradient. Therefore, the concentration of ferromagnetic particles (density) in the active zone was not constant and the magnetic properties (relative permeability, magnetic saturation, etc.) were position (volume)-dependent. This had a direct impact on the magnetic flux density map in the active zones. The presented magnetic model did not account for that behavior. For this reason, the performance of the prototypes was compared at the same magnetic flux that roughly corresponded with the electric current excitation.

5.2. Flow Bench Testing

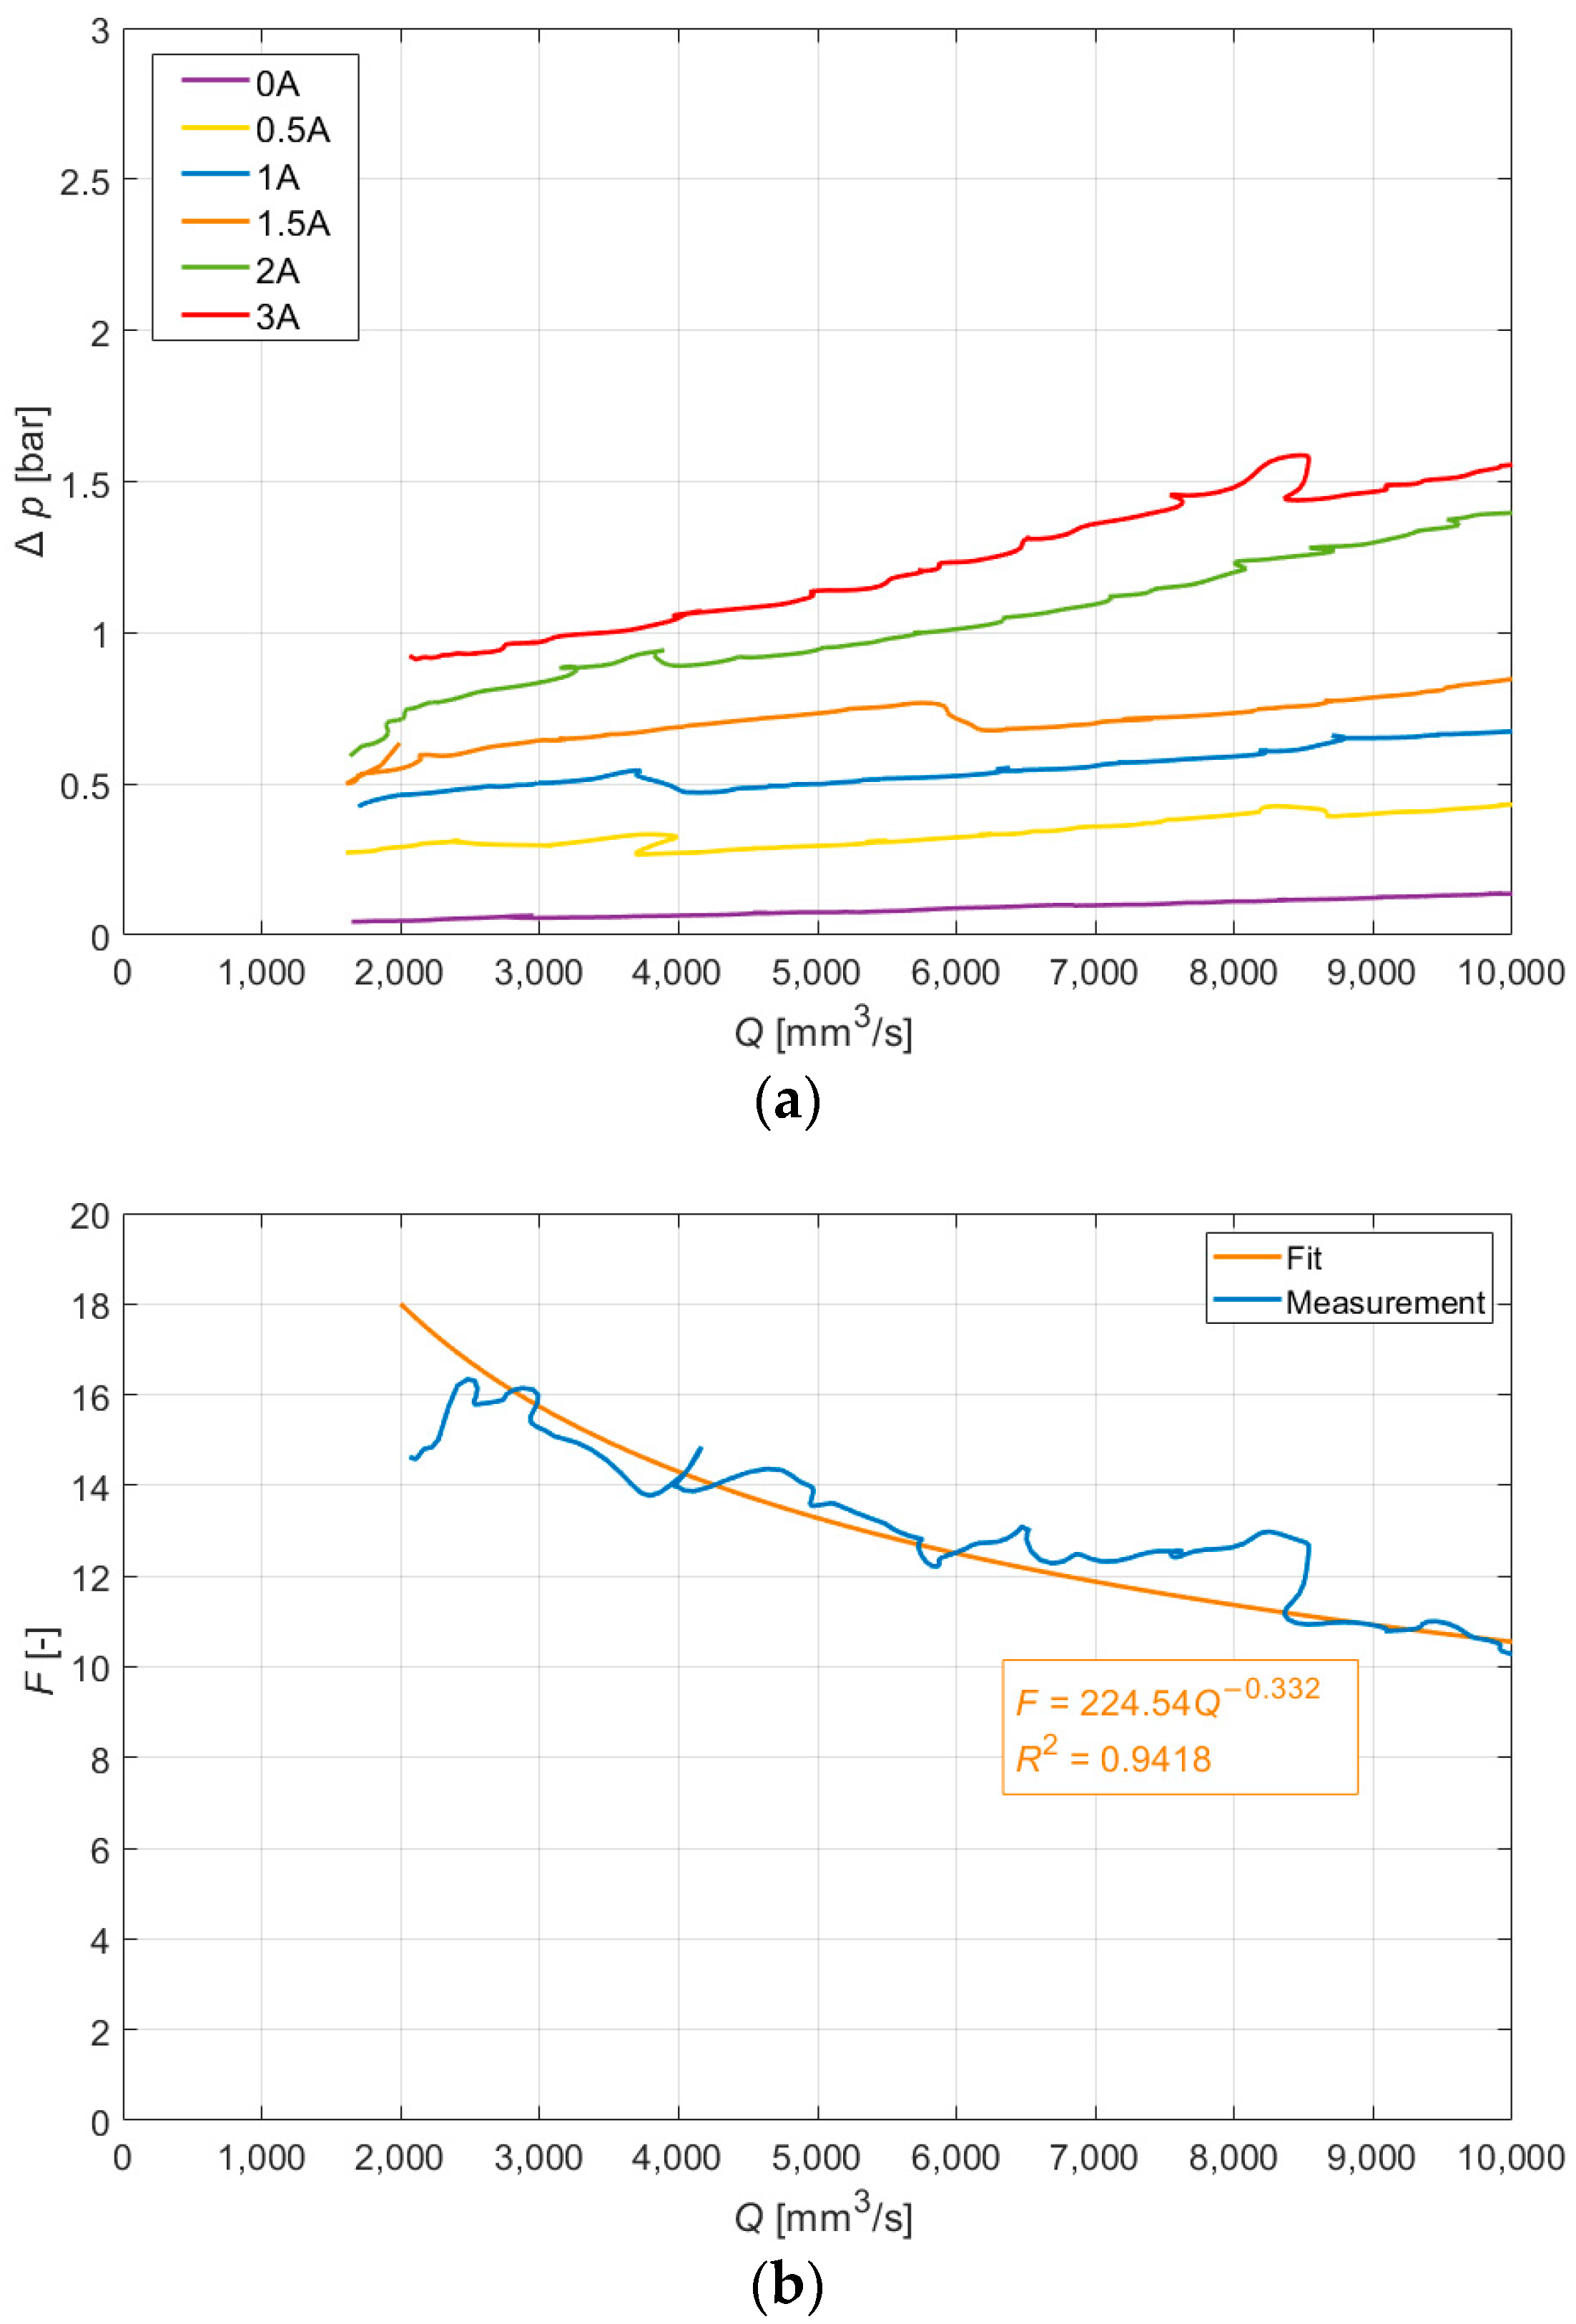
5.2.1. Single-Stage Valve

Figure 10 shows the plot of the MR valve pressure drop versus the flow rate dataset collected during the velocity increase stage. The illustration shows the data at various levels of the magnetic flux density (or up to I = 3 A). In Figure 10, the increase in the slope of the flow curve, K, and the pressure drop offset change with the increase in the magnetic field, B, are evident. Based on the calculations from the measured data, the estimated pressure–flow rate curve slope varied by a factor of K = 6.6 at the maximum electric current excitation, I = 3 A, compared to the off-state condition (I = 0 A). The measured curves were not smooth and revealed unexpected pressure drop twitches. A more detailed description of this phenomenon can be found in [16]. Lee at al. [15] measured the output of the MR pinch valve only at several discrete measurement points. Therefore, the disturbances occurring in the measured signal could not be captured. It was also necessary to note that Lee et al. [15] studied the pinch-mode valve performance at significantly higher flow rates than in the case of the present experiment. At the same time, comparing the two experiments in terms of the Reynolds number range yielded a slightly different image—the competitive experiment was conducted up to Re = 246, whereas in the current study, it reached 180.
The dynamic range, F, of this valve reached 10.3 at the flow rate of 10,000 mm3/s. It was evident that, as the flow rate increased, the absolute pressure drop span (calculated as the difference between the pressure drop at a given flow rate and the current level relative to the off-state pressure drop) increased at least within the examined flow rate range.

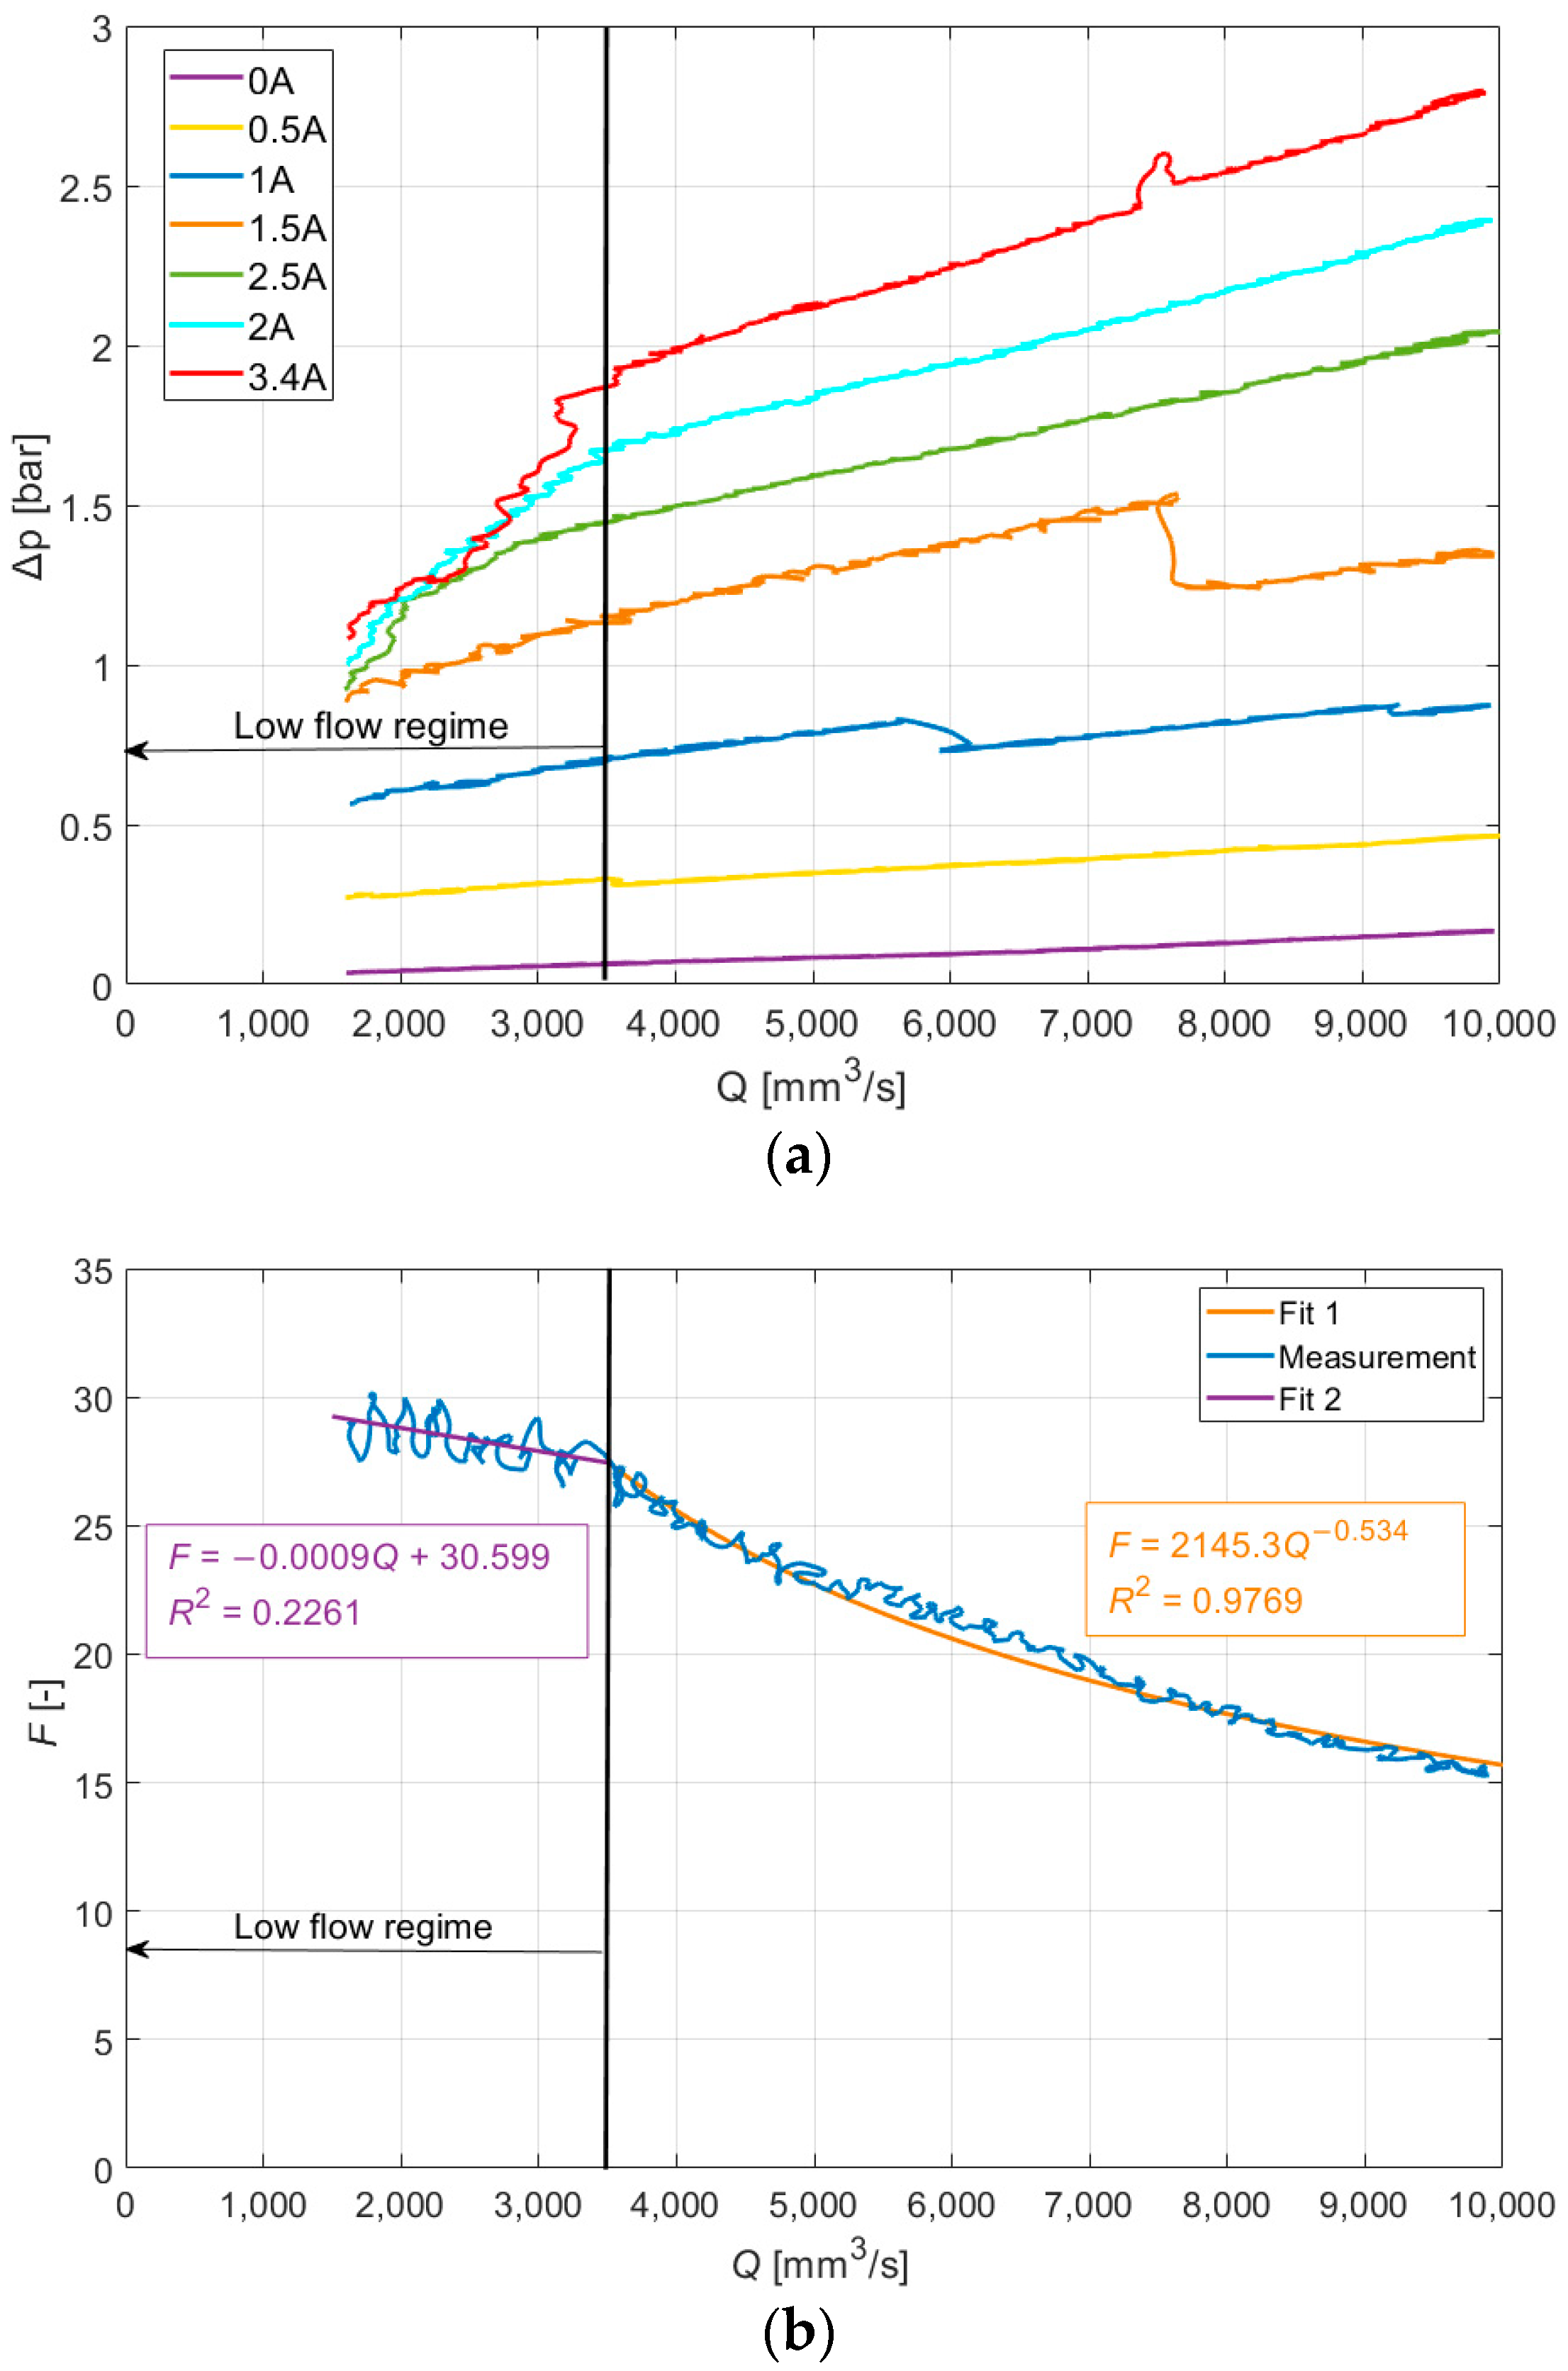
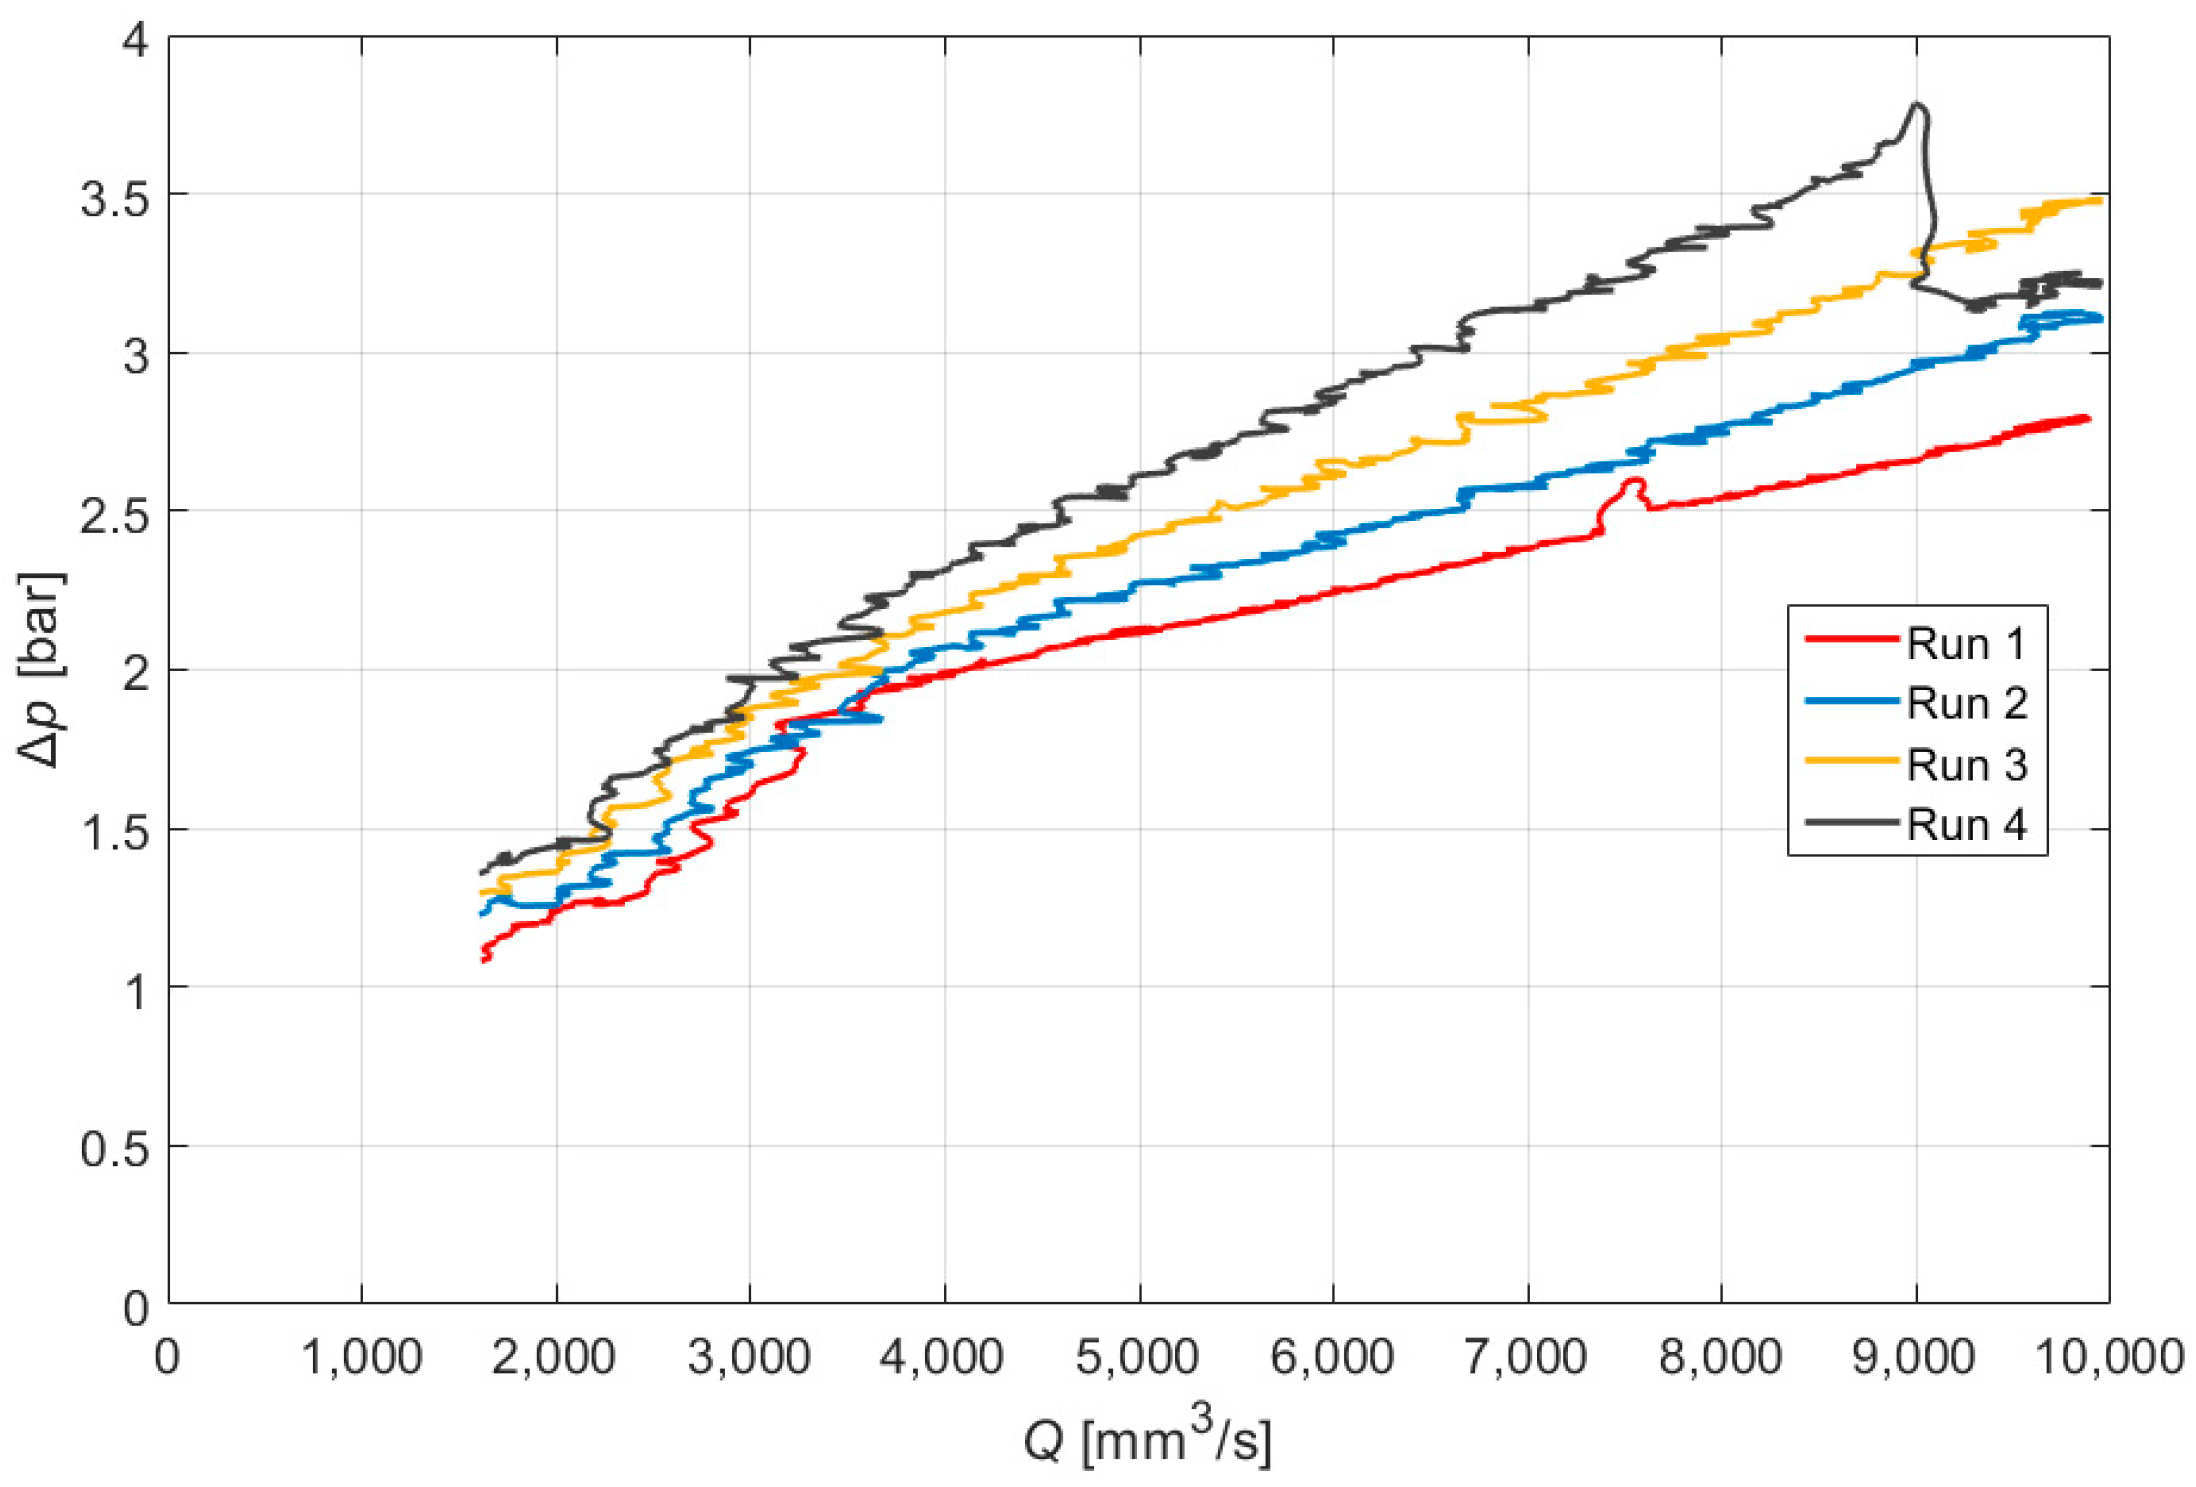
5.2.2. Three-Stage Valve

Figure 11 shows the plot of the MR valve pressure drop versus flow rate dataset collected during the velocity increase stage with the three-stage MR pinch-valve prototype. It can be observed that at higher magnetic fields (corresponding to the current levels I = 3 A and I = 3.4 A), the curves exhibit a bi-linear character. At low flow rates (up to Q = 3500 mm3/s), the slope is significantly steeper than at the higher flow rates. The estimated pressure drop–flow rate curve’s slope varies by a factor of K = 28 at the maximum electric current excitation, I = 3.4 A, compared to the off-state condition (I = 0 A) at low flow rates Q. Above Q = 3500 mm3/s, the slope factor significantly decreases to K = 9.1. The valve’s dynamic range, F, reaches 15.5 at Q = 10,000 mm3/s. Again, as the flow rate, Q, increases, the valve’s pressure drop span increases.
Then, the repeatability of the valve’s output was examined. Figure 12 shows the outcome of the experiment at I = 3.4 A. It can be seen that the data at low flow rates are relatively well repeatable. However, above the flow rate, Q = 3500 mm3/s, the variations between the consecutive runs become evident; the curve slope varies from K = 9 (run 1) to K = 17 (run 4). We hypothesized that this behavior was caused by increasing the concentration of particles in the active zone in time. A similar phenomenon was also observed with the single-stage pinch valve. To comprehend this behavior, it will probably be necessary to observe the active zone and particle clusters visually. The computed tomography method [26,27] or the fluorescence method with a confocal microscope [28] can be used for providing in insight into this behavior.
The authors estimated that the flow rate would linearly increase during the experiment. Unfortunately, it was not like this in some cases due to the regulation hysteresis of our hydraulic dynamometer.

5.3. Valve Performance Comparison

Except for the presence of multiple pinch stages in the latter prototype, both valves were identical and examined under the same test conditions. The three-stage MR pinch valve’s maximum output exceeded the performance of the single-stage MR pinch valve by a factor of 1.55. The off-state performances of the two valves were nearly identical—the pressure drop difference at 10,000 mm3/s did not exceed 0.02 bar. This was likely caused by minor discrepancies in the temperature during the tests, as seen in Figure 13—the MR fluid’s temperature was 0.8 °C lower while testing the three-stage MR pinch valve compared to the single-stage MR pinch valve.
In comparison with the single-stage valve, the three-stage MR pinch valve reached a significantly higher dynamic range, F, of 17 as opposed to 11.5 for the single-stage prototype. Another significant difference was in the three-stage MR pinch valve’s bilinear behavior, as illustrated in Figure 13. At low flow rates, the curve’s slope factor, K, reached a value of 28, only to drop down to 9.1 at higher flow rates. It seems that the observed behavior in the pinch mode at low flow rates may be an interesting loading mode for microfluidic systems working with MR fluid [25,29].
The pressure drop measurements at flow rates lower than 1500 mm3/s were not presented due to the significant influence of the hydraulic pulsator’s controller. For further research, it is necessary to redesign the test rig for using such measurements in a reliable and repetitive manner.

6. Conclusions

In general, the purpose of the research was to provide a detailed performance comparison of a single-and the multi-stage pinch-mode valve, which incorporated three pinch gaps in series in a flow channel. To accomplish this, the authors designed and manufactured prototypes, and then examined their performances across a prescribed range of excitation inputs.
Based on the analysis of the data, the following conclusions can be drawn:
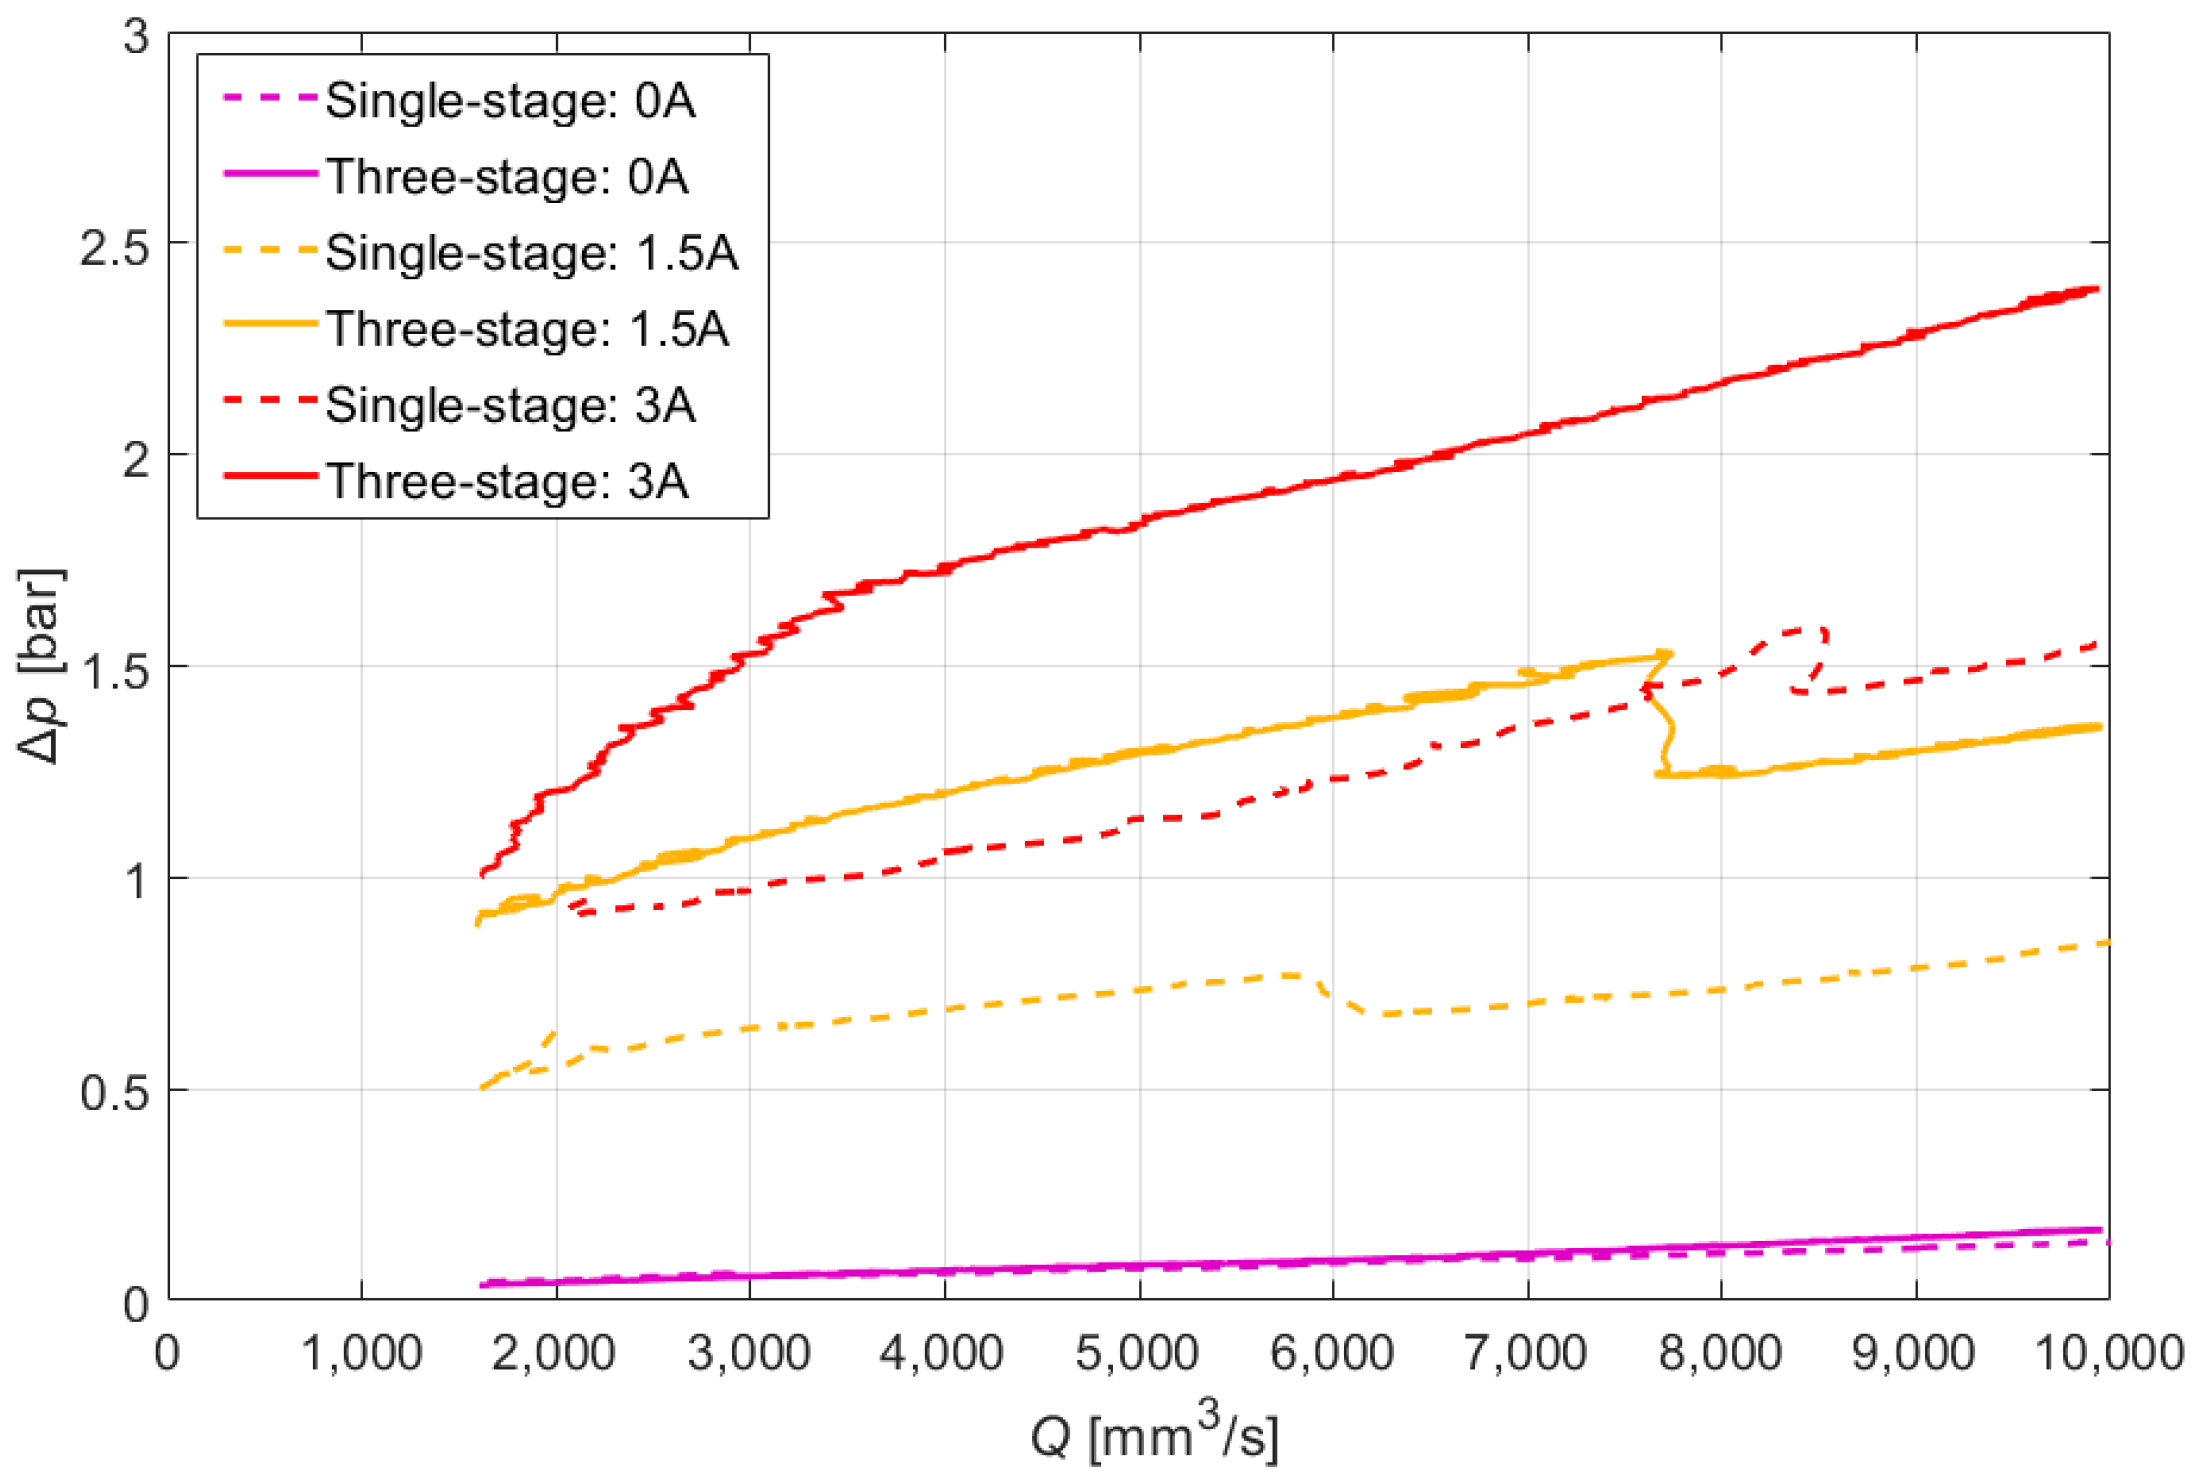
  • The three-stage prototype reveals a superior performance when compared to its single-stage counterpart. The increase in the performance of the three-stage prototype is 55%.
  • The three-stage prototype’s performance is somewhat hampered by the sequence of several air gaps in the solenoid for the magnetic flux to pass through. The air gaps are the elements causing the greatest reluctance; therefore, the level of current to generate an equivalent flux density in the flow channel is increased. Thus, the power consumption is higher in the case of the three-stage assembly.
  • The three-stage valve is superior in terms of the slope factor variation when compared to the single-stage valve. At low flow rates, the largest slope factor of the three-stage valve is 4.5-times higher than the single-stage valve and augmented by 1.5 times at higher flow rates.
  • The three-stage valve exhibits bilinear behavior at the highest current level, which is not observed in the single-stage prototype. This behavior may yield some performance advantages and merits further investigation.
On a general note, the multi-stage pinch-mode valve’s development may be hampered by its magnetic circuit performance. Although the fluid in the channel is activated in several locations, its performance does not increase proportionally with the number of stages in the flow channel for the same magnetic flux induced in the structure. The authors plan to modify the multi-stage prototype of the valve to improve the dynamic range of the magnetic circuit by proposing a different topology.

Author Contributions

Conceptualization, M.K. and J.Ž.; methodology, M.K.; software, Z.S.; validation, J.Ž., J.G. and B.S.; resources, B.S.; writing—original draft preparation, J.G., J.Ž. and M.S.; writing—review and editing, M.K. and B.S.; supervision, M.K. and B.S.; project administration, B.S. All authors have read and agreed to the published version of the manuscript.

Funding

The authors wish to acknowledge the kind support of the Czech Science Foundation (Grantová agentura České republiky—GACR) and the National Science Centre (Narodowe Centrum Nauki—NCN, Poland)—grant IDs: GACR 21-45236L (CZ) and 2020/39/I/ST8/02916 (PL).

Data Availability Statement

The editable raw data from measurement are available from the corresponding author, [M. Kubík], upon request. Data that supported conclusions are contained within the paper.

Conflicts of Interest

The authors declare no conflict of interest.

References

  1. de Vicente, J.; Klingenberg, D.J.; Hidalgo-Alvarez, R. Magnetorheological fluids: A review. Soft Matter 2011, 7, 3701. [Google Scholar] [CrossRef]
  2. Kumar, J.S.; Paul, P.S.; Raghunathan, G.; Alex, D.G. A review of challenges and solutions in the preparation and use of magnetorheological fluids. Int. J. Mech. Mater. Eng. 2019, 14, 13. [Google Scholar] [CrossRef]
  3. Li, P.; Dong, X.; Wang, K.; Ran, J.; Yang, B. Characteristic analysis of magnetorheological fluid porous fabric composite with a novel constitute model. Smart Mater. Struct. 2023, 32, 025002. [Google Scholar] [CrossRef]
  4. Li, G.; Huang, Q.; Hu, G.; Ding, R.; Zhu, W.; Zeng, L. Semi-active fuzzy cooperative control of vehicle suspension with a magnetorheological damper. J. Intell. Mater. Syst. Struct. 2023, 34, 2106–2123. [Google Scholar] [CrossRef]
  5. Xia, D.; Fu, J.; Li, W.; Han, G.; Du, X.; Luo, L.; Yu, M. Incremental proportion integration differentiation control of all-terrain vehicle magnetorheological suspension system under low-frequency disturbances. Smart Mater. Struct. 2023, 32, 075019. [Google Scholar] [CrossRef]
  6. Yang, J.; Sun, S.; Ezani, S.; Gong, N.; Deng, L.; Zhang, S.; Li, W. New magnetorheological engine mount with controllable stiffness characteristics towards improved driving stability and ride comfort. Smart Mater. Struct. 2022, 31, 125009. [Google Scholar] [CrossRef]
  7. Chen, S.; Li, R.; Du, P.; Zheng, H.; Li, D. Parametric Modeling of a Magnetorheological Engine Mount Based on a Modified Polynomial Bingham Model. Front. Mater. 2019, 6, 68. [Google Scholar] [CrossRef]
  8. Koutsoloukas, L.; Nikitas, N.; Aristidou, P. Passive, semi-active, active and hybrid mass dampers: A literature review with associated applications on building-like structures. Dev. Built Environ. 2022, 12, 100094. [Google Scholar] [CrossRef]
  9. Demetriou, D.; Nikitas, N.; Tsavdaridis, K.D. Performance of fixed-parameter control algorithms on high-rise structures equipped with semi-active tuned mass dampers. Struct. Des. Tall Spec. Build. 2016, 25, 340–354. [Google Scholar] [CrossRef]
  10. Liu, J.; Qu, W.; Nikitas, N.; Ji, Z. Research on extending the fatigue life of railway steel bridges by using intelligent control. Constr. Build. Mater. 2018, 168, 532–546. [Google Scholar] [CrossRef]
  11. Sapiński, B.; Rosół, M. Autonomous control system for a 3 DOF pitch-plane suspension model with MR shock absorbers. Comput. Struct. 2008, 86, 379–385. [Google Scholar] [CrossRef]
  12. Strecker, Z.; Jeniš, F.; Kubík, M.; Macháček, O.; Choi, S.-B. Novel Approaches to the Design of an Ultra-Fast Magnetorheological Valve for Semi-Active Control. Materials 2021, 14, 2500. [Google Scholar] [CrossRef]
  13. Žáček, J.; Šebesta, K.; Mohammad, H.; Jeniš, F.; Strecker, Z.; Kubík, M. Experimental Evaluation of Modified Groundhook Car Suspension with Fast Magnetorheological Damper. Actuators 2022, 11, 354. [Google Scholar] [CrossRef]
  14. Wereley, N.M.; Cho, J.U.; Choi, Y.T.; Choi, S.B. Magnetorheological dampers in shear mode. Smart Mater. Struct. 2008, 17, 015022. [Google Scholar] [CrossRef]
  15. Lee, T.-H.; Kang, B.-H.; Choi, S.-B. A quasi-static model for the pinch mode analysis of a magnetorheological fluid flow with an experimental validation. Mech. Syst. Signal Process. 2019, 134, 106308. [Google Scholar] [CrossRef]
  16. Kubík, M.; Gołdasz, J.; Macháček, O.; Strecker, Z.; Sapiński, B. Magnetorheological fluids subjected to non-uniform magnetic fields: Experimental characterization. Smart Mater. Struct. 2023, 32, 035007. [Google Scholar] [CrossRef]
  17. Carlson, J.; Goncalves, F.; Catanzarite, D.; Dobbs, D. Controllable Magnetorheological Fluid Valve, Devices, and Methods. U.S. Patent US20080060710A1, 3 March 2008. [Google Scholar]
  18. Golini, D.; Kordonski, W.I.; Dumas, P.; Hogan, S.J. Magnetorheological Finishing (MRF) in Commercial Precision Optics Manufacturing; Stahl, H.P., Ed.; SPIE: Bellingham, WA, USA, 1999; pp. 80–91. [Google Scholar]
  19. Kordonsky, W.I.; Prokhorov, I.V.; Gorodkin, G.; Jacobs, S.D.; Puchebner, B.; Pietrowski, D. Magnetorheological Finishing. Opt. Photonics News 1993, 4, 16. [Google Scholar] [CrossRef]
  20. Jolly, M.R.; Bender, J.W.; Carlson, J.D. Properties and Applications of Commercial Magnetorheological Fluids. J. Intell. Mater. Syst. Struct. 1999, 10, 5–13. [Google Scholar] [CrossRef]
  21. Gällsjö, A.; Johansson, M. Physical Modelling and Automatic Configuration of CES Valve; Linköping University: Linköping, Sweden, 2012. [Google Scholar]
  22. Gong, X.; Ruan, X.; Xuan, S.; Yan, Q.; Deng, H. Magnetorheological Damper Working in Squeeze Mode. Adv. Mech. Eng. 2014, 6, 410158. [Google Scholar] [CrossRef]
  23. Kim, B.-G.; Yoon, D.-S.; Kim, G.-W.; Choi, S.-B.; Tan, A.S.; Sattel, T. Design of a Novel Magnetorheological Damper Adaptable to Low and High Stroke Velocity of Vehicle Suspension System. Appl. Sci. 2020, 10, 5586. [Google Scholar] [CrossRef]
  24. Kubík, M.; Šebesta, K.; Strecker, Z.; Jeniš, F.; Goldasz, J.; Mazůrek, I. Hydrodynamic response time of magnetorheological fluid in valve mode: Model and experimental verification. Smart Mater. Struct. 2021, 30, 125020. [Google Scholar] [CrossRef]
  25. Ocalan, M.; McKinley, G.H. Rheology and microstructural evolution in pressure-driven flow of a magnetorheological fluid with strong particle–wall interactions. J. Intell. Mater. Syst. Struct. 2012, 23, 969–978. [Google Scholar] [CrossRef]
  26. Schümann, M.; Odenbach, S. The microstructure of magnetorheological materials characterized by means of computed X-ray microtomography. Phys. Sci. Rev. 2023, 8, 1487–1511. [Google Scholar] [CrossRef]
  27. Wang, N.; Liu, X.; Sun, S.; Królczyk, G.; Li, Z.; Li, W. Microscopic characteristics of magnetorheological fluids subjected to magnetic fields. J. Magn. Magn. Mater. 2020, 501, 166443. [Google Scholar] [CrossRef]
  28. Shen, Y.; Hua, D.; Liu, X.; Li, W.; Krolczyk, G.; Li, Z. Visualizing rheological mechanism of magnetorheological fluids. Smart Mater. Struct. 2022, 31, 025027. [Google Scholar] [CrossRef]
  29. Zhang, L.; Gu, S.; Guo, S.; Tamiya, T. A Magnetorheological Fluids-Based Robot-Assisted Catheter/Guidewire Surgery System for Endovascular Catheterization. Micromachines 2021, 12, 640. [Google Scholar] [CrossRef]
Figure 1. Mechanisms of MR fluid operating modes: flow (top), pinch (bottom); Δp—MR valve pressure drop, Q—flow rate, deff—effective diameter of the flow channel, D—diameter of the flow channel, purple arrows show magnetic flux lines.
Actuators 12 00449 g001
Figure 2. Rig layout (left); actual setup (right); (1) floating piston, (2) frame, (3) hydraulic pulsator, (4) electromagnetic coil, (5) pinch gap, (6) magnetic flux lines, (7) position sensor, (8) pressure and (9) temperature sensors, (10) MR fluid, and (11) Hall probe.
Actuators 12 00449 g002
Figure 3. Input excitation wave form (black) position x; (orange) velocity v.
Actuators 12 00449 g003
Figure 4. Layout of the single-stage MR valve (left), prototype cross-section (middle), fabricated parts (right); (1) magnetic circuit, (2) non-magnetic spacer, (3) coil, (4) thru-hole channel, (5) air gap, (6) magnetic flux lines.
Actuators 12 00449 g004
Figure 5. Layout of the three-stage MR valve, incl. fabricated parts (left), prototype cross-section (middle), three-stage assembly (right); (1) magnetic circuit, (2) non-magnetic spacers, (3) magnetic poles, (4) coil, (5) thru-hole channel, (6) air gap, (7) magnetic flux lines.
Actuators 12 00449 g005
Figure 6. Simplified geometry of single-stage assembly (left) and the three-stage valve (right) for FE analyses; (orange) low-carbon steel, (gray) bronze or aluminum, (green) MR fluid, and (white) copper.
Actuators 12 00449 g006
Figure 7. Experimental verification of the FE models.
Actuators 12 00449 g007
Figure 8. Single-stage valve model (left) and zoomed-in magnetic flux density maps (right) at (a) I = 3 A, (b) I = 2 A, and (c) I = 1 A.
Actuators 12 00449 g008
Figure 9. Three-stage valve (left) and zoomed-in magnetic flux density maps (right) at (a) I = 3.4 A, (b) I = 3 A, (c) I = 2 A, and (d) I = 1 A.
Actuators 12 00449 g009
Figure 10. Single-stage pinch-mode valve: (a) pressure drop vs. flow rate; (b) dynamic range at 3 A.
Actuators 12 00449 g010
Figure 11. Three-stage pinch-mode valve: (a) pressure drop vs. flow rate; (b) dynamic range at 3 A.
Actuators 12 00449 g011
Figure 12. Three-stage pinch valve: repeatability of the experiment, I = 3.4 A.
Actuators 12 00449 g012
Figure 13. Valves’ performance comparison.
Actuators 12 00449 g013
Disclaimer/Publisher’s Note: The statements, opinions and data contained in all publications are solely those of the individual author(s) and contributor(s) and not of MDPI and/or the editor(s). MDPI and/or the editor(s) disclaim responsibility for any injury to people or property resulting from any ideas, methods, instructions or products referred to in the content.

