Abstract
A torque measurement method that combines the inverse magnetostrictive effect with twist angle measurement has been proposed in this paper. A Kalman filter and complementary filter are applied to significantly reduce the noises and errors in the proposed method. This new measurement block can detect the applied torque with an error of less than 1%. The proposed measurement method can be used in static and dynamic conditions.
1. Introduction
Sensors transferring physical signals into electrical signals play an important role in modern life [1]. One of them is for measuring torque. Torque measurement is important for all rotating bodies and shafts, such as vehicle transmission, gearbox shafts, rotational cutting devices and electric motors [2]. Measurement of the power transmitted by rotating shafts depends on the torque [3,4]. There are six common types of torque transducers: strain gauges, surface acoustic wave, magnetostrictive, piezoelectric reaction torque sensors, optical and inductive [5].
Torque measurement can be separated into two types: direct and indirect measurement of the torque. Direct methods are based on measuringsome physical values that change with the dynamic torque, and indirect methods are based on measurement of some physical values that can be computed by using the in-situ torque. Torque measurement sensors are classified as tension measurement and twist measurement [6,7,8,9,10,11].
The conventional magnetostrictive torque sensor [12] was mainly composed of an excitation coil, a detection coil, and a C-core transformer element. However, this is not the ideal energy saving method, as the excitation coil and the detection coil will consume energy. Based on the above analysis, removing the excitation coil and detection coil is a good choice for energy saving. Therefore, in this article, a torque measurement without the excitation coil and detection coil was introduced.
A highly precise torque method based on twist measurement has been presented [6]. However, the biggest shortcoming of this method is that it is not appropriate for the measurement of torque when the shaft is at a slow rotation speed or in the static state. This paper is presenting a torque measurement method that combines the inverse magnetostrictive effect with the previous method. The rest of this article is organized as follows. Section 2 presents the materials and methods. Section 3 describes the results and discussion. Section 4 concludes this article.
2. Materials and Methods
2.1. Torque Sensing Material
The sensing material used in the proposed method is Terfenol-D, Fe-Co Alnico, and neodymium magnets. Terfenol-D is an alloy of terbium, dysprosium, and iron [13], which has properties of large magnetostriction coefficient and small saturation magnetic induction. The specification of Terfenol-D is a width of 10mm and a thickness of 1.5 mm. The magnetic and physical properties of Terfenol-D are presented in Table 1. Fe-Co Alnico is an alloy that has the properties of magnets; it is selected as an excitation magnet in the system. Fe-Co Alnico has significant remanence, good excitation effect, and high cost performance. Neodymium magnets, with a size of 2 mm3, were applied here; their material properties are shown in Table 2. A neodymium magnet is one of the strongest types of magnets; it is suitable for the moving magnet torque measurement system based on its properties [14].

Table 1.
Physical and magnetic properties of Terfenol-D.

Table 2.
Material properties of neodymium magnets.
2.2. Structure of the Proposed Sensor
The overall structure of the proposed torque measurement system is presented in Figure 1, which includes a magnetostrictive ring (MR), a C-shaped core of silicon lamination, a Fe-Co Alnico, a Hall chip, and eight permanent magnets (PM).
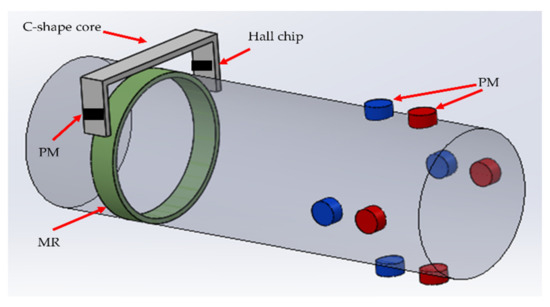
Figure 1.
Overall structure of the presented system diagram of the presented method.
Figure 2 shows the complete magnetic circuit of MR in the left part of the shaft; this magnetic circuit included a C-shaped core made by silicon lamination and MR made by Terfenol-D. The air gap between the C-shaped core and Terfenol-D is 0.2–0.3 mm. One pole of the C-shaped core is a PM embedded in the middle of the pole for excitation, and the other is a linear Hall chip embedded in the middle of the pole for detecting the magnetic flux density in the magnetic circuit.
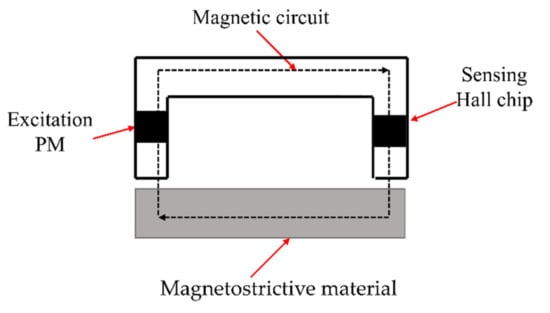
Figure 2.
Schematic diagram of the magnetic circuit.
Figure 3 shows the installation of eight PMs in the right part of the system. To easily install these eight PMs to a pre-assembled shaft, here two semi-circular structures, on which are mounted four PMs each, are adopted as shown in Figure 4.
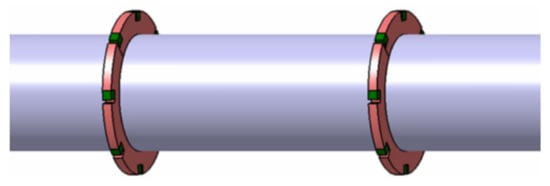
Figure 3.
Schematic diagram of the magnetic sensor bands [6].
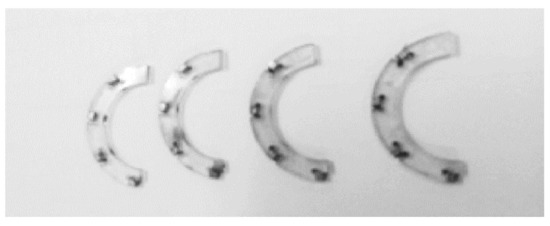
Figure 4.
Picture of magnetic sensor bands [6].
2.3. Working Principle
2.3.1. The Method Based on Twist Measurement
Firstly, the torque measurement method based on the twisting angle is described in this part. The relation of the twisting angle and the external torque is given by:
where is the twisting angle, is the length of the shaft, is the shear modulus, is the radius and is a torsional spring constant. This measurement’s principle is described in Figure 5.
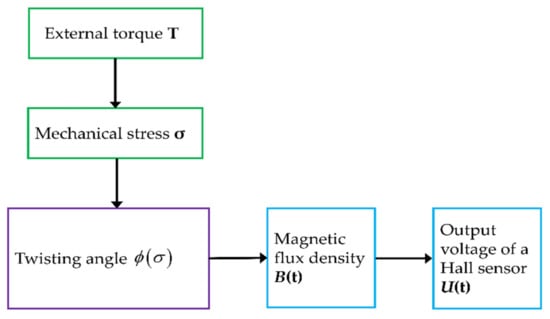
Figure 5.
Schematic diagram of the twisting angle method.
Here, to measure the torsion angle, 4 × 2 permanent magnet bands are attached on the shaft as demonstrated in the upper right of Figure 1. When the shaft turns, the permanently bonded magnets on it will rotate together. The respective Hall effect sensors detect the strongest magnetic field of each magnet that occurs when the magnets are closest to them. Firstly, no extra torque is applied to the shaft and the time of the peak of magnetic field wave form is recorded; secondly, the torque is applied to the shaft and the time of the peak of magnetic field wave form is recorded; thirdly, is subtracted from and multiplied by the rotation speed. Then we can compute the torsion angle by using the mechanics.
Equation (1) can be modified as the following Equation (2) [6]:
where is the mean time intervals between eight identified maximum points of the magnetic field wave signal, n is the number of permanent magnets, C is a constant, is the length of the shaft, is the shear modulus, and is the radius.
2.3.2. The Method Based on the Inverse Magnetostrictive Effect
The inverse magnetostrictive effect method will be introduced in this part.
When torque T is applied to the shaft, the resulting stress can be expressed by two principal stresses ±σ at the ±45° directions on the shaft axis, which are tensile stress +45° along one axis, and compressive stress −45° along the other axis, as demonstrated in Figure 1. The relationship between principal stress and torque is as follows [15]:
where D is the shaft diameter, it is easy to find the linear relationship between torque and stress. When we know the stress produced by the external torque, we can calculate the applied torque. Therefore, the problem converts to find out the stress. It is described in Figure 6.
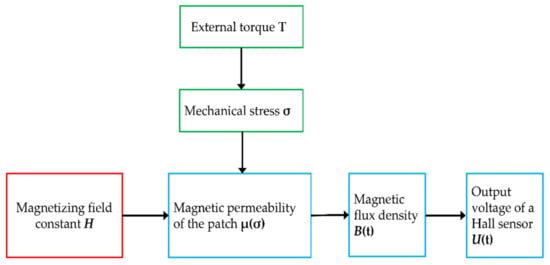
Figure 6.
Schematic diagram of the inverse magnetostrictive effect method.
In this paper, two methods are adopted to constitute a proposed hybrid method: one uses the inverse magnetostrictive effect, and the other usesthe twisting angle.
As a characteristic property of magnetostrictive materials, a mechanical strain is induced when they are subjected to a magnetic field. As well as their magnetization, changes are caused by changes in applied mechanical stress and in the applied magnetic field. This dependency can be described by mathematical functions [16]:
where , , and is the strain, the stress and the applied magnetic field strength, respectively, and is the magnetic flux density.
The inverse magnetostrictive material is ferromagnetic, which has magnetostrictive and inverse magnetostrictive properties shown in Figure 7. The inverse magnetostrictive materials are expected to be magnetized during operation and demagnetized instantaneously in free state. This requires the material to have a soft magnetic property.
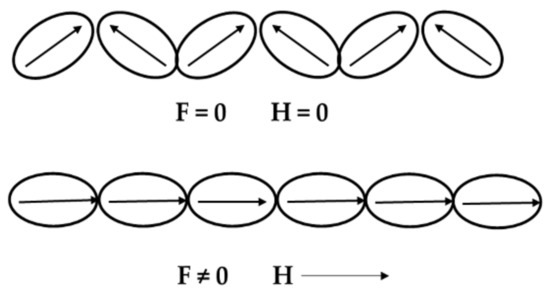
Figure 7.
Force-induced magnetization changed by the rotation of the magnetic domain.
The magnetic circuit of the presented system is composed of a PM, the magnetostrictive material, a soft magnetic conductor and air gaps. It is equal to the circuit with multiple resistors connected in series and a DC power supply [17,18]. The schematic diagram of the equivalent circuit is shown in Figure 8, where R1 and R2 is the air gap reluctance, R3 is the reluctance of the magnetostrictive material, and R4 is the reluctance of the magnetic conductive magnetic circuit. The constant magnetic flux provided by a PM can be regarded as a DC power supply. The length of the PM is and the magnetic field intensity is . The constant magnetic flux is produced by the PM, so is a constant. According to basic electromagnetic theory, we can obtain Equations (6) and (7) as follows:
where is leakage coefficient, is the total magnetic flux, is the total magnetic reluctance, and is magnetomotive force.
where and is the air gap reluctance, is the reluctance of magnetostrictive material, is the reluctance ofmagnetic conductive magnetic circuit, and is the length of the air gap, the PM, and magnetic conductive magnetic circuit.
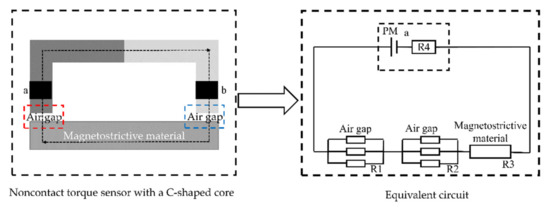
Figure 8.
Equivalent circuit analysis of the magnetic circuit.
As the length Li (i = 1,2,4), the cross-section area Si (i = 1,2,4), and the permeability of air gap μi (i = 1,2,4) are invariants; we can rewrite above Equation (7).
where , , , , and are invariant; only the permeability of magnetostrictive material varies when the applied torque changes, so is an independent variable and is a dependent variable. It has been tested and proven that , so can be ignored here. According to the theory of magnetoelasticity [18], the relation between the relative rate of change of magnetic permeability of ferromagnetic materials and stress is as follows:
In the above Equation (12), is the magnetic permeability of the material, is the saturation magnetic flux density, and is the saturation magnetostriction coefficient. Equation (12) can be rewritten as follows:
where is a constant that denotes the relative change in permeability of the magnetostrictive material caused by unit stress.
According to Equation (13), we can obtain Equation (15) as follows:
Substitute Equation (3) into Equation (15), then we can obtain Equation (17).
The magnetic permeability of the magnetostrictive material will vary when a torque is applied to the shaft, then the magnetic flux will also change with it. Magnetic flux density measured by the Hall sensor, which is linear and highly precise, and its output voltage is linearly proportional to the magnetic flux through the Hall element. Then, the stress can be measured by the output voltage of the Hall sensor. The relationship between the output voltage . and torque T is described as Equation (18); here the parameter is the sensitivity for torque.
3. Results and Discussion
3.1. Modelling and Simulation
Based on discussed method in Section 2.3, modeling and simulation were performed. The modeling and simulation were conducted by using COMSOL Multiphysics. This consists of an aluminum shaft; a ring of Terfenol-D, which is known as its highest strain magnetostrictive material at room temperature and has the highest energy around the shaft; and two magnetic sensor bands mounted on the shaft. Magnetostrictive material properties are shown in Table 3 and Table 4 denotes properties of Aluminium Shaft. A fixed constraint is applied on one end of the shaft while a torque is applied on the other end. The results are shown in Figure 9.

Table 3.
Magnetostrictive Material Properties.

Table 4.
Aluminium Shaft.
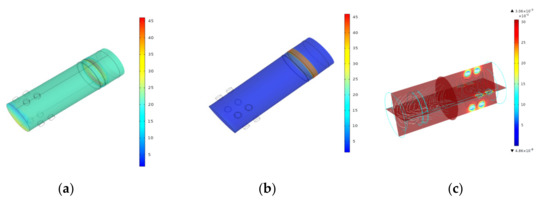
Figure 9.
Shows the stress distribution at full model and magnetostrictive strip, and magnetic flux density distribution around the surface of model. (a) Stress (MPa) at full model, (b) Stress (MPa) at magnetostrictive material, and (c) Surface magnetic flux density (kT).
The resultant stress was obtained based on the difference between stresses at +σ and −σ direction, as shown in Figure 10. Figure 10a shows the torque vs. resultant stress; it was observed that at 100 Nm, the maximum stress was 45 MPa. Figure 8b shows the B-H curve obtained for the Terfenol-D, a magnetostrictive material. Based on these characteristics, the relation of output voltage and torque is the Equation (19). The characteristics of output voltage for the torque are shown in Figure 11.
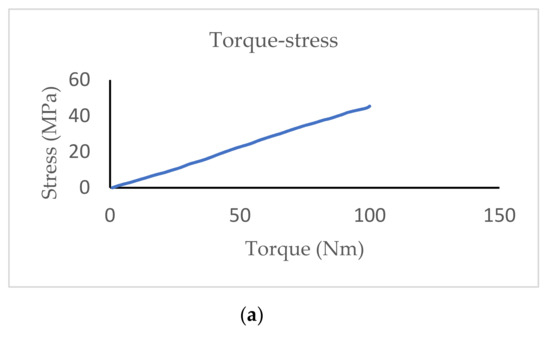
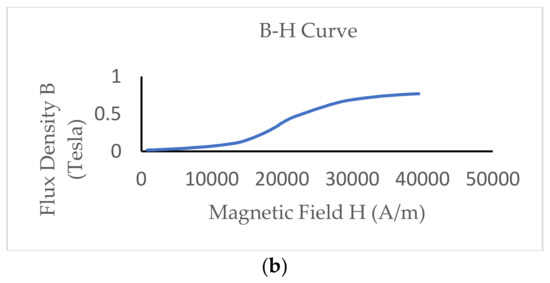
Figure 10.
The characteristics of the Terfenol-D. (a) Torque vs. stress at Terfenol-D; (b) B-H curve for Terfenol-D.
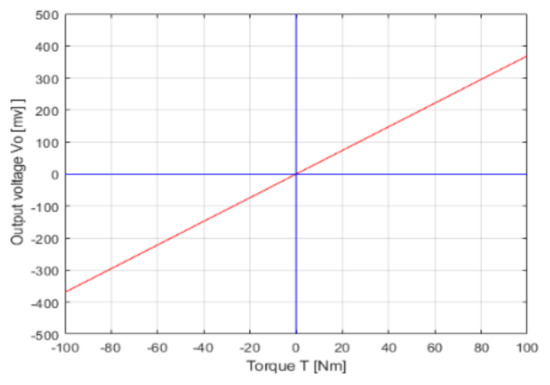
Figure 11.
Characteristics of output voltage for the torque.
According to the research [6], the relation of the twisting angle and torque is as follows:
where L is 0.065 m, R is 0.0125 m, and G is 78 GPa. The constant value (rad/Nm) from Equation (20) is 99.9%, close to the experimental result which is shown in Figure 12. The theoretical value is closely matched with the experiment results in the literature [3].
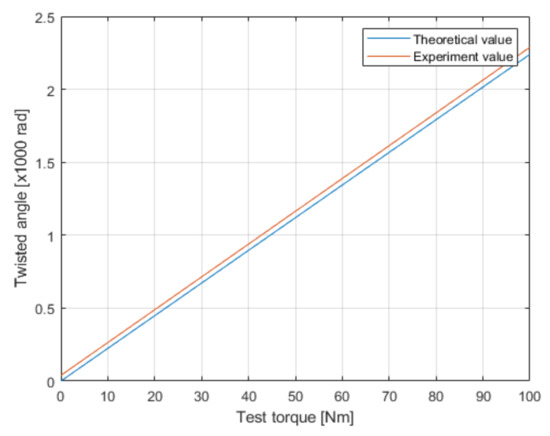
Figure 12.
Twist angle versus the applied torque for a rotational speed of 400 rpm.
3.2. Data Processing
Based on above discussed materials and methods, data processing results are covered in this section. There are three main limitations to this investigation [19]:
- no perfect mathematic model;
- the disturbances in the system are uncontrollable and difficult to model;
- errors exist in the measurement sensor.
Some noises exist in the results based on the inverse magnetostrictive effect method and twisting angle method. To remove these noises, a one-dimensional Kalman filter [20,21] is introduced to smooth noisy data. The diagram for the torque measurement system is shown in Figure 13. The mathematic model for torque has been built with Equations (19) and (20).
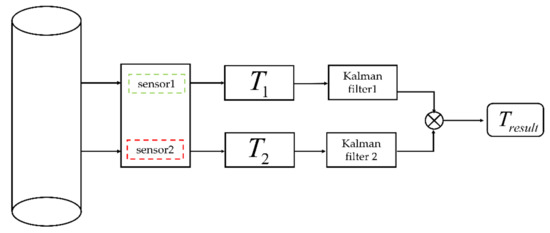
Figure 13.
Data fusion for the torque sensors.
In Figure 13, denotes the torque of magnetostrictive type sensor (MTs), denotes the torque of magnets type sensor (MS), and denotes the final torque result.
Assuming the applied torque is , the process noise and the measurement noise are independent of each other, and with normal probability distributions which can be expressed by Equations (21) and (22):
The state equation and observation equation is composed as follow:
where X(k) is the torque at the moment k and is one-dimensional variable, the coefficient A is a system matrix, and H is an observation matrix. Since it is a one-dimensional system, here A and H both are 1. Based on the X(k−1) and its covariance matrix P(k−1) at time k−1, at time k the optimal estimate values is as follows:
Equations (24) and (25) are also referred to as the prediction equations. It can be calculated the value of X at the time k:
where,
is Kalman gain, which is the most important parameter of the filter. It determines how easily the filter will adjust to any possible new condition. The covariance matrix of the unknown state X is as follows:
Equations (26)–(28) are known as updating equations. The initial values and must be determined before the operating of the filter, however they do not severely influence the results of the algorithm, as and will quickly converge to their real values. However, covariant matrices and crucially affect the final outcome; they determine Kalman gain, therefore the filter is fit as fast as possible in new conditions.
The initial value can be assumed to be approximately 100, and the initial variance must have a considerably large value, which demonstrates that we do not confide in our first guess [20]. Assuming for the magnetostrictive type sensor, the covariance matrices is 0.01, in other words Q is 0.01, the covariance matrices is 0.04, that is, R is 0.04, which means measurement error is 0.2. For the magnets type sensor, the covariance matrices is 0.01, namely Q is 0.01, the covariance matrices is 0.25, this means that R is 0.25, which means the measurement error is 0.5. In Table 5 we present the parameters of Kalman filters.

Table 5.
Parameters of Kalman filter.
With the previous assumptions our Kalman filter algorithm has the following form:
System equation:
Observation equation:
Prediction equations:
Updating equations:
Based on the Equations (30)–(36) described above, we obtain the results through the MATLAB software. The results of magnetostrictive type sensor (MTs) for the torque measurement value and measurement errors are displayed in Figure 14, and the results of moving magnets type sensor (MS) for the torque measurement value and measurement errors are shown in Figure 15. In Figure 14a and Figure 15a, the blue line denotes the expected torque value, the red line shows the true value, the black line indicates the observe value, and the green line exhibits the value of the Kalman filter. It can be seen that Kalman filters significantly reduce the corresponding bias, and although a Kalman filter does not eliminate the errors completely, its output is as close to the real value as possible. From Figure 14 and Figure 15, the proposed filter results are very close to the expected value of 100, which is supplementary proof of the accuracy of the presented method.
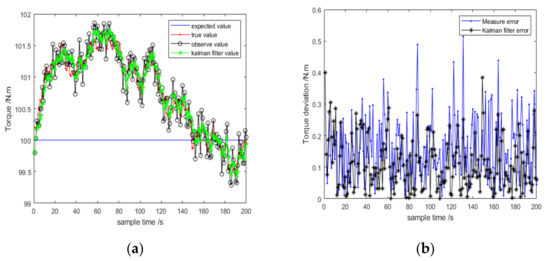
Figure 14.
The results of MTs. (a)Torque measurement estimation; (b) Analysis of torque measurement error.
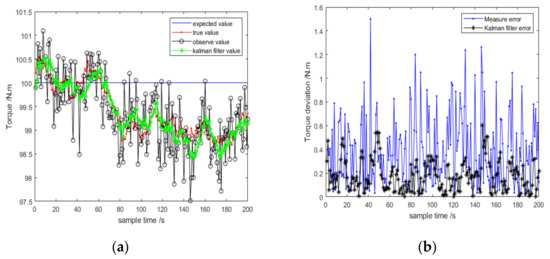
Figure 15.
The results of MS.(a) Torque measurement estimation; (b) Analysis of torque measurement error.
By contrast, the performance of filter 1 is better than filter 2. The maximum measurement error of filter 1 is 0.53 Nm, and the maximum measurement error of filter 2 is 1.51 Nm.
The complementary filter outperforms the Kalman filter significantly by utilizing less computational and processing power and offering better accuracy [22]. Therefore, we applied the complementary filter to optimize the result. [23,24]
where coefficient is 0.5.
In the Figure 16a, the blue line is a reference line which means the expected value, the red line denotes the outputs of the Kalman filter of MTs, the black line denotes the output of the Kalman filter of moving MS, and the green line denotes the outputs of the complementary filter, which significantly optimized the final torque value; the results of these two sensors are compared with the result of the presented method which is green line. From Figure 16a, we know that the biases of the green line are smaller than other two methods. That is to say, the accuracy of the presented method is better than others. Figure 16b shows the corresponding errors that were lower than those without the complementary filter.
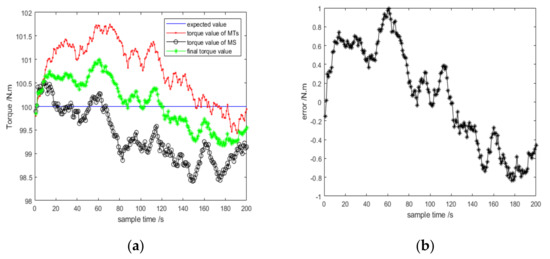
Figure 16.
The final torque results of the complementary filter. (a) The comparison of measurement torque of different mehod; (b) The measurement errors of final torque.
4. Conclusions
In this study, a comprehensive torque measuring method that uses a magnetostrictive ring and eight magnets has been demonstrated to prove precision and reliability. For better energy efficiency, the excitation coil and the detection coil are both removed from the system. To overcome the shortcoming of the magnetic sensor under the stopped condition, a magnetostrictive sensor was introduced. Torque is measured by detecting the magnetic flux density and peaks of magnetic field strength waves. The results showed that the effective combination of Kalman filter and complementary filter could eliminate certain noises, reduce the measurement error and raise the measurement accuracy. These results depicted an overall error of less than 1% after processing calibration. This research provides understanding for future work concerningtorque measurement.
Author Contributions
Conceptualization, F.X. and C.C.; methodology, F.X. and C.C.; software, F.X. and V.K.D.; validation, F.X., and C.C.; formal analysis, F.X. and V.K.D.; investigation, C.C.; resources, C.C.; data curation, F.X.; writing—original draft preparation, F.X.; writing—review and editing, F.X., C.C., and V.K.D.; visualization, F.X., C.C. and V.K.D.; supervision, C.C.; and project administration, C.C. All authors have read and agreed to the published version of the manuscript.
Funding
This research received no external funding.
Institutional Review Board Statement
This work did not involve humans or animals.
Informed Consent Statement
This work did not involve humans or animals.
Data Availability Statement
We choose to exclude this statement.
Conflicts of Interest
The authors declare no conflict of interest.
References
- Vetelino, J.; Reghu, A. Introduction to Sensors; CRC press: Boca Raton, FL, USA, 2017. [Google Scholar]
- Tan, Y.; Wang, X.; Ren, L. Design and experiment of a cardan-type self-decoupled and self-powered bending moment and torque sensor. IEEE Trans. Ind. Electron. 2020. [Google Scholar] [CrossRef]
- Morris, A.S.; Langari, R. Measurement and Instrumentation: Theory and Application; Academic Press: New York, NY, USA, 2012. [Google Scholar]
- Fleming, W.J. Overview of automotive sensors. IEEE Sens. J. 2001, 1, 296–308. [Google Scholar] [CrossRef]
- Goszczak, J. Torque measurement issues. In Proceedings of the IOP Conference Series: Materials Science and Engineering, Bali, Indonesia, 19–20 March 2016; p. 012041. [Google Scholar]
- Lee, K.; Cho, C. Study of noncontact torque measurement method with magnetic sensor band. J. Mech. Sci. Technol. 2015, 29, 3897–3903. [Google Scholar] [CrossRef]
- Zappalá, D.; Bezziccheri, M.; Crabtree, C.J.; Paone, N. Non-intrusive torque measurement for rotating shafts using optical sensing of zebra-tapes. Meas. Sci. Technol. 2018, 29. [Google Scholar] [CrossRef]
- Muro, H.; Saito, C.; Shimada, M.; Furuya, Y. Magnetostrictive-ring type torque sensor using two Hall ICs with differential magnetic field detection. In Proceedings of the SENSORS, 2014 IEEE, Valencia, Spain, 2–5 November 2014; pp. 412–415. [Google Scholar]
- Garshelis, I.J. A torque transducer utilizing a circularly polarized ring. IEEE Trans. Magn. 1992, 28, 2202–2204. [Google Scholar] [CrossRef]
- Tsujisawa, T.; Yamakawa, K. Improvement of the angular-dependent noise in a magneto-striction type torque sensor. Int. J. Automot. Eng. 2011, 2, 75–80. [Google Scholar] [CrossRef][Green Version]
- Ruser, H.; Troltzsch, U.; Horn, M. Low-cost magnetic torque sensor principle. In Proceedings of the SENSORS, 2002 IEEE, Orlando, FL, USA, 12–14 June 2002; pp. 901–904. [Google Scholar]
- Fleming, W.J. Magnetostrictive torque sensors—Derivation of transducer model. SAE Trans. 1989, 98, 519–538. [Google Scholar]
- Moffett, M.B.; Clark, A.E.; Wun-Fogle, M.; Linberg, J.; Teter, J.P.; McLaughlin, E.A. Characterization of Terfenol-D for magnetostrictive transducers. J. Acoust. Soc. Am. 1991, 89, 1448–1455. [Google Scholar] [CrossRef]
- Fraden, J. Handbook of Modern Sensors: Physics, Designs, and Applications; Springer: Berlin/Heidelberg, Germany, 1998. [Google Scholar]
- Skarpetis, M.G.; Tsiantos, V.; Karagiannis, V.; Ktena, A.; Manasis, C.; Ladoukakis, O.; Elias, C.; Hristoforou, E.; Vourna, P. Modelling of a Magnetostrictive Torque Sensor. MATEC Web Conf. 2016, 41. [Google Scholar] [CrossRef]
- Apicella, V.; Clemente, C.S.; Davino, D.; Leone, D.; Visone, C. Review of modeling and control of magnetostrictive actuators. Actuators 2019, 8, 45. [Google Scholar] [CrossRef]
- Wu, G.; Zhang, Y.; Liu, K.; Cheng, M.; Xiao, K. Design Method of Magnetic Circuit for Permanent Electromagnetic Bearing. CNKI J. 2004. [Google Scholar] [CrossRef]
- Wang, S.L.; Wang, W.; Su, S.Q.; Zhang, S.F. A magneto-mechanical model on differential permeability and stress of ferromagnetic material. J. Xi’an Univ. Sci. Technol. 2005. [Google Scholar] [CrossRef]
- Oberkampf, W.L.; Helton, J.C.; Joslyn, C.A.; Wojtkiewicz, S.F.; Ferson, S. Challenge problems: Uncertainty in system response given uncertain parameters. Reliab. Eng. Syst. Saf. 2004, 85, 11–19. [Google Scholar] [CrossRef]
- Galanis, G.; Anadranistakis, M. A one-dimensional Kalman filter for the correction of near surface temperature forecasts. Meteorol. Appl. A J. Forecast. Pract. Appl. Train. Tech. Model. 2002, 9, 437–441. [Google Scholar] [CrossRef]
- Bishop, G.; Welch, G. An introduction to the kalman filter. In Proceedings of the SIGGRAPH, Los Angeles, CA, USA, 12–17 August 2001; Volume 8, p. 41. [Google Scholar]
- Dobre, C.; Xhafa, F. Pervasive Computing: Next Generation Platforms for Intelligent Data Collection; Morgan Kaufmann: San Francisco, CA, USA, 2016. [Google Scholar]
- Higgins, W.T. A Comparison of Complementary and Kalman Filtering. IEEE Trans. Aerosp. Electron. Syst. 1975, AES-11, 321–325. [Google Scholar] [CrossRef]
- Islam, T.; Islam, M.S.; Shajid-Ul-Mahmud, M.; Hossam-E-Haider, M. Comparison of complementary and Kalman filter based data fusion for attitude heading reference system. In AIP Conference Proceedings; AIP Publishing LLC.: Melville, NY, USA, 2017; p. 020002. [Google Scholar]
Publisher’s Note: MDPI stays neutral with regard to jurisdictional claims in published maps and institutional affiliations. |
© 2021 by the authors. Licensee MDPI, Basel, Switzerland. This article is an open access article distributed under the terms and conditions of the Creative Commons Attribution (CC BY) license (https://creativecommons.org/licenses/by/4.0/).