Electrocardiography Abnormalities in Macaques after Infection with Encephalitic Alphaviruses
Abstract
1. Introduction
2. Results
2.1. ECG Changes in EEEV-Infection of Macaques
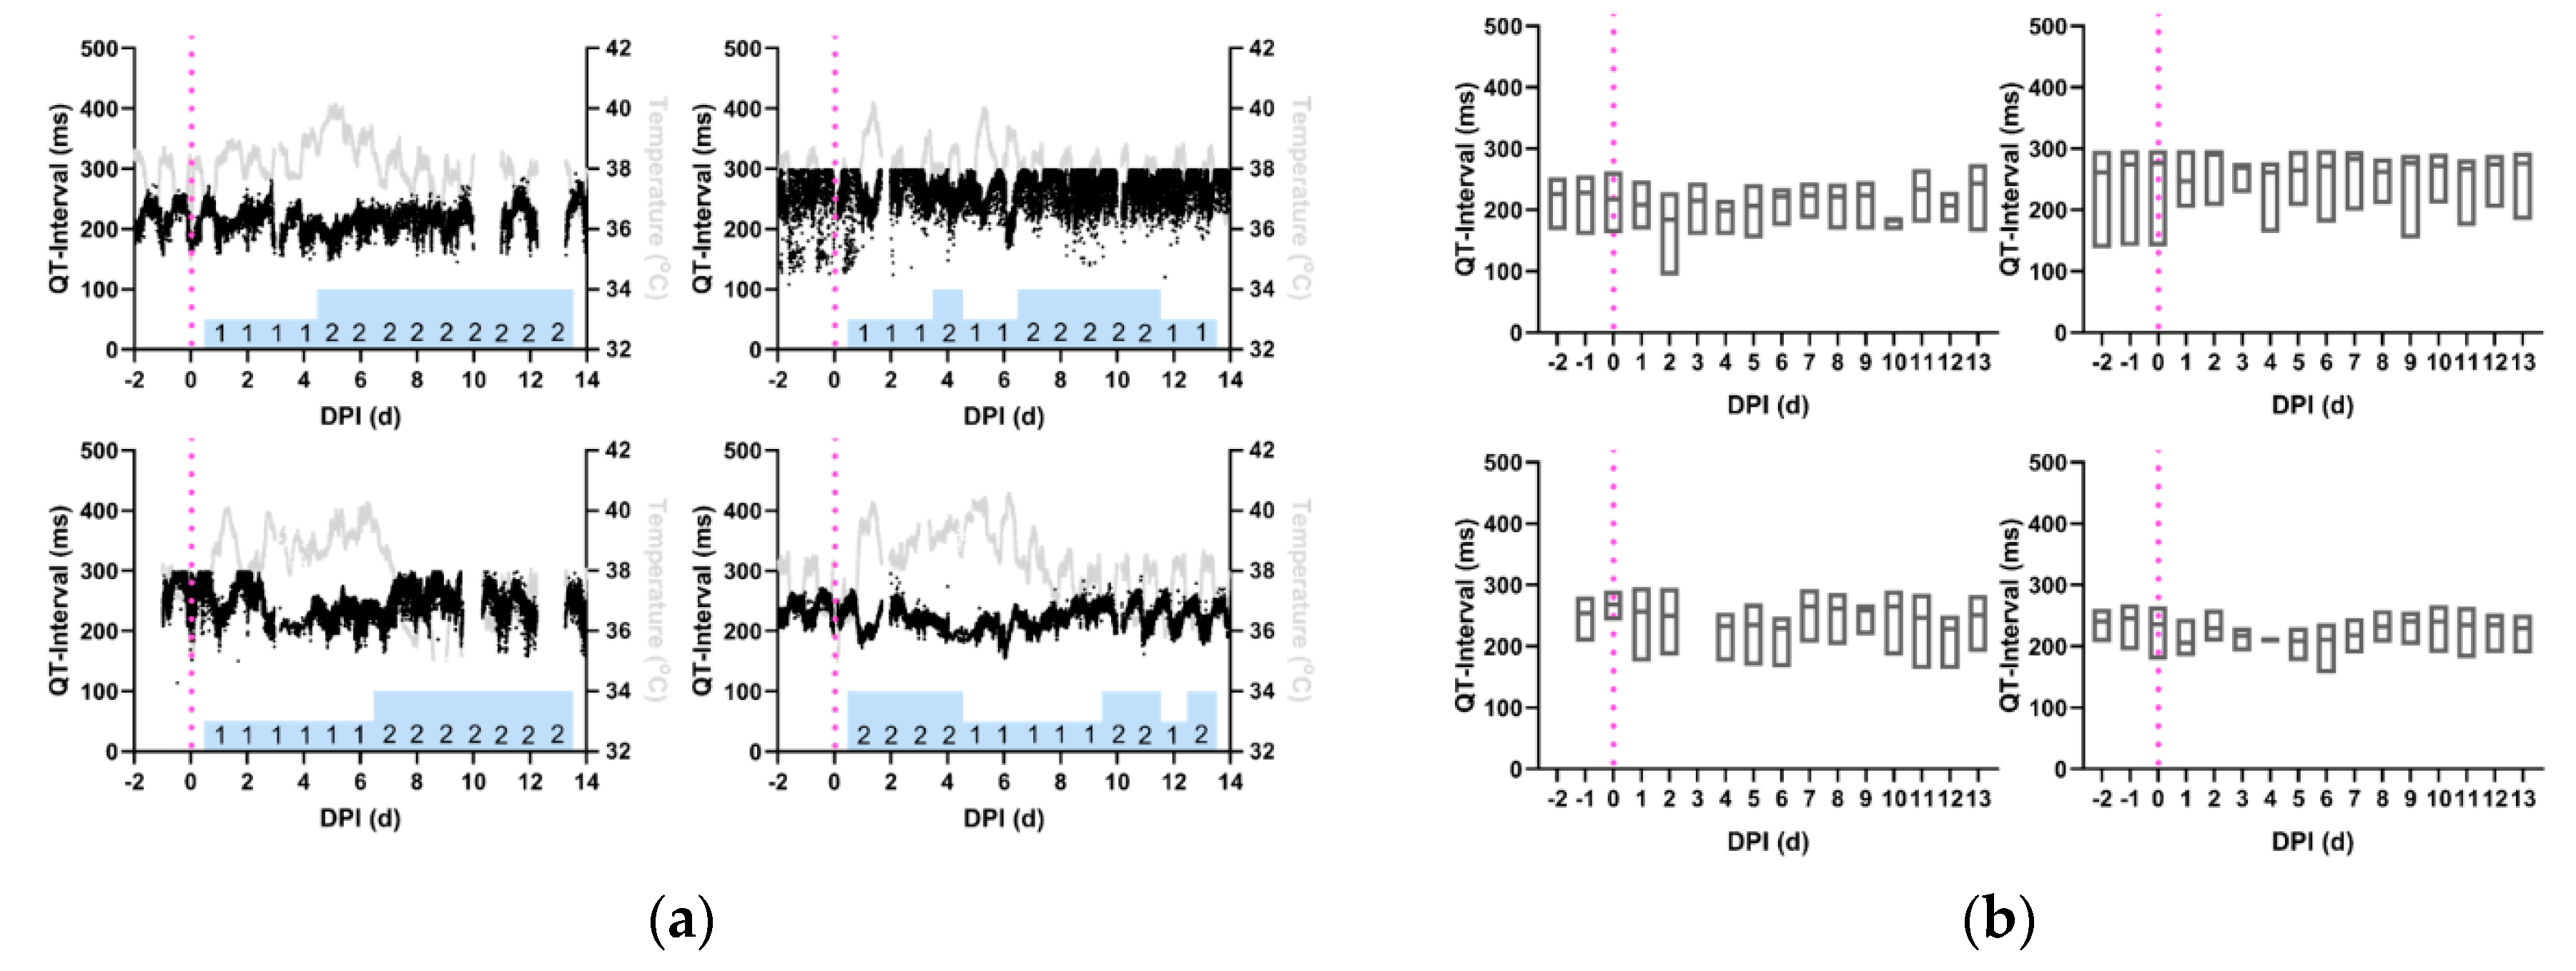
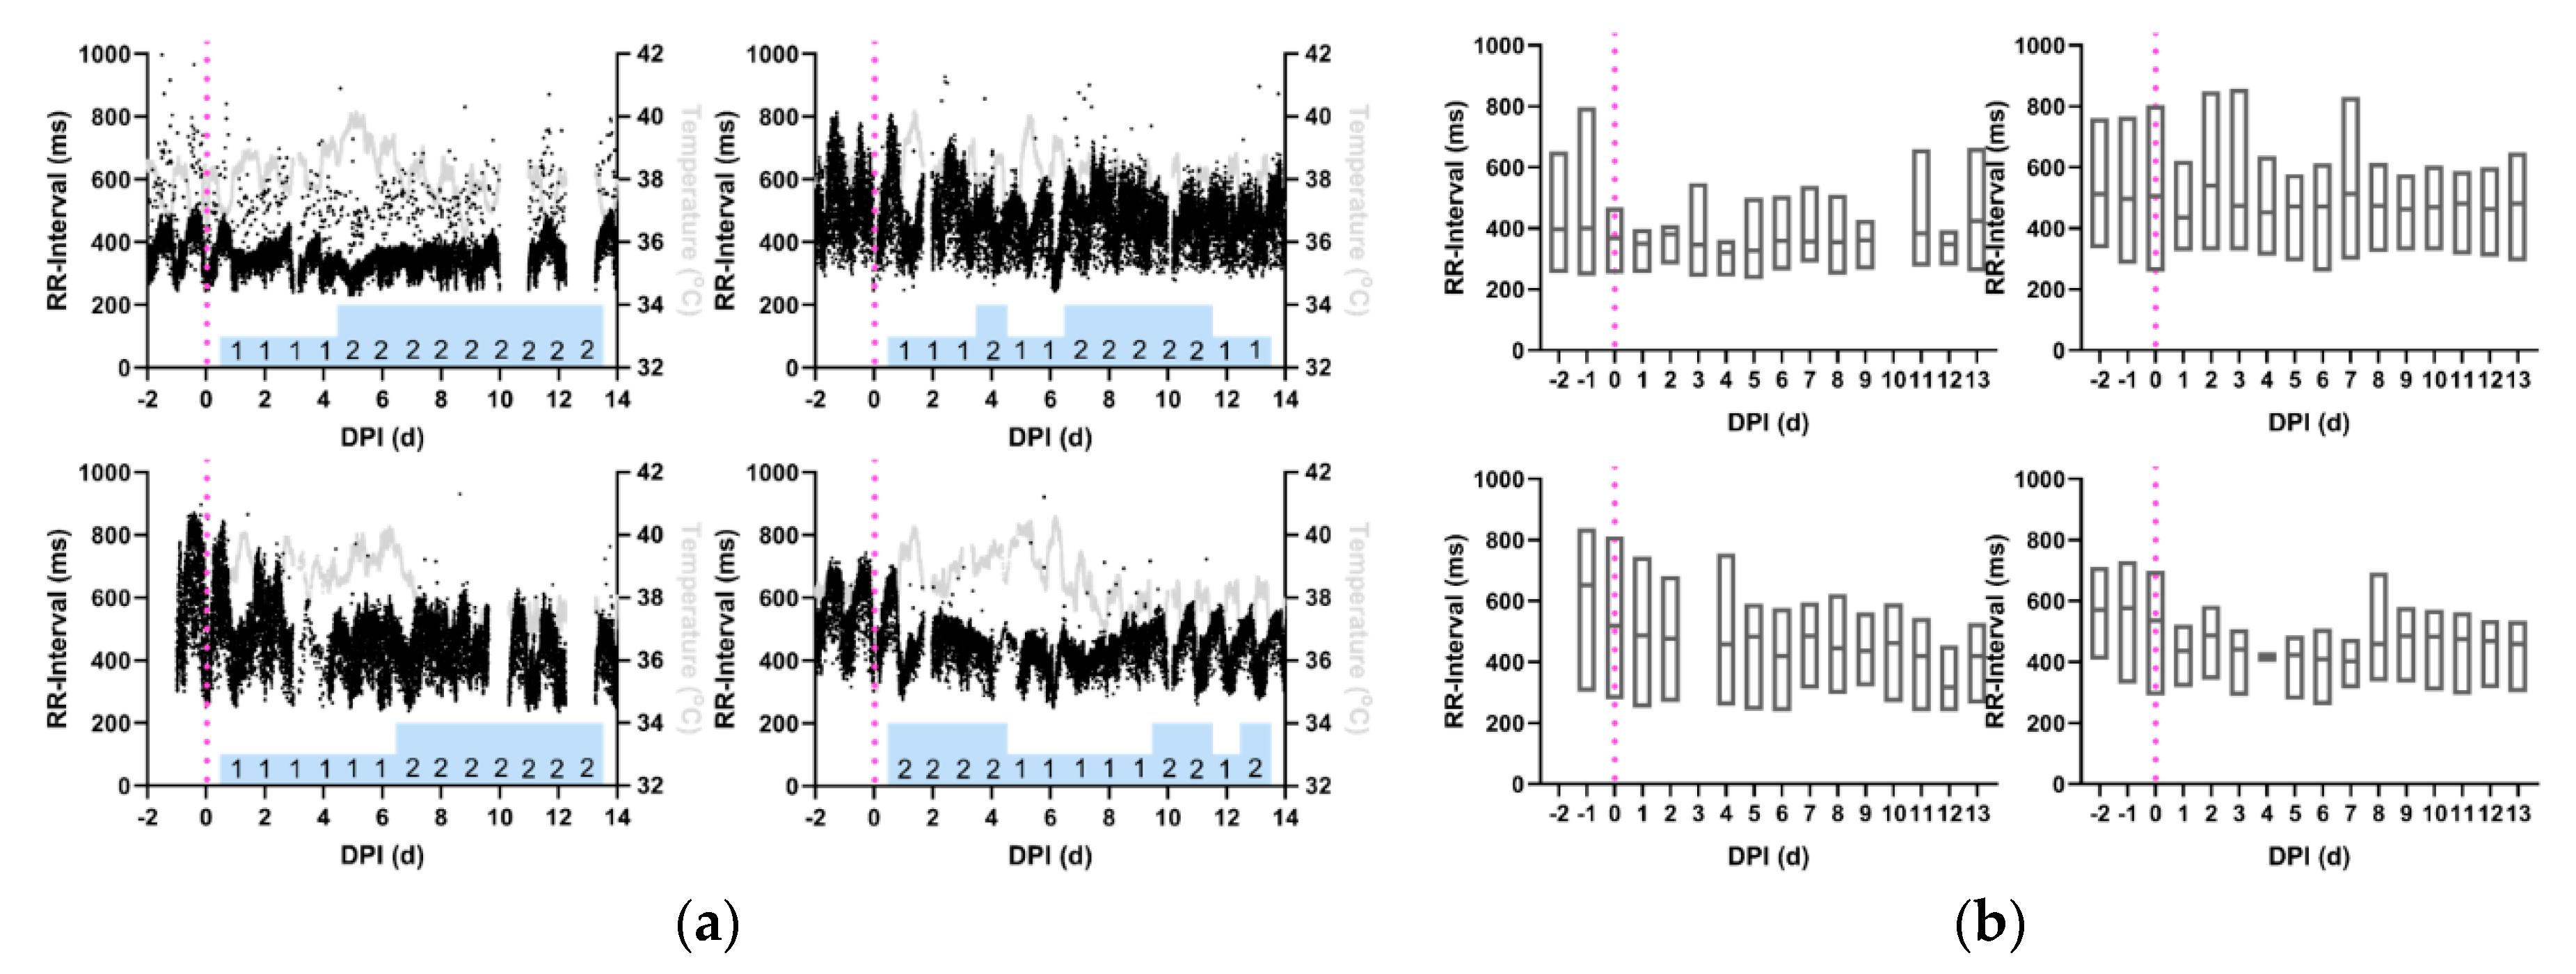
2.2. ECG Changes in VEEV-Infection of Macaques
2.3. Frequency Spectrum Analysis
3. Discussion
3.1. QRS Complexes
3.2. QT-Intervals
3.3. RR-Interval, Heart Rate Variability, and Frequency Spectrum Analysis
3.4. Limitations and Future Work
4. Materials and Methods
4.1. Statement on Rationale, Use, and Care of Animals
4.2. Animal Model Telemetry Implantation
4.3. Virus Culture and Dose Determination
4.4. Aerosol Exposure of Macaques to EEVs
4.5. Electrocardiography Data Collection
4.6. Electrocardiography Analysis Methods
5. Conclusions
Supplementary Materials
Author Contributions
Funding
Acknowledgments
Conflicts of Interest
References
- Bennett, J.E.; Dolin, R.; Blaser, M.J. Mandell, Douglas, and Bennett’s Principles and Practice of Infectious Diseases; Elsevier Health Sciences: Philadelphia, PA, USA, 2014. [Google Scholar]
- Lwande, O.W.; Obanda, V.; Bucht, G.; Mosomtai, G.; Otieno, V.; Ahlm, C.; Evander, M. Global emergence of Alphaviruses that cause arthritis in humans. Infect. Ecol. Epidemiol. 2015, 5, 29853. [Google Scholar] [CrossRef] [PubMed]
- Weaver, S.C.; Winegar, R.; Manger, I.D.; Forrester, N.L. Alphaviruses: Population genetics and determinants of emergence. Antivir. Res. 2012, 94, 242–257. [Google Scholar] [CrossRef] [PubMed]
- Greenlee, J.E. The equine encephalitides. Handb. Clin. Neurol. 2014, 123, 417–432. [Google Scholar] [CrossRef] [PubMed]
- Broeck, G.T.; Merrill, M.H. A serological difference between eastern and western equine encephalomyelitis virus. Proc. Soc. Exp. Biol. Med. 1933, 31, 217–220. [Google Scholar] [CrossRef]
- Beck, C.E.; Wyckoff, R.W.G. Venezuelan Equine Encephalomyelitis. Science 1938, 88, 530. [Google Scholar] [CrossRef]
- Howitt, B.F. Viruses of Equine and of St. Louis Encephalitis in Relationship to Human Infections in California, 1937–1938. Am. J. Public Health Nations Health 1939, 29, 1083–1097. [Google Scholar] [CrossRef]
- Findlay, G. Variation in viruses. In Handbuch der Virusforschung; Springer: Berlin, Germany, 1938; pp. 861–994. [Google Scholar]
- Hart, B.L.; Ketai, L. Armies of pestilence: CNS infections as potential weapons of mass destruction. AJNR Am. J. Neuroradiol. 2015, 36, 1018–1025. [Google Scholar] [CrossRef]
- Sidwell, R.W.; Smee, D.F. Viruses of the Bunya- and Togaviridae families: Potential as bioterrorism agents and means of control. Antivir. Res. 2003, 57, 101–111. [Google Scholar] [CrossRef]
- Schmaljohn, A.L.; McClain, D. Alphaviruses (Togaviridae) and Flaviviruses (Flaviviridae). In Medical Microbiology, 4th ed.; Baron, S., Ed.; University of Texas Medical Branch at Galveston: Galveston, TX, USA, 1996. [Google Scholar]
- Kennedy, P.G. Viral encephalitis: Causes, differential diagnosis, and management. J. Neurol. Neurosurg. Psychiatry 2004, 75 (Suppl. S1), i10–i15. [Google Scholar] [CrossRef]
- Deresiewicz, R.L.; Thaler, S.J.; Hsu, L.; Zamani, A.A. Clinical and neuroradiographic manifestations of eastern equine encephalitis. N. Engl. J. Med. 1997, 336, 1867–1874. [Google Scholar] [CrossRef]
- Zacks, M.A.; Paessler, S. Encephalitic alphaviruses. Vet. Microbiol. 2010, 140, 281–286. [Google Scholar] [CrossRef] [PubMed]
- Delfraro, A.; Burgueno, A.; Morel, N.; Gonzalez, G.; Garcia, A.; Morelli, J.; Perez, W.; Chiparelli, H.; Arbiza, J. Fatal human case of Western equine encephalitis, Uruguay. Emerg. Infect. Dis. 2011, 17, 952–954. [Google Scholar] [CrossRef] [PubMed]
- Gardner, C.L.; Ebel, G.D.; Ryman, K.D.; Klimstra, W.B. Heparan sulfate binding by natural eastern equine encephalitis viruses promotes neurovirulence. Proc. Natl. Acad. Sci. USA 2011, 108, 16026–16031. [Google Scholar] [CrossRef]
- Pisano, M.B.; Oria, G.; Beskow, G.; Aguilar, J.; Konigheim, B.; Cacace, M.L.; Aguirre, L.; Stein, M.; Contigiani, M.S. Venezuelan equine encephalitis viruses (VEEV) in Argentina: Serological evidence of human infection. PLoS Negl. Trop. Dis. 2013, 7, e2551. [Google Scholar] [CrossRef] [PubMed]
- Arechiga-Ceballos, N.; Aguilar-Setien, A. Alphaviral equine encephalomyelitis (Eastern, Western and Venezuelan). Rev. Sci. Tech. 2015, 34, 491–501. [Google Scholar] [CrossRef] [PubMed]
- Martin, D.H.; Eddy, G.A.; Sudia, W.D.; Reeves, W.C.; Newhouse, V.F.; Johnson, K.M. An epidemiologic study of Venezuelan equine encephalomyelitis in Costa Rica, 1970. Am. J. Epidemiol. 1972, 95, 565–578. [Google Scholar] [CrossRef] [PubMed]
- Rivas, F.; Diaz, L.A.; Cardenas, V.M.; Daza, E.; Bruzon, L.; Alcala, A.; De la Hoz, O.; Caceres, F.M.; Aristizabal, G.; Martinez, J.W.; et al. Epidemic Venezuelan equine encephalitis in La Guajira, Colombia, 1995. J. Infect. Dis. 1997, 175, 828–832. [Google Scholar] [CrossRef]
- Reeves, W.C. A review of developments associated with the control of Western Equine and St. Louis encephalitis in California during 1967. Proc. Pap. Annu. Conf. Calif. Mosq. Control Assoc. 1968, 36, 65–70. [Google Scholar]
- MacKay, J.F.; Stackiw, W.; Brust, R.A. Western encephalitis (W.E.) in Manitoba-1966. Manit. Med. Rev. 1968, 48, 56–57. [Google Scholar]
- Rozdilsky, B.; Robertson, H.E.; Chorney, J. Western encephalitis: Report of eight fatal cases. Saskatchewan epidemic, 1965. Can. Med. Assoc. J. 1968, 98, 79–86. [Google Scholar]
- Forrester, N.L.; Kenney, J.L.; Deardorff, E.; Wang, E.; Weaver, S.C. Western Equine Encephalitis submergence: Lack of evidence for a decline in virus virulence. Virology 2008, 380, 170–172. [Google Scholar] [CrossRef] [PubMed]
- Przelomski, M.M.; O’Rourke, E.; Grady, G.F.; Berardi, V.P.; Markley, H.G. Eastern equine encephalitis in Massachusetts: A report of 16 cases, 1970–1984. Neurology 1988, 38, 736–739. [Google Scholar] [CrossRef] [PubMed]
- Whitley, R.J. Viral encephalitis. N. Engl. J. Med. 1990, 323, 242–250. [Google Scholar] [CrossRef] [PubMed]
- Wang, E.; Paessler, S.; Aguilar, P.V.; Carrara, A.S.; Ni, H.; Greene, I.P.; Weaver, S.C. Reverse Transcription-PCR-Enzyme-Linked Immunosorbent Assay for Rapid Detection and Differentiation of Alphavirus Infections. J. Clin. Microbiol. 2006, 44, 4000–4008. [Google Scholar] [CrossRef]
- Gang Hu, W.; Nagata, L.P. Opportunities and Challenges of Therapeutic Monoclonal Antibodies as Medical Countermeasures for Biodefense. J. Bioterror. Biodef. 2016, 7. [Google Scholar] [CrossRef]
- Burns, D.L. Licensure of vaccines using the Animal Rule. Curr. Opin. Virol. 2012, 2, 353–356. [Google Scholar] [CrossRef]
- Dupuy, L.C.; Reed, D.S. Nonhuman primate models of encephalitic alphavirus infection: Historical review and future perspectives. Curr. Opin. Virol. 2012, 2, 363–367. [Google Scholar] [CrossRef]
- Pratt, W.D.; Fine, D.L.; Hart, M.K.; Martin, S.S.; Reed, D.S. Alphaviruses. In Biodefense Research Methodology and Animal Models, 2nd ed.; Swearengen, J.R., Ed.; CRC Press: New York, NY, USA, 2012; pp. 223–254. [Google Scholar]
- Phillips, A.T.; Rico, A.B.; Stauft, C.B.; Hammond, S.L.; Aboellail, T.A.; Tjalkens, R.B.; Olson, K.E. Entry Sites of Venezuelan and Western Equine Encephalitis Viruses in the Mouse Central Nervous System following Peripheral Infection. J. Virol. 2016, 90, 5785–5796. [Google Scholar] [CrossRef]
- Suhrbier, A.; Jaffar-Bandjee, M.C.; Gasque, P. Arthritogenic alphaviruses—An overview. Nat. Rev. Rheumatol. 2012, 8, 420–429. [Google Scholar] [CrossRef]
- Sali, T.M.; Pryke, K.M.; Abraham, J.; Liu, A.; Archer, I.; Broeckel, R.; Staverosky, J.A.; Smith, J.L.; Al-Shammari, A.; Amsler, L.; et al. Characterization of a Novel Human-Specific STING Agonist that Elicits Antiviral Activity Against Emerging Alphaviruses. PLoS Pathog. 2015, 11, e1005324. [Google Scholar] [CrossRef]
- Reed, D.S.; Lind, C.M.; Sullivan, L.J.; Pratt, W.D.; Parker, M.D. Aerosol Infection of Cynomolgus Macaques with Enzootic Strains of Venezuelan Equine Encephalitis Viruses. J. Infect. Dis. 2004, 189, 1013–1017. [Google Scholar] [CrossRef] [PubMed]
- Norris, S.; Gamble, C.; Reed, D.S.; Lackemeyer, M.G.; Garza, N.L.; Sullivan, L.J.; Lind, C.M.; Raymond, J.L. Severe Encephalitis in Cynomolgus Macaques Exposed to Aerosolized Eastern Equine Encephalitis Virus. J. Infect. Dis. 2007, 196, 441–450. [Google Scholar] [CrossRef]
- Kearney, M.T.; Cotton, J.M.; Richardson, P.J.; Shah, A.M. Viral myocarditis and dilated cardiomyopathy: Mechanisms, manifestations, and management. Postgrad. Med. J. 2001, 77, 4–10. [Google Scholar] [CrossRef] [PubMed]
- Momiyama, Y.; Mitamura, H.; Kimura, M. ECG characteristics of dilated cardiomyopathy. J. Electrocardiol. 1994, 27, 323–328. [Google Scholar] [CrossRef]
- Miyamoto, S.; Ito, T.; Terada, S.; Eguchi, T.; Furubeppu, H.; Kawamura, H.; Yasuda, T.; Kakihana, Y. Fulminant myocarditis associated with severe fever with thrombocytopenia syndrome: A case report. BMC Infect. Dis. 2019, 19, 266. [Google Scholar] [CrossRef]
- Villa, A.; Foresti, V.; Confalonieri, F. Autonomic neuropathy and prolongation of QT interval in human immunodeficiency virus infection. Clin. Auton. Res. 1995, 5, 48–52. [Google Scholar] [CrossRef]
- Schuster, I.; Thöni, G.J.; Edérhy, S.; Walther, G.; Nottin, S.; Vinet, A.; Boccara, F.; Khireddine, M.; Girard, P.-M.; Mauboussin, J.-M.; et al. Subclinical cardiac abnormalities in human immunodeficiency virus–infected men receiving antiretroviral therapy. Am. J. Cardiol. 2008, 101, 1213–1217. [Google Scholar] [CrossRef]
- Gopinath, R.; Ayya, S.S. Neurogenic stress cardiomyopathy: What do we need to know. Ann. Card. Anaesth. 2018, 21, 228–234. [Google Scholar] [CrossRef]
- Groom, Z.C.; Protopapas, A.D.; Zochios, V. Tropical diseases of the myocardium: A review. Int. J. Gen. Med. 2017, 10, 101–111. [Google Scholar] [CrossRef]
- Gottdenker, N.L.; Howerth, E.W.; Mead, D.G. Natural infection of a great egret (Casmerodius albus) with eastern equine encephalitis virus. J. Wildl. Dis. 2003, 39, 702–706. [Google Scholar] [CrossRef]
- Monath, T.P.; Kemp, G.E.; Cropp, C.B.; Chandler, F.W. Necrotizing myocarditis in mice infected with Western equine encephalitis virus: Clinical, electrocardiographic, and histopathologic correlations. J. Infect. Dis. 1978, 138, 59–66. [Google Scholar] [CrossRef] [PubMed]
- Gleiser, C.A.; Gochenour, W.S., Jr.; Berge, T.O.; Tigertt, W.D. The comparative pathology of experimental Venezuelan equine encephalomyelitis infection in different animal hosts. J. Infect. Dis. 1962, 110, 80–97. [Google Scholar] [CrossRef] [PubMed]
- Chreiteh, S.S.; Fisker, K.B. Morphological Changes of the QRS Complex as a Marker of Autonomic Modulation of the Heart Rate; Aalborg University: Aalborg, Denmark, 2009. [Google Scholar]
- Yamaguchi, M.; Shimizu, M.; Ino, H.; Terai, H.; Uchiyama, K.; Oe, K.; Mabuchi, T.; Konno, T.; Kaneda, T.; Mabuchi, H. T wave peak-to-end interval and QT dispersion in acquired long QT syndrome: A new index for arrhythmogenicity. Clin. Sci. 2003, 105, 671–676. [Google Scholar] [CrossRef] [PubMed]
- Sztajzel, J. Heart rate variability: A noninvasive electrocardiographic method to measure the autonomic nervous system. Swiss Med. Wkly. 2004, 134, 514–522. [Google Scholar]
- Stein, P.K.; Kleiger, R.E. Insights from the study of heart rate variability. Annu. Rev. Med. 1999, 50, 249–261. [Google Scholar] [CrossRef]
- Saper, C.B.; Scammell, T.E.; Lu, J. Hypothalamic regulation of sleep and circadian rhythms. Nature 2005, 437, 1257–1263. [Google Scholar] [CrossRef]
- Massin, M.M.; Maeyns, K.; Withofs, N.; Ravet, F.; Gerard, P. Circadian rhythm of heart rate and heart rate variability. Arch. Dis. Child. 2000, 83, 179–182. [Google Scholar] [CrossRef]
- Carney, R.M.; Blumenthal, J.A.; Freedland, K.E.; Stein, P.K.; Howells, W.B.; Berkman, L.F.; Watkins, L.L.; Czajkowski, S.M.; Hayano, J.; Domitrovich, P.P.; et al. Low heart rate variability and the effect of depression on post-myocardial infarction mortality. Arch. Intern. Med. 2005, 165, 1486–1491. [Google Scholar] [CrossRef]
- Singh, J.P.; Larson, M.G.; O’Donnell, C.J.; Wilson, P.F.; Tsuji, H.; Lloyd-Jones, D.M.; Levy, D. Association of hyperglycemia with reduced heart rate variability (The Framingham Heart Study). Am. J. Cardiol. 2000, 86, 309–312. [Google Scholar] [CrossRef]
- Sloan, R.P.; McCreath, H.; Tracey, K.J.; Sidney, S.; Liu, K.; Seeman, T. RR interval variability is inversely related to inflammatory markers: The CARDIA study. Mol. Med. 2007, 13, 178–184. [Google Scholar] [CrossRef]
- Kleiter, I.; Steinbrecher, A.; Flugel, D.; Bogdahn, U.; Schulte-Mattler, W. Autonomic involvement in tick-borne encephalitis (TBE): Report of five cases. Eur. J. Med. Res. 2006, 11, 261–265. [Google Scholar] [PubMed]
- La-Orkhun, V.; Supachokchaiwattana, P.; Lertsapcharoen, P.; Khongphatthanayothin, A. Spectrum of cardiac rhythm abnormalities and heart rate variability during the convalescent stage of dengue virus infection: A Holter study. Ann. Trop. Paediatr. 2011, 31, 123–128. [Google Scholar] [CrossRef] [PubMed]
- Stock, C.; Teyssier, G.; Pichot, V.; Goffaux, P.; Barthelemy, J.C.; Patural, H. Autonomic dysfunction with early respiratory syncytial virus-related infection. Auton. Neurosci. 2010, 156, 90–95. [Google Scholar] [CrossRef] [PubMed]
- Markoff, L. Alphaviruses. In Mandell, Douglas, and Bennett’s Principles and Practice of Infectious Diseases; Elsevier BV: Amsterdam, The Netherlands, 2010; pp. 2117–2125. [Google Scholar]
- Council, N.R. Guide for the Care and Use of Laboratory Animals; National Academy: Washington, DC, USA, 1996. [Google Scholar]
- Aebersold, P. FDA experience with medical countermeasures under the animal rule. Adv. Prev. Med. 2011, 2012. [Google Scholar] [CrossRef] [PubMed]
- Gronvall, G.K.; Trent, D.; Borio, L.; Brey, R.; Nagao, L. The FDA animal efficacy rule and biodefense. Nat. Biotechnol. 2007, 25, 1084–1087. [Google Scholar] [CrossRef] [PubMed]
- Wyckoff, R.W.G.; Tesar, W.C. Equine Encephalomyelitis in Monkeys. J. Immunol. 1939, 37, 329–343. [Google Scholar]
- Roy, C.; Reed, D.; Hutt, J. Aerobiology and inhalation exposure to biological select agents and toxins. Vet. Pathol. Online 2010, 47, 779–789. [Google Scholar] [CrossRef]
- Sahin-Yilmaz, A.; Naclerio, R.M. Anatomy and physiology of the upper airway. Proc. Am. Thorac. Soc. 2011, 8, 31–39. [Google Scholar] [CrossRef]
- Rossi, S.L.; Russell-Lodrigue, K.E.; Killeen, S.Z.; Wang, E.; Leal, G.; Bergren, N.A.; Vinet-Oliphant, H.; Weaver, S.C.; Roy, C.J. IRES-Containing VEEV Vaccine Protects Cynomolgus Macaques from IE Venezuelan Equine Encephalitis Virus Aerosol Challenge. PLoS Negl. Trop. Dis. 2015, 9, e0003797. [Google Scholar] [CrossRef]
- Roy, C.J.; Adams, A.P.; Wang, E.; Leal, G.; Seymour, R.L.; Sivasubramani, S.K.; Mega, W.; Frolov, I.; Didier, P.J.; Weaver, S.C. A chimeric Sindbis-based vaccine protects cynomolgus macaques against a lethal aerosol challenge of eastern equine encephalitis virus. Vaccine 2013, 31, 1464–1470. [Google Scholar] [CrossRef]
- Reed, D.S.; Larsen, T.; Sullivan, L.J.; Lind, C.M.; Lackemeyer, M.G.; Pratt, W.D.; Parker, M.D. Aerosol exposure to western equine encephalitis virus causes fever and encephalitis in cynomolgus macaques. J. Infect. Dis. 2005, 192, 1173–1182. [Google Scholar] [CrossRef] [PubMed]
- Einthoven, W.; Fahr, G.; De Waart, A. On the direction and manifest size of the variations of potential in the human heart and on the influence of the position of the heart on the form of the electrocardiogram. Am. Heart J. 1950, 40, 163–211. [Google Scholar] [CrossRef]
- Gardner, C.L.; Sun, C.; Luke, T.; Raviprakash, K.; Wu, H.; Jiao, J.A.; Sullivan, E.; Reed, D.S.; Ryman, K.D.; Klimstra, W.B. Antibody Preparations from Human Transchromosomic Cows Exhibit Prophylactic and Therapeutic Efficacy against Venezuelan Equine Encephalitis Virus. J. Virol. 2017, 91. [Google Scholar] [CrossRef] [PubMed]
- Lackemeyer, M.; Kok-Mercado, F.; Wada, J.; Bollinger, L.; Kindrachuk, J.; Wahl-Jensen, V.; Kuhn, J.; Jahrling, P. ABSL-4 Aerobiology Biosafety and Technology at the NIH/NIAID Integrated Research Facility at Fort Detrick. Viruses 2014, 6, 137–150. [Google Scholar] [CrossRef] [PubMed]
- Reed, D.S.; Bethel, L.M.; Powell, D.S.; Caroline, A.L.; Hartman, A.L. Differences in aerosolization of Rift Valley fever virus resulting from choice of inhalation exposure chamber: Implications for animal challenge studies. Pathog. Dis. 2014, 71, 227–233. [Google Scholar] [CrossRef] [PubMed]
- Bohannon, J.K.; Honko, A.N.; Reeder, R.J.; Cooper, K.; Byrum, R.; Bollinger, L.; Kuhn, J.H.; Wada, J.; Qin, J.; Jahrling, P.B.; et al. Comparison of respiratory inductive plethysmography versus head-out plethysmography for anesthetized nonhuman primates in an animal biosafety level 4 facility. Inhal. Toxicol. 2016, 28, 670–676. [Google Scholar] [CrossRef]
- Bowling, J.D.; O’Malley, K.J.; Klimstra, W.B.; Hartman, A.L.; Reed, D.S. A Vibrating Mesh Nebulizer as an Alternative to the Collison Three-Jet Nebulizer for Infectious Disease Aerobiology. Appl. Environ. Microbiol. 2019, 85, e00747-9. [Google Scholar] [CrossRef]
- Mehendale, A.C.; Doyle, J.M.; Kolin, C.M.; Kroehle, J.P., Jr. Unlock the information in your data: Software to find, classify, and report on data patterns and arrhythmias. J. Pharm. Toxicol. Methods 2016, 81, 99–106. [Google Scholar] [CrossRef]
- Agnieszka Kitlas, G. Poincaré Plots in Analysis of Selected Biomedical Signals. Stud. Log. Gramm. Rhetor. 2013, 35, 117–127. [Google Scholar] [CrossRef]
- Henriques, T.S.; Mariani, S.; Burykin, A.; Rodrigues, F.; Silva, T.F.; Goldberger, A.L. Multiscale Poincaré plots for visualizing the structure of heartbeat time series. BMC Med. Inform. Decis. Mak. 2016, 16, 17. [Google Scholar] [CrossRef]
- Ma, H. Investigation of the Natural History of Equine Encephalitis Viruses with Radiofrequency Telemetry for Detection of Subclinical Disease Patterns; University of Pittsburgh: Pittsburgh, PA, USA, 2017. [Google Scholar]
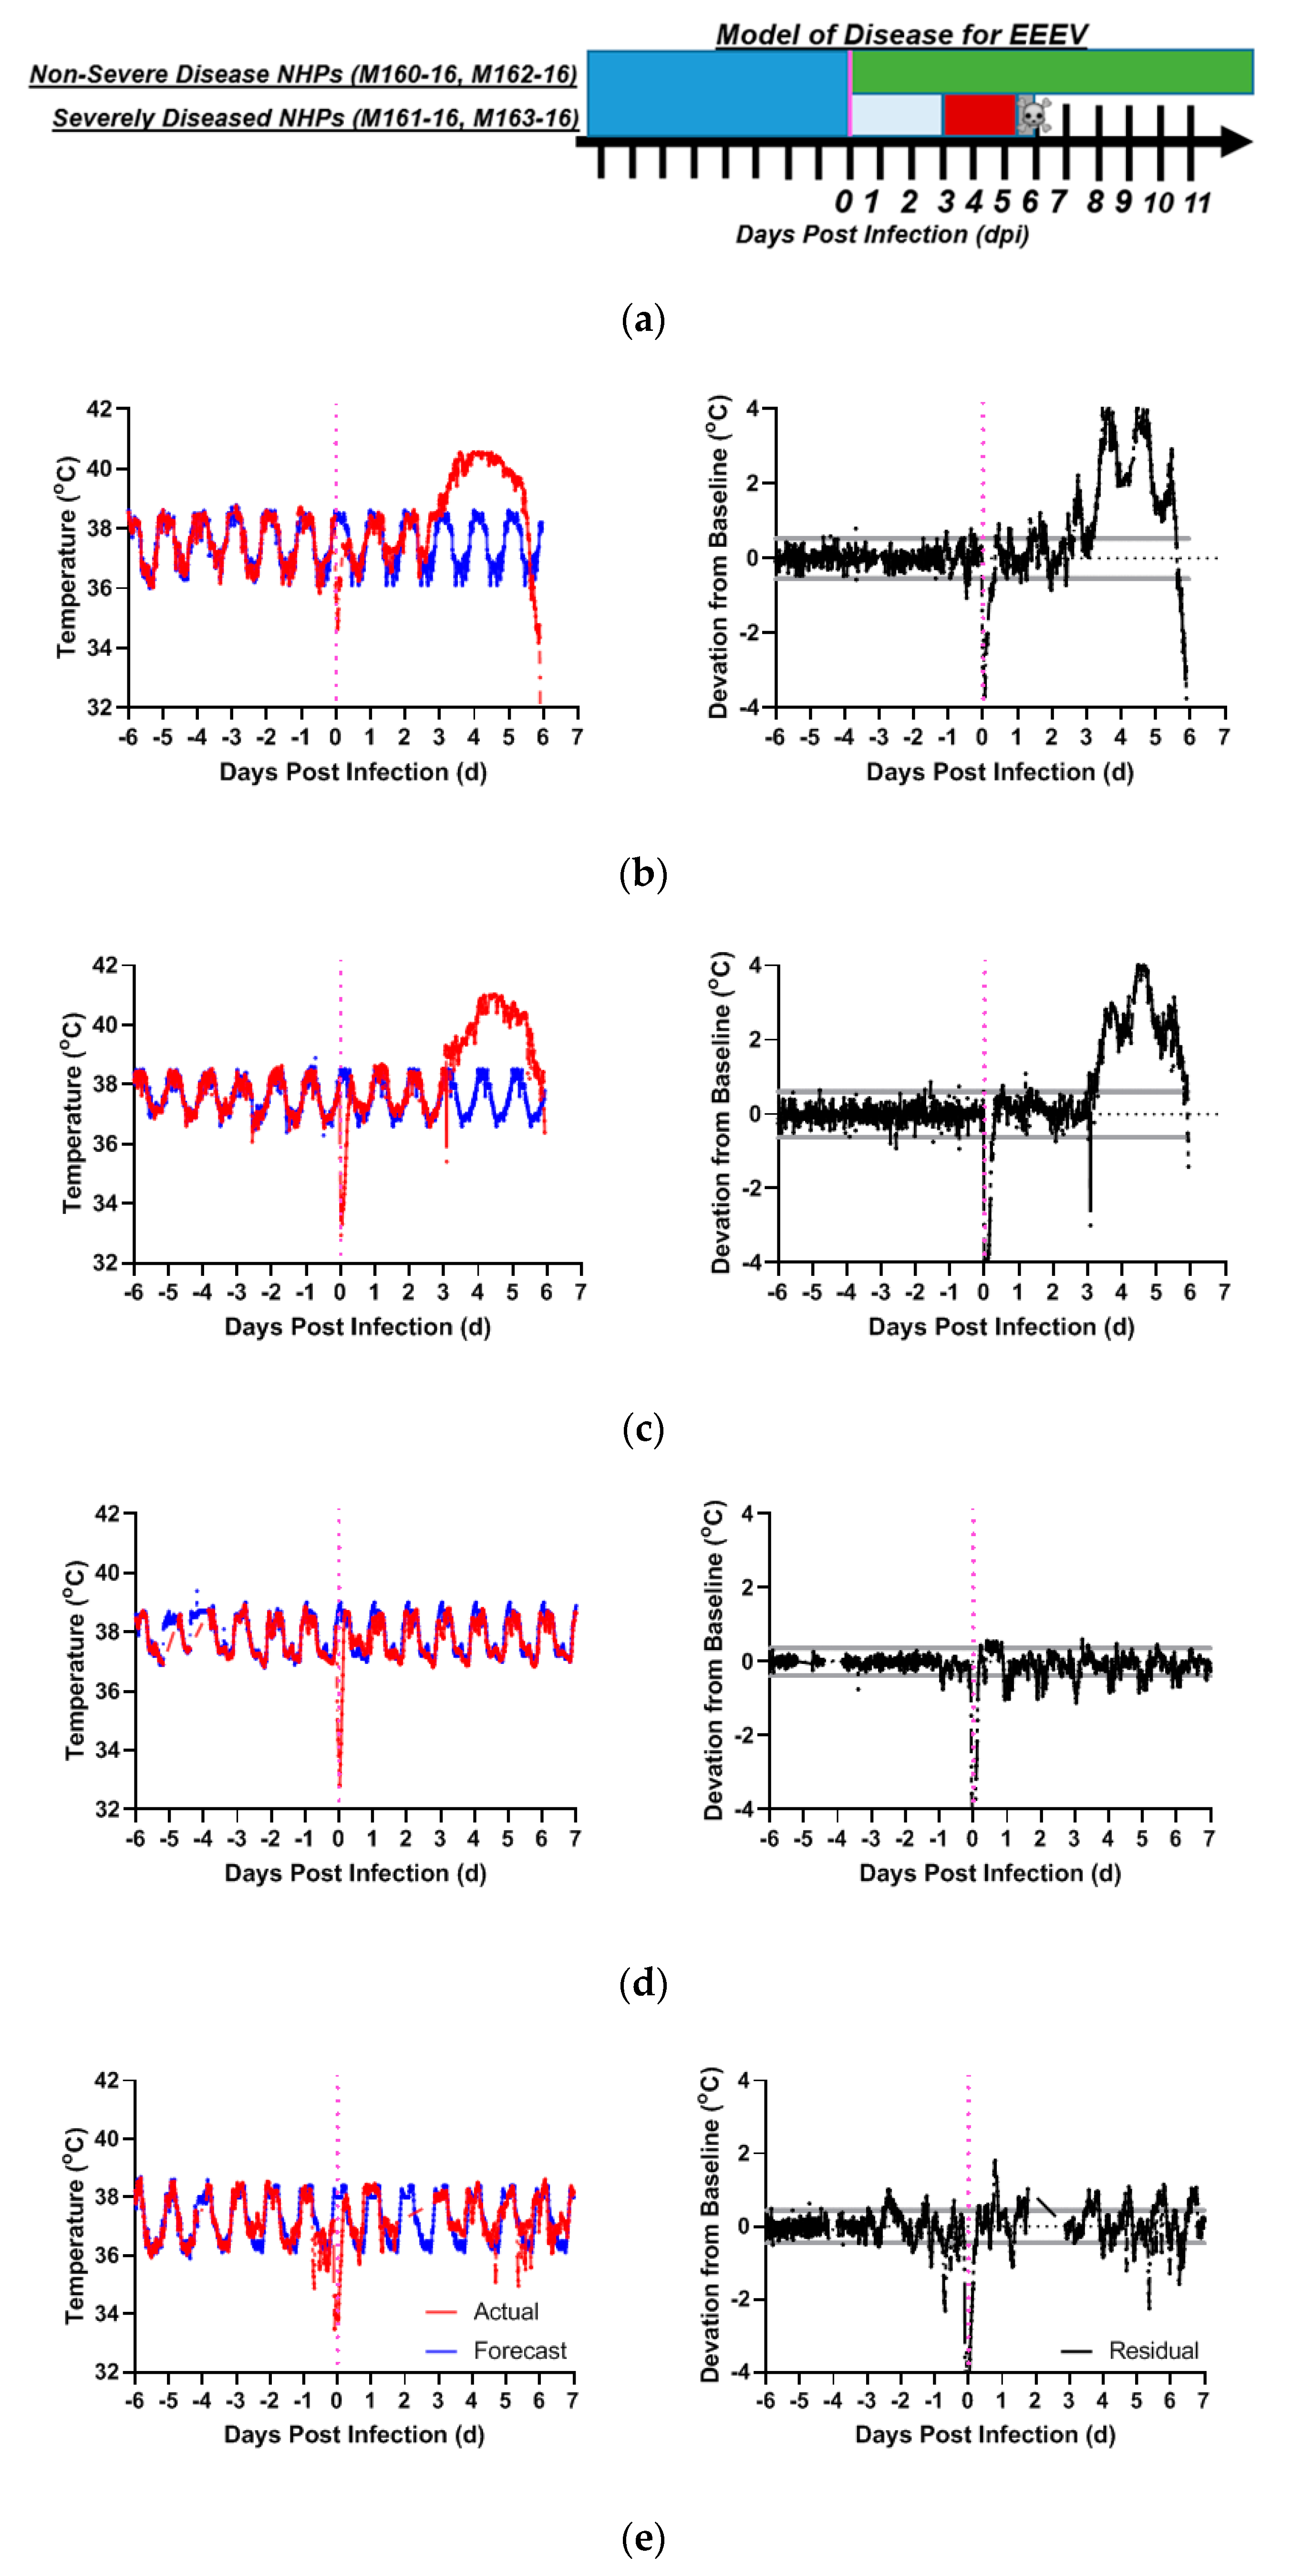
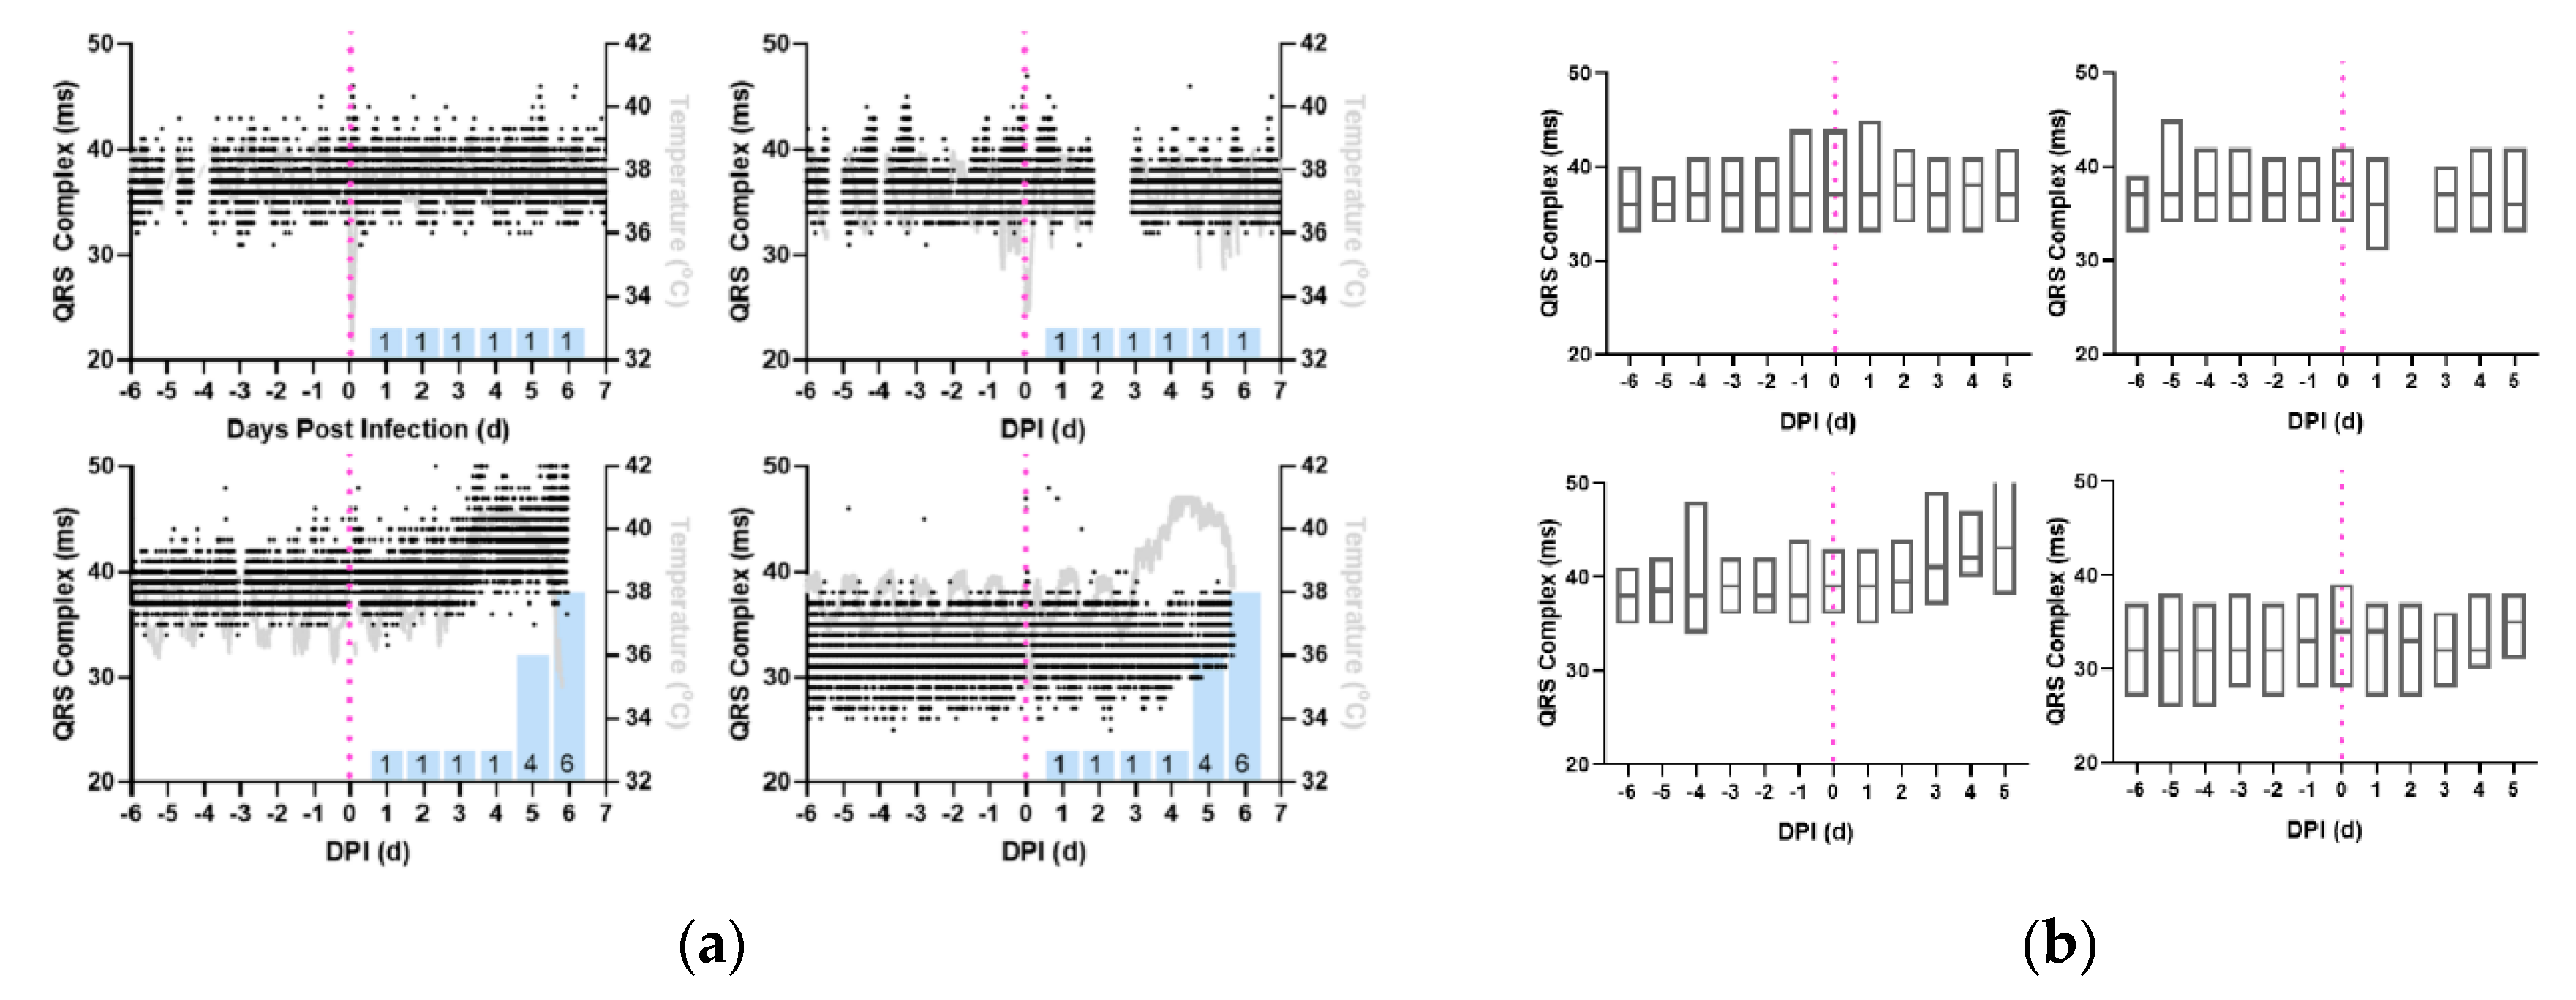
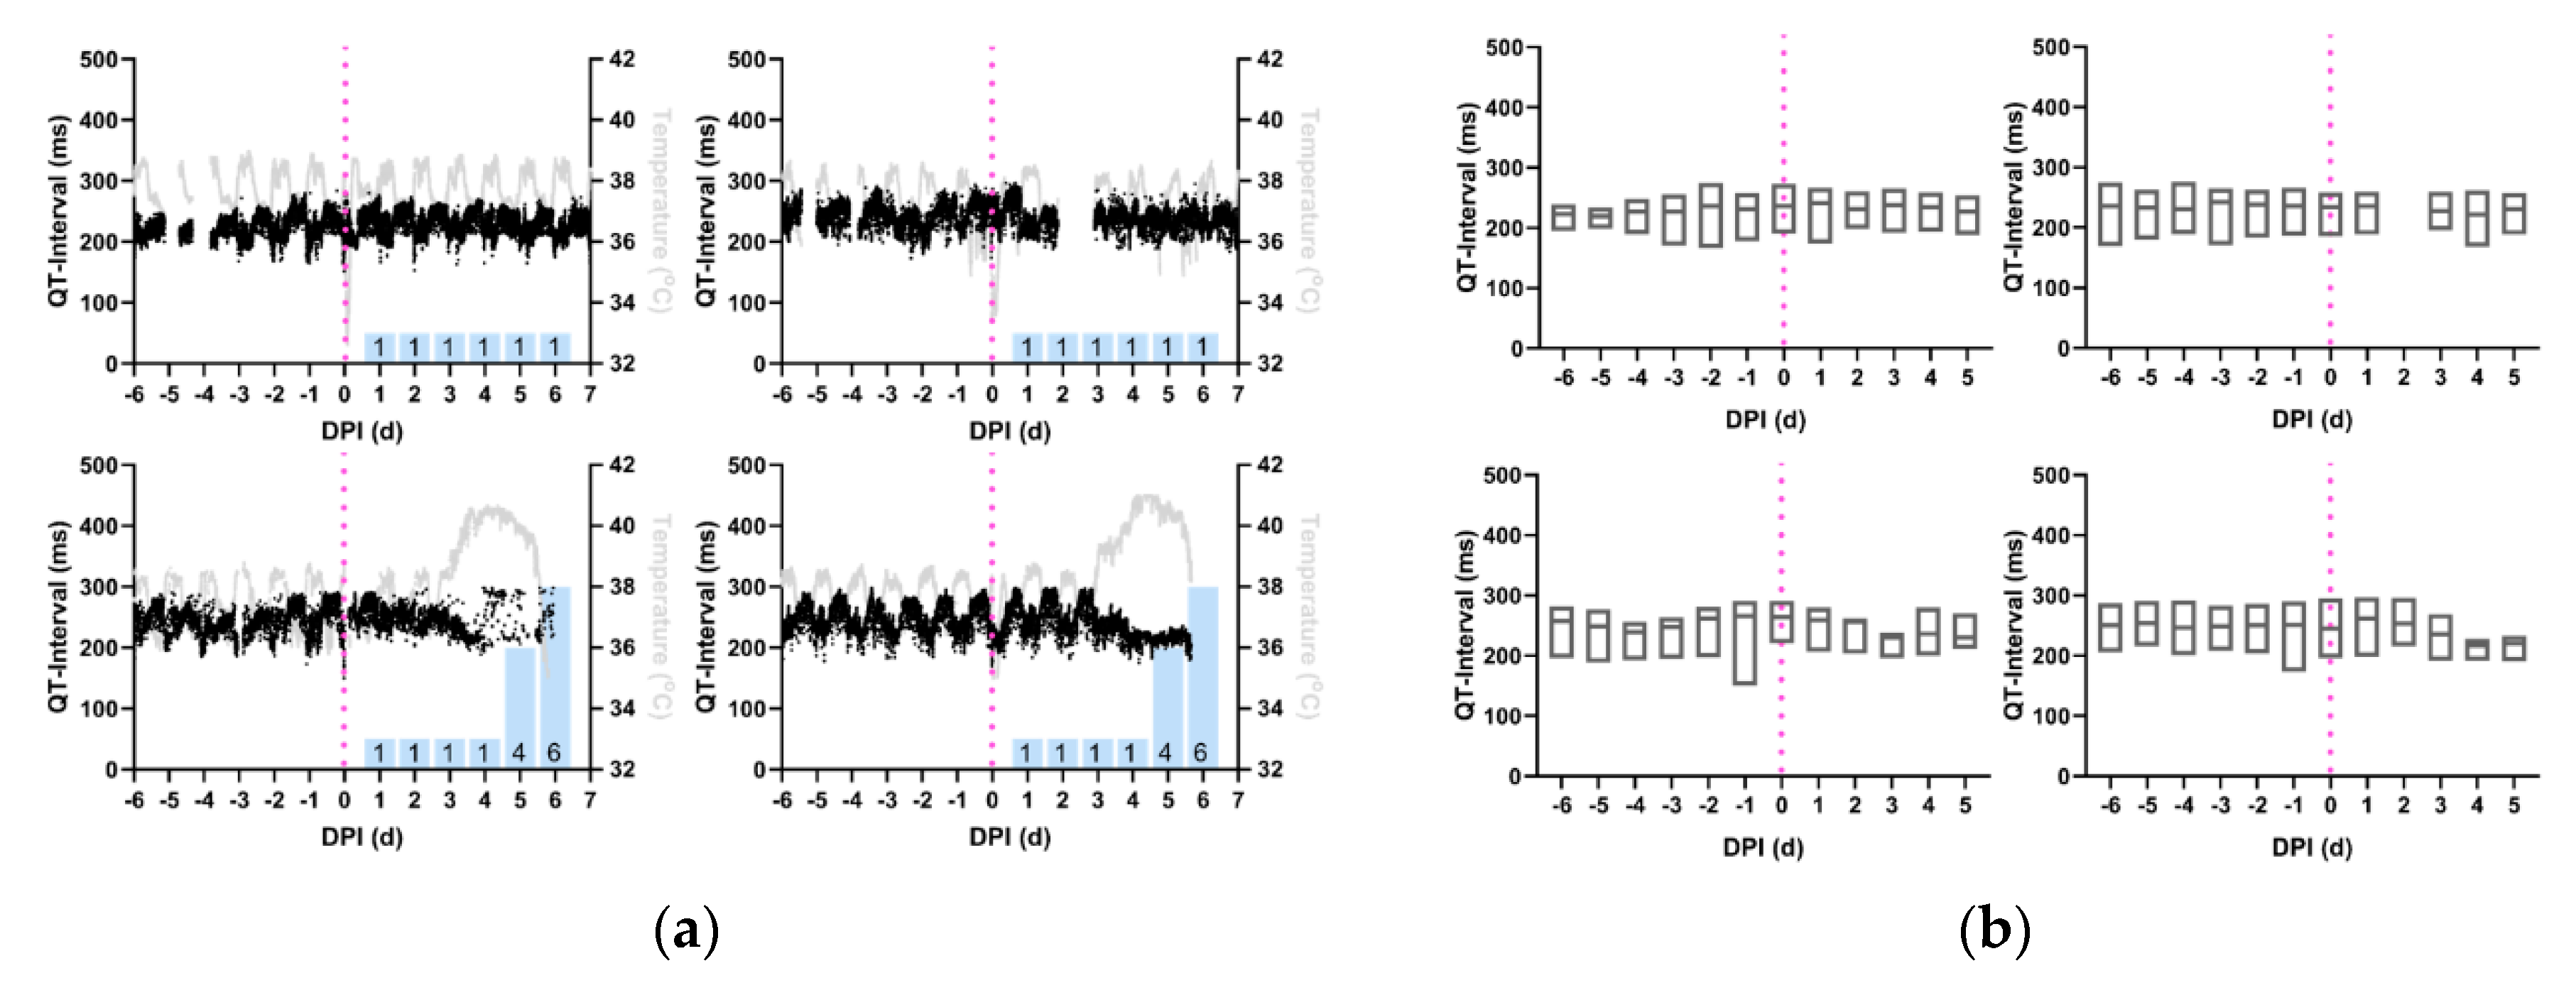
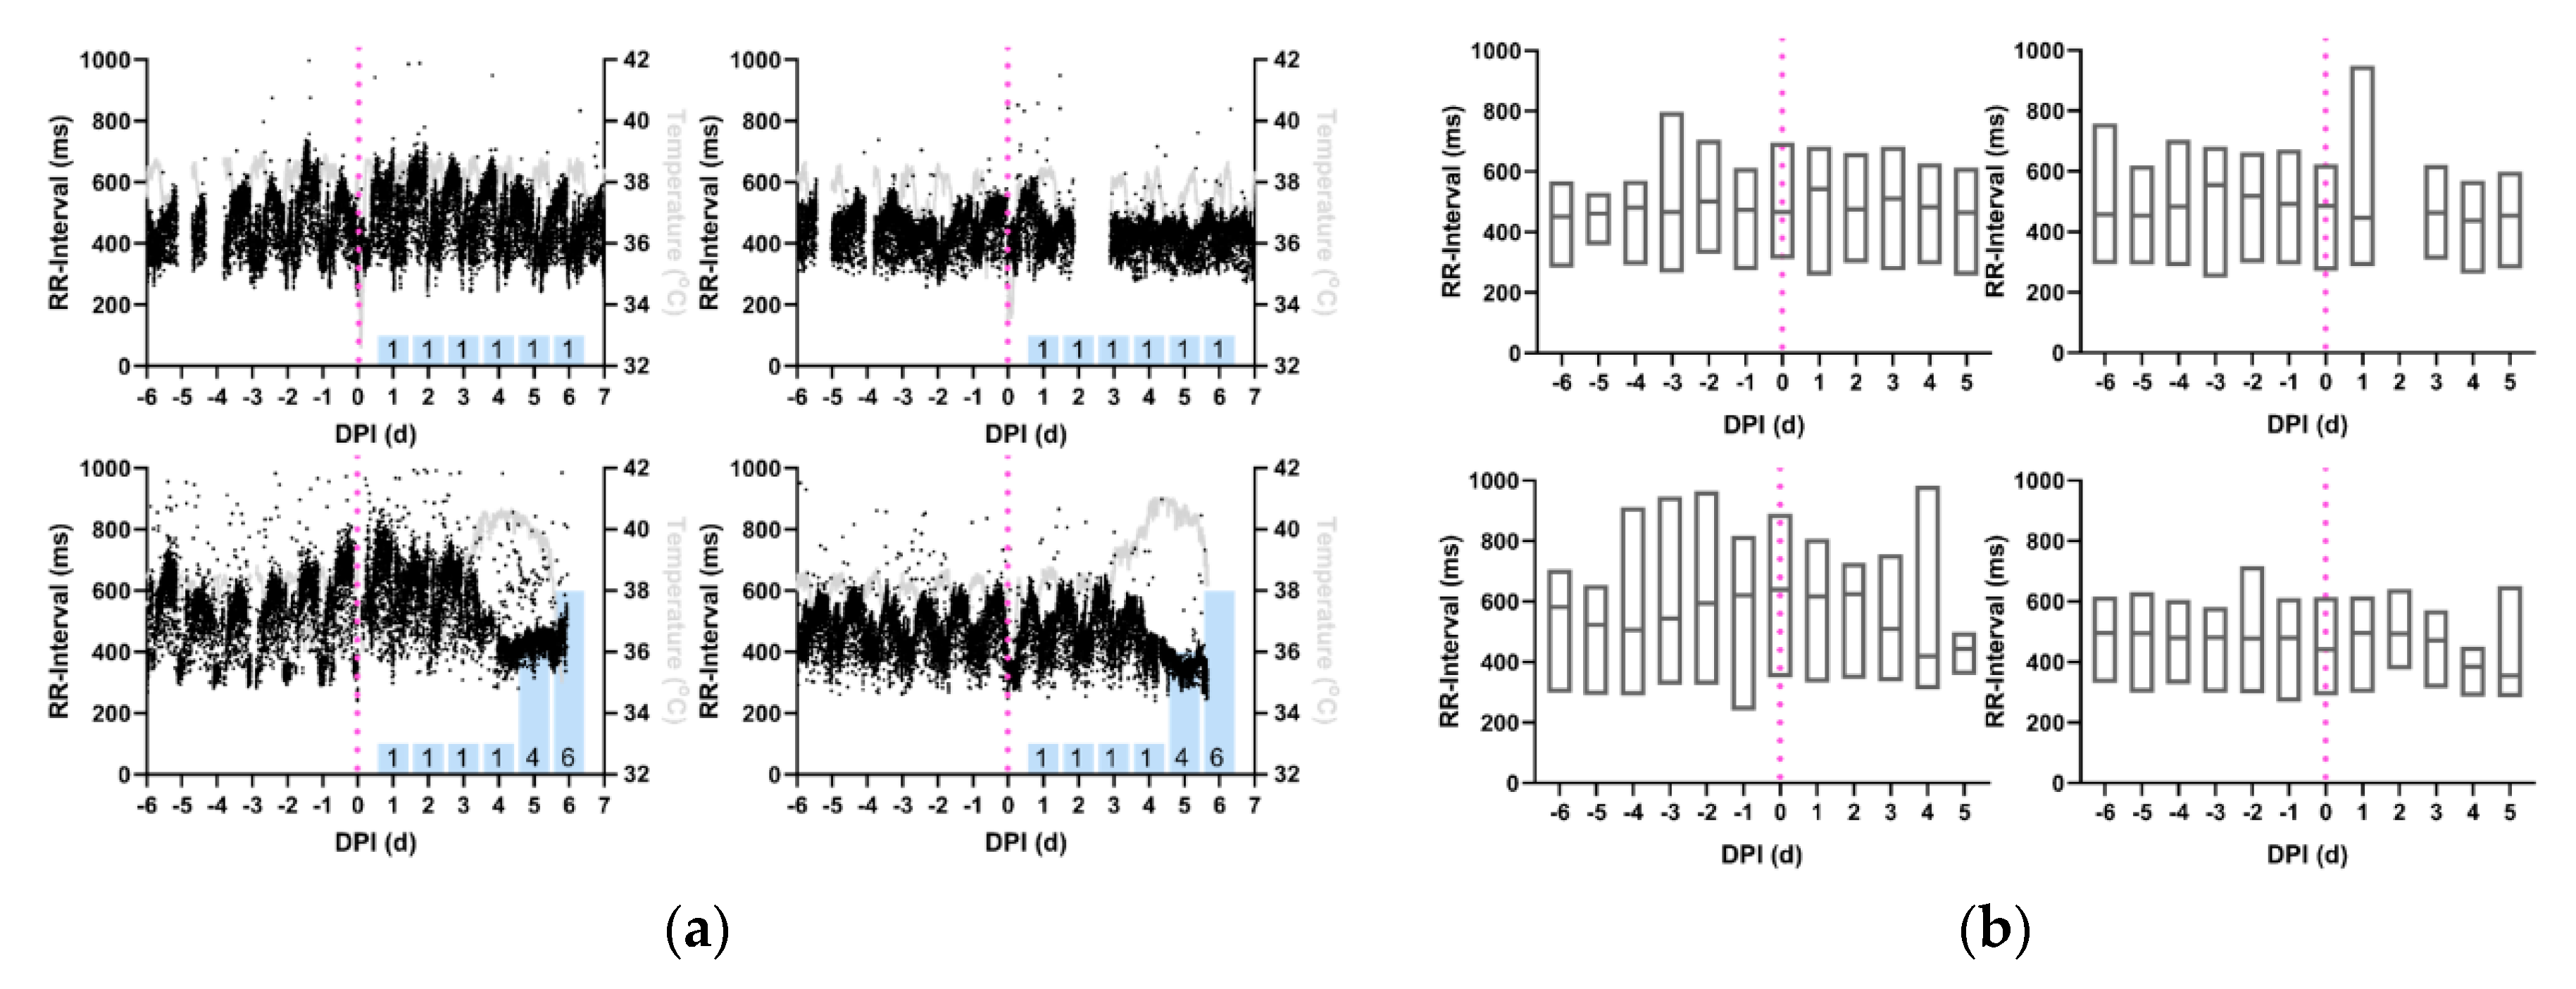

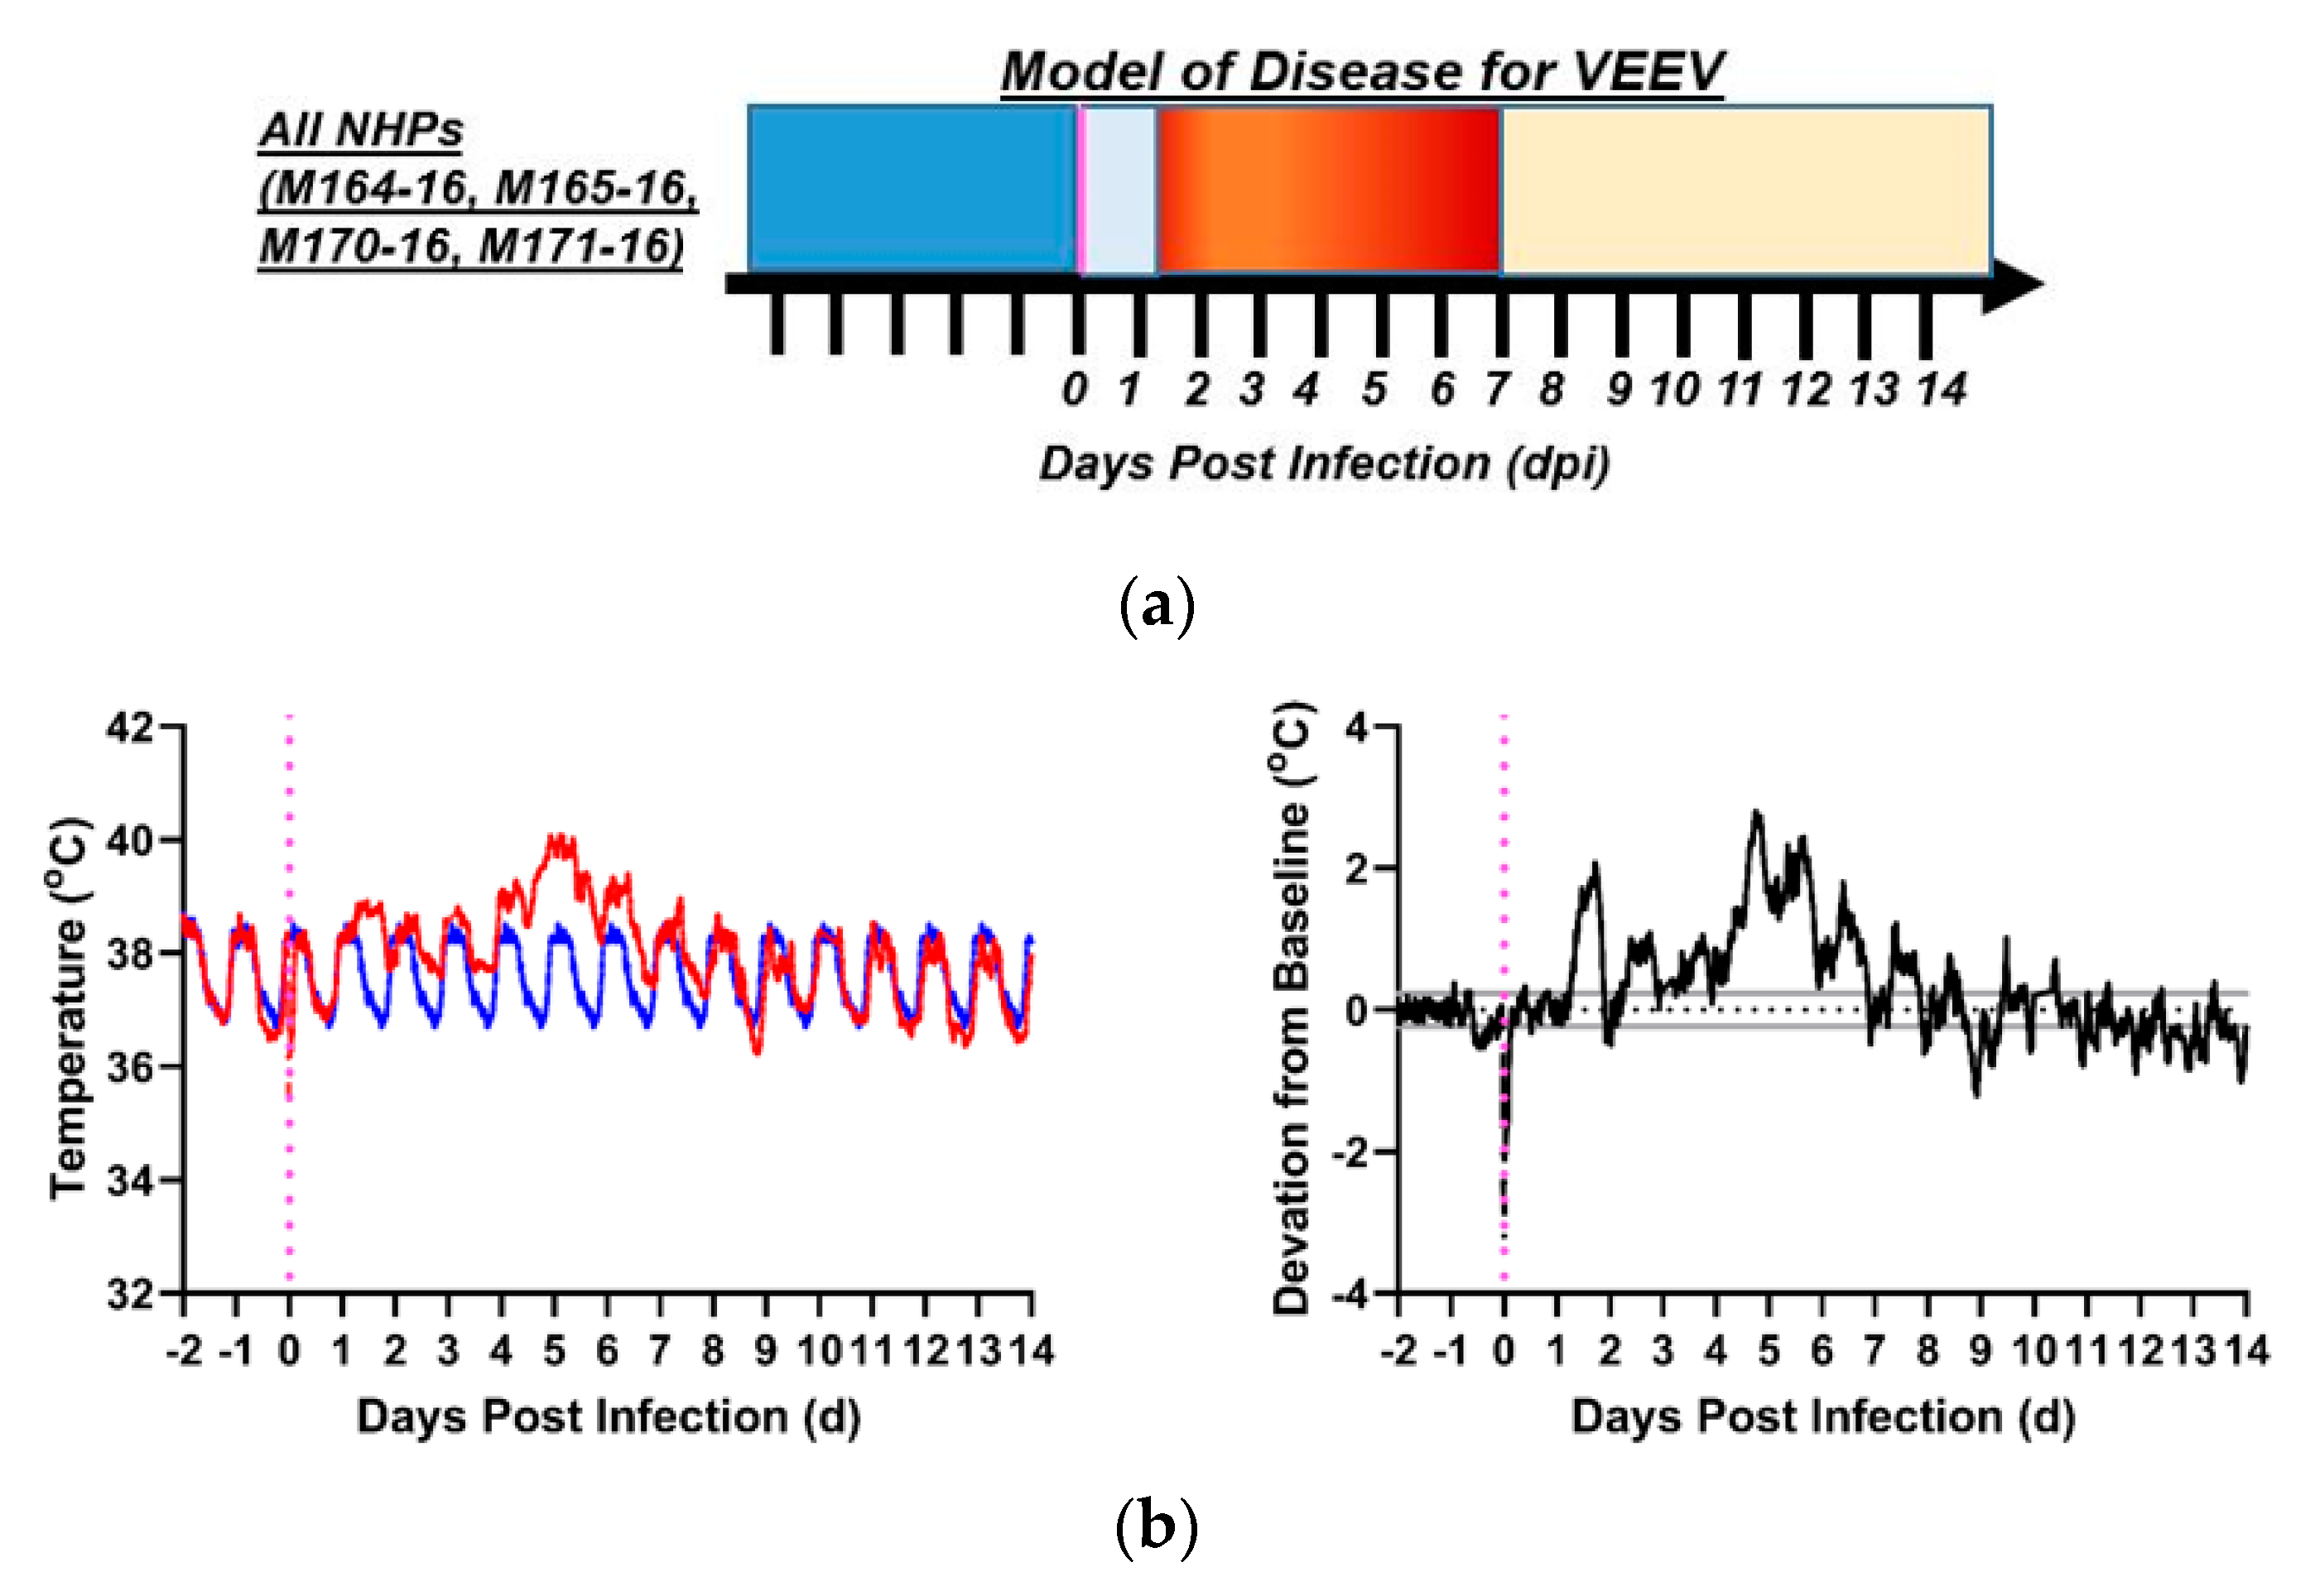
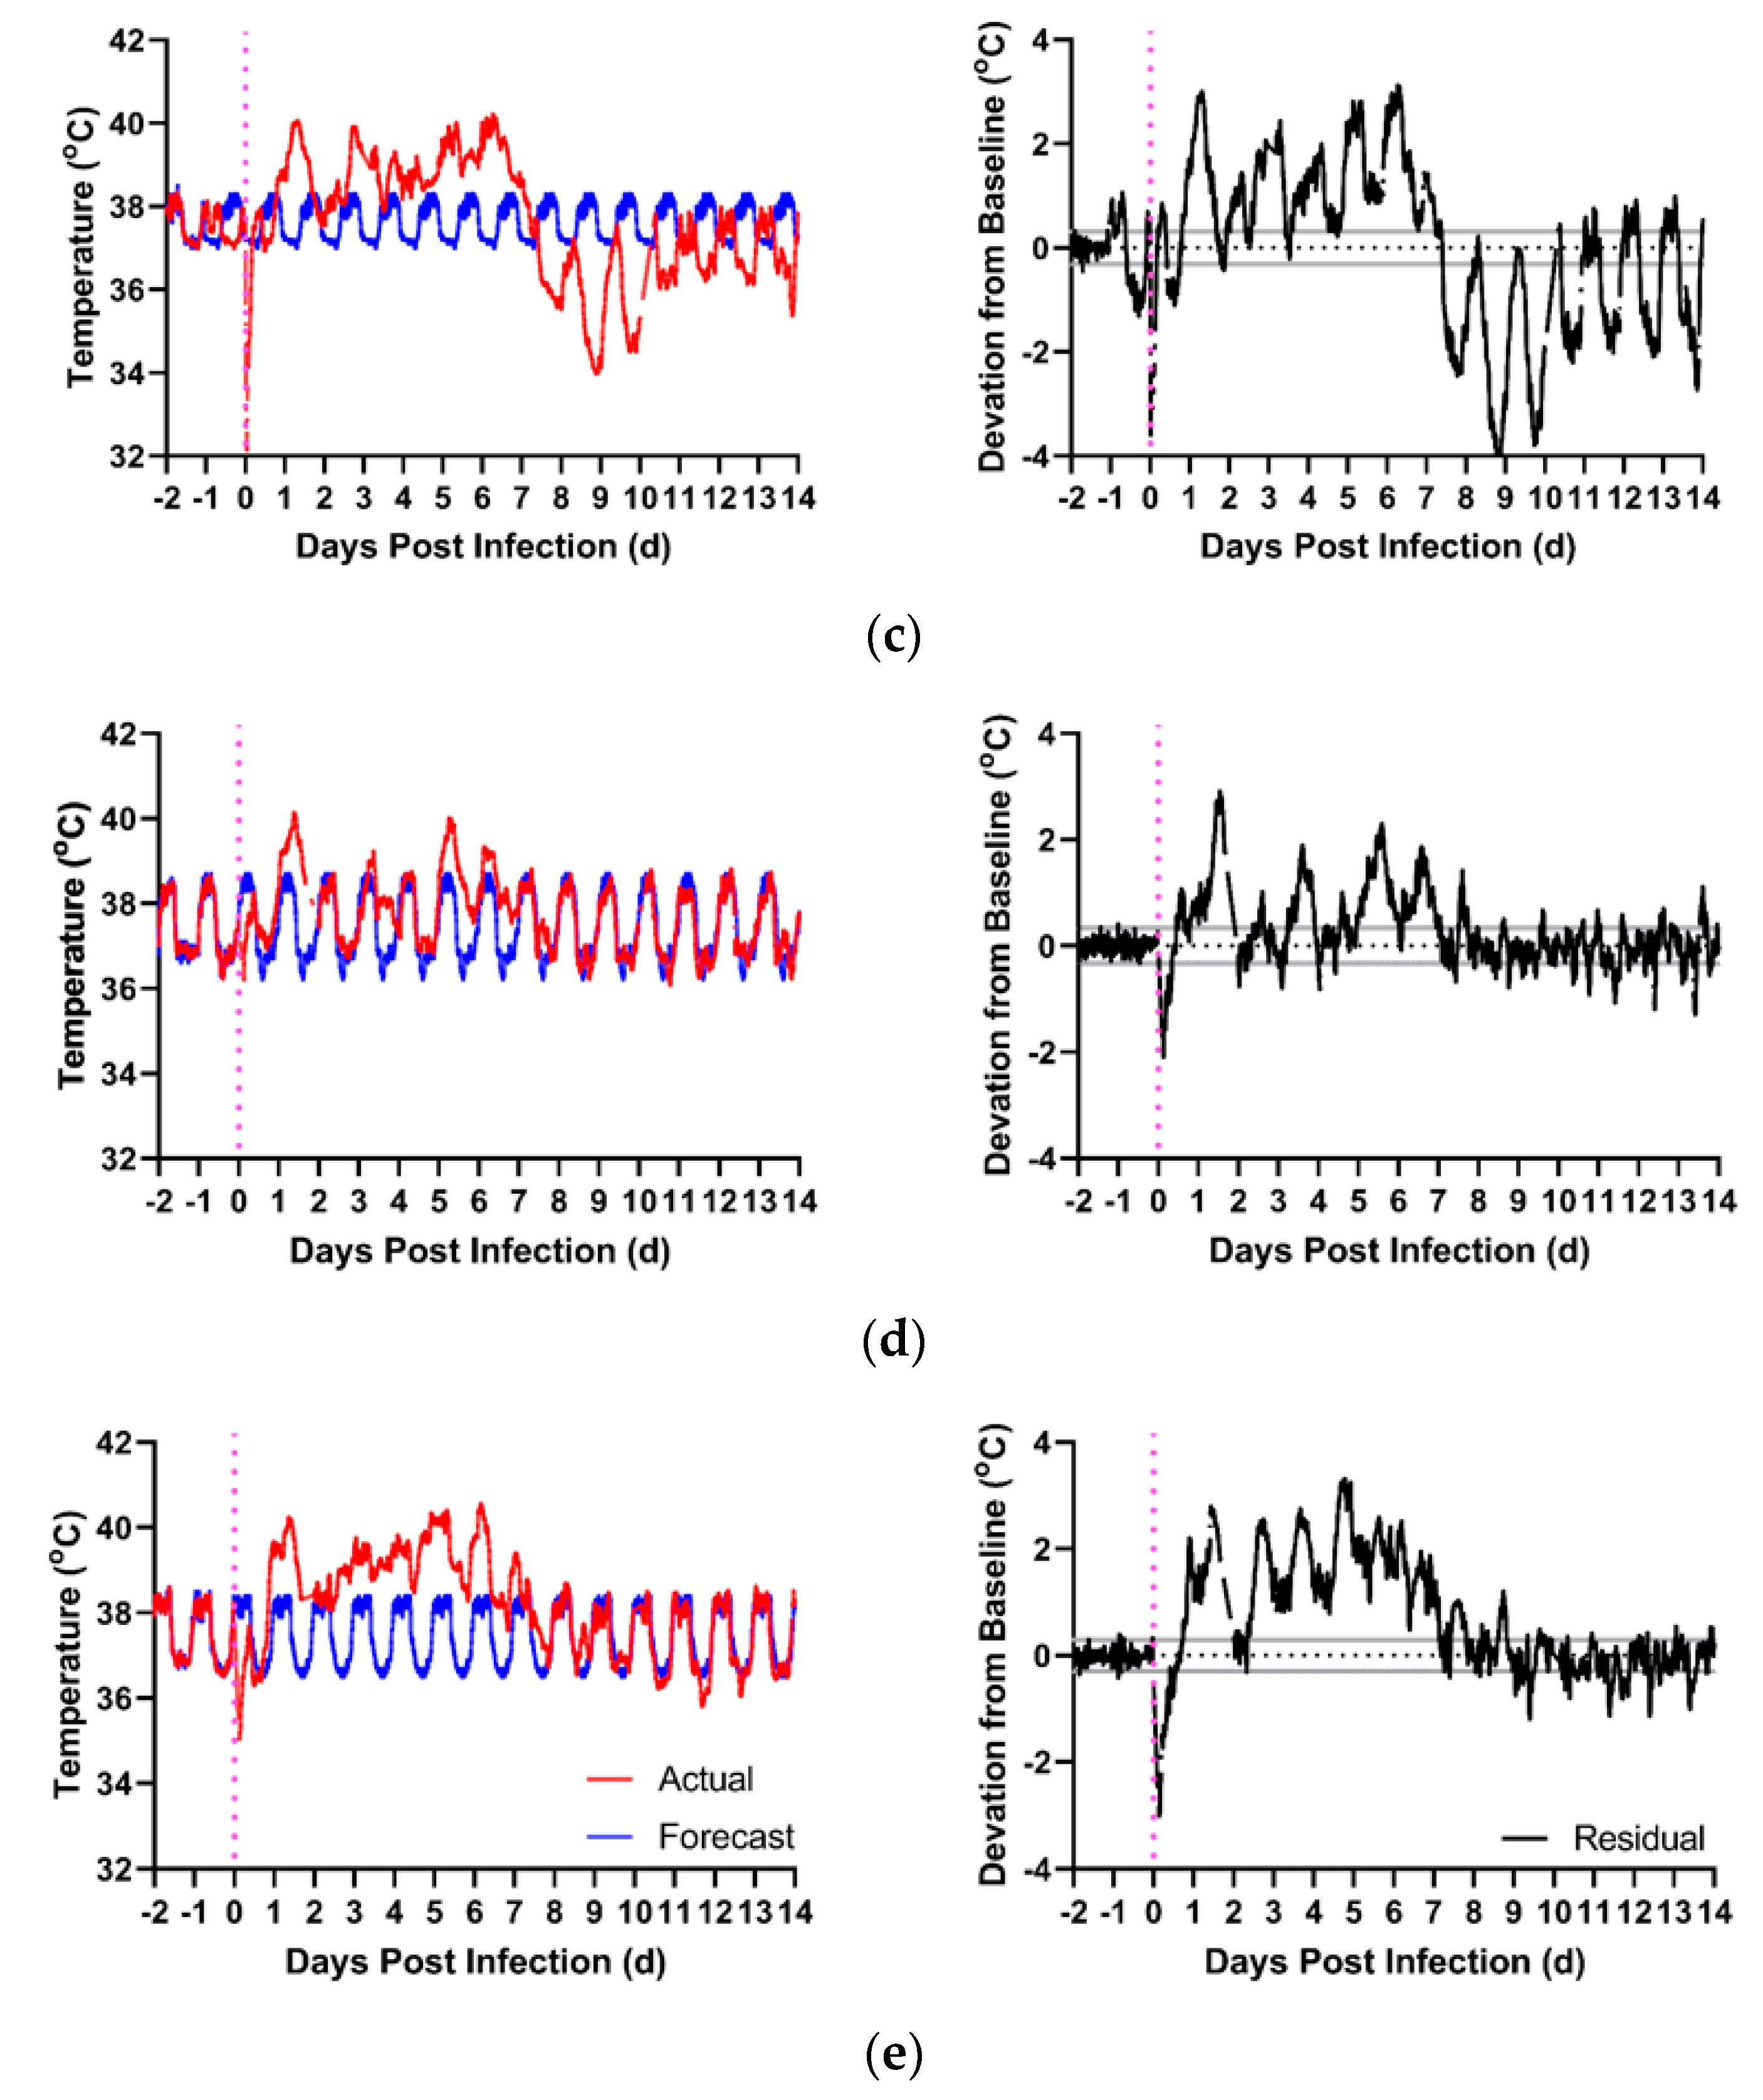

| Virus | Macaque | Sex | Dose * | TTD δ | Neuro £ | ΔMax γ | Onset γ | Duration γ | Fever-Hours γ |
|---|---|---|---|---|---|---|---|---|---|
| EEEV | M161-16 | M | 8.2 | 6 | Y | 4.2 | 3 | 70.8 | 144.2 |
| M163-16 | M | 7.5 | 6 | Y | 4.4 | 3 | 65.0 | 154.9 | |
| Mean | 8.0 | 4.3 | 3 | 67.9 | 149.6 | ||||
| M160-16 | M | 7.0 | S | N | 0.7 | 14.3 | 6.5 | ||
| M162-16 | M | 5.7 | S | N | 1.8 | 41.5 | 30.5 | ||
| Mean | 6.8 | 1.3 | 27.9 | 18.5 | |||||
| VEEV | M164-16 | F | 7.1 | S | Y | 2.8 | 1 | 187.8 | 171.6 |
| M165-16 | F | 6.9 | S | Y | 3.1 | 1 | 260.5 | 282.5 | |
| M170-16 | M | 6.3 | S | Y | 2.9 | 1 | 180.5 | 153.8 | |
| M171-16 | M | 6.0 | S | Y | 3.3 | 1 | 238.0 | 305.9 | |
| Mean | 6.8 | 3.0 | 1 | 216.7 | 228.4 |
| Virus | Macaque | Sex | Dose £ | TTD δ | F-Statistic | p-Value |
|---|---|---|---|---|---|---|
| EEEV | M161-16 | M | 8.2 | 6 | 4.780 | 0.0346 * |
| M163-16 | M | 7.5 | 6 | 4.034 | 0.0490 * | |
| M160-16 | M | 7.0 | S | 3.833 | 0.058 | |
| M162-16 | M | 5.7 | S | 3.046 | 0.331 | |
| VEEV | M164-16 | F | 7.1 | S | 29.55 | <0.00001 * |
| M165-16 | F | 6.9 | S | 164.7 | <0.00001 * | |
| M170-16 | M | 6.3 | S | 48.40 | <0.00001 * | |
| M171-16 | M | 6.0 | S | 84.17 | <0.00001 * |
| Virus | Macaque | Sex | Dose * | TTD δ | F-Statistic | p-Value |
|---|---|---|---|---|---|---|
| EEEV | M161-16 | M | 8.2 | 6 | 6.472 | 0.016 * |
| M163-16 | M | 7.5 | 6 | 24.95 | 0.00005 * | |
| M160-16 | M | 7.0 | S | 3.884 | 0.055 | |
| M162-16 | M | 5.7 | S | 2.962 | 0.335 | |
| VEEV | M164-16 | F | 7.1 | S | 36.30 | <0.00001 * |
| M165-16 | F | 6.9 | S | 62.56 | <0.00001 * | |
| M170-16 | M | 6.3 | S | 25.46 | <0.00001 * | |
| M171-16 | M | 6.0 | S | 82.35 | <0.00001 * |
| Virus | Macaque | Sex | Dose * | TTD δ | F-Statistic | p-Value |
|---|---|---|---|---|---|---|
| EEEV | M161-16 | M | 8.2 | 6 | 6.626 | 0.014 * |
| M163-16 | M | 7.5 | 6 | 13.92 | 0.0004 * | |
| M160-16 | M | 7.0 | S | 3.420 | 0.073 | |
| M162-16 | M | 5.7 | S | 2.227 | 0.376 | |
| VEEV | M164-16 | F | 7.1 | S | 49.07 | <0.00001 * |
| M165-16 | F | 6.9 | S | 175.9 | <0.00001 * | |
| M170-16 | M | 6.3 | S | 15.65 | <0.00001 * | |
| M171-16 | M | 6.0 | S | 183.0 | <0.00001 * |
| Virus | Macaque | Sex | Pre-Infection Frequency | Post-Infection Frequency | Febrile Period Frequency | Recovery Period Frequency |
|---|---|---|---|---|---|---|
| EEEV | 161-16 | M | 0.395 | 0.879 | 0.571 | |
| 163-16 | M | 0.242 | 0.769 | 0.549 | ||
| 160-16 | M | 0.351 | 0.242 | |||
| 162-16 | M | 0.307 | 0.351 | |||
| VEEV | 164-16 | F | 5.974 (0.373) | 11.070 (0.275) | 4.393 (0.275) | 3.514 (0.220) |
| 165-16 | F | 5.974 (0.373) | 11.070 (0.286) | 4.568 (0.286) | 3.514 (0.220) | |
| 170-16 | M | 11.245 (0.351) | 13.881 (0.434) | 4.217 (0.132) | 3.163 (0.099) | |
| 171-16 | M | 11.245 (0.351) | 13.705 (0.428) | 5.271 (0.165) | 3.163 (0.099) |
© 2019 by the authors. Licensee MDPI, Basel, Switzerland. This article is an open access article distributed under the terms and conditions of the Creative Commons Attribution (CC BY) license (http://creativecommons.org/licenses/by/4.0/).
Share and Cite
Ma, H.; Lundy, J.D.; O’Malley, K.J.; Klimstra, W.B.; Hartman, A.L.; Reed, D.S. Electrocardiography Abnormalities in Macaques after Infection with Encephalitic Alphaviruses. Pathogens 2019, 8, 240. https://doi.org/10.3390/pathogens8040240
Ma H, Lundy JD, O’Malley KJ, Klimstra WB, Hartman AL, Reed DS. Electrocardiography Abnormalities in Macaques after Infection with Encephalitic Alphaviruses. Pathogens. 2019; 8(4):240. https://doi.org/10.3390/pathogens8040240
Chicago/Turabian StyleMa, Henry, Jeneveve D. Lundy, Katherine J. O’Malley, William B. Klimstra, Amy L. Hartman, and Douglas S. Reed. 2019. "Electrocardiography Abnormalities in Macaques after Infection with Encephalitic Alphaviruses" Pathogens 8, no. 4: 240. https://doi.org/10.3390/pathogens8040240
APA StyleMa, H., Lundy, J. D., O’Malley, K. J., Klimstra, W. B., Hartman, A. L., & Reed, D. S. (2019). Electrocardiography Abnormalities in Macaques after Infection with Encephalitic Alphaviruses. Pathogens, 8(4), 240. https://doi.org/10.3390/pathogens8040240


