Article

Immunohistochemical Expression Patterns of Inflammatory Cells Involved in Chronic Hyperplastic Candidosis

1
School of Dentistry, Cardiff University, Heath Park, Cardiff CF14 4XY, UK
2
Bristol Dental School, Lower Maudlin Street, Bristol BS1 3NU, UK
3
Dental Hospital, University Hospital of Wales, Heath Park, Cardiff CF14 4XY, UK
*
Author to whom correspondence should be addressed.
Pathogens 2019, 8(4), 232; https://doi.org/10.3390/pathogens8040232
Submission received: 4 October 2019 / Revised: 4 November 2019 / Accepted: 9 November 2019 / Published: 12 November 2019
(This article belongs to the Special Issue Pathogenesis and Virulence of Candida albicans and Candida glabrata)

Abstract

:
The profile of the inflammatory cell infiltrate in chronic hyperplastic candidosis (CHC) was determined in oral mucosal biopsies by immunohistochemistry. One tonsillar tissue section was included as an immunohistochemistry control, whilst squamous papilloma (n = 4) with secondary Candida infection was used as Candida controls. Oral lichen planus tissues (n = 10) provided negative controls for Candida presence, as well as positive controls for inflammation. Immunohistochemistry employed antibodies specific for CD3+ (T lymphocytes), CD4+ (T helper cells), CD8+ (cytotoxic T cells), and CD20+ (B lymphocytes). Manual counting of stained cells from digitised images determined the proportion of each cell type relative to the total number of cells, and these were assessed in the mucosa, the epithelium, and the lamina propria. The mean proportion of CD3+ cells was significantly higher than CD20+ cells in all tissue types. For CHC, the mean proportion of CD3+ cells in entire tissues was 15.6%, with the highest proportion in the lamina propria (32.6%) compared with the epithelium (3.9%). CD20+ cells were in much lower proportions (1.8%) in CHC, with the highest proportion (3.6%) in the lamina propria. T lymphocytes were predominately CD4+ cells (9.0%) compared with CD8+ cells (4.4%). CD4+ cells were most prevalent in the lamina propria (23.1%) compared with the epithelium (mean = 3.2%). From these results, it was concluded that the immune response invoked by Candida in CHC is primarily driven by the T helper cells.

1. Introduction

Candida albicans is a commensal fungus of humans, where it typically resides on the skin and mucosal surfaces without detriment to health. However, in debilitated individuals, including those with immune deficiency, C. albicans can cause a range of opportunistic infections, collectively referred to as candidoses. Whilst these infections are mostly superficial, primarily effecting the oral and vaginal mucosa, in severely immunocompromised patients, serious systemic infections can arise, which have mortality rates approaching 50% [1].
Several clinical presentations of oral candidoses are recognised, including acute and chronic pseudomembranous candidosis, acute erythematous candidosis, chronic erythematous candidosis, and chronic hyperplastic candidosis (CHC) [2]. These infections typically arise following changes in the oral environment, often associated with weakened or immature immune systems [3]. An appropriately functioning immune response is therefore essential in protecting the host against candidosis [4].
The focus of this research was CHC, which is associated with premalignant changes (oral epithelial dysplasia), although it is not clear whether premalignancy occurs because of the Candida infection itself [5]. CHC presents as white plaque lesions on the commissures of the oral mucosa or buccal mucosa, and the lateral border of the tongue [6]. Unlike other oral candidoses, where only surface colonisation by the fungus occurs, in CHC, invasion of Candida into the keratinised layer of the oral epithelium is evident. Histology of CHC lesions is essential for diagnosis, and along with Candida invasion, typically reveals an inflammatory cell infiltrate with hyperplasia of the oral epithelium [6,7]. There is debate over interaction between immune cells when coordinating host responses to Candida, and this is further complicated by differential responses to yeast and hyphal forms of C. albicans. When Candida invades the oral mucosa, a sequence of cellular interactions occurs, ultimately leading to phagocytosis and removal of the invading Candida [8]. It is thought that Toll-Like Receptors (TLRs) and C-lectin receptors on dendritic cells (DCs) recognise pathogen-associated molecular patterns (PAMPs) on the surface of Candida [8,9]. The DCs then phagocytose the Candida and migrate to draining lymph nodes, where the antigen is presented to naïve T cells. T cells bind to the DCs via the presented antigen, and major histocompatibility complex (MHC) [10]. The result of interaction between the DC with the naïve T cell is release of specific cytokines leading to clonal expansion of the T cell and their trafficking to the infection site. T cells are thought to be essential in the orchestration of cell immunity [4]. In addition, recent studies have evidenced a role for oral epithelial cells themselves to detect and, indeed, discriminate between yeast and hyphal forms of C. albicans through pattern recognition receptors. This may subsequently instigate both the induction of pro-inflammatory and antifungal responses [11,12].
All T cells express CD3 (cluster of differentiation 3), which is a cell surface protein cluster that acts as a receptor for activation. Within the CD3+ T cell population, some T cells are CD4+ and these are commonly referred to as T helper cells. Other CD3+ T cells are CD8+ and are often referred to as cytotoxic T cells. CD8+ T cells can be resident within the epithelium of normal mucosa, and occasionally CD4+ T cells are found in the corium, which in the oral mucosa is most frequently termed the lamina propria. T helper (CD4+) cells produce cytokines that ‘help’ the immune response [9,13], whilst the primary function of CD8+ cells (cytotoxic T cells) is to kill viral-infected cells [13]. Specific types of CD4+ T helper (Th) cell responses may occur and are mediated by subsets of CD4+ T cells termed Th1, Th2, Th17, and T regulatory cells (Tregs) [10]. Th-1 responses are pro-inflammatory [12] and are modulated by the anti-inflammatory effects of Th2 responses. Th-17 responses are associated with IL-17A, IL-17F, IL-21, and IL-22 cytokines and are strongly linked with protection against fungal disease [12,14]. In addition to T cells, B-lymphocytes (CD20+) can be present in the lamina propria and these mature into plasma cells, which could play a role in defence against Candida through production of antibodies. The most important mucosal defence against Candida infection is undoubtedly cell-mediated immunity (involving T cells) and innate immunity (involving macrophages, neutrophils, and cytotoxic T cells) [15]. There remains controversy about the role of antibodies in protecting against mucosal candidosis, although protection against systemic candidosis has been demonstrated [16].
To date, the immunohistochemical analyses of inflammatory cells in CHC has not been widely studied. Previous research examined expression of CD3+ and CD20+ cells in CHC, but a lack of commercially available antibodies which functioned on fixed tissue at the time of that study meant analyses of the CD4+ and CD8+ T cell subsets were not possible [7]. This present study includes this analysis, thus further enhancing our knowledge of host immune responses to Candida in CHC.

2. Results

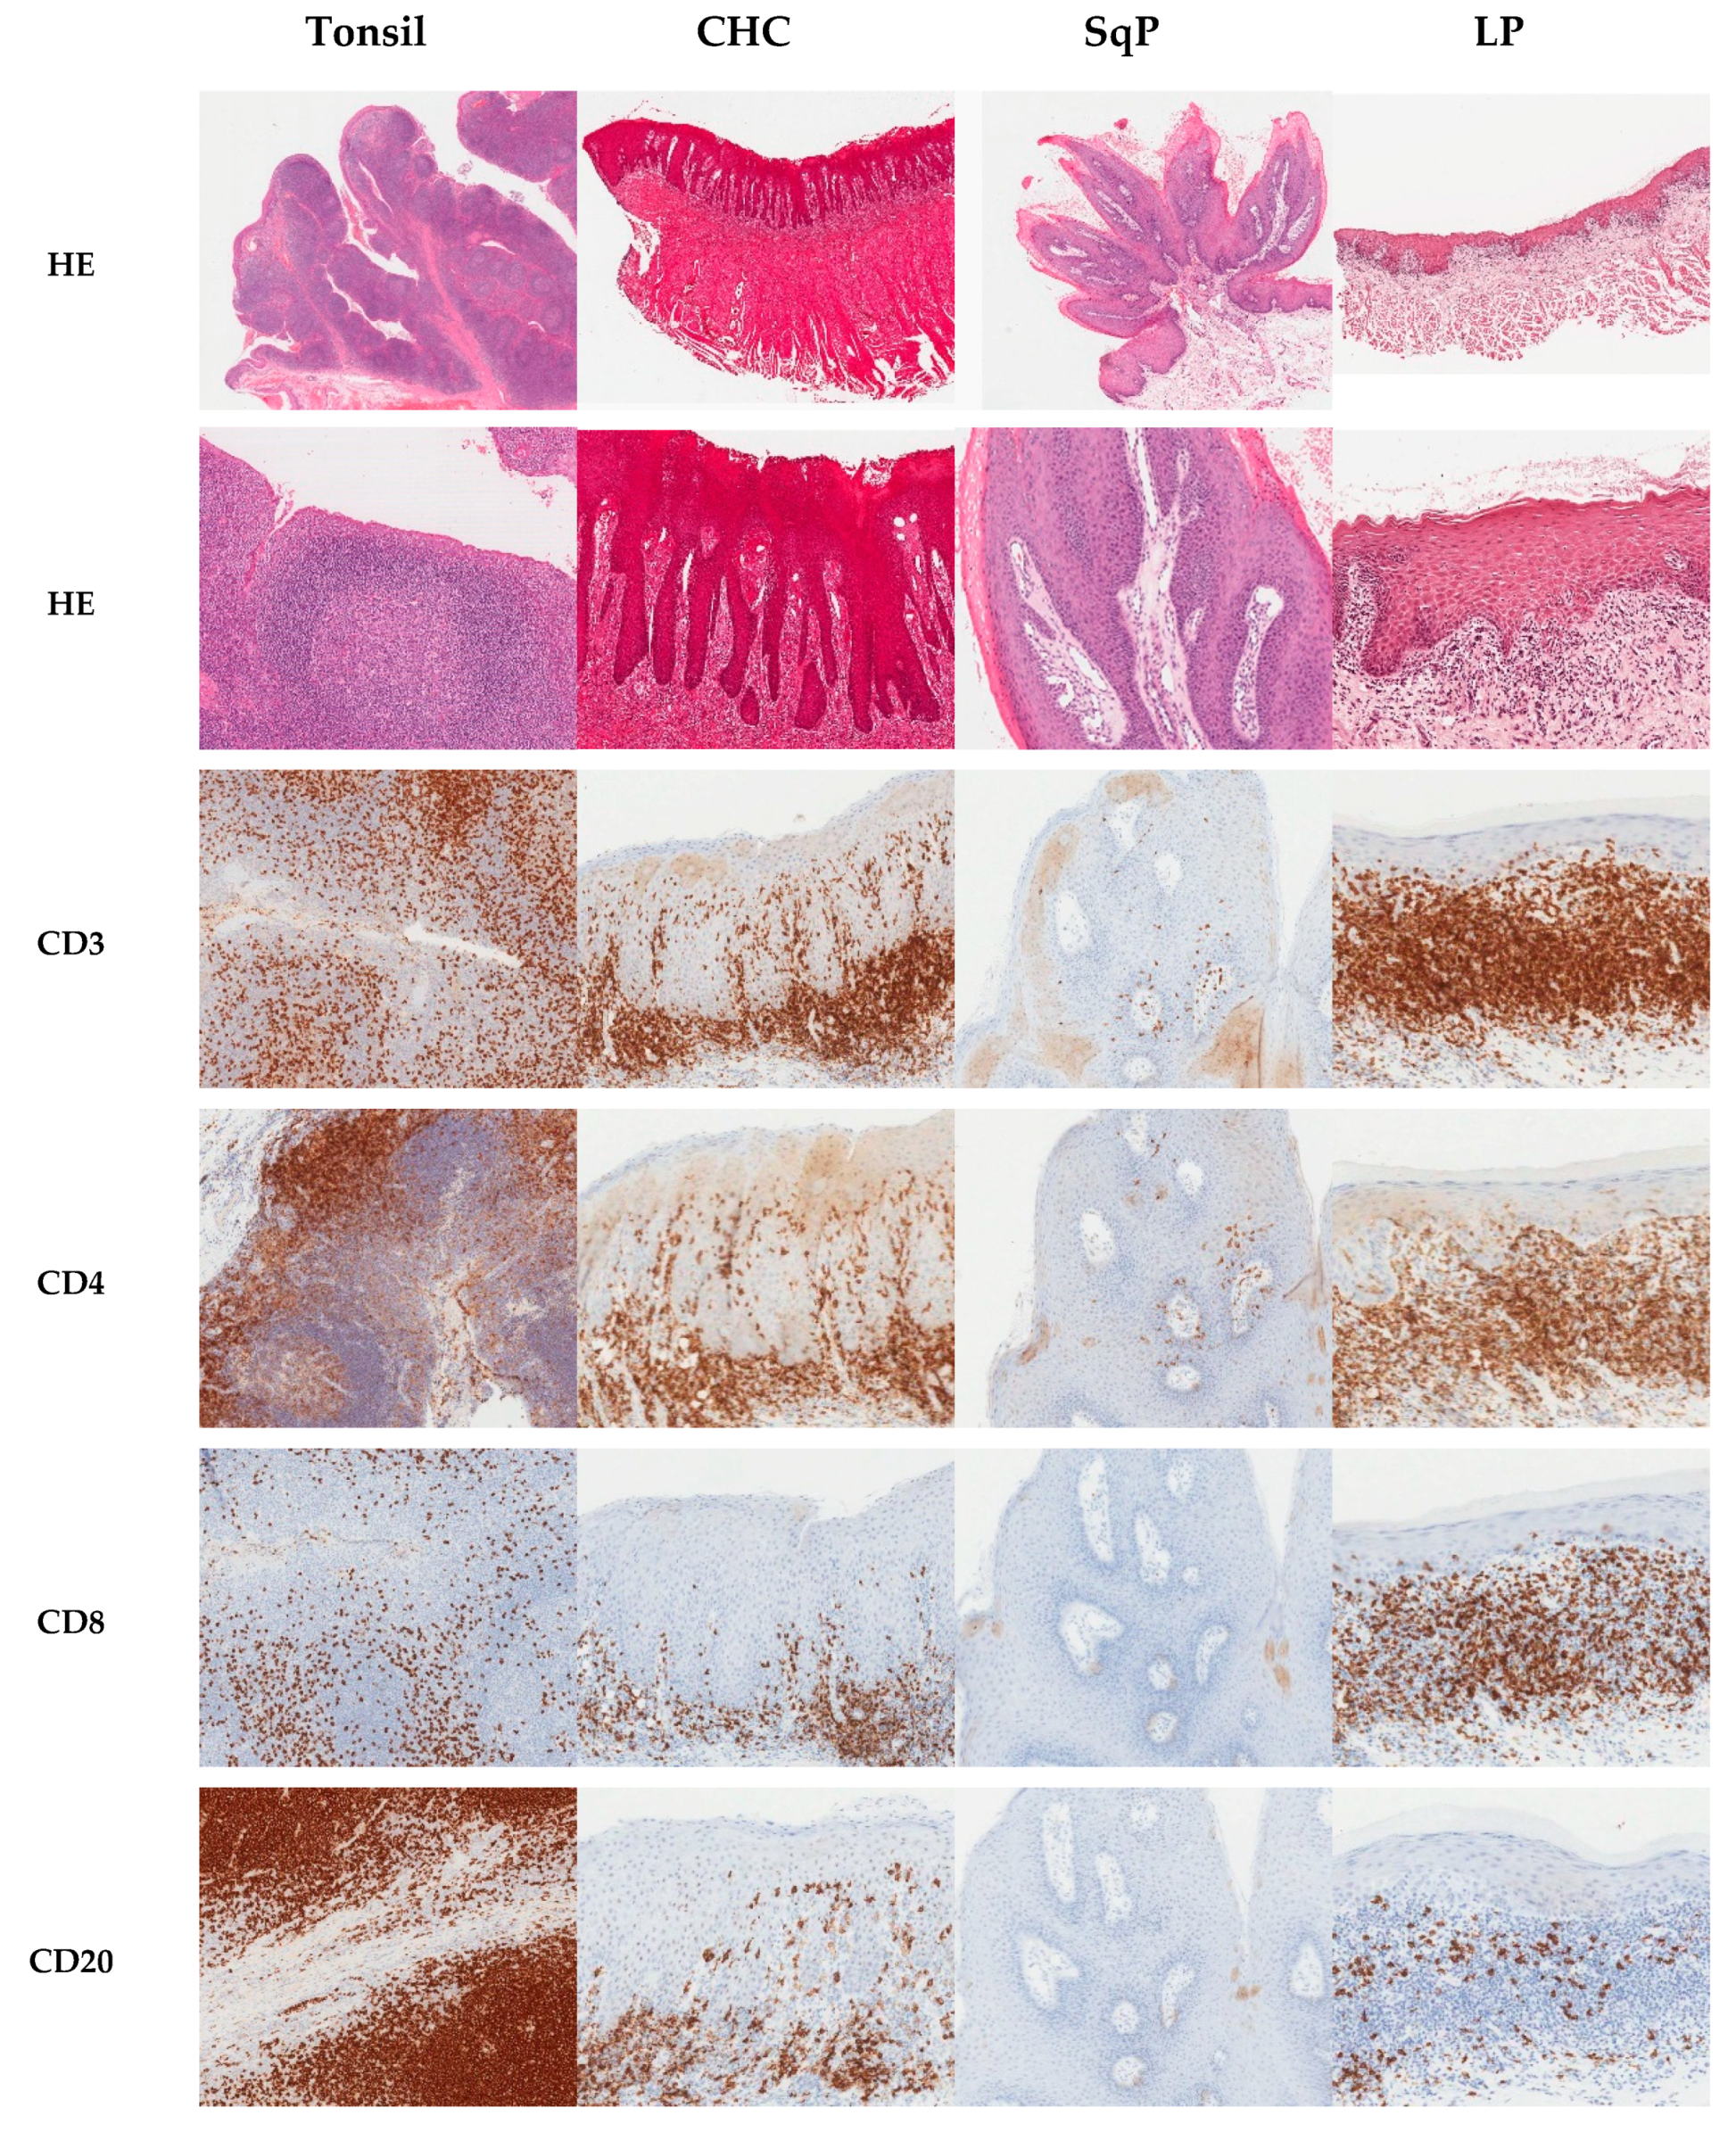
2.1. Immunohistochemical Analysis

Analyses were undertaken by two assessors, and intraclass correlation coefficient testing revealed consistent scoring (kappa score 0.990). Figure 1 illustrates the typical immunohistochemical staining of the targeted cell types for the different tissue types. Tonsil tissue was included as an immunohistochemistry control, whilst squamous papilloma with secondary Candida infection served as Candida controls. The oral lichen planus tissue provided a negative control for Candida presence, as well as a positive control for inflammation.

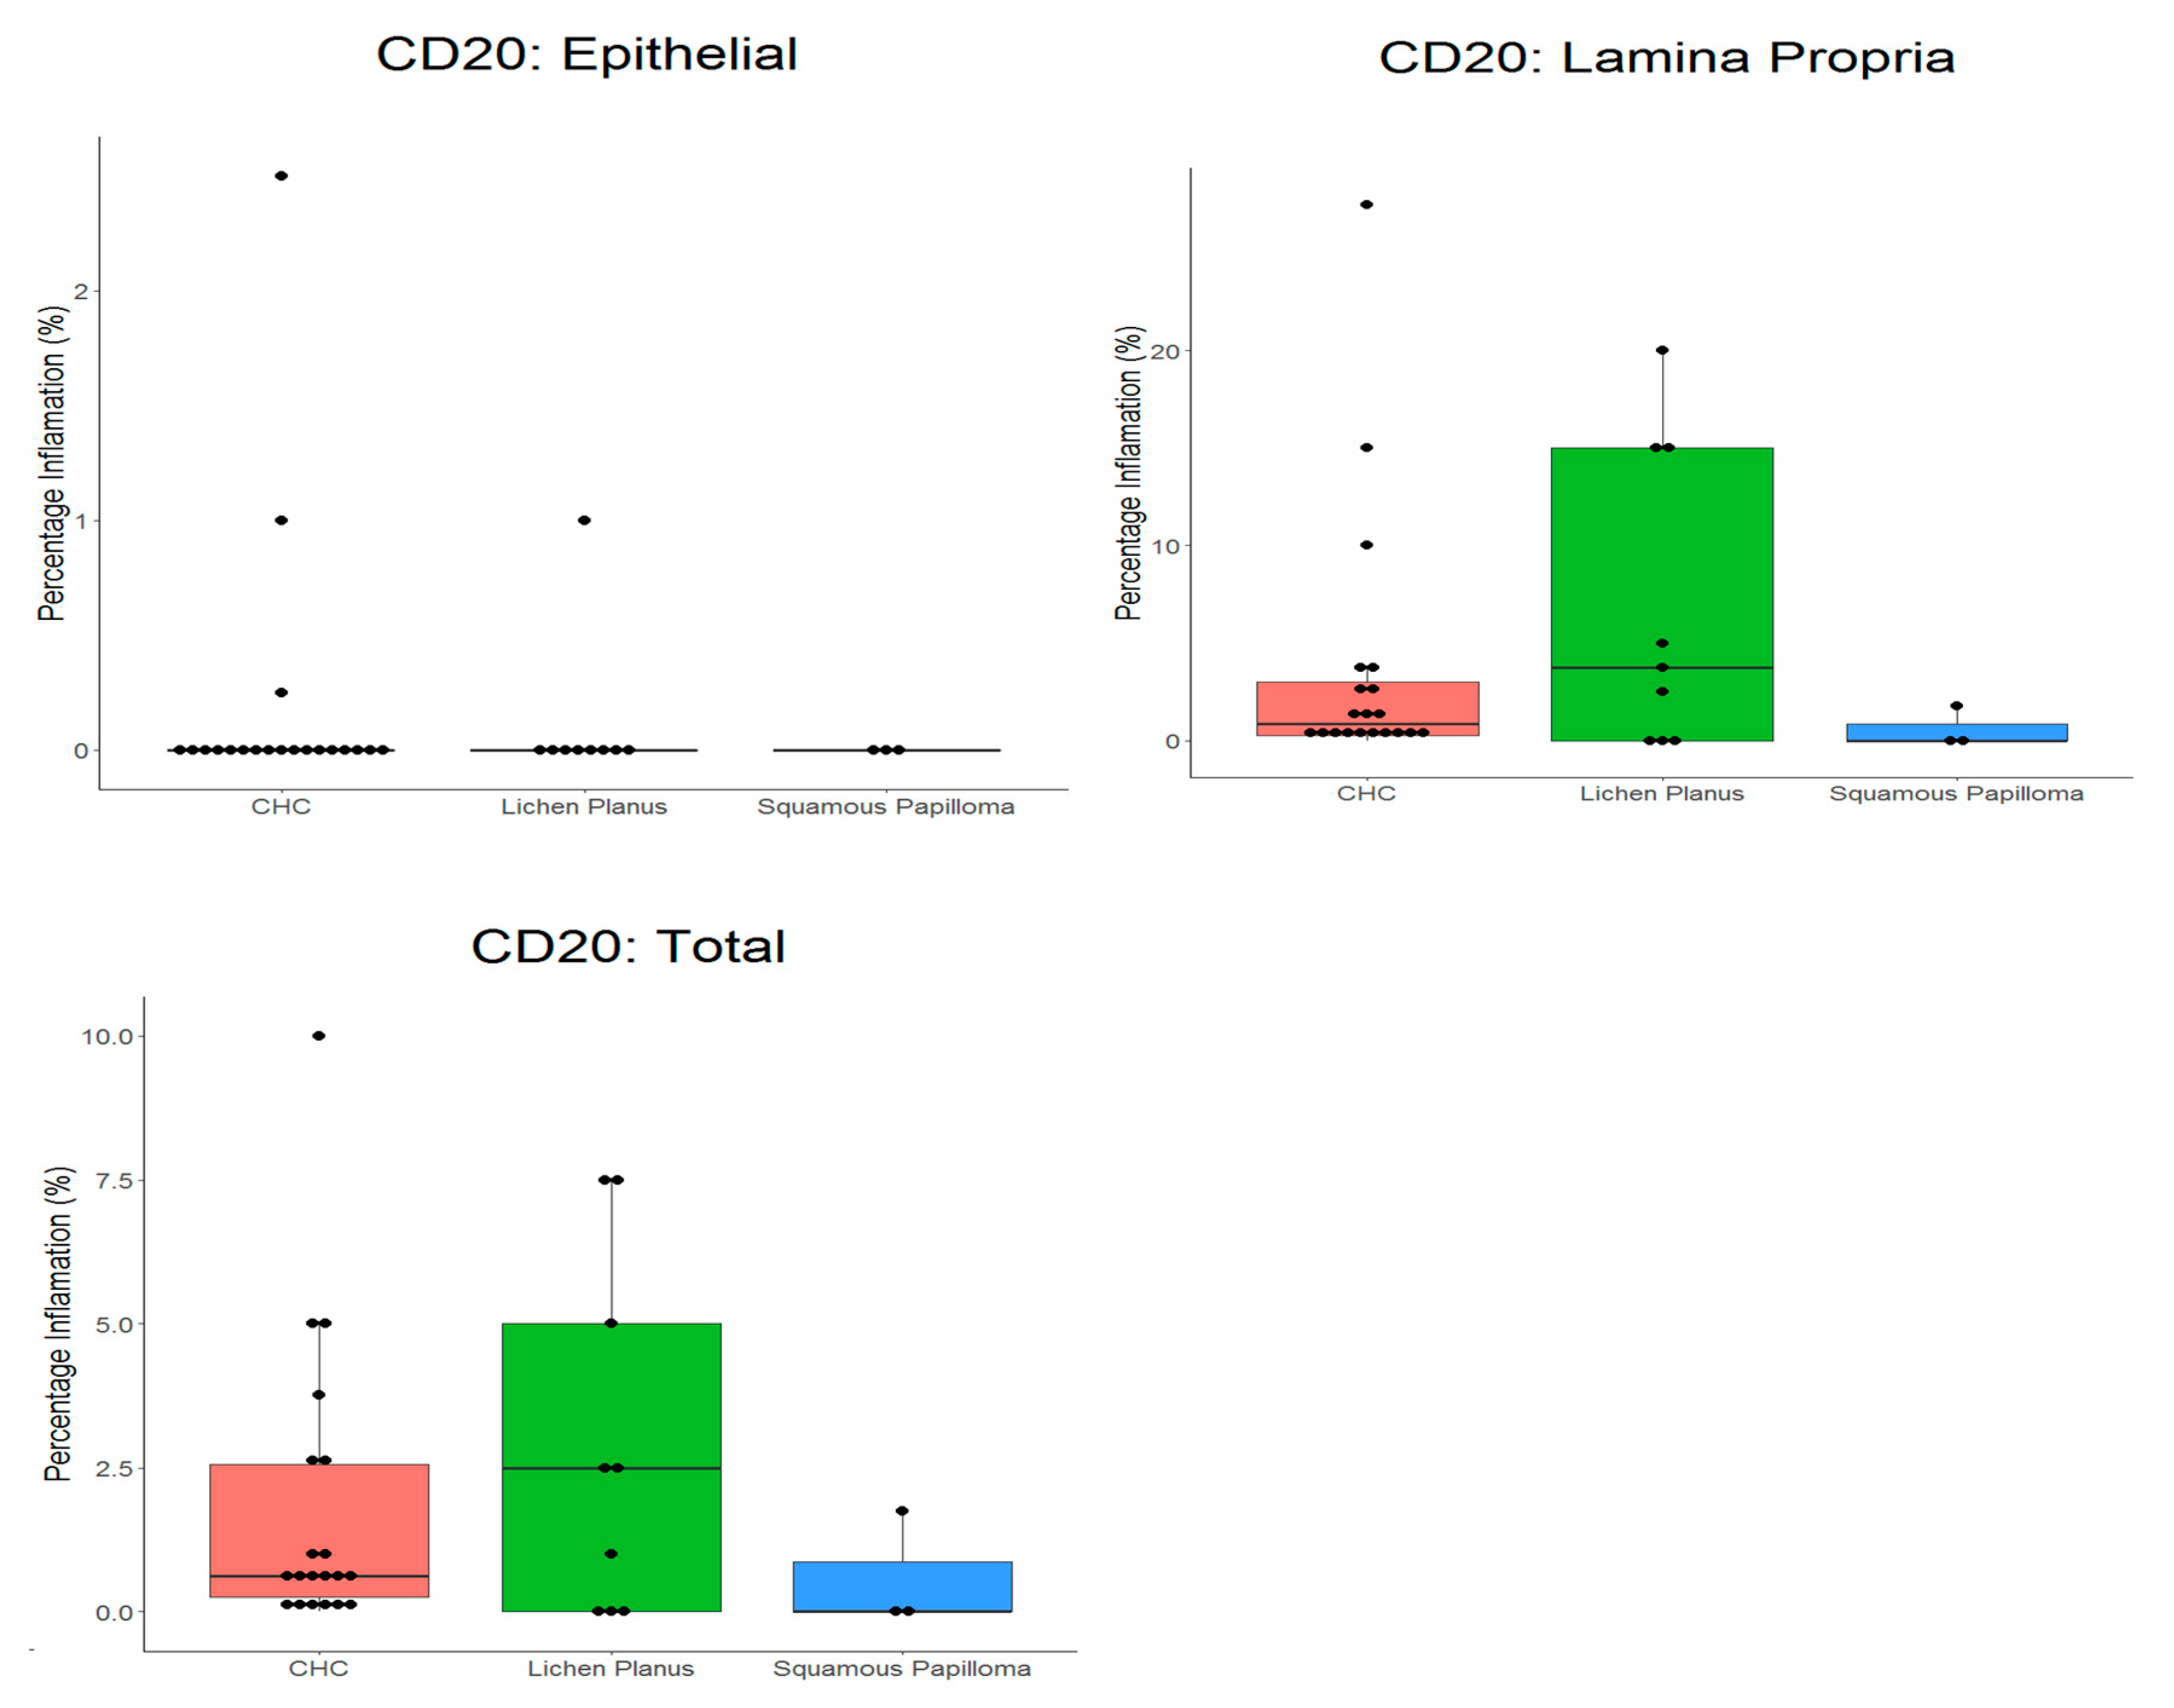
2.2. Proportion of CD3+ and CD20+ Cells in Tissues

The mean percentages (compared with total cells) of CD3+ and CD20+ cells in tissues are presented in Table 1 and Figure 2, and Table 2 and Figure 3, respectively. For all tissues, there was a significantly (p < 0.0001) higher proportion of T cells compared with B cells. CD3+ cells detected in all tissues, although a significant difference (p = 0.0281) in the proportion of these cells occurred between tissues types. The highest proportion of CD3+ cells was in oral lichen planus (33.3%) and lowest in squamous papilloma (4.9%). In CHC, the highest proportion of CD3+ cells was in the lamina propria (32.6%), with only a small proportion occurring in the epithelium (3.9%).
All tissues had low levels of CD20+ cells (Table 2 and Figure 3), and there was no significant difference (p = 0.3908) between tissue types. The highest proportion of CD20+ cells occurred in oral lichen planus (2.9%) and lowest in squamous papilloma (0.6%).
For CHC, a mean proportion of CD3+ cells of 15.6% was evident, compared with 1.7% for CD20+ cells. In oral lichen planus, a significantly (p < 0.0001) higher proportion of CD3+ cells (33.3%) than CD20+ cells (2.9%) was evident.

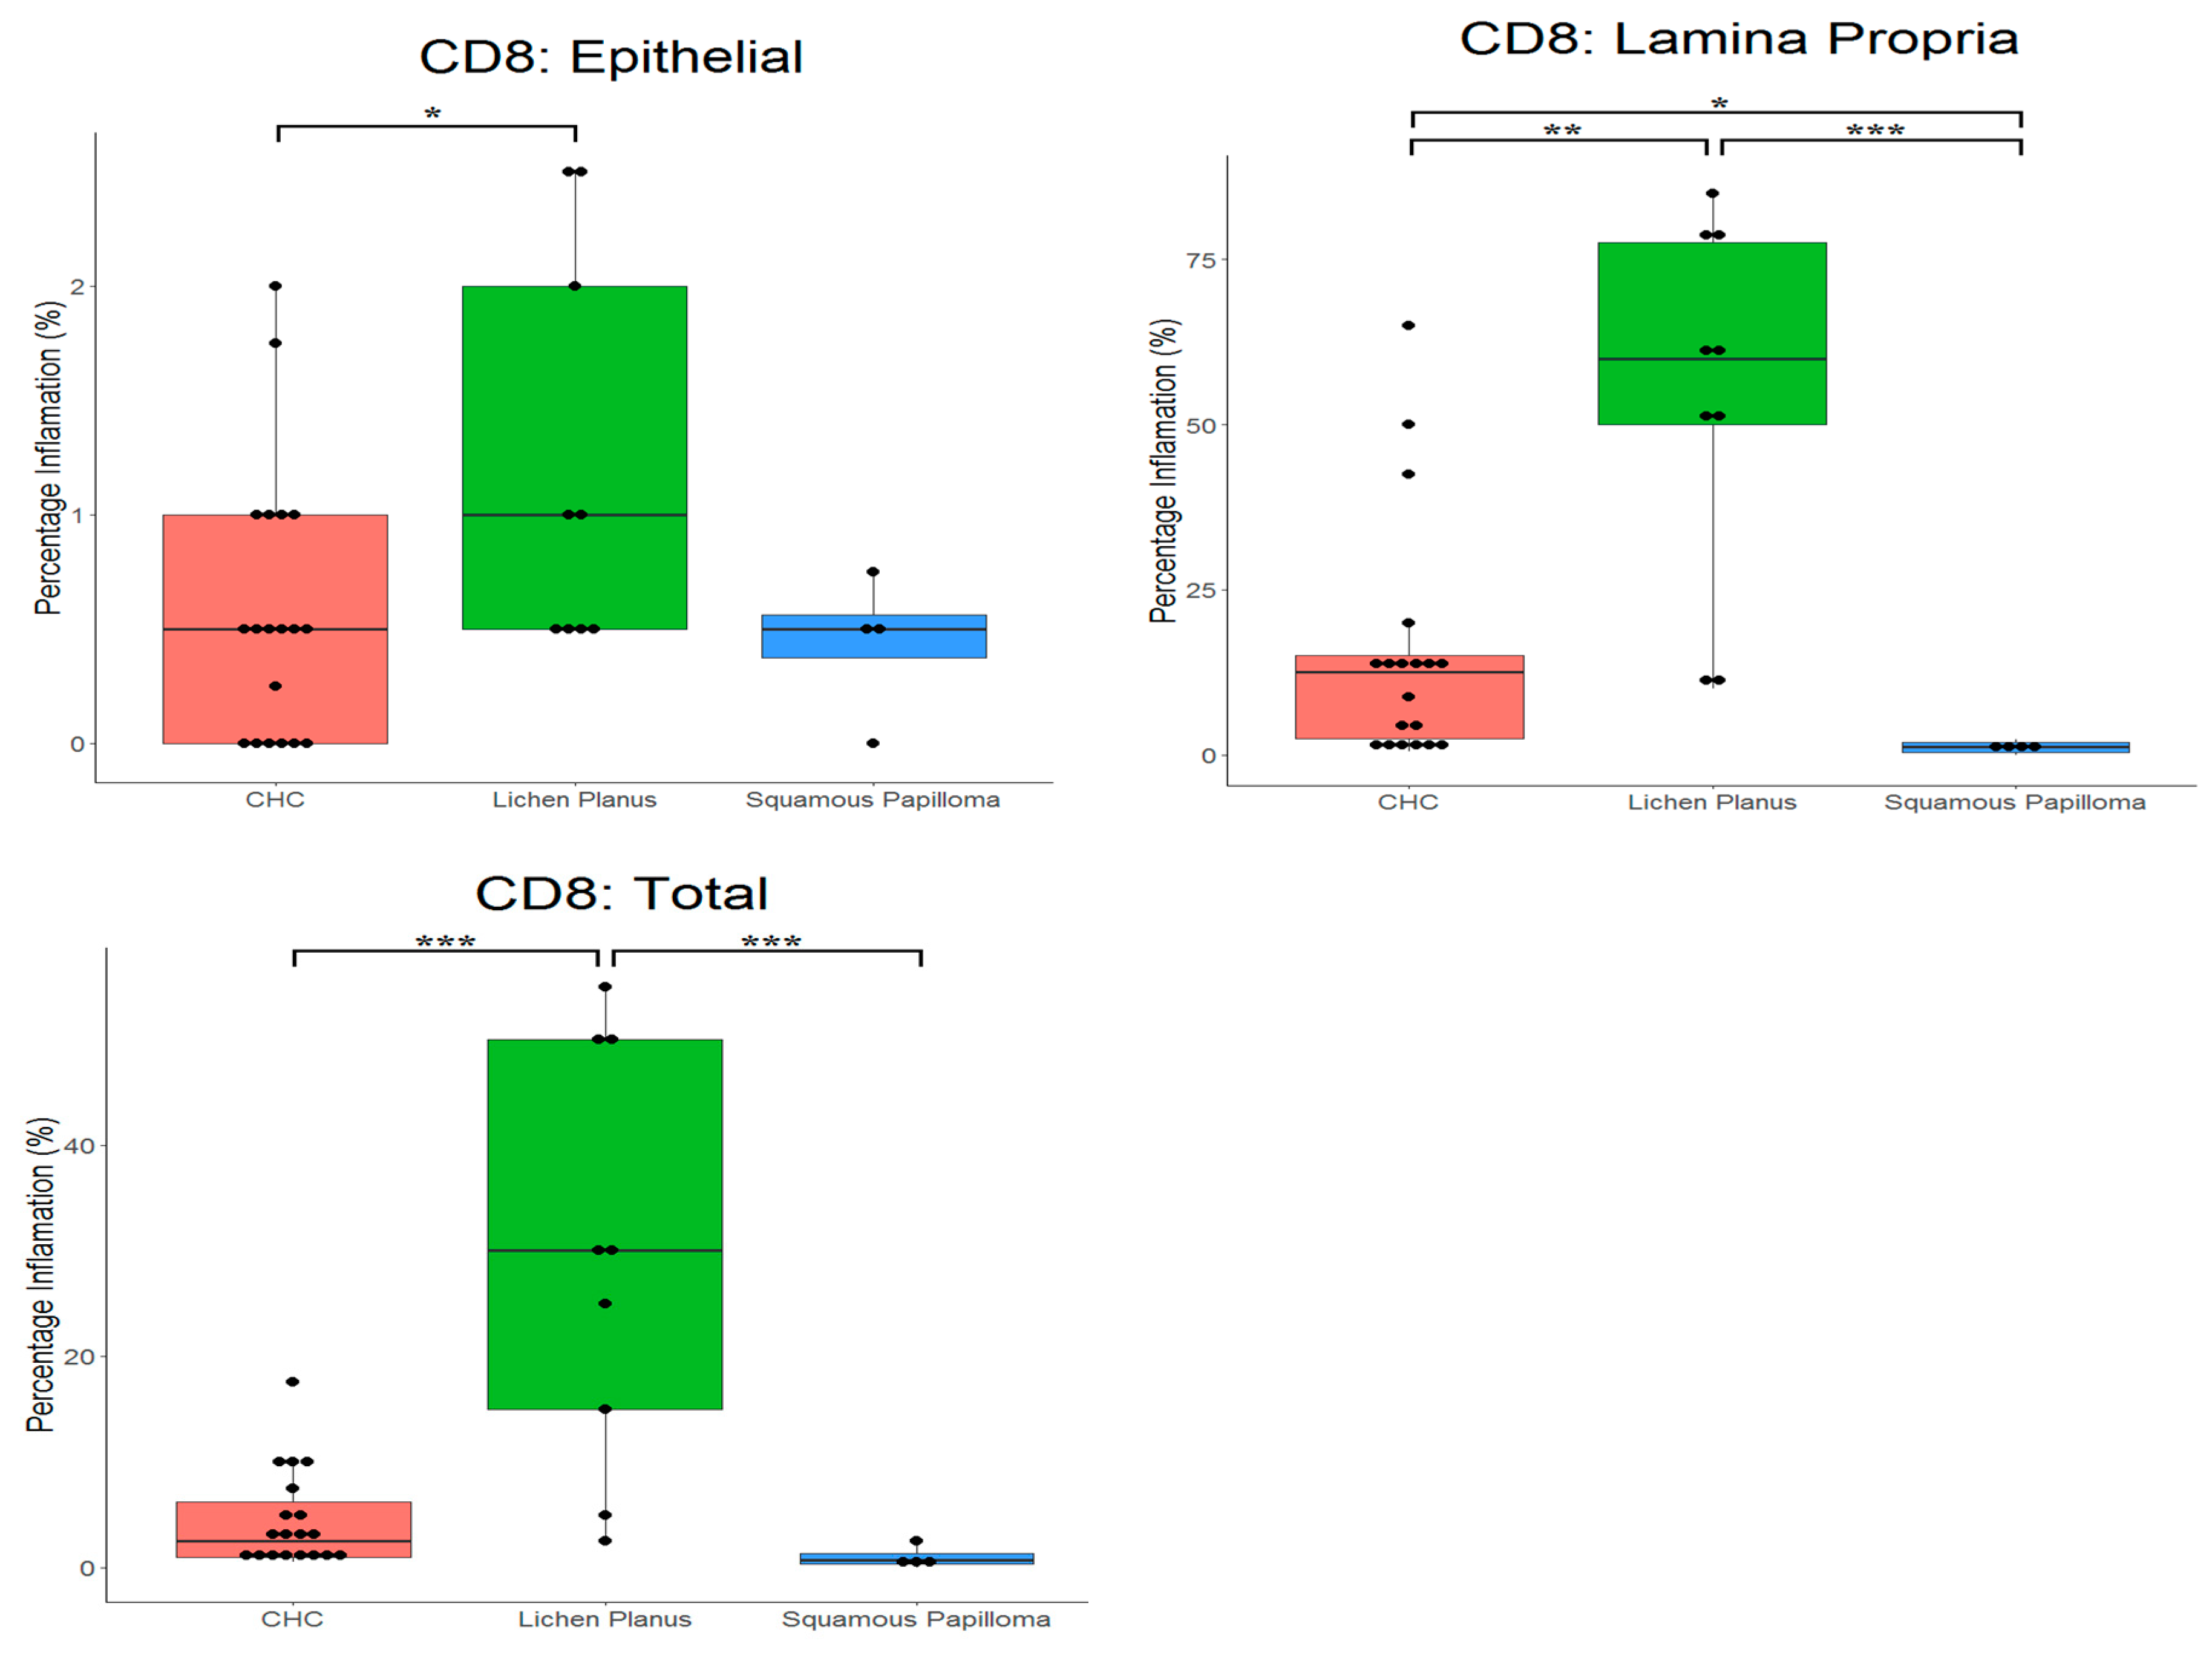
2.3. Proportion of CD4+ and CD8+ Cells in Tissues

Table 3 and Figure 4, and Table 4 and Figure 5, present the mean proportions of CD4+ and CD8+ cells in tissues, respectively. There were significant differences in proportions of CD4+ cells (p = 0.0430) for the different tissues. CD4+ cells had highest prevalence in the lamina propria of oral lichen planus (54.6%) compared with CHC (23.0%). The lowest proportion of CD4+ cells was in squamous papilloma (7.4%). Significant differences in proportions of CD4+ cells between tissue types occurred in the epithelium (p = 0.008), where these cells were more prevalent in CHC (3.2%) compared with both oral lichen planus (0.7%) and squamous papilloma (1.0%).
The proportion of CD8+ cells was also significantly different between tissue types (p < 0.001). CD8+ cells were most prevalent in the lamina propria of oral lichen planus (54.4%) compared with CHC (15.0%) and squamous papilloma (1.1%). No significant differences in the number of CD8+ cells in the epithelium was evident. In the case of CHC, a significantly (p < 0.0001) higher proportion of CD4+ cells (9.0%) was evident compared with CD8+ cells (4.4%).

3. Discussion

The primary aim of this study was to characterise the inflammatory cell infiltrate in CHC, which, to date, has not been widely investigated. CHC is an important form of oral candidosis, given its potential association with malignant transformation at lesional sites. This study applied immunohistochemistry to sections of archival CHC biopsy tissue and targeted four types of immune cells, namely CD3+ (T cells), CD20+ (B cells), CD4+ (T helper cells), and CD8+ (cytotoxic T cells) cells. Using this approach, it was possible, for the first time, to identify subsets of T cells in CHC.
As anticipated, given its chronic inflammatory nature [17], oral lichen planus had the highest levels of both T and B cells. The results did, however, show that the proportion of CD4+ cells was higher (34.0%) than CD8+ cells (29.2%), which could reflect level of disease activity. It is not uncommon for squamous papilloma to be secondarily infected by Candida and, interestingly, limited host immune responses tend to occur in such cases [18]. This finding was supported by the results of the present study, where squamous papilloma tissues had the lowest levels of both T and B cells. In contrast, CHC tissues had higher proportions of both T helper (CD4+) and cytotoxic T cells (CD8+) in the lamina propria compared with squamous papilloma, suggesting that the host immune response differed between the conditions and was likely dependent on Candida infection.
The importance of CD4+ cells in protection against oral candidosis is highlighted by higher disease incidence in individuals with reduced CD4+ cell numbers [19]. CHC does, however, occur in people who are not thought to have lowered CD4+ cell numbers or function. Chromophore analysis of tissue from oropharyngeal candidosis has previously indicated that the majority of T cells were CD8+, rather than CD4+ cells [19]. In contrast, in immunodeficient transgenic mice with oral and gastrointestinal candidosis, the immune response was primarily mediated by CD4+ Th1 cells [20].
A previous study of CHC inflammatory cells used polyclonal rabbit antibodies, and analysed infiltration of T cells, B cells, and plasma cells in CHC [7]. The findings of this present study were similar, with higher CD3+ cell numbers relative to CD20+ cells being encountered. There was also agreement between the two studies regarding the higher density of the inflammatory cell infiltrate in the lamina propria compared with the epithelium. However, this present study was also able to determine the type of T cell present in the inflammatory infiltrate and found it to be predominantly driven by T helper cells rather than cytotoxic T cells. Ascertaining the subtypes of these T helper cells was not undertaken, but future study could focus on cytokine and interleukin (IL) expression by the T helper (Th) cells, which would be indicative Th1 (interferon-γ), Th2 (IL-4 and IL-5), Th17 (IL-17 and IL-22), and Treg (Foxp3 and IL-35) cells. As plasma cells containing IgG are also known to be in abundance in the lamina propria in oral candidosis [7], detection of CD79a and CD138 positive cells could offer improved understanding of the plasma cell infiltrate in these infections.

4. Materials and Methods

4.1. Tissue Samples

Prior to commencement of this research, tissue biopsies from patients attending the Cardiff University School of Dentistry were obtained for diagnostic purposes. Pathological diagnoses for the tissues was established by the resident consultant pathologist. Ethical approval for this research was obtained (IRAS approved for Project ID: 136258) and permission also provided by the Cardiff and Vale University Health Board R&D (approval received 14/DEN/5953).
An alphanumeric code was used to blind researchers to patient ID and diagnostic tissue type during the study. After data were analysed, the tissue conditions were revealed so the data could be interpreted with respect to their pathology. The tissue types studied (Table 5) were chronic hyperplastic candidosis (n = 20), squamous papilloma (n = 4, positive control for Candida with secondary Candida colonisation), oral lichen planus (n = 10, negative control for Candida and positive control for inflammation, a non-Candida-associated mucocutaneous inflammatory condition), and tonsil (n = 1, positive control for inflammation and appropriate antibody reaction).

4.2. Immunohistochemistry

Tissue sections were initially stained with haematoxylin and eosin (HE) using an automated slide staining system (Linistain, Thermo Scientific, Paisley, UK). Following HE staining, tissues were stained using the primary antibodies against human CD3, CD20, CD4, and CD8. Antibodies were all mouse monoclonal antibodies, with the exception of CD3 antibody, which was a rabbit antibody. All antibodies were obtained from Dako and were used without dilution to label tissues for 20 min. Antibody detection used the Dako Flex Envision™ + kit as recommended by the manufacturer. Negative controls included all tissue processing steps, apart from inclusion of primary antibody. Images of stained sections were obtained and digitised using an Aperio system (Leica Microsystems Ltd, Milton Keynes, UK).

4.3. Histopathological Analysis of Stained Tissues

Using the Aperio Imagescope, histopathological analysis of the stained tissue sections was performed. For each tissue section, digital ‘demarcation’ was made between the epithelium and the lamina propria/corium (Figure 6). The tissue section was then further divided into equal portions across the epithelium and lamina propria. In each portion, estimation was made of the percentage of cells stained (relative to the total cell population) with CD3+, CD4+, CD8+, or CD20+ specific antibodies. Analysis was performed for all tissue sections by two researchers.

4.4. Statistical Analysis

The median average over repeated measurements within each slide was found for the epithelial, lamina propria, and ‘total’ (i.e., both epithelium and lamina propria) tissues separately in order to form the data for the main analysis (i.e., for each slide). Data were then explored initially by using descriptive statistics (mean, median, and standard deviations) evaluated over all slides and by using graphical box plots with dot plots of the "raw" data superimposed. Normality was assessed by using histograms, normal plots, and the Shapiro–Wilk and Kolgorov–Smirnov tests in SPSS V25. As non-normality could not be ruled out in many cases, differences between groups were assessed by using non-parametric one-way ANOVA (Kruskal–Wallis test), followed by Dunn’s post-hoc test in all cases by using the statistical software package R V3.30.

5. Conclusions

Understanding the host immune response in CHC is important, as CHC is potentially a pre-malignant condition, and this information could serve as both a diagnostic tool for CHC and also allow us to monitor the host for potential immune factors associated with CHC. From the research, significant differences in levels of CD3+, CD4+, CD8+, and CD20+ cells were found between the three tissue types studied. The highest levels of inflammatory cells occurred in oral lichen planus, and the lowest in squamous papilloma. CHC was shown to predominantly be a T helper cell response in the lamina propria, as opposed to a cytotoxic T cell response. Further research is needed to ascertain the subsets of these T helper cells.

Author Contributions

A.W. was responsible for analysing the immunohistochemistry profiles and writing the original draft preparation. A.J. and D.W. were responsible for conceptualisation of this research, data interpretation, and reviewing and editing the draft manuscript. S.W. and H.R. were responsible for the immunohistochemistry and editing the draft. M.L. and X.W. contributed to study design, project supervision, and editing the draft. D.F. was responsible for statistical analyses, data interpretation, and editing the draft.

Funding

This research received no external funding.

Acknowledgments

The authors wish to acknowledge the support received for Helen Rogers through receipt of a Wallport Fellowship.

Conflicts of Interest

The authors declare no conflicts of interest.

References

  1. Tsui, C.; Kong, E.F.; Jabra-Rizk, M.A. Pathogenesis of Candida albicans biofilm. Pathog. Dis. 2016, 74, ftw018. [Google Scholar] [CrossRef] [PubMed]
  2. Williams, D.; Lewis, M. Pathogenesis and treatment of oral candidosis. J. Oral Microbiol. 2011, 3. [Google Scholar] [CrossRef] [PubMed]
  3. Millsop, J.; Fazel, N. Oral candidiasis. Clin. Dermatol. 2016, 34, 487–494. [Google Scholar] [CrossRef] [PubMed]
  4. Frimpong, P.; Amponsah, E.; Abebrese, J.; Kim, S. Oral manifestations and their correlation to baseline CD4 count of HIV/AIDS patients in Ghana. J. Korean Assoc. Oral Maxillofac. Surg. 2017, 43, 29–36. [Google Scholar] [CrossRef] [PubMed]
  5. Bakri, M.M.; Hussaini, H.M.; Holmes, R.A.; Cannon, D.R.; Rich, M.A. Revisiting the association between candidal infection and carcinoma, particularly oral squamous cell carcinoma. J. Oral Microbiol. 2010, 21, 2. [Google Scholar]
  6. Sitheeque, M.; Samaranayake, L. Chronic hyperplastic candidosis/candidiasis (candidal leukoplakia). Crit. Rev. Oral Biol. Med. 2003, 14, 253–267. [Google Scholar] [CrossRef] [PubMed]
  7. Williams, D.; Potts, A.; Wilson, M.; Matthews, J.; Lewis, M. Characterisation of the inflammatory cell infiltrate in chronic hyperplastic candidosis of the oral mucosa. J. Oral Pathol. Med. 1997, 26, 83–89. [Google Scholar] [CrossRef] [PubMed]
  8. Netea, M.G.; Joosten, L.A.; van der Meer, J.W.; Kullberg, B.J.; van de Veerdonk, F.L. Immune defence against Candida fungal infections. Nat Rev. Immunol. 2015, 15, 630–642. [Google Scholar] [CrossRef] [PubMed]
  9. Richardson, J.P.; Moyes, D.L. Adaptive immune responses to Candida albicans infection. Virulence 2015, 6, 327–337. [Google Scholar] [CrossRef] [PubMed]
  10. Trautwein-Weidner, K.; Gladiator, A.; Kirchner, F.; Becattini, S.; Rülicke, T.; Sallusto, F.; LeibundGut-Landmann, S. Antigen-specific Th17 cells are primed by distinct and complementary dendritic cell subsets in oropharyngeal candidiasis. PLoS Pathog. 2015, 11, e1005164. [Google Scholar] [CrossRef] [PubMed]
  11. Swidergall, M.; Solis, N.V.; Lionakis, M.S.; Filler, S.G. EphA2 is an epithelial cell pattern recognition receptor for fungal β-glucans. Nat. Microbiol. 2018, 3, 53–61. [Google Scholar] [CrossRef] [PubMed]
  12. Moyes, D.L.; Runglall, M.; Murciano, C.; Shen, C.; Nayar, D.; Thavaraj, S.; Kohli, A.; Islam, A.; Mora-Montes, H.; Challacombe, S.J.; et al. A biphasic innate immune MAPK response discriminates between the yeast and hyphal forms of Candida albicans in epithelial cells. Cell Host Microbe 2010, 8, 225–235. [Google Scholar] [CrossRef] [PubMed]
  13. Sekelova, Z.; Polansky, O.; Stepanova, H.; Fedr, R.; Faldynova, M.; Rychlik, I.; Vlasatikova, L. Different roles of CD4, CD8 and γδ T-lymphocytes in naive and vaccinated chickens during Salmonella enteritidis infection. Proteomics 2017, 17. [Google Scholar] [CrossRef] [PubMed]
  14. Conti, H.; Gaffen, S. Host responses to Candida albicans: Th17 cells and mucosal candidiasis. Microbes Infect. 2010, 12, 518–527. [Google Scholar] [CrossRef] [PubMed]
  15. Levitz, S.M. Overview of host defenses in fungal infections. Clin. Infect. Dis. 1992, 14 (Suppl. 1), S37–S42. [Google Scholar] [CrossRef] [PubMed]
  16. Burnie, M.R.J. Antifungal antibodies: A new approach to the treatment of systemic candidiasis. Curr. Opin. Investig. Drugs 2001, 2, 472–476. [Google Scholar]
  17. Lavanya, N.; Rao, U.; Jayanthi, P.; Ranganathan, K. Oral lichen planus: An update on pathogenesis and treatment. J. Oral Maxillofac. Pathol. 2011, 15, 127–132. [Google Scholar] [CrossRef] [PubMed]
  18. Barrett, A.; Kingsmill, V.; Speight, P. The frequency of fungal infection in biopsies of oral mucosal lesions. Oral Dis. 1998, 4, 26–31. [Google Scholar] [CrossRef] [PubMed]
  19. Myers, T.; Leigh, J.; Arribas, A.; Hager, S.; Clark, R.; Lilly, E.; Fidel, P.L., Jr. Immunohistochemical evaluation of T cells in oral lesions from human immunodeficiency virus-positive persons with oropharyngeal candidiasis. Infect. Immun. 2003, 71, 956–963. [Google Scholar] [CrossRef] [PubMed]
  20. Naglik, J.; Fidel, P.; Odds, F. Animal models of mucosal Candida infection. FEMS Microbiol. Lett. 2008, 283, 129–139. [Google Scholar] [CrossRef] [PubMed] [Green Version]
Figure 1. Composite image of haematoxylin and eosin (HE) and immunohistochemical staining of sections of tonsil, chronic hyperplastic candidosis (CHC), squamous papilloma (SqP), and oral lichen planus (LP). Immunohistochemical staining was for T cells (CD3+), T helper cells (CD4+), cytotoxic T cells (CD8+), and B cells (CD20+).. Original magnification x100, except for first row of HE stained sections, which was x20.
Pathogens 08 00232 g001
Figure 2. Box plots with the ‘raw’ data points superimposed, showing percentage of T cells (CD3+) in tissue types. CHC, chronic hyperplastic candidosis. * indicates p < 0.05, ** indicates p < 0.01, *** indicates p < 0.001.
Pathogens 08 00232 g002
Figure 3. Box plot with the ‘raw’ data points superimposed, showing percentage of B cells (CD20+) in tissue types. CHC, chronic hyperplastic candidosis.
Pathogens 08 00232 g003
Figure 4. Box plot with the ‘raw’ data points superimposed, showing percentage of T helper (CD4+) in tissue types. CHC, chronic hyperplastic candidosis. * indicates p < 0.05, ** indicates p < 0.01.
Pathogens 08 00232 g004
Figure 5. Box plots with the ‘raw’ data points superimposed, showing percentage of cytotoxic T cells (CD8+) in tissue types. CHC, chronic hyperplastic candidosis. * indicates p < 0.05, ** indicates p < 0.01, *** indicates p < 0.001.
Pathogens 08 00232 g005
Figure 6. Haematoxylin and eosin stain of chronic hyperplastic candidosis illustrating delineation between (A) epithelium and (B) lamina propria/corium. Scale bar (bottom left) equals 0.5 mm.
Pathogens 08 00232 g006
Table 1. Summary of proportions of T cells (CD3+) cells in tissue sections. CHC, chronic hyperplastic candidosis; LP, oral lichen planus; SqP, squamous papilloma.
CHC
(n = 20)
LP
(n = 10)
SqP
(n = 4)
EpitheliumMean3.90.94.9
Median3.80.82.0
SD2.60.66.9
Lamina PropriaMean32.667.22.9
Median33.875.00.6
SD22.229.24.7
TotalMean15.633.34.9
Median15.030.02.1
SD9.124.16.9
Table 2. Summary of proportions of B cells (CD20+) in tissue sections. CHC, chronic hyperplastic candidosis; LP, oral lichen planus; SqP, squamous papilloma.
CHC
(n = 20)
LP
(n = 10)
SqP
(n = 4)
EpitheliumMean0.20.10.0
Median0.00.00.0
SD0.60.30.0
Lamina PropriaMean3.66.80.6
Median0.93.80.0
SD6.87.71.0
TotalMean1.82.90.6
Median0.62.50.0
SD2.53.11.0
Table 3. Summary of proportions of T helper (CD4+) cells in tissue sections. CHC, chronic hyperplastic candidosis; LP, oral lichen planus; SqP, squamous papilloma.
CHC
(n = 20)
LP
(n = 10)
SqP
(n = 4)
EpitheliumMean3.20.71.0
Median2.00.50.5
SD3.80.51.1
Lamina PropriaMean23.154.615.9
Median17.565.01.0
SD23.331.830.4
TotalMean9.034.07.4
Median5.035.01.0
SD7.228.812.8
Table 4. Summary of proportions of cytotoxic T cells (CD8+) in tissue sections. CHC, chronic hyperplastic candidosis; LP, oral lichen planus; SqP, squamous papilloma.
CHC
(n = 20)
LP
(n = 10)
SqP
(n = 4)
EpitheliumMean0.61.20.4
Median0.51.00.5
SD0.60.90.3
Lamina PropriaMean15.054.41.1
Median12.560.01.1
SD18.127.31.1
TotalMean4.429.11.0
Median2.530.00.8
SD4.619.51.1
Table 5. Summary of oral pathology tissue types studied and their site of origin.
Number of Each Oral Pathology Type(s) *
Oral site of tissueChronic hyperplastic candidosisLichen planusSquamous papiloma
Buccal mucosa46
Tongue833
Commisure7
Lips1 1
Gingiva 1
Total20104
* Tonsil tissue sections were included for antibody/inflammatory controls and were not used for comparison.

