Article

Population Genetic Structure and Hybridization of Schistosoma haematobium in Nigeria

1
Department of Biology, Alex Ekwueme Federal University, Ndufu-Alike, Abakaliki PMB 1010, Nigeria
2
IHPE, University Montpellier, CNRS, Ifremer, University Perpignan Via Domitia, F-66000 Perpignan, France
3
Department of Zoology, Nnamdi Azikiwe University, Akwa PMB 5025, Nigeria
4
Department of Microbiology, Alex Ekwueme Federal University, Ndufu-Alike, Abakaliki PMB 1010, Nigeria
*
Author to whom correspondence should be addressed.
Pathogens 2022, 11(4), 425; https://doi.org/10.3390/pathogens11040425
Submission received: 2 February 2022 / Revised: 24 March 2022 / Accepted: 29 March 2022 / Published: 31 March 2022
(This article belongs to the Special Issue Schistosomiasis: Host-Pathogen Biology)

Abstract

:
Background: Schistosomiasis is a major poverty-related disease caused by dioecious parasitic flatworms of the genus Schistosoma with a health impact on both humans and animals. Hybrids of human urogenital schistosome and bovine intestinal schistosome have been reported in humans in several of Nigeria’s neighboring West African countries. No empirical studies have been carried out on the genomic diversity of Schistosoma haematobium in Nigeria. Here, we present novel data on the presence and prevalence of hybrids and the population genetic structure of S. haematobium. Methods: 165 Schistosoma-positive urine samples were obtained from 12 sampling sites in Nigeria. Schistosoma haematobium eggs from each sample were hatched and each individual miracidium was picked and preserved in Whatman® FTA cards for genomic analysis. Approximately 1364 parasites were molecularly characterized by rapid diagnostic multiplex polymerase chain reaction (RD-PCR) for mitochondrial DNA gene (Cox1 mtDNA) and a subset of 1136 miracidia were genotyped using a panel of 18 microsatellite markers. Results: No significant difference was observed in the population genetic diversity (p > 0.05), though a significant difference was observed in the allelic richness of the sites except sites 7, 8, and 9 (p < 0.05). Moreover, we observed two clusters of populations: west (populations 1–4) and east (populations 7–12). Of the 1364 miracidia genotyped, 1212 (89%) showed an S. bovis Cox1 profile and 152 (11%) showed an S. haematobium cox1 profile. All parasites showed an S. bovis Cox1 profile except for some at sites 3 and 4. Schistosoma miracidia full genotyping showed 59.3% of the S. bovis ITS2 allele. Conclusions: This study provides novel insight into hybridization and population genetic structure of S. haematobium in Nigeria. Our findings suggest that S. haematobium x S. bovis hybrids are common in Nigeria. More genomic studies on both human- and animal-infecting parasites are needed to ascertain the role of animals in schistosome transmission.

1. Introduction

Schistosomiasis is one of the major neglected tropical diseases with public and veterinary health concerns and is endemic in tropical and subtropical regions. With a global burden of about 1.4 million disability-adjusted life years (DALYs), the disease is ranked second after malaria based on morbidity [1]. The Schistosoma genus shows a wide definitive host spectrum that ranges from humans to domestic and wild animals. Humans could be infected with one or more of the six human-infecting Schistosome species, and this may lead to combined disease symptoms and co-morbidities. Four human-infecting parasites (Schistosoma haematobium, S. mansoni, S. intercalatum, and S. guineensis) are common in Africa, while two (S. japonicum and S. mekongi) are prevalent in Asia [2]. Except for S. intercalatum, all schistosome species are known to infect domestic or wild mammalian animal hosts [3]. The disease is less recognized in the veterinary sector including livestock and wild animals [4].
In Africa, three species of schistosomes are concerned with livestock infection: S. bovis and S. mattheei infect members of the orders of Cetartiodactyla (mainly Bovidae), Rodentia, Primates, and Perissodactyla and S. curassoni infect members of the family of Bovidae [3]. There is little or no documentation available on the prevalence, intensity, repartition, transmission dynamics, and phylogeography of these livestock schistosomes [5,6]. In addition to their veterinarian importance, the animal infecting schistosomes have recently received peculiar interest due to their potential zoonotic importance through hybridization with human-infecting parasites. In Africa, hybrids between S. haematobium and the three livestock schistosomes have been evidenced in humans: S. haematobium x S. bovis [7,8,9], S. haematobium x S. mattheei [10,11], and S. haematobium x S. curassoni [12].
The hybrid from human uro-genital schistosome (S. haematobium) and bovine intestinal schistosome (S. bovis) is certainly the most studied hybrid form. S. haematobium x S. bovis hybrids have been reported in infected humans in several West African countries like Benin, Cote d’Ivoire, Mali, Niger, and Senegal [4,9]. No empirical studies have been carried out in Nigeria to identify the presence of hybrids as has been conducted in some of its neighboring countries. Hybrids are commonly identified based on a single nuclear and single mitochondrial marker. A discordance in species assignation on these two markers or the presence of animal parasite allele or haplotype in humans is thus generally considered a hybrid parasite. Based on such an approach, studies have shown hybridization between: S. haematobium and S. mansoni [13,14,15], S. haematobium and S. bovis, [7,9,12,16,17,18,19,20,21], S. haematobium and S. guineensis [22,23,24,25], S. haematobium and S. curassoni [12], or S. haematobium and S. mattheei [10,11,26].
If the presence/absence of S. haematobium hybrids have been assessed in some west African countries, the population genetic structure and diversity of this parasite have received less attention. Nevertheless, genomic introgression through hybridization is expected to influence both the genetic diversity and the population structure. Most population genetic studies have been conducted on S. mansoni and very few on S. haematobium. Some common features can be observed despite the Schistosoma species: such as few barriers to gene flow at a local scale or the most important genetic variation within than between definitive hosts [27]. However, S. haematobium is peculiar from other species because it presents less genetic diversity and less genetic structure compared to S. mansoni or S. bovis [27]. To date, a single study has analyzed both the hybrid status of the parasite using the nuclear/mitochondrial marker discordance approach and population genetic structure based on microsatellite markers [28]. This last study showed no clustering when parasites are grouped according to their hybrid versus pure status.
Our study aims to complete our knowledge of S. haematobium in the identification of the presence and prevalence of S. haematobium versus S. bovis hybrids in Nigeria on a large geographical scale as well as microsatellites genotyping to analyze the population genetic structure and diversity.

2. Results

2.1. Schistosome Genotyping Using Cox1 and ITS2

We obtained a total of 4007 miracidia from 165 Schistosoma-positive urine samples and analyzed 1364 successful miracidia. Of the 1364 miracidia, 1212 (89%) and 152(11%) showed an S. bovis Cox1 profile and S. haematobium Cox1 profile, respectively (Table 1). All studied sites except sites 3 and 4 showed 100% of Cox1 haplotypes. No miracidium was identified as an S. mansoni Cox1 profile. Full genotyping (i.e., Cox1 and ITS2 sequencing) was obtained from a sub-sample. The Schistosoma miracidia full genotyping showed 6 (5.1%) for the nuclear gene of S. haematobium (Sh x ShSh), 46 (39.0%) alleles were assigned to S. bovis (Sb x SbSb), and 66 (55.9%) alleles were assigned to S. bovis x S. haematobium hybrids (Sb x ShSh, Sb x SbSh, and Sh x ShSb), while no hybrid parasite was identified as Sh x SbSb genotype (Table 2).

2.2. Cox1 Phylogenetic Trees

On the 59 Cox1 sequences we have sequenced 21 different haplotypes: 2 S. haematobium and 19 S. bovis haplotypes. An S. bovis Cox1 phylogenetic tree performed with the haplotypes recovered from Nigeria and several other haplotypes from Cameroon, Benin, Senegal, Ivory Coast, Kenya, and Tanzania did not reveal any spatial structuration (see Supplementary Figure S2).

2.3. Microsatellite Analysis

No significant deviation from HW equilibrium or linkage disequilibrium was observed across loci. The genetic variability indices (He, A, Ar, and Fis) are shown in Table 3 from the 14 microsatellite loci. Mean heterozygosity across the population ranged from 0.527–0.598 but we did not observe any significant difference (p > 0.05). For allelic richness (Ar), the mean values ranged from 4.718–6.929. Significant differences were observed between site 9 and sites 2 to 4 (p < 0.05).

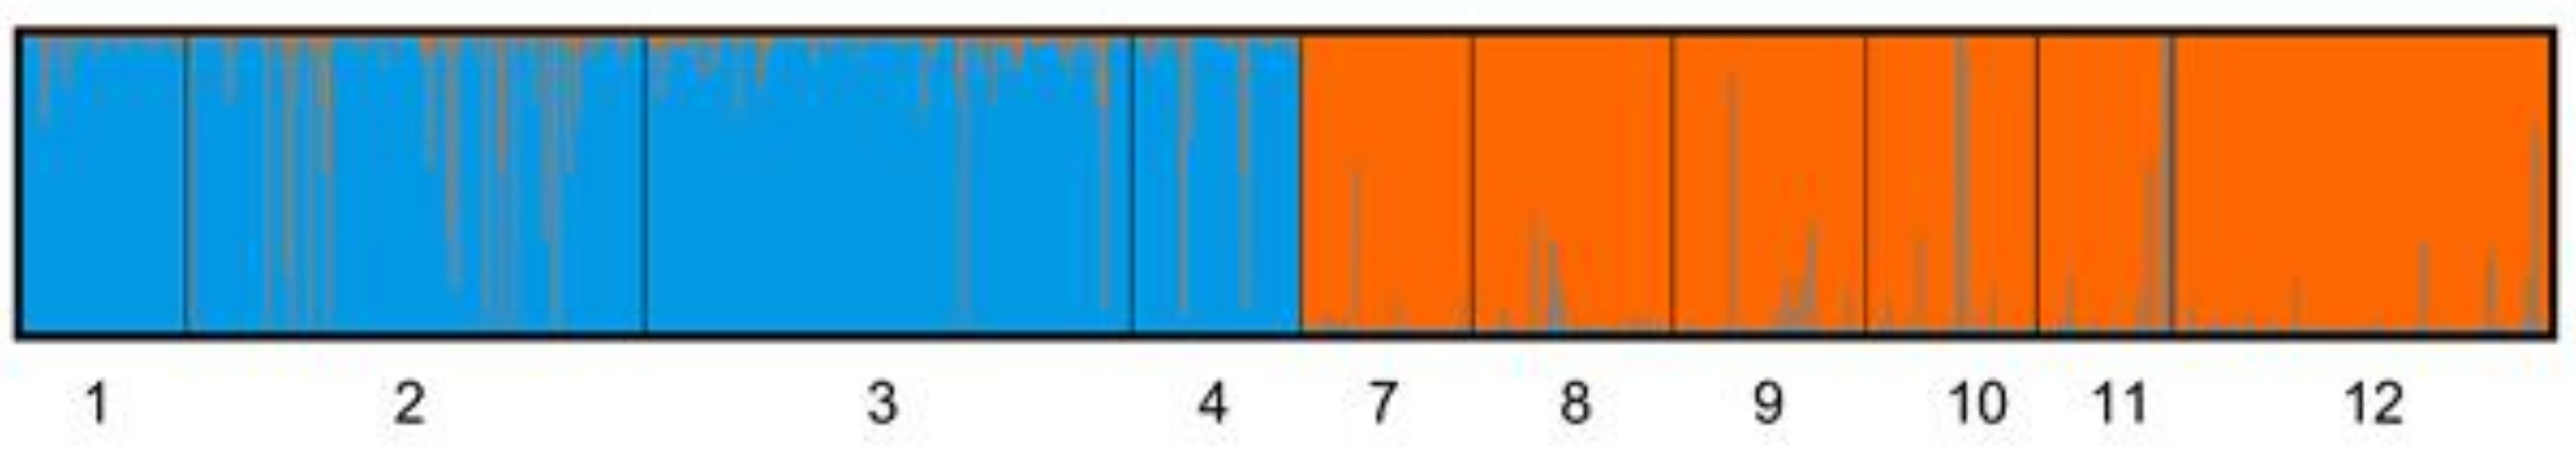
2.4. Population Genetic Structure

The pairwise genetic differentiation estimates (FST) between most of the sampling sites are statistically significant after Bonferroni correction, except for between sites 1 and 2, 8 and 9, 8 and 10, 9 and 10, 7 and 11, and 7 and 12 (Table 4). The PCA (Figure 1) showed a structuration among populations with the population from the west (1–4) separated from the population in the east (sites 7–12). Random sampling of two miracidia by patient does not change the latter result (Supplementary Figure S3) This genetic structure was confirmed using Structure software that revealed the highest probability for two clusters (K = 2) (Figure 2).

3. Discussion

We report for the first time the population genetic structure and hybridization of S. haematobium in Nigeria. Based on the Cox1 profile, our study revealed a country-wide minimum proportion of 89% prevalence of S. bovis x S. haematobium hybrids and almost equal repartition among the study sites. Most studied sites revealed a hybrid prevalence of 100% except for sites 3 and 4. S. bovis x S. haematobium hybrid prevalence obtained from other West African countries: Cote d’Ivoire 57.5% [9] and Senegal 9–72% [7,8,12,28,29,30] revealed that Nigeria has the highest prevalence of hybrids. An important variation in hybrid frequency, ranging from 2% to 26%, between different villages has been evidenced in Senegal [29]. The authors have positively associated this variation with the prevalence of S. mansoni. They hypothesized that a first schistosome infection would favor ongoing infections and subsequently hybridizations. Because hybrid prevalence is 100% in the majority of the sites we have sampled, we cannot test for an eventual link with proximal factors such as prevalence and socio-demographic factors we have measured [31].
We have obtained full genotypes (both Cox1 and ITS2) for a sub-sample of 59 parasites. Interestingly, we found a high percentage (39%) of Sb x SbSb genotypes. This genotype has not been found in Senegal [8,12,28,29] and is in a very low percentage in Cote d’Ivoire [32] and in Corsica [18]. The high percentage of Sb x SbSb genotype we found is associated with a preponderance of both S. bovis Cox1 haplotype and S. bovis ITS2 alleles compared to S. haematobium. Concerning the ITS2, in Cote d’Ivoire and in Senegal, the frequency of the S. haematobium allele is 87% and more than 88%, respectively [8,12,28,29]. We found only 40% of S. haematobium ITS2 alleles in Nigeria. When a population is at equilibrium, the ITS is expected to harbor a single allele from one of the parents resulting in a concerted evolution [33]. This supposes that in Nigeria, contrary to other countries the population of hybrid schistosomes is not stabilized.
Concerning Cox 1, in Cote d’Ivoire and Senegal, the frequency of the S. haematobium haplotype is 46% and more than 77%, respectively [8,12,28,29]. We found only 11% of the S. haematobium haplotype in Nigeria, and these haplotypes were restricted to two sites. As previously proposed by Boon et al. [29], two main factors could explain a variation in Cox1 haplotype frequency: genetic drift and/or selection. Because the mitochondrial genes are only maternally inherited, they are more prone to genetic drift compared to bi-parentally (i.e., nuclear) inherited markers. Mate choice or mate competition could select for a given mitochondria species. Recently, this has been shown in random mating between S. haematobium and S. bovis excluding the selection of mitochondria through sexual selection [34]. Boon et al. [29] proposed that the environment could select for different mitochondrial haplotypes. For instance, these authors hypothesized that the snail strain host could select for hybrid parasites in a given area. This interesting snail driver selection hypothesis needs to be tested.
Concerning Nigeria, the high frequency of S. bovis genes could be explained by active zoonotic transmission and ongoing gene flow between animal (i.e., S. bovis) and human parasites. Recent genomic studies have shown that the S. haematobium x S. bovis hybrid is certainly the result of an ancient introgression event [35,36]. The age of the hybridization does not exclude ongoing zoonotic transmission. This zoonotic transmission has been evidenced in Benin with cows and rodents [20,21] and only with rodents in Senegal [19]. S. haematobium x S. bovis hybrids have not been evidenced in cows in Cameroon [6]. Considering the high prevalence of S. bovis genes in parasite-infecting humans in Nigeria, looking for the presence of hybrid schistosomes in animals (rodents or cows) seems necessary.
To determine the genetic structure among the populations, we measured the pairwise genetic estimates (FST values), for all pairs. Generally, values < 0.05, 0.05–0.15, 0.15–0.25 and >0.25 indicate low, moderate, high and very high genetic differentiations respectively [6]. Our study revealed FST values of 0.0104–0.1688 which is an indication of low to very high genetic differentiation among the populations. Few population genetic studies involved S. haematobium compared with S. mansoni [36], and the studies involved local scales, between 8 and 45 km distances between sites for Gower et al. [37] and Boon et al. [28], respectively. Our study proposed a wider range from local (10’s of kilometers) to regional (10s to 100s of kilometers) scale. When populations are separated by a few kilometers, paired FST values are in agreement with previous studies and range from 0.01 to 0.04 [37]. At the regional scale, the Fst values for S. haematobium are similar to S. mansoni [38,39].
Regardless of the method used (PCA or Bayesian analyses using Structure software), we showed a clear clustering into two groups of populations: one from the west (populations 1–4) and one from the east (populations 7–12). S. haematobium populations are usually not well structured compared to S. mansoni [36]. These two parasite species possess similar transmission dynamics that could influence the parasite’s genetic structure. For instance, for both species, the transmission is focused on water bodies, the intermediate and definitive hosts have similar mobility, and the number of intermediate host species is restricted. It is well established that S. haematobium has less genetic diversity than S. bovis or S. mansoni [6,36]. This low genetic diversity reduces the power of determination of structuring units. Our study shows that no structuring units are detectable under around 250 km distances between populations. Fst values are also lower among populations 1–4 or among populations 5–10 than between the two clusters of populations. In comparison, it has been shown that clear population structures between S. mansoni populations are separated by a 127 km distance in Ethiopia [39].
Various factors including hybridization can favor genetic structure [27]. Introgression through hybridization can influence the genetic structure by adding new alleles in a given area and in turn favor population clustering. We have obtained 100% of hybrids in the majority of sites we have sampled. Nowadays, this does not exclude the influence of hybridization in genetic structuring. Indeed, the molecular barcoding method we have used only infer the presence/absence of hybrids and not the genomic introgression level. Molecular markers such as SNP are needed to infer the role of hybridization in genetic structuring.

4. Materials and Methods

4.1. Parasitological Survey and Sampling Collection

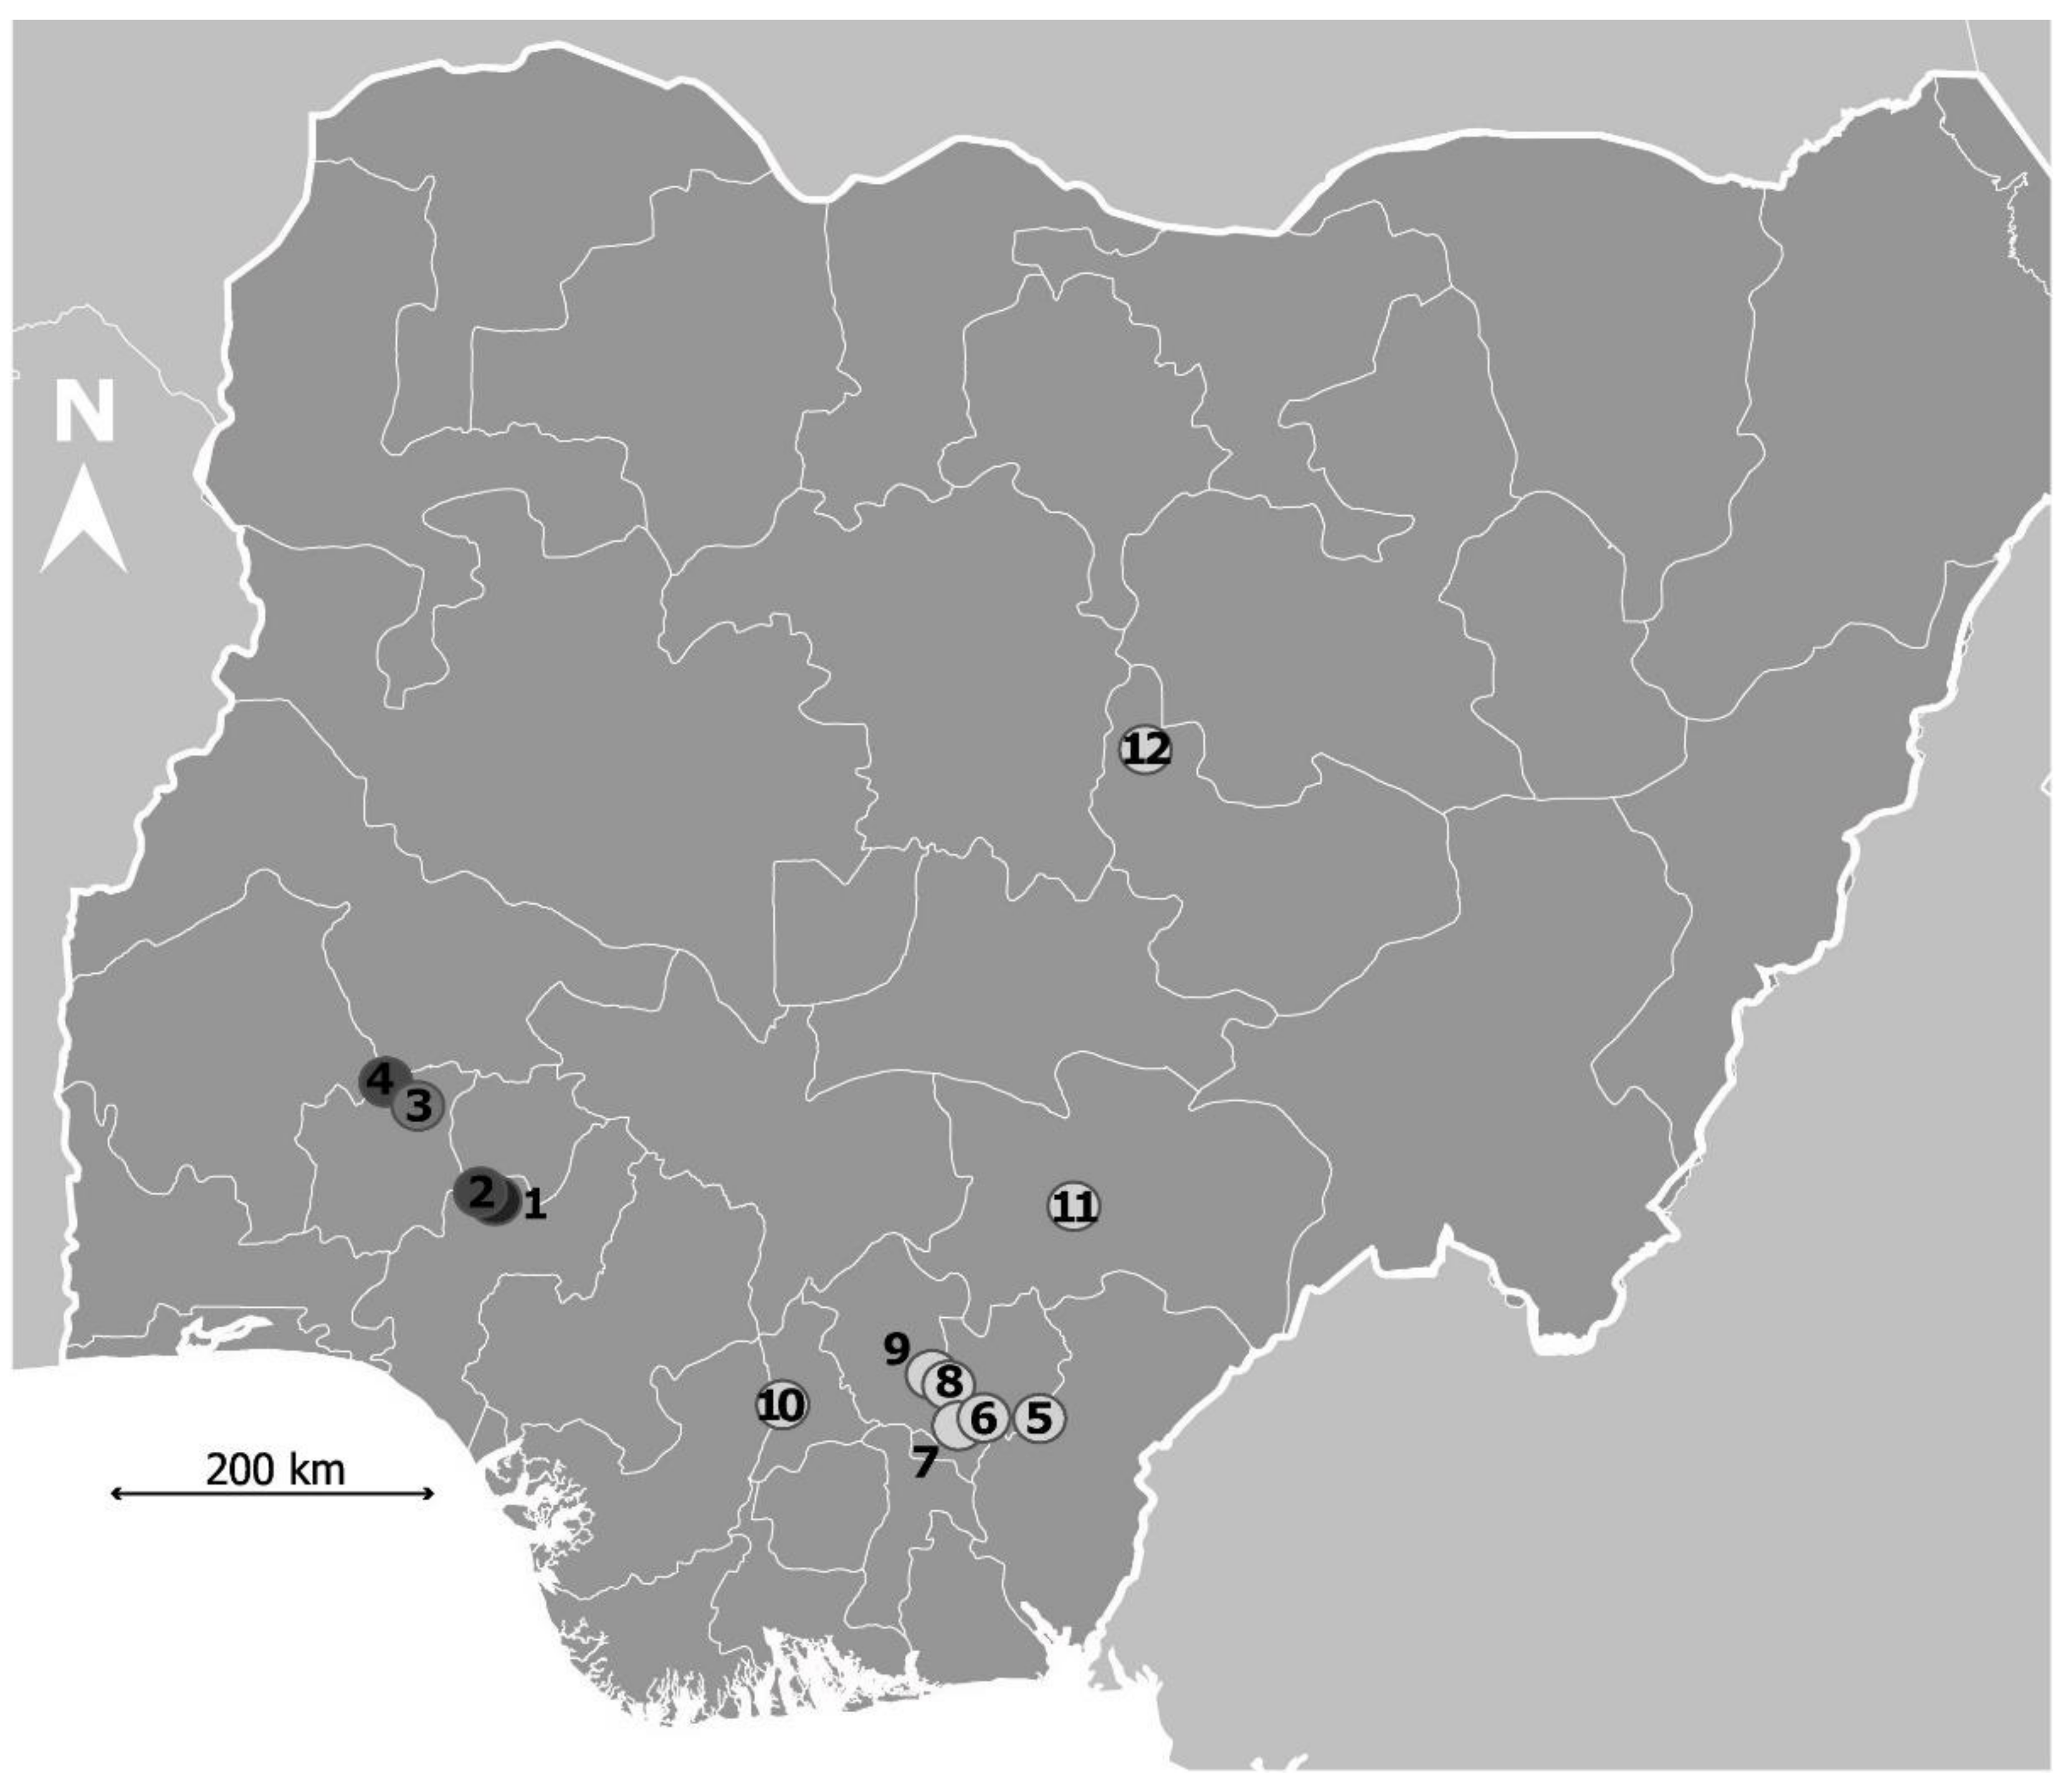
4.1.1. Study Area and Study Population

This study was carried out in twelve sites in Nigeria, West Africa (Figure 3). This study was integrated into a survey carried out on prevalence and risk factors associated with urinary schistosomiasis among primary school-age pupils in Nigeria (Onyekwere et al. submitted).

4.1.2. Urine Sample Collection and Miracidia Sampling

A labeled, clean, and sterile plastic container with an “identification code” for anonymity of 20 mL was given to each patient whose parents or legal guardians gave oral consent. Each participant whose urine sample was positive for the parasite was treated with a single oral dose of 40 mg/kg body weight of praziquantel (600 mg, Biltricide, Bayer, Leverkusen, Germany) through their Primary Health Center (PHC).
Individual miracidium was harvested using a P10 Gilson micropipette in 3 μL of water under a 20× or 40× magnification binocular microscope. About 20–25 miracidia were individually captured for each participant with each miracidium being checked in the pipette tip before placing on Whatman FTA® cards (GE Healthcare Life Sciences; Amersham, UK). Each FTA® card filled with miracidia was stored at room temperature while on the field and transferred to “Laboratoire Interactions Hotes-Pathogenes-Environnements” (IHPE), France, for genetic analysis. Table 5 shows the number of miracidia collected from participants and genotyped with Cox1 and microsatellites for each of the sampling site.

4.2. Genomic Analysis

4.2.1. DNA Extraction

Genomic DNA from Schistosoma randomly selected miracidia were individually extracted from FTA® cards using the Chelex method [40]. Harris-Micro-Punch (VWR; London, UK) was used to perforate a 2 mm disc at the center where the sample was placed. The disc was washed in 50 μL ultra-pure water for 10 min, the water discarded, and the disc was incubated in 80 μL of 5% Chelex® solution (Bio-Rad; Hercules, CA, USA) at 65 °C for 30 min with agitation. This was incubated again at 99 °C for 8 min without agitation. The solution was centrifuged at 14,000 rpm for 2 min and 60 μL of the supernatant was transferred into a 96-wells micro-plate and stored at −20 °C for genomic analysis.

4.2.2. Estimation of Hybrid Prevalence by Mitochondrial DNA Identification

Hybrid schistosomes are generally characterized by the combination of the maternal DNA (mt-DNA) from Cox1 and the nuclear DNA (rDNA) from ITS2 [7,9]. The results will be used to assign each parasite a genetic signature based on the haplotype-alleles combinations: Sb x SbSb, Sb x ShSh, Sb x SbSh, Sh x ShSh, Sh x SbSb or Sh x SbSh. We obtained this full genotyping only for a subsample of miracidia (see below). However, a basic estimation of the hybrid frequency could be assessed only by the Cox1 gene characterization considering that human infected by an animal parasite (i.e S. bovis) gene is a hybrid parasite [29]. Hence, the frequency of hybrids is a synonym for the frequency of miracidia with an S. bovis Cox1 profile. This method can lead to the underestimation of the frequency of hybrids because Sh x SbSb or Sh x SbSh genotypes are considered as pure S. haematobium instead of hybrids. For this purpose, each miracidium was molecularly characterized by rapid diagnostic multiplex PCR (RD-PCR) on Cox1 [41]. The number of miracidia tested per site is presented in Table 1. We used species-specific primers to amplify the region to discriminate each Schistosoma species fragment: S. haematobium 120 bp, S. mansoni 215 bp, and S. bovis 260 bp [41]. The primers we used were a single universal reverse primer; (Shmb.R, 5-CAA GTA TCA TGA AAY ART ATR TCT AA-3′) and three species-specific forward primers; (Sh.F, 5′-GGT CTC GTG TAT GAG ATC CTA TAG TTT G-3′) for S. haematobium, (Sm.F, 5′-CTT TGA TTC GTT AAC TGG AGT G-3′) for S. mansoni and (Sb.F, 5′-GTT TAG GTA GTG TAG TTT GGG CTC AC-3′) for S. bovis. Each PCR is made up of 1.2 μL of ultra-pure water, 2 μL of buffer (Green GoTaq Flexi buffer, 5×; Promega; Madison, Wisconsin, USA), 1.2 μL of 25 mM MgCl2 (Promega), 0.4 μL of 10 mM dNTPs mix (Promega), 1 μL of 10X primer mix (4 μL of 100 μM reverse primer, 4 μL of each 100 μM forward primer and 84 μL of ultra-pure water), 0.2 μL of 5 U/ μL of GoTaq G2 Hot Start Polymerase (Promega), and 4 μL of DNA extract, making a total volume of 10 μL for the PCR mix. Thermal cycling was performed in (plate thermal cycler) a PerkinElmer 9600 Thermal Cycler (PerkinElmer, Waltham, MA, USA) and the PCR conditions used were: pre-denaturing at 95 °C for 3 min; 45 cycles of 10 s at 95 °C (denaturing), 30 s at 52 °C (annealing), and 10 s at 72 °C (extending). This was followed by a final extending period of 2 min at 72 °C. The PCR product was stored in the refrigerator at 4 °C until use. The PCR products (Cox1) were visualized on 2% agarose gel stained with 8 μL Midori dye. Nine microliters of the PCR product was loaded into each well using a multi-channel micro-pipette (including wells for positive controls; S. haematobium, S. mansoni, S. bovis, and water for a negative control) and 4 μL for size standard 100 bp (base-pair) ladder. The PCR products in the gel were analyzed by electrophoresis at 135 V for 30–35 min and transferred to the UV trans-illuminator where gel images were taken.

4.2.3. Mitochondrial DNA (Cox1) and Nuclear Internal Transcribed Spacer II (ITS2) Sequencing

Full genotyping on a sub-sample was assessed by SANGER sequencing of the two genes (Cox1 and ITS2). Cox1 and ITS2 genes of six to seven miracidia harboring S. bovis Cox1 RD-PCR profile were sequenced for all sites. Seven more miracidia were sequenced for sites 3 and 4, the only sites harboring the S. haematobium Cox1 RD-PCR profile (see results). S. haematobium Cox1 PCR mix was performed in 96 wells with a single forward primer COI1_F: 5′-GGGGGTTTTATTGGTTTAGGTT-3′ and a single reverse primer COI1_R: 5′-CCAATTATAAAAGGCCATCACC-3′, while S. bovis COI1 PCR mix was performed in 96 wells with a single forward primer COI1_F: 5′-GAGGTGGTTTTATTGGTCTTGG-3′ and a single reverse primer COI1_R: 5′-GGCCACCATCATACCAACAT. Schistosome ITS2 PCR mix was performed with a single forward primer ITS4_F: 5′-TAACAAGGTTTCCGTAGGTGAA-3′ and a single reverse primer ITS5_R: 5′-TGCTTAAGTTCAGCGGGT-3′ (Kane and Rollinson, 1994). The PCR mix was made up of 17.35 μL of ultra-pure water, 6 μL of buffer (colorless GoTag Flexi buffer 5X; Promega; Madison, Wisconsin, USA) 1.8 μL of 25 mM MgCl2 (Promega), 0.6 μL of 10 mM dNTPs mix (Promega), 1 μL of each 10μM primer, 0.25 μL GoTaq G2 Hot Start polymerase (Promega), and 2 μL of DNA extract, making a total volume of 30 μL for each PCR mix. The PCR thermal cycling conditions used was the same for all markers and was performed in (plate thermal cycler) a PerkinElmer 9600 Thermal Cycler (PerkinElmer, Waltham, MA, USA): pre-denaturing at 95 °C for 3 min, 45 cycles of 30 s at 95 °C (denaturing), 40 s at 56 °C (annealing), and 80 s at 72 °C (extending). This was followed by a final extending period of 2 min at 72 °C. The PCR product was stored in the refrigerator at 4 °C until used. Then, 4.5 μL of the product was mixed with 1.5 μL of a green loading dye to make 6 μL which was loaded into each well of a 1% agarose gel with 8 μL Midori dye using a multi-channel micro-pipette and 5 μL for size standard 100 bp ladder. This was analyzed by electrophoresis at 135 V for 30 min and transferred to the UV trans-illuminator where gel images were taken. The expected band size was 1000–1100 bp. Fifty-nine (59) samples were selected based on the quality of the amplicons. These successfully amplified PCR products were purified and sequenced on an Applied Biosystem Genetic Analyzer at Genoscreen, Lille, France.

4.2.4. Sequence Analysis

The Cox1 and ITS2 sequences were assembled separately and edited with a 4.5 sequencer version: (Gene Codes Corporation; Ann Arbor, MI, USA). The sequences were aligned using BioEdit Version 7.0.9 and ClustalW software. The aligned sequences were compared with the sequences in the GenBank Nucleotide Database for species designation: (https://www.ncbi.nlm.nih.gov/nucleotide/ accessed on 30 March 2022). The nuclear ITS2 region between S. haematobium and S. bovis differs at five polymorphic sites, hence the sequence chromatograms were checked at these SNPs to identify any possible heterozygosity (Supplementary Figure S2). We constructed a Cox1 gene phylogenetic tree only using S. bovis sequences because the Cox1 S. haematobium gene is known to be poorly variable and a phylogenetic study revealed only two clusters in all the areas of repartition of the parasites [42]. The phylogenetic tree was constructed using MEGA version 6.0.6 (Pennsylvania State University, Philadelphia, PA, USA) using an HKY + G nucleotide substitution model identified as the best model describing data. The support for tree nodes was calculated with 1000 bootstrap iterations. The phylogenetic analysis includes S. bovis sequences from various African countries retrieved from GenBank databases with a minimum length of 778 bp (see Supplementary Table S1). The tree was rooted in the S. haematobium haplotypes of the present study. All sequences were uploaded onto the GenBank database (OL840258-OL840278).

4.2.5. Microsatellite Genotyping

Microsatellite genotyping was performed on parasites from all sites except 5 and 6. A total of 1136 samples (Table 1) were individually genotyped with 18 microsatellite markers divided into two panels of 9 loci [43]. The multiplex PCR mix for each panel in two tubes was performed using the Qiagen® multiplex PCR Kit (Qiagen, Hilden, Germany) according to the manufacturer’s standard amplification protocol. The forward primers were fluorescently labeled using 6-FAM, VIC, NED, and PET dyes (Applied Biosystems, Foster City, California, USA). The PCR mix consists of 5 μL Qiagen MM 2X, 1 μL of 10X microsatellite primer mix, and 4 μL DNA extract making a final volume of 10 μL. The thermal cycling was performed in a plate thermocycler, PerkinElmer 9600 Thermal Cycler (PerkinElmer, Waltham, MA, USA): pre-denaturing at 95 °C for 15 min, 40 cycles of 30 s at 94 °C (denaturing), 90 s at 56 °C (annealing), and 60 s at 72 °C (extending). This was followed by a final extending period of 30 s at 60 °C [43]. The microsatellite PCR products were sent to Genoscreen, Lille, France for genotyping. Each microsatellite locus was visibly peak called with GS500Liz size standard (Applied Biosystem) and GeneMarker software. Eighty percent of our samples were successfully amplified by 14 loci and were used for result analysis while 4 markers (C131, Sh4, Sh8, and Sh15), which amplified less than 20% of the samples, were excluded.

4.2.6. Population Genetic Structure

Linkage disequilibria and departures from Hardy–Weinberg expectations were tested using exact tests (1200 permutations) adjusted for multiple tests using Bonferroni’s correction as implemented in the FSTAT software 2.9.3.2 [44]. We analyzed the genetic variability of schistosomes from each study site by computing the expected heterozygosity (He), number of alleles (A), allelic richness (Ar), and the inbreeding coefficient (Fis) in each microsatellite’s locus with FSTAT v.2.9.3.2 [44]. Heterozygosity (He) and allelic richness (Ar) between the populations were compared using the pairwise Friedman rank test followed by Nemenyi post hoc test.
Genetic structure was first assessed by calculating pairwise FST values between sites according to [45] using FSTAT version 2.9.3.2. A possible link between geographic (in Km) and genetic distances (Fst) was assessed using the Mantel test. Second, we used the principal components analysis (PCA) implemented in Genetix [46]. Because we sampled several miracidia per patient, these miracidia are related, which could influence the genetic structure. In order to assess a possible bias of our sampling strategy, we performed PCA by randomly sampling two miracidia per patient. Third, we used the Bayesian clustering approach implemented in the Structure software to determine the uppermost level of genetic structure [47]. We tested the number of clusters from K = 1 to K = 12, by computing three runs for each cluster which is made up of 106 iterations after a “burn-in” period of 250,000 iterations with other parameters set by default and an admixture model. The mean logarithm probability for each cluster (K) was taken for the three runs with the corrsieve package in R. The ΔK-values were then computed in R to determine the probable cluster number from the total clusters (ΔK) tested according to Evanno et al. [48], from which we identified K = 2 as the most probable genetic clusters. Lastly, an additional 10 runs were computed for K = 2 using 106 iterations and setting the same parameters as earlier described. The mean probability for a miracidium to belong to each cluster over the 10 runs was taken as Q-values, and we used Clumpp version 1.1.2 according to Francis R.M. [49], and Distruct version 1.1 according to Rosenberg N.A [50].

5. Conclusions

This study revealed that S. haematobium-bovis hybrids are predominant in Schistosoma eggs isolated in the urine samples of primary school-aged pupils in Nigeria. Our findings provide evidence that S. haematobium x S. bovis hybrids are common in Nigeria. Based on the high prevalence of S. haematobium x S. bovis hybrids, we advocate research priority on domestic and wild animals to investigate the role of zoonotic transmission.

Supplementary Materials

The following supporting information can be downloaded at: https://www.mdpi.com/article/10.3390/pathogens11040425/s1, Table S1. Accession numbers for Supplementary Figure S1; Table S2. Microsatellite database; Figure S1. Maximum likelihood phylogenetic tree built with 21 (2 S. haematobium NigeriaHap1&2, and 19 S. bovis NigeriaHap3-21) haplotypes from the present study and haplotypes from Cameroon, Benin, Senegal, Cote d’lvoire, Kenya and Tanzania from Genbank database. See supplementary Table S1 for AN database; Figure S2. The sequence chromatograms show the pure and mixed signal in the nuclear ITS2 marker. The double sequence chromatogram (heterozygous) showing bi-parental inheritance of the nuclear DNA; Figure S3. Population genetic structure graph assessed by principal component analysis using 2 miracidia by patient. Each sampling site is represented by a dot. The first and second axis of the PCA represent 46.2% and 16.9% respectively of the total variation in allele frequency.

Author Contributions

Conceptualization, A.M.O., J.B. and O.R.; methodology, A.M.O., J.-F.A. and J.B.; software, A.M.O., O.R. and J.B.; validation, J.B. and O.R.; formal analysis, A.M.O., J.-F.A. and J.B.; investigation, A.M.O., M.C.N., M.A. and C.U.; resources, A.M.O., M.C.N., M.A. and C.U.; data curation, A.M.O., M.C.N., M.A. and C.U.; writing—original draft preparation A.M.O.; writing—review and editing, J.B. and O.R.; visualization, A.M.O., O.R. and J.B.; supervision, O.R. and J.B.; project administration, J.B.; funding acquisition, J.B. and A.M.O. All authors have read and agreed to the published version of the manuscript.

Funding

This research was funded by Campus France, France, and Tertiary Education Trust Fund (TETfund), Nigeria and was supported by the program HySWARM (ANR-18-CE35-0001) from the French Research National Agency respectively awarded to O. Rey and J. Boissier. Amos Onykwere is funded by Campus France. This study is set within the framework of the “Laboratoires d’Excellence (LABEX)” TULIP (ANR-10-LABX-41).

Institutional Review Board Statement

This study was part of an epidemiological surveillance not submitted to an ethics committee.

Informed Consent Statement

Urine sample were collected only from children whose parents or legal guardians gave oral consent. Each participant whose urine sample was positive for the parasite was treated with a single oral dose of 40 mg/kg body weight of praziquantel.

Data Availability Statement

Datasets generated for this report can be found on NCBI database for sequences and for microsatellite database (Supplementary Table S2).

Acknowledgments

We thank each State “Universal Basic Education Board” of the Ministry of Education for their collaboration in this research. We are also grateful to the teachers, head teachers, “Community Heads” and Church leaders that mobilized the children for this study. We say thank you to the “Primary Health Centers” (PHC) for using the funds provided to purchase drugs for the infected children.

Conflicts of Interest

The authors declare no conflict of interest. The funders had no role in the design of the study; in the collection, analyses, or interpretation of data; in the writing of manuscript, or in the decision to publish the results.

References

  1. Hotez, P.J.; Alvarado, M.; Basanez, M.G.; Bolliger, I.; Bourne, R.; Boussinesq, M.; Brooker, S.J.; Brown, A.S.; Buckle, G.; Budke, C.M.; et al. The global burden of disease study 2010: Interpretation and implications for the neglected tropical diseases. PLoS Negl. Trop Dis. 2014, 8, e2865. [Google Scholar] [CrossRef] [PubMed] [Green Version]
  2. Boissier, J.; Mouahid, G.; Moné, H. Schistosoma spp. (Robertson, L (eds) Part 4 Helminths); Rose, J.B., Jiménez-Cisneros, B., Eds.; Michigan State University: E. Lansing, MI, USA, 2019. [Google Scholar]
  3. Panzner, U.; Boissier, J. Natural Intra- and Interclade Human Hybrid Schistosomes in Africa with Considerations on Prevention through Vaccination. Microorganisms 2021, 9, 1465. [Google Scholar] [CrossRef]
  4. Leger, E.; Webster, J.P. Hybridizations within the Genus Schistosoma: Implications for evolution, epidemiology and control. Parasitology 2017, 144, 65–80. [Google Scholar] [CrossRef] [PubMed] [Green Version]
  5. Mone, H.; Mouahid, G.; Morand, S. The distribution of Schistosoma bovis Sonsino, 1876 in relation to intermediate host mollusc-parasite relationships. Adv. Parasitol. 1999, 44, 99–138. [Google Scholar] [PubMed]
  6. Djuikwo-Teukeng, F.; Kouam Simo, A.; Alliene, J.F.; Rey, O.; Njayou Ngapagna, A.; Tchuem Tchuente, L.A.; Boissier, J. Population genetic structure of Schistosoma bovis in Cameroon. Parasit Vectors 2019, 12, 56–67. [Google Scholar] [CrossRef] [PubMed] [Green Version]
  7. Huyse, T.; Webster, B.L.; Geldof, S.; Stothard, J.R.; Diaw, O.T.; Polman, K.; Rollinson, D. Bidirectional introgressive hybridization between a cattle and human schistosome species. PLoS Pathog. 2009, 5, e1000571. [Google Scholar] [CrossRef] [PubMed] [Green Version]
  8. Sene-Wade, M.; Marchand, B.; Rollinson, D.; Webster, B.L. Urogenital schistosomiasis and hybridization between Schistosoma haematobium and Schistosoma bovis in adults living in Richard-Toll, Senegal. Parasitology 2018, 145, 1723–1726. [Google Scholar] [CrossRef]
  9. Angora, E.K.; Allienne, J.F.; Rey, O.; Menan, H.; Toure, A.O.; Coulibaly, J.T.; Raso, G.; Yavo, W.; N’Goran, E.K.; Utzinger, J.; et al. High prevalence of Schistosoma haematobium × Schistosoma bovis hybrids in schoolchildren in Cote d’Ivoire. Parasitology 2020, 147, 287–294. [Google Scholar] [CrossRef]
  10. Wright, C.A.; Ross, G.C. Hybrids between Schistosoma haematobium and S. mattheei and their identification by isoelectric focusing of enzymes. Trans. R Soc. Trop Med. Hyg. 1980, 74, 326–332. [Google Scholar] [CrossRef]
  11. Kruger, F.J.; Evans, A.C. Do all human urinary infections with Schistosoma mattheei represent hybridization between S. haematobium and S. mattheei? J. Helminthol. 1990, 64, 330–332. [Google Scholar] [CrossRef]
  12. Webster, B.L.; Diaw, O.T.; Seye, M.M.; Webster, J.P.; Rollinson, D. Introgressive hybridization of Schistosoma haematobium group species in Senegal: Species barrier break down between ruminant and human schistosomes. PLoS Negl. Trop Dis. 2013, 7, e2110. [Google Scholar] [CrossRef] [PubMed] [Green Version]
  13. Huyse, T.; Van den Broeck, F.; Hellemans, B.; Volckaert, F.A.; Polman, K. Hybridisation between the two major African schistosome species of humans. Int. J. Parasitol. 2013, 43, 687–689. [Google Scholar] [CrossRef]
  14. Le Govic, Y.; Kincaid-Smith, J.; Allienne, J.F.; Rey, O.; de Gentile, L.; Boissier, J. Schistosoma haematobium-Schistosoma mansoni Hybrid Parasite in Migrant Boy, France, 2017. Emerg. Infect. Dis. 2019, 25, 365–367. [Google Scholar] [CrossRef] [Green Version]
  15. Depaquit, J.; Akhoundi, M.; Haouchine, D.; Mantelet, S.; Izri, A. No limit in interspecific hybridization in schistosomes: Observation from a case report. Parasite 2019, 26, 10. [Google Scholar] [CrossRef] [PubMed] [Green Version]
  16. Brémond, P.; Sellin, B.; Sellin, E.; Naméoua, B.; Labbo, R.; Théron, A.; Combes, C. Arguments en faveur d’une modification du génome (introgression) du parasite humain Schistosoma haematobium par des gènes de S. bovis, au Niger. Comptes-Rendus L’académie Des. Sci. 1993, 316, 667–670. [Google Scholar]
  17. Mone, H.; Holtfreter, M.C.; Allienne, J.F.; Mintsa-Nguema, R.; Ibikounle, M.; Boissier, J.; Berry, A.; Mitta, G.; Richter, J.; Mouahid, G. Introgressive hybridizations of Schistosoma haematobium by Schistosoma bovis at the origin of the first case report of schistosomiasis in Corsica (France, Europe). Parasitol. Res. 2015, 114, 4127–4133. [Google Scholar] [CrossRef] [PubMed]
  18. Boissier, J.; Grech-Angelini, S.; Webster, B.L.; Allienne, J.F.; Huyse, T.; Mas-Coma, S.; Toulza, E.; Barré-Cardi, H.; Rollinson, D.; Kincaid-Smith, J.; et al. Outbreak of urogenital schistosomiasis in Corsica (France): An epidemiological case study. Lancet Infect. Dis. 2016, 16, 971–979. [Google Scholar] [CrossRef]
  19. Catalano, S.; Sene, M.; Diouf, N.D.; Fall, C.B.; Borlase, A.; Leger, E.; Ba, K.; Webster, J.P. Rodents as Natural Hosts of Zoonotic Schistosoma Species and Hybrids: An Epidemiological and Evolutionary Perspective From West Africa. J. Infect. Dis. 2018, 218, 429–433. [Google Scholar] [CrossRef] [Green Version]
  20. Savassi, B.; Dobigny, G.; Etougbetche, J.R.; Avocegan, T.T.; Quinsou, F.T.; Gauthier, P.; Ibikounle, M.; Mone, H.; Mouahid, G. Mastomys natalensis (Smith, 1834) as a natural host for Schistosoma haematobium (Bilharz, 1852) Weinland, 1858 × Schistosoma bovis Sonsino, 1876 introgressive hybrids. Parasitol. Res. 2021, 120, 1755–1770. [Google Scholar] [CrossRef]
  21. Savassi, B.; Mouahid, G.; Lasica, C.; Mahaman, S.K.; Garcia, A.; Courtin, D.; Allienne, J.F.; Ibikounle, M.; Mone, H. Cattle as natural host for Schistosoma haematobium (Bilharz, 1852) Weinland, 1858 × Schistosoma bovis Sonsino, 1876 interactions, with new cercarial emergence and genetic patterns. Parasitol. Res. 2020, 119, 2189–2205. [Google Scholar] [CrossRef]
  22. Southgate, V.R.; Rollinson, D.; Ross, G.C.; Knowles, R.J.; Vercruysse, J. On Schistosoma curassoni, S. haematobium and S. bovis from Senegal: Development in Mesocricetus auratus, compatibility with species of Bulinus and their enzymes. J. Nat. Hist. 1985, 19, 1249–1267. [Google Scholar] [CrossRef]
  23. Vercruysse, J.; Southgate, V.R.; Rollinson, D.; De Clercq, D.; Sacko, M.; De Bont, J.; Mungomba, L.M. Studies on transmission and schistosome interactions in Senegal, Mali and Zambia. Trop Geogr. Med. 1994, 46, 220–226. [Google Scholar] [PubMed]
  24. Webster, B.L.; Tchuem Tchuente, L.A.; Jourdane, J.; Southgate, V.R. The interaction of Schistosoma haematobium and S. guineensis in Cameroon. J. Helminthol. 2005, 79, 193–197. [Google Scholar] [CrossRef] [PubMed]
  25. Mone, H.; Minguez, S.; Ibikounle, M.; Allienne, J.F.; Massougbodji, A.; Mouahid, G. Natural Interactions between S. haematobium and S. guineensis in the Republic of Benin. Sci. World J. 2012, 2012, 793420. [Google Scholar] [CrossRef] [Green Version]
  26. De Bont, J.; Vercruysse, J.; Southgate, V.R.; Rollinson, D.; Kaukas, A. Cattle schistosomiasis in Zambia. J. Helminthol. 1994, 68, 295–299. [Google Scholar] [CrossRef]
  27. Rey, O.; Webster, B.L.; Huyse, T.; Rollinson, D.; Van den Broeck, F.; Kincaid-Smith, J.; Onyekwere, A.; Boissier, J. Population genetics of African Schistosoma species. Infect. Genet. Evol. 2021, 89, 104727. [Google Scholar] [CrossRef]
  28. Boon, N.A.M.; Mbow, M.; Paredis, L.; Moris, P.; Sy, I.; Maes, T.; Webster, B.L.; Sacko, M.; Volckaert, F.A.M.; Polman, K.; et al. No barrier breakdown between human and cattle schistosome species in the Senegal River Basin in the face of hybridisation. Int J. Parasitol. 2019, 49, 1039–1048. [Google Scholar] [CrossRef]
  29. Boon, N.A.M.; Van Den Broeck, F.; Faye, D.; Volckaert, F.A.M.; Mboup, S.; Polman, K.; Huyse, T. Barcoding hybrids: Heterogeneous distribution of Schistosoma haematobium × Schistosoma bovis hybrids across the Senegal River Basin. Parasitology 2018, 145, 634–645. [Google Scholar] [CrossRef] [Green Version]
  30. Leger, E.; Borlase, A.; Fall, C.B.; Diouf, N.D.; Diop, S.D.; Yasenev, L.; Catalano, S.; Thiam, C.T.; Ndiaye, A.; Emery, A.; et al. Prevalence and distribution of schistosomiasis in human, livestock, and snail populations in northern Senegal: A One Health epidemiological study of a multi-host system. Lancet Planet Health 2020, 4, e330–e342. [Google Scholar] [CrossRef]
  31. Onyekwere, A.M.; Rey, O.; Nwanchor, M.C.; Alo, M.; Angora, E.K.; Allienne, J.F.; Boissier, J. Prevalence and Risk Factors Associated with Urogenital Schistosomiasis among Primary School Pupils in Nigeria. Parasite Epidemiol. Control 2021, Submitted. [Google Scholar]
  32. Angora, E.K.; Boissier, J.; Menan, H.; Rey, O.; Tuo, K.; Toure, A.O.; Coulibaly, J.T.; Meite, A.; Raso, G.; N’Goran, E.K.; et al. Prevalence and Risk Factors for Schistosomiasis among Schoolchildren in two Settings of Cote d’Ivoire. Trop Med. Infect. Dis. 2019, 4, 110. [Google Scholar] [CrossRef] [PubMed] [Green Version]
  33. Sang, T.; Crawford, D.J.; Stuessy, T.F. Documentation of reticulate evolution in peonies (Paeonia) using internal transcribed spacer sequences of nuclear ribosomal DNA: Implications for biogeography and concerted evolution. Proc. Natl. Acad. Sci. USA 1995, 92, 6813–6817. [Google Scholar] [CrossRef] [PubMed] [Green Version]
  34. Kincaid-Smith, J.; Mathieu-Begne, E.; Chaparro, C.; Reguera-Gomez, M.; Mulero, S.; Allienne, J.F.; Toulza, E.; Boissier, J. No pre-zygotic isolation mechanisms between Schistosoma haematobium and Schistosoma bovis parasites: From mating interactions to differential gene expression. PLoS Negl. Trop Dis. 2021, 15, e0009363. [Google Scholar] [CrossRef]
  35. Platt, R.N.; McDew-White, M.; Le Clec’h, W.; Chevalier, F.D.; Allan, F.; Emery, A.M.; Garba, A.; Hamidou, A.A.; Ame, S.M.; Webster, J.P.; et al. Ancient Hybridization and Adaptive Introgression of an Invadolysin Gene in Schistosome Parasites. Mol. Biol. Evol. 2019, 36, 2127–2142. [Google Scholar] [CrossRef] [Green Version]
  36. Rey, O.; Toulza, E.; Chaparro, C.; Allienne, J.F.; Kincaid-Smith, J.; Mathieu-Begne, E.; Allan, F.; Rollinson, D.; Webster, B.L.; Boissier, J. Diverging patterns of introgression from Schistosoma bovis across S. haematobium African lineages. PLoS Pathog. 2021, 17, e1009313. [Google Scholar]
  37. Gower, C.M.; Gabrielli, A.F.; Sacko, M.; Dembele, R.; Golan, R.; Emery, A.M.; Rollinson, D.; Webster, J.P. Population genetics of Schistosoma haematobium: Development of novel microsatellite markers and their application to schistosomiasis control in Mali. Parasitology 2011, 138, 978–994. [Google Scholar] [CrossRef] [PubMed]
  38. Agola, L.E.; Mburu, D.N.; DeJong, R.J.; Mungai, B.N.; Muluvi, G.M.; Njagi, E.N.; Loker, E.S.; Mkoji, G.M. Microsatellite typing reveals strong genetic structure of Schistosoma mansoni from localities in Kenya. Infect Genet. Evol. 2006, 6, 484–490. [Google Scholar] [CrossRef]
  39. Aemero, M.; Boissier, J.; Climent, D.; Mone, H.; Mouahid, G.; Berhe, N.; Erko, B. Genetic diversity, multiplicity of infection and population structure of Schistosoma mansoni isolates from human hosts in Ethiopia. BMC Genet. 2015, 16, 137. [Google Scholar] [CrossRef] [Green Version]
  40. Beltran, S.; Galinier, R.; Allienne, J.F.; Boissier, J. Cheap, rapid and efficient DNA extraction method to perform multilocus microsatellite genotyping on all Schistosoma mansoni stages. Mem. Inst. Oswaldo Cruz 2008, 103, 501–503. [Google Scholar] [CrossRef] [Green Version]
  41. Webster, B.L.; Rollinson, D.; Stothard, J.R.; Huyse, T. Rapid diagnostic multiplex PCR (RD-PCR) to discriminate Schistosoma haematobium and S. bovis. J. Helminthol. 2010, 84, 107–114. [Google Scholar] [CrossRef] [Green Version]
  42. Webster, B.L.; Emery, A.M.; Webster, J.P.; Gouvras, A.; Garba, A.; Diaw, O.; Seye, M.M.; Tchuente, L.A.; Simoonga, C.; Mwanga, J.; et al. Genetic diversity within Schistosoma haematobium: DNA barcoding reveals two distinct groups. PLoS Negl. Trop Dis. 2012, 6, e1882. [Google Scholar] [CrossRef] [PubMed]
  43. Webster, B.L.; Rabone, M.; Pennance, T.; Emery, A.M.; Allan, F.; Gouvras, A.; Knopp, S.; Garba, A.; Hamidou, A.A.; Mohammed, K.A.; et al. Development of novel multiplex microsatellite polymerase chain reactions to enable high-throughput population genetic studies of Schistosoma haematobium. Parasit Vectors 2015, 8, 432, Erratum Parasit Vectors 2015, 8, 519. [Google Scholar] [CrossRef] [PubMed] [Green Version]
  44. Goudet, J.; Perrin, N.; Waser, P. Tests for sex-biased dispersal using bi-parentally inherited genetic markers. Mol. Ecol. 2002, 11, 1103–1114. [Google Scholar] [CrossRef] [PubMed] [Green Version]
  45. Weir, B.S.; Cockerham, C.C. Estimating F-Statistics for the Analysis of Population Structure. Evolution 1984, 38, 1358–1370. [Google Scholar] [PubMed]
  46. Belkhir, K.; Borsa, P.; Chikhi, L.; Raufaste, N.; Bonhomme, F. GENETIX 4.05, Logiciel Sous Windows TM Pour la Génétique des Populations. Laboratoire Génome, Populations, Interactions, CNRS UMR 5000, Université de Montpellier II, Montpellier (France) 1996. Available online: http://www.genetix.univ-montp2.fr/genetix/constr.htm (accessed on 30 March 2022).
  47. Pritchard, J.K.; Stephens, M.; Donnelly, P. Inference of population structure using multilocus genotype data. Genetics 2000, 155, 945–959. [Google Scholar] [CrossRef]
  48. Evanno, G.; Regnaut, S.; Goudet, J. Detecting the number of clusters of individuals using the software STRUCTURE: A simulation study. Mol. Ecol. 2005, 14, 2611–2620. [Google Scholar] [CrossRef] [Green Version]
  49. Francis, R.M. pophelper: An R package and web app to analyse and visualize population structure. Mol. Ecol. Resour. 2017, 17, 27–32. [Google Scholar] [CrossRef] [Green Version]
  50. Rosenberg, N.A. DISTRUCT: A program for the graphical display of population structure. Mol. Ecol. Notes 2004, 4, 137–138. [Google Scholar] [CrossRef]
Figure 1. Population genetic structure graph assessed by principal component analysis of 1136 S. haematobium parasites collected in Nigeria revealed by graph (PCA). Each sampling site is represented by a dot. The first and second axis of the PCA represent 43.8% and 22.9%, respectively, of the total variation in allele frequency.
Pathogens 11 00425 g001
Figure 2. Bar plot showing the population genetic structure using Structure software of 1136 S. haematobium miracidia collected in Nigeria. Each column represents one miracidium. The colors show the proportion of contribution of each cluster to each genotype. The cluster structure K = 2, produced by structure software for 10 sampling sites.
Pathogens 11 00425 g002
Figure 3. Map showing sampling sites 1–12 in the survey study carried out to determine the prevalence of S. haematobium infection among primary school-age pupils across Nigeria (Onyekwere, et al. Submitted). Sampling sites were represented according to infection status of the disease among the participants. Darker to lighter colors correspond to higher to lower infection status observed at the studied sites.
Pathogens 11 00425 g003
Table 1. Number of miracidia collected from participants and analyzed by Cox1 marker rapid diagnostic (RD) PCR to show the minimum percentage of S. haematobium x S. bovis hybrids.
Sampling SiteNo. of Children TestedNo. Miracidia GenotypedNo. of Miracidia with Cox1 S. bovisNo. of Miracidia with Cox1 S. haematobiumMin. % of Hybrids (S. bovis Cox1)
11090900100%
2201561560100%
3181522812418%
41174462862%
5330300100%
61266660100%
71284840100%
8121031030100%
9171641640100%
101290900100%
11201931930100%
12181621620100%
Total1651364121215289%
Table 2. Prevalence of S. haematobium, S. bovis and S. haematobium x S. bovis hybrids for each sampling site based on Cox1 x ITS2 combinations of full genotyped 59 sub-samples.
GenotypeSite123456789101112Total Alleles (%)
Sb ITS2Sh ITS2
COX1ITS2
SbSbSb 31000020445423 (39.0)46 (39.0)0 (0)
SbShSh 2042000001009 (15.3)0 (0)18 (15.3)
SbSbSh 26210201321222 (37.2)22 (18.6)22 (18.6)
ShSbSb 0000000000000 (0)0 (0)0 (0)
ShShSh 0021000000003 (5.1)0 (0)6 (5.1)
ShSbSh 0020000000002 (3.4)2 (1.7)2 (1.7)
Total 771040221776659 (100)70 (59.3)48 (40.7)
Table 3. Population genetic diversity indices per study and per locus. Mean and Standard error (SE) of expected heterozygosity (He), number of alleles detected (A), allelic richness (Ar), mean inbreeding coefficient (Fis).
LocusSh9Sh3C102Sh1Sh14Sh6C111Sh7Sh13Sh11Sh2Sh5Sh10Sh12MeanSE
Site 1 n = 74
He0.6330.8240.0000.7040.8750.3650.6080.5600.6960.4540.8770.8410.5360.3350.5930.247
A510161155485109746.4292.848
Ar4.5909.6031.0005.55010.9344.9474.6453.6367.3304.9809.5748.7106.0143.9566.1052.774
Fis0.5690.241NA0.1770.0820.2730.0880.377−0.0260.4160.4110.4150.5010.0480.2750.196
Site 2 n = 206
He0.6240.8600.0250.6590.8830.3350.6360.6770.7100.4800.8210.8210.3650.4730.5980.241
A111126126641051213857.9293.518
Ar7.1119.9061.6945.50211.4694.3374.9604.0007.8394.46510.85110.0455.2254.2126.5443.017
Fis0.4140.116−0.0100.0130.0630.0900.0390.468−0.0100.4110.2640.4230.219−0.0860.1720.191
Site 3 n = 219
He0.6980.8010.3310.6240.7670.3600.6300.6560.6560.2310.8330.8750.3260.1360.5660.241
A914712105651151213658.5713.368
Ar6.92510.3995.6718.7908.0913.6985.0034.6239.3023.71510.25212.1874.8023.5416.9292.890
Fis0.3630.1070.130−0.0060.1510.3440.1080.0940.1030.5620.3350.2020.3990.1580.2180.157
Site 4 n = 76
He0.5830.8850.0390.6750.8650.4190.6020.5790.6520.5800.7960.8210.3080.4090.5870.235
A511361256485119546.7142.946
Ar4.68310.8652.3545.83111.6244.7575.4183.8637.6024.67510.8368.5174.3223.9346.3772.986
Fis0.2160.135−0.009−0.0150.1830.0400.1450.330−0.0620.6550.3920.5130.333−0.0330.2020.219
Site 7 n = 77
He0.5850.7810.2080.5690.7310.0000.6590.5340.8220.1940.7500.7580.6660.7030.5690.253
A8925716311277745.6432.925
Ar6.6248.5262.0004.7146.5061.0005.1332.9989.9062.0005.9696.6806.8974.0005.2112.591
Fis0.3990.1790.1260.2140.088NA0.2621.0000.0830.525−0.1670.3300.6750.1960.3010.298
Site8 n = 90
He0.7320.8020.1630.5250.6730.0000.6290.5090.7360.2290.7110.6710.6770.6640.5520.245
A982571445478975.7142.525
Ar8.1127.7372.0004.4486.3871.0003.8593.6694.9993.4246.6437.2857.6286.1795.2412.242
Fis0.7000.213−0.0920.102−0.008NA0.0430.6900.2330.630−0.1020.1090.6360.0890.2490.300
Site 9 n = 87
He0.7550.7780.2690.4570.7020.0000.5780.4000.7710.0520.7370.7140.4940.6670.5270.263
A882561426278765.1432.507
Ar7.4457.1212.0003.9735.9711.0003.4882.0005.5181.9836.7186.8266.3025.7094.7182.245
Fis0.4700.0440.081−0.080−0.043NA0.3760.8260.408−0.018−0.1920.1590.3490.1040.1910.275
Site 10 n = 77
He0.7610.7620.2320.5340.6770.0000.5670.4900.7660.2620.7870.7270.7020.7040.5690.244
A883381527386865.4292.563
Ar7.3347.5612.5533.0007.0711.0004.1202.0006.1512.6677.6145.8567.5685.7915.0202.379
Fis0.3710.0750.0920.241−0.113NA0.2010.8190.2310.697−0.0590.0890.7190.1050.2670.298
Site 11 n = 61
He0.7470.7680.2420.6920.6770.0750.5570.5510.7630.4060.7760.7230.5930.6960.5900.213
A992464439289855.8572.742
Ar8.5428.9102.0004.0005.9623.5433.7003.00010.1622.0007.4398.7367.4664.9995.7472.779
Fis0.5960.0300.2560.2610.0910.4940.2810.637−0.0630.707−0.0130.2020.6030.1160.3000.262
Site 12 n = 169
He0.7600.7520.2000.6190.7250.0450.6080.4200.8160.1230.7380.7120.4680.7280.5510.259
A101146725411389876.7862.914
Ar7.4878.6923.5554.9736.4481.8954.2203.1889.9082.3406.6487.4116.5424.7975.5792.401
Fis0.5130.1670.0380.134−0.0250.8550.1470.8360.0200.471−0.0340.1740.665−0.0000.2830.321
Total (n = 1136)
Table 4. Pairwise genetic differentiation estimate (FST—above the diagonal) and the Euclidian geographic distances (Km—below the diagonal) between the sampling sites. Most FST values are statistically significant (marked with an asterisk (*)) with the level of significance adjusted with Bonferroni correction (p < 0.0011). No link was observed between the geographical and genetic distances (Mantel test; p > 0.05).
Population Number1234789101112
1--0.01040.0681 *0.0441 *0.1493 *0.1454 *0.1544 *0.1295 *0.1424 *0.1579 *
25.6--0.0546 *0.0187 *0.1206 *0.1286 *0.1323 *0.1157 *0.1188 *0.1348 *
372.768.2--0.0445 *0.1195 *0.1497 *0.1387 *0.1346 *0.1179 *0.1332 *
497.692.825.5--0.1274 *0.1683 *0.1688 *0.1521 *0.1181 *0.1487 *
7372.3377.9436.3461.5--0.0358 *0.0371 *0.0318 *0.01120.0209
8311.7317.3376.4401.624.3--0.01220.00520.0356 *0.0241 *
9298.9304.5363.3388.536.113.2--0.01940.0485 *0.0261 *
10225.1230.5295.4320.9113.8105.496.2--0.0244 *0.0286 *
11365.8371.2414.7437.4153.3138.0138.0221.5--0.0220 *
12497.9501.3506.5518.5439.3419.8415.4471.3291.0--
Table 5. Number of miracidia collected from participants and genotyped with Cox1 and microsatellites for each of the sampling site.
Site NoSampling SiteNo. of ChildrenNo. of Miracidia CollectedNo. of Miracidia Genotyped with Cox1No. of Miracidia Genotyped with Microsatellites
1Ipogun102689574
2Ilara-Mokin20560156206
3Alie Ilie18405152219
4Lie Twon112797476
5Ikwo382300
6Ohaozara12279660
7Onicha122778477
8Ishielu1227810390
9Nkanu east1741816487
10Anambra west122799077
11Gwer east2046519361
12Jos north18417162169
Total165400713641136
Publisher’s Note: MDPI stays neutral with regard to jurisdictional claims in published maps and institutional affiliations.

