
The Origin and Maintenance of Tuberculosis Is Explained by the Induction of Smear-Negative Disease in the Paleolithic


Abstract
:1. Introduction
2. Results
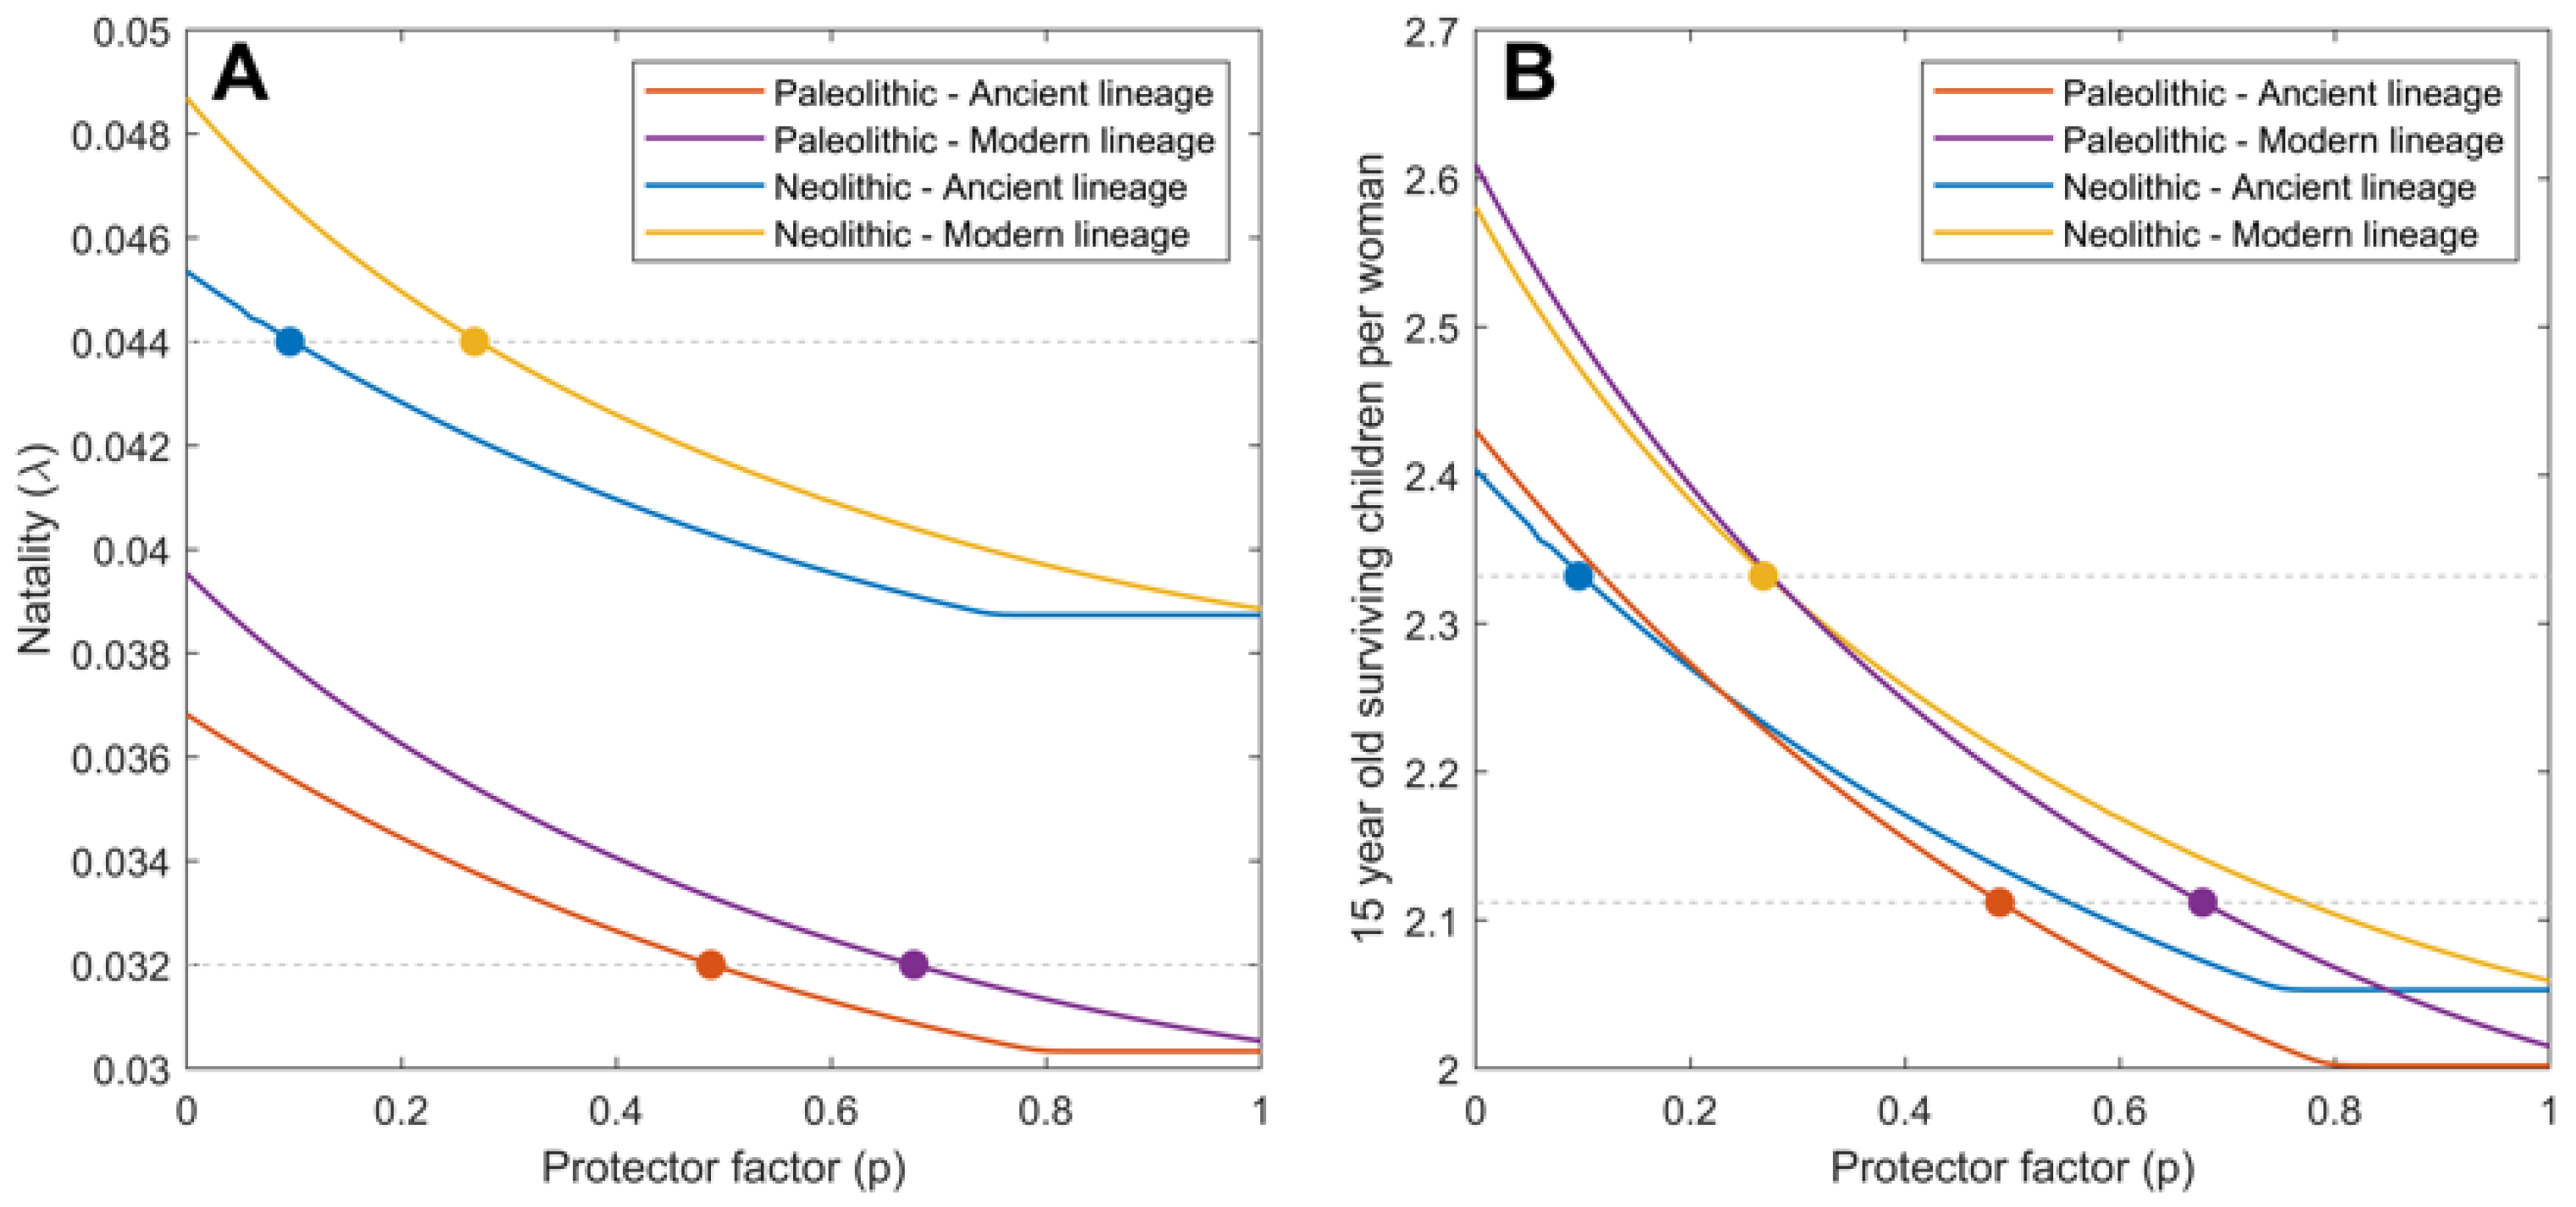
2.1. Mtb Infection in the Paleolithic Was Possible Thanks to High Smear-Negative Proportion (p) Values
2.2. Ancient Lineages Had to Be More Virulent in the Paleolithic in Order to Sustain Mtb Infection but They Offered a Better Recovery Rate
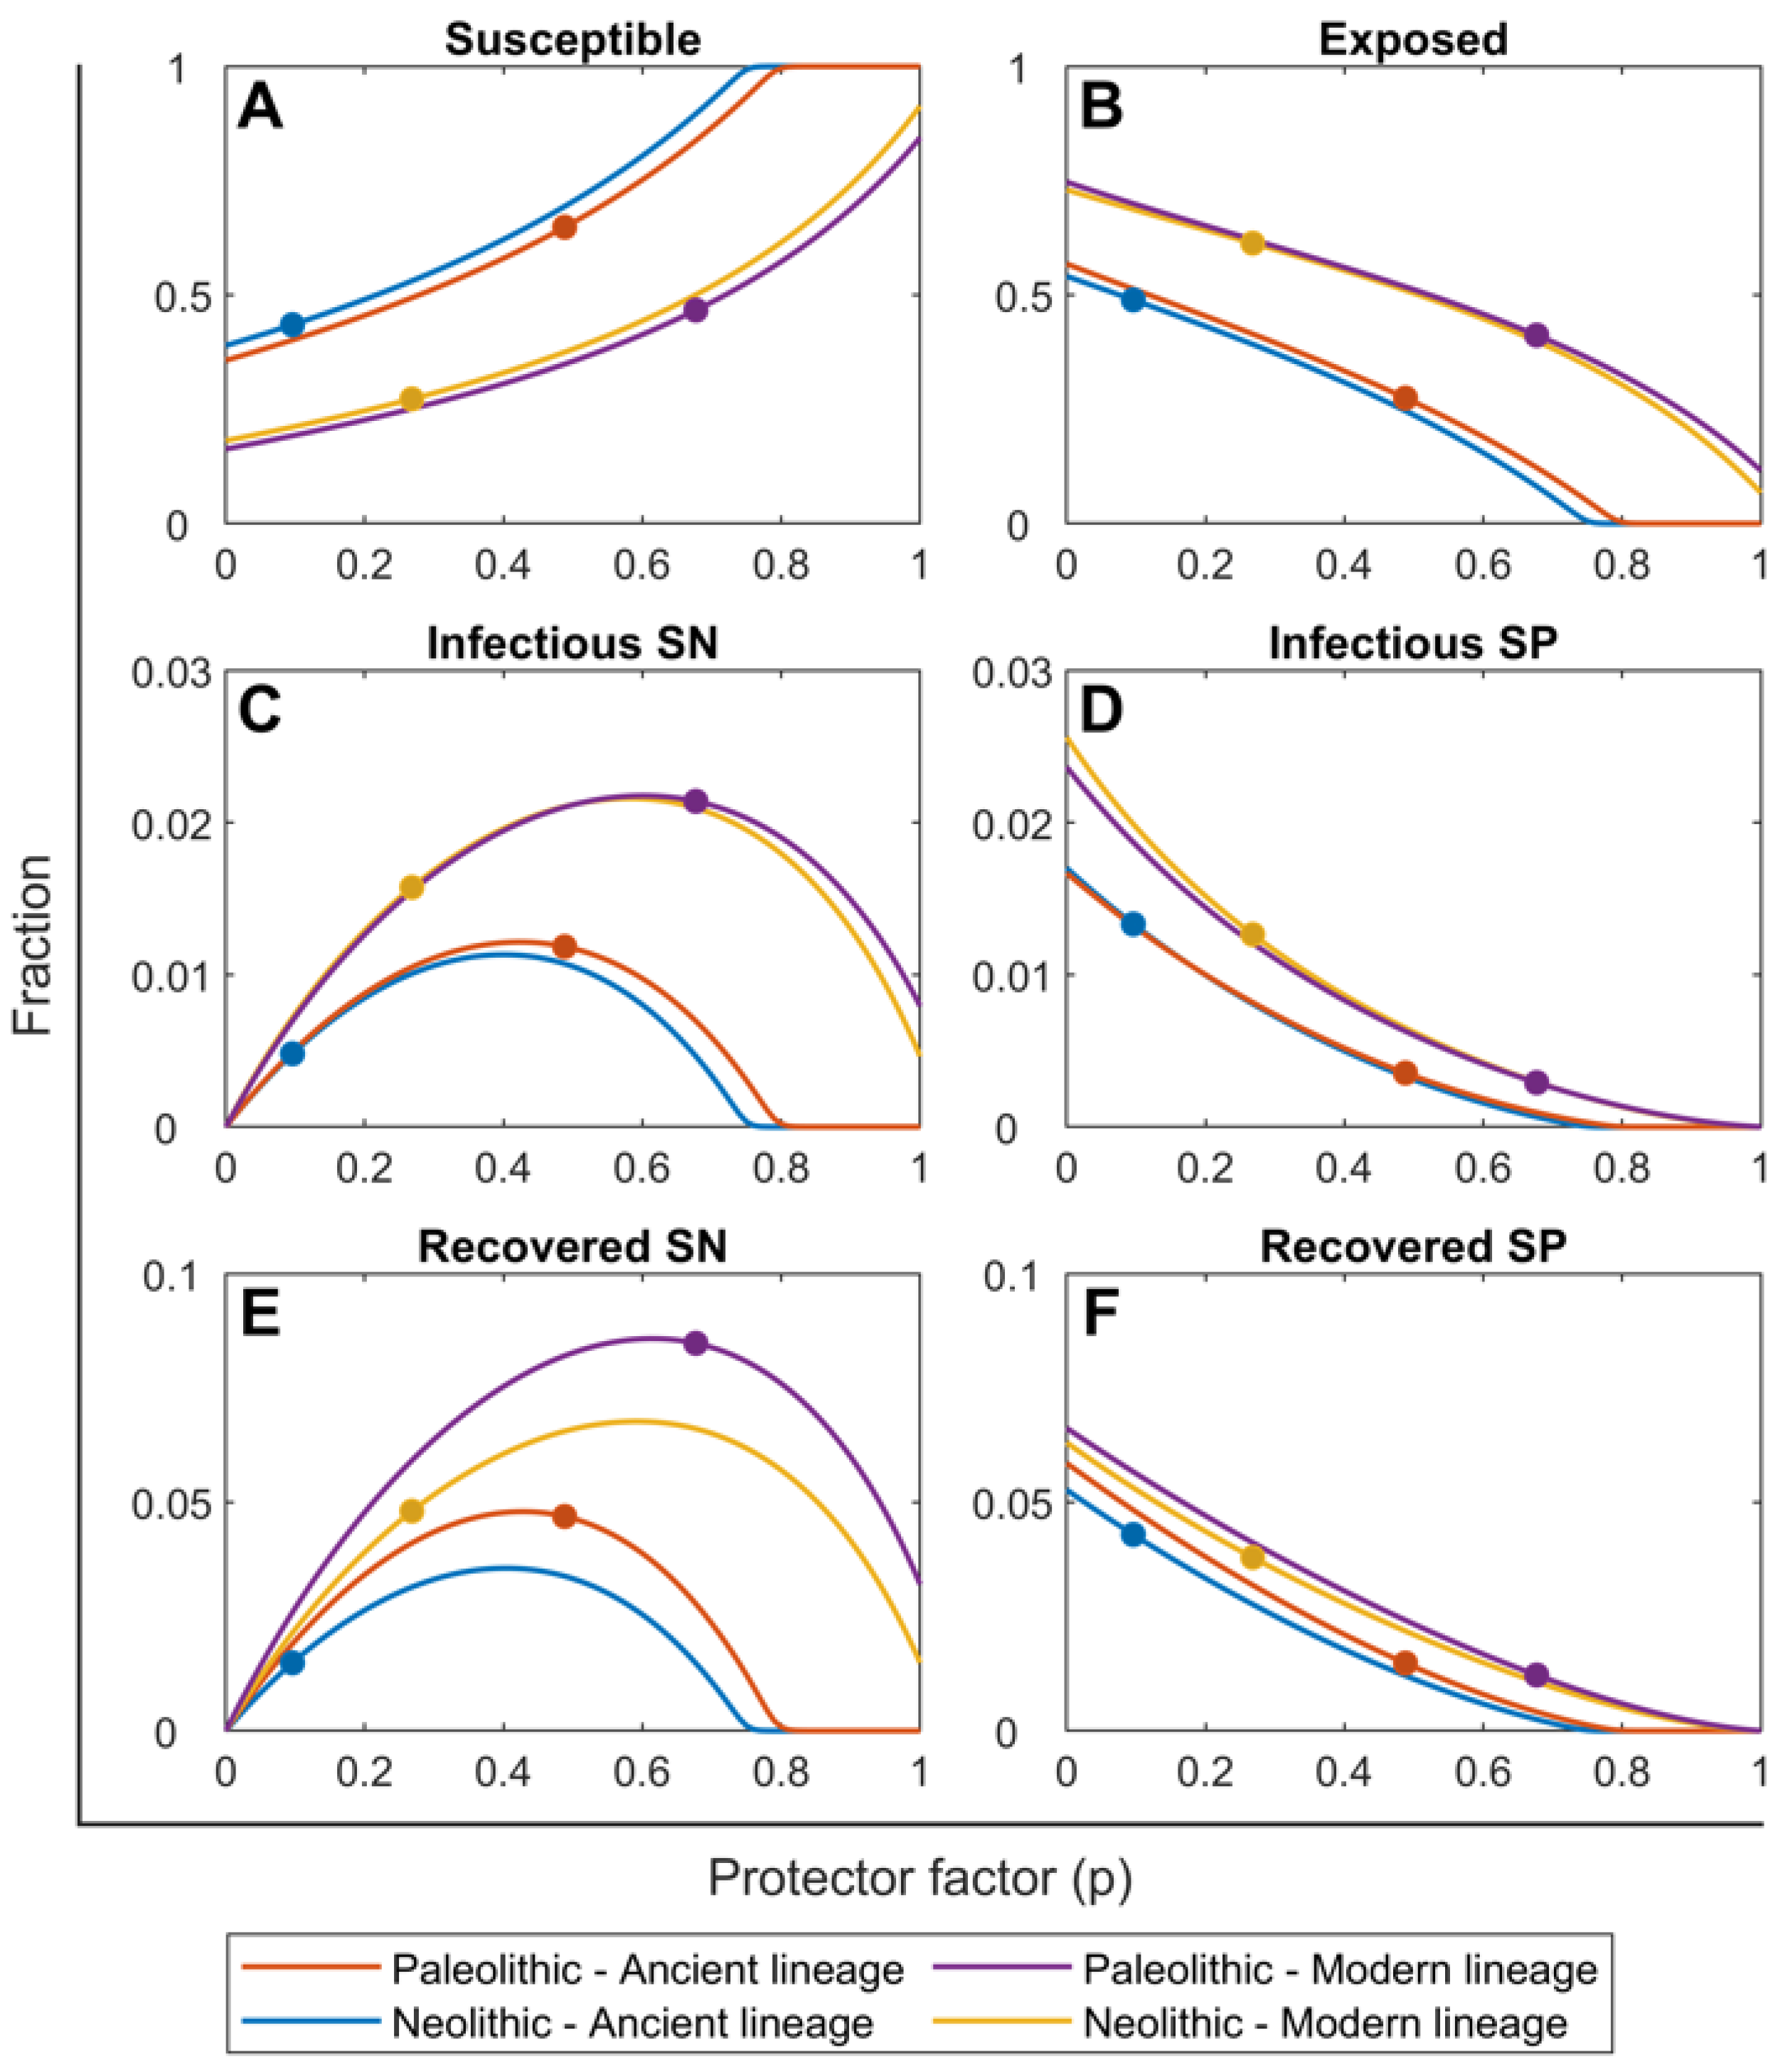
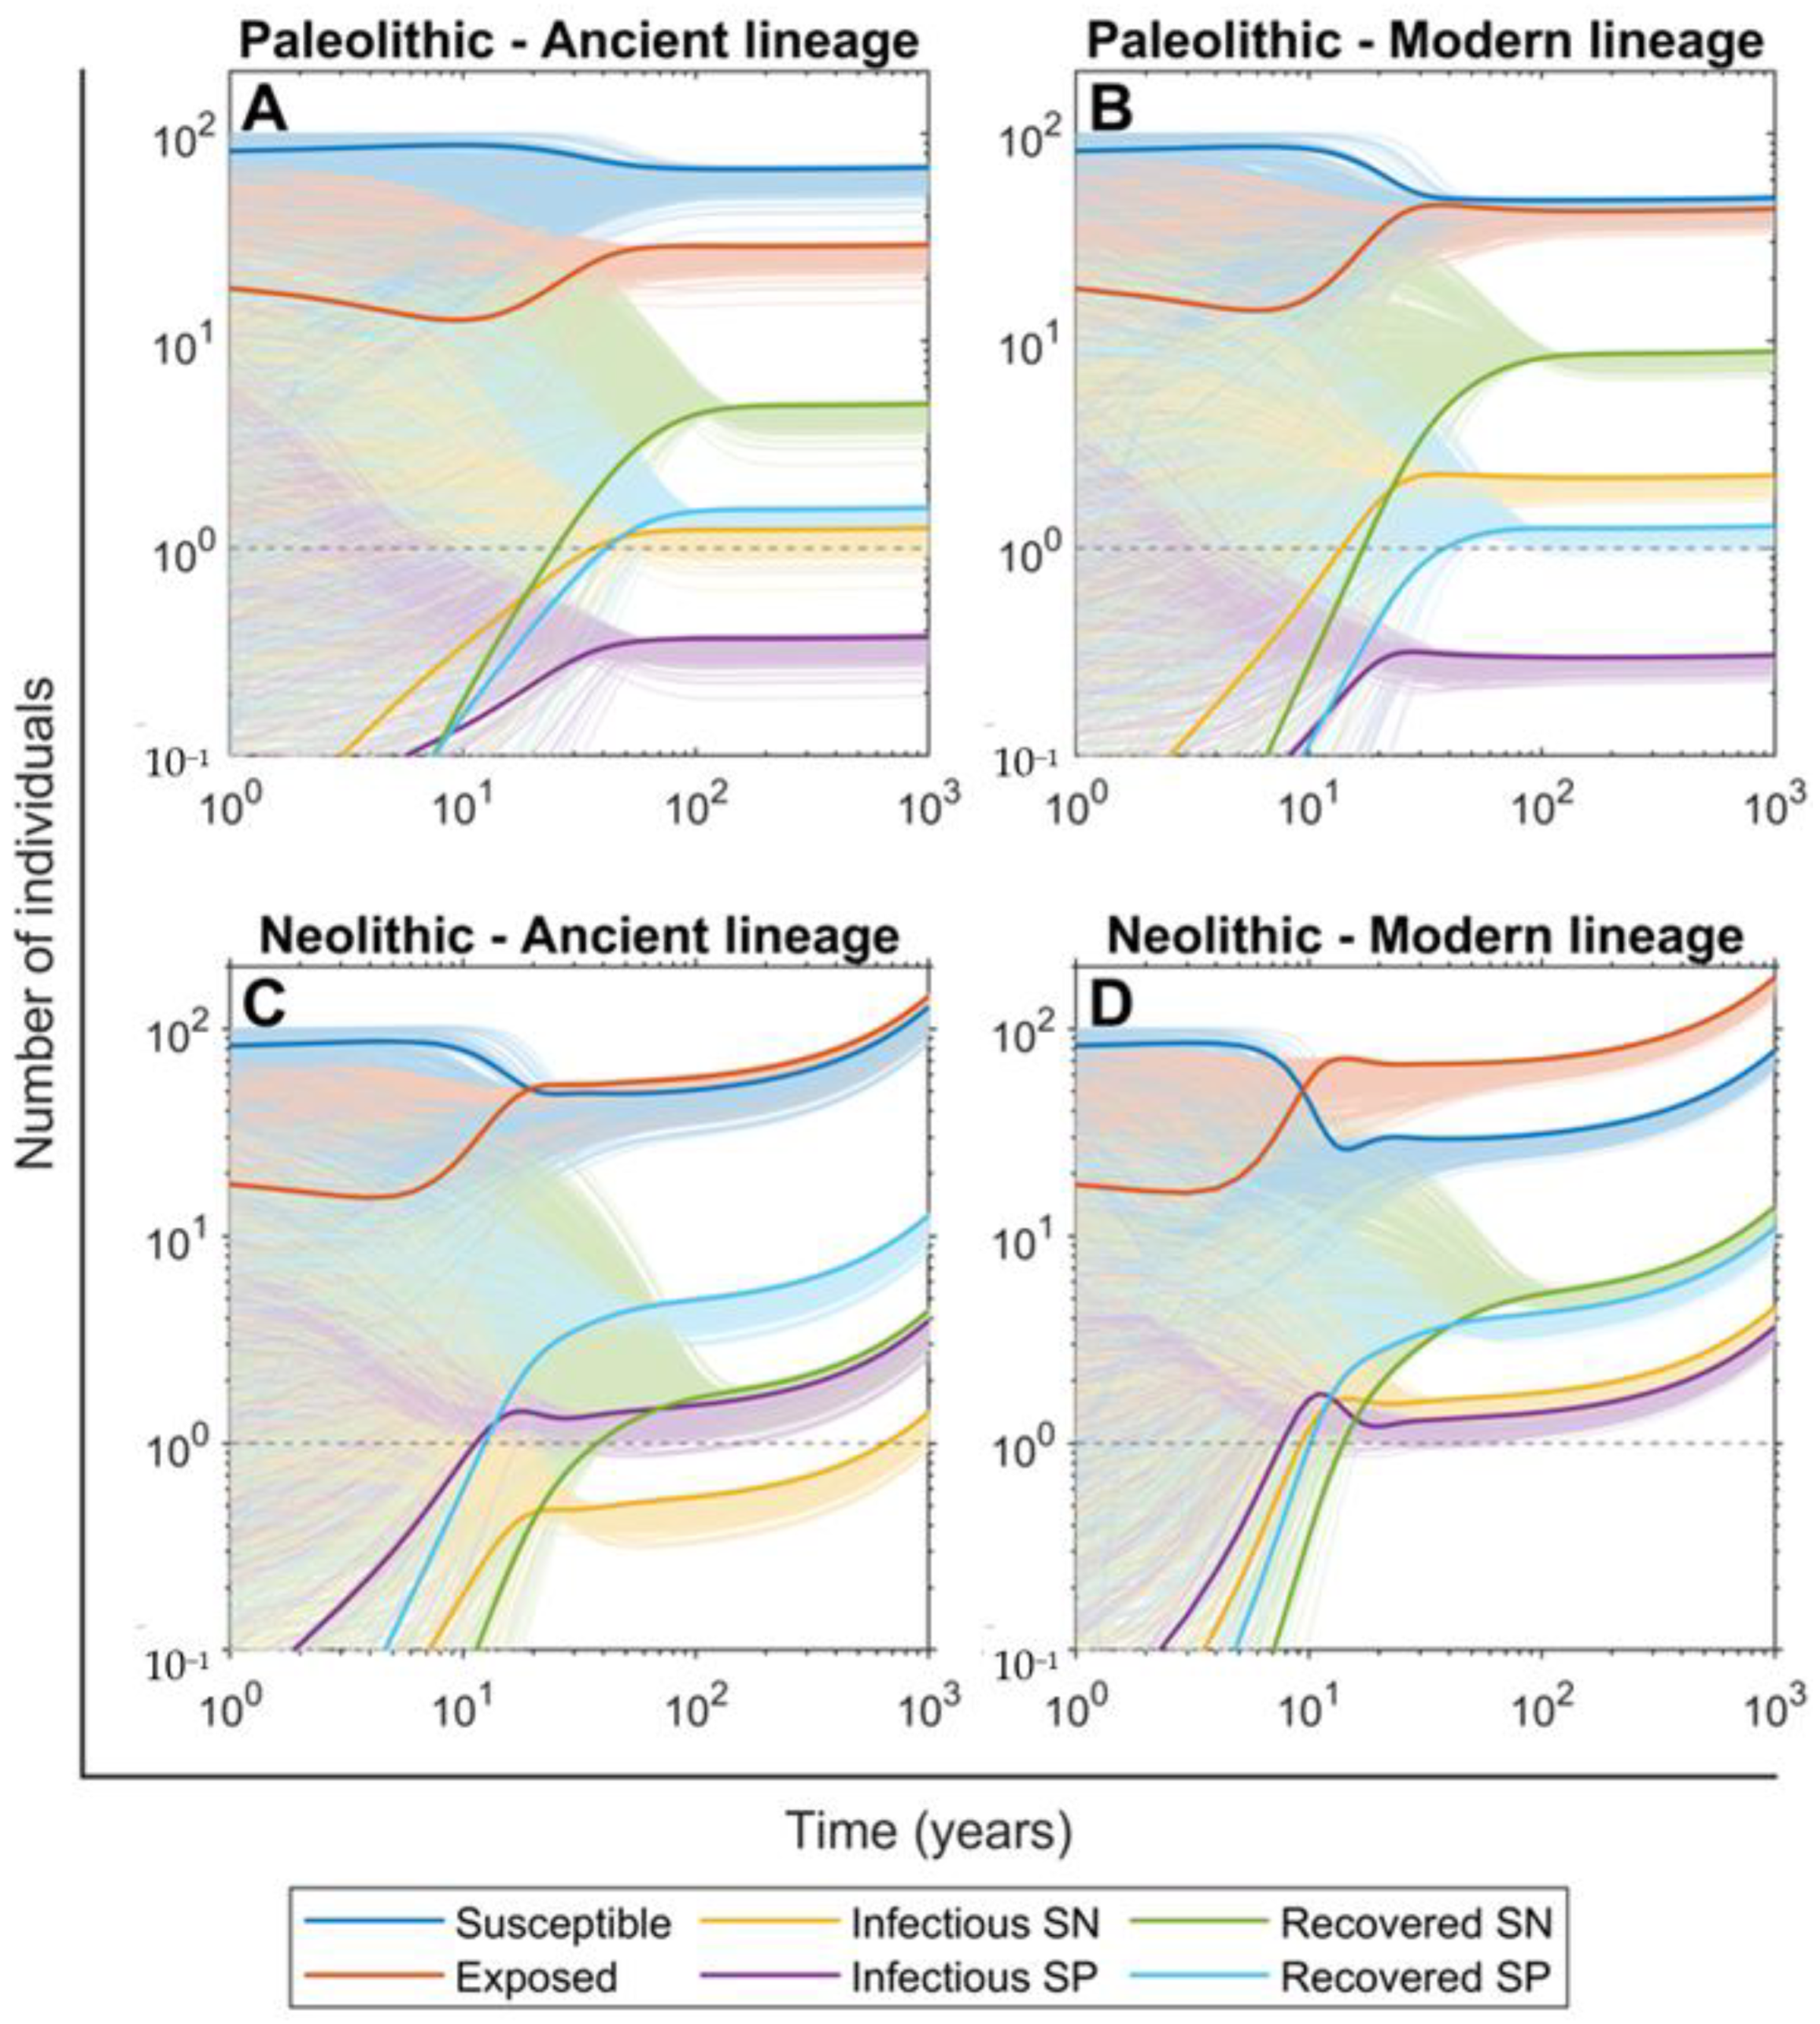
2.3. The SN Recovered Cases Were Crucial for Maintaining Mtb Infection in the Paleolithic While the Neolithic Era Was Marked by the Arrival of SP Lesions
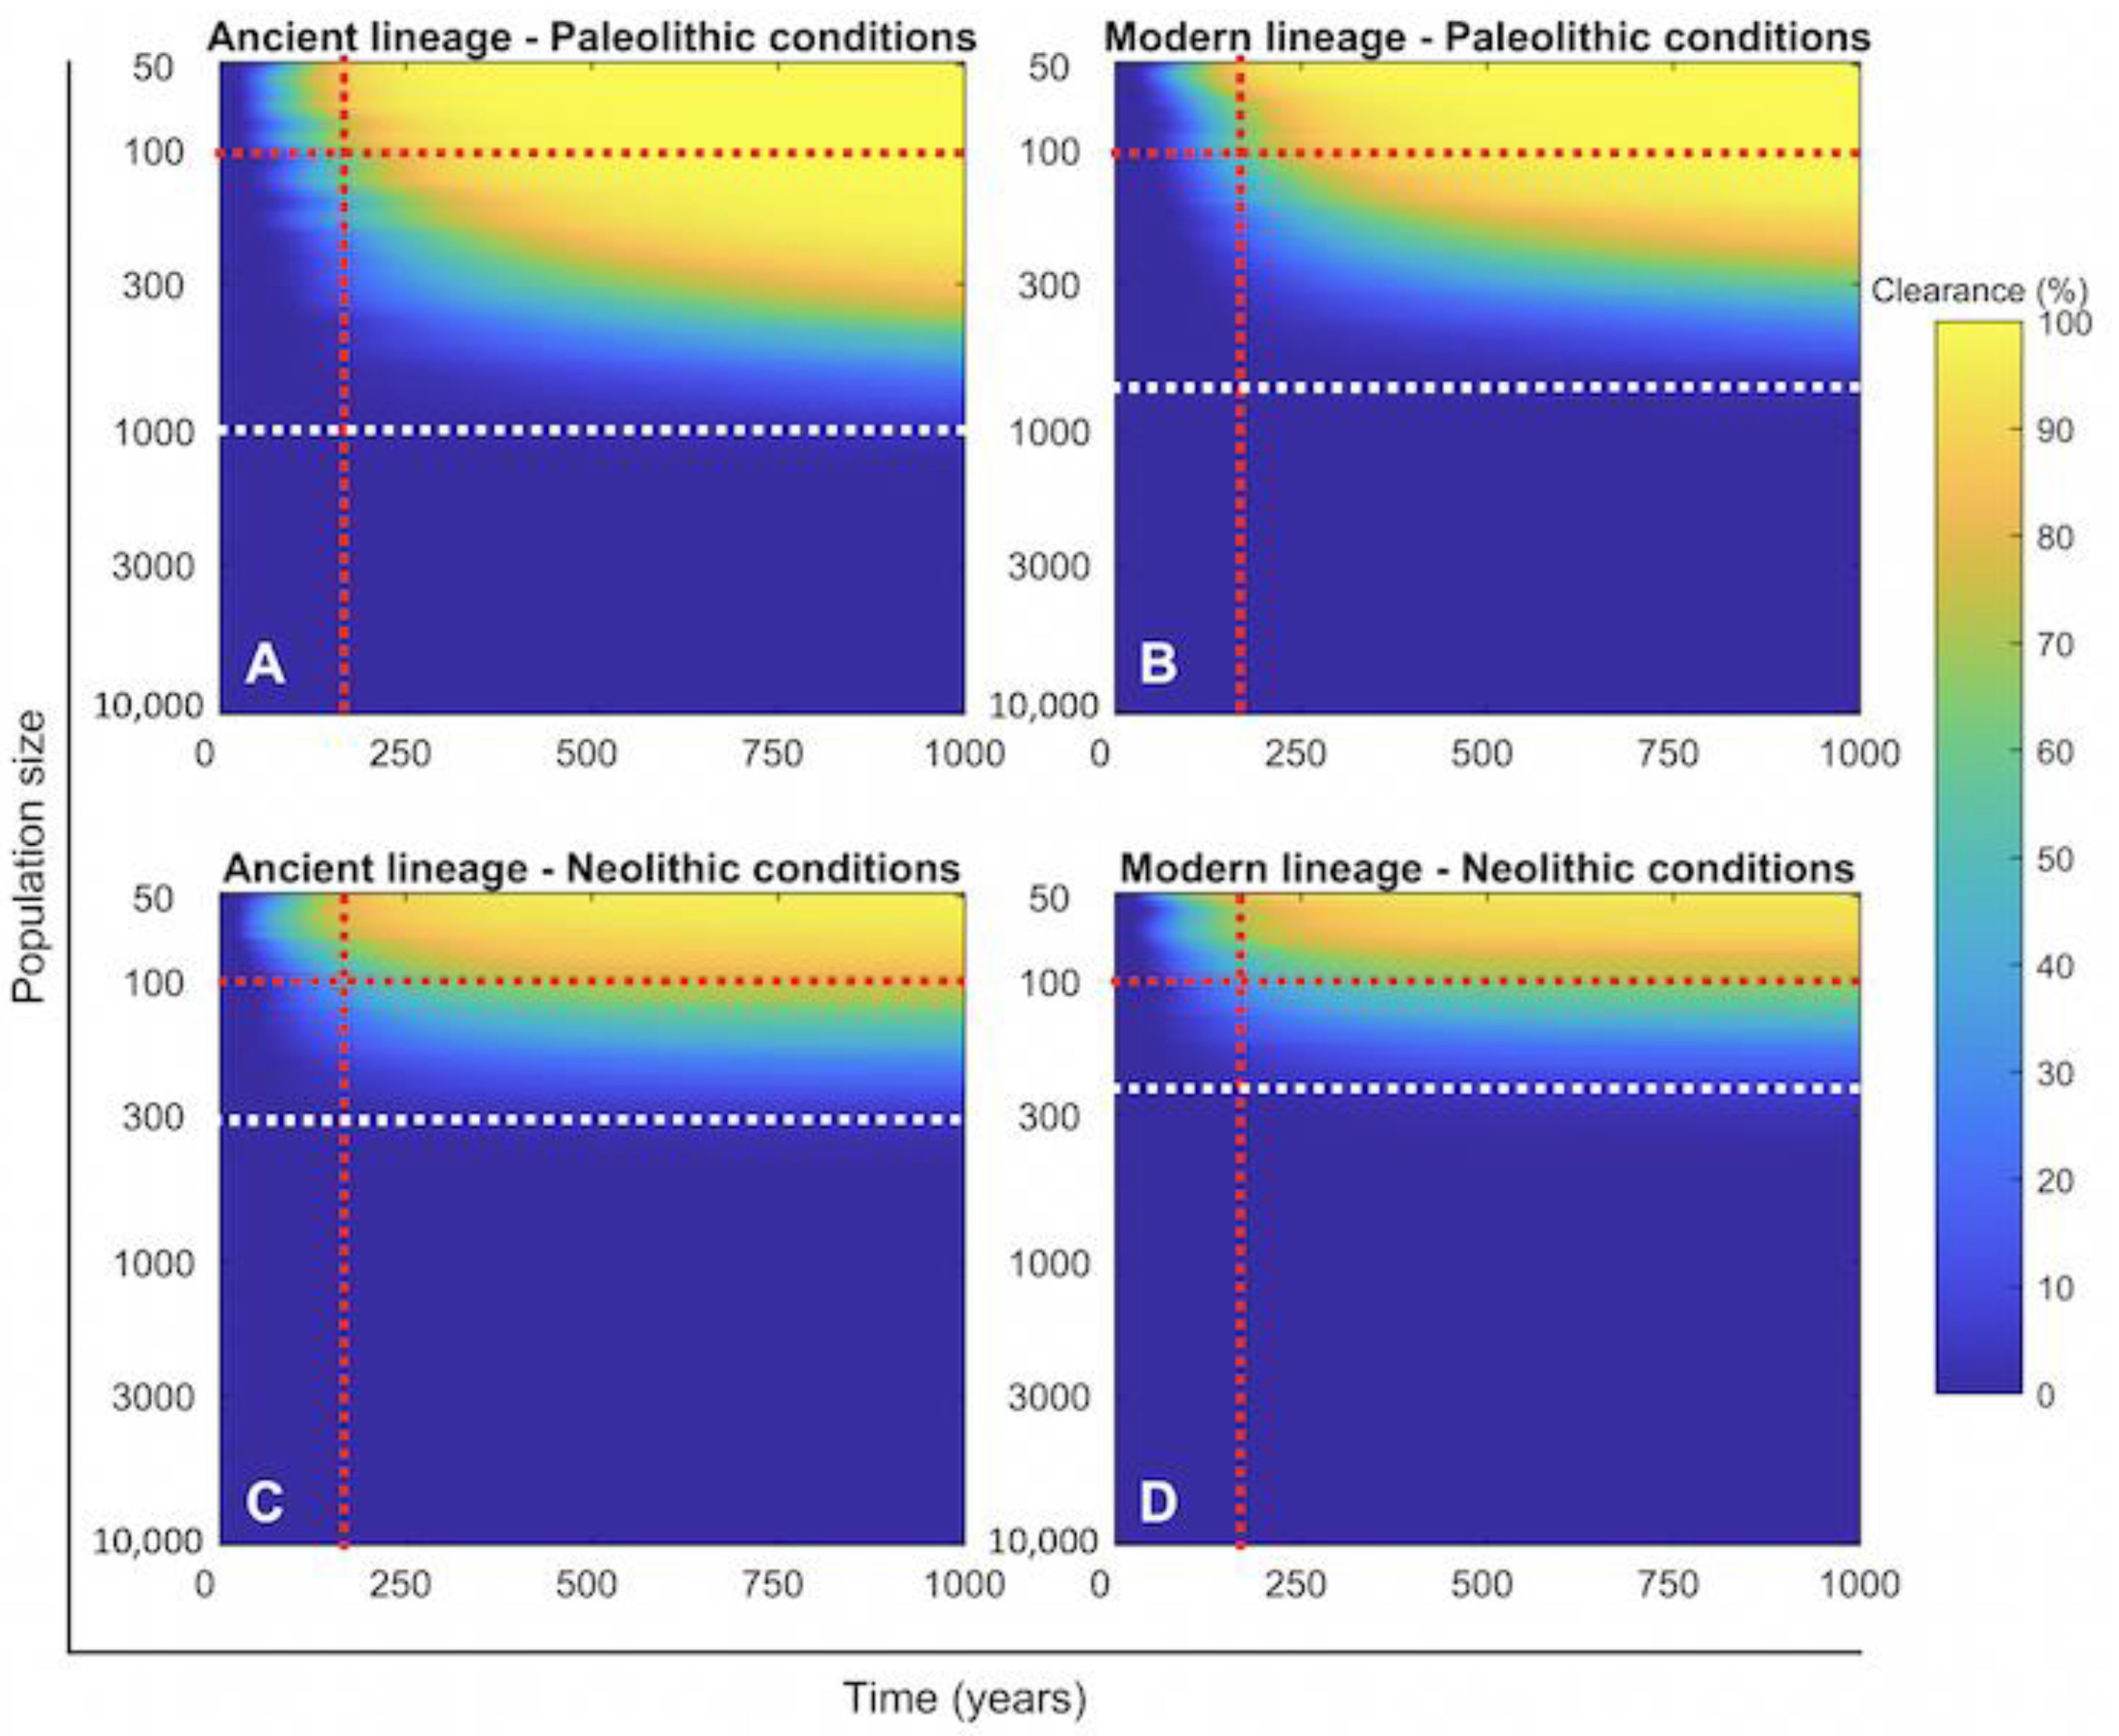
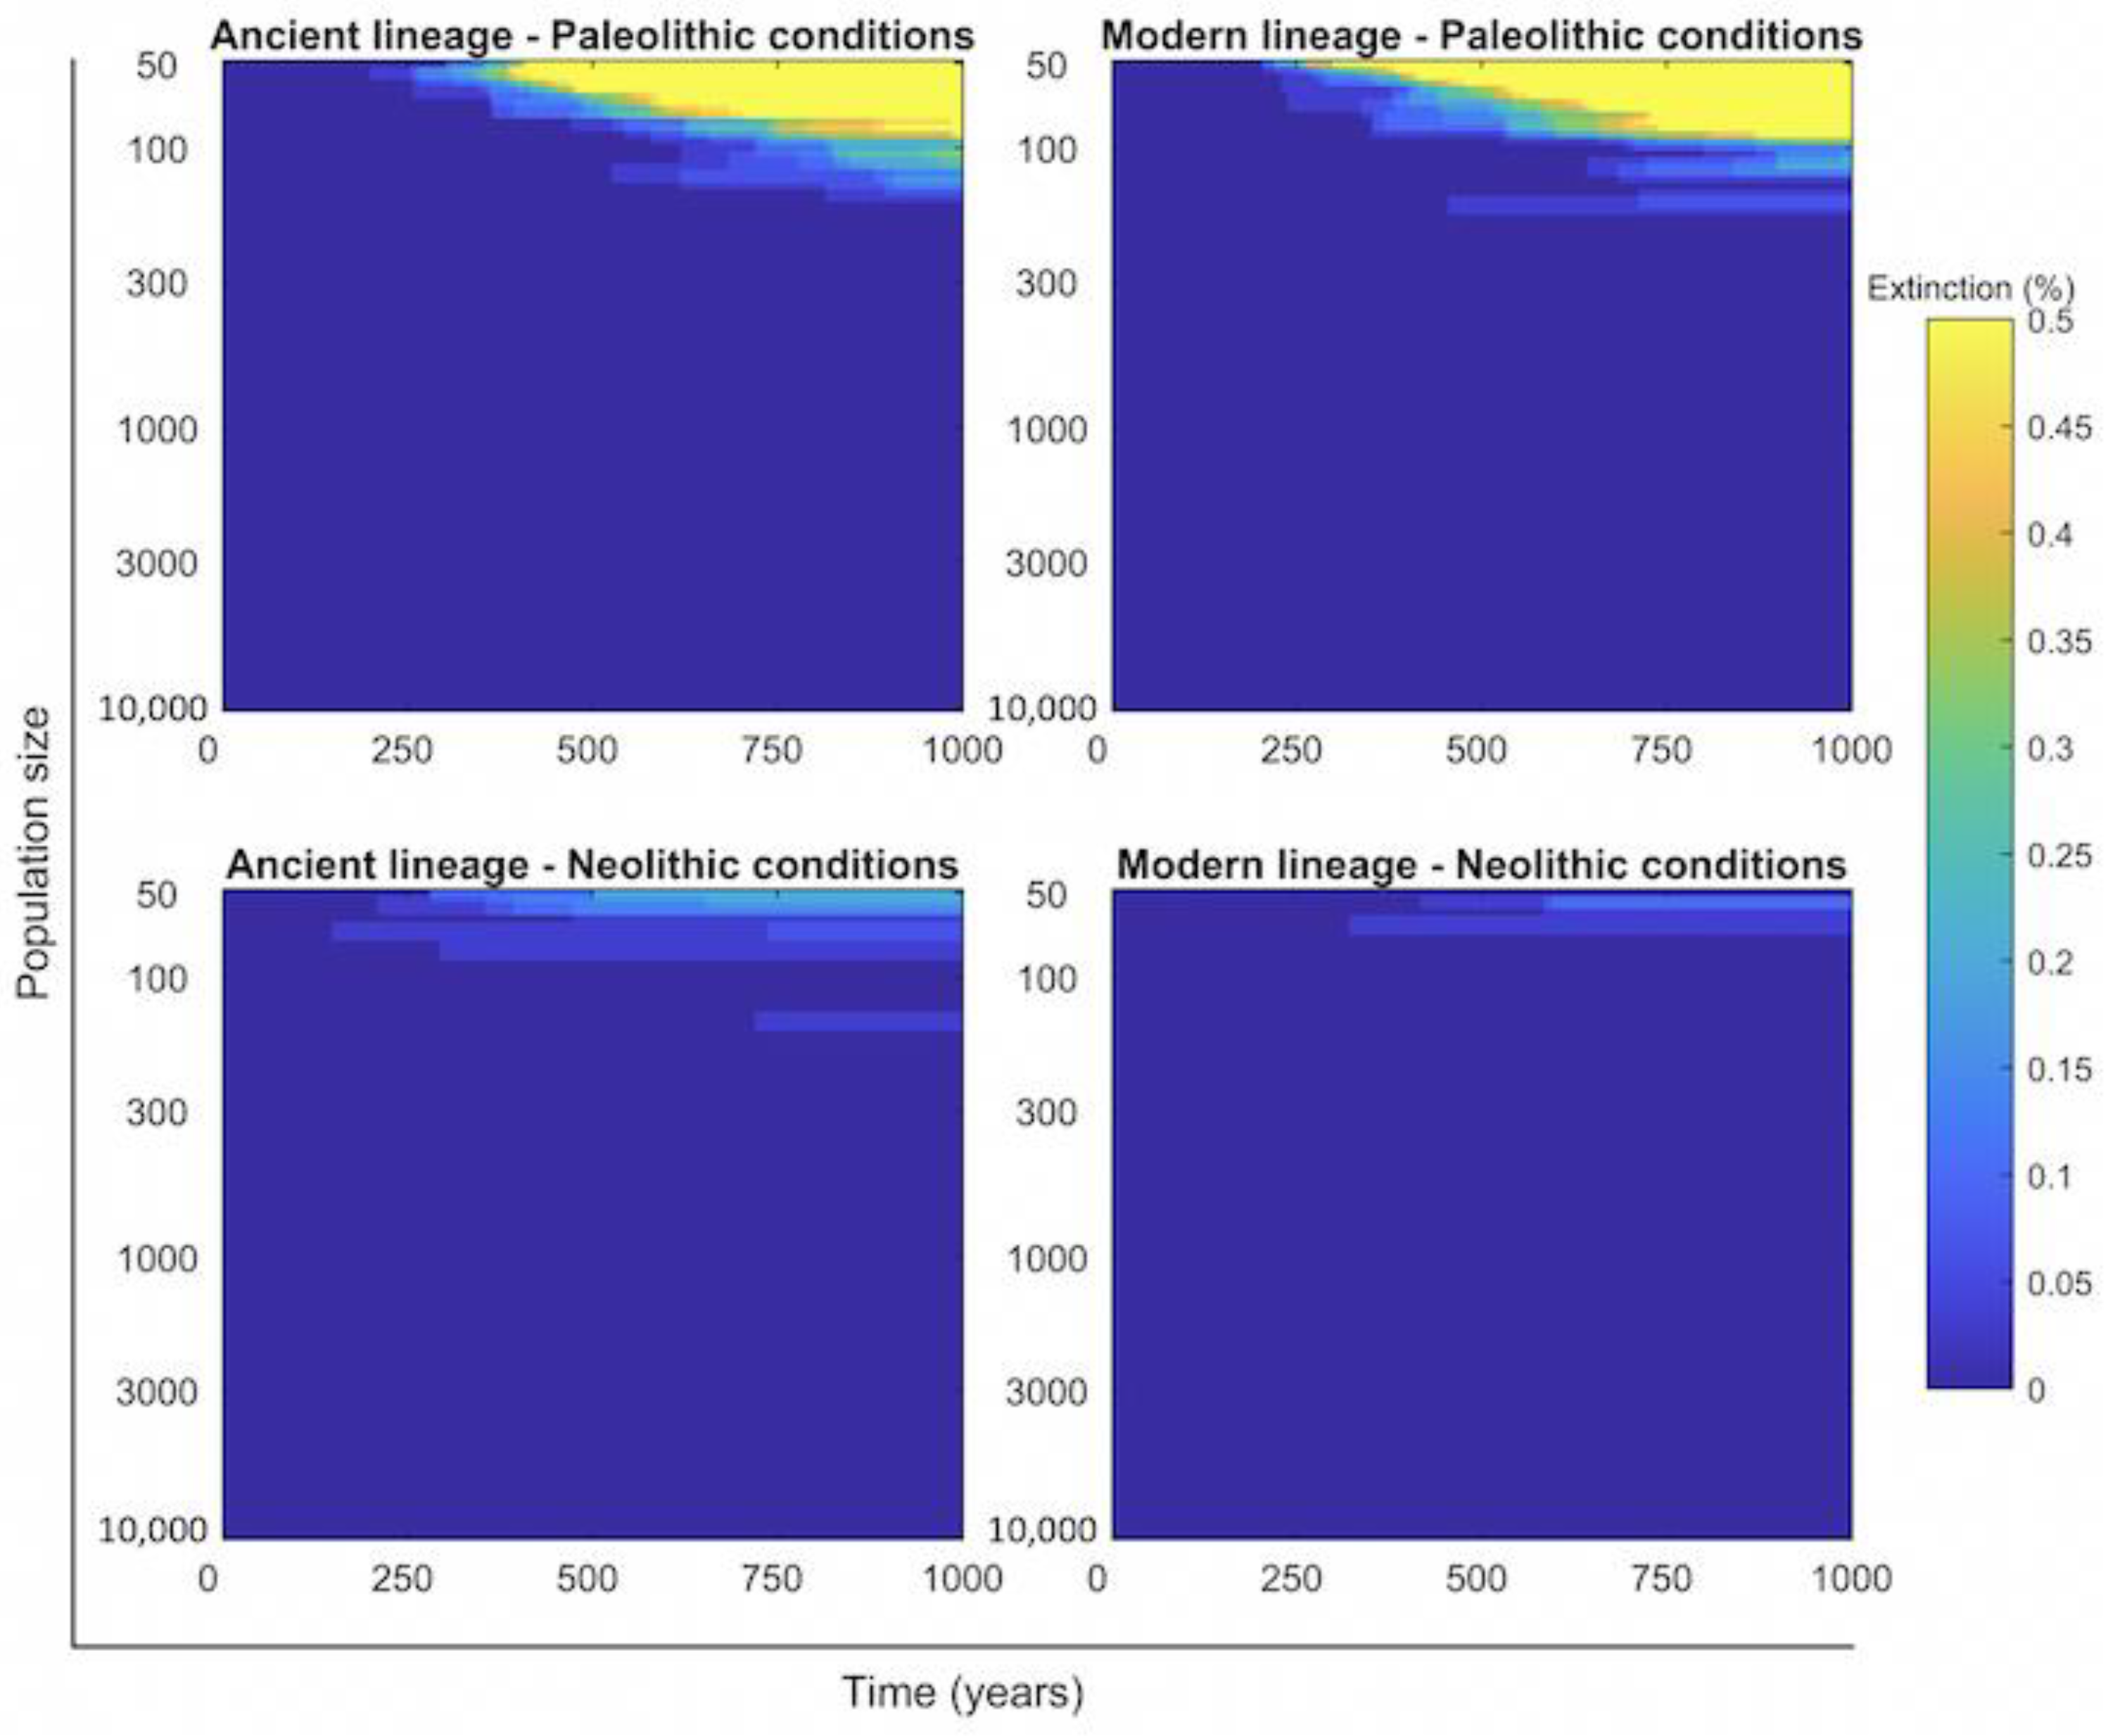
2.4. Persistence of Mtb Infection Required Interrelations among Hunter–Gatherer Groups in the Paleolithic While the Risk of Human Extinction Was Negligible
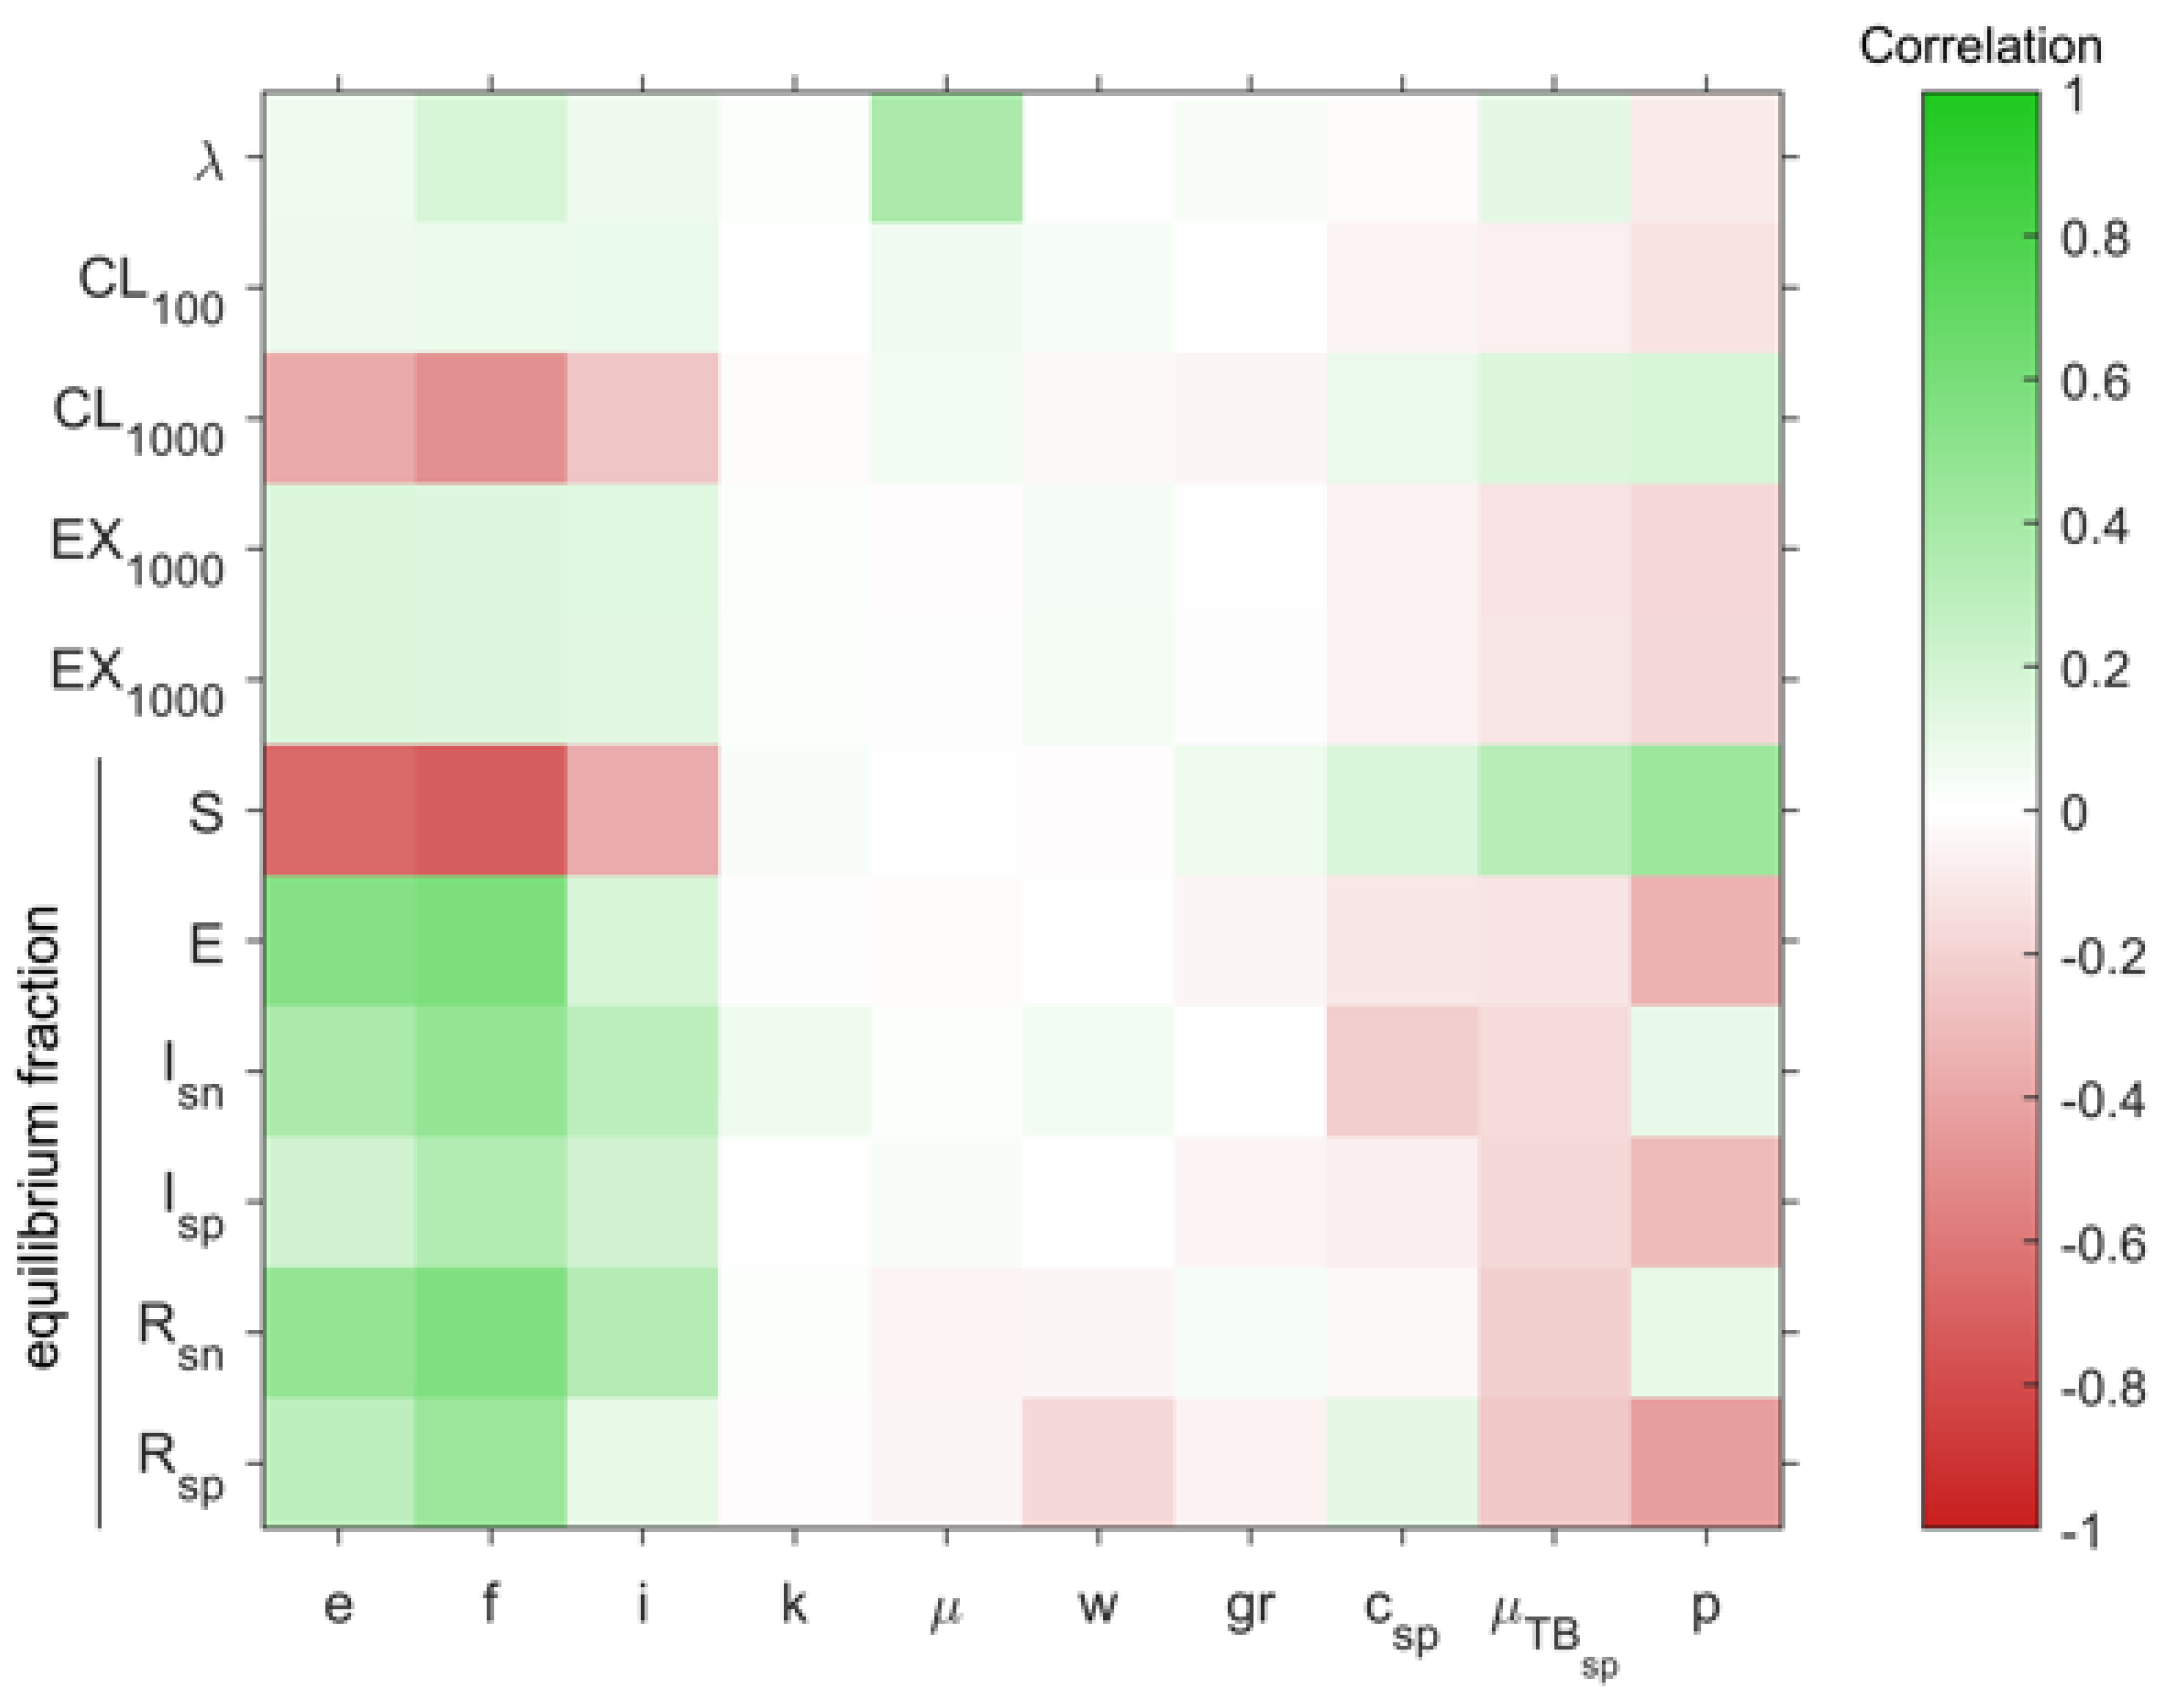
2.5. The Number of People Infected Per Case and Fast Progression to Disease Are the Most Important Factors in Maintaining TB in Existence
3. Discussion
4. Methodology
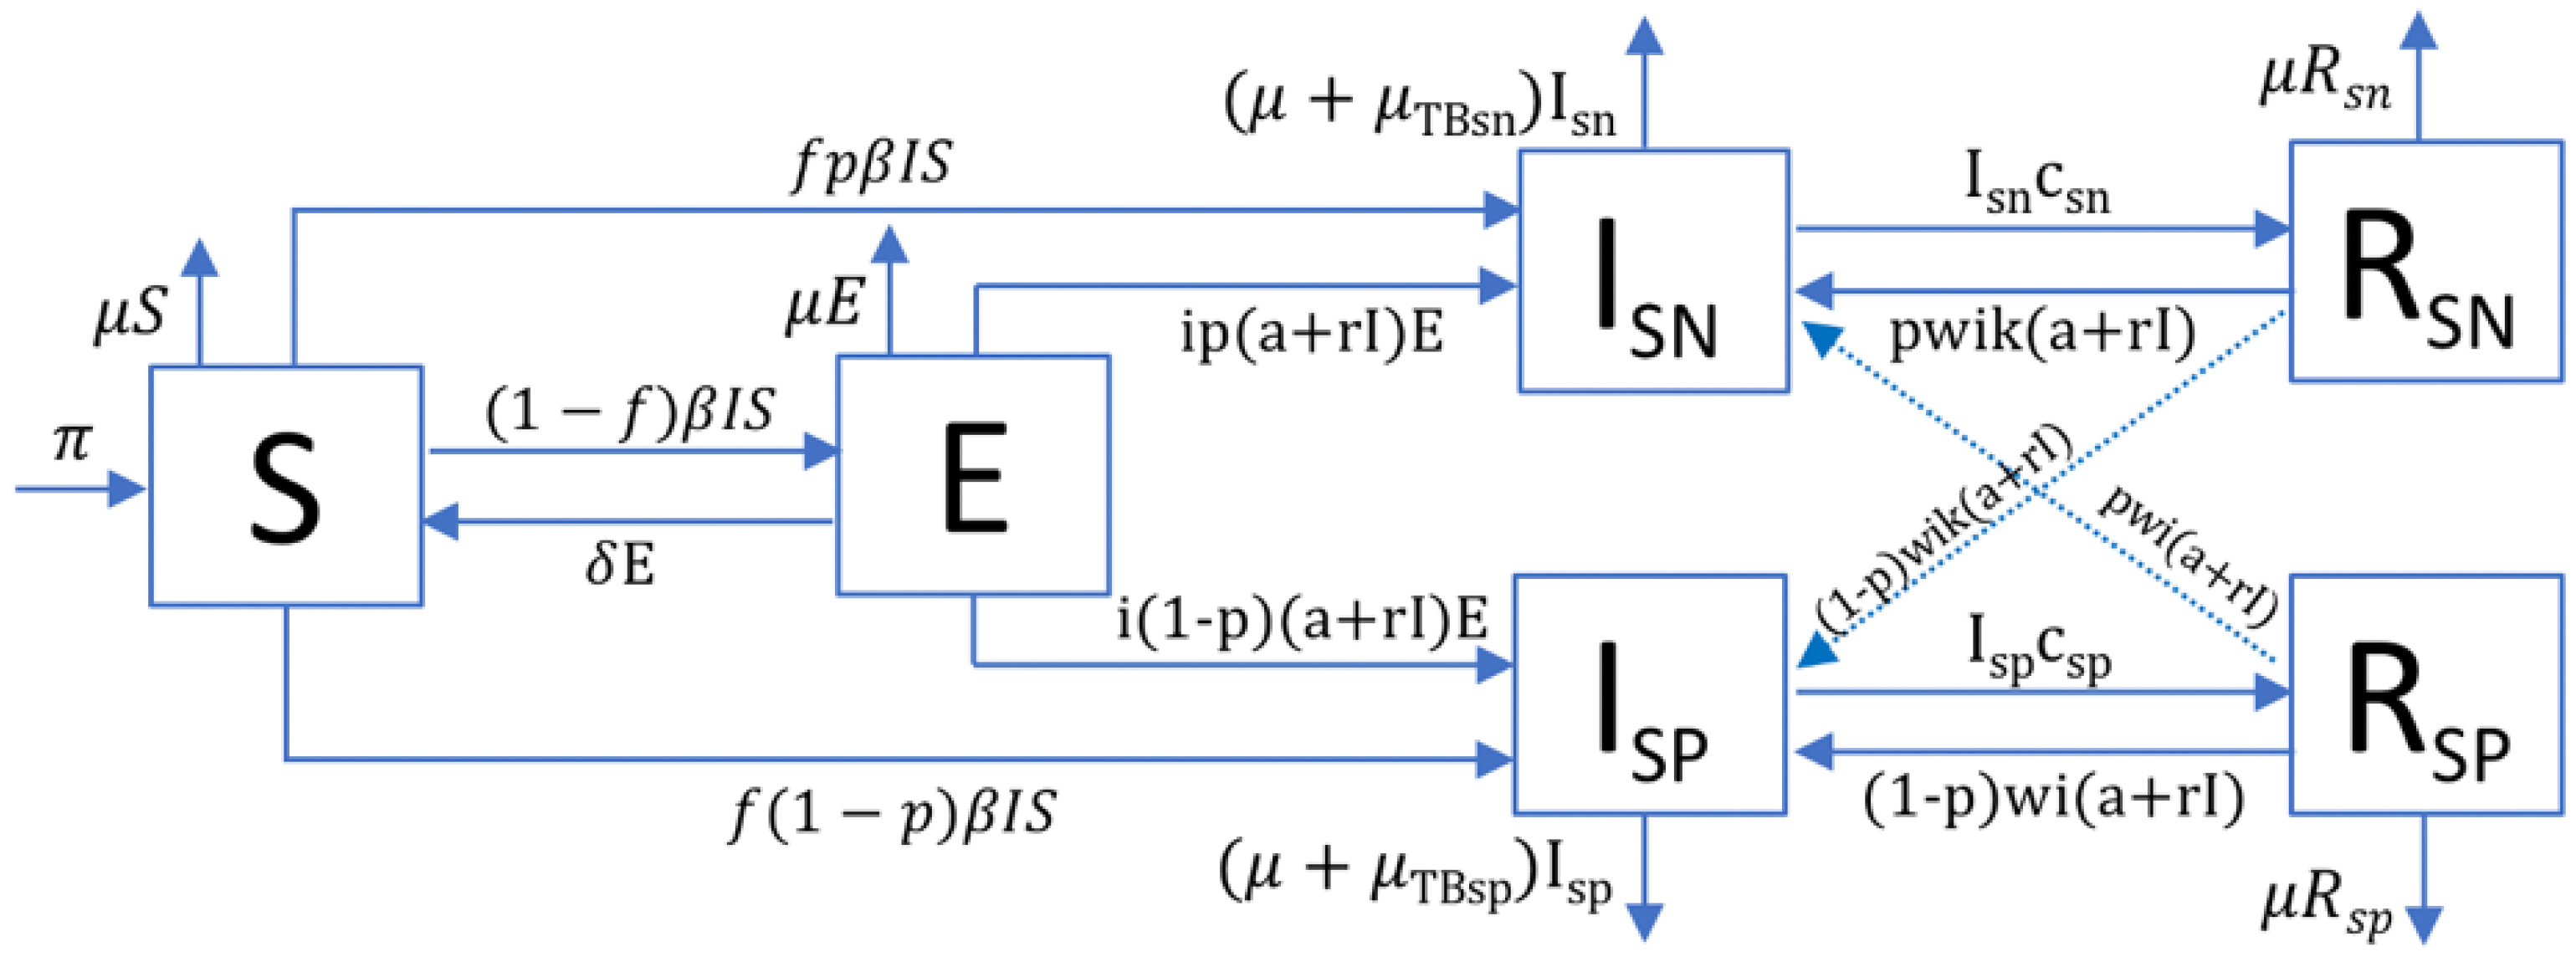
4.1. TBSpectr Model
4.2. Assessment of Uncertainty and Sensitivity in the System
4.3. Continuous and Discrete Resolution of the Models
Supplementary Materials
Author Contributions
Funding
Institutional Review Board Statement
Informed Consent Statement
Acknowledgments
Conflicts of Interest
References
- Comas, I.; Coscolla, M.; Luo, T.; Borrell, S.; Holt, K.E.; Kato-Maeda, M.; Parkhill, J.; Malla, B.; Berg, S.; Thwaites, G.; et al. Out-of-Africa migration and Neolithic coexpansion of Mycobacterium tuberculosis with modern humans. Nat. Genet. 2013, 45, 1176–1182. [Google Scholar] [CrossRef] [PubMed]
- Atkinson, Q.D.; Gray, R.D.; Drummond, A.J. mtDNA variation predicts population size in humans and reveals a major Southern Asian chapter in human prehistory. Mol. Biol. Evol. 2008, 25, 468–474. [Google Scholar] [CrossRef] [PubMed] [Green Version]
- Miller, E.F.; Manica, A.; Amos, W. Global demographic history of human populations inferred from whole mitochondrial genomes. R. Soc. Open Sci. 2018, 5, 180543. [Google Scholar] [CrossRef] [PubMed] [Green Version]
- Paulson, T. Epidemiology: A mortal foe. Nature 2013, 502, S2–S3. [Google Scholar] [CrossRef] [PubMed]
- Stead, W. Variation in vulnerability to tuberculosis in America today: Random, or legacies of different ancestral epidemics? Int. J. Tuberc. Lung Dis. 2001, 5, 807–814. [Google Scholar] [PubMed]
- Dubos, R.; Dubos, J. The White Plague: Tuberculosis, Man, and Society; Rutgers University Press: New Brunswick, NJ, USA, 1987; 277p, Available online: https://books.google.es/books?id=DcgZbgSOPBAC&printsec=frontcover&hl=ca&source=gbs_ViewAPI&redir_esc=y#v=onepage&q&f=false (accessed on 12 September 2019).
- Stead, W.W. The origin and erratic global spread of tuberculosis. How the past explains the present and is the key to the future. Clin. Chest Med. 1997, 18, 65–77. [Google Scholar] [CrossRef]
- Barberis, I.; Bragazzi, N.L.; Galluzzo, L.; Martini, M. The history of tuberculosis: From the first historical records to the isolation of Koch’s bacillus. J. Prev. Med. Hyg. 2017, 58, E9–E12. [Google Scholar] [PubMed]
- Roguin, A. Rene Theophile Hyacinthe Laënnec (1781–1826): The man behind the stethoscope. Clin. Med. Res. 2006, 4, 230–235. [Google Scholar] [CrossRef] [PubMed] [Green Version]
- Henn, B.M.; Cavalli-Sforza, L.L.; Feldman, M.W. The great human expansion. Proc. Natl. Acad. Sci. USA 2012, 109, 17758–17764. [Google Scholar] [CrossRef] [Green Version]
- Oppenheimer, S. Out-of-Africa, the peopling of continents and islands: Tracing uniparental gene trees across the map. Philos. Trans. R. Soc. Lond. B. Biol. Sci. 2012, 367, 770–784. [Google Scholar] [CrossRef] [Green Version]
- Tryon, C.A.; Faith, J.T. A demographic perspective on the Middle to Later Stone Age transition from Nasera rockshelter, Tanzania. Philos. Trans. R. Soc. Lond. B. Biol. Sci. 2016, 371, 20150238. [Google Scholar] [CrossRef] [PubMed]
- Cohen, M.N. The Food Crisis in Prehistory: Overpopulation and the Origins of Agriculture; Yale University Press: New Haven, CT, USA, 1977; 341p, Available online: https://yalebooks.yale.edu/book/9780300023510/food-crisis-prehistory (accessed on 12 September 2019).
- Johnson, A.W.; Earle, T.K. The Evolution of Human Societies: From Foraging Group to Agrarian State; Stanford University Press: Redwood, CA, USA, 1987; 360p, Available online: https://books.google.es/books/about/The_Evolution_of_Human_Societies.html?id=m7eGx61SSioC&redir_esc=y (accessed on 12 September 2019).
- Volk, A.A.; Atkinson, J.A. Infant and child death in the human environment of evolutionary adaptation. Evol. Hum. Behav. 2013, 34, 182–192. [Google Scholar] [CrossRef]
- Armelagos, G.J.; Goodman, A.H.; Jacobs, K.H. The origins of agriculture: Population growth during a period of declining health. Popul. Environ. 1991, 13, 9–22. [Google Scholar] [CrossRef]
- Gurven, M.; Kaplan, H. Longevity Among Hunter- Gatherers: A Cross-Cultural Examination. Popul. Dev. Rev. 2007, 33, 321–365. [Google Scholar] [CrossRef]
- Coscolla, M.; Gagneux, S. Consequences of genomic diversity in Mycobacterium tuberculosis. Semin. Immunol. 2014, 26, 431–444. [Google Scholar] [CrossRef] [PubMed] [Green Version]
- Cardona, P.-J.; Català, M.; Prats, C. Origin of tuberculosis in the Paleolithic predicts unprecedented population growth and female resistance. Sci. Rep. 2020, 10, 42. [Google Scholar] [CrossRef] [PubMed]
- Brites, D.; Gagneux, S. Co-evolution of Mycobacterium tuberculosis and Homo sapiens. Immunol. Rev. 2015, 264, 6–24. [Google Scholar] [CrossRef]
- Bentley, R.A.; Bickle, P.; Fibiger, L.; Nowell, G.M.; Dale, C.W.; Hedges, R.E.M.; Hamilton, J.; Wahl, J.; Francken, M.; Grupe, G.; et al. Community differentiation and kinship among Europe’s first farmers. Proc. Natl. Acad. Sci. USA 2012, 109, 9326–9330. [Google Scholar] [CrossRef] [Green Version]
- Scheidel, W. The Great Leveler: Violence and the History of Inequality from the Stone Age to the Twenty-First Century; Princeton University Press: Princeton, NJ, USA, 2018; 504p, Available online: https://press.princeton.edu/books/paperback/9780691183251/the-great-leveler (accessed on 25 January 2021).
- Guzmán, R.A.; Weisdorf, J. The Neolithic Revolution from a price-theoretic perspective. J. Dev. Econ. 2011, 96, 209–219. [Google Scholar] [CrossRef] [Green Version]
- Blaser, M.J.; Kirschner, D. The equilibria that allow bacterial persistence in human hosts. Nature 2007, 449, 843–849. [Google Scholar] [CrossRef]
- Zheng, N.; Whalen, C.C.; Handel, A. Modeling the potential impact of host population survival on the evolution of M. tuberculosis latency. PLoS ONE 2014, 9, e105721. [Google Scholar] [CrossRef] [PubMed]
- Blower, S.M.; McLean, A.R.; Porco, T.C.; Small, P.M.; Hopewell, P.C.; Sanchez, M.A.; Moss, A.R. The intrinsic transmission dynamics of tuberculosis epidemics. Nat. Med. 1995, 1, 815–821. [Google Scholar] [CrossRef]
- Porco, T.C.; Blower, S.M. Quantifying the intrinsic transmission dynamics of tuberculosis. Theor. Popul. Biol. 1998, 54, 117–132. [Google Scholar] [CrossRef] [PubMed] [Green Version]
- Menzies, N.A.; Wolf, E.; Connors, D.; Bellerose, M.; Sbarra, A.N.; Cohen, T.; Hill, A.N.; Yaesoubi, R.; Galer, K.; White, P.J.; et al. Progression from latent infection to active disease in dynamic tuberculosis transmission models: A systematic review of the validity of modelling assumptions. Lancet Infect. Dis. 2018, 18, e228–e238. [Google Scholar] [CrossRef]
- Ragonnet, R.; Flegg, J.A.; Brilleman, S.L.; Tiemersma, E.W.; Melsew, Y.A.; McBryde, E.S.; Trauer, J.M. Revisiting the Natural History of Pulmonary Tuberculosis: A Bayesian Estimation of Natural Recovery and Mortality Rates. Clin. Infect. Dis. 2021, 73, e88–e96. [Google Scholar] [CrossRef] [PubMed]
- Palaci, M.; Dietze, R.; Hadad, D.J.; Ribeiro, F.K.C.; Peres, R.L.; Vinhas, S.A.; Maciel, E.L.N.; do Valle Dettoni, V.; Horter, L.; Boom, W.H.; et al. Cavitary disease and quantitative sputum bacillary load in cases of pulmonary tuberculosis. J. Clin. Microbiol. 2007, 45, 4064–4066. [Google Scholar] [CrossRef] [PubMed] [Green Version]
- Gilligan, I. Climate, Clothing, and Agriculture in Prehistory; Cambridge University Press: Cambridge, UK, 2018; Available online: https://www.cambridge.org/core/product/identifier/9781108555883/type/book (accessed on 12 September 2019).
- Chamberlain, A.T. Demography in Archaeology; Cambridge University Press: Cambridge, UK, 2006; Available online: http://ebooks.cambridge.org/ref/id/CBO9780511607165 (accessed on 15 September 2019).
- Kaplan, H.; Hill, K.; Lancaster, J.; Hurtado, A.M. A theory of human life history evolution: Diet, intelligence, and longevity. Evol. Anthropol. Issues News Rev. 2000, 9, 156–185. [Google Scholar] [CrossRef]
- Galor, O.; Moav, O. The Neolithic Revolution and Contemporary Variations in Life Expectancy. Working Papers Brown University, Department of Economics. 2007, Volume 14, pp. 1–39. Available online: http://www.ssrn.com/abstract=1012650 (accessed on 15 September 2019). [CrossRef] [Green Version]
- Stýblo, K.; Meijer, J.; Sutherland, I. Tuberculosis Surveillance Research Unit Report No. 1: The transmission of tubercle bacilli; its trend in a human population. Bull. Int. Union Tuberc. 1969, 42, 1–104. Available online: http://www.ncbi.nlm.nih.gov/pubmed/5004883 (accessed on 15 September 2019).
- Sloot, R.; Schim van der Loeff, M.F.; Kouw, P.M.; Borgdorff, M.W. Risk of Tuberculosis after Recent Exposure. A 10-Year Follow-up Study of Contacts in Amsterdam. Am. J. Respir. Crit. Care Med. 2014, 190, 1044–1052. [Google Scholar] [CrossRef]
- Cardona, P.-J. A dynamic reinfection hypothesis of latent tuberculosis infection. Infection 2009, 37, 80–86. [Google Scholar] [CrossRef] [PubMed]
- Menzies, D. What Does Tuberculin Reactivity after Bacille Calmette-Guérin Vaccination Tell Us? Clin. Infect. Dis. 2000, 31, S71–S74. [Google Scholar] [CrossRef] [PubMed] [Green Version]
- Heimbeck, J. Incidence of tuberculosis in young adult women, with special reference to employment. Br. J. Tuberc. 1938, 32, 154–166. [Google Scholar] [CrossRef]
- Uys, P.; Brand, H.; Warren, R.; van der Spuy, G.; Hoal, E.G.; van Helden, P.D. The Risk of Tuberculosis Reinfection Soon after Cure of a First Disease Episode Is Extremely High in a Hyperendemic Community. PLoS ONE 2015, 10, e0144487. [Google Scholar] [CrossRef] [PubMed] [Green Version]
- Tiemersma, E.W.; van der Werf, M.J.; Borgdorff, M.W.; Williams, B.G.; Nagelkerke, N.J.D. Natural History of Tuberculosis: Duration and Fatality of Untreated Pulmonary Tuberculosis in HIV Negative Patients: A Systematic Review. PLoS ONE 2011, 6, e17601. [Google Scholar] [CrossRef] [PubMed]
- Menardo, F.; Duchêne, S.; Brites, D.; Gagneux, S. The molecular clock of Mycobacterium tuberculosis. PLOS Pathog. 2019, 15, e1008067. [Google Scholar] [CrossRef] [PubMed] [Green Version]
- Chisholm, R.H.; Trauer, J.M.; Curnoe, D.; Tanaka, M.M. Controlled fire use in early humans might have triggered the evolutionary emergence of tuberculosis. Proc. Natl. Acad. Sci. USA 2016, 113, 9051–9056. [Google Scholar] [CrossRef] [Green Version]
- Kappelman, J.; Alçiçek, M.C.; Kazancı, N.; Schultz, M.; Özkul, M.; Şen, Ş. FirstHomo erectus from Turkey and implications for migrations into temperate Eurasia. Am. J. Phys. Anthropol. 2008, 135, 110–116. [Google Scholar] [CrossRef]
- Roberts, C.A.; Pfister, L.-A.; Mays, S. Letter to the editor: Was tuberculosis present in Homo erectus in Turkey? Am. J. Phys. Anthropol. 2009, 139, 442–444. [Google Scholar] [CrossRef]
- Gutierrez, M.C.; Brisse, S.; Brosch, R.; Fabre, M.; Omaïs, B.; Marmiesse, M.; Supply, P.; Vincent, V. Ancient origin and gene mosaicism of the progenitor of Mycobacterium tuberculosis. PLoS Pathog. 2005, 1, e5. [Google Scholar] [CrossRef]
- Jankute, M.; Nataraj, V.; Lee, O.Y.-C.; Wu, H.H.T.; Ridell, M.; Garton, N.J.; Barer, M.R.; Minnikin, D.E.; Bhatt, A.; Besra, G.S. The role of hydrophobicity in tuberculosis evolution and pathogenicity. Sci. Rep. 2017, 7, 1315. [Google Scholar] [CrossRef] [PubMed] [Green Version]
- Adékambi, T.; Ben Salah, S.; Khlif, M.; Raoult, D.; Drancourt, M. Survival of environmental mycobacteria in Acanthamoeba polyphaga. Appl. Environ. Microbiol. 2006, 72, 5974–5981. [Google Scholar] [CrossRef] [PubMed] [Green Version]
- Mba Medie, F.; Ben Salah, I.; Henrissat, B.; Raoult, D.; Drancourt, M. Mycobacterium tuberculosis Complex Mycobacteria as Amoeba-Resistant Organisms. PLoS ONE 2011, 6, e20499. [Google Scholar] [CrossRef] [PubMed] [Green Version]
- McGrath, J.W. Social networks of disease spread in the lower illinois valley: A simulation approach. Am. J. Phys. Anthropol. 1988, 77, 483–496. [Google Scholar] [CrossRef] [PubMed]
- Xu, Y.; Cancino-Muñoz, I.; Torres-Puente, M.; Villamayor, L.M.; Borrás, R.; Borrás-Máñez, M.; Bosque, M.; Camarena, J.J.; Colomer-Roig, E.; Colomina, J.; et al. High-resolution mapping of tuberculosis transmission: Whole genome sequencing and phylogenetic modelling of a cohort from Valencia Region, Spain. PLoS Med. 2019, 16, e1002961. [Google Scholar] [CrossRef] [PubMed] [Green Version]
- Geiter, L. Ending Neglect: The Elimination of Tuberculosis in the United States; National Academies Press: Washington, DC, USA, 2000. Available online: http://www.ncbi.nlm.nih.gov/pubmed/25077271 (accessed on 1 April 2021).
- Netea, M.G.; van der Meer, J.W.M. Trained Immunity: An Ancient Way of Remembering. Cell Host Microbe 2017, 21, 297–300. [Google Scholar] [CrossRef] [PubMed] [Green Version]
- Jackson, J.A.; Friberg, I.M.; Little, S.; Bradley, J.E. Review series on helminths, immune modulation and the hygiene hypothesis: Immunity against helminths and immunological phenomena in modern human populations: Coevolutionary legacies? Immunology 2009, 126, 18–27. [Google Scholar] [CrossRef] [PubMed]
- Rook, G.A. Regulation of the immune system by biodiversity from the natural environment: An ecosystem service essential to health. Proc. Natl. Acad. Sci. USA 2013, 110, 18360–18367. [Google Scholar] [CrossRef] [Green Version]
- Trauer, J.M.; Moyo, N.; Tay, E.-L.; Dale, K.; Ragonnet, R.; McBryde, E.S.; Denholm, J.T. Risk of Active Tuberculosis in the Five Years Following Infection … 15%? Chest 2016, 149, 516–525. [Google Scholar] [CrossRef] [PubMed]
- Marino, S.; Hogue, I.B.; Ray, C.J.; Kirschner, D.E. A methodology for performing global uncertainty and sensitivity analysis in systems biology. J. Theor. Biol. 2008, 254, 178–196. [Google Scholar] [CrossRef] [Green Version]


| Parameter | Values | Sources | |
|---|---|---|---|
| Paleolithic | Neolithic | ||
| Annual population growth rate (gr) | 0.003% | 0.1% | [13,31,32] |
| Natality () | 0.032 | 0.044 | |
| 15 years old surviving children/women | 2.11 | 2.33 | |
| Natural mortality/year () | 1/33 | 1/26.5 | [33,34] |
| Smear-negative proportion (p) | 0.488 (A) 0.677 (M) | 0.096 (A) 0.268 (M) | explored |
| Mortality/year caused by TB (TB) | 0.389 (SP)/0.025 (SN) | [29] | |
| Infected people per case/year (e) | A = 10 (SP)/1 (SN); M = 20 (SP)/2 (SN) | [30,35] | |
| Bacillary charge (k) | 0.1 | [30] | |
| Fast progression (f) | 0.099 (A)/0.0825 (M) | 0.1238 (A)/0.1031 (M) | [36] |
| Reactivation from infection (a) | f 0.3 | ||
| Bacillary drainage and immunity reduction () | 0.1-a-r | [37,38] | |
| Reduced progression due to immunity (i) | 0.1 | [39] | |
| TB natural cure (c) | 0.231 (SP)/0.130 (SN) | [29] | |
| Increased progression in recovered (w) | 7 | [40] | |
| Parameter | Paleolithic Value | Neolithic Value | Sensitivity Analysis Range % |
|---|---|---|---|
| 0.003% | 0.1% | (0.003, 0.1) | |
| 0.03030 | 0.03846 | (0.0286, 0.04) | |
| p | 0.488 (A) 0.677 (M) | 0.096 (A) 0.268 (M) | (0, 1) |
| 0.389 (SP) 0.025 (SN) | (0.02, 0.4) | ||
| A = 10 (SP) 1 (SN); M = 20 (SP) 2 (SN) | (1, 20) | ||
| 0.099 (A) 0.0825 (M) | 0.1238 (A) 0.1031 (M) | (0, 0.13) | |
| 0.1 | (0.05, 0.5) | ||
| c | 0.231 (SP) 0.130 (SN) | (0.1, 0.4) | |
| 7 | (1, 7) | ||
| 0.1 | (0.05, 0.2) | ||
Publisher’s Note: MDPI stays neutral with regard to jurisdictional claims in published maps and institutional affiliations. |
© 2022 by the authors. Licensee MDPI, Basel, Switzerland. This article is an open access article distributed under the terms and conditions of the Creative Commons Attribution (CC BY) license (https://creativecommons.org/licenses/by/4.0/).
Share and Cite
Cardona, P.-J.; Català, M.; Prats, C. The Origin and Maintenance of Tuberculosis Is Explained by the Induction of Smear-Negative Disease in the Paleolithic. Pathogens 2022, 11, 366. https://doi.org/10.3390/pathogens11030366
Cardona P-J, Català M, Prats C. The Origin and Maintenance of Tuberculosis Is Explained by the Induction of Smear-Negative Disease in the Paleolithic. Pathogens. 2022; 11(3):366. https://doi.org/10.3390/pathogens11030366
Chicago/Turabian StyleCardona, Pere-Joan, Martí Català, and Clara Prats. 2022. "The Origin and Maintenance of Tuberculosis Is Explained by the Induction of Smear-Negative Disease in the Paleolithic" Pathogens 11, no. 3: 366. https://doi.org/10.3390/pathogens11030366
APA StyleCardona, P.-J., Català, M., & Prats, C. (2022). The Origin and Maintenance of Tuberculosis Is Explained by the Induction of Smear-Negative Disease in the Paleolithic. Pathogens, 11(3), 366. https://doi.org/10.3390/pathogens11030366