Abstract
Background: Coinfection with bacteria, fungi, and respiratory viruses in SARS-CoV-2 is of particular importance due to the possibility of increased morbidity and mortality. In this meta-analysis, we calculated the prevalence of such coinfections. Methods: Electronic databases were searched from 1 December 2019 to 31 March 2021. Effect sizes of prevalence were pooled with 95% confidence intervals (CIs). To minimize heterogeneity, we performed sub-group analyses. Results: Of the 6189 papers that were identified, 72 articles were included in the systematic review (40 case series and 32 cohort studies) and 68 articles (38 case series and 30 cohort studies) were included in the meta-analysis. Of the 31,953 SARS-CoV-2 patients included in the meta-analysis, the overall pooled proportion who had a laboratory-confirmed bacterial infection was 15.9% (95% CI 13.6–18.2, n = 1940, 49 studies, I2 = 99%, p < 0.00001), while 3.7% (95% CI 2.6–4.8, n = 177, 16 studies, I2 = 93%, p < 0.00001) had fungal infections and 6.6% (95% CI 5.5–7.6, n = 737, 44 studies, I2 = 96%, p < 0.00001) had other respiratory viruses. SARS-CoV-2 patients in the ICU had higher co-infections compared to ICU and non-ICU patients as follows: bacterial (22.2%, 95% CI 16.1–28.4, I2 = 88% versus 14.8%, 95% CI 12.4–17.3, I2 = 99%), and fungal (9.6%, 95% CI 6.8–12.4, I2 = 74% versus 2.7%, 95% CI 0.0–3.8, I2 = 95%); however, there was an identical other respiratory viral co-infection proportion between all SARS-CoV-2 patients [(ICU and non-ICU) and the ICU only] (6.6%, 95% CI 0.0–11.3, I2 = 58% versus 6.6%, 95% CI 5.5–7.7, I2 = 96%). Funnel plots for possible publication bias for the pooled effect sizes of the prevalence of coinfections was asymmetrical on visual inspection, and Egger’s tests confirmed asymmetry (p values < 0.05). Conclusion: Bacterial co-infection is relatively high in hospitalized patients with SARS-CoV-2, with little evidence of S. aureus playing a major role. Knowledge of the prevalence and type of co-infections in SARS-CoV-2 patients may have diagnostic and management implications.
Keywords:
SARS-Cov-2; co-infection; coinfection; COVID-19; concurrent; bacterial; fungal; viral; meta-analysis 1. Introduction
Coronavirus disease 2019 (COVID-19) is caused by the severe acute respiratory syndrome coronavirus 2 (SARS-CoV-2) and was first described in Wuhan, China in 2019. Globally, as of 15 April 2021, there have been 137,866,311 confirmed cases of COVID-19, including 2,965,707 deaths, as reported by the World Health Organization [1]. Coinfection with SARS-CoV-2 and other bacterial, fungal, and respiratory viral pathogens [2,3,4], Gram-positive and Gram-negative bacteria [5,6,7], Middle East respiratory syndrome coronavirus (MERS-CoV) [8], and influenza [9,10,11,12,13] has been described. However, the reported frequency is variable. Such coinfections in patients with SARS-CoV-2 may be a cause of increased morbidity and mortality [2,6,7,14,15,16,17,18,19,20,21,22]. Thus, timely diagnosis is important to initiate appropriate therapy and limit the overuse of antimicrobial agents. Previous studies, including case series [2,5,8,11,14,15,16,19,20,23,24,25,26,27,28,29,30,31,32,33,34,35,36,37,38,39,40,41,42,43,44,45,46,47,48,49,50], cohort studies [3,4,6,7,9,10,12,13,17,18,21,22,51,52,53,54,55,56,57,58,59,60,61,62,63,64,65,66,67,68,69,70], and meta-analyses [71,72,73], have shown variable results. In light of recent studies evaluating coinfections in SARS-CoV-2 patients, we aimed to re-evaluate the prevalence of bacterial, fungal, and respiratory viral coinfections in a comprehensive meta-analysis. Moreover, we aimed to identify the risk-factors, characteristics, and consequences associated with SARS-CoV-2 coinfection.
2. Methods
2.1. Design
This is a meta-analysis and was conducted per the Preferred Reporting Items for Systematic Reviews and Meta-Analyses [PRISMA] guidelines [74]. We searched PROQUEST, MEDLINE, EMBASE, PUBMED, CINAHL, WILEY ONLINE LIBRARY, and NATURE for full texts. Search keywords included Coronavirus infection OR SARS coronavirus OR severe acute respiratory syndrome OR COVID OR SARS AND mixed infection OR bacterial pneumonia OR bacteremia OR bacterial infection OR fungal infection OR viral infection OR respiratory infection OR mycosis OR coinfect OR co-infect OR concomitant infect OR concurrent infection OR mixed infect OR coinfection OR co-infection. The search included English language studies from 1 December 2019 to 31 March 2021. Then, articles were kept if the title and abstract contained discussion about bacterial, fungal, and/or respiratory viral co-infection in SARS-CoV-2 patients. In addition, we used manual backward snowballing of the bibliographies of retrieved articles to include additional relevant articles.
2.2. Inclusion and Exclusion Criteria
The included articles were pertinent if these articles included patients with a positive SARS-CoV-2 reverse-transcription polymerase chain reaction (RT-PCR) test of any age and a described co-infection on presentation or developed during the course of the disease or during hospital stay. These cases were retained if bacteria, fungi, and/or viruses were detected in the respiratory tract or blood culture samples and were excluded if they were identified from other samples. We aimed to include randomized controlled trials, cohort studies, and case series, and excluded other types of studies.
2.3. Data Extraction
Three authors (S.A., A.A., and J.A.) reviewed the retrieved studies and chose relevant articles. Data were extracted using key headings as indicated in Table 1. The study designs were classified as well. The extracted information included: authors; study location; study design and setting; publication year; number of SARS-CoV-2 patients tested for co-pathogens; number of coinfected patients; age; proportion of male patients; percentage of patients requiring intensive care unit (ICU) and mechanical ventilation; mortality rates; proportion of patients with bacterial, fungal, and/or respiratory viral coinfections; total organisms identified; antimicrobials prescribed; laboratory techniques for co-pathogen detection; assessment of study risk of bias; and remarks on notable findings.

Table 1.
Summary of the characteristics of the included studies with evidence on SARS-CoV-2 and bacterial, fungal, and/or respiratory viral co-infections (n = 72), 2020–2021.
2.4. Quality Assessment
The Newcastle–Ottawa Scale [NOS] was the primary tool for examining the quality of included studies, as described previously [75]. The tool provides maximum scores of 4 for selection, 2 for comparability, and 3 for exposure/outcome. High-quality studies have a score of >7, and moderate-quality studies have a score of 5–7. Quality assessment was performed independently by four authors (A.M.A., S.A.A., G.Y.A., and A.R.) and a consensus was used to resolve any disagreement.
2.5. Data Analysis
We examined primarily the proportion of confirmed acute bacterial, fungal and/or respiratory viral infections in patients with SARS-CoV-2. This proportion was further classified based on initial presentation or during the course of the illness. Taking a conservative approach, a random effects with the DerSimoniane–Laird model was used [76], which produces wider confidence intervals [CIs] than a fixed effect model. Results were illustrated using forest plots. The Cochran’s chi-square (χ2) and the I2 statistic provided the tools of examining statistical heterogeneity [77]. An I2 value of >50% suggested significant heterogeneity [78]. Examining the source of heterogeneity, a subgroup analysis was conducted based on ICU and non-ICU admission or only ICU admission. Funnel plots and Egger’s correlation test estimate publication bias and p value < 0.05 indicates statistical significance [79]. R version 4.1.0 with the packages metafor and meta was used for all statistical analyses.
3. Results
3.1. Characteristics and Quality of Included Studies
Of the initial 7317 retrieved publications, there were 4609 duplicate articles, and 2080 articles were found to be irrelevant based on their titles and abstracts and were excluded. An additional 1065 articles were excluded after review, meaning that we included 72 articles in the systematic review [2,3,4,5,6,7,8,9,10,11,12,13,14,15,16,17,18,19,20,21,22,23,24,25,26,27,28,29,30,31,32,33,34,35,36,37,38,39,40,41,42,43,44,45,46,47,48,49,50,51,52,53,54,55,56,57,58,59,60,61,62,63,64,65,66,67,68,69,70,80,81,82], while 68 articles were included in the meta-analysis [2,3,4,5,6,7,8,9,10,11,13,14,15,16,17,18,19,20,21,22,23,24,25,26,27,28,29,30,31,32,33,34,35,36,37,39,40,41,43,44,45,46,47,48,49,50,51,52,53,54,55,56,57,59,60,61,62,63,64,65,66,67,68,69,70,80,81,82] (Figure 1).
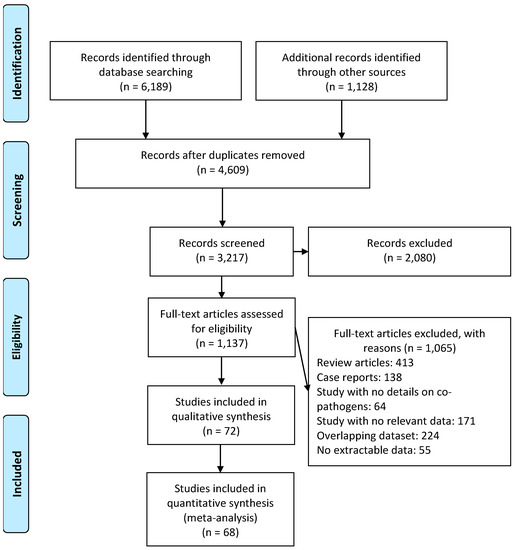
Figure 1.
Flow diagram of literature search and data extraction from studies included in the systematic review and meta-analysis.
The included studies had a total of 31,953 SARS-CoV-2 infected patients as detailed in Table 1. Of those patients, 25,302 (79.2%) were from 32 cohort studies and 20.8% were from 40 case series. The geographical distribution of these studies was as follows: Asia (n = 36), Europe (n = 22), and North America (n = 14). The majority of the studies were single center and only 24 studies were multi-center. Laboratory techniques for co-pathogen detection within studies included 19 that used respiratory samples and RT-PCR tests [4,5,8,11,12,13,29,33,37,38,53,55,58,59,62,63,66,70,80], 17 that used serologic tests (antibodies) [6,10,14,19,24,31,32,35,36,43,44,45,50,52,60,64,68], 15 that used RT-PCR tests with respiratory and/or blood cultures [7,9,17,18,23,26,28,34,39,42,51,56,57,65,67], 12 that did not specify their testing methods [3,15,16,22,25,30,40,41,46,47,49,81], five that only used respiratory and/or blood cultures [2,21,48,54,61], and three that tested both serology and RT-PCR [27,69,82] (Table 1). Seven studies examined patients for influenza A and B only [10,11,19,41,60,68,70]; while five studies evaluated patients for the presence of Chlamydia or Mycoplasma [6,24,35,52,82]; and four studies only evaluated for the presence of fungi [17,23,39,42]. The proportion of patients receiving antibiotic agents was reported in 34 studies [2,6,7,14,16,17,18,19,20,21,23,24,31,34,35,36,37,39,40,42,43,45,46,48,49,51,52,56,57,60,64,70,80,82]. The most commonly used antimicrobials were macrolides (n = 355), 2nd/3rd/5th generation cephalosporins (n = 157), fluoroquinolones, (n = 150), antifungals (n = 62), beta-lactams/beta-lactam inhibitors (n = 26), beta-lactams (n = 21), tetracyclines (n = 17), linezolid (n = 13), carbapenems (n = 4), and glycopeptides (n = 2). The median NOS score was 6 with a range from 5 to 8. The NOS quality was moderate for 66 studies, and high quality for 6 studies. The majority (60/72, 83.3%) of the studies included only adult patients. The proportion of male patients had a median of 55.9% [interquartile range (IQR) 48.9–71.9%]. The majority (n = 58) of the studies included any hospitalized patient, and 14 studies included only critically ill. Sixteen, thirteen, and four studies exclusively reported on respiratory viral, bacterial, and fungal co-infections, respectively; and the remaining 39 studies reported on bacterial, fungal, and respiratory viral co-infections; Table 1.
3.2. Meta-Analysis of Bacterial, Fungal, and Respiratory Viral Co-Infections in Patients with SARS-CoV-2
The overall pooled proportions of SARS-CoV-2 patients who had laboratory-confirmed bacterial, fungal, and respiratory viral coinfections were 15.9% (95% CI 13.6 to 18.2, n = 1940, 49 studies, I2 99%, p < 0.00001), 3.7% (95% CI 2.6 to 4.8, n = 177, 16 studies, I2 93%, p < 0.00001), and 6.6% (95% CI 5.5 to 7.6, n = 737, 44 studies, I2 96%, p < 0.00001), respectively; (Figure 2,Figure 3,Figure 4).
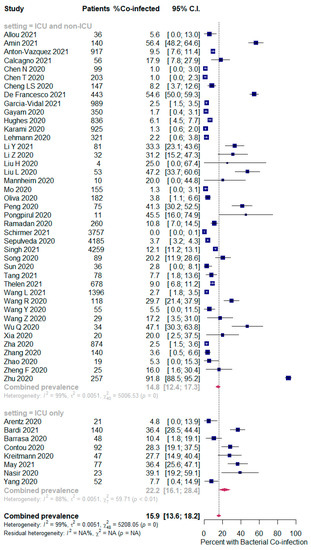
Figure 2.
Forest plot of proportion of SARS-CoV-2 patients with bacterial co-infections (all patients in the upper panel and only ICU patients in the lower panel).
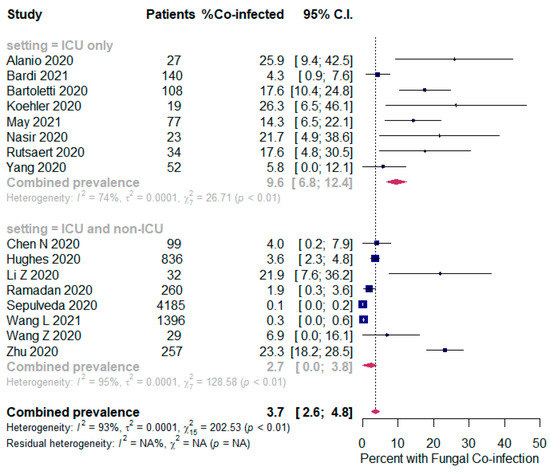
Figure 3.
Forest plot of proportion of SARS-CoV-2 patients with fungal co-infections (all patients in the upper panel and only ICU patients in the lower panel).
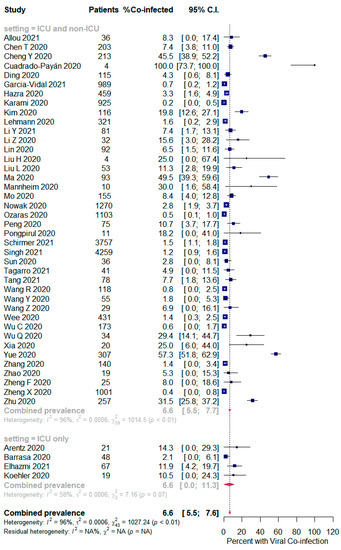
Figure 4.
Forest plot of proportion of SARS-CoV-2 patients with respiratory viral co-infections (all patients in the upper panel and only ICU patients in the lower panel).
In bacterial coinfected SARS-CoV-2 patients, subgroup analysis showed some difference in the rates between all patients (ICU and non-ICU group); and the ICU only group (14.8% (95% CI 12.4 to 17.3, n = 1802, 41 studies, I2 = 99%); and 22.2% (95% CI 16.1 to 28.4, n = 137, 8 studies, I2 = 88%), respectively); Figure 2. In the fungal co-infected SARS-CoV-2 patients, subgroup analysis showed a significant difference in the rates between all patients (ICU and non-ICU); and ICU only patients [2.7% (95% CI 0.0 to 3.8, n = 155, 8 studies, I2 = 95%); and 9.6% (95% CI 6.8 to 12.4, n = 62, 8 studies, I2 = 74%), respectively]; Figure 3.
However, in the respiratory viral co-infected SARS-CoV-2 patients, subgroup analysis showed an identical proportion between all patients (ICU and non-ICU) and the ICU only patients [6.6% (95% CI 5.5 to 7.7, n = 723, 40 studies, I2 = 96%); and 6.6% (95% CI 0.0 to 11.3, n = 14, 4 studies, I2 = 58%), respectively]; Figure 4.
Funnel plots for possible publication bias for the pooled effect size to determine the prevalence of coinfections in SARS-Cov-2 patients appeared asymmetrical on visual inspection, and Egger’s tests confirmed asymmetry with p values < 0.05; Figure 5, Figure 6 and Figure 7.
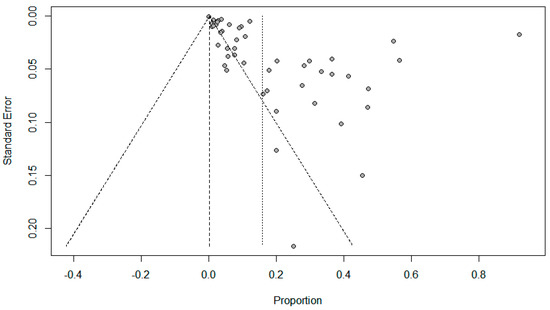
Figure 5.
Funnel plots evaluating publication bias for the pooled effect size determining the prevalence of bacterial co-infections in SARS-Cov-2 patients.
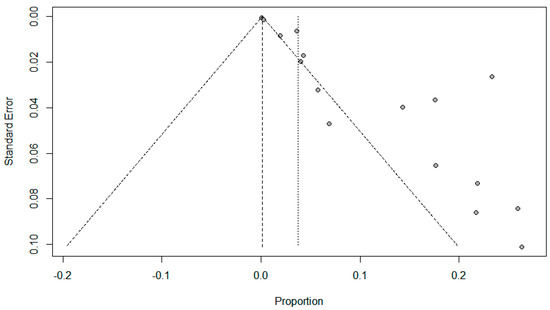
Figure 6.
Funnel plots evaluating publication bias for the pooled effect size to determine the prevalence of fungal co-infections in SARS-Cov-2 patients.
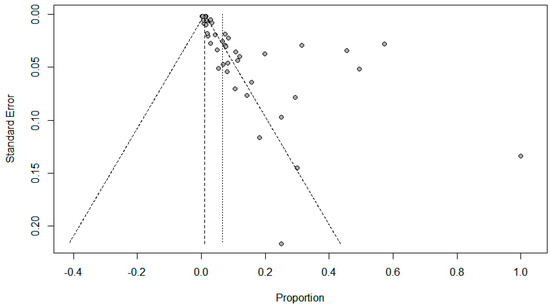
Figure 7.
Funnel plots to evaluate publication bias for the pooled effect size to determine the prevalence of other respiratory viral co-infections in SARS-Cov-2 patients.
3.3. Bacterial, Fungal and Respiratory Viral Co-Pathogens
Specific bacterial co-pathogens were reported in 49/72 (68%) studies, which is about 57.3% of the reported co-infections. The most common bacteria were S. aureus (n = 1095), M. catarrhalis (n = 352), M. pneumoniae (n = 338), S. pneumoniae (n = 316), C. pneumoniae (n = 261), K. pneumoniae (n = 259), and H. influenzae (n = 197) (Table 2).
Table 2.
Proportion of all identified SARS-CoV-2 bacterial co-infections (N = 3468).
Fungal co-pathogens were reported in 16/72 (22.2%) studies, which is equal to only 3.2% of the reported co-infections. The most common fungal organisms were Aspergillus spp. (n = 68), Aspergillus fumigatus (n = 43), Other Candida spp. (n = 29), Candida albicans (n = 25) and Aspergillus flavus (n = 10) (Table 3).
Table 3.
Proportion of all identified SARS-CoV-2 fungal co-infections (N = 192).
Respiratory viral co-pathogens were reported in 44/72 (61.1%) studies, representing about 39.5% of the reported co-infections. The most common respiratory viruses were EBV (n = 644), HHV6 (n = 574), Influenza A virus (n = 355), HMPV (n = 328), and Adenovirus (n = 144) (Table 4).
Table 4.
Proportion of all identified SARS-CoV-2 respiratory viral co-infections (N = 2392).
4. Discussion
In this large systematic review and meta-analysis, we included 31,953 patients with laboratory-confirmed SARS-CoV-2 from 72 observational studies in order to estimate the prevalence of coinfections with bacterial, fungal, and respiratory viral pathogens. This study showed the following microbial coinfection prevalences: bacterial (15.9%, 95% CI 13.6–18.2); fungal (3.7%, 95% CI 2.6–4.8); and respiratory viral (6.6%, 95% CI 5.5–7.6) coinfections. Bacterial and fungal coinfections were more common in ICU patients ((22.2%%, 95% CI 16.1–28.4) and (9.6%, 95% CI 6.8–12.4), respectively) than mixed ICU and non-ICU patients, as expected. However, respiratory viral co-infection rate in SARS-CoV-2 patients was identical in both groups (6.6%, 95% CI 0.0–11.3). Nevertheless, the included studies in this meta-analysis are case series and cohort studies and we did not identify any randomized controlled trials addressing this issue. In addition, the included studies comprised only admitted patients, which may skew the findings and should not be generalized to all SARS-COV-2 patients. Non-admitted COVID-19 patients were not represented in these studies and thus the exact prevalence of coinfections could not be calculated for all SARS-CoV-2 infected patients [83,84,85]. The findings in this meta-analysis showed different results from previous systematic meta-analyses that evaluated coinfections among COVID-19 patients [71,72,73]. We reported a higher prevalence of coinfections in hospitalized SARS-CoV-2 patients. The current meta-analysis is more comprehensive and included a total of 71 studies [2,4,5,6,7,8,9,10,11,12,13,14,15,16,17,18,19,20,21,22,23,24,25,26,27,28,29,30,31,32,33,34,35,36,37,38,39,40,41,42,43,44,45,46,47,48,49,50,51,52,53,54,55,56,57,58,59,60,61,62,63,64,65,66,67,68,69,70,80] and one abstract [3], including a total of 31,953 patients. The inclusion of 18 recently published studies [2,3,5,6,7,8,9,10,12,13,14,22,24,27,41,62,64,65] contributed to the refinement of the estimate of the pooled prevalence of pathogens contributing to coinfections in SARS-CoV-2 patients.
In this meta-analysis, bacterial coinfection was more prevalent than fungal and other respiratory viruses. This finding may reflect high rates of antimicrobial use for admitted patients with SARS-CoV-2 infection to treat documented or presumed bacterial co-infections. Thus, it is important to study the occurrence, type, and intended antimicrobial agent use in SARS-COV-2 patients in order to develop additional strategies for the optimal use of antimicrobial agents in this population. As expected, bacterial, fungal, and other respiratory viral co-infections in SARS-CoV-2 patients were more frequent in ICUs compared with non-ICU locations [2,20,28,57], a finding which has previously been described in systematic reviews [71,72] and may reflect the epicenter role of ICUs in both infections and antimicrobial resistance. One of the reasons for the increase in infection rate in ICUs could be due to the simultaneous infection of the virus and bacterium. Viruses can facilitate the attachment and colonization of the bacteria in the respiratory tract, which is certainly no exception for SARS-CoV-2 [86]. Nevertheless, other factors such as ICU type, used equipment rate, admission or discharge criteria, high workload or nurse ratio, etc. can also affect the quality of care and the rate of ICU-acquired, healthcare-associated infections [87,88]. With observed strains currently being placed on healthcare systems during the upstroke of the SARS-CoV-2 pandemic, guidelines must focus on the maintenance of good knowledge and compliance of infection prevention and control [89], antimicrobial stewardship [90], and robust surveillance for healthcare-associated infections and antimicrobial resistance [91,92].
The most common method used to detect co-infections in the studies included in this review was RT-PCR tests for respiratory samples. The choice of diagnostic test for pathogens depends in part upon test availability and how soon the results are needed. If available, molecular assays (RT-PCR or, alternatively, a rapid molecular assay) are preferred over antigen detection tests (e.g., direct and indirect immunofluorescence assays) because molecular tests are the most sensitive [93]. Nevertheless, positive RT-PCR tests might indicate recently resolved infection or colonization [94,95]. In addition, many studies evaluated serological (antibodies) tests with this method detecting co-infections in SARS-CoV-2 patients. Application of serologic laboratory technique for co-pathogens detection across all studies was likely to reveal an even higher overall co-infection proportion than found in our study. Consecutively, it is possible that positive serology indicated recent and not acute infection in included patients [96]. Serologic testing is useful primarily for research purposes and antibody-based tests might produce false negative results during the window period. It is worthwhile to mention that administration of broad-spectrum antimicrobials to a large percentage of the patients included in this review might relatively have lowered the sensitivity of microbial culture methods, which could have resulted in underestimation of the true numbers of co-infections.
Specific co-infecting pathogens in SARS-CoV-2 patients were identified in this study from the 72 included studies. In line with the previous systematic reviews and meta-analyses [71,72], M. pneumoniae, K. pneumoniae, and H. influenzae were among the predominant co-pathogens. However, in this meta-analysis, S. aureus was the most common bacterial pathogens co-infecting SARS-CoV-2 patients. However, this finding needs to be carefully interpreted, as 85.6% of all S. aureus co-pathogens in our review were reported by one study [58]. S. aureus infections are a known complication of other viral pandemics, such as the Spanish flu and the H1N1 influenza pandemic [97,98]. S. aureus is known to act synergistically in SARS-CoV-2 patients, increasing mortality and severity of disease [38,99]. The proposed mechanisms of viral-induced S. aureus co-infections include viral modification of airway structures and increased adherence of the organism to respiratory mucosa, as well as initiation of immune-suppressive responses [22,100,101]. Further investigations are necessary to confirm an association between SARS-CoV-2 infection and susceptibility to S. aureus coinfections.
It was noted that male patients with SARS-CoV-2 were more likely to have coinfections than female [13]. However, patients with pneumococcal pneumoniae and SARS-CoV-2 were mostly females [24]. Older age appears to be the major risk factor associated with coinfections with bacteria and respiratory viruses [12,38,43,58,62] and fungi [39]. This might be attributed mainly to the differences in the inclusion criteria and the population age groups included in the studies, or it could be explained by the gender-based biological differences in the host immune response to COVID-19 infection [102]. The age-dependent defects in T-cell and B-cell function and the excess production of type 2 cytokines could lead to a deficiency in control of viral replication and more prolonged proinflammatory responses, potentially leading to poorer outcomes [103]. Yet, SARS-CoV-2 patients of any age may develop such coinfections and experience severe disease, especially in those with comorbidities, even in young people [4,53], children [27,49], and infants [40].
A few underlying comorbidities were associated with increased risk of coinfections, and these included obesity [8,12,38], cancer, hepatitis, and kidney disease [12,43]. Laboratory abnormalities that have been described in SARS-CoV-2 patients with bacterial and respiratory viral coinfections were high procalcitonin [47,50,64,80], d-dimer [9], and monocytes [31]; and low neutrophils [31]. Some conclusions could be drawn from available data as to whether patients who have a concurrent bacterial, fungal, and/or respiratory viral infection have a worse prognosis than those in whom SARS-CoV-2 is the only detected pathogen. Mortality in SARS-CoV-2 patients was increased due to bacterial [2,6,14,21], fungal [2,17,20,21], or respiratory viral [20] co-infections compared to SARS-CoV-2 patients with no co-infections. Few studies observed no increase in mortality in COVID-19 patients compared to those who did not have bacterial [3,22,24,35,66], fungal [3,22], or other respiratory viral [66] coinfections. Clinical presentation, laboratory results, radiological findings, and outcome are likely to differ between SARS-CoV-2 positive patients with and without co-infections. Bacterial coinfection increased SARS-CoV-2 patients’ hospital length of stay [18,50], need for ventilatory support [6,28], ARDS [28], shock [28], multi-organ injury [23,32], and caused more severe COVID-19 disease [2,21,28,33,34,53,68]. Two studies reported conflicting results on the role of bacterial [24,36] or respiratory viral [36] coinfection in relation to increasing length of hospital stay or ICU admission [22,24,35]. It was shown that the patterns of SARS-CoV-2 symptoms and clinical outcomes were not different in the bacterial [27] and respiratory viral [10,11,27,66,70] co-infected patients. The severity and time of SARS-CoV-2 disease clearance were not different in patients with respiratory viral co-infections [19,36].
The data on the timing of the occurrence of co-infection was variable. The occurrence of co-infections has a median time of 4–11.5 days (IQR 2–42) of ICU admission [2,17,42]. Bacterial co-infection was infrequent within 2–4 days of hospital admission [22,26]. Nonetheless, considering the high number and severity of bacterial co-infections previously reported in patients with SARS-CoV-2, initiation of antibiotic therapy for all hospitalized patients with COVID-19 is recommended [7]. The approach of administering empiric antibiotic therapy solely to patients who were admitted for SARS-CoV-2 and who presented with a chest X-ray suggestive of bacterial infection, have a need for direct ICU admission, or are severely immunocompromised should be reconsidered. When bacterial co-infection in SARS-CoV-2 patients is suspected, an antibiotic approach with optimal S. aureus coverage, such as ceftaroline, ceftriaxone, or cefazolin plus levofloxacin, is recommended in areas with methicillin-sensitive S. aureus prevalence [104].
Limitations
The main limitation of this meta-analysis is that included studies were observational with no randomized controlled trials; and there was no standardized microbiologic testing at specified intervals. In interpreting funnel plots, the different possible reasons for funnel plot asymmetry should be distinguished. Possible sources of asymmetry in funnel plots might be the wide differences between the included populations in the different studies, publication bias and selective outcome and/or analysis reporting, poor methodological design and inadequate analysis, or asymmetry might have occurred by chance. Furthermore, the analysis was limited to the English literature and thus may miss other studies published in other languages.
5. Conclusions
Bacterial co-infection is relatively high in hospitalized patients with SARS-CoV-2, with little evidence of S. aureus having a major role. Empiric antibiotic therapy should be considered in SARS-CoV-2 patients who present with a chest X-ray suggestive of bacterial infection, the need for direct ICU admission, or a severely immunocompromised condition. Knowledge of the prevalence and type of co-infections in SARS-CoV-2 patients may have diagnostic and management implications.
Author Contributions
S.A., A.A.M., A.A.R., Z.A.A. and J.A.A.-T. contributed equally to this study. S.A., A.A.M., Z.A.A., and A.A.R. were the core team leading the systematic review. S.A., A.A.M., and J.A.A.-T. identified and selected the studies. A.M.A. (Abeer M. Alshawi), S.A.A., G.Y.A., and A.A.R. did the quality assessment of the studies. S.A., A.A.M., M.S.A., and A.A.A. collected the data. S.A., A.H.B.S., A.M.A. (Abdullah M. Alotaibi), and A.A.-O. analyzed the data. S.A., A.A.M., Z.A.A., A.A.R., and J.A.A.-T. drafted the manuscript. The corresponding author attests that all listed authors meet authorship criteria and that no others meeting the criteria have been omitted. All authors have read and agreed to the published version of the manuscript.
Funding
This research received no external funding.
Institutional Review Board Statement
Not applicable.
Informed Consent Statement
Not applicable.
Data Availability Statement
Data are available upon request. Please contact author for data requests.
Acknowledgments
We would like to thank Hani N. Mufti for precious guidance and support to create the forest and funnel plots using RStudio. We would also like to thank the reviewers for very helpful and valuable comments and suggestions for improving the paper.
Conflicts of Interest
The authors declare that they have no competing interests.
References
- World Health Organization. WHO Coronavirus (COVID-19) Dashboard. 2021. Available online: https://covid19.who.int (accessed on 5 April 2021).
- Bardi, T.; Pintado, V.; Gomez-Rojo, M.; Escudero-Sanchez, R.; Lopez, A.A.; Diez-Remesal, Y.; Castro, N.M.; Ruiz-Garbajosa, P.; Pestaña, D. Nosocomial infections associated to COVID-19 in the intensive care unit: Clinical characteristics and outcome. Eur. J. Clin. Microbiol. Infect. Dis. 2021, 40, 495–502. [Google Scholar] [CrossRef]
- May, A.; Swetenham, N.; Pandey, M.; Taylor, V.; Hughes, H.; Underwood, J. P197 Bacterial and fungal respiratory co-infection among patients admitted to ICU with COVID-19: A retrospective cohort study in a UK hospital. BMJ 2021, 76, A196–A197. [Google Scholar]
- Zhu, X.; Ge, Y.; Wu, T.; Zhao, K.; Chen, Y.; Wu, B.; Zhu, F.; Zhu, B.; Cui, L. Co-infection with respiratory pathogens among COVID-2019 cases. Virus Res. 2020, 285, 198005. [Google Scholar] [CrossRef]
- Calcagno, A.; Ghisetti, V.; Burdino, E.; Trunfio, M.; Allice, T.; Boglione, L.; Bonora, S.; Di Perri, G. Co-infection with other respiratory pathogens in COVID-19 patients. Clin. Microbiol. Infect. 2021, 27, 297–298. [Google Scholar] [CrossRef]
- De Francesco, M.A.; Poiesi, C.; Gargiulo, F.; Bonfanti, C.; Pollara, P.; Fiorentini, S.; Caccuri, F.; Carta, V.; Mangeri, L.; Pellizzeri, S. Co-infection of Chlamydia pneumoniae and Mycoplasma pneumoniae with SARS-CoV-2 is associated with more severe features. J. Infect. 2021, 8. [Google Scholar] [CrossRef]
- Garcia-Vidal, C.; Sanjuan, G.; Moreno-García, E.; Puerta-Alcalde, P.; Garcia-Pouton, N.; Chumbita, M.; Fernandez-Pittol, M.; Pitart, C.; Inciarte, A.; Bodro, M. Incidence of co-infections and superinfections in hospitalized patients with COVID-19: A retrospective cohort study. Clin. Microbiol. Infect. 2021, 27, 83–88. [Google Scholar] [CrossRef] [PubMed]
- Elhazmi, A.; Al-Tawfiq, J.A.; Sallam, H.; Al-Omari, A.; Alhumaid, S.; Mady, A.; Al Mutair, A. Severe respiratory syndrome Coronavirus 2 (SARS-CoV-2) and middle east respiratory syndrome Coronavirus (MERS-CoV) coinfection: A unique case series. Travel Med. Infect. Dis. 2021, 41, 102026. [Google Scholar] [CrossRef] [PubMed]
- Allou, N.; Larsen, K.; Dubernet, A.; Traversier, N.; Masse, L.; Foch, E.; Bruneau, L.; Maillot, A.; André, M.; Lagrange-Xelot, M. Co-infection in patients with hypoxemic pneumonia due to COVID-19 in Reunion Island. Medicine 2021, 100, e24524. [Google Scholar] [CrossRef]
- Cheng, Y.; Ma, J.; Wang, H.; Wang, X.; Hu, Z.; Li, H.; Zhang, H.; Liu, X. Co-infection of influenza A virus and SARS-CoV-2: A retrospective cohort study. J. Med. Virol. 2021, 93. [Google Scholar] [CrossRef]
- Cuadrado-Payán, E.; Montagud-Marrahi, E.; Torres-Elorza, M.; Bodro, M.; Blasco, M.; Poch, E.; Soriano, A.; Piñeiro, G.J. SARS-CoV-2 and influenza virus co-infection. Lancet 2020, 395, e84. [Google Scholar] [CrossRef]
- Hashemi, S.A.; Safamanesh, S.; Ghasemzadeh-Moghaddam, H.; Ghafouri, M.; Azimian, A. High prevalence of SARS-CoV-2 and influenza A virus (H1N1) coinfection in dead patients in northeastern Iran. J. Med. Virol. 2021, 93, 1008–1012. [Google Scholar] [CrossRef]
- Schirmer, P.; Lucero-Obusan, C.; Sharma, A.; Sohoni, P.; Oda, G.; Holodniy, M. Respiratory co-infections with COVID-19 in the Veterans Health Administration, 2020. Diagn. Microbiol. Infect. Dis. 2021, 100, 115312. [Google Scholar] [CrossRef]
- Amin, D.; McKitish, K.; Shah, P.S. Association of mortality and recent Mycoplasma pneumoniae infection in COVID-19 patients. J. Med. Virol. 2021, 93, 1180–1183. [Google Scholar] [CrossRef] [PubMed]
- Arentz, M.; Yim, E.; Klaff, L.; Lokhandwala, S.; Riedo, F.X.; Chong, M.; Lee, M. Characteristics and outcomes of 21 critically ill patients with COVID-19 in Washington state. JAMA 2020, 323, 1612–1614. [Google Scholar] [CrossRef] [PubMed] [Green Version]
- Barrasa, H.; Rello, J.; Tejada, S.; Martín, A.; Balziskueta, G.; Vinuesa, C.; Fernández-Miret, B.; Villagra, A.; Vallejo, A.; San Sebastián, A. SARS-CoV-2 in Spanish intensive care units: Early experience with 15-day survival in Vitoria. Anaesth. Crit. Care Pain Med. 2020, 39, 553–561. [Google Scholar] [CrossRef]
- Bartoletti, M.; Pascale, R.; Cricca, M.; Rinaldi, M.; Maccaro, A.; Bussini, L.; Fornaro, G.; Tonetti, T.; Pizzilli, G.; Francalanci, E. Epidemiology of invasive pulmonary aspergillosis among COVID-19 intubated patients: A prospective study. Clin. Infect. Dis. 2020. [Google Scholar] [CrossRef] [PubMed]
- Cheng, L.S.; Chau, S.K.; Tso, E.Y.; Tsang, S.W.; Li, I.Y.; Wong, B.K.; Fung, K.S. Bacterial co-infections and antibiotic prescribing practice in adults with COVID-19: Experience from a single hospital cluster. Ther. Adv. Infect. Dis. 2020, 7. [Google Scholar] [CrossRef]
- Ding, Q.; Lu, P.; Fan, Y.; Xia, Y.; Liu, M. The clinical characteristics of pneumonia patients coinfected with 2019 novel coronavirus and influenza virus in Wuhan, China. J. Med. Virol. 2020, 92, 1549–1555. [Google Scholar] [CrossRef]
- Koehler, P.; Cornely, O.A.; Böttiger, B.W.; Dusse, F.; Eichenauer, D.A.; Fuchs, F.; Hallek, M.; Jung, N.; Klein, F.; Persigehl, T. COVID-19 associated pulmonary aspergillosis. Mycoses 2020, 63, 528–534. [Google Scholar] [CrossRef]
- Ramadan, H.K.-A.; Mahmoud, M.A.; Aburahma, M.Z.; Elkhawaga, A.A.; El-Mokhtar, M.A.; Sayed, I.M.; Hosni, A.; Hassany, S.M.; Medhat, M.A. Predictors of severity and co-infection resistance profile in COVID-19 patients: First report from upper Egypt. Infect. Drug Res. 2020, 13, 3409. [Google Scholar] [CrossRef]
- Wang, L.; Amin, A.K.; Khanna, P.; Aali, A.; McGregor, A.; Bassett, P.; Gopal Rao, G. An observational cohort study of bacterial co-infection and implications for empirical antibiotic therapy in patients presenting with COVID-19 to hospitals in north west London. J. Antimicrob. Chemother. 2021, 76, 796–803. [Google Scholar] [CrossRef]
- Alanio, A.; Dellière, S.; Fodil, S.; Bretagne, S.; Mégarbane, B. Prevalence of putative invasive pulmonary aspergillosis in critically ill patients with COVID-19. Lancet Respir. Med. 2020, 8, e48–e49. [Google Scholar] [CrossRef]
- Anton-Vazquez, V.; Clivillé, R. Streptococcus pneumoniae coinfection in hospitalised patients with COVID-19. Eur. J. Clin. Microbiol. Infect. Dis. 2021, 40, 1353–1355. [Google Scholar] [CrossRef] [PubMed]
- Chen, T.; Dai, Z.; Mo, P.; Li, X.; Ma, Z.; Song, S.; Chen, X.; Luo, M.; Liang, K.; Gao, S. Clinical characteristics and outcomes of older patients with coronavirus disease 2019 (COVID-19) in Wuhan, China: A single-centered, retrospective study. J. Gerontol. Ser. A 2020, 75, 1788–1795. [Google Scholar] [CrossRef]
- Hughes, S.; Troise, O.; Donaldson, H.; Mughal, N.; Moore, L.S. Bacterial and fungal coinfection among hospitalized patients with COVID-19: A retrospective cohort study in a UK secondary-care setting. Clin. Microbiol. Infect. 2020, 26, 1395–1399. [Google Scholar] [CrossRef] [PubMed]
- Li, Y.; Wang, H.; Wang, F.; Lu, X.; Du, H.; Xu, J.; Han, F.; Zhang, L.; Zhang, M. Co-infections of SARS-CoV-2 with multiple common respiratory pathogens in infected children: A retrospective study. Medicine 2021, 100. [Google Scholar] [CrossRef] [Green Version]
- Li, Z.; Chen, Z.; Chen, L.D.; Zhan, Y.Q.; Li, S.Q.; Cheng, J.; Zhu, A.; Chen, L.Y.; Zhong, N.S.; Li, S.Y. Coinfection with SARS-CoV-2 and other respiratory pathogens in patients with COVID-19 in Guangzhou, China. J. Med. Virol. 2020, 92, 2381–2383. [Google Scholar] [CrossRef] [PubMed]
- Lin, D.; Liu, L.; Zhang, M.; Hu, Y.; Yang, Q.; Guo, J.; Guo, Y.; Dai, Y.; Xu, Y.; Cai, Y. Co-infections of SARS-CoV-2 with multiple common respiratory pathogens in infected patients. Sci. China Life Sci. 2020, 63, 606–609. [Google Scholar] [CrossRef] [PubMed] [Green Version]
- Liu, H.; Liu, F.; Li, J.; Zhang, T.; Wang, D.; Lan, W. Clinical and CT imaging features of the COVID-19 pneumonia: Focus on pregnant women and children. J. Infect. 2020, 80, e7–e13. [Google Scholar] [CrossRef]
- Liu, L.; Lei, X.; Xiao, X.; Yang, J.; Li, J.; Ji, M.; Du, W.; Tan, H.; Zhu, J.; Li, B. Epidemiological and clinical characteristics of patients with coronavirus disease-2019 in Shiyan City, China. Front. Cell. Infect. Microbiol. 2020, 10. [Google Scholar] [CrossRef] [PubMed]
- Ma, S.; Lai, X.; Chen, Z.; Tu, S.; Qin, K. Clinical characteristics of critically ill patients co-infected with SARS-CoV-2 and the influenza virus in Wuhan, China. Int. J. Infect. Dis. 2020, 96, 683–687. [Google Scholar] [CrossRef]
- Mannheim, J.; Gretsch, S.; Layden, J.E.; Fricchione, M.J. Characteristics of hospitalized pediatric coronavirus disease 2019 cases in Chicago, Illinois, March–April 2020. J. Pediatr. Infect. Dis. Soc. 2020, 9, 519–522. [Google Scholar] [CrossRef] [PubMed]
- Nasir, N.; Farooqi, J.; Mahmood, S.F.; Jabeen, K. COVID-19-associated pulmonary aspergillosis (CAPA) in patients admitted with severe COVID-19 pneumonia: An observational study from Pakistan. Mycoses 2020, 63, 766–770. [Google Scholar] [CrossRef]
- Oliva, A.; Siccardi, G.; Migliarini, A.; Cancelli, F.; Carnevalini, M.; D’Andria, M.; Attilia, I.; Danese, V.C.; Cecchetti, V.; Romiti, R. Co-infection of SARS-CoV-2 with Chlamydia or Mycoplasma pneumoniae: A case series and review of the literature. Infection 2020, 48, 871–877. [Google Scholar] [CrossRef]
- Peng, H.; Gao, P.; Xu, Q.; Liu, M.; Peng, J.; Wang, Y.; Xu, H. Coronavirus disease 2019 in children: Characteristics, antimicrobial treatment, and outcomes. J. Med. Virol. 2020, 128, 104425. [Google Scholar] [CrossRef]
- Pongpirul, W.A.; Mott, J.A.; Woodring, J.V.; Uyeki, T.M.; MacArthur, J.R.; Vachiraphan, A.; Suwanvattana, P.; Uttayamakul, S.; Chunsuttiwat, S.; Chotpitayasunondh, T. Clinical characteristics of patients hospitalized with coronavirus disease, Thailand. Emerg. Infect. Dis. 2020, 26, 1580–1585. [Google Scholar] [CrossRef]
- Richardson, S.; Hirsch, J.S.; Narasimhan, M.; Crawford, J.M.; McGinn, T.; Davidson, K.W.; Barnaby, D.P.; Becker, L.B.; Chelico, J.D.; Cohen, S.L. Presenting characteristics, comorbidities, and outcomes among 5700 patients hospitalized with COVID-19 in the New York City area. JAMA 2020, 323, 2052–2059. [Google Scholar] [CrossRef] [PubMed]
- Rutsaert, L.; Steinfort, N.; Van Hunsel, T.; Bomans, P.; Naesens, R.; Mertes, H.; Dits, H.; Van Regenmortel, N. COVID-19-associated invasive pulmonary aspergillosis. Ann. Intensiv. Care 2020, 10, 71. [Google Scholar] [CrossRef] [PubMed]
- Sun, D.; Chen, X.; Li, H.; Lu, X.-X.; Xiao, H.; Zhang, F.-R.; Liu, Z.-S. SARS-CoV-2 infection in infants under 1 year of age in Wuhan City, China. World J. Pediatr. 2020, 16, 260–266. [Google Scholar] [CrossRef] [PubMed]
- Tagarro, A.; Epalza, C.; Santos, M.; Sanz-Santaeufemia, F.J.; Otheo, E.; Moraleda, C.; Calvo, C. Screening and severity of coronavirus disease 2019 (COVID-19) in children in Madrid, Spain. JAMA Pediatr. 2021, 175, 316–317. [Google Scholar] [CrossRef] [Green Version]
- Van Arkel, A.L.; Rijpstra, T.A.; Belderbos, H.N.; Van Wijngaarden, P.; Verweij, P.E.; Bentvelsen, R.G. COVID-19–associated pulmonary aspergillosis. Am. J. Respir. Crit. Care Med. 2020, 202, 132–135. [Google Scholar] [CrossRef]
- Wang, R.; Pan, M.; Zhang, X.; Han, M.; Fan, X.; Zhao, F.; Miao, M.; Xu, J.; Guan, M.; Deng, X. Epidemiological and clinical features of 125 hospitalized patients with COVID-19 in Fuyang, Anhui, China. Int. J. Infect. Dis. 2020, 95, 421–428. [Google Scholar] [CrossRef] [PubMed]
- Wang, Y.; Liu, Y.; Liu, L.; Wang, X.; Luo, N.; Li, L. Clinical outcomes in 55 patients with severe acute respiratory syndrome coronavirus 2 who were asymptomatic at hospital admission in Shenzhen, China. J. Infect. Dis. 2020, 221, 1770–1774. [Google Scholar] [CrossRef] [PubMed]
- Wang, Z.; Yang, B.; Li, Q.; Wen, L.; Zhang, R. Clinical features of 69 cases with coronavirus disease 2019 in Wuhan, China. Clin. Infect. Dis. 2020, 71, 769–777. [Google Scholar] [CrossRef] [Green Version]
- Wu, Q.; Xing, Y.; Shi, L.; Li, W.; Gao, Y.; Pan, S.; Wang, Y.; Wang, W.; Xing, Q. Coinfection and other clinical characteristics of COVID-19 in children. Pediatrics 2020, 146. [Google Scholar] [CrossRef] [PubMed]
- Xia, W.; Shao, J.; Guo, Y.; Peng, X.; Li, Z.; Hu, D. Clinical and CT features in pediatric patients with COVID-19 infection: Different points from adults. Pediatr. Pulmonol. 2020, 55, 1169–1174. [Google Scholar] [CrossRef] [Green Version]
- Yang, X.; Yu, Y.; Xu, J.; Shu, H.; Liu, H.; Wu, Y.; Zhang, L.; Yu, Z.; Fang, M.; Yu, T. Clinical course and outcomes of critically ill patients with SARS-CoV-2 pneumonia in Wuhan, China: A single-centered, retrospective, observational study. Lancet Respir. Med. 2020, 8, 475–481. [Google Scholar] [CrossRef] [Green Version]
- Zheng, F.; Liao, C.; Fan, Q.-H.; Chen, H.; Zhao, X.; Xie, Z.; Li, X.; Chen, C.; Lu, X.; Liu, Z. Clinical characteristics of children with coronavirus disease 2019 in Hubei, China. Curr. Med. Sci. 2020, 275–280. [Google Scholar] [CrossRef] [Green Version]
- Zhang, J.; Dong, X.; Cao, Y.; Yuan, Y.; Yang, Y.; Yan, Y.; Akdis, C.A.; Gao, Y. Clinical characteristics of 140 patients infected with SARS-CoV-2 in Wuhan, China. Allergy 2020, 75, 1730–1741. [Google Scholar] [CrossRef] [PubMed]
- Contou, D.; Claudinon, A.; Pajot, O.; Micaëlo, M.; Flandre, P.L.; Dubert, M.; Cally, R.; Logre, E.; Fraissé, M.; Mentec, H. Bacterial and viral co-infections in patients with severe SARS-CoV-2 pneumonia admitted to a French ICU. Ann. Intensive Care 2020, 10, 119. [Google Scholar] [CrossRef]
- Gayam, V.; Konala, V.M.; Naramala, S.; Garlapati, P.R.; Merghani, M.A.; Regmi, N.; Balla, M.; Adapa, S. Presenting characteristics, comorbidities, and outcomes of patients coinfected with COVID-19 and Mycoplasma pneumoniae in the USA. J. Med. Virol. 2020, 92, 2181–2187. [Google Scholar] [CrossRef]
- Hazra, A.; Collison, M.; Pisano, J.; Kumar, M.; Oehler, C.; Ridgway, J.P. Coinfections with SARS-CoV-2 and other respiratory pathogens. Infect. Control Hosp. Epidemiol. 2020, 41, 1228–1229. [Google Scholar] [CrossRef]
- Karami, Z.; Knoop, B.T.; Dofferhoff, A.S.; Blaauw, M.J.; Janssen, N.A.; van Apeldoorn, M.; Kerckhoffs, A.P.; van de Maat, J.S.; Hoogerwerf, J.J.; Ten Oever, J. Few bacterial co-infections but frequent empiric antibiotic use in the early phase of hospitalized patients with COVID-19: Results from a multicentre retrospective cohort study in The Netherlands. Infect. Dis. 2020. [Google Scholar] [CrossRef] [PubMed]
- Kim, D.; Quinn, J.; Pinsky, B.; Shah, N.H.; Brown, I. Rates of co-infection between SARS-CoV-2 and other respiratory pathogens. JAMA 2020, 323, 2085–2086. [Google Scholar] [CrossRef] [PubMed] [Green Version]
- Kreitmann, L.; Monard, C.; Dauwalder, O.; Simon, M.; Argaud, L. Early bacterial co-infection in ARDS related to COVID-19. Intensive Care Med. 2020, 46, 1787–1789. [Google Scholar] [CrossRef] [PubMed]
- Lehmann, C.J.; Pho, M.T.; Pitrak, D.; Ridgway, J.P.; Pettit, N.N. Community acquired co-infection in COVID-19: A retrospective observational experience. Clin. Infect. Dis. 2020. [Google Scholar] [CrossRef]
- Massey, B.W.; Jayathilake, K.; Meltzer, H.Y. Respiratory microbial co-infection with SARS-CoV-2. Front. Microbiol. 2020, 11. [Google Scholar] [CrossRef] [PubMed]
- Nowak, M.D.; Sordillo, E.M.; Gitman, M.R.; Paniz Mondolfi, A.E. Coinfection in SARS-CoV-2 infected patients: Where are influenza virus and rhinovirus/enterovirus? J. Med. Virol. 2020, 92, 1699–1700. [Google Scholar] [CrossRef]
- Ozaras, R.; Cirpin, R.; Duran, A.; Duman, H.; Arslan, O.; Bakcan, Y.; Kaya, M.; Mutlu, H.; Isayeva, L.; Kebanlı, F. Influenza and COVID-19 coinfection: Report of six cases and review of the literature. J. Med. Virol. 2020, 92, 2657–2665. [Google Scholar] [CrossRef]
- Sepulveda, J.; Westblade, L.F.; Whittier, S.; Satlin, M.J.; Greendyke, W.G.; Aaron, J.G.; Zucker, J.; Dietz, D.; Sobieszczyk, M.; Choi, J.J. Bacteremia and blood culture utilization during COVID-19 surge in New York City. J. Med. Virol. 2020, 58. [Google Scholar] [CrossRef]
- Singh, V.; Upadhyay, P.; Reddy, J.; Granger, J. SARS-CoV-2 respiratory co-infections: Incidence of viral and bacterial co-pathogens. Int. J. Infect. Dis. 2021. [Google Scholar] [CrossRef] [PubMed]
- Song, W.; Jia, X.; Zhang, X.; Ling, Y.; Yi, Z. Co-infection in COVID-19, a cohort study. J. Infect. 2020. [Google Scholar] [CrossRef] [PubMed]
- Tang, M.-L.; Li, Y.-Q.; Chen, X.; Lin, H.; Jiang, Z.-C.; Gu, D.-L.; Chen, X.; Tang, C.-X.; Xie, Z.-Q. Co-infection with common respiratory pathogens and SARS-CoV-2 in patients with COVID-19 pneumonia and laboratory biochemistry findings: A retrospective cross-sectional study of 78 patients from a single center in China. Int. Med. J. Exp. Clin. Res. 2021, 27, e929783-1. [Google Scholar]
- Thelen, J.M.; Buenen, A.N.; van Apeldoorn, M.; Wertheim, H.F.; Hermans, M.H.; Wever, P.C. Community-acquired bacteraemia in COVID-19 in comparison to influenza A and influenza B: A retrospective cohort study. BMC Infect. Dis. 2021, 21, 199. [Google Scholar] [CrossRef]
- Wee, L.E.; Ko, K.K.K.; Ho, W.Q.; Kwek, G.T.C.; Tan, T.T.; Wijaya, L. Community-acquired viral respiratory infections amongst hospitalized inpatients during a COVID-19 outbreak in Singapore: Co-infection and clinical outcomes. J. Clin. Virol. 2020, 128, 104436. [Google Scholar] [CrossRef] [PubMed]
- Wu, C.; Chen, X.; Cai, Y.; Zhou, X.; Xu, S.; Huang, H.; Zhang, L.; Zhou, X.; Du, C.; Zhang, Y. Risk factors associated with acute respiratory distress syndrome and death in patients with coronavirus disease 2019 pneumonia in Wuhan, China. JAMA Intern. Med. 2020, 180, 934–943. [Google Scholar] [CrossRef] [Green Version]
- Yue, H.; Zhang, M.; Xing, L.; Wang, K.; Rao, X.; Liu, H.; Tian, J.; Zhou, P.; Deng, Y.; Shang, J. The epidemiology and clinical characteristics of co-infection of SARS-CoV-2 and influenza viruses in patients during COVID-19 outbreak. J. Med. Virol. 2020, 92, 2870–2873. [Google Scholar] [CrossRef] [PubMed]
- Zhao, D.; Yao, F.; Wang, L.; Zheng, L.; Gao, Y.; Ye, J.; Guo, F.; Zhao, H.; Gao, R. A comparative study on the clinical features of coronavirus 2019 (COVID-19) pneumonia with other pneumonias. Clin. Infect. Dis. 2020, 71, 756–761. [Google Scholar] [CrossRef] [PubMed] [Green Version]
- Zheng, X.; Wang, H.; Su, Z.; Li, W.; Yang, D.; Deng, F.; Chen, J. Co-infection of SARS-CoV-2 and Influenza virus in Early Stage of the COVID-19 Epidemic in Wuhan, China. J. Infect. 2020. [Google Scholar] [CrossRef]
- Lansbury, L.; Lim, B.; Baskaran, V.; Lim, W.S. Co-infections in people with COVID-19: A systematic review and meta-analysis. J. Infect. 2020, 81, 266–275. [Google Scholar] [CrossRef]
- Langford, B.J.; So, M.; Raybardhan, S.; Leung, V.; Westwood, D.; MacFadden, D.R.; Soucy, J.-P.R.; Daneman, N. Bacterial co-infection and secondary infection in patients with COVID-19: A living rapid review and meta-analysis. Clin. Microbiol. Infect. 2020. [Google Scholar] [CrossRef] [PubMed]
- Davis, B.; Rothrock, A.N.; Swetland, S.; Andris, H.; Davis, P.; Rothrock, S.G. Viral and atypical respiratory co-infections in COVID-19: A systematic review and meta-analysis. J. Am. Coll. Emerg. Phys. Open 2020, 1, 533–548. [Google Scholar] [CrossRef] [PubMed]
- Moher, D.; Liberati, A.; Tetzlaff, J.; Altman, D.G.; Group, P. Preferred reporting items for systematic reviews and meta-analyses: The PRISMA statement. PLoS Med. 2009, 6, e1000097. [Google Scholar] [CrossRef] [PubMed] [Green Version]
- Wells, G.; Shea, B.; O’Connell, D.; Peterson, J.; Welch, V.; Losos, M.; Tugwell, P. The Newcastle-Ottawa Scale (NOS) for Assessing the Quality of Nonrandomized Studies in Meta-Analyses; Ottawa Health Research Institute: Ottawa, ON, Canada, 2015. [Google Scholar]
- DerSimonian, R.; Kacker, R. Random-effects model for meta-analysis of clinical trials: An update. Contemp. Clin. Trials 2007, 28, 105–114. [Google Scholar] [CrossRef] [PubMed]
- Higgins, J.P.; Thompson, S.G. Quantifying heterogeneity in a meta-analysis. Stat. Med. 2002, 21, 1539–1558. [Google Scholar] [CrossRef]
- Higgins, J.P.; Thompson, S.G.; Deeks, J.J.; Altman, D.G. Measuring inconsistency in meta-analyses. BMJ 2003, 327, 557–560. [Google Scholar] [CrossRef] [Green Version]
- Egger, M.; Smith, G.D.; Schneider, M.; Minder, C. Bias in meta-analysis detected by a simple, graphical test. BMJ 1997, 315, 629–634. [Google Scholar] [CrossRef] [Green Version]
- Chen, N.; Zhou, M.; Dong, X.; Qu, J.; Gong, F.; Han, Y.; Qiu, Y.; Wang, J.; Liu, Y.; Wei, Y. Epidemiological and clinical characteristics of 99 cases of 2019 novel coronavirus pneumonia in Wuhan, China: A descriptive study. Lancet 2020, 395, 507–513. [Google Scholar] [CrossRef] [Green Version]
- Mo, P.; Xing, Y.; Xiao, Y.; Deng, L.; Zhao, Q.; Wang, H.; Xiong, Y.; Cheng, Z.; Gao, S.; Liang, K. Clinical characteristics of refractory COVID-19 pneumonia in Wuhan, China. Clin. Infect. Dis. 2020. [Google Scholar] [CrossRef] [Green Version]
- Zha, L.; Shen, J.; Tefsen, B.; Wang, Y.; Lu, W.; Xu, Q. Clinical features and outcomes of adult COVID-19 patients co-infected with Mycoplasma pneumoniae. J. Infect. 2020. [Google Scholar] [CrossRef]
- Al Mutair, A.; Alhumaid, S.; Alhuqbani, W.N.; Zaidi, A.R.Z.; Alkoraisi, S.; Al-Subaie, M.F.; AlHindi, A.M.; Abogosh, A.K.; Alrasheed, A.K.; Alsharafi, A.A. Clinical, epidemiological, and laboratory characteristics of mild-to-moderate COVID-19 patients in Saudi Arabia: An observational cohort study. Eur. J. Med. Res. 2020, 25. [Google Scholar] [CrossRef] [PubMed]
- Alhumaid, S.; Al Mutair, A.; Al Alawi, Z.; Al Salman, K.; Al Dossary, N.; Omar, A.; Alismail, M.; Al Ghazal, A.M.; Jubarah, M.B.; Al Shaikh, H. Clinical features and prognostic factors of intensive and non-intensive 1014 COVID-19 patients: An experience cohort from Alahsa, Saudi Arabia. Eur. J. Med. Res. 2021, 26, 47. [Google Scholar] [CrossRef] [PubMed]
- Al-Omari, A.; Alhuqbani, W.N.; Zaidi, A.R.Z.; Al-Subaie, M.F.; AlHindi, A.M.; Abogosh, A.K.; Alrasheed, A.K.; Alsharafi, A.A.; Alhuqbani, M.N.; Salih, S. Clinical characteristics of non-intensive care unit COVID-19 patients in Saudi Arabia: A descriptive cross-sectional study. J. Infect. Public Health 2020, 13, 1639–1644. [Google Scholar] [CrossRef]
- Sharifipour, E.; Shams, S.; Esmkhani, M.; Khodadadi, J.; Fotouhi-Ardakani, R.; Koohpaei, A.; Doosti, Z.; Golzari, S.E. Evaluation of bacterial co-infections of the respiratory tract in COVID-19 patients admitted to ICU. BMC Infect. Dis. 2020, 20, 646. [Google Scholar] [CrossRef] [PubMed]
- Lee, A.; Cheung, Y.S.L.; Joynt, G.M.; Leung, C.C.H.; Wong, W.-T.; Gomersall, C.D. Are high nurse workload/staffing ratios associated with decreased survival in critically ill patients? A cohort study. Ann. Intensive Care 2017, 7, 46. [Google Scholar] [CrossRef]
- Dasgupta, S.; Das, S.; Chawan, N.S.; Hazra, A. Nosocomial infections in the intensive care unit: Incidence, risk factors, outcome and associated pathogens in a public tertiary teaching hospital of eastern India. Indian J. Crit. Care Med. 2015, 19, 14. [Google Scholar]
- Alhumaid, S.; Al Mutair, A.; Al Alawi, Z.; Alsuliman, M.; Ahmed, G.Y.; Rabaan, A.A.; Al-Tawfiq, J.A.; Al-Omari, A. Knowledge of infection prevention and control among healthcare workers and factors influencing compliance: A systematic review. Antimicrob. Resist. Infect. Control. 2021, 10, 1–32. [Google Scholar] [CrossRef] [PubMed]
- Al-Omari, A.; Al Mutair, A.; Alhumaid, S.; Salih, S.; Alanazi, A.; Albarsan, H.; Abourayan, M.; Al Subaie, M. The impact of antimicrobial stewardship program implementation at four tertiary private hospitals: Results of a five-years pre-post analysis. Antimicrob. Resist. Infect. Control. 2020, 9, 95. [Google Scholar] [CrossRef] [PubMed]
- Al Mutair, A.; Alhumaid, S.; Al Alawi, Z.; Zaidi, A.R.Z.; Alzahrani, A.J.; Al-Tawfiq, J.; Al-Shammari, H.; Rabaan, A.; Khojah, O.; Al-Omari, A. Five-year resistance trends in pathogens causing healthcare-associated infections at a multi-hospital healthcare system in Saudi Arabia, 2015–2019. J. Glob. Antimicrob. Resist. 2021. [Google Scholar] [CrossRef]
- Alhumaid, S.; Al Mutair, A.; Al Alawi, Z.; Alzahrani, A.J.; Tobaiqy, M.; Alresasi, A.M.; Bu-Shehab, I.; Al-Hadary, I.; Alhmeed, N.; Alismail, M.; et al. Antimicrobial susceptibility of gram-positive and gram-negative bacteria: A 5-year retrospective analysis at a multi-hospital healthcare system in Saudi Arabia. Ann. Clin. Microbiol. Antimicrob. 2021, 20, 43. [Google Scholar] [CrossRef]
- Uyeki, T.M.; Bernstein, H.H.; Bradley, J.S.; Englund, J.A.; File, T.M., Jr.; Fry, A.M.; Gravenstein, S.; Hayden, F.G.; Harper, S.A.; Hirshon, J.M. Clinical practice guidelines by the Infectious Diseases Society of America: 2018 update on diagnosis, treatment, chemoprophylaxis, and institutional outbreak management of seasonal influenza. Clin. Infect. Dis. 2019, 68, e1–e47. [Google Scholar] [CrossRef]
- Unnewehr, M.; Friederichs, H.; Bartsch, P.; Schaaf, B. High diagnostic value of a new real-time Pneumocystis PCR from bronchoalveolar lavage in a real-life clinical setting. Respiration 2016, 92, 144–149. [Google Scholar] [CrossRef]
- Byington, C.L.; Ampofo, K.; Stockmann, C.; Adler, F.R.; Herbener, A.; Miller, T.; Sheng, X.; Blaschke, A.J.; Crisp, R.; Pavia, A.T. Community surveillance of respiratory viruses among families in the Utah better identification of germs-longitudinal viral epidemiology (BIG-LoVE) study. Clin. Infect. Dis. 2015, 61, 1217–1224. [Google Scholar] [CrossRef]
- Patel, R.; Babady, E.; Theel, E.S.; Storch, G.A.; Pinsky, B.A.; St George, K.; Smith, T.C.; Bertuzzi, S. Report from the American Society for Microbiology COVID-19 international summit, 23 March 2020: Value of diagnostic testing for SARS–CoV-2/COVID-19. Am. Soc. Microbiol. 2020. [Google Scholar] [CrossRef] [Green Version]
- Morens, D.M.; Taubenberger, J.K.; Fauci, A.S. Predominant role of bacterial pneumonia as a cause of death in pandemic influenza: Implications for pandemic influenza preparedness. J. Infect. Dis. 2008, 198, 962–970. [Google Scholar] [CrossRef]
- Leung, C.-H.; Tseng, H.-K.; Wang, W.-S.; Chiang, H.-T.; Wu, A.Y.-J.; Liu, C.-P. Clinical characteristics of children and adults hospitalized for influenza virus infection. J. Microbiol. Immunol. Infect. 2014, 47, 518–525. [Google Scholar] [CrossRef] [Green Version]
- Cusumano, J.A.; Dupper, A.C.; Malik, Y.; Gavioli, E.M.; Banga, J.; Berbel Caban, A.; Nadkarni, D.; Obla, A.; Vasa, C.V.; Mazo, D. (Eds.) Staphylococcus aureus bacteremia in patients infected with COVID-19: A case series. In Open Forum Infectious Diseases; Oxford University Press: Oxford, UK, 2020. [Google Scholar]
- Navarini, A.A.; Recher, M.; Lang, K.S.; Georgiev, P.; Meury, S.; Bergthaler, A.; Flatz, L.; Bille, J.; Landmann, R.; Odermatt, B. Increased susceptibility to bacterial superinfection as a consequence of innate antiviral responses. Proc. Nat. Acad. Sci. USA 2006, 103, 15535–15539. [Google Scholar] [CrossRef] [PubMed] [Green Version]
- Didierlaurent, A.; Goulding, J.; Patel, S.; Snelgrove, R.; Low, L.; Bebien, M.; Lawrence, T.; van Rijt, L.S.; Lambrecht, B.N.; Sirard, J.-C. Sustained desensitization to bacterial Toll-like receptor ligands after resolutionof respiratory influenza infection. J. Exp. Med. 2008, 205, 323–329. [Google Scholar] [CrossRef] [PubMed] [Green Version]
- Gadi, N.; Wu, S.C.; Spihlman, A.P.; Moulton, V.R. What’s sex got to do with COVID-19? Gender-based differences in the host immune response to coronaviruses. Front. Immunol. 2020, 11, 2147. [Google Scholar] [CrossRef] [PubMed]
- Rabaan, A.A.; Al-Ahmed, S.H.; Garout, M.A.; Al-Qaaneh, A.M.; Sule, A.A.; Tirupathi, R.; Mutair, A.A.; Alhumaid, S.; Hasan, A.; Dhawan, M. Diverse immunological factors influencing pathogenesis in patients with COVID-19: A review on viral dissemination, immunotherapeutic options to counter cytokine storm and inflammatory responses. Pathogens 2021, 10, 565. [Google Scholar] [CrossRef] [PubMed]
- Kamfose, M.M.; Muriithi, F.G.; Knight, T.; Lasserson, D.; Hayward, G. Intravenous ceftriaxone versus multiple dosing regimes of intravenous anti-Staphylococcal antibiotics for methicillin-susceptible Staphylococcus aureus (MSSA): A systematic review. Antibiotics 2020, 9, 39. [Google Scholar] [CrossRef] [PubMed] [Green Version]
Publisher’s Note: MDPI stays neutral with regard to jurisdictional claims in published maps and institutional affiliations. |
© 2021 by the authors. Licensee MDPI, Basel, Switzerland. This article is an open access article distributed under the terms and conditions of the Creative Commons Attribution (CC BY) license (https://creativecommons.org/licenses/by/4.0/).