
Impact of Annual Albendazole versus Four-Monthly Test-and-Treat Approach of Intestinal Parasites on Children Growth—A Longitudinal Four-Arm Randomized Parallel Trial during Two Years of a Community Follow-Up in Bengo, Angola

 , ,
, ,  ,
,
Abstract
1. Introduction
2. Materials and Methods
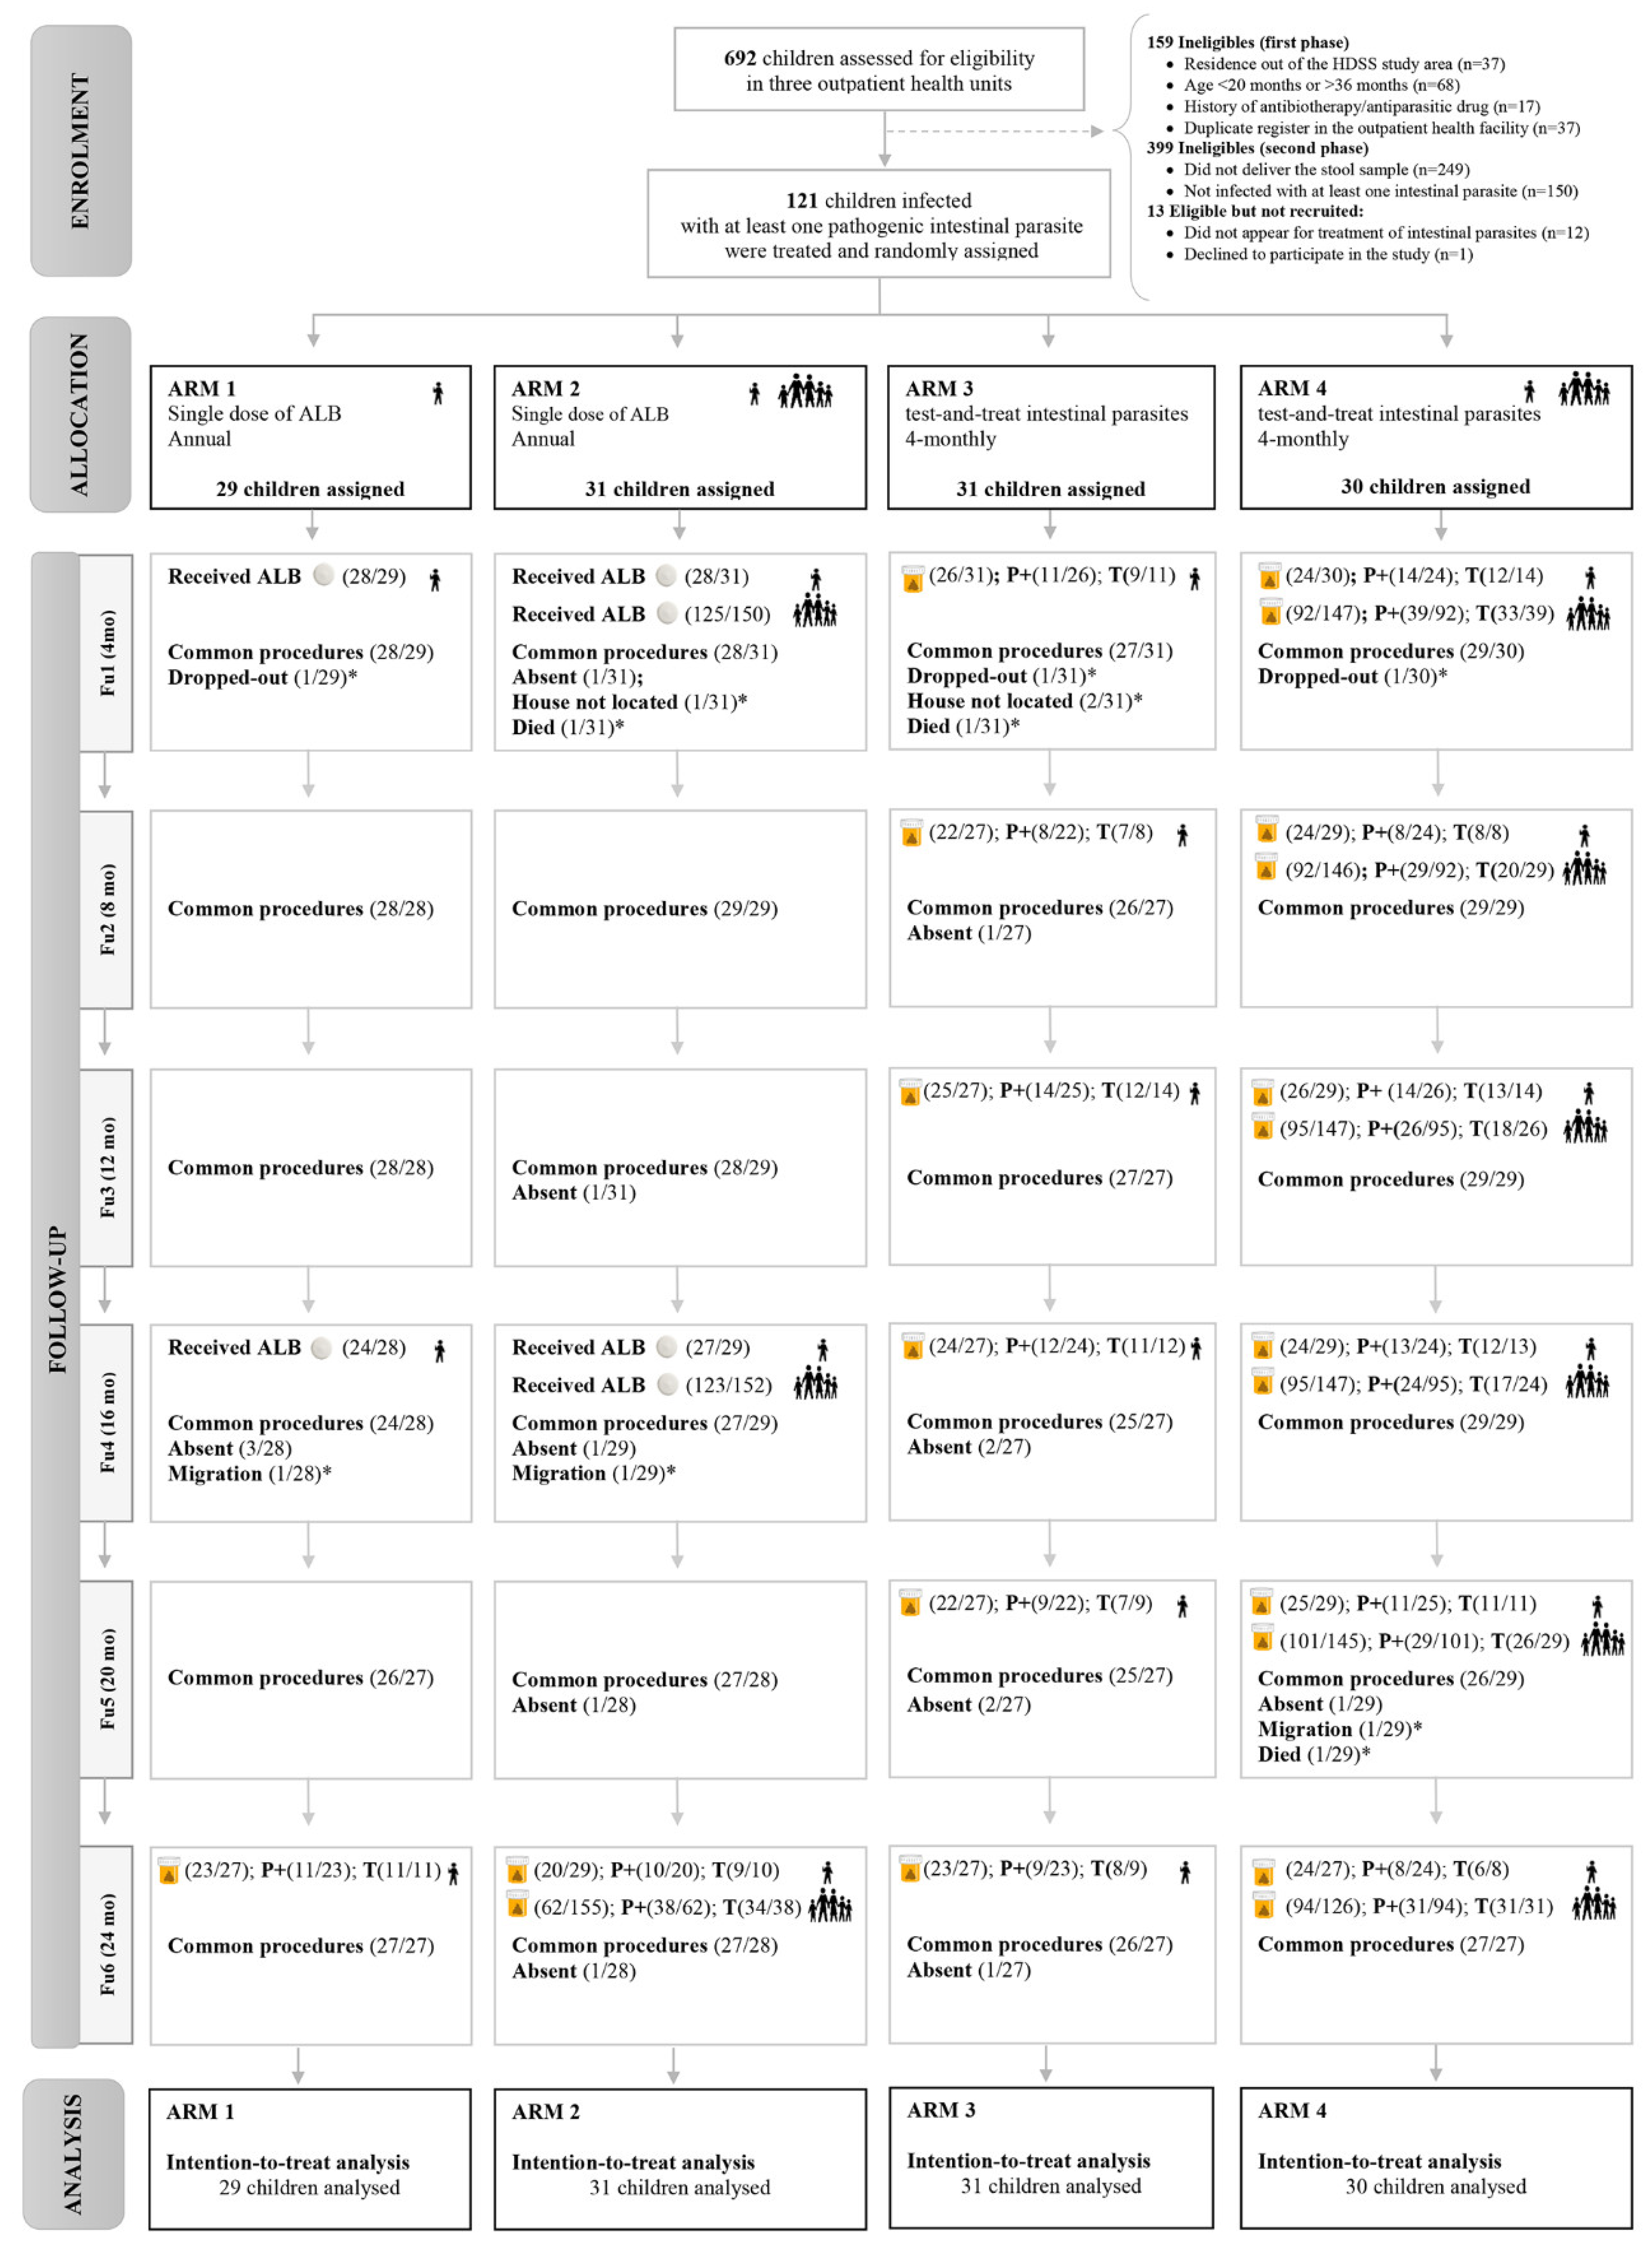
2.1. Study Design, Setting, and Participants
2.2. Randomization and Masking
- Arm 1 (A1)—to receive a single annual dose of ALB 400 mg at individual level.
- Arm 2 (A2)—to receive a single annual dose of ALB 400 mg at household level (child and household members).
- Arm 3 (A3)—to test-and-treat pathogenic intestinal parasites every four months at individual level.
- Arm 4 (A4)—to test-and-treat pathogenic intestinal parasites every four months at household level (child and household members).
2.3. Common Procedures between Arms
2.4. Symptoms
2.5. Anthropometric Assessment
2.6. Anemia and Malaria
2.7. Interventions
 : Single dose of albendazole;
  : Stool sample collected; P+: Positive samples for pathogenic intestinal parasites; T: children infected with intestinal parasites who received treatment;
  : children included;
  : household members.
: Single dose of albendazole; : Stool sample collected; P+: Positive samples for pathogenic intestinal parasites; T: children infected with intestinal parasites who received treatment; : children included; : household members.
: household members.
: Single dose of albendazole; : Stool sample collected; P+: Positive samples for pathogenic intestinal parasites; T: children infected with intestinal parasites who received treatment; : children included; : household members.
2.7.1. Annual Single Dose of ALB at Individual (A1) and Household Levels (A2)
2.7.2. Test-and-Treat Intestinal Parasites Approach at Individual (A3) and Household Levels (A4)
2.8. Outcomes
2.9. Statistical Analysis
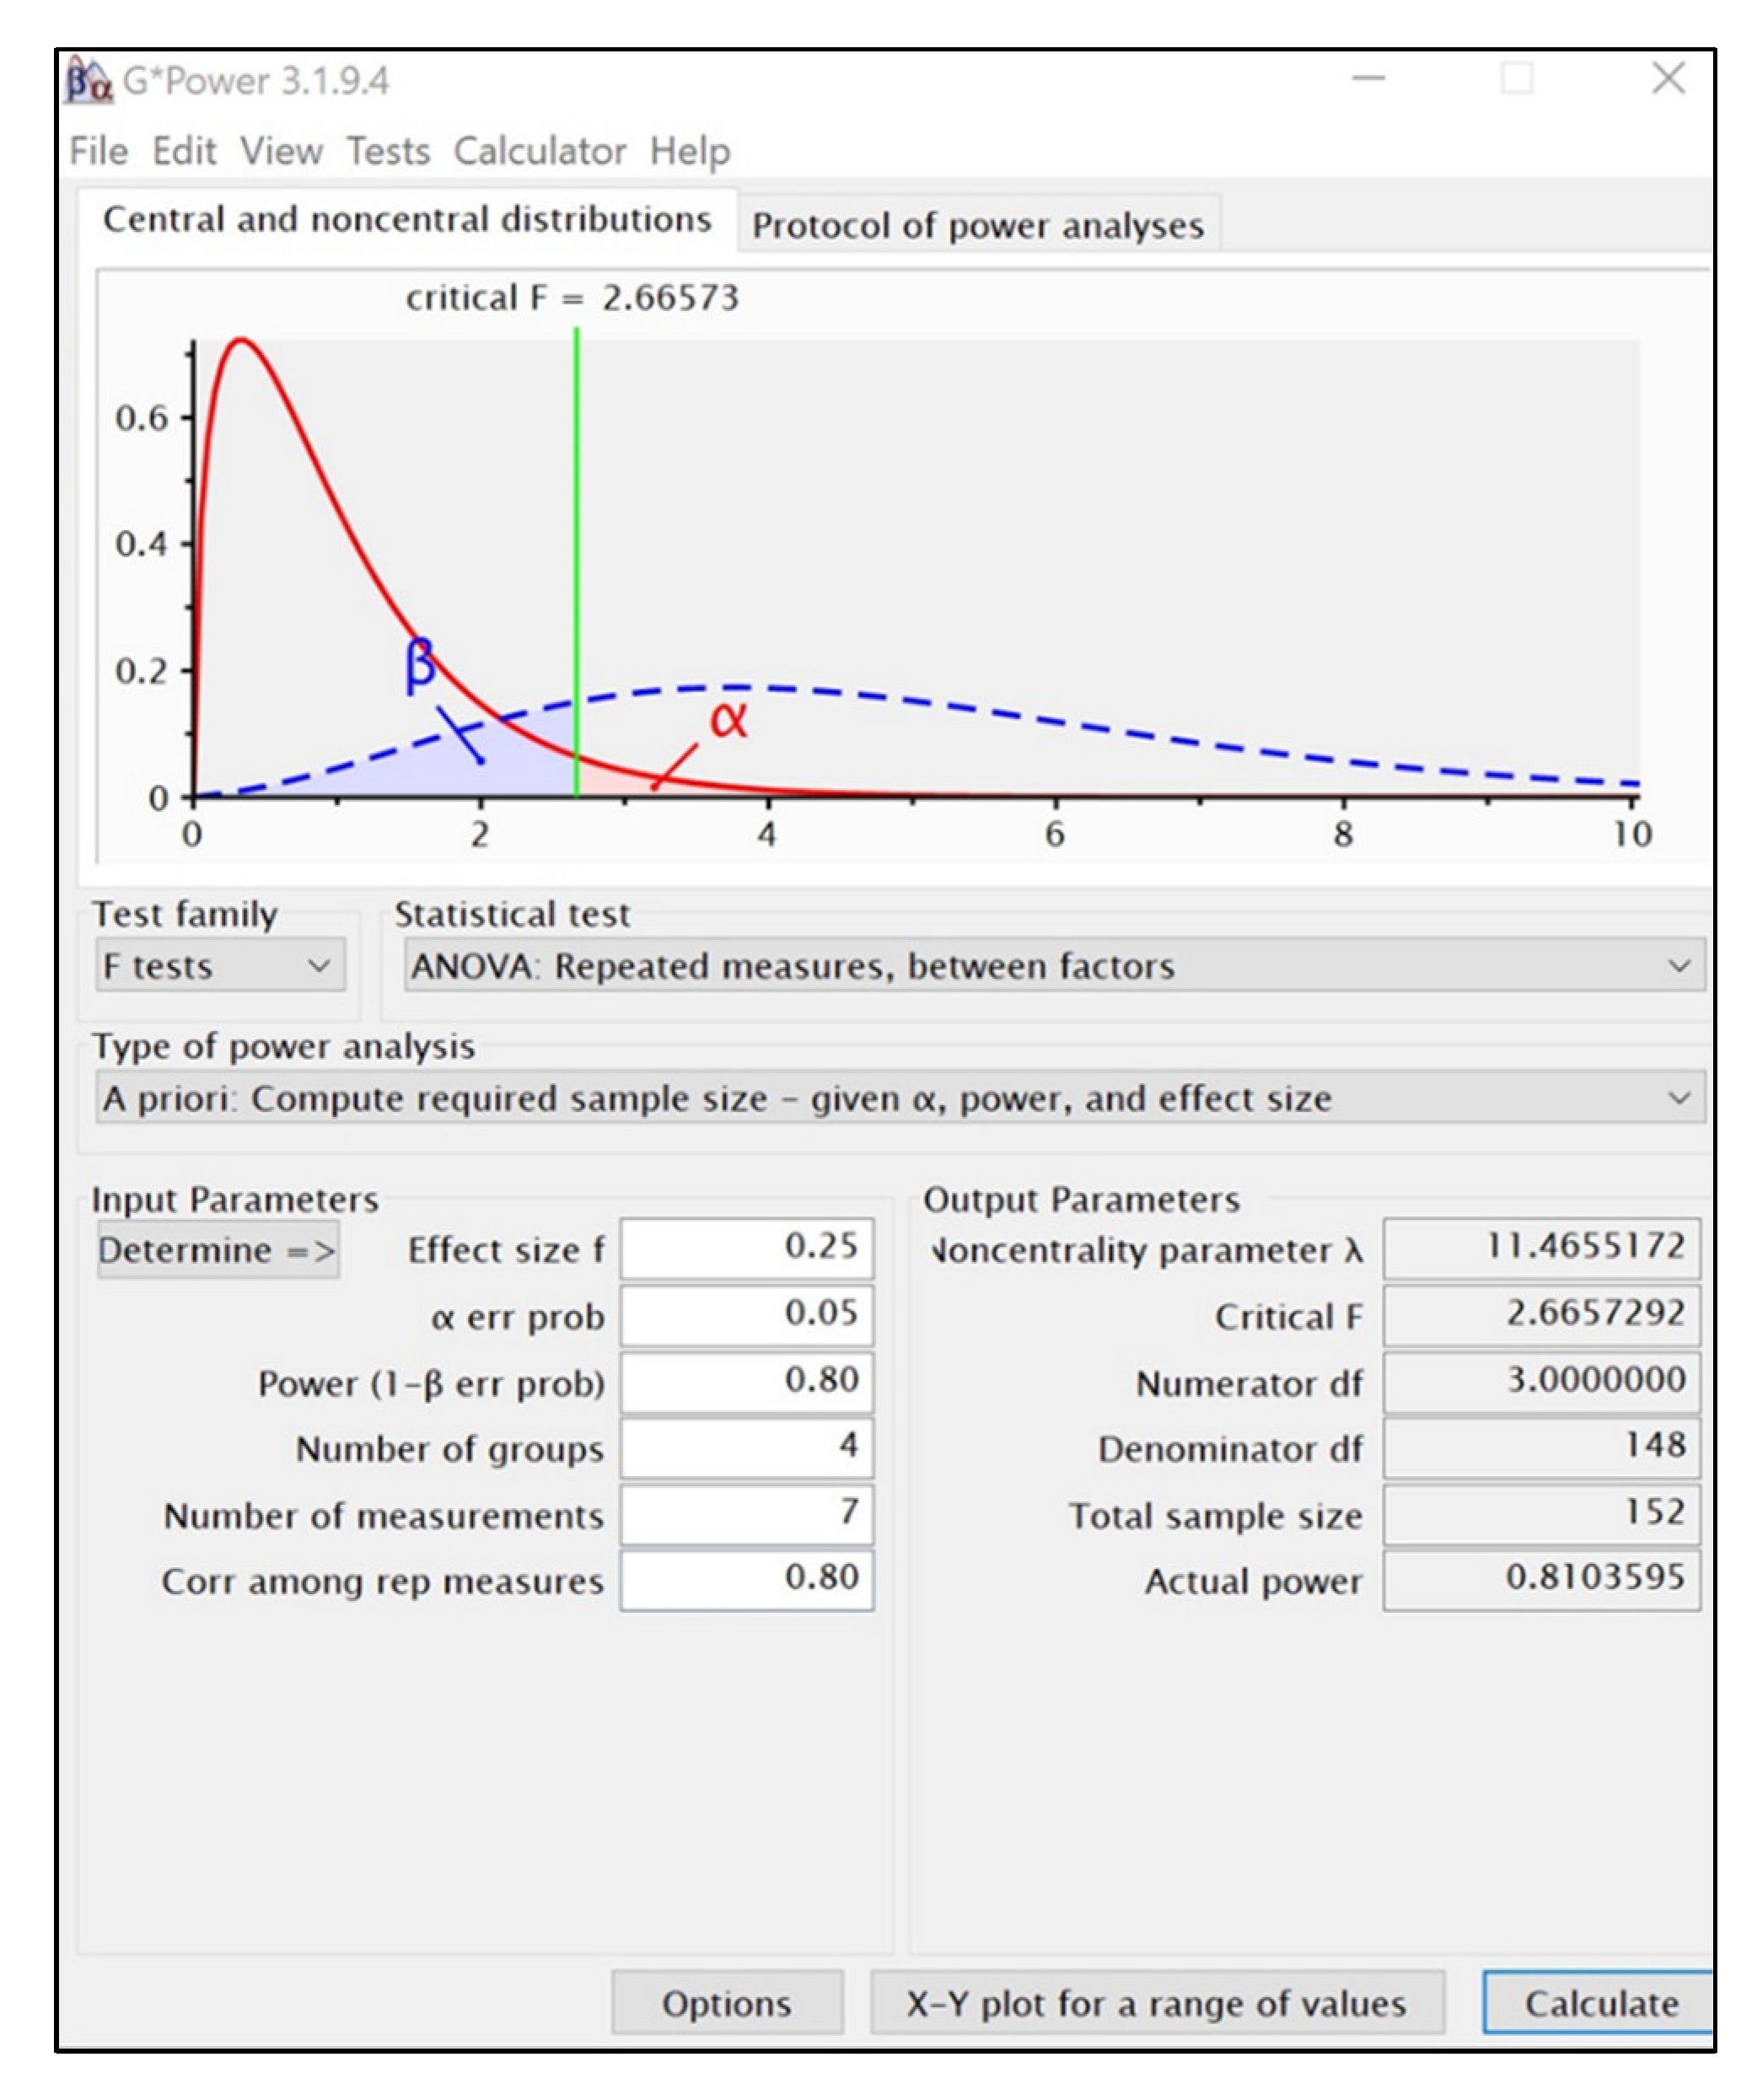
2.9.1. Sample Size Calculation
2.9.2. Data Analysis
- (i)
- Do the arms/treatments have the same effect?
- (ii)
- Is the time profile flat or there is a trend over the follow-up period?
- (iii)
- Are the effects of the treatments similar over time?
3. Results
3.1. Baseline Characteristics
3.2. Loss to Follow-Up and Missing Values
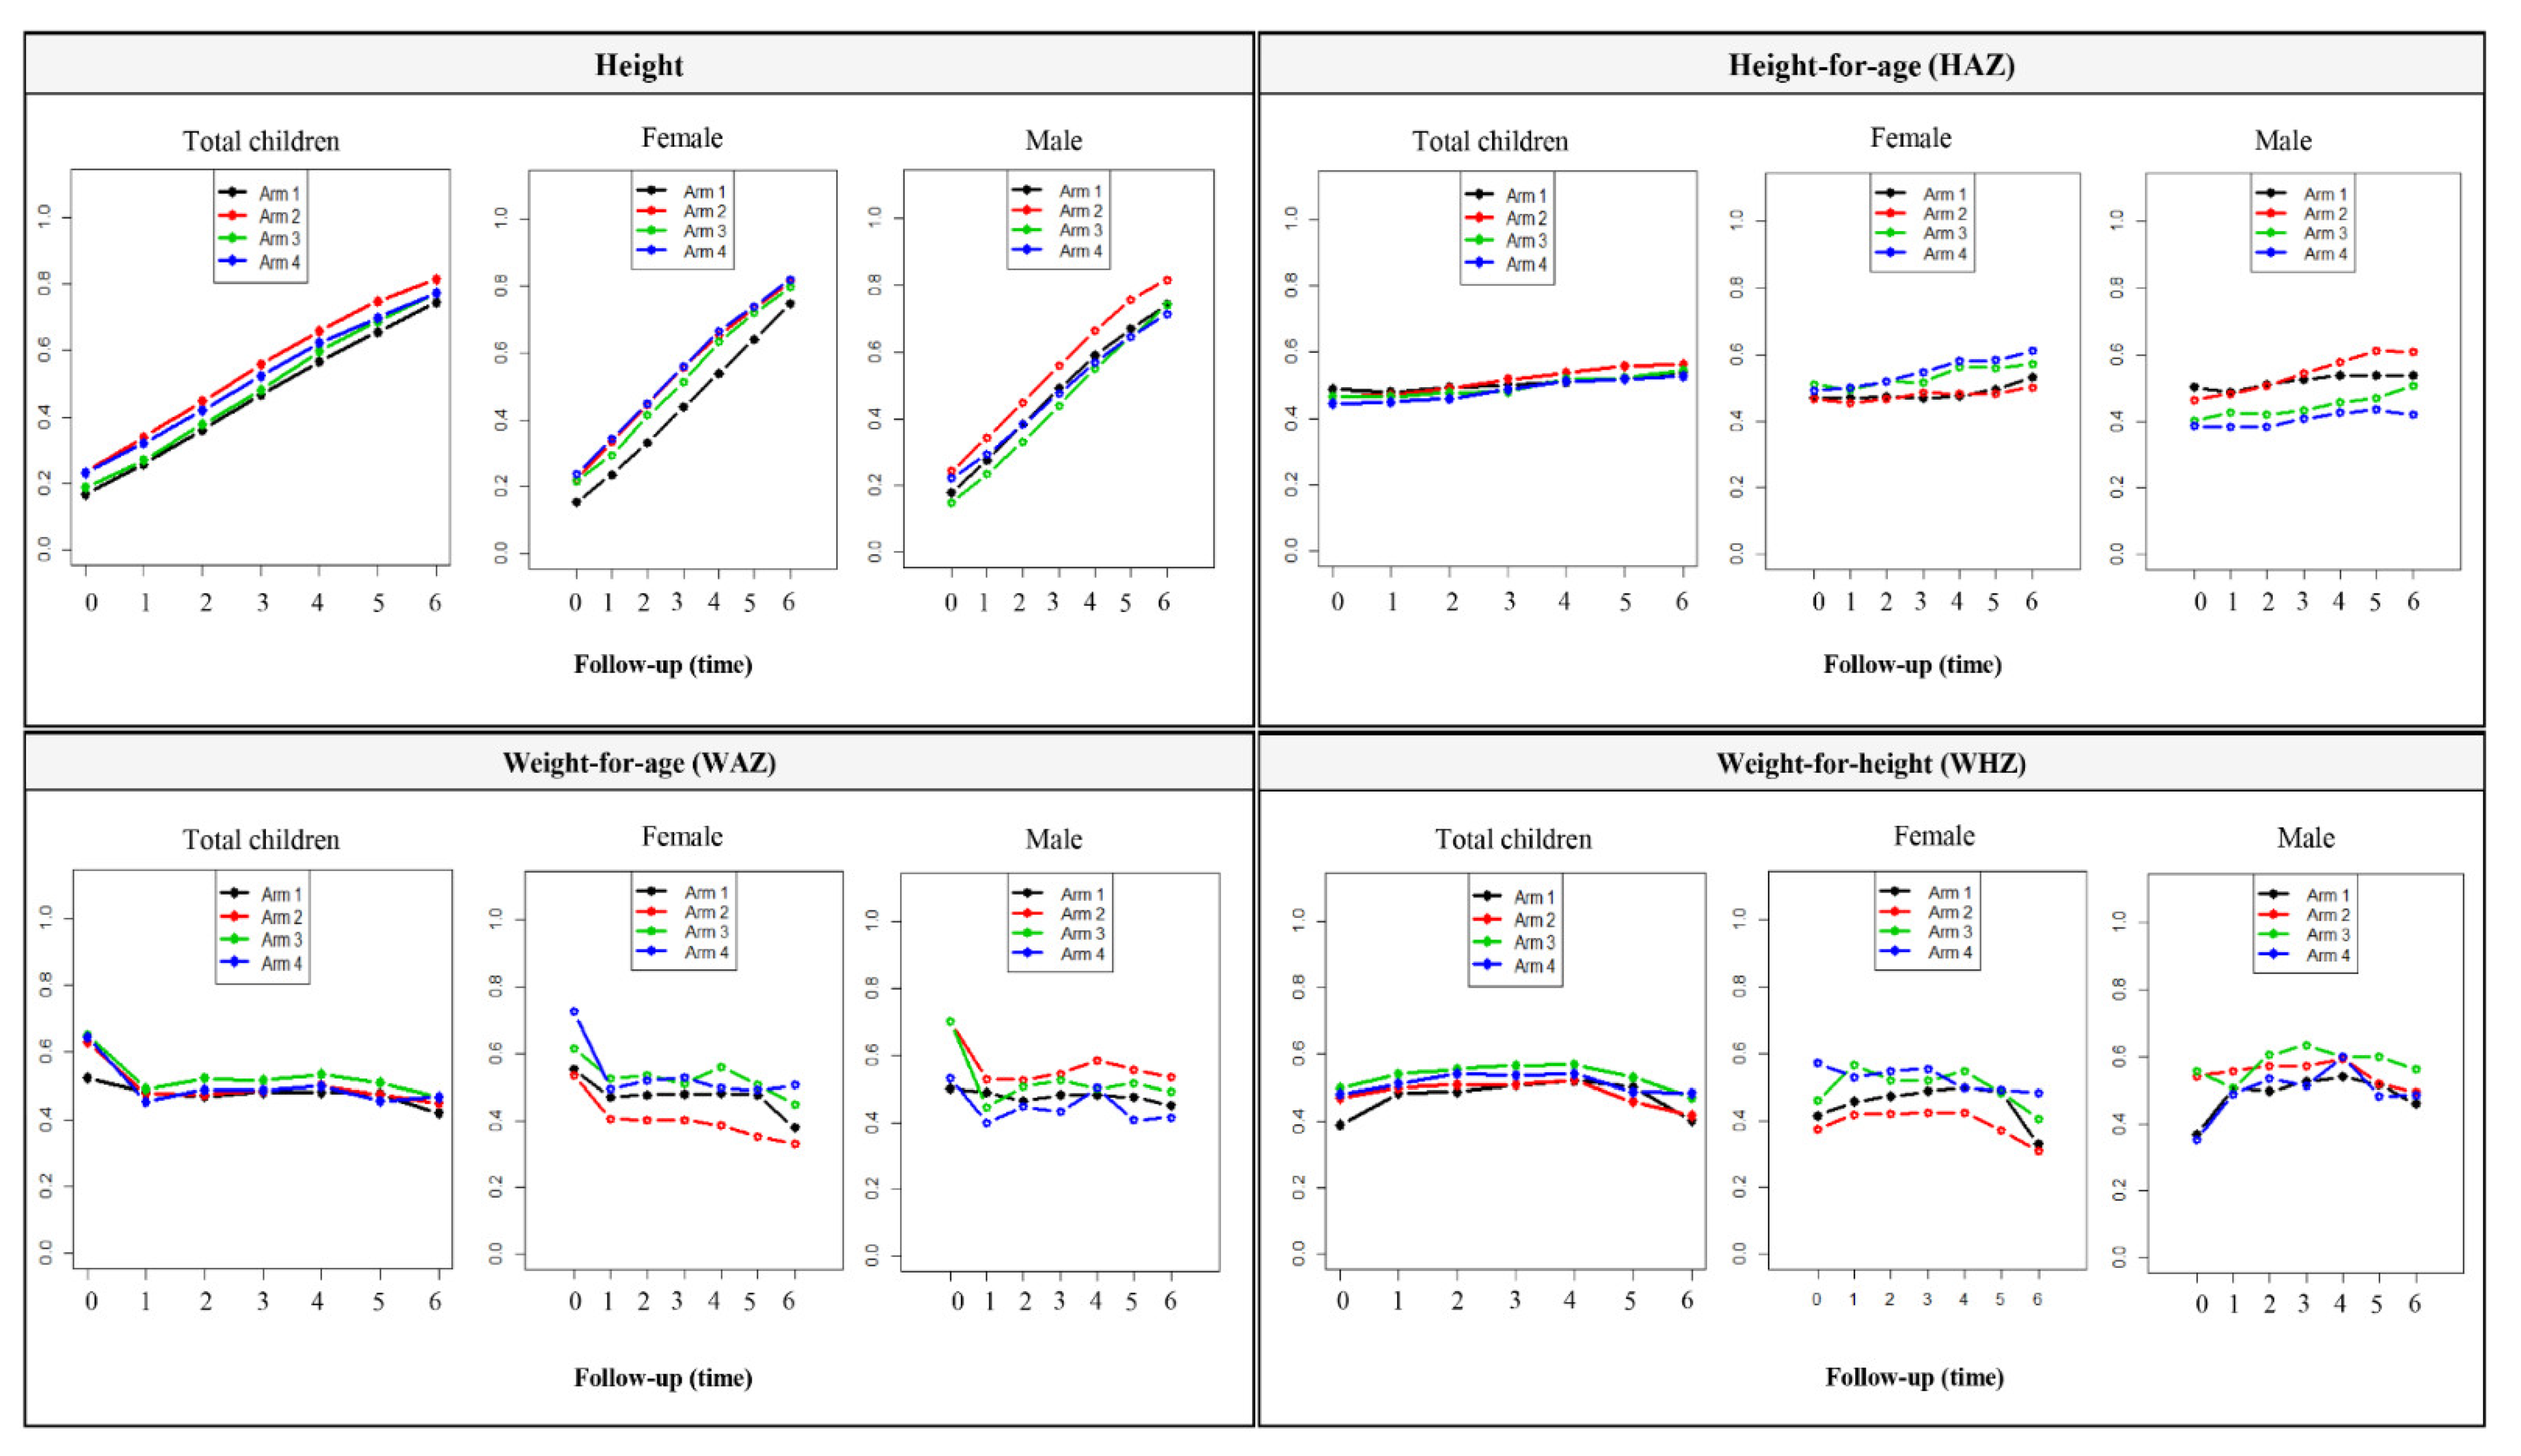
3.3. Effect of Interventions on Nutritional Outcomes
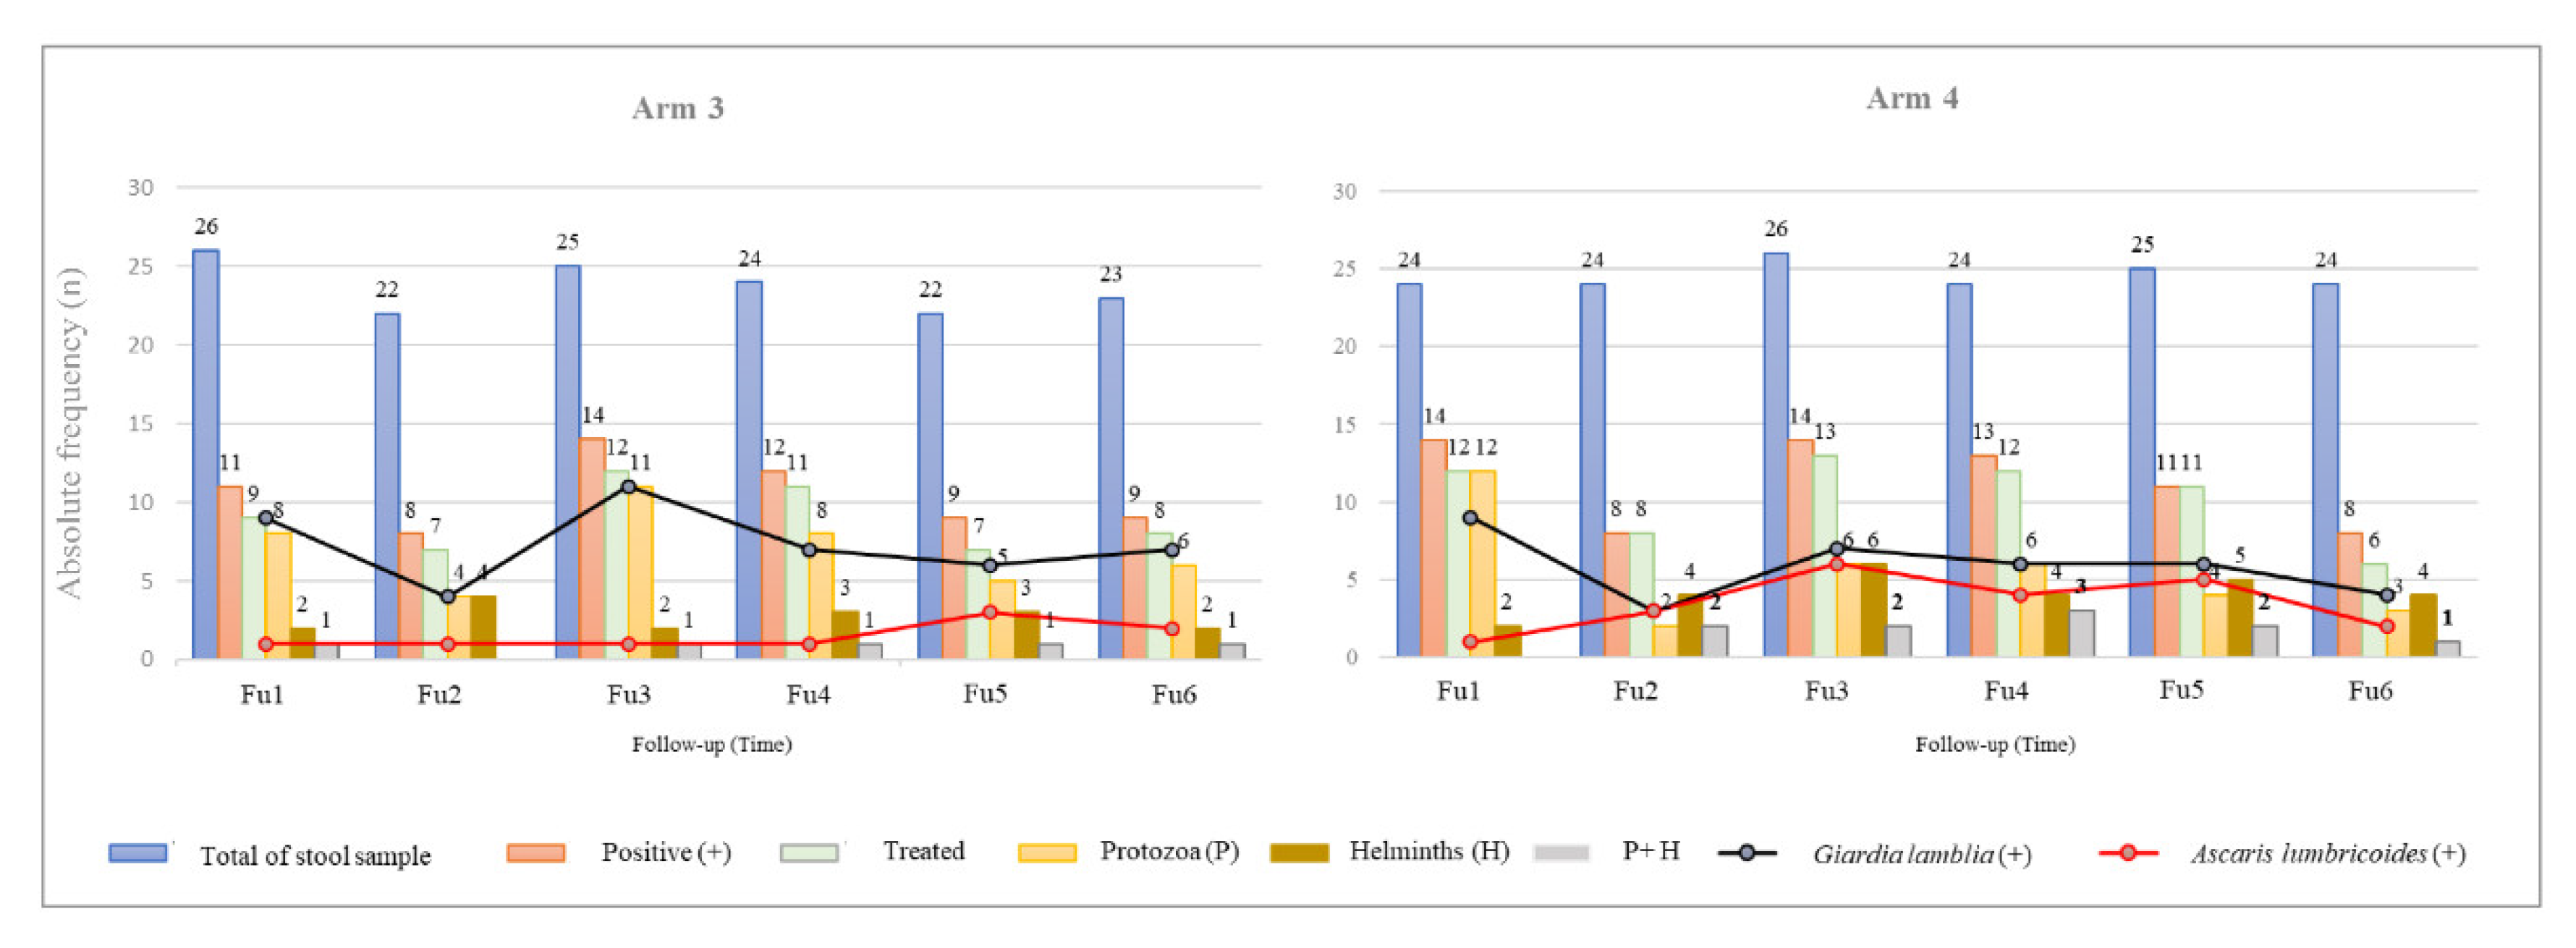
3.4. Effect of Test-and-Treat Intestinal Parasites Approach on Secondary Outcomes
4. Discussion
4.1. Malnutrition Is a Public Health Problem in Bengo
4.2. Interventions and Nutrition Outcomes of Children between 24 and 60 Months of Age
4.3. Blind Deworming Neglects Other Parasitic Infections Contributing to Malnutrition
4.4. Limitations
4.5. Strengths
5. Conclusions
Author Contributions
Funding
Institutional Review Board Statement
Informed Consent Statement
Data Availability Statement
Acknowledgments
Conflicts of Interest
List of Abbreviations
| A1 | Arm 1 |
| A2 | Arm 2 |
| A3 | Arm 3 |
| A4 | Arm 4 |
| ALB | Albendazole |
| Annual-ALB | Single annual dose of albendazole |
| Annual-ALB*individual level | Single annual dose of albendazole provided at individual level in arm 1 |
| Annual-ALB*household level | Single annual dose of albendazole provided at household level in arm 2 |
| CISA | Health Research Centre of Angola |
| CONSORT | Consolidated Standards of Reporting Trials |
| EPG | Eggs per gram |
| Fu | Follow-up |
| Fu1 | Follow-up performed 4 months after participant inclusion |
| Fu2 | Follow-up performed 8 months after participant inclusion |
| Fu3 | Follow-up performed 12 months after participant inclusion |
| Fu4 | Follow-up performed 16 months after participant inclusion |
| Fu5 | Follow-up performed 20 months after participant inclusion |
| Fu6 | Follow-up performed 24 months after participant inclusion |
| g/dL | Grams per decilitre |
| GEE | Generalized estimating equations |
| HAZ | Height-for-age Z-score |
| Hb | Hemoglobin |
| HDSS | Dande Health and Demographic Surveillance System |
| ITT | Intention-to-treat |
| LMICs | Low- and middle-income countries |
| LMM | Linear mixed effect models |
| MCAR | Missing Completely at Random |
| MICS | Multiple Indicator Health Survey |
| MTZ | Metronidazole |
| MUAC | Mid-upper arm circumference |
| MUACZ | Mid-Upper Arm Circumference Z-score |
| nparLD | nonparametric analysis of longitudinal data |
| P.f | Plasmodium falciparum |
| PSAC | pre-school age children |
| P.v | Plasmodium vivax |
| PZQ | Praziquantel |
| SAC | School-age children |
| STH | Soil-transmitted helminths |
| TNZ | Tinidazole |
| WAZ | Weight-for-age Z-score |
| WHO | World Health Organization |
| WHO/UNICEF JMP | World Health Organization/United Nations International Children’s Emergency Fund Joint Monitoring Programme for Water Supply, Sanitation, and Hygiene |
| WHZ | Weight-for-height Z-score |
| 4TT | Four-monthly test-and-treat |
| 4TT*individual | A four-monthly test-and-treat intestinal parasites approach provided at individual level in arm 3 |
| 4TT*household level | A four-monthly test-and-treat intestinal parasites approach provided at household level in arm 4 |
Appendix A. Medication Regimens

| Type of Infection Intestinal Parasites Identified | 12 < Age < 24 Months | Age ≥ 24 Months | |||||||||
|---|---|---|---|---|---|---|---|---|---|---|---|
| ALB | MTZ | TNZ | PZQ | Dosage | Frequency | ALB | TNZ | PZQ | Dosage | Frequency | |
| Monoparasitism (single pathogenic intestinal parasite) | |||||||||||
| Ascaris lumbricoides | x | 200 mg | single dose | x | 400 mg | single dose | |||||
| Ancylostoma sp. | x | 200 mg | single dose | x | 400 mg | single dose | |||||
| Entamoeba histolytica | x | 35–50 mg/kg/d c | 8/8 h, 7d | x | 50 mg/kg b | 3d | |||||
| Giardia lamblia | x | 15 mg/kg/d | 8/8 h, 5d | x | 50 mg/kg b | single dose | |||||
| Hymenolepis nana | x | 25 mg/kg | single dose | x | 25 mg/kg | single dose | |||||
| Strongyloides stercoralis | x | 200 mg | 12/12 h, 7d | x | 400 mg | 12/12 h, 7d | |||||
| Trichuris trichiura | x | 200 mg | 3d | x | 400 mg | 3d | |||||
| Polyparasitism (at least two pathogenic intestinal parasites) | |||||||||||
| G. lamblia + E. histolytica | x | 35–50 mg/kg/d c | 8/8h, 7d | x | 50 mg/kg b | 3d | |||||
| G. lamblia + A. lumbricoides | x | 200 mg | 5d | x | 400 mg | 5d | |||||
| G. lamblia + T. trichiura | x | 200 mg | 5d | x | 400 mg | 5d | |||||
| G. lamblia + A. lumbricoides + T.trichiura | x | 200 mg | 5d | x | 400 mg | 5d | |||||
| G. lamblia + S. stercoralis | x | 200 mg | 12/12 h, 7d | x | 400 mg | 12/12 h, 7d | |||||
| G. lamblia + H. nana | x | 25 mg/kg a | single dose | x | 25 mg/kg | single dose | |||||
| x | 15 mg/kg/d | 8/8 h, 5d | x | 50 mg/kg b | single dose | ||||||
| A. lumbricoides + S. stercoralis | x | 200 mg | 12/12, 7d | x | 400 mg | 12/12, 7d | |||||
| T. trichiura + H. nana | x | 25 mg/kg a | single dose | x | 25 mg/kg | single dose | |||||
| x | 200 mg | 3d | x | 200 mg | 3d | ||||||
Appendix B. Sample Size Calculation


Appendix C. Losses to Follow-Up
- Arm 1:
- ✓
- 96.6% (28/29) of children received a single dose of ALB at Fu1;
- ✓
- 85.7% (24/28) of children received a single dose of ALB at Fu4
- ✓
- Of the total included, 82.8% (24/29) received complete intervention in both Fu1 and Fu4.
- Arm 2:
- ✓
- 90.3% (28/31) of children and 83.3% (125/150) of household members received a single dose of ALB at Fu1; Coverage of ALB by household was ≥80% in 25 cases.
- ✓
- 93.1% (27/29) of children and 80.9% (123/152) of household members received a single dose of ALB at Fu4; Coverage of ALB by household was ≥80% in 23 cases.
- ✓
- 71.0% (22/31) of children received ALB in both Fu1 and Fu4 with a household coverage ≥80%.
- Arm 3:
- ✓
- The percentage of children delivering a stool sample and receiving appropriate treatment by follow-up was: 77.4% (24/31) in Fu1; 67.7% (21/31) in Fu2; 74.2% (23/31) in Fu3; 74.2% (23/31) in Fu4; 64.5% (20/31) in Fu5, and 71.0% (22/31) in Fu6.
- ✓
- However, only 48.4% (15/31) of children delivered a stool sample and received appropriate treatment in all follow-ups.
- Arm 4:
- ✓
- The percentage of children delivering a stool sample and receiving appropriate treatment by follow-up was: 73.3% (22/30) in Fu1; 80.0% (24/30) in Fu2; 83.3% (25/30) in Fu3; 76.7% (23/30) in Fu4; 83.3% (25/30) in Fu5; and 73.3% (22/30) in Fu6.
- ✓
- The percentage of household members delivering the requested stool sample during the follow-up period ranged between 63.0% (92/146) and 74.6% (94/126).
- ✓
- At the household level, only nine children (30%) and at least 50% of their household members were able to deliver a stool sample and receive appropriate treatment in the six follow-ups.
Appendix D. Missing Data
| Follow-Up (2 Years) | Arm 1 (n = 29) | Arm 2 (n = 31) | Arm 3 (n = 31) | Arm 4 (n = 30) | Total (n = 121) |
|---|---|---|---|---|---|
| n (%) | n (%) | n (%) | n (%) | n (%) | |
| No missing values | 24 (82.8) | 23 (74.2) | 23 (74.2) | 26 (86.7) | 96 (79.3) |
| 1 missing values | 2 (6.9) | 4 (12.9) | 3 (9.7) | 1 (3.3) | 10 (8.3) |
| 2 missing values | 1 (3.4) | 2 (6.5) | 1 (3.2) | 2 (6.7) | 6 (5.0) |
| 3 missing values | 1 (3.4) | 0 (0.0) | 0 (0.0) | 0 (0.0) | 1 (0.8) |
| 6 missing values | 1(3.4) | 2 (6.5) | 4 (12.9) | 1 (3.3) | 8 (6.6) |
Appendix E. Outcomes during the Follow-Up and by Arms
| Outcome | Follow-Up | A1 (n = 29) | A2 (n = 31) | A3 (n = 31) | A4 (n = 30) | p-Value |
|---|---|---|---|---|---|---|
| Mean ± SD | Mean ± SD | Mean ± SD | Mean ± SD | |||
| Height | Fu1 | 86.61 ± 5.27 | 88.70 ± 5.84 | 86.92 ± 5.29 | 88.02 ± 6.68 | 0.469 |
| Fu2 | 89.38 ± 5.43 | 91.45 ± 5.82 | 89.90 ± 4.96 | 90.67 ± 6.65 | 0.528 | |
| Fu3 | 91.95 ± 5.60 | 94.22 ± 5.50 | 92.40 ± 5.21 | 93.39 ± 6.62 | 0.420 | |
| Fu4 | 94.48 ± 5.85 | 96.71 ± 5.35 | 95.18 ± 4.86 | 96.01 ± 6.57 | 0.432 * | |
| Fu5 | 96.83 ± 5.78 | 99.23 ± 5.37 | 97.47 ± 5.01 | 98.30 ± 6.82 | 0.408 | |
| Fu6 | 99.29 ± 5.90 | 101.35 ± 5.33 | 99.91 ± 5.09 | 100.51 ± 6.46 | 0.548 | |
| Dif fu6-fu1 # | 12.69 ± 2.01 | 12.65 ± 1.83 | 12.99 ± 1.72 | 12.49 ± 1.65 | 0.745 | |
| Weight | Fu1 | 11.83 ± 1.72 | 12.39 ± 1.86 | 12.08 ± 1.48 | 12.25 ± 1.91 | 0.572 * |
| Fu2 | 12.49 ± 1.86 | 13.12 ± 1.83 | 12.88 ± 1.55 | 13.06 ± 1.94 | 0.615 * | |
| Fu3 | 13.20 ± 1.78 | 13.82 ± 1.84 | 13.56 ± 1.70 | 13.66 ± 2.03 | 0.644 * | |
| Fu4 | 13.85 ± 1.91 | 14.45 ± 1.84 | 14.25 ± 1.65 | 14.37 ± 2.01 | 0.580 * | |
| Fu5 | 14.44 ± 2.13 | 14.87 ± 1.82 | 14.75 ± 1.67 | 14.79 ± 2.20 | 0.798 * | |
| Fu6 | 14.67 ± 2.27 | 15.32 ± 1.92 | 15.13 ± 1.77 | 15.36 ± 2.29 | 0.618 * | |
| Dif fu6-fu1 # | 2.83 ± 0.95 | 2.93 ± 0.89 | 3.05 ± 0.76 | 3.11 ± 0.73 | 0.579 | |
| HAZ | Fu1 | −1.33 ± 1.18 | −1.29 ± 1.21 | −1.33 ± 1.16 | −1.42 ± 1.19 | 0.981 |
| Fu2 | −1.31 ± 1.19 | −1.23 ± 1.24 | −1.25 ± 1.04 | −1.38 ± 1.19 | 0.962 | |
| Fu3 | −1.28 ± 1.21 | −1.13 ± 1.06 | −1.24 ± 1.08 | −1.30 ± 1.15 | 0.941 | |
| Fu4 | −1.24 ± 1.22 | −1.08 ± 1.00 | −1.12 ± 0.99 | −1.21 ± 1.12 | 0.937 | |
| Fu5 | −1.19 ± 1.14 | −0.99 ± 1.02 | −1.11 ± 1.00 | −1.19 ± 1.15 | 0.874 | |
| Fu6 | −1.12 ± 1.14 | −0.99 ± 0.98 | −1.05 ± 1.02 | −1.15 ± 1.07 | 0.924 | |
| Dif fu6-fu1 # | 0.21 ± 0.50 | 0.30 ± 0.51 | 0.28 ± 0.38 | 0.26 ± 0.36 | 0.849 | |
| WHZ | Fu1 | −0.20 ± 1.09 | −0.16 ± 1.14 | 0.03 ± 0.75 | −0.10 ± 0.89 | 0.793 |
| Fu2 | −0.21 ± 1.04 | −0.08 ± 0.96 | 0.10 ± 0.88 | 0.05 ± 1.01 | 0.608 | |
| Fu3 | −0.12 ± 0.96 | −0.07 ± 1.03 | 0.14 ± 0.97 | −0.04 ± 0.98 | 0.754 | |
| Fu4 | −0.11 ± 0.90 | −0.07 ± 1.00 | 0.11 ± 0.94 | 0.01 ± 1.05 | 0.829 | |
| Fu5 | −0.15 ± 0.94 | −0.27 ± 0.76 | 0.03 ± 0.86 | −0.19 ± 0.91 | 0.579 | |
| Fu6 | −0.51 ± 1.06 | −0.39 ± 0.83 | −0.20 ± 0.83 | −0.23 ± 0.98 | 0.542 | |
| Dif fu6-fu1 # | −0.31 ± 0.79 | −0.22 ± 0.86 | −0.23 ± 0.58 | −0.13 ± 0.55 | 0.824 | |
| WAZ | Fu1 | −0.86 ± 1.06 | −0.81 ± 1.10 | −0.69 ± 0.88 | −0.84 ± 0.92 | 0.909 |
| Fu2 | −0.87 ± 1.06 | −0.75 ± 0.96 | −0.62 ± 0.86 | −0.73 ± 0.92 | 0.792 | |
| Fu3 | −0.80 ± 0.97 | −0.69 ± 0.90 | −0.60 ± 0.91 | −0.76 ± 0.93 | 0.839 | |
| Fu4 | −0.79 ± 0.95 | −0.68 ± 0.89 | −0.57 ± 0.85 | −0.70 ± 0.87 | 0.815 | |
| Fu5 | −0.80 ± 1.03 | −0.77 ± 0.84 | −0.64 ± 0.78 | −0.82 ± 0.88 | 0.845 | |
| Fu6 | −1.00 ± 1.03 | −0.84 ± 0.86 | −0.76 ± 0.79 | −0.84 ± 0.93 | 0.752 | |
| Dif fu6-fu1 # | −0.15 ± −0.55 | −0.03 ± 0.64 | −0.07 ± 0.44 | 0.01 ± 0.31 | 0.655 | |
| MUACZ | Fu1 | −0.92 ± 1.11 | −0.76 ± 1.10 | −0.62 ± 0.65 | −0.59 ± 0.82 | 0.508 |
| Fu2 | −0.91 ± 0.81 | −0.71 ± 0.94 | −0.60 ± 0.61 | −0.71 ± 0.83 | 0.518 | |
| Fu3 | −0.95 ± 0.85 | −0.78 ± 0.92 | −0.81 ± 0.74 | −0.66 ± 0.73 | 0.591 | |
| Fu4 | −0.85 ± 0.81 | −0.72 ± 1.02 | −0.67 ± 0.59 | −0.64 ± 0.67 | 0.733 | |
| Fu5 | −0.87 ± 0.92 | −0.80 ± 0.88 | −0.64 ± 0.72 | −0.71 ± 0.78 | 0.736 | |
| Fu6 | −0.93 ± 0.90 | −0.91 ± 0.75 | −0.88 ± 0.68 | −0.85 ± 0.68 | 0.977 | |
| Dif fu6-fu1 # | −0.01 ±0.75 | −0.15 ± 0.89 | −0.26 ± 0.67 | −0.26 ± 0.52 | 0.496 |
| Variables | Follow-Up | A1 | A2 | A3 | A4 | p-Value | |
|---|---|---|---|---|---|---|---|
| (n = 29) | (n = 31) | (n = 31) | (n = 30) | ||||
| n (%) | n (%) | n (%) | n (%) | ||||
| Stunting | Moderate-to-severe (HAZ < −2) | Fu1 | 7 (24.1) | 11 (35.5) | 8 (25.8) | 11 (36.7) | 0.630 |
| Fu2 | 7 (24.1) | 10 (32.3) | 7 (22.6) | 10 (33.3) | 0.727 | ||
| Fu3 | 8 (27.6) | 6 (19.4) | 9 (29.0) | 11 (36.7) | 0.526 | ||
| Fu4 | 7 (24.1) | 7 (22.6) | 7 (22.6) | 10 (33.3) | 0.741 | ||
| Fu5 | 7 (24.1) | 6 (19.4) | 8 (25.8) | 9 (30.0) | 0.807 | ||
| Fu6 | 6 (20.7) | 6 (19.4) | 7 (22.6) | 8 (26.7) | 0.914 | ||
| p-value (Fu6 vs. Fu1) § | 1.000 | 0.063 | 1.000 | 0.375 | |||
| Dif (%) Fu6—Fu1 # | −3.4 | −16.1 | −3.2 | −10.0 | |||
| Mild-to-severe (HAZ < −1) | Fu1 | 21 (72.4) | 21 (67.7) | 21 (67.7) | 20 (66.7) | 0.966 | |
| Fu2 | 15 (51.7) | 20 (64.5) | 21 (67.7) | 20 (66.7) | 0.570 | ||
| Fu3 | 15 (51.7) | 17 (54.8) | 20 (64.5) | 18 (60.0) | 0.762 | ||
| Fu4 | 15 (51.7) | 16 (51.6) | 19 (61.3) | 16 (53.3) | 0.865 | ||
| Fu5 | 15 (51.7) | 17 (54.8) | 17 (54.8) | 14 (46.7) | 0.918 | ||
| Fu6 | 13 (44.8) | 15 (48.4) | 17 (54.8) | 14 (46.7) | 0.891 | ||
| p-value (Fu6 vs. Fu1) § | 0.008 * | 0.031 * | 0.125 | 0.031 * | |||
| Dif (%) Fu6—Fu1 # | −27.6 | −19.3 | −12.9 | −20.0 | |||
| Wasting | Moderate-to-severe (WHZ < −2) | Fu1 | 1 (3.4) | 2 (6.5) | 0 (0.0) | 1 (3.3) | 0.652 ¶ |
| Fu2 | 1 (3.4) | 0 (0.0) | 0 (0.0) | 0 (0.0) | 0.240 ¶ | ||
| Fu3 | 1 (3.4) | 1 (3.2) | 1 (3.2) | 2 (6.7) | 0.874 ¶ | ||
| Fu4 | 1 (3.4) | 1 (3.2) | 1 (3.2) | 1 (3.3) | 1.000 ¶ | ||
| Fu5 | 2 (6.9) | 2 (6.5) | 0 (0.0) | 0 (0.0) | 0.257 | ||
| Fu6 | 2 (6.9) | 0 (0.0) | 0 (0.0) | 2 (6.7) | 0.213 | ||
| p-value (Fu6 vs. Fu1) § | 1.000 | 1.000 | |||||
| Dif (%) Fu6—Fu1 # | 3.5 | −6.5 | 0.0 | 3.4 | |||
| Mild-to-severe (WHZ < −1) | Fu1 | 8 (27.6) | 7 (22.6) | 1 (3.2) | 4 (13.3) | 0.038 ¶ | |
| Fu2 | 7 (24.1) | 3 (9.7) | 3 (9.7) | 5 (16.7) | 0.359 ¶ | ||
| Fu3 | 7 (24.1) | 4 (12.9) | 2 (6.5) | 4 (13.3) | 0.282 ¶ | ||
| Fu4 | 5 (17.2) | 4 (12.9) | 3 (9.7) | 6 (20.0) | 0.668 ¶ | ||
| Fu5 | 6 (20.7) | 4 (12.9) | 2 (6.5) | 8 (26.7) | 0.157 ¶ | ||
| Fu6 | 11 (37.9) | 7 (22.6) | 3 (9.7) | 6 (20.0) | 0.079 ¶ | ||
| p-value (Fu6 vs. Fu1) § | 0.250 | 1.000 | 0.500 | 0.500 | |||
| Dif (%) Fu6—Fu1 # | 10.3 | 0.0 | 6.5 | 6.7 | |||
| Underweight | Moderate-to-severe (WAZ < −2) | Fu1 | 4 (13.8) | 4 (12.9) | 1 (3.2) | 3 (10.0) | 0.474 |
| Fu2 | 4 (13.8) | 3 (9.7) | 2 (6.5) | 3 (10.0) | 0.786 | ||
| Fu3 | 4 (13.8) | 1 (3.2) | 2 (6.5) | 3 (10.0) | 0.415 | ||
| Fu4 | 2 (6.9) | 3 (9.7) | 0 (0.0) | 3 (10.0) | 0.315 | ||
| Fu5 | 3 (10.3) | 2 (6.5) | 0 (0.0) | 2 (6.7) | 0.344 | ||
| Fu6 | 5 (17.2) | 2 (6.5) | 1 (3.2) | 3 (10.0) | 0.256 | ||
| p-value (Fu6 vs. Fu1) § | 1.000 | 1.000 | 1.000 | 1.000 | |||
| Dif (%) Fu6—Fu1 # | 3.4 | −6.4 | 0.0 | 0.0 | |||
| Mild-to-severe (WAZ < −1) | Fu1 | 10 (34.5) | 13 (41.9) | 11 (35.5) | 14 (46.7) | 0.757 | |
| Fu2 | 10 (34.5) | 12 (38.7) | 10 (32.3) | 10 (33.3) | 0.962 | ||
| Fu3 | 11 (37.9) | 12 (38.7) | 11 (35.5) | 11 (36.7) | 1.000 | ||
| Fu4 | 11 (37.9) | 10 (32.3) | 10 (32.3) | 11 (36.7) | 0.951 | ||
| Fu5 | 11 (37.9) | 15 (48.4) | 11 (35.5) | 13 (43.3) | 0.736 | ||
| Fu6 | 14 (48.3) | 14 (45.2) | 12 (38.7) | 13 (43.3) | 0.903 | ||
| p-value (Fu6 vs. Fu1) § | 0.125 | 1.000 | 1.000 | 1.000 | |||
| Dif (%) Fu6—Fu1 # | 13.8 | 3.3 | 3.2 | −3.4 | |||
| Gender | Variable | Follow-Up | A1 (n = 29) | A2 (n = 31) | A3 (n = 31) | A4 (n = 30) | p-Value |
|---|---|---|---|---|---|---|---|
| n (%) | n (%) | n (%) | n (%) | ||||
| Female (N = 61) | Moderate-to-severe stunting (HAZ < −2) | Fu1 | 3 (23.1) | 6 (46.2) | 4 (22.2) | 5 (29.4) | 0.540 |
| Fu2 | 3 (23.1) | 6 (46.2) | 3 (16.7) | 3 (17.6) | 0.266 | ||
| Fu3 | 4 (30.8) | 3 (23.1) | 4 (22.2) | 4 (23.5) | 0.954 | ||
| Fu4 | 3 (23.1) | 4 (30.8) | 2 (11.1) | 3 (17.6) | 0.597 | ||
| Fu5 | 3 (23.1) | 3 (23.1) | 3 (16.7) | 3 (17.6) | 0.947 | ||
| Fu6 | 2 (15.4) | 3 (23.1) | 3 (16.7) | 2 (11.8) | 0.934 | ||
| p-value * (Fu1 vs. Fu6) | 1.000 | 0.250 | 1.000 | 0.250 | |||
| Mild-to-severe stunting (HAZ < −1) | Fu1 | 10 (76.9) | 9 (69.2) | 12 (66.7) | 11 (64.7) | 0.929 | |
| Fu2 | 8 (61.5) | 9 (69.2) | 11 (61.1) | 11 (64.7) | 0.983 | ||
| Fu3 | 9 (69.2) | 8 (61.5) | 11 (61.1) | 9 (52.9) | 0.847 | ||
| Fu4 | 9 (69.2) | 9 (69.2) | 11 (61.1) | 7 (41.2) | 0.357 | ||
| Fu5 | 9 (69.2) | 9 (69.2) | 10 (55.6) | 7 (41.2) | 0.359 | ||
| Fu6 | 7 (53.8) | 8 (61.5) | 10 (55.6) | 6 (35.3) | 0.532 | ||
| p-value * (Fu1 vs. Fu6) | 0.250 | 1.000 | 0.500 | 0.063 | |||
| Male (N = 60) | Moderate-to-severe stunting (HAZ < −2) | Fu1 | 4 (25.0) | 5 (27.8) | 4 (30.8) | 6 (46.2) | 0.283 |
| Fu2 | 4 (25.0) | 4 (22.2) | 4 (30.8) | 7 (53.8) | 0.160 | ||
| Fu3 | 4 (25.0) | 3 (16.7) | 5 (38.5) | 7 (53.8) | 0.160 | ||
| Fu4 | 4 (25.0) | 3 (16.7) | 5 (38.5) | 7 (53.8) | 0.160 | ||
| Fu5 | 4 (25.0) | 3 (16.7) | 5 (38.5) | 6 (46.2) | 0.299 | ||
| Fu6 | 4 (25.0) | 3 (16.7) | 4 (30.8) | 6 (46.2) | 0.359 | ||
| p-value * (Fu1 vs. Fu6) | 1.000 | 0.500 | 1.000 | 1.000 | |||
| Mild-to-severe stunting (HAZ < −1) | Fu1 | 11 (68.8) | 12 (66.7) | 9 (69.2) | 9 (69-2) | 1.000 | |
| Fu2 | 7 (43.8) | 11 (61.1) | 10 (76.9) | 9 (69.2) | 0.315 | ||
| Fu3 | 6 (37.5) | 9 (50.0) | 9 (69.2) | 9 (69.2) | 0.261 | ||
| Fu4 | 6 (37.5) | 7 (38.9) | 8 (61.5) | 9 (69.2) | 0.219 | ||
| Fu5 | 6 (37.5) | 8 (44.4) | 7 (53.8) | 7 (53.8) | 0.757 | ||
| Fu6 | 6 (37.5) | 7 (38.9) | 7 (53.8) | 8 (61.5) | 0.515 | ||
| p-value * (Fu1 vs. Fu6) | 0.063 | 0.063 | 0.500 | 1.000 |
Appendix F. Description of Parasitic Infection Rates during the Follow-Up Period in Children Allocated to A3 and A4
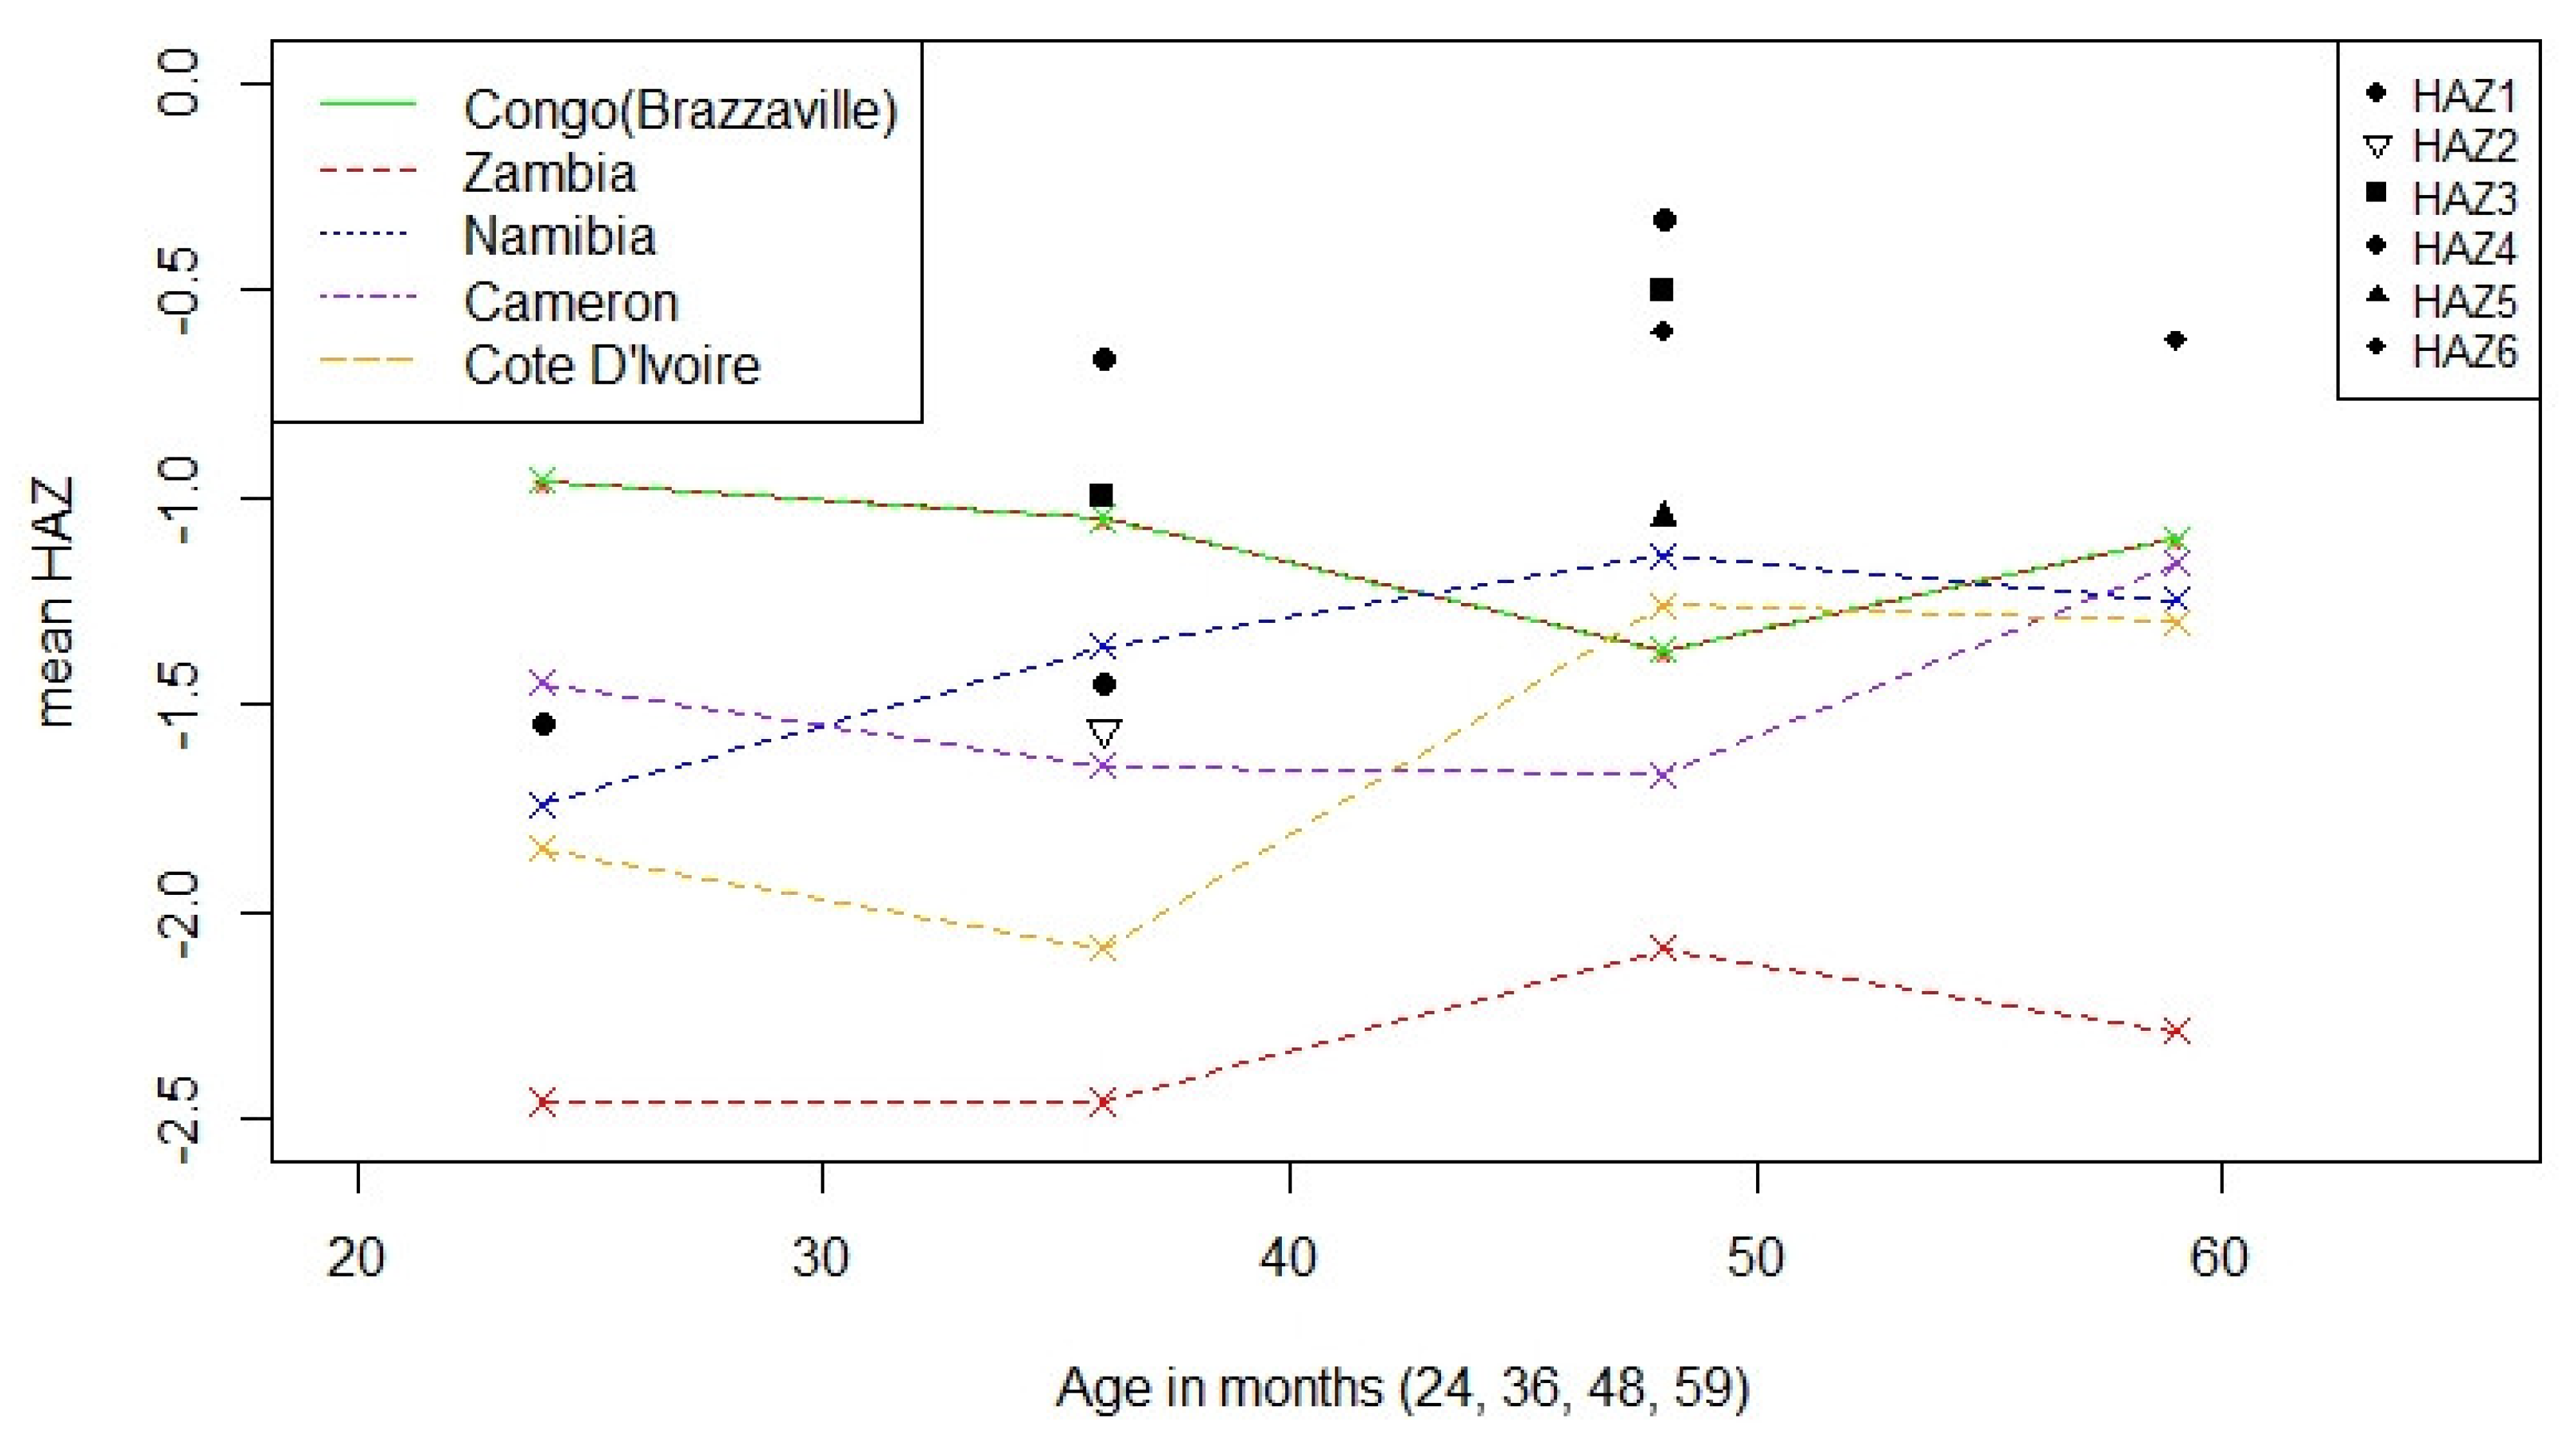
Appendix G. Mean Height-for-Age Scores (HAZ) in Children between 24 and 60 Months Assessed in This Study in Comparison with Mean HAZ Reported in Other African Countries

References
- Black, R.E.; Victora, C.G.; Walker, S.P.; Bhutta, Z.A.; Christian, P.; de Onis, M.; Ezzati, M.; Grantham-McGregor, S.; Katz, J.; Martorell, R.; et al. Maternal and child undernutrition and overweight in low-income and middle-income countries. Lancet 2013, 382, 427–451. [Google Scholar] [CrossRef]
- Black, R.E.; Allen, L.H.; Bhutta, Z.A.; Caulfield, L.E.; de Onis, M.; Ezzati, M.; Mathers, C.; Rivera, J. Maternal and child undernutrition: Global and regional exposures and health consequences. Lancet 2008, 371, 243–260. [Google Scholar] [CrossRef]
- United Nations Children’s Fund (UNICEF); World Health Organization (WHO); The World Bank. Levels and Trends in Child Malnutrition: Key Findings of the 2019 Edition of the Joint Child; Malnutrition Estimates; WHO: Geneva, Switzerland, 2019.
- Victora, C.G.; de Onis, M.; Hallal, P.C.; Blossner, M.; Shrimpton, R. Worldwide timing of growth faltering: Revisiting implications for interventions. Pediatrics 2010, 125, e473–e480. [Google Scholar] [CrossRef]
- Local Burden of Disease Child Growth Failure Collaborators. Mapping child growth failure across low- and middle-income countries. Nature 2020, 577, 231–234. [Google Scholar] [CrossRef]
- Alum, A.; Rubino, J.R.; Ijaz, M.K. The global war against intestinal parasites—Should we use a holistic approach? Int. J. Infect. Dis. 2010, 14, e732–e738. [Google Scholar] [CrossRef] [PubMed]
- World Health Organization (WHO). Guideline: Preventive Chemotherapy to Control Soil-Transmitted Helminth Infections in At-Risk Population Groups; WHO: Geneva, Switzerland, 2017. [Google Scholar]
- Rogawski, E.T.; Bartelt, L.A.; Platts-Mills, J.A.; Seidman, J.C.; Samie, A.; Havt, A.; Babji, S.; Trigoso, D.R.; Qureshi, S.; Shakoor, S.; et al. Determinants and Impact of Giardia Infection in the First 2 Years of Life in the MAL-ED Birth Cohort. J. Pediatric Infect Dis Soc 2017, 6, 153–160. [Google Scholar] [CrossRef]
- Squire, S.A.; Ryan, U. Cryptosporidium and Giardia in Africa: Current and future challenges. Parasit Vectors 2017, 10, 195. [Google Scholar] [CrossRef]
- Agadjanian, V.; Prata, N. Civil war and child health: Regional and ethnic dimensions of child immunization and malnutrition in Angola. Soc. Sci. Med. 2003, 56, 2515–2527. [Google Scholar] [CrossRef]
- República de Angola and Ministério da Saúde (MINSA). Plano Nacional de Desenvolvimento Sanitário 2012–2025. Mais e Melhor Saúde; MINSA: Luanda, Angola, 2012; p. 102.
- Instituto Nacional de Estatística (INE). Inquérito de Indicadores Múltiplos e de Saúde em Angola 2015–2016; INE: Luanda, Angola, 2017. [Google Scholar]
- Rosario, E.V.; Costa, D.; Timoteo, L.; Rodrigues, A.A.; Varanda, J.; Nery, S.V.; Brito, M. Main causes of death in Dande, Angola: Results from Verbal Autopsies of deaths occurring during 2009–2012. BMC Public Health 2016, 16, 719. [Google Scholar] [CrossRef]
- Sousa-Figueiredo, J.C.; Gamboa, D.; Pedro, J.M.; Fancony, C.; Langa, A.J.; Magalhaes, R.J.; Stothard, J.R.; Nery, S.V. Epidemiology of malaria, schistosomiasis, geohelminths, anemia and malnutrition in the context of a demographic surveillance system in northern Angola. PLoS ONE 2012, 7, e33189. [Google Scholar] [CrossRef]
- Gasparinho, C.; Mirante, M.C.; Centeno-Lima, S.; Istrate, C.; Mayer, A.C.; Tavira, L.; Nery, S.V.; Brito, M. Etiology of Diarrhea in Children Younger Than 5 Years Attending the Bengo General Hospital in Angola. Pediatr. Infect. Dis. J. 2016, 35, e28–e34. [Google Scholar] [CrossRef] [PubMed]
- República de Angola and Ministério da Saúde (MINSA); Direcção Nacional de Saúde Pública; Departamento de Controlo de Doenças; Secção Nacional de Controlo das Doenças Tropicais Negligenciadas. Plano Estratégico Nacional de Doenças Tropicais Negligenciadas 2017–2021; MINSA: Luanda, Angola, 2017.
- Croke, K.; Hicks, J.H.; Hsu, E.; Kremer, M.; Miguel, E. Should the WHO withdraw support for mass deworming? PLoS Negl. Trop. Dis. 2017, 11, e0005481. [Google Scholar] [CrossRef] [PubMed]
- Taylor-Robinson, D.C.; Maayan, N.; Soares-Weiser, K.; Donegan, S.; Garner, P. Deworming drugs for soil-transmitted intestinal worms in children: Effects on nutritional indicators, haemoglobin, and school performance. Cochrane Database Syst. Rev. 2012, 11. [Google Scholar] [CrossRef]
- Welch, V.A.; Ghogomu, E.; Hossain, A.; Awasthi, S.; Bhutta, Z.A.; Cumberbatch, C.; Fletcher, R.; McGowan, J.; Krishnaratne, S.; Kristjansson, E.; et al. Mass deworming to improve developmental health and wellbeing of children in low-income and middle-income countries: A systematic review and network meta-analysis. Lancet Glob. Health 2017, 5, e40–e50. [Google Scholar] [CrossRef]
- Taylor-Robinson, D.C.; Maayan, N.; Donegan, S.; Chaplin, M.; Garner, P. Public health deworming programmes for soil-transmitted helminths in children living in endemic areas. Cochrane Database Syst. Rev. 2019, 9, CD000371. [Google Scholar] [CrossRef]
- Awasthi, S.; Peto, R.; Read, S.; Richards, S.M.; Pande, V.; Bundy, D.; DEVTA (Deworming and Enhanced Vitamin A) team. Population deworming every 6 months with albendazole in 1 million pre-school children in North India: DEVTA, a cluster-randomised trial. Lancet 2013, 381, 1478–1486. [Google Scholar] [CrossRef]
- Lo, N.C.; Snyder, J.; Addiss, D.G.; Heft-Neal, S.; Andrews, J.R.; Bendavid, E. Deworming in pre-school age children: A global empirical analysis of health outcomes. PLoS Negl. Trop. Dis. 2018, 12, e0006500. [Google Scholar] [CrossRef] [PubMed]
- Andrews, J.R.; Bogoch, I.I.; Utzinger, J. The benefits of mass deworming on health outcomes: New evidence synthesis, the debate persists. Lancet Glob. Health 2017, 5, e4–e5. [Google Scholar] [CrossRef]
- Rosario, E.V.N.; Costa, D.; Francisco, D.; Brito, M. HDSS Profile: The Dande Health and Demographic Surveillance System (Dande HDSS, Angola). Int. J. Epidemiol. 2017. [Google Scholar] [CrossRef]
- World Health Organization (WHO). WHO Child Growth Standards: Length/Height for Age, Weight-for-Age, Weight-for-Length, Weight-for-Height and Body Mass Index-for-Age, Methods and Development; World Health Organization: Geneva, Switzerland, 2006. [Google Scholar]
- World Health Organization (WHO). Nutrition Landscape Information System (NLIS) Country Profile Indicators: Interpretation Guide; WHO: Geneva, Switzerland, 2010. [Google Scholar]
- World Health Organization (WHO); United Nations Children’s Fund (UNICEF). WHO Child Growth Standards and the Identification of Severe Acute Malnutrition in Infants and Children; Joint Statement by the World Health Organization and the United Nations Children’s Fund; WHO: Geneva, Switzerland; UNICEF: New York, NY, USA, 2009.
- World Health Organization (WHO). Bench Aids for the Diagnosis of Intestinal Parasites; WHO: Geneva, Switzerland, 1994. [Google Scholar]
- Crompton, D.W.T. Preventive Chemotherapy in Human Helminthiasis: Coordinated Use of Anthelminthic Drugs in Control Interventions: A Manual for Health Professionals and Programme Managers; WHO: Geneva, Switzerland, 2006. [Google Scholar]
- De Onis, M.; Dewey, K.G.; Borghi, E.; Onyango, A.W.; Blossner, M.; Daelmans, B.; Piwoz, E.; Branca, F. The World Health Organization’s global target for reducing childhood stunting by 2025: Rationale and proposed actions. Matern. Child Nutr. 2013, 9 (Suppl. 2), 6–26. [Google Scholar] [CrossRef]
- Moher, D.; Hopewell, S.; Schulz, K.F.; Montori, V.; Gøtzsche, P.C.; Devereaux, P.J.; Elbourne, D.; Egger, M.; Altman, D.G. CONSORT 2010 Explanation and Elaboration: Updated guidelines for reporting parallel group randomised trials. BMJ 2010, 340, c869. [Google Scholar] [CrossRef]
- Chakraborty, H.; Gu, H. A Mixed Model Approach for Intent-to-Treat Analysis in Longitudinal Clinical Trials with Missing Values; RTI Press: Triangle Park, NC, USA, 2009; Volume 129. [Google Scholar]
- Zhang, Z. Missing data imputation: Focusing on single imputation. Ann. Transl. Med. 2016, 4, 9. [Google Scholar] [CrossRef]
- Davis, C.S. Statistical Methods for the Analysis of Repeated Measurements; Springer: New York, NY, USA, 2002. [Google Scholar]
- Noguchi, K.; Gel, Y.R.; Brunner, E.; Konietschke, F. nparLD: An R Software Package for the Nonparametric Analysis of Longitudinal Data in Factorial Experiments. J. Stat. Softw. 2012, 50, 23. [Google Scholar] [CrossRef]
- Chirwa, E.D.; Griffiths, P.L.; Maleta, K.; Norris, S.A.; Cameron, N. Multi-level modelling of longitudinal child growth data from the Birth-to-Twenty Cohort: A comparison of growth models. Ann. Hum. Biol. 2014, 41, 168–179. [Google Scholar] [CrossRef]
- Alderman, H.; Headey, D. The timing of growth faltering has important implications for observational analyses of the underlying determinants of nutrition outcomes. PLoS ONE 2018, 13, e0195904. [Google Scholar] [CrossRef]
- Moser, W.; Schindler, C.; Keiser, J. Efficacy of recommended drugs against soil transmitted helminths: Systematic review and network meta-analysis. BMJ 2017, 358, j4307. [Google Scholar] [CrossRef]
- Forrer, A.; Khieu, V.; Schär, F.; Hattendorf, J.; Marti, H.; Neumayr, A.; Char, M.C.; Hatz, C.; Muth, S.; Odermatt, P. Strongyloides stercoralis is associated with significant morbidity in rural Cambodia, including stunting in children. PLoS Negl. Trop. Dis. 2017, 11, e0005685. [Google Scholar] [CrossRef]
- Henriquez-Camacho, C.; Gotuzzo, E.; Echevarria, J.; White, A.C., Jr.; Terashima, A.; Samalvides, F.; Pérez-Molina, J.A.; Plana, M.N. Ivermectin versus albendazole or thiabendazole for Strongyloides stercoralis infection. Cochrane Database Syst. Rev. 2016, 2016. [Google Scholar] [CrossRef] [PubMed]
- Rogawski, E.T.; Liu, J.; Platts-Mills, J.A.; Kabir, F.; Lertsethtakarn, P.; Siguas, M.; Khan, S.S.; Praharaj, I.; Murei, A.; Nshama, R.; et al. Use of quantitative molecular diagnostic methods to investigate the effect of enteropathogen infections on linear growth in children in low-resource settings: Longitudinal analysis of results from the MAL-ED cohort study. Lancet Glob. Health 2018, 6, e1319–e1328. [Google Scholar] [CrossRef]
- Kotloff, K.L.; Nataro, J.P.; Blackwelder, W.C.; Nasrin, D.; Farag, T.H.; Panchalingam, S.; Wu, Y.; Sow, S.O.; Sur, D.; Breiman, R.F.; et al. Burden and aetiology of diarrhoeal disease in infants and young children in developing countries (the Global Enteric Multicenter Study, GEMS): A prospective, case-control study. Lancet 2013, 382, 209–222. [Google Scholar] [CrossRef]
- Platts-Mills, J.A.; Babji, S.; Bodhidatta, L.; Gratz, J.; Haque, R.; Havt, A.; McCormick, B.J.; McGrath, M.; Olortegui, M.P.; Samie, A.; et al. Pathogen-specific burdens of community diarrhoea in developing countries: A multisite birth cohort study (MAL-ED). Lancet Glob. Health 2015, 3, e564–e575. [Google Scholar] [CrossRef]
- Oliveira, Y.; Oliveira, L.M.; Oliveira, Y.L.M.; Nascimento, A.M.D.; La Corte, R.; Geraldi, R.M.; Barbosa, L.; Gazzinelli-Guimarães, P.H.; Fujiwara, R.T.; Bueno, L.L.; et al. Changes in the epidemiological profile of intestinal parasites after a school-based large-scale treatment for soil-transmitted helminths in a community in northeastern Brazil: Epidemiological profile after large-scale school-based treatment for STH. Acta Trop 2020, 202, 105279. [Google Scholar] [CrossRef]
- Mascha, E.J.; Vetter, T.R. Significance, Errors, Power, and Sample Size: The Blocking and Tackling of Statistics. Anesth. Analg. 2018, 126, 691–698. [Google Scholar] [CrossRef]
- Kreidler, S.M.; Muller, K.E.; Grunwald, G.K.; Ringham, B.M.; Coker-Dukowitz, Z.T.; Sakhadeo, U.R.; Baron, A.E.; Glueck, D.H. GLIMMPSE: Online Power Computation for Linear Models with and without a Baseline Covariate. J. Stat. Softw. 2013, 54, 116–128. [Google Scholar] [CrossRef]
- Donohue, M.C. Longpower: Power and Sample Size Calculations for Longitudinal Data, R package version 1.0-19.; The R Project: Vienna, Austria, 2019. [Google Scholar]
- Dupont, W.D.; Plummer, W.D., Jr. Power and sample size calculations. A review and computer program. Control Clin. Trials 1990, 11, 116–128. [Google Scholar] [CrossRef]
- Acharya, K.P.; Pathak, S. Applied Research in Low-Income Countries: Why and How? Front. Res. Metr. Anal. 2019, 4, 3. [Google Scholar] [CrossRef]
- McGowan, H. An editor’s-eye view of randomized controlled trials. World Dev. 2020, 127, 104814. [Google Scholar] [CrossRef]
- Jagtap, S. Design and poverty: A review of contexts, roles of poor people, and methods. Res. Engineeing Des. 2019, 30, 41–62. [Google Scholar] [CrossRef]
- Savioli, L.; Albonico, M.; Daumerie, D.; Lo, N.C.; Stothard, J.R.; Asaolu, S.; Tchuem Tchuenté, L.A.; Anderson, R.M. Review of the 2017 WHO Guideline: Preventive chemotherapy to control soil-transmitted helminth infections in at-risk population groups. An opportunity lost in translation. PLoS Negl. Trop. Dis. 2018, 12, e0006296. [Google Scholar] [CrossRef]
- Mokomane, M.; Kasvosve, I.; de Melo, E.; Pernica, J.M.; Goldfarb, D.M. The global problem of childhood diarrhoeal diseases: Emerging strategies in prevention and management. Ther. Adv. Infect. Dis. 2018, 5, 29–43. [Google Scholar] [CrossRef]
- Mshida, H.A.; Kassim, N.; Mpolya, E.; Kimanya, M. Water, Sanitation, and Hygiene Practices Associated with Nutritional Status of Under-Five Children in Semi-Pastoral Communities Tanzania. Am. J. Trop. Med. Hyg. 2018, 98, 1242–1249. [Google Scholar] [CrossRef] [PubMed]
- Gasparinho, C.; Piedade, J.; Mirante, M.C.; Mendes, C.; Mayer, C.; Vaz Nery, S.; Brito, M.; Istrate, C. Characterization of rotavirus infection in children with acute gastroenteritis in Bengo province, Northwestern Angola, prior to vaccine introduction. PLoS ONE 2017, 12, e0176046. [Google Scholar] [CrossRef]
- Soares Magalhaes, R.J.; Langa, A.; Pedro, J.M.; Sousa-Figueiredo, J.C.; Clements, A.C.; Vaz Nery, S. Role of malnutrition and parasite infections in the spatial variation in children’s anaemia risk in northern Angola. Geospat. Health 2013, 7, 341–354. [Google Scholar] [CrossRef] [PubMed]
- Oliveira, D.; Ferreira, F.S.; Atouguia, J.; Fortes, F.; Guerra, A.; Centeno-Lima, S. Infection by Intestinal Parasites, Stunting and Anemia in School-Aged Children from Southern Angola. PLoS ONE 2015, 10, e0137327. [Google Scholar] [CrossRef] [PubMed]
- Olofin, I.; McDonald, C.M.; Ezzati, M.; Flaxman, S.; Black, R.E.; Fawzi, W.W.; Caulfield, L.E.; Danaei, G. Associations of suboptimal growth with all-cause and cause-specific mortality in children under five years: A pooled analysis of ten prospective studies. PLoS ONE 2013, 8, e64636. [Google Scholar] [CrossRef]
- Carrel, M.; Rennie, S. Demographic and health surveillance: Longitudinal ethical considerations. Bull. World Health Organ 2008, 86, 612–616. [Google Scholar] [CrossRef]


| Variable (n) | Categories a | A1 (n = 29) | A2 (n = 31) | A3 (n = 31) | A4 (n = 30) | |
|---|---|---|---|---|---|---|
| Child | Sex (n = 121) | Male | 16 (55.2) | 18 (58.1) | 13 (41.9) | 13 (43.3) |
| Female | 13 (44.8) | 13 (41.9) | 18 (58.1) | 17 (56.7) | ||
| Age (n = 121) | Mean ± SD, (months) | 25.1 ± 4.57 | 27.7 ± 4.93 | 25.8 ± 4.90 | 27.6 ± 4.70 | |
| Exclusively breastfed (n = 114) | Mean ± SD, (months) | 4.6 ± 1.80 | 5.4 ± 1.82 | 4.3 ± 2.1 | 4.7 ± 2.3 | |
| Complementary feeding (n = 111) | Mean ± SD, (months) | 19.7 ± 3.9 | 19.6 ± 5.0 | 20.1 ± 4.1 | 21.0 ± 3.8 | |
| Mother | Age (n = 114) | Mean ± SD, (years) | 27.32 ± 6.44 | 28.97 ± 6.68 | 26.67 ± 5.05 | 30.42 ± 7.90 |
| Maternal education (n = 116) | No education | 3 (10.3) | 2 (6.9) | 0 (0.0) | 6 (20.7) | |
| Primary | 8 (27.6) | 14 (48.3) | 18 (62.1) | 11 (37.9) | ||
| Secondary or higher | 18 (62.1) | 13 (44.8) | 11 (37.9) | 12 (41.4) | ||
| Studying and working status (n = 116) | Do not study/work | 5 (17.2) | 7 (24.1) | 8 (27.6) | 5 (17.2) | |
| Only working | 11 (37.9) | 8 (27.6) | 7 (24.1) | 11 (37.9) | ||
| Study and work | 4 (13.8) | 5 (17.2) | 5 (17.2) | 5 (17.2) | ||
| Only studying | 9 (31.0) | 9 (31.0) | 9 (31.0) | 8 (27.6) | ||
| Father | Age (n = 92) | Mean ± SD, (years) | 31.44 ± 7.93 | 35.07 ± 10.49 | 30.67 ± 4.90 | 36.84 ± 10.12 |
| Paternal education (n = 115) | No education | 1 (3.4) | 1 (3.6) | 0 (0.0) | 0 (0.0) | |
| Primary | 3 (10.3) | 5 (17.9) | 6 (20.7) | 6 (20.7) | ||
| Secondary or higher | 25 (86.2) | 22 (78.6) | 23 (79.3) | 23 (79.3) | ||
| Studying and working status (n = 115) | Do not study/work | 0 (0.0) | 0 (0.0) | 1 (3.4) | 1 (3.4) | |
| Only working | 21 (72.4) | 22 (78.6) | 19 (65.5) | 23 (793) | ||
| Study and work | 6 (20.7) | 6 (21.4) | 7 (24.1) | 4 (13.8) | ||
| Only studying | 2 (6.9) | 0 (0.0) | 2 (6.9) | 1 (3.4) | ||
| Household characteristics | Members per household (n = 117) | Mean ± SD | 6.29 ± 2.29 | 6.20 ± 2.30 | 5.45 ± 1.59 | 5.97 ± 2.06 |
| Place of residence (n = 121) | Urban | 27 (93.1) | 31 (100.0) | 30 (96.8) | 27 (90.0) | |
| Rooms (n = 117) | ≤3 | 23 (79.3) | 17 (58.6) | 25 (83.3) | 22 (75.9) | |
| >3 | 6 (20.7) | 12 (41.4) | 5 (16.7) | 7 (24.1) | ||
| Wall (n = 117) | Adobe | 18 (62.1) | 20 (69.0) | 23 (76.7) | 26 (89.7) | |
| Bricks | 11 (37.9) | 9 (31.0) | 7 (23.3) | 3 (10.3) | ||
| Floor (n = 117) | Earth/sand | 5 (17.2) | 4 (13.8) | 3 (10.0) | 3 (10.3) | |
| Cement/ceramic | 24 (82.8) | 25 (86.2) | 27 (90.0) | 26 (89.7) | ||
| Mobile phone (n = 117) | Yes | 27 (93.1) | 28 (96.6) | 30 (100.0) | 25 (86.2) | |
| Television (n = 117) | Yes | 25 (86.2) | 26 (89.7) | 26 (86.7) | 26 (89.7) | |
| Public electricity (n = 117) | Yes | 21 (72.4) | 27 (93.1) | 25 (83.3) | 21 (72.4) | |
| Freezer (n = 117) | Yes | 22 (75.9) | 22 (75.9) | 23 (76.7) | 21 (72.4) | |
| Cable TV (n = 117) | Yes | 19 (65.5) | 23 (79.3) | 20 (66.7) | 20 (69.0) | |
| Wheelbarrow (n = 117) | Yes | 14 (48.3) | 18 (62.1) | 16 (53.3) | 15 (51.7) | |
| Radio (n = 117) | Yes | 16 (55.2) | 12 (41.4) | 14 (46.7) | 13 (44.8) | |
| Motorcycle (n = 117) | Yes | 9 (31.0) | 9 (31.0) | 15 (50.0) | 9 (31.0) | |
| Generator (n = 117) | Yes | 4 (13.8) | 6 (20.7) | 8 (26.7) | 10 (34.5) | |
| Animals (n = 117) | Yes | 6 (20.7) | 3 (10.3) | 7 (24.1) | 7 (24.1) | |
| Refrigerator (n = 117) | Yes | 5 (17.2) | 4 (13.8) | 6 (20.0) | 6 (20.7) | |
| Car (n = 117) | Yes | 6 (20.7) | 4 (13.8) | 3 (10.0) | 7 (24.1) | |
| Bicycle (n = 117) | Yes | 1 (3.4) | 2 (6.9) | 4 (13.3) | 0 (0.0) | |
| Water source and sanitation | Drinking water source b (n = 117) | Improved | 21 (72.4) | 22 (75.9) | 19 (63.3) | 21 (72.4) |
| Unimproved | 8 (27.6) | 7 (24.1) | 11 (36.7) | 8 (27.6) | ||
| Drinking water source (n = 117) | River | 8 (27.6) | 5 (17.2) | 9 (30.0) | 7 (24.1) | |
| Tap in the yard | 5 (17.2) | 12 (41.4) | 7 (23.3) | 8 (27.6) | ||
| Private tank | 9 (31.0) | 6 (20.7) | 9 (30.0) | 10 (34.5) | ||
| Others c | 7 (24.1) | 6 (20.6) | 5 (16.7) | 4 (13.8) | ||
| Bath water source (n = 117) | Irrigation channel | 9 (31.0) | 4 (13.8) | 9 (30.0) | 6 (20.7) | |
| River | 7 (24.1) | 6 (20.7) | 9 (30.0) | 8 (27.6) | ||
| Tap in the yard | 3 (10.3) | 7 (24.1) | 4 (13.3) | 7 (24.1) | ||
| Private tank | 3 (10.3) | 5 (17.2) | 2 (6.7) | 4 (13.8) | ||
| Others d | 7 (24.1) | 7 (24.1) | 6 (20.0) | 4 (13.8) | ||
| Latrine (n = 117) | No facility | 7 (24.1) | 3 (10.3) | 7 (23.3) | 6 (20.7) | |
| Public | 10 (34.5) | 10 (34.5) | 9 (30.0) | 7 (24.1) | ||
| Private | 12 (41.4) | 16 (55.2) | 14 (46.7) | 16 (55.2) |
| Variable (n) | Categories a | A1 (n = 29) | A2 (n = 31) | A3 (n = 31) | A4 (n = 30) | |
|---|---|---|---|---|---|---|
| Nutritional status | Height (n = 121) | Mean ± SD | 83.63 ± 5.32 | 85.49 ± 5.89 | 84.19 ± 5.68 | 85.15 ± 6.73 |
| Weight b (n = 119) | Mean ± SD | 10.70 ± 1.74 | 11.58 ± 1.77 | 11.40 ± 1.70 | 11.48 ± 1.87 | |
| MUAC (n = 121) | Mean ± SD | 13.83 ± 1.32 | 14.34 ± 1.12 | 14.33 ± 1.01 | 14.40 ± 0.94 | |
| HAZ (n = 121) | Mean ± SD | −1.26 ± 1.41 | −1.35 ± 1.35 | −1.30 ± 1.33 | −1.43 ± 1.29 | |
| WHZ b (n = 119) | Mean ± SD | −0.65 ± 1.22 | −0.25 ± 1.02 | 0.00 ± 1.36 | −0.22 ± 0.98 | |
| WAZ b (n = 119) | Mean ± SD | −1.15 ± 1.19 | −0.87 ± 1.07 | −0.65 ± 1.15 | −0.89 ± 1.04 | |
| MUACZ (n = 121) | Mean ± SD | −1.19 ± 1.21 | −0.85 ± 0.93 | −0.73 ± 0.90 | −0.75 ± 0.84 | |
| Stunting (n = 121) | Eutrophic | 12 (41.4) | 11 (35.5) | 11 (35.5) | 10 (33.3) | |
| Moderate-to-severe | 9 (31.0) | 10 (32.3) | 8 (25.8) | 10 (33.3) | ||
| Wasting (n = 121) | Eutrophic | 17 (58.6) | 23 (74.2) | 24 (77.4) | 22 (73.3) | |
| Moderate-to-severe | 4 (13.8) | 2 (6.5) | 1 (3.2) | 2 (6.7) | ||
| Underweight (n = 119) | Eutrophic | 16 (55.2) | 15 (50.0) | 18 (58.1) | 16 (55.2) | |
| Moderate-to-severe | 6 (20.7) | 3 (10.0) | 6 (19.4) | 4 (10.3) | ||
| Pathogenic intestinal parasites | Type of infection (n = 121) | Monoparasitism | 25 (86.2) | 26 (83.9) | 28 (90.3) | 26 (86.7) |
| Polyparasitism | 4 (13.8) | 5 (16.1) | 3 (9.7) | 4 (13.3) | ||
| Group of parasites (n = 121) | Protozoa (P) | 18 (62.1) | 17 (54.8) | 19 (61.3) | 13 (43.3) | |
| Helminths (H) | 8 (27.6) | 12 (38.7) | 11 (35.5) | 14 (46.7) | ||
| P + H | 3 (10.3) | 2 (6.5) | 1 (3.2) | 3 (10.0) | ||
| Giardia lamblia (n = 121) | Positive | 17 (58.6) | 18 (58.1) | 19 (61.3) | 15 (50.0) | |
| Ascaris lumbricoides (n = 121) | Positive | 3 (10.3) | 8 (25.8) | 8 (25.8) | 12 (40.0) | |
| A. lumbricoides intensity c (Kato–Katz d, n = 17) | Light | 1 (50.0) | 4 (66.7) | 3 (60.0) | 3 (75.0) | |
| Moderate-to-heavy | 1 (50.0) | 2 (33.3) | 2 (40.0) | 1 (25.0) | ||
| Strongyloides stercoralis (n = 121) | Positive | 5 (17.2) | 3 (9.7) | 4 (12.9) | 4 (13.3) | |
| Trichuris trichiura (n = 121) | Positive | 2 (6.9) | 2 (6.5) | 1 (3.2) | 2 (6.7) | |
| T. trichiura intensitye (Kato–Katzd, n = 3) | Light | 1 (100.0) | 1 (100.0) | 0 (0.0) | 1 (100.0) | |
| Moderate-to-heavy | 0 (0.0) | 0 (0.0) | 0 (0.0) | 0 (0.0) | ||
| Hymenolepis nana (n = 121) | Positive | 1 (3.4) | 3 (9.7) | 3 (9.7) | 0 (0.0) | |
| Cryptosporidium spp. (n = 121) | Positive | 3 (10.3) | 1 (3.2) | 1 (3.2) | 2 (6.7) | |
| Entamoeba histolytica (n = 121) | Positive | 2 (6.9) | 1 (3.2) | 0 (0.0) | 0 (0.0) | |
| Malaria, Hb, symptoms | Malaria (P.falciparum) (n = 121) | Positive | 4 (13.8) | 3 (9.7) | 2 (6.5) | 2 (6.7) |
| Hemoglobin (g/dL) (n = 116) | mean ± SD | 10.3 ± 2.06 | 10.5 ± 1.65 | 11.0 ± 1.05 | 10.5 ± 1.81 | |
| Anemia (n = 119) | No | 11 (40.7) | 15 (48.4) | 18 (58.1) | 11 (36.7) | |
| Mild | 7 (25.9) | 7 (22.6) | 9 (29.0) | 13 (43.3) | ||
| Moderate | 7 (25.9) | 7 (22.6) | 4 (12.9) | 4 (13.3) | ||
| Severe | 2 (7.4) | 2 (6.5) | 0 (0.0) | 2 (6.7) | ||
| Diarrhea (n = 121) | Yes | 15 (51.7) | 10 (32.3) | 16 (51.6) | 17 (56.7) | |
| Fever (n = 121) | Yes | 24 (82.8) | 25 (80.6) | 22 (71.0) | 26 (86.7) | |
| Vomiting (n = 121) | Yes | 4 (13.8) | 7 (22.6) | 5 (16.1) | 2 (6.7) |
| Outcome | nparLD | LMM | GEE | ||||||||||
|---|---|---|---|---|---|---|---|---|---|---|---|---|---|
| ANOVA Modified | Wald | ANOVA | ANOVA | ||||||||||
| Effect | Statistic | df | p-value | Statistic | df | p-value | Statistic | df1 | df2 | p-value | Statistic a | df | p-value |
| Height | |||||||||||||
| Arm | 0.94 | 2.930 | 0.42 | 3.03 | 3 | 0.39 | 1.0 | 3 | 117 | 0.48 | 10.0 | 3 | 0.02* |
| Time | 1210.04 | 1.903 | <0.001 * | 1860.84 | 5 | <0.001 * | 6997.0 | 1 | 601 | <0.001 * | 427.0 | 1 | <0.001* |
| Arm*Time | 0.79 | 5.483 | 0.57 | 11.86 | 15 | 0.69 | 0.0 | 3 | 601 | 0.72 | 0.0 | 3 | 1.00 |
| Weight | |||||||||||||
| Arm | 0.63 | 2.939 | 0.59 | 1.82 | 3 | 0.61 | 1.0 | 3 | 117 | 0.62 | 7.5 | 3 | 0.06 |
| Time | 474.71 | 3.279 | <0.001 * | 1053.28 | 5 | <0.001 * | 2025.0 | 1 | 601 | <0.001 * | 216.8 | 1 | <0.001* |
| Arm*Time | 0.82 | 8.979 | 0.60 | 15.83 | 15 | 0.39 | 0.0 | 3 | 601 | 0.69 | 0.1 | 3 | 0.99 |
| HAZ | |||||||||||||
| Arm | 0.06 | 2.986 | 0.98 | 0.19 | 3 | 0.98 | 0.1 | 3 | 117 | 0.96 | 2.13 | 3 | 0.55 |
| Time | 29.30 | 3.256 | <0.001 * | 64.53 | 5 | <0.001 * | 54.2 | 1 | 601 | <0.001 * | 5.23 | 1 | 0.02* |
| Arm*Time | 0.73 | 8.670 | 0.68 | 11.43 | 15 | 0.72 | 0.4 | 3 | 601 | 0.78 | 0.13 | 3 | 0.99 |
| WAZ | |||||||||||||
| Arm | 0.12 | 2.986 | 0.95 | 0.40 | 3 | 0.94 | 0.3 | 3 | 117 | 0.84 | 5.08 | 3 | 0.17 |
| Time | 6.06 | 4.292 | <0.001 * | 23.73 | 5 | <0.001 * | 1.9 | 1 | 601 | 0.17 | 0.21 | 1 | 0.65 |
| Arm*Time | 0.77 | 10.112 | 0.66 | 15.92 | 15 | 0.39 | 0.3 | 3 | 601 | 0.83 | 0.04 | 3 | 1.00 |
| WHZ | |||||||||||||
| Arm | 0.29 | 2.955 | 0.83 | 0.95 | 3 | 0.81 | 0.5 | 3 | 117 | 0.68 | 8.10 | 3 | 0.04* |
| Time | 10.15 | 4.534 | <0.001 * | 46.32 | 5 | <0.001 * | 15.6 | 1 | 601 | <0.001 * | 4.08 | 1 | 0.04* |
| Arm*Time | 0.48 | 11.766 | 0.93 | 9.63 | 15 | 0.84 | 0.06 | 3 | 601 | 0.98 | 0.04 | 3 | 1.00 |
| MUACZ | |||||||||||||
| Arm | 0.35 | 2.947 | 0.79 | 1.00 | 3 | 0.80 | 0.5 | 3 | 117 | 0.66 | 7.52 | 3 | 0.06 |
| Time | 4.35 | 4.549 | 0.001 * | 19.15 | 5 | 0.002 * | 6.8 | 1 | 601 | 0.009 * | 1.86 | 1 | 0.17 |
| Arm*Time | 0.40 | 12.047 | 0.96 | 6.80 | 15 | 0.96 | 1.0 | 3 | 601 | 0.39 | 0.77 | 3 | 0.86 |
| Variable | Parameter | LMM | GEE | |||||||
|---|---|---|---|---|---|---|---|---|---|---|
| E | SE | Df | Statistic | p-Value | E | SE | Statistic | p-Value | ||
| Height | (Intercept) | 84.1 | 1.08 | 601 | 78.1 | <0.001 * | 84.3 | 0.92 | 8324.2 | <0.001 * |
| A1A2 | 2.1 | 1.50 | 117 | 1.4 | 0.16 | 2.1 | 1.32 | 2.6 | 0.11 | |
| A1A3 | 0.3 | 1.50 | 117 | 0.2 | 0.85 | 0.3 | 1.26 | 0.1 | 0.80 | |
| A1A4 | 1.5 | 1.51 | 117 | 1.0 | 0.33 | 1.4 | 1.44 | 1.0 | 0.32 | |
| Time | 2.5 | 0.06 | 601 | 40.9 | <0.001 * | 2.5 | 0.24 | 106.67 | <0.001 * | |
| A1A2: Time | 0.0 | 0.09 | 601 | 0.0 | 0.97 | 0.0 | 0.34 | 0.0 | 0.95 | |
| A1A3: Time | 0.1 | 0.09 | 601 | 0.7 | 0.48 | 0.1 | 0.33 | 0.0 | 0.85 | |
| A1A4: Time | 0.0 | 0.09 | 601 | −0.4 | 0.69 | 0.0 | 0.38 | 0.0 | 0.98 | |
| Weight | (Intercept) | 11.4 | 0.35 | 601 | 32.1 | <0.001 * | 11.4 | 0.32 | 1301.5 | <0.001 * |
| A1A2 | 0.6 | 0.49 | 117 | 1.1 | 0.26 | 0.6 | 0.44 | 1.8 | 0.18 | |
| A1A3 | 0.2 | 0.49 | 117 | 0.5 | 0.62 | 0.3 | 0.41 | 0.4 | 0.51 | |
| A1A4 | 0.4 | 0.50 | 117 | 0.8 | 0.45 | 0.4 | 0.46 | 0.8 | 0.36 | |
| Time | 0.6 | 0.03 | 601 | 21.3 | <0.001 * | 0.6 | 0.09 | 45.1 | <0.001 * | |
| A1A2: Time | 0.0 | 0.04 | 601 | 0.2 | 0.87 | 0.0 | 0.12 | 0.0 | 0.98 | |
| A1A3: Time | 0.0 | 0.04 | 601 | 0.9 | 0.38 | 0.0 | 0.11 | 0.1 | 0.81 | |
| A1A4: Time | 0.0 | 0.04 | 601 | 1.0 | 0.34 | 0.0 | 0.13 | 0.0 | 0.85 | |
| HAZ | (Intercept) | −1.38 | 0.210 | 601 | −6.6 | <0.001 * | −1.39 | 0.201 | 47.7 | <0.001 * |
| A1A2 | 0.04 | 0.292 | 117 | 0.1 | 0.90 | 0.04 | 0.278 | 0.0 | 0.90 | |
| A1A3 | 0.00 | 0.292 | 117 | 0.0 | 0.99 | 0.01 | 0.271 | 0.0 | 0.98 | |
| A1A4 | −0.09 | 0.295 | 117 | −0.3 | 0.77 | −0.09 | 0.280 | 0.1 | 0.76 | |
| Time | 0.04 | 0.015 | 601 | 2.8 | 0.01 * | 0.04 | 0.051 | 0.6 | 0.42 | |
| A1A2: Time | 0.02 | 0.021 | 601 | 1.0 | 0.31 | 0.03 | 0.069 | 0.1 | 0.72 | |
| A1A3: Time | 0.02 | 0.021 | 601 | 0.7 | 0.46 | 0.02 | 0.068 | 0.1 | 0.83 | |
| A1A4: Time | 0.01 | 0.021 | 601 | 0.6 | 0.56 | 0.02 | 0.071 | 0.1 | 0.83 | |
| WHZ | (Intercept) | −0.08 | 0.179 | 601 | −0.4 | 0.67 | −0.08 | 0.181 | 0.2 | 0.65 |
| A1A2 | 0.06 | 0.248 | 117 | 0.2 | 0.81 | 0.08 | 0.250 | 0.1 | 0.75 | |
| A1A3 | 0.25 | 0.248 | 117 | 1.0 | 0.32 | 0.26 | 0.226 | 1.3 | 0.25 | |
| A1A4 | 0.11 | 0.250 | 117 | 0.4 | 0.67 | 0.13 | 0.240 | 0.3 | 0.58 | |
| Time | −0.04 | 0.022 | 601 | −2.0 | 0.04 * | −0.04 | 0.046 | 0.7 | 0.41 | |
| A1A2: Time | 0.00 | 0.030 | 601 | −0.1 | 0.91 | −0.01 | 0.062 | 0.0 | 0.87 | |
| A1A3: Time | 0.00 | 0.030 | 601 | 0.1 | 0.94 | −0.00 | 0.058 | 0.0 | 0.98 | |
| A1A4: Time | 0.01 | 0.030 | 601 | 0.3 | 0.78 | 0.00 | 0.062 | 0.0 | 1.00 | |
| WAZ | (Intercept) | −0.79 | 0.175 | 601 | −4.5 | <0.001 * | −0.80 | 0.178 | 20.2 | <0.001 * |
| A1A2 | 0.04 | 0.243 | 117 | 0.2 | 0.86 | 0.06 | 0.244 | 0.1 | 0.79 | |
| A1A3 | 0.18 | 0.243 | 117 | 0.7 | 0.47 | 0.19 | 0.228 | 0.7 | 0.40 | |
| A1A4 | 0.01 | 0.245 | 117 | 0.0 | 0.97 | 0.04 | 0.236 | 0.0 | 0.88 | |
| Time | −0.02 | 0.016 | 601 | −1.4 | 0.16 | −0.02 | 0.046 | 0.1 | 0.73 | |
| A1A2: Time | 0.02 | 0.022 | 601 | 0.7 | 0.47 | 0.01 | 0.061 | 0.0 | 0.88 | |
| A1A3: Time | 0.01 | 0.022 | 601 | 0.5 | 0.65 | 0.01 | 0.058 | 0.0 | 0.93 | |
| A1A4: Time | 0.02 | 0.022 | 601 | 0.9 | 0.38 | 0.01 | 0.060 | 0.0 | 0.86 | |
| MUACZ | (Intercept) | −0.92 | 0.153 | 601 | −6.0 | <0.001 * | −0.92 | 0.168 | 30.1 | <0.001 * |
| A1A2 | 0.24 | 0.213 | 117 | 1.1 | 0.27 | 0.24 | 0.236 | 1.0 | 0.31 | |
| A1A3 | 0.35 | 0.213 | 117 | 1.7 | 0.10 | 0.35 | 0.120 | 3.1 | 0.08 | |
| A1A4 | 0.36 | 0.215 | 117 | 1.7 | 0.09 | 0.36 | 0.215 | 2.8 | 0.09 | |
| Time | 0.00 | 0.021 | 601 | 0.2 | 0.86 | 0.01 | 0.042 | 0.0 | 0.91 | |
| A1A2: Time | −0.03 | 0.029 | 601 | −1.1 | 0.27 | −0.03 | 0.058 | 0.3 | 0.57 | |
| A1A3: Time | −0.04 | 0.029 | 601 | −1.5 | 0.13 | −0.04 | 0.051 | 0.7 | 0.41 | |
| A1A4: Time | −0.04 | 0.029 | 601 | −1.5 | 0.13 | −0.04 | 0.054 | 0.7 | 0.44 | |
Publisher’s Note: MDPI stays neutral with regard to jurisdictional claims in published maps and institutional affiliations. |
© 2021 by the authors. Licensee MDPI, Basel, Switzerland. This article is an open access article distributed under the terms and conditions of the Creative Commons Attribution (CC BY) license (http://creativecommons.org/licenses/by/4.0/).
Share and Cite
Gasparinho, C.; Kanjungo, A.; Zage, F.; Clemente, I.; Santos-Reis, A.; Brito, M.; Sousa-Figueiredo, J.C.; Fortes, F.; Gonçalves, L. Impact of Annual Albendazole versus Four-Monthly Test-and-Treat Approach of Intestinal Parasites on Children Growth—A Longitudinal Four-Arm Randomized Parallel Trial during Two Years of a Community Follow-Up in Bengo, Angola. Pathogens 2021, 10, 309. https://doi.org/10.3390/pathogens10030309
Gasparinho C, Kanjungo A, Zage F, Clemente I, Santos-Reis A, Brito M, Sousa-Figueiredo JC, Fortes F, Gonçalves L. Impact of Annual Albendazole versus Four-Monthly Test-and-Treat Approach of Intestinal Parasites on Children Growth—A Longitudinal Four-Arm Randomized Parallel Trial during Two Years of a Community Follow-Up in Bengo, Angola. Pathogens. 2021; 10(3):309. https://doi.org/10.3390/pathogens10030309
Chicago/Turabian StyleGasparinho, Carolina, Aguinaldo Kanjungo, Félix Zage, Isabel Clemente, Ana Santos-Reis, Miguel Brito, José Carlos Sousa-Figueiredo, Filomeno Fortes, and Luzia Gonçalves. 2021. "Impact of Annual Albendazole versus Four-Monthly Test-and-Treat Approach of Intestinal Parasites on Children Growth—A Longitudinal Four-Arm Randomized Parallel Trial during Two Years of a Community Follow-Up in Bengo, Angola" Pathogens 10, no. 3: 309. https://doi.org/10.3390/pathogens10030309
APA StyleGasparinho, C., Kanjungo, A., Zage, F., Clemente, I., Santos-Reis, A., Brito, M., Sousa-Figueiredo, J. C., Fortes, F., & Gonçalves, L. (2021). Impact of Annual Albendazole versus Four-Monthly Test-and-Treat Approach of Intestinal Parasites on Children Growth—A Longitudinal Four-Arm Randomized Parallel Trial during Two Years of a Community Follow-Up in Bengo, Angola. Pathogens, 10(3), 309. https://doi.org/10.3390/pathogens10030309