
Seasonality of Non-SARS, Non-MERS Coronaviruses and the Impact of Meteorological Factors

 , , and
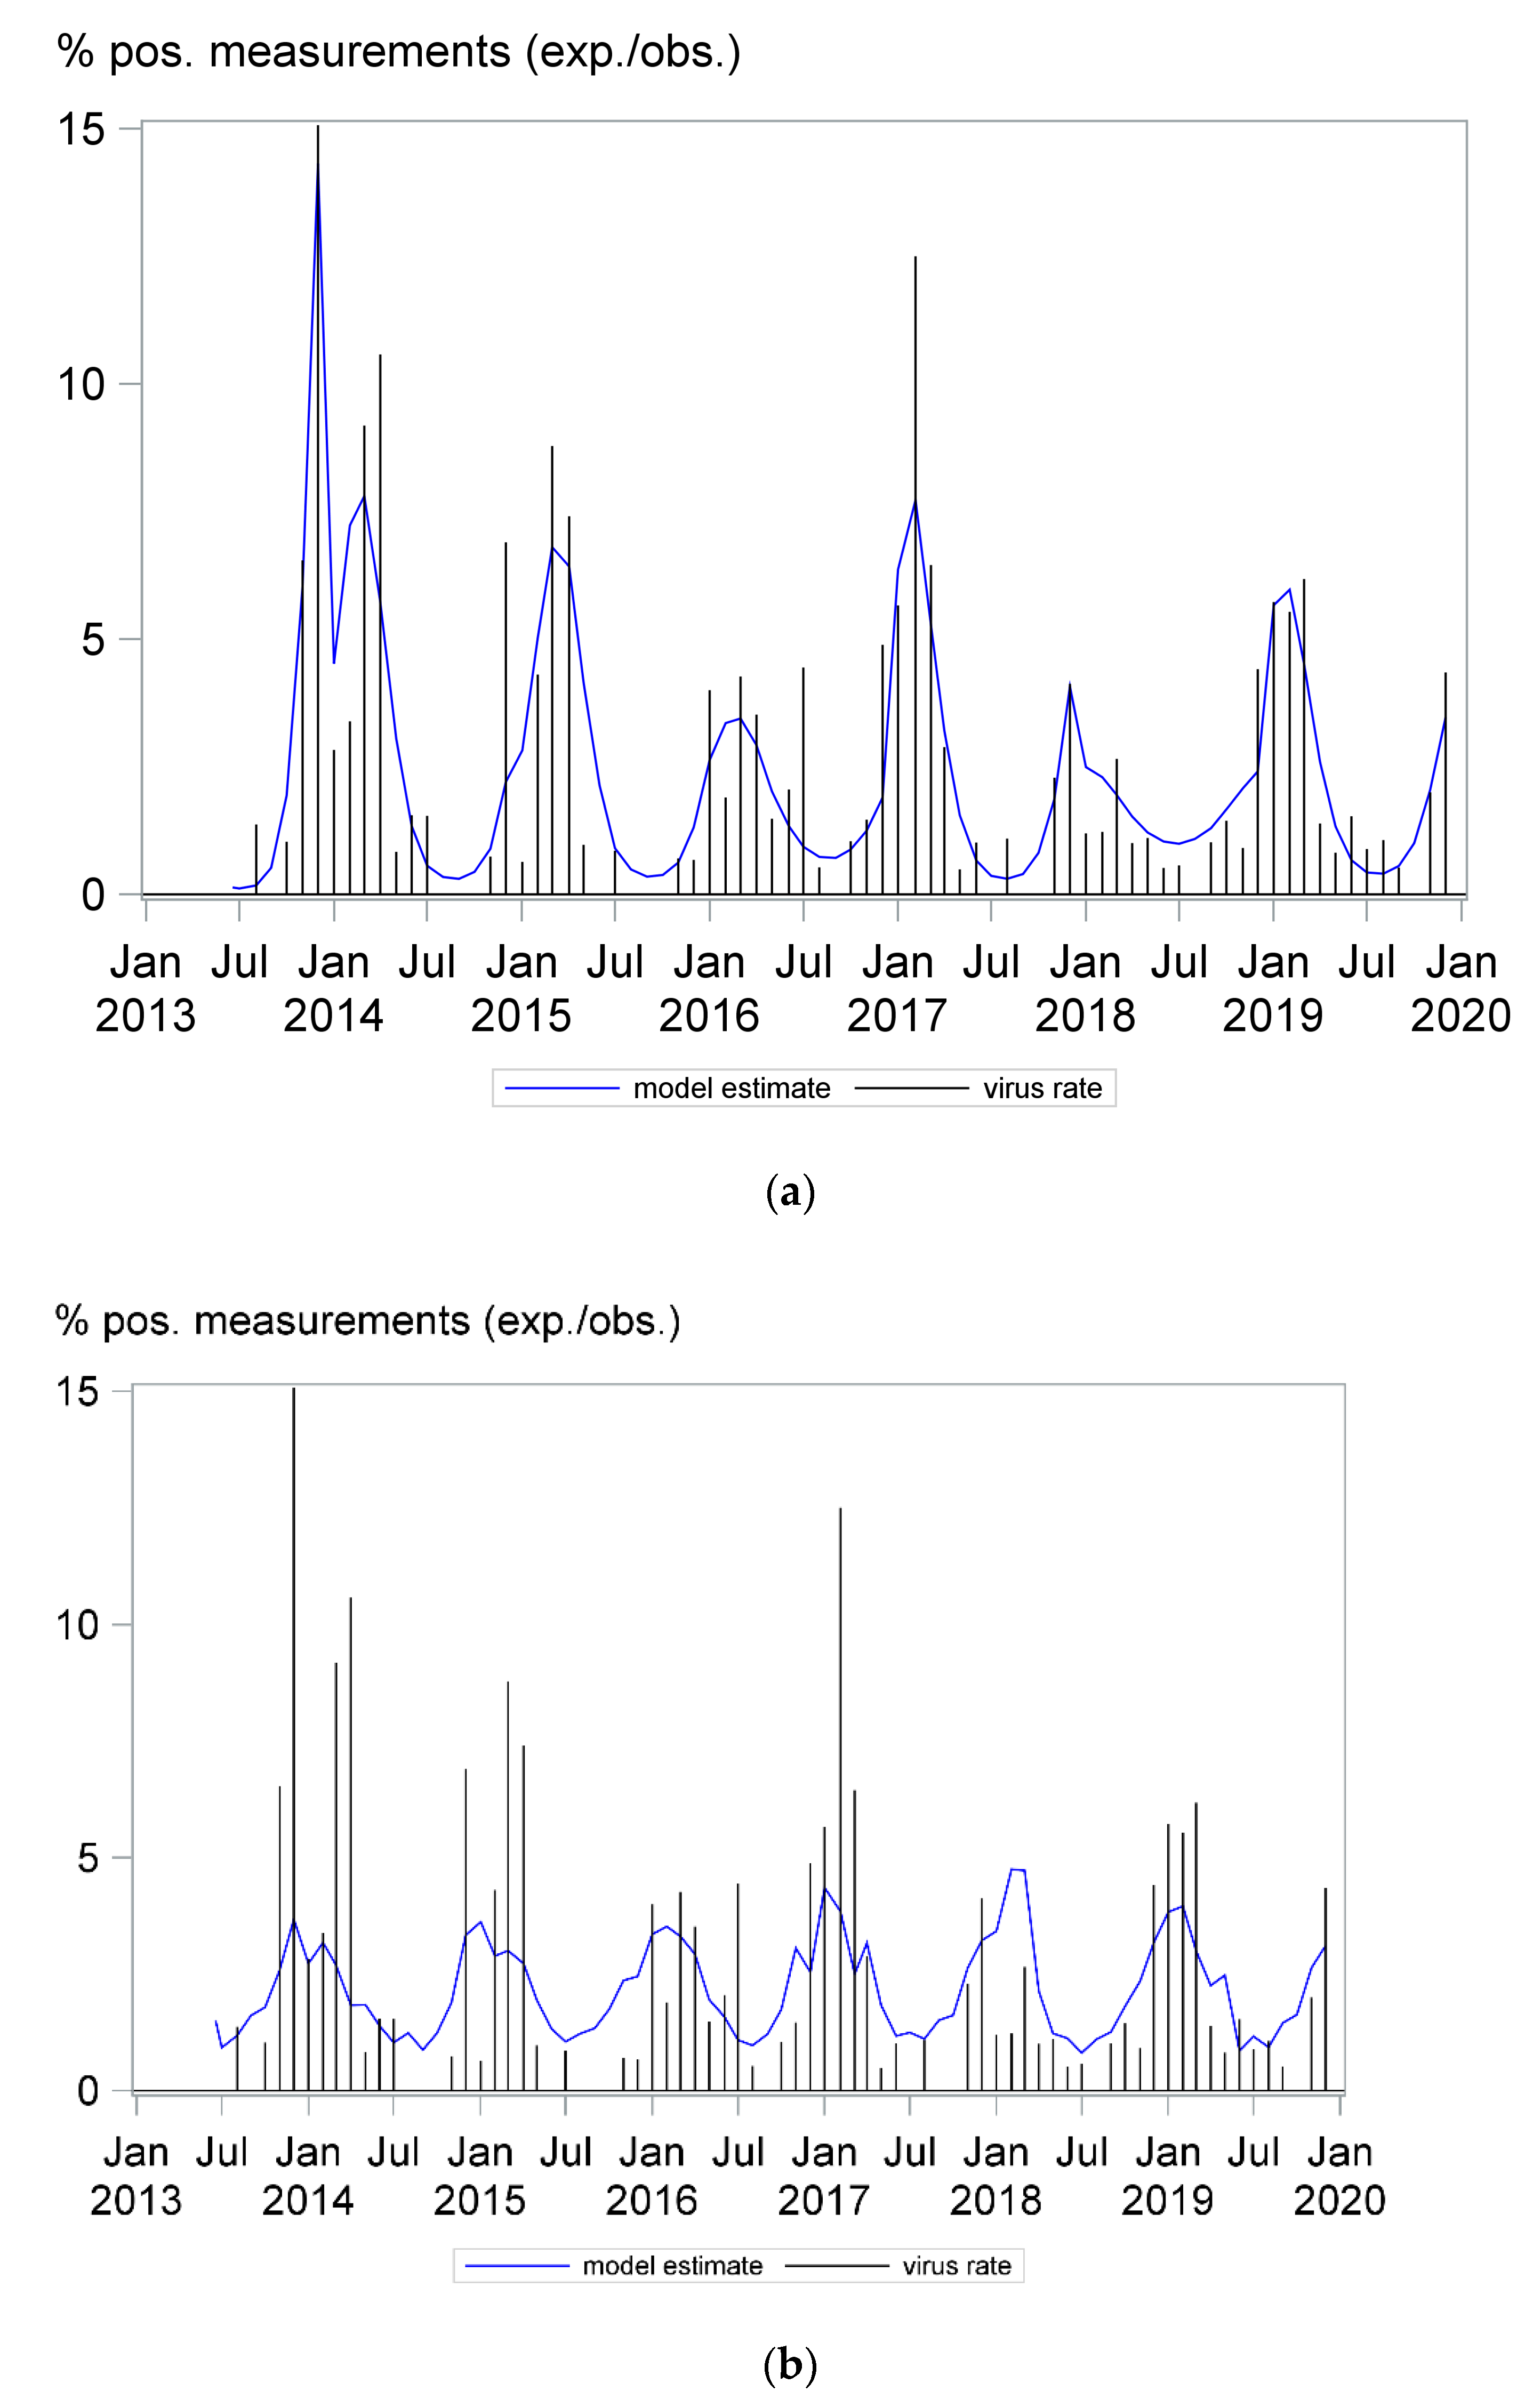
Abstract
1. Introduction
2. Materials and Methods
Data Analysis
3. Results
3.1. Coronavirus Infections Followed a Seasonal Pattern
3.2. Low Ambient Temperature, Minimum Sunlight Hours per Day, High Relative Humidity, Wind Speed, Cloud Cover and Precipitation Were Each Associated with Higher Detection Rates of Coronavirus
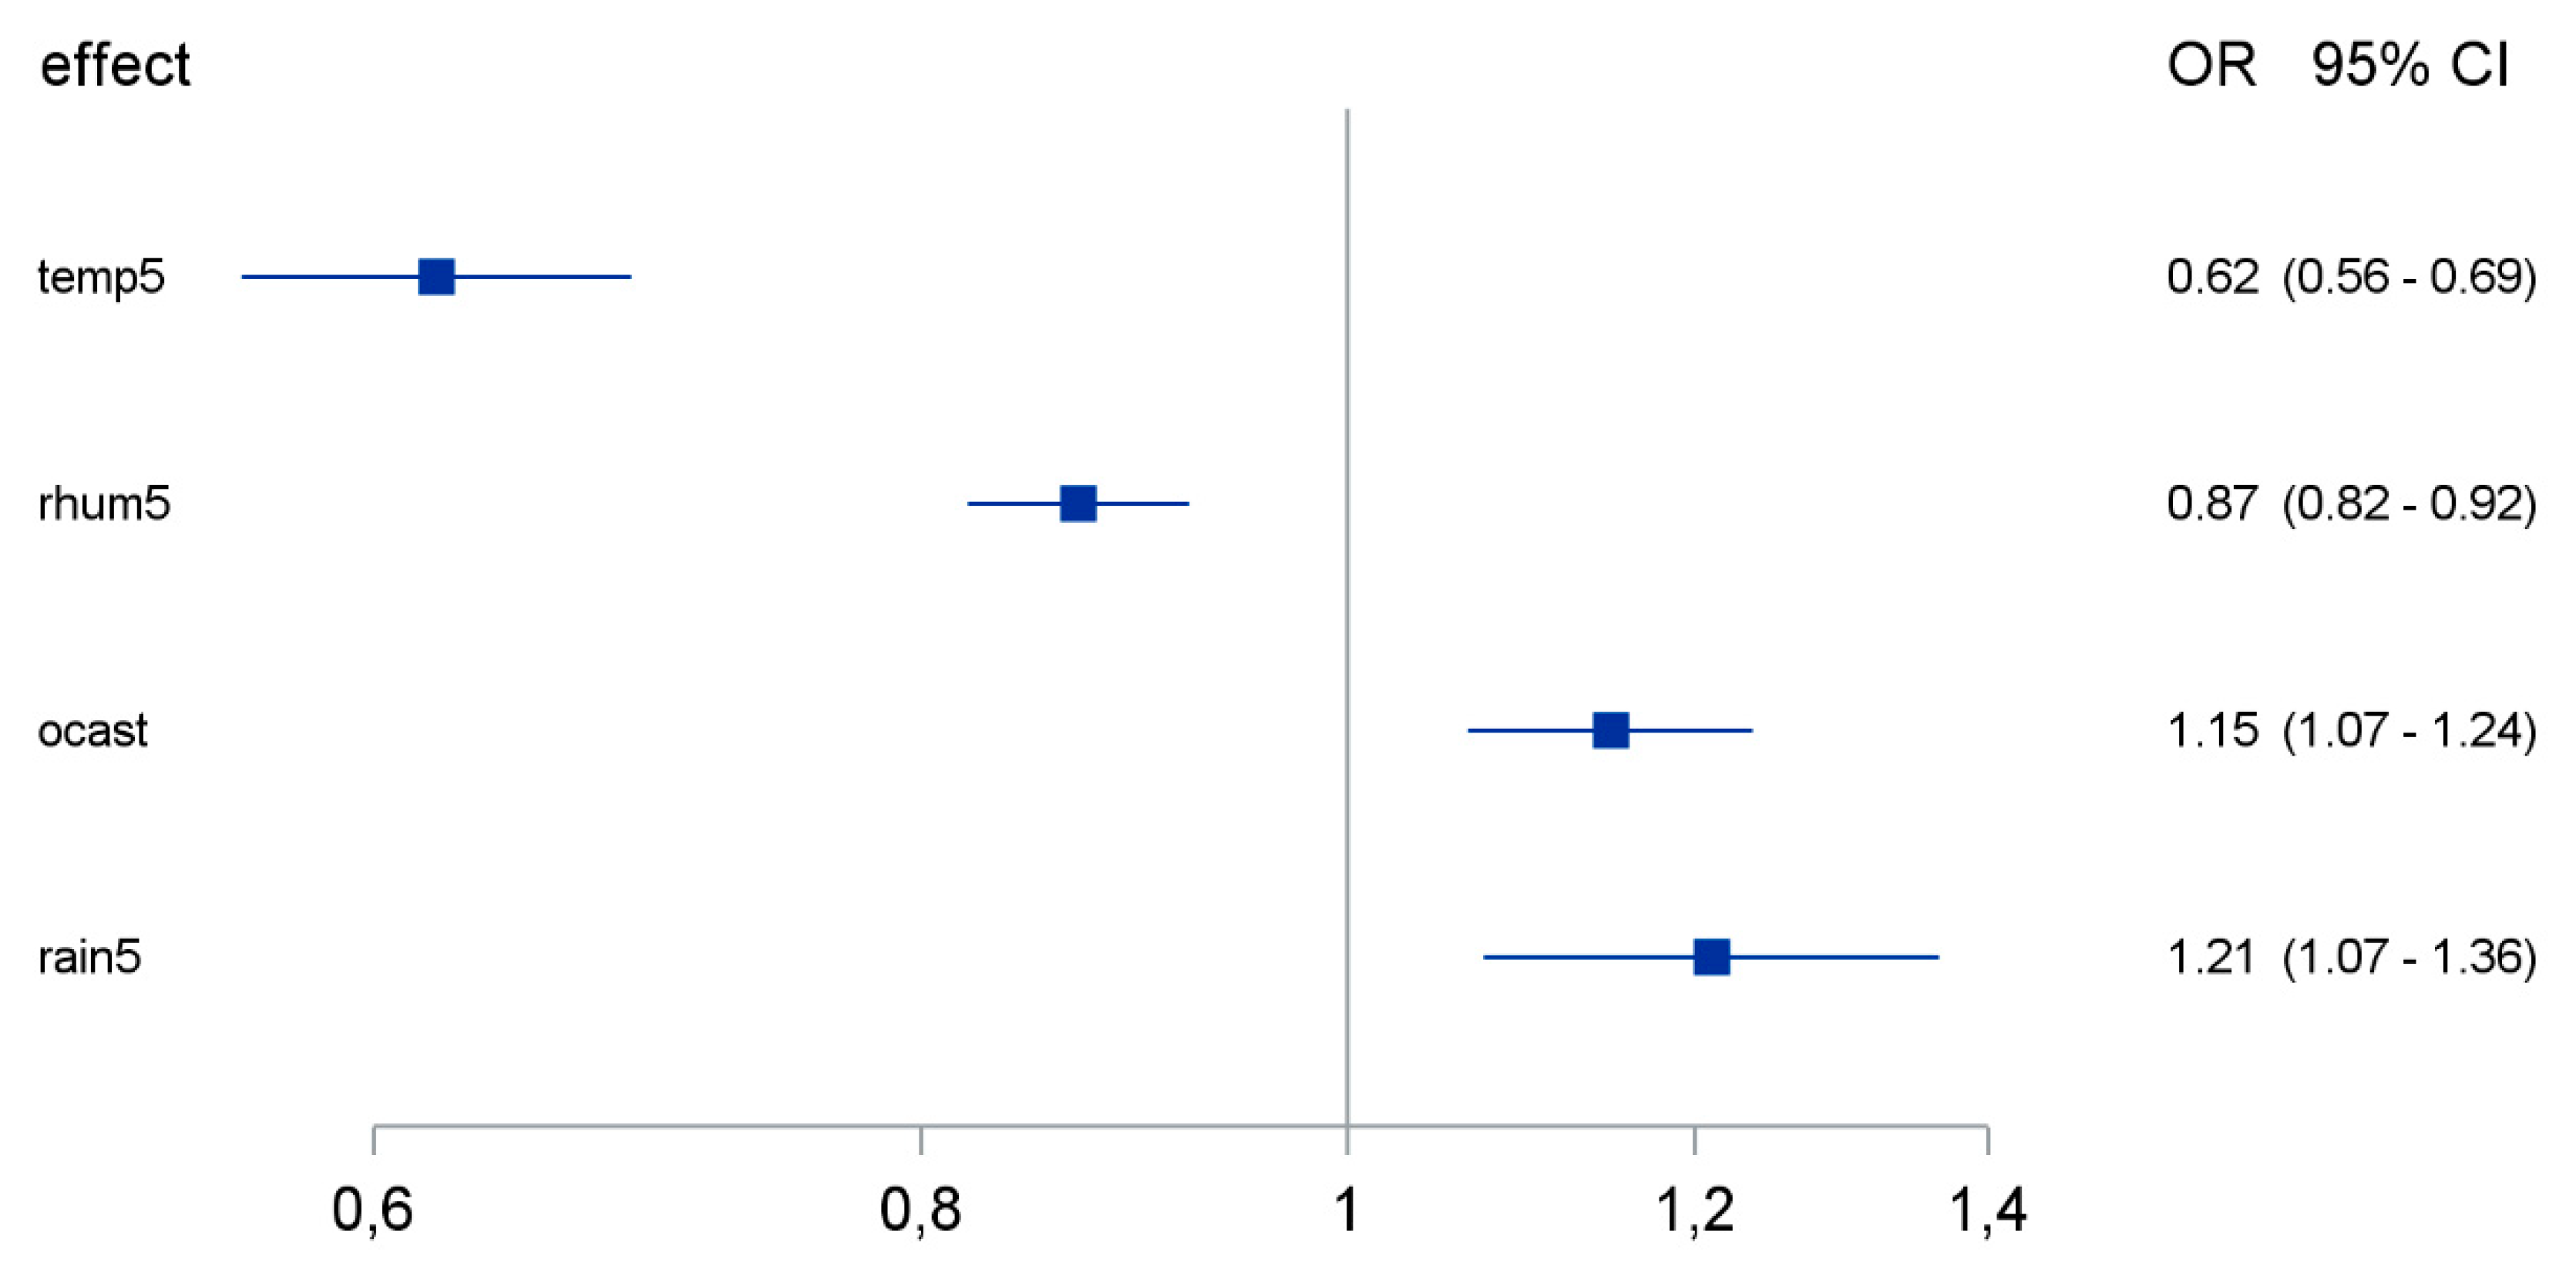
3.3. Temperature, Relative Humidity, Precipitation and Cloud Cover Were Independently Associated with the Coronavirus Detection Rate
3.4. The Seasonality of Coronavirus Infections Was Less Pronounced in Immunosuppressed Patients
3.5. “Off-Season” Coronavirus Detection Was More Frequent in Immunosuppressed Patients
4. Discussion
Supplementary Materials
Author Contributions
Funding
Institutional Review Board Statement
Informed Consent Statement
Data Availability Statement
Acknowledgments
Conflicts of Interest
References
- WHO. Global Health Estimates 2016: Disease burden by Cause, Age, Sex, by Country and by Region, 2000–2016; World Health Organization: Geneva, Switzerland, 2018. [Google Scholar]
- Dandachi, D.; Rodriguez-Barradas, M.C. Viral pneumonia: Etiologies and treatment. J. Investig. Med. 2018, 66, 957. [Google Scholar] [CrossRef] [PubMed]
- Stang, A.; Standl, F.; Jöckel, K.-H. Characteristics of COVID-19 pandemic and public health consequences. Herz 2020, 45, 313–315. [Google Scholar] [CrossRef] [PubMed]
- Welfens, P.J.J. Macroeconomic and health care aspects of the coronavirus epidemic: EU, US and global perspectives. Int. Econ. Econ. Policy 2020, 1–68. [Google Scholar] [CrossRef]
- Heikkinen, T.; Jarvinen, A. The common cold. Lancet 2003, 361, 51–59. [Google Scholar] [CrossRef]
- Du Prel, J.B.; Puppe, W.; Grondahl, B.; Knuf, M.; Weigl, J.A.; Schaaff, F.; Schmitt, H.J. Are meteorological parameters associated with acute respiratory tract infections? Clin. Infect. Dis. 2009, 49, 861–868. [Google Scholar] [CrossRef]
- Price, R.H.M.; Graham, C.; Ramalingam, S. Association between viral seasonality and meteorological factors. Sci Rep. 2019, 9, 929. [Google Scholar] [CrossRef] [PubMed]
- Choe, Y.J.; Smit, M.A.; Mermel, L.A. Seasonality of respiratory viruses and bacterial pathogens. Antimicrob. Resist. Infect. Control. 2019, 8, 125. [Google Scholar] [CrossRef] [PubMed]
- Lofgren, E.; Fefferman, N.H.; Naumov, Y.N.; Gorski, J.; Naumova, E.N. Influenza seasonality: Underlying causes and modeling theories. J. Virol. 2007, 81, 5429–5436. [Google Scholar] [CrossRef]
- Moriyama, M.; Ichinohe, T. High ambient temperature dampens adaptive immune responses to influenza A virus infection. Proc. Natl. Acad. Sci. USA 2019, 116, 3118. [Google Scholar] [CrossRef]
- Branche, A.R.; Falsey, A.R. Respiratory Syncytial Virus Infection in Older Adults: An Under-Recognized Problem. Drugs Aging 2015, 32, 261–269. [Google Scholar] [CrossRef]
- Shah, D.P.; Shah, P.K.; Azzi, J.M.; Chemaly, R.F. Parainfluenza virus infections in hematopoietic cell transplant recipients and hematologic malignancy patients: A systematic review. Cancer Lett. 2016, 370, 358–364. [Google Scholar] [CrossRef] [PubMed]
- Ramsey, C.D.; Kumar, A. Influenza and Endemic Viral Pneumonia. Crit. Care Clin. 2013, 29, 1069–1086. [Google Scholar] [CrossRef] [PubMed]
- Lehners, N.; Tabatabai, J.; Prifert, C.; Wedde, M.; Puthenparambil, J.; Weissbrich, B.; Biere, B.; Schweiger, B.; Egerer, G.; Schnitzler, P. Long-Term Shedding of Influenza Virus, Parainfluenza Virus, Respiratory Syncytial Virus and Nosocomial Epidemiology in Patients with Hematological Disorders. PLoS ONE 2016, 11, e0148258. [Google Scholar] [CrossRef] [PubMed]
- Merow, C.; Urban, M.C. Seasonality and uncertainty in COVID-19 growth rates. medRxiv 2020, 117, 27456–27464. [Google Scholar] [CrossRef] [PubMed]
- Chiyomaru, K.; Takemoto, K. Global COVID-19 transmission rate is influenced by precipitation seasonality and the speed of climate temperature warming. medRxiv 2020. [Google Scholar] [CrossRef]
- Mecenas, P.; Bastos, R.; Vallinoto, A.; Normando, D. Effects of temperature and humidity on the spread of COVID-19: A systematic review. medRxiv 2020. [Google Scholar] [CrossRef]
- Bhattacharjee, S. Statistical investigation of relationship between spread of coronavirus disease (COVID-19) and environmental factors based on study of four mostly affected places of China and five mostly affected places of Italy. arXiv 2020, arXiv:2003.11277. [Google Scholar]
- Lessler, J.; Reich, N.G.; Brookmeyer, R.; Perl, T.M.; Nelson, K.E.; Cummings, D.A.T. Incubation periods of acute respiratory viral infections: A systematic review. Lancet Infect. Dis. 2009, 9, 291–300. [Google Scholar] [CrossRef]
- Virlogeux, V.; Fang, V.J.; Park, M.; Wu, J.T.; Cowling, B.J. Comparison of incubation period distribution of human infections with MERS-CoV in South Korea and Saudi Arabia. Sci. Rep. 2016, 6, 35839. [Google Scholar] [CrossRef]
- Backer, J.A.; Klinkenberg, D.; Wallinga, J. Incubation period of 2019 novel coronavirus (2019-nCoV) infections among travellers from Wuhan, China, 20–28 January 2020. Eurosurveillance 2020, 25, 2000062. [Google Scholar] [CrossRef]
- Lash, T.L. Heuristic Thinking and Inference From Observational Epidemiology. Epidemiology 2007, 18, 67–72. [Google Scholar] [CrossRef] [PubMed]
- Sterne, J.A.; Davey Smith, G. Sifting the evidence-what’s wrong with significance tests? BMJ 2001, 322, 226–231. [Google Scholar] [CrossRef]
- Lau, S.K.P.; Woo, P.C.Y.; Yip, C.C.Y.; Tse, H.; Tsoi, H.-W.; Cheng, V.C.C.; Lee, P.; Tang, B.S.F.; Cheung, C.H.Y.; Lee, R.A.; et al. Coronavirus HKU1 and other coronavirus infections in Hong Kong. J. Clin. Microbiol. 2006, 44, 2063–2071. [Google Scholar] [CrossRef] [PubMed]
- Nickbakhsh, S.; Ho, A.; Marques, D.F.P.; McMenamin, J.; Gunson, R.N.; Murcia, P.R. Epidemiology of Seasonal Coronaviruses: Establishing the Context for the Emergence of Coronavirus Disease 2019. J. Infect. Dis. 2020, 222, 17–25. [Google Scholar] [CrossRef] [PubMed]
- Van der Vries, E.; Stittelaar, K.J.; van Amerongen, G.; Veldhuis Kroeze, E.J.; de Waal, L.; Fraaij, P.L.; Meesters, R.J.; Luider, T.M.; van der Nagel, B.; Koch, B.; et al. Prolonged influenza virus shedding and emergence of antiviral resistance in immunocompromised patients and ferrets. PLoS Pathog. 2013, 9, e1003343. [Google Scholar] [CrossRef]
- Man, Z.; Jing, Z.; Huibo, S.; Bin, L.; Fanjun, Z. Viral shedding prolongation in a kidney transplant patient with COVID-19 pneumonia. Am. J. Transplant. 2020, 9, 2626–2627. [Google Scholar] [CrossRef] [PubMed]
- Vega, E.; Donaldson, E.; Huynh, J.; Barclay, L.; Lopman, B.; Baric, R.; Chen, L.F.; Vinjé, J. RNA Populations in Immunocompromised Patients as Reservoirs for Novel Norovirus Variants. J. Virol. 2014, 88, 14184. [Google Scholar] [CrossRef] [PubMed]
- Chan, K.H.; Peiris, J.S.M.; Lam, S.Y.; Poon, L.L.M.; Yuen, K.Y.; Seto, W.H. The Effects of Temperature and Relative Humidity on the Viability of the SARS Coronavirus. Adv. Virol. 2011, 2011, 734690. [Google Scholar] [CrossRef]
- Sagripanti, J.-L.; Lytle, C.D. Inactivation of Influenza Virus by Solar Radiation. Photochem. Photobiol. 2007, 83, 1278–1282. [Google Scholar] [CrossRef]
- Darnell, M.E.R.; Subbarao, K.; Feinstone, S.M.; Taylor, D.R. Inactivation of the coronavirus that induces severe acute respiratory syndrome, SARS-CoV. J. Virol. Methods 2004, 121, 85–91. [Google Scholar] [CrossRef]
- Marr, L.C.; Tang, J.W.; Van Mullekom, J.; Lakdawala, S.S. Mechanistic insights into the effect of humidity on airborne influenza virus survival, transmission and incidence. J. R. Soc. Interface 2019, 16, 20180298. [Google Scholar] [CrossRef] [PubMed]
- Eccles, R. An Explanation for the Seasonality of Acute Upper Respiratory Tract Viral Infections. Acta Oto-Laryngol. 2002, 122, 183–191. [Google Scholar] [CrossRef]
- Salah, B.; Dinh Xuan, A.T.; Fouilladieu, J.L.; Lockhart, A.; Regnard, J. Nasal mucociliary transport in healthy subjects is slower when breathing dry air. Eur. Respir. J. 1988, 1, 852–855. [Google Scholar] [PubMed]
- Yang, W.; Elankumaran, S.; Marr, L.C. Relationship between humidity and influenza A viability in droplets and implications for influenza’s seasonality. PLoS ONE 2012, 7, e46789. [Google Scholar] [CrossRef] [PubMed]
- Smith, G.S.; Messier, K.P.; Crooks, J.L.; Wade, T.J.; Lin, C.J.; Hilborn, E.D. Extreme precipitation and emergency room visits for influenza in Massachusetts: A case-crossover analysis. Environ. Health 2017, 16, 108. [Google Scholar] [CrossRef]
- Hayashi, O.; Kikuchi, M. Time relationship between ambient temperature change and antigen stimulation on immune responses of mice. Int. J. Biometeorol. 1989, 33, 19–23. [Google Scholar] [CrossRef]


Publisher’s Note: MDPI stays neutral with regard to jurisdictional claims in published maps and institutional affiliations. |
© 2021 by the authors. Licensee MDPI, Basel, Switzerland. This article is an open access article distributed under the terms and conditions of the Creative Commons Attribution (CC BY) license (http://creativecommons.org/licenses/by/4.0/).
Share and Cite
Anastasiou, O.E.; Hüsing, A.; Korth, J.; Theodoropoulos, F.; Taube, C.; Jöckel, K.-H.; Stang, A.; Dittmer, U. Seasonality of Non-SARS, Non-MERS Coronaviruses and the Impact of Meteorological Factors. Pathogens 2021, 10, 187. https://doi.org/10.3390/pathogens10020187
Anastasiou OE, Hüsing A, Korth J, Theodoropoulos F, Taube C, Jöckel K-H, Stang A, Dittmer U. Seasonality of Non-SARS, Non-MERS Coronaviruses and the Impact of Meteorological Factors. Pathogens. 2021; 10(2):187. https://doi.org/10.3390/pathogens10020187
Chicago/Turabian StyleAnastasiou, Olympia E., Anika Hüsing, Johannes Korth, Fotis Theodoropoulos, Christian Taube, Karl-Heinz Jöckel, Andreas Stang, and Ulf Dittmer. 2021. "Seasonality of Non-SARS, Non-MERS Coronaviruses and the Impact of Meteorological Factors" Pathogens 10, no. 2: 187. https://doi.org/10.3390/pathogens10020187
APA StyleAnastasiou, O. E., Hüsing, A., Korth, J., Theodoropoulos, F., Taube, C., Jöckel, K.-H., Stang, A., & Dittmer, U. (2021). Seasonality of Non-SARS, Non-MERS Coronaviruses and the Impact of Meteorological Factors. Pathogens, 10(2), 187. https://doi.org/10.3390/pathogens10020187