Introduction of New Food Products in China: Is There a Trend towards Healthier and Safer Products?


Abstract
:1. Introduction
- To identify whether, through launching new products, over time retailers and manufacturers were improving the assortment of products with health and food safety attributes available to consumers; in this regard, whether they could be considered ‘agents of change’ towards healthier patterns of consumption.
- To discover which companies were leading the introduction of new products making health and food safety claims and in what categories.
- To explore whether foreign retailers and manufacturers played a significant role in the introduction of food and drink products with health and food safety attributes.
2. The Role of Suppliers in Shaping Consumers’ Grocery Purchasing Decisions
3. Material and Methods
3.1. Data
3.2. Methods
4. Results
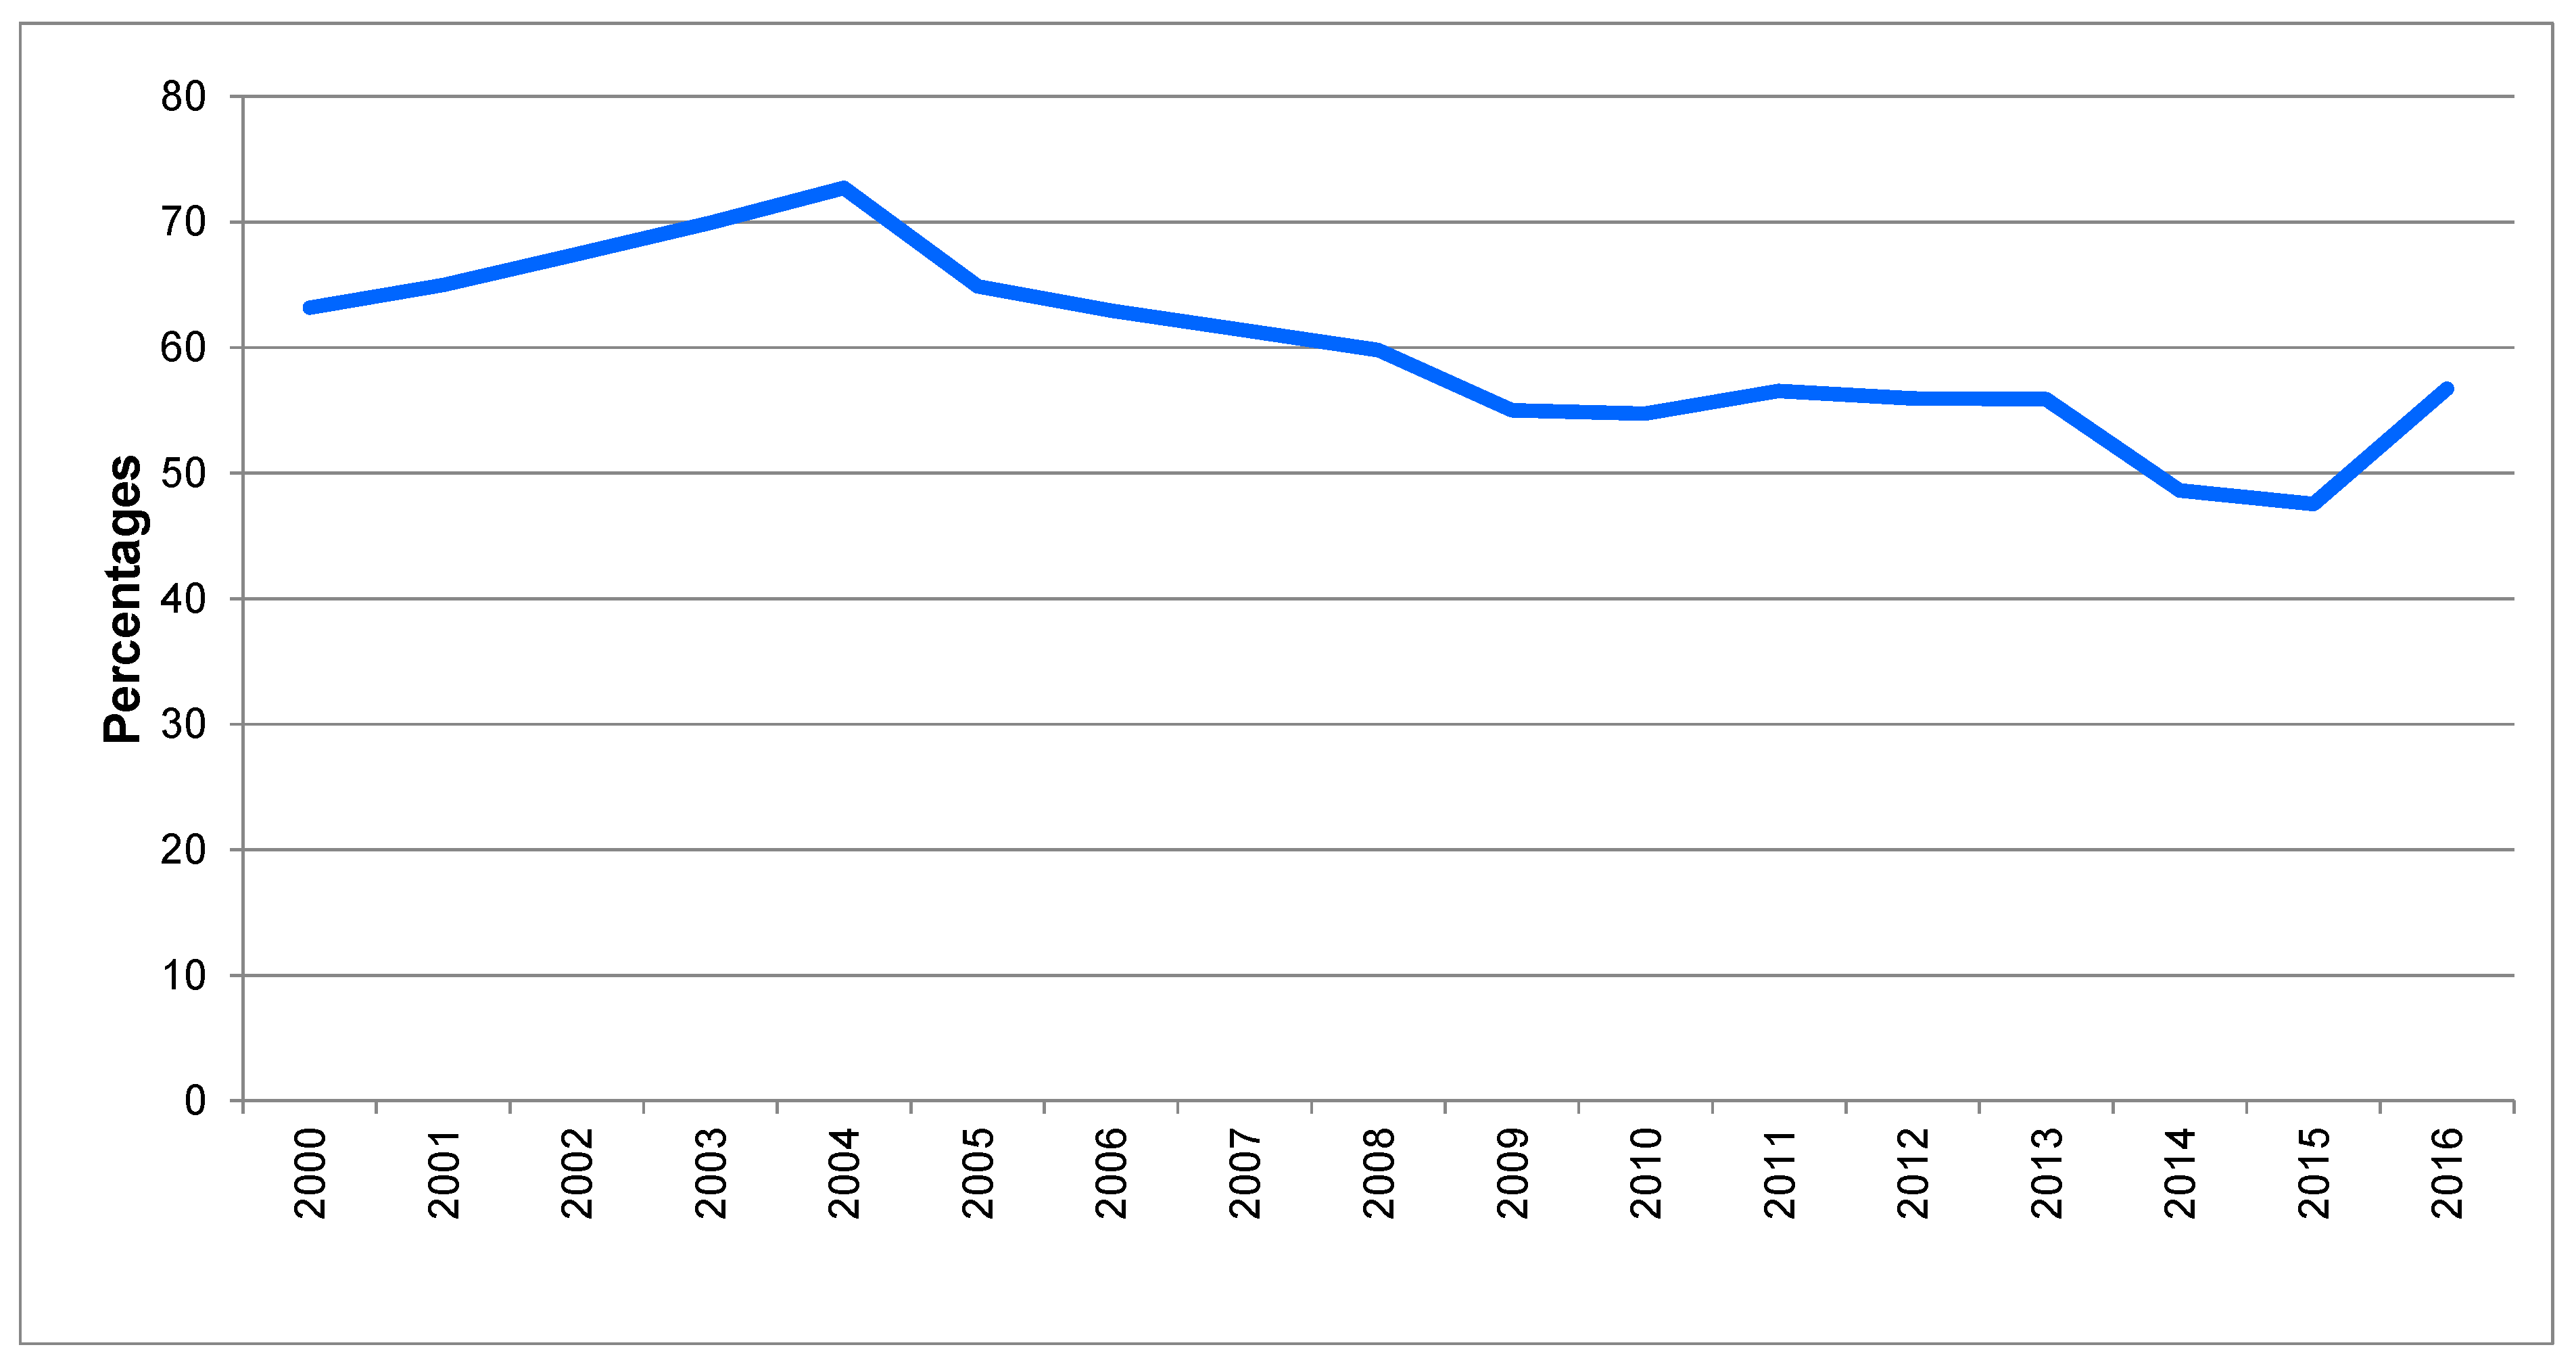
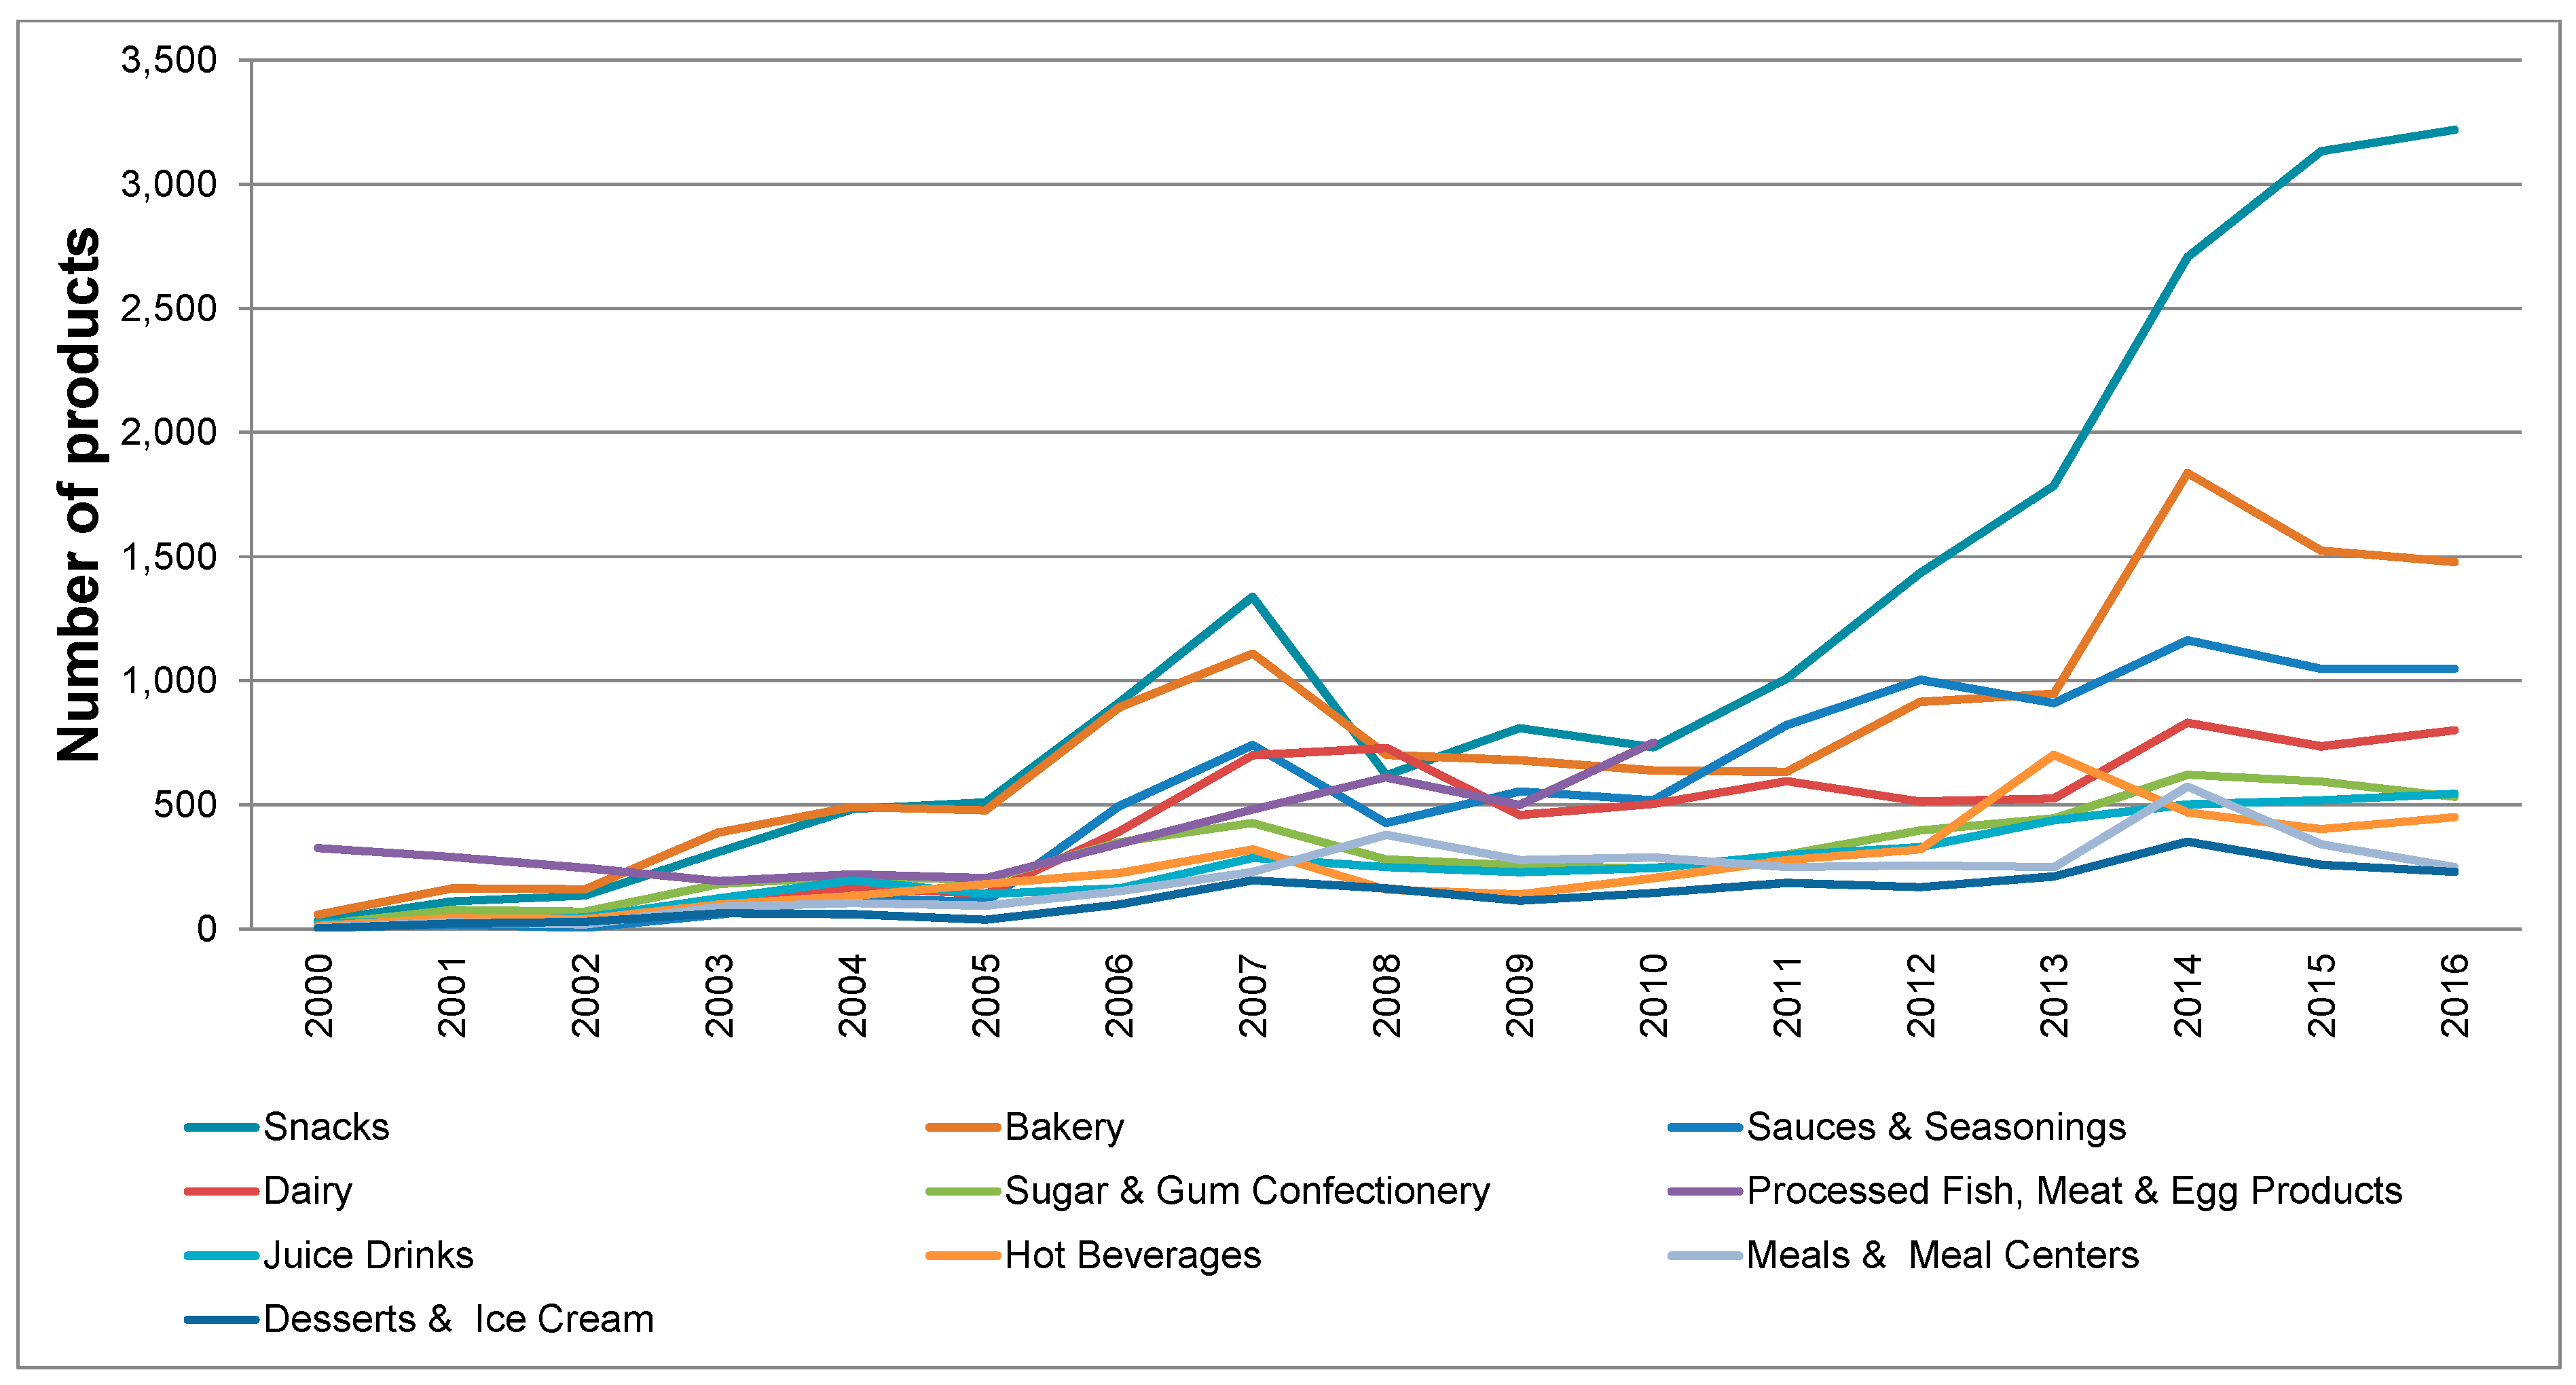
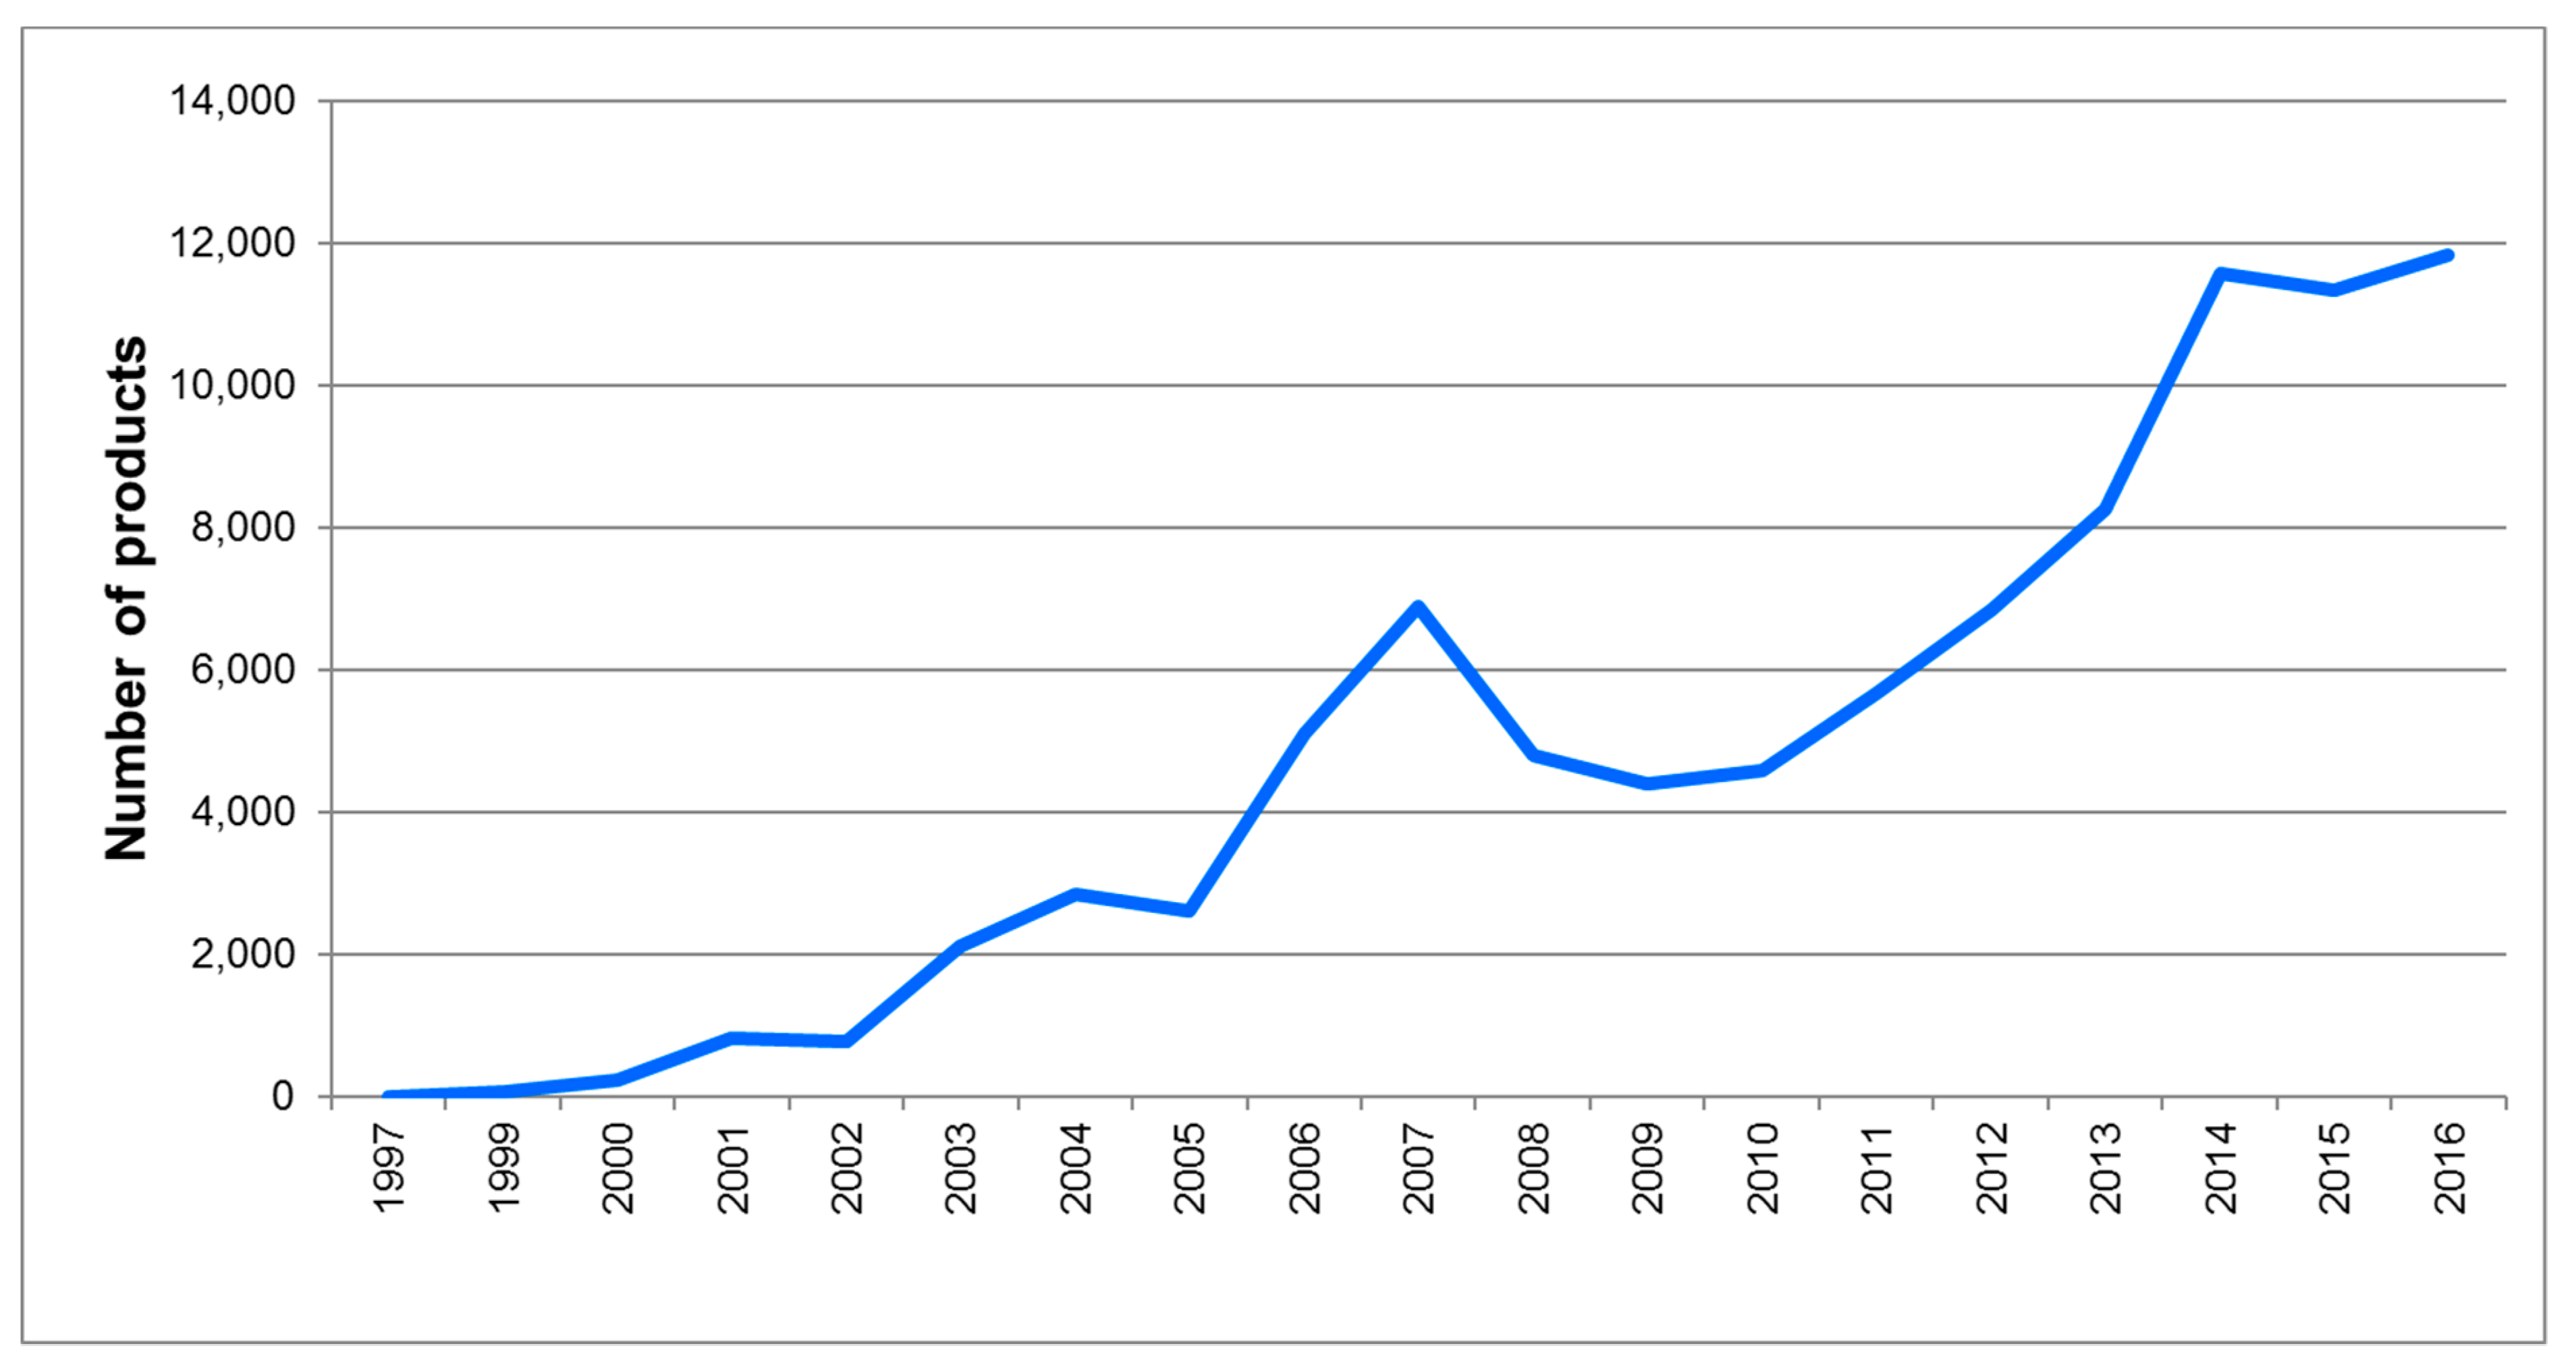
4.1. Overview of the Launching of New Food and Drink Products in China
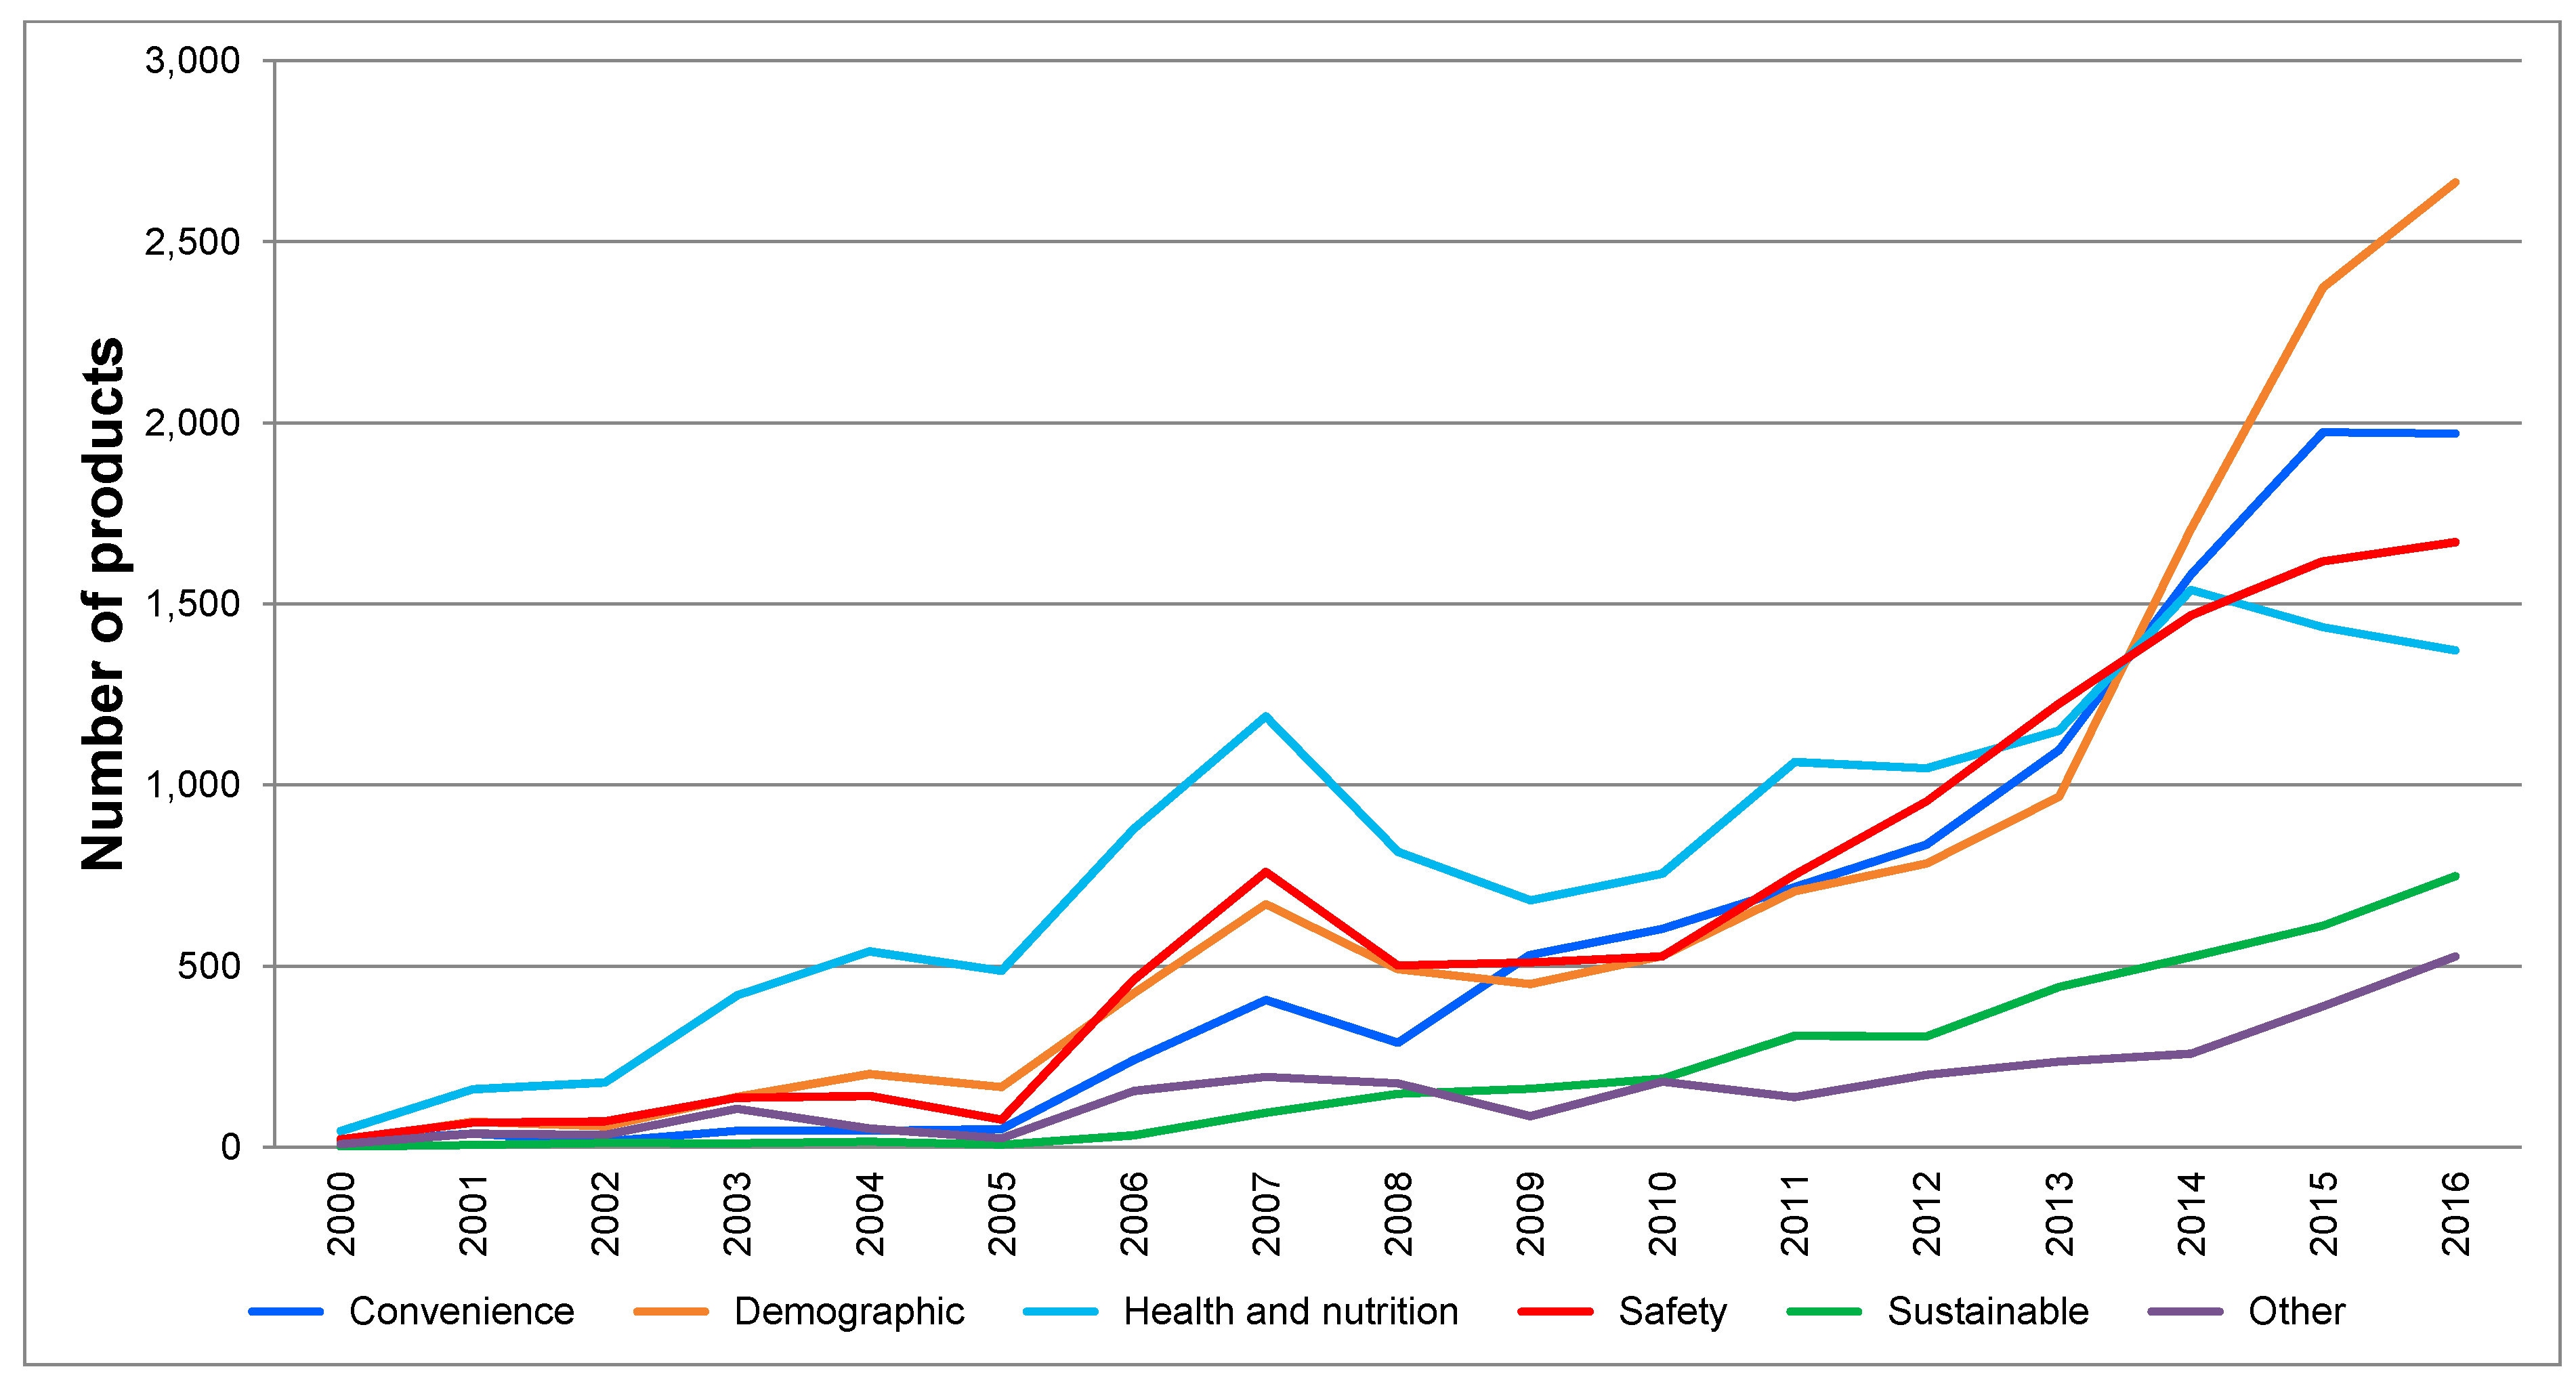
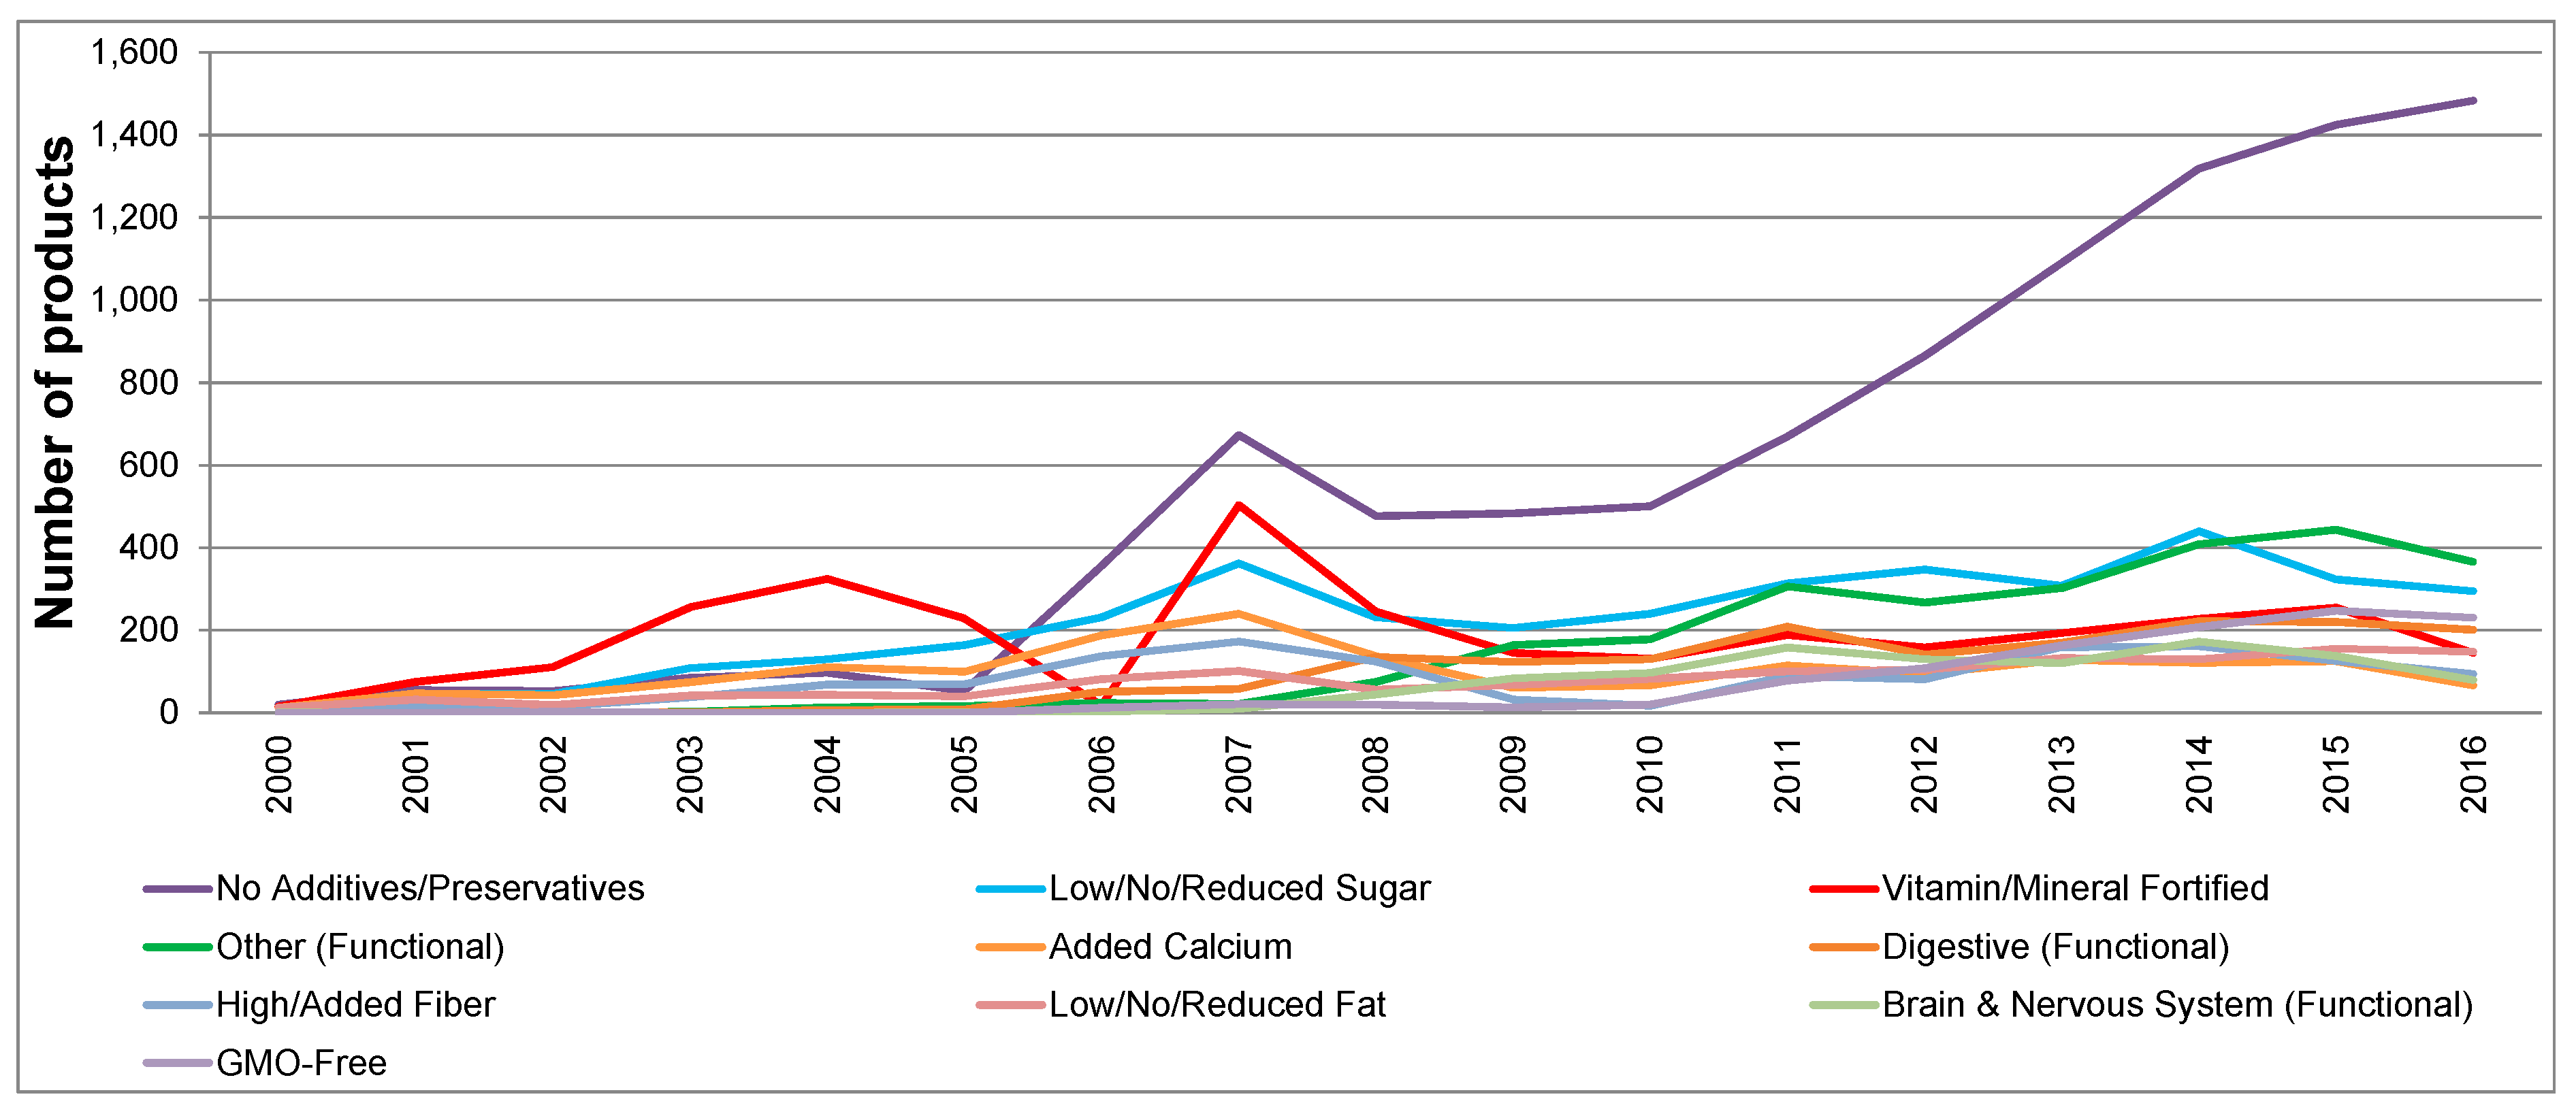
4.2. Trends in the Launching of Products Making Health, Nutritional, and Food Safety Claims
4.3. Major Companies Introducing Products with Health, Nutritional and Food Safety Claims
5. Conclusions
Author Contributions
Funding
Conflicts of Interest
References
- Alick, Zhou. 2016. Trends in Food, Beverage & Consumer Insights in China 2016. Ipsos China. Available online: https://www.ipsos.com/sites/default/files/2016-06/024.2-Food-beverage-consumer-trends-insights-china.pdf (accessed on 4 February 2019).
- Baker, Phillip, and Sharon Friel. 2016. Food systems transformations, ultra-processed food markets and the nutrition transition in Asia. Globalization and Health 12: 80. [Google Scholar] [CrossRef] [PubMed]
- Bava, Christina M., Sara R. Jaeger, and John Dawson. 2009. In store influences on consumers’ grocery purchasing decisions: A qualitative investigation. Journal of Consumer Behaviour 8: 221–36. [Google Scholar] [CrossRef]
- Chassaing, Benoit, Omry Koren, Julia K. Goodrich, Angela C. Poole, Shanthi Srinivasan, Ruth E. Ley, and Andrew T. Gewirtz. 2015. Dietary emulsifiers impact the mouse gut microbiota promoting colitis and metabolic syndrome. Naturen 519: 92–96. [Google Scholar] [CrossRef] [PubMed]
- Cheng, Michael. 2017. eCommerce in China—The Future Is Already Here. p. 37. Available online: https://www.pwccn.com/en/retail-and-consumer/publications/total-retail-2017-china/total-retail-survey-2017-china-cut.pdf (accessed on 20 November 2018).
- Dawson, John. 2013. Retailer activity in shaping food choice. Food Quality and Preference 28: 339–47. [Google Scholar] [CrossRef]
- Dawson, John, David Marshall, Matt Taylor, Steven Cummins, Leigh Sparks, and Annie S. Anderson. 2008. Accessing healthy food: Availability and price of a healthy food basket in Scotland. Journal of Marketing Management 24: 893–913. [Google Scholar] [CrossRef]
- Fiolet, Thibault, Bernard Srour, Laury Sellem, Emmanuelle Kesse-Guyot, Benjamin Allès, Caroline Méjean, and Mélanie Deschasaux. 2018. Consumption of ultra-processed foods and cancer risk: Results from NutriNet-Sante prospective cohort. BMJ 360: k322. [Google Scholar] [CrossRef]
- Gale, Fred, and Reardon Thomas. 2005. China’s Supermarkets Present Export Opportunity. Asia Times Online. Available online: http://www.atimes.com/atimes/China/GF24Ad02.html (accessed on 10 May2018).
- Gale, H. Frederick, James Hansen, and Michael Jewison. 2015. China’s Growing Demand for Agricultural Imports. USDA Economic Information Bulletin 136: 1–32. [Google Scholar]
- Gomez, Miguel I., and Katie D. Ricketts. 2013. Food value chain transformations in developing countries: Selected hypotheses on nutritional implications. Food Policy 42: 139–50. [Google Scholar] [CrossRef]
- Gordon-Larsen, Penny, Huijun Wang, and Barry M. Popkin. 2014. Overweight dynamics in Chinese children and adults. Obesity Reviews 15: 37–48. [Google Scholar] [CrossRef]
- Grunert, Klaus G., Simone Mueller Loose, Yanfeng Zhou, and Søren Tinggaard. 2015. Extrinsic and intrinsic quality cues in Chinese consumers’ purchase of pork ribs. Food Quality and Preference 42: 37–47. [Google Scholar] [CrossRef]
- Hawkes, Corinna. 2008. Agro-food industry growth and obesity in China: What role for regulating food advertising and promotion and nutrition labelling? Obesity Reviews 9: 151–61. [Google Scholar] [CrossRef] [PubMed]
- Hawkes, Corinna, and Marie T. Ruel. 2011. Value Chains for Nutrition. 2020 Conference Brief 4. Available online: http://ebrary.ifpri.org/utils/getfile/collection/p15738coll2/id/124831/filename/124832.pdf (accessed on 10 November 2018).
- Hu, Dinghuan, Thomas Reardon, Scott Rozelle, Peter Timmer, and Honglin Wang. 2004. The Emergence of Supermarkets with Chinese Characteristics: Challenges and Opportunities for China’s Agricultural Development. Development Policy Review 22: 557–86. [Google Scholar] [CrossRef]
- Ipsos. 2014. What Are People Eating? Available online: http://www.arastirmakutuphanesi.com/wp-content/uploads/2014/11/Ipsos-MORI-Food-Trends-in-Context-October-2014.pdf (accessed on 26 June 2018).
- Lam, Hon-Ming, Justin Remais, Ming-Chiu Fung, Liqing Xu, and Samuel Sai-Ming Sun. 2013. Food supply and food safety issues in China. The Lancet 381: 2044–53. [Google Scholar] [CrossRef]
- Li, Linyue, Thomas D. Willett, and Nan Zhang. 2012. The effects of the global financial crisis on China’s financial market and macroeconomy. Economics Research International 2012: 961694. [Google Scholar] [CrossRef]
- Liu, Zhen, Maarten A. Jongsma, Caicheng Huang, Hans Dons, and Onno Omtaf. 2014. Key Success Factors of Innovation Projects of Vegetable Breeding Companies in China. International Food and Agribusiness Management Review 17: 177–204. [Google Scholar]
- Liu, Rongduo, Christine Hoefkens, and Wim Verbeke. 2015. Chinese consumers’ understanding and use of a food nutrition label and their determinants. Food Quality and Preference 41: 103–11. [Google Scholar] [CrossRef]
- Lupton, Robert A., David R. Rawlinson, and Lori A. Braunstein. 2010. Private label branding in China: What do US and Chinese students think? Journal of Consumer Marketing 27: 104–13. [Google Scholar] [CrossRef]
- Machín, Leandro, Jessica Aschemann-Witzel, María Rosa Curutchet, Ana Giménez, and Gastón Ares. 2018. Does front-of-pack nutrition information improve consumer ability to make healthful choices? Performance of warnings and the traffic light system in a simulated shopping experiment. Appetite 121: 55–62. [Google Scholar]
- Martinez, Olivia, Noemi Rodriguez, Alison Mercurio, Marie Bragg, and Brian Elbel. 2018. Supermarket retailer’s prespectives on healthy food retail strategies: In-depth interviews. BMC Public Health 18: 1019. [Google Scholar] [CrossRef]
- Mayer, Wolfgang, and Saul Pleeter. 1975. A theoretical justification for the use of location quotients. Regional Science and Urban Economics 5: 343–55. [Google Scholar] [CrossRef]
- Mintel. 2013. China Retailing Report. London: Mintel. [Google Scholar]
- Mintel. 2016. Altitudies towards Private Lables—China—March 2016: Contents. Available online: http://reports.mintel.com/display/768420/?__cc=1 (accessed on 11 July 2018).
- Monteiro, Carlos A., Jean Claude Moubarac, Geoffrey Cannon, Shu Wen Ng, and Barry Popkin. 2013. Ultra-processed products are becoming dominant in the global food system. Obesity Reviews 14: 21–28. [Google Scholar] [CrossRef] [PubMed]
- Ortega, David, Colin G. Brown, Scott A. Waldron, and Holly Wang. 2014. Agricultural marketing and food safety in China: A utility perspective. Journal of Agribusiness in Developing and Emerging Economies 4: 23–31. [Google Scholar] [CrossRef]
- Popkin, Barry M. 2014. Nutrition, agriculture and the global food system in low and middle income countries. Food Policy 47: 91–96. [Google Scholar] [CrossRef] [PubMed]
- Popkin, Barry M., and W. R. Kenan Jr. 2016. Preventing type 2 diabetes: Changing the food industry. Best Practice & Research Clinical Endocrinology & Metabolism 30: 373–83. [Google Scholar]
- Reardon, Thomas, and Rose Hopkins. 2006. The Supermarket Revolution in Developing Countries: Policies to Address Emerging Tensions among Supermarkets, Suppliers, and Traditional Retailers. European Journal of Development Research 18: 522–45. [Google Scholar] [CrossRef]
- Reardon, Thomas, and Johan F. M. Swinnen. 2004. Agrifood sector liberalization and the rise of supermarkets in former state-controlled economies: A comparative overview. Development Policy Review 22: 515–23. [Google Scholar] [CrossRef]
- Revoredo-Giha, Cesar. 2014. Hitting the Jackpot and the Health Agenda: The Case of Processed Potato Products. Procedia Economics and Finance 14: 525–33. [Google Scholar] [CrossRef]
- Shang, Xian Wen, Ai Ling Liu, Qian Zhang, Xiao Qi Hu, Song Ming Du, M. A. Jun, and Gui Fa Xu. 2012. Report on childhood obesity in China (9): Sugar-sweetened beverages consumption and obesity. Biomedical and Environmental Sciences 25: 125–32. [Google Scholar] [PubMed]
- Si, Zhenzhong, Steffanie Scott, and Cameron McCordic. 2016. Supermarkets, Wet Markets and Food Patronage in Nanjing, China. Discussion Papers, Hungry Cities Partenership. Available online: http://hungrycities.net/wp-content/uploads/2016/09/HCP-Discussion-Paper-No.-4.pdf (accessed on 12 October 2017).
- Smith, B. Gail. 2008. Developing sustainable food supply chains. Philosophical Transactions of the Royal Society B 363: 849–61. [Google Scholar] [CrossRef] [PubMed]
- Talukdar, Debabrata, K. Sudhir, and Andrew Ainslie. 2002. Investigating new product diffusion across products and countries. Marketing Science 21: 97–114. [Google Scholar] [CrossRef]
- The Lancet. 2014. China’s food safety: A continuing global problem. The Lancet 384. [Google Scholar] [CrossRef]
- USDA. 2017. Annual Retail Foods Report—China. Available online: https://gain.fas.usda.gov/Recent GAIN Publications/Retail Foods_Beijing ATO_China—Peoples Republic of_1-26-2017.pdf (accessed on 9 August 2018).
- USDA. 2018. Change and Opportunity. Available online: https://gain.fas.usda.gov/Recent%20GAIN%20Publications/Retail%20Foods_Beijing%20ATO_China%20-%20Peoples%20Republic%20of_8-17-2018.pdf (accessed on 3 February 2019).
- Xu, Jiazhe, Rong Huang, and Yingchao Ji. 2018. Private Labels in China—Case Studies of RT-Mart and ICA. Available online: http://hb.diva-portal.org/smash/get/diva2:1201139/FULLTEXT01.pdf (accessed on 20 December 2018).
- Zhai, Fengying, Du Shufa, Wang Huijun, Jiajie Zhang, Du Wen-Wen, and Barry M. Popkin. 2014. Dynamics of the Chinese diet and the role of urbanicity, 1991–2011. Obesity Reviews 15: 16–26. [Google Scholar] [CrossRef] [PubMed]
- Zhou, Yijing, Shufa Du, Chang Su, Bing Zhang, Huijun Wang, and Barry M. Popkin. 2015. The food retail revolution in China and its association with diet and health. Food Policy 55: 92–100. [Google Scholar] [CrossRef] [PubMed]
| 1. | The classification of claims was done as follows: for the case of health claims following European Commission Nutrition and Health Claims’ definition (claims relating to the growth, development and functions of the body; referring to psychological and behavioural functions; on slimming or weight-control; reducing a risk factor in the development of a disease; and referring to children’s development), and for the safety claims, we considered those claims that differentiated the product with the intention to precaution a safety. |


| Product Category | Frequencies | |
|---|---|---|
| Absolute | Relative (%) | |
| Snacks | 19,282 | 21.25 |
| Bakery | 13,100 | 14.44 |
| Sauces and seasonings | 9045 | 9.97 |
| Dairy | 7298 | 8.04 |
| Sugar and gum confectionery | 5200 | 5.73 |
| Processed fish, meat, and egg products | 4649 | 5.12 |
| Juice drinks | 4374 | 4.82 |
| Hot beverages | 4178 | 4.61 |
| Meals and meal centers | 3577 | 3.94 |
| Desserts and ice cream | 2334 | 2.57 |
| Fruit and vegetables | 2059 | 2.27 |
| Baby food | 1907 | 2.10 |
| Breakfast cereals | 1744 | 1.92 |
| Alcoholic beverages | 1653 | 1.82 |
| Chocolate confectionery | 1636 | 1.80 |
| Side dishes | 1506 | 1.66 |
| Other beverages | 1363 | 1.50 |
| RTDs | 1320 | 1.46 |
| Water | 1097 | 1.21 |
| Sweet spreads | 941 | 1.04 |
| Carbonated soft drinks | 839 | 0.92 |
| Soup | 532 | 0.59 |
| Sports and energy drinks | 504 | 0.56 |
| Sweeteners and sugar | 488 | 0.54 |
| Savoury spreads | 94 | 0.10 |
| Total | 90,720 | 100.00 |
| Claims | Claim | Frequencies | |
|---|---|---|---|
| Group | Absolute | Relative (%) | |
| No additives/preservatives | Food safety | 9705 | 27.11 |
| Low/no/reduced sugar | Health and nutrition | 3802 | 10.62 |
| Vitamin/mineral fortified | Health and nutrition | 3603 | 10.06 |
| Other (functional) | Health and nutrition | 2591 | 7.24 |
| Added calcium | Health and nutrition | 1724 | 4.82 |
| Digestive (functional) | Health and nutrition | 1669 | 4.66 |
| High/added fiber | Health and nutrition | 1400 | 3.91 |
| Low/no/reduced fat | Health and nutrition | 1344 | 3.75 |
| GMO-free | Food safety | 1121 | 3.13 |
| Brain and nervous system (functional) | Health and nutrition | 1034 | 2.89 |
| Bone health | Health and nutrition | 936 | 2.61 |
| Prebiotic | Health and nutrition | 813 | 2.27 |
| High protein | Health and nutrition | 806 | 2.25 |
| All natural product | Food safety | 759 | 2.12 |
| Low/no/reduced cholesterol | Health and nutrition | 692 | 1.93 |
| Low/no/reduced transfat | Health and nutrition | 500 | 1.40 |
| Immune system (functional) | Health and nutrition | 495 | 1.38 |
| Low/no/reduced calorie | Health and nutrition | 479 | 1.34 |
| Low/no/reduced sodium | Health and nutrition | 364 | 1.02 |
| Antioxidant | Health and nutrition | 348 | 0.97 |
| Cardiovascular (functional) | Health and nutrition | 292 | 0.82 |
| Low/no/reduced allergen | Health and nutrition | 266 | 0.74 |
| Wholegrain | Health and nutrition | 262 | 0.73 |
| Hormone-free | Food safety | 134 | 0.37 |
| Low/no/reduced lactose | Health and nutrition | 119 | 0.33 |
| Gluten-free | Health and nutrition | 118 | 0.33 |
| Diabetic | Health and nutrition | 114 | 0.32 |
| Anti-ageing | Health and nutrition | 104 | 0.29 |
| Caffeine-free | Health and nutrition | 80 | 0.22 |
| Low/no/reduced saturated fat | Health and nutrition | 62 | 0.17 |
| Stanols/sterols | Health and nutrition | 56 | 0.16 |
| Low/no/reduced glycemic | Health and nutrition | 6 | 0.02 |
| Low/no/reduced carb | Health and nutrition | 5 | 0.01 |
| Total | 35,803 | 100.0 | |
| All Natural | GMO-Free | Hormone-Free | No Additives | Added Calcium | Anti-Ageing | Antioxidant | Bone Health | |
| β (SD) | β (SD) | β (SD) | β (SD) | β (SD) | β (SD) | β (SD) | β (SD) | |
| Snacks | 0.02 (0.01) ** | 0.02 (0.01) * | 0.03 (0.01) ** | 0.02 (0.01) ** | ||||
| Bakery | 0.01 (0.01) * | 0.07 (0.02) ** | ||||||
| Sauces and Seasonings | 0.49 (0.05) ** | 0.04 (0.02) ** | 0.07 (0.04) * | 0.04 (0.02) * | ||||
| Dairy | 0.09 (0.04) ** | 0.09 (0.03) ** | 0.16 (0.07) ** | 0.19 (0.09) ** | 0.34 (0.08) ** | |||
| Sugar and Gum Confectionery | 0.05 (0.02) ** | 0.01 (0.00) ** | 0.05 (0.02) ** | 0.02 (0.01) ** | ||||
| Processed Fish, Meat, and Egg Products | 0.06 (0.02) ** | 0.30 (0.13) ** | ||||||
| Hot Beverages | 0. 02 (0.01) * | 0.09 (0.03) ** | 0.24 (0.13) * | 0.12 (0.06) * | ||||
| Juice Drinks | −0.20 (0.06) ** | 0.18 (0.03) ** | 0.06 (0.03) ** | 0.18 (0.09) * | ||||
| Meals and Meal Centers | ||||||||
| Desserts and Ice Cream | 0.01 (0.00) ** | −0.05 (0.02) ** | ||||||
| Breakfast Cereals | −0.21 (0.08) ** | 0.09 (0.02) ** | 0.18 (0.05) ** | 0.31 (0.13) ** | 0.27 (0.12) ** | |||
| Fruit and Vegetables | 0.06 (0.02) ** | 0.16 (0.04) ** | 0.06 (0.03) ** | 0.62 (0.24) ** | 0.48 (0.19) ** | |||
| Baby Food | 0.17 (0.09) * | 0.66 (0.15) ** | 0.71 (0.15) ** | |||||
| Chocolate Confectionery | 0.01 (0.01) * | 0.02 (0.01) ** | ||||||
| Alcoholic Beverages | ||||||||
| Other Beverages | 0.07 (0.03) ** | 0.33 (0.15) ** | 0.22 (0.12) * | |||||
| RTDs | 0.04 (0.02) * | 0.98 (0.36) ** | 0.25 (0.10) ** | |||||
| Side Dishes | ||||||||
| Water | −0.23 (0.11) ** | 0.03 (0.01) ** | 0.10 (0.05) ** | |||||
| Sweet Spreads | 0.01 (0.0) * | 0.08 (0.04) * | ||||||
| Carbonated Soft Drinks | 0.03 (0.01) ** | |||||||
| Soup | 0.07 (0.04) * | |||||||
| Sweeteners and Sugar | 0.07 (0.02) ** | 0.36 (0.17) ** | ||||||
| Sports and Energy Drinks | ||||||||
| Brain System | Caffeine-Free | Cardiovascular | Diabetic | Digestive | Gluten-Free | High Protein | High Satiety | |
| β (SD) | β (SD) | β (SD) | β (SD) | β (SD) | β (SD) | β (SD) | β (SD) | |
| Snacks | 0.01 (0.01) ** | 0.05 (0.02) ** | 0.02 (0.00) ** | 0.10 (0.03) ** | ||||
| Bakery | 0.01 (0.00) ** | 0.03 (0.01) ** | −0.20 (0.11) * | |||||
| Sauces and Seasonings | 0.01 (0.01) ** | 0.17 (0.06) ** | 0.01 (0.00) ** | 0.02 (0.01) ** | ||||
| Dairy | 0.21 (0.10) ** | 0.08 (0.03) ** | ||||||
| Sugar and Gum Confectionery | 0.05 (0.01) ** | 0.02 (0.01) ** | 0.26 (0.09) ** | |||||
| Processed Fish, Meat, and Egg Products | 0.03 (0.01) * | |||||||
| Hot Beverages | 0.09 (0.03) ** | |||||||
| Juice Drinks | 0.07 (0.02) ** | 0.08 (0.04) ** | 0.07 (0.02) ** | |||||
| Meals and Meal Centers | 0.03 (0.02) * | |||||||
| Desserts and Ice Cream | 0.06 (0.03) ** | |||||||
| Breakfast Cereals | 0.24 (0.10) ** | −0.28 (0.14) * | ||||||
| Fruit and Vegetables | 0.77 (0.29) ** | 0.09 (0.04) * | 0.46 (0.16) ** | 0.10 (0.04) ** | ||||
| Baby Food | 1.30 (0.52) ** | 0.33 (0.13) ** | 1.38 (0.69) * | 1.09 (0.24) ** | ||||
| Chocolate Confectionery | 0.01 (0.01) * | 0.08 (0.04) * | ||||||
| Alcoholic Beverages | 79.91 (21.65) ** | |||||||
| Other Beverages | −1.13 (0.38) ** | |||||||
| RTDs | 0.07 (0.03) ** | 0.12 (0.06) * | 0.08 (0.04) * | |||||
| Side Dishes | ||||||||
| Water | 0.04 (0.02) * | |||||||
| Sweet Spreads | 0.15 (0.06) ** | |||||||
| Carbonated Soft Drinks | ||||||||
| Soup | 0.35 (0.18) * | 0.14 (0.05) ** | ||||||
| Sweeteners and Sugar | 0.16 (0.09) * | 2.93 (1.40) * | ||||||
| Sports and Energy Drinks | ||||||||
| High or Added | Immune | Low or No | Low or No | Low or No | Low or No | Low or No | Low or No | |
| System | Allergen | Calorie | Cholesterol | Fat | Lactose | Saturated fat | ||
| β (SD) | β (SD) | β (SD) | β (SD) | β (SD) | β (SD) | β (SD) | β (SD) | |
| Snacks | 0.03 (0.01) ** | 0.06 (0.02) ** | ||||||
| Bakery | 0.12 (0.07) * | 0.03 (0.01) ** | ||||||
| Sauces and Seasonings | 0.02 (0.01) ** | 0.13 (0.04) ** | ||||||
| Dairy | 0.11 (0.05) ** | 0.17 (0.07) ** | 0.42 (0.14) ** | |||||
| Sugar and Gum Confectionery | 0.13 (0.05) ** | |||||||
| Processed Fish, Meat & Egg Products | 0.02 (0.01) ** | 0.01 (0.01) * | ||||||
| Hot Beverages | 0.05 (0.02) ** | |||||||
| Juice Drinks | 0.02 (0.01) ** | |||||||
| Meals and Meal Centers | 0.01 (0.01) * | |||||||
| Desserts and Ice Cream | 0.06 (0.02) ** | |||||||
| Breakfast Cereals | −0.22 (0.08) ** | |||||||
| Fruit and Vegetables | 0.19 (0.07) ** | 0.92 (0.36) ** | 0.23 (0.10) ** | 0.46 (0.18) ** | ||||
| Baby Food | 0.72 (0.25) ** | 1.63 (0.60) ** | 0.76 (0.27) ** | 0.24 (0.11) ** | 0.63 (0.28) ** | |||
| Chocolate Confectionery | 0.04 (0.02) * | |||||||
| Alcoholic Beverages | 0.01 (0.01) * | |||||||
| Other Beverages | −1.58 (0.67) ** | |||||||
| RTDs | 0.11 (0.03) ** | 0.07 (0.03) ** | 0.09 (0.04) ** | 0.11 (0.06) * | ||||
| Side Dishes | 0.25 (0.11) ** | |||||||
| Water | 0.39 (0.20) * | |||||||
| Sweet Spreads | 0.07 (0.03) ** | |||||||
| Carbonated Soft Drinks | ||||||||
| Soup | ||||||||
| Sweeteners and Sugar | 0.09 (0.05) * | |||||||
| Sports and Energy Drinks | ||||||||
| Low or No | Low or No | Low or No | Other | Prebiotic | Sliming | Vitamin/ | Wholegrain | |
| Sodium | Sugar | Trans Fat | (Functional) | Fortified | ||||
| β (SD) | β (SD) | β (SD) | β (SD) | β (SD) | β (SD) | β (SD) | β (SD) | |
| Snacks | −0.02 (0.01) ** | 0.03 (0.01) ** | 0.07 (0.02) ** | −0.02 (0.01) ** | ||||
| Bakery | 0.04 (0.01) ** | −0.04 (0.01) ** | ||||||
| Sauces and Seasonings | 0.21 (0.12) * | 0.16 (0.06) ** | 0.01 (0.01) * | 0.01 (0.01) * | 0.029 (0.01) ** | |||
| Dairy | 0.05 (0.02) ** | 0.09 (0.04) ** | 0.06 (0.03) ** | |||||
| Sugar and Gum Confectionery | 0.18 (0.04) ** | 0.07 (0.01) ** | 0.34 (0.10) ** | 0.05 (0.01) ** | ||||
| Processed Fish, Meat, and Egg Products | 0.02 (0.01) * | 0.01 (0.01) * | 0.03 (0.01) ** | |||||
| Hot Beverages | 0.09 (0.03) ** | 0.11 (0.04) ** | 0.17 (0.09) * | |||||
| Juice Drinks | 0.14 (0.07) * | 0.09 (0.04) ** | 0.12 (0.05) ** | 0.14 (0.02) ** | 0.10 (0.04) ** | |||
| Meals and Meal Centers | 0.11 (0.04) ** | 0.03 (0.01) ** | 0.09 (0.04) ** | |||||
| Desserts and Ice Cream | 0.07 (0.03) ** | 0.02 (0.01) ** | 0.37 (0.17) ** | 0.03 (0.01) ** | ||||
| Breakfast Cereals | −0.43 (0.18) ** | 0.08 (0.02) ** | 0.14 (0.05) ** | |||||
| Fruit and Vegetables | 0.22 (0.11) * | 0.36 (0.14) ** | 0.41 (0.16) ** | 0.04 (0.02) * | ||||
| Baby Food | 0.24 (0.05) ** | 0.07 (0.04) * | 0.81 (0.19) ** | 0.63 (0.25) ** | 0.21 (0.08) ** | 0.33 (0.16) ** | 0.80 (0.35) ** | |
| Chocolate Confectionery | 0.17 (0.04) ** | 0.02 (0.01) * | 1.22 (0.64) * | 0.02 (0.01) ** | 0.01 (0.01) * | |||
| Alcoholic Beverages | 0.03 (0.02) * | 0.15 (0.08) * | ||||||
| Other Beverages | 0.03 (0.02) * | 0.07 (0.03) ** | 0.08 (0.04) * | |||||
| RTDs | 0.24 (0.06) ** | 0.12 (0.05) ** | 0.96 (0.27) ** | 0.07 (0.04) * | ||||
| Side Dishes | 0.09 (0.04) ** | 0.18 (0.07) ** | −0.06 (0.02) ** | |||||
| Water | 0.22 (0.05) ** | 0.07 (0.03) ** | 0.12 (0.05) ** | |||||
| Sweet Spreads | 0.03 (0.01) * | 0.15 (0.07) ** | ||||||
| Carbonated Soft Drinks | 0.50 (0.23) ** | 0.19 (0.08) ** | ||||||
| Soup | 0.11 (0.04) ** | −0.03 (0.02) * | ||||||
| Sweeteners and Sugar | 0.40 (0.12) ** | 0.55 (0.21) ** | ||||||
| Sports and Energy Drinks | 0.24 (0.10) ** | 0.26 (0.11) ** |
| Category | Firm | Firm | Origin | Associated Categories | Total | Percentage |
|---|---|---|---|---|---|---|
| type | Launched | of Products | ||||
| Products | in Category | |||||
| Added Calcium | Heinz | Manufacturer | Western | Baby food | 47 | 2.73 |
| Nestlé | Manufacturer | Western | Baby food, Breakfast Cereals, Dairy, Hot Beverages | 43 | 2.49 | |
| Inner Mongolia Yili Industrial Group | Manufacturer | Chinese | Baby food, Dairy | 31 | 1.80 | |
| Fang Guang | Manufacturer | Chinese | Baby food | 30 | 1.74 | |
| Nabisco | Manufacturer | Western | Bakery, Snacks | 27 | 1.57 | |
| Antioxidant | Mondelez | Manufacturer | Western | Bakery | 17 | 4.89 |
| Nestlé | Manufacturer | Western | Baby food, Dairy, Other Beverages | 11 | 3.16 | |
| Wondersun Dairy | Manufacturer | Chinese | Baby food, Dairy | 10 | 2.87 | |
| Liao Yuan Dairy | Manufacturer | Chinese | Baby food | 9 | 2.59 | |
| Kraft Foods | Manufacturer | Western | Other Beverages | 7 | 2.01 | |
| Brain & Nervous System | Heinz | Manufacturer | Western | Baby food, Dairy | 37 | 3.58 |
| (Functional) | Inner Mongolia Mengniu Dairy Group | Manufacturer | Chinese | Baby food, Dairy | 37 | 3.58 |
| Inner Mongolia Yili Industrial Group | Manufacturer | Chinese | Baby food, Dairy | 34 | 3.29 | |
| Nestlé | Manufacturer | Western | Baby food, Dairy, Other Beverages | 30 | 2.90 | |
| Fang Guang | Manufacturer | Chinese | Baby Food | 27 | 2.61 | |
| Cardiovascular | Alpha Health Care Products | Manufacturer | Chinese | Bakery | 5 | 1.71 |
| (Functional) | Dou Bang | Manufacturer | Chinese | Snacks | 4 | 1.37 |
| Nestlé | Manufacturer | Western | Dairy, Side Dishes | 4 | 1.37 | |
| Haojiayi Dairy | Manufacturer | Chinese | Dairy | 3 | 1.03 | |
| Huang Yu Tech | Manufacturer | Chinese | Dairy | 3 | 1.03 | |
| Digestive | Inner Mongolia Mengniu Dairy Group | Manufacturer | Chinese | Desserts & Ice Cream, Dairy, Baby Food. | 63 | 3.77 |
| (Functional) | Inner Mongolia Yili Industrial Group | Manufacturer | Chinese | Dairy, Baby Food | 51 | 3.06 |
| Nestlé | Manufacturer | Western | Dairy, Baby Food, Breakfast Cereals, Hot Beverages, Side Dishes | 41 | 2.46 | |
| Heinz | Manufacturer | Western | Dairy, Baby Food | 38 | 2.28 | |
| Bright Dairy & Food | Manufacturer | Chinese | Juice Drinks, Dairy, Baby Food | 25 | 1.50 | |
| High Protein | Coca-Cola | Manufacturer | Western | Dairy | 18 | 2.23 |
| Inner Mongolia Yili Industrial Group | Manufacturer | Chinese | Dairy, Baby Food, Bakery | 15 | 1.86 | |
| Wondersun Dairy | Manufacturer | Chinese | Dairy, Baby Food | 13 | 1.61 | |
| Beingmate Group | Manufacturer | Chinese | Dairy, Baby Food | 10 | 1.24 | |
| General Mills | Manufacturer | Western | Meals & Meal Centers | 10 | 1.24 | |
| High Added Fiber | PepsiCo | Manufacturer | Western | Dairy, Breakfast Cereals, Hot Beverages, Other beverages | 30 | 2.14 |
| Nestlé | Manufacturer | Western | Dairy, Baby Food, Breakfast Cereals, Hot Beverages | 23 | 1.64 | |
| Liuliu Orchard | Manufacturer | Chinese | Snacks | 17 | 1.21 | |
| Inner Mongolia Mengniu Dairy Group | Manufacturer | Chinese | Dairy, RTDs | 14 | 1.00 | |
| Inner Mongolia Yili Industrial Group | Manufacturer | Chinese | Dairy, Bakery | 13 | 0.93 | |
| Low/No/Reduced | Inner Mongolia Yili Industrial Group | Manufacturer | Chinese | Dairy | 12 | 4.51 |
| Allergen | Inner Mongolia Mengniu Dairy Group | Manufacturer | Chinese | Dairy | 10 | 3.76 |
| August Töpfer & Co | Manufacturer | Western | Baby Food | 6 | 2.26 | |
| Fantastic Snacks | Manufacturer | Western | Snacks | 5 | 1.88 | |
| Silk | Manufacturer | Western | Dairy | 5 | 1.88 | |
| Low/No/Reduced | Kang Zhi Quan Soda Water | Manufacturer | Chinese | Water | 1 | 20.00 |
| Carb | Lin Hai Xue Yuan Brewing | Manufacturer | Chinese | Water | 1 | 20.00 |
| Thai Hajima Trading | Manufacturer | Other Asian | Snacks | 1 | 20.00 | |
| Tsingtao Beer | Manufacturer | Chinese | Alcoholic Beverages | 1 | 20.00 | |
| General Nutrition Corporation-GNC | Manufacturer | Western | Other Beverages | 1 | 20.00 | |
| Low/No/Reduced | Inner Mongolia Yili Industrial Group | Manufacturer | Chinese | Dairy | 44 | 3.27 |
| Fat | Nestlé | Manufacturer | Western | Dairy, Breakfast Cereals, Chocolate Confectionery. | 23 | 1.71 |
| Wei Chuan Food | Manufacturer | Other Asian | Dairy | 22 | 1.64 | |
| Bright Dairy & Food | Manufacturer | Chinese | Dairy | 18 | 1.34 | |
| Inner Mongolia Mengniu Dairy Group | Manufacturer | Chinese | Dairy | 14 | 1.04 | |
| Low/No/Reduced | Inner Mongolia Yili Industrial Group | Manufacturer | Chinese | Dairy | 15 | 12.61 |
| Lactose | Inner Mongolia Mengniu Dairy Group | Manufacturer | Chinese | Dairy | 10 | 8.40 |
| Yeo Hiap Seng | Manufacturer | Chinese | Dairy | 5 | 4.20 | |
| Abbott Laboratories | Manufacturer | Western | Baby Food | 4 | 3.36 | |
| Longdan Dairy | Manufacturer | Chinese | Baby Food | 4 | 3.36 | |
| Low/No/Reduced | Kagome | Manufacturer | Other Asian | Juice Drinks, Sauces & Seasonings | 17 | 4.67 |
| Sodium | Heinz | Manufacturer | Western | Sauces & Seasonings, Baby Food | 14 | 3.85 |
| China Salt | Manufacturer | Chinese | Sauces & Seasonings | 6 | 1.65 | |
| Sichuan Weijute Food | Manufacturer | Chinese | Sauces & Seasonings | 6 | 1.65 | |
| Wei Xing Foods | Manufacturer | Chinese | Sauces & Seasonings | 5 | 1.37 | |
| Low/No/Reduced | Liwayway Food | Manufacturer | Chinese | Snacks, Bakery | 47 | 9.40 |
| Transfat | Orion Food | Manufacturer | Other Asian | Bakery, Snacks | 39 | 7.80 |
| Want Want | Manufacturer | Chinese | Breakfast Cereals, Snacks, Hot Beverages | 27 | 5.40 | |
| PepsiCo | Manufacturer | Western | Breakfast Cereals, Dairy | 25 | 5.00 | |
| Nestlé | Manufacturer | Western | Bakery, Hot Beverages | 17 | 3.40 | |
| Prebiotic | Inner Mongolia Mengniu Dairy Group | Manufacturer | Chinese | Baby Food, Dairy, Desserts & Ice Cream | 55 | 6.77 |
| Inner Mongolia Yili Industrial Group | Manufacturer | Chinese | Baby Food, Dairy | 45 | 5.54 | |
| Heinz | Manufacturer | Western | Baby Food | 37 | 4.55 | |
| Fei He Dairy | Manufacturer | Chinese | Baby Food, Dairy | 17 | 2.09 | |
| Chuang Kang Food & Beverage | Manufacturer | Chinese | Other Beverages, Dairy | 15 | 1.85 | |
| Vitamin/Mineral | Nestlé | Manufacturer | Western | Baby Food, Dairy, Breakfast Cereals, Hot Beverages, Energy Drinks | 110 | 3.05 |
| Fortified | Inner Mongolia Yili Industrial Group | Manufacturer | Chinese | Baby Food, Dairy | 66 | 1.83 |
| Heinz | Manufacturer | Western | Baby Food, Bakery | 62 | 1.72 | |
| Inner Mongolia Mengniu Dairy Group | Manufacturer | Chinese | Baby Food, Dairy | 47 | 1.30 | |
| Bright Dairy & Food | Manufacturer | Chinese | Baby Food, Dairy, RTDs | 45 | 1.25 | |
| Anti-Ageing | New Hope Dairy | Manufacturer | Chinese | Dairy | 3 | 2.88 |
| Ao Chao Agriculture Technology | Manufacturer | Chinese | Snacks | 2 | 1.92 | |
| Doubly Biological Technology | Manufacturer | Chinese | Sports & Energy Drinks | 2 | 1.92 | |
| Jing Feng Food | Manufacturer | Chinese | Snacks, Meals & Meal Centers | 2 | 1.92 | |
| Mengchun Dairy | Manufacturer | Chinese | Dairy | 2 | 1.92 | |
| Bone Health | Nestlé | Manufacturer | Western | Baby food, Breakfast Cereals, Dairy, Hot Beverages | 54 | 5.77 |
| Inner Mongolia Yili Industrial Group | Manufacturer | Chinese | Baby food, Dairy | 49 | 5.24 | |
| Heinz | Manufacturer | Western | Baby food | 38 | 4.06 | |
| Fang Guang | Manufacturer | Chinese | Baby food | 26 | 2.78 | |
| Beingmate | Manufacturer | Chinese | Baby food | 23 | 2.46 | |
| Caffeine Free | Jianlibao Group | Manufacturer | Chinese | Sports Drinks | 9 | 11.25 |
| Prince Dairy | Manufacturer | Chinese | Baby Cereals | 4 | 5.00 | |
| Kokei Food | Manufacturer | Chinese | Hot Beverages | 3 | 3.75 | |
| Twinings | Manufacturer | Western | Hot Beverages | 3 | 3.75 | |
| Wahaha Group | Manufacturer | Chinese | Carbonated Soft Drinks | 3 | 3.75 | |
| Diabetic | Alpha Health Care Products | Manufacturer | Chinese | Sweeteners & Sugar, Side Dishes, Breakfast Cereals, Bakery | 9 | 7.89 |
| Lijia Food | Manufacturer | Chinese | Hot Beverages, Breakfast Cereals | 3 | 2.63 | |
| Heilongjiang Canwang Healthcare Foods Co | Manufacturer | Chinese | Savoury Biscuits/Crackers, White Milk | 2 | 1.75 | |
| Jiangsu Fukang Foods Factory | Manufacturer | Chinese | Hot Beverages | 2 | 1.75 | |
| Mengchuan Green-Food | Manufacturer | Chinese | Sauces & Seasonings | 2 | 1.75 | |
| Gluten Free | August Töpfer & Co | Manufacturer | Western | Baby Food | 6 | 5.08 |
| Fantastic Snacks | Manufacturer | Western | Snacks | 5 | 5.08 | |
| GangRong Foodstuff Development | Manufacturer | Chinese | Bakery | 4 | 5.08 | |
| Beijing Kongweng Foods | Manufacturer | Chinese | Bakery | 3 | 5.08 | |
| Capital Trading | Manufacturer | Other Asian | Snacks | 3 | 5.08 | |
| High Saciety | Royal Family Food | Manufacturer | Other Asian | Bakery | 4 | 16.00 |
| Carman’s Fine Foods | Manufacturer | Western | Breakfast Cereals | 2 | 8.00 | |
| Hunan Taier Pharmacy | Manufacturer | Chinese | Other Beverages | 2 | 8.00 | |
| Kang Bi Te | Manufacturer | Chinese | Other Beverages | 2 | 8.00 | |
| Liwayway Food | Manufacturer | Chinese | Snacks, Bakery | 2 | 8.00 | |
| Immune System | Wondersun Dairy | Manufacturer | Chinese | Dairy, Baby Food | 19 | 3.84 |
| Liao Yuan Dairy | Manufacturer | Chinese | Dairy, Baby Food | 17 | 3.43 | |
| Fei He Dairy | Manufacturer | Chinese | Baby Food | 15 | 3.03 | |
| Nestlé | Manufacturer | Western | Dairy, Baby Food | 15 | 3.03 | |
| Wyeth | Manufacturer | Western | Baby Food | 15 | 3.03 | |
| Low/No/Reduced | PepsiCo | Manufacturer | Western | Carbonated Soft Drinks, Juice Drinks, Water | 14 | 2.92 |
| Calorie | Coca-Cola | Manufacturer | Western | Carbonated Soft Drinks | 13 | 2.71 |
| Kai Tao Qi Food | Manufacturer | Chinese | Snacks | 8 | 1.67 | |
| Royal Family Food | Manufacturer | Other Asian | Bakery | 7 | 1.46 | |
| Ba Wang Si Industrial | Manufacturer | Chinese | Carbonated Soft Drinks | 5 | 1.04 | |
| Low/No/Reduced | Guangdong Black Cow Foods Industry Co | Manufacturer | Chinese | Dairy, Breakfast Cereals, Hot Beverages | 10 | 1.45 |
| Cholesterol | Hangzhou Zuming Foods | Manufacturer | Chinese | Dairy | 10 | 1.45 |
| Vitasoy (Bright) Food & Beverage | Manufacturer | Chinese | Dairy | 10 | 1.45 | |
| AB Food & Beverages | Manufacturer | Western | Dairy, Hot Beverages | 9 | 1.30 | |
| Changkang Hunan | Manufacturer | Chinese | Sauces & Seasonings | 7 | 1.01 | |
| Low/No/Reduced | Carman’s Fine Foods | Manufacturer | Western | Breakfast Cereals | 2 | 33.33 |
| Glycemic | Fudelande Trade | Manufacturer | Chinese | Sugar & Gum Confectionery | 1 | 16.67 |
| Qingdao Kanghaiyuan Industry | Manufacturer | Chinese | Bakery | 1 | 16.67 | |
| Vitality Brands Worldwide | Manufacturer | Western | Snacks | 1 | 16.67 | |
| Xiwang Sugar | Manufacturer | Chinese | Sweeteners & Sugar | 1 | 16.67 | |
| Low/No/Reduced | Guilin Zhiqiang Food Development | Manufacturer | Chinese | Breakfast Cereals, Hot Beverages | 7 | 11.29 |
| Saturated Fat | Wahaha Group | Manufacturer | Chinese | Dairy | 6 | 9.68 |
| Guilin Zhiqiang Foods Improved | Manufacturer | Chinese | Hot Beverages | 3 | 4.84 | |
| Vitasoy (Bright) Food & Beverage | Manufacturer | Western | Dairy | 3 | 4.84 | |
| Vitasoy International Holdings | Manufacturer | Western | Dairy | 3 | 4.84 | |
| Low/No/Reduced | Wrigley | Manufacturer | Western | Sugar & Gum Confectionery | 71 | 1.87 |
| Sugar | Perfetti Van Melle | Manufacturer | Western | Sugar & Gum Confectionery | 40 | 1.05 |
| Inner Mongolia Yili Industrial Group | Manufacturer | Chinese | Sugar & Gum Confectionery, Desserts & Ice Cream, Dairy | 32 | 0.84 | |
| Orion Food | Manufacturer | Other Asian | Sugar & Gum Confectionery | 31 | 0.82 | |
| Nestlé | Manufacturer | Western | Sugar & Gum Confectionery, Baby Food, Dairy, Hot Beverages | 27 | 0.71 | |
| Other (Functional) | Inner Mongolia Yili Industrial Group | Manufacturer | Chinese | Dairy, Sugar & Gum Confectionery, Meals & Meal Centers | 65 | 2.51 |
| Heinz | Manufacturer | Western | Baby Food, Dairy, | 62 | 2.39 | |
| Nestlé | Manufacturer | Western | Baby Food, Dairy, Breakfast Cereals, Hot Beverages | 48 | 1.85 | |
| Fang Guang | Manufacturer | Chinese | Baby food | 40 | 1.54 | |
| Inner Mongolia Mengniu Dairy Group | Manufacturer | Chinese | Baby Food, Dairy | 33 | 1.27 | |
| Slimming | Food Vending China | Manufacturer | Chinese | Desserts & Ice Cream | 7 | 3.76 |
| Royal Family Food | Manufacturer | Asiatic | Bakery | 4 | 2.15 | |
| SinoConnect Group | Manufacturer | Chinese | Hot Beverages, Other Beverages | 3 | 1.61 | |
| Xing Ding Food | Manufacturer | Chinese | Desserts & Ice Cream | 3 | 1.61 | |
| Beidahuang Feng Wei Food | Manufacturer | Chinese | Dairy | 2 | 1.08 | |
| Wholegrain | Nestlé | Manufacturer | Western | Baby Food, Breakfast Cereals, Hot Beverages | 16 | 6.11 |
| Cereal Partners | Manufacturer | Western | Breakfast Cereals | 8 | 3.05 | |
| Weetabix | Manufacturer | Western | Breakfast Cereals | 8 | 3.05 | |
| Kraft Foods | Manufacturer | Western | Bakery, Breakfast Cereals | 6 | 2.29 | |
| Mankattan Food | Manufacturer | Chinese | Bakery | 6 | 2.29 | |
| All Natural | Tenwow Group | Manufacturer | Chinese | Snacks, Breakfast Cereals | 6 | 0.79 |
| Andros | Manufacturer | Western | Juice Drinks, Sweet Spreads | 4 | 0.53 | |
| GangRong Foodstuff Development | Manufacturer | Chinese | Bakery | 4 | 0.53 | |
| Kang Pu Bio-Tech | Manufacturer | Chinese | Juice Drink | 4 | 0.53 | |
| Nongmao Foodstuff | Manufacturer | Chinese | Snacks | 4 | 0.53 | |
| Hormone Free | Tyson Hua Dong Food Development | Manufacturer | Chinese | Processed Fish, Meat & Egg Products | 12 | 8.96 |
| Sheng Mu High-Tech Dairy | Manufacturer | Chinese | Dairy | 10 | 7.46 | |
| Yibang Foods | Manufacturer | Chinese | Fruit & Vegetables, Side Dishes | 10 | 7.46 | |
| Best Food | Manufacturer | Chinese | Eggs & Egg Products | 5 | 3.73 | |
| Haiba Biological & Technology | Manufacturer | Chinese | Baby Food | 4 | 2.99 | |
| GMO Free | Yihai Kerry Food | Manufacturer | Chinese | Soy Based Drinks, Oils | 19 | 1.69 |
| Vitasoy (Bright) Food & Beverage | Manufacturer | Chinese | Soy Based Drinks | 14 | 1.25 | |
| Sichuan Qianhe Flavoring | Manufacturer | Chinese | Sauces & Seasonings | 13 | 1.16 | |
| Cofco | Manufacturer | Chinese | Sauces & Seasonings | 12 | 1.07 | |
| Baling Oils and Fats | Manufacturer | Chinese | Sauces & Seasonings | 11 | 0.98 | |
| No Additives/ | Sanquan Foods | Manufacturer | Chinese | Desserts & Ice Cream, Meals & Meal Centers, Snacks, Bakery | 147 | 1.51 |
| Preservatives | Inner Mongolia Mengniu Dairy Group | Manufacturer | Chinese | Dairy, Desserts & Ice Cream | 80 | 0.82 |
| Bright Dairy & Food | Manufacturer | Chinese | Baby Food, Dairy, Juice Drinks, RTDs | 67 | 0.69 | |
| Heinz | Manufacturer | Western | Baby Food, Fruit & Vegetables, Sauces & Seasonings | 52 | 0.54 | |
| General Mills | Manufacturer | Western | Snacks, Sugar & Gum Confectionery | 52 | 0.54 |
© 2019 by the authors. Licensee MDPI, Basel, Switzerland. This article is an open access article distributed under the terms and conditions of the Creative Commons Attribution (CC BY) license (http://creativecommons.org/licenses/by/4.0/).
Share and Cite
Costa-Font, M.; Revoredo-Giha, C. Introduction of New Food Products in China: Is There a Trend towards Healthier and Safer Products? Soc. Sci. 2019, 8, 51. https://doi.org/10.3390/socsci8020051
Costa-Font M, Revoredo-Giha C. Introduction of New Food Products in China: Is There a Trend towards Healthier and Safer Products? Social Sciences. 2019; 8(2):51. https://doi.org/10.3390/socsci8020051
Chicago/Turabian StyleCosta-Font, Montserrat, and Cesar Revoredo-Giha. 2019. "Introduction of New Food Products in China: Is There a Trend towards Healthier and Safer Products?" Social Sciences 8, no. 2: 51. https://doi.org/10.3390/socsci8020051
APA StyleCosta-Font, M., & Revoredo-Giha, C. (2019). Introduction of New Food Products in China: Is There a Trend towards Healthier and Safer Products? Social Sciences, 8(2), 51. https://doi.org/10.3390/socsci8020051