Abstract
The aim of this paper is to provide a new approach for assessing the input-output efficiency of education and technology for national science and education department. We used the Data Envelopment Analysis (DEA) method to analyze the efficiency sharing activities in education and technology sector, and classify input variables and output variables accordingly. Using the panel data in the education and technology sector of 53 countries, we found that the countries with significant progress in educational efficiency and technological efficiency mainly concentrated in East Asia, especially in Japan, Korea, Taiwan and some other developing countries. We further evaluate the effect of educational and technological efficiencies on national competitiveness, balanced development of the country, national energy efficiency, export, and employment. We found that the efficiency of science and technology has an effect on the balanced development of the country, but that of education has played a counter-productive role; Educational efficiency has a large role and related the country’s educational development. In addition, using the panel data analysis, we showed that educational and technological efficiency has different degrees of contributions to the development from 2000 to 2014. It mainly depends on the economic development progress and the push for the education and technological policy. The proposed approach in this paper provides the decision-making support for the education and technological policy formulation, specially the selection of the appropriate education and technological strategies for resource allocation and process evaluation.
1. Introduction
The importance of education and technology is evident in the advancement of global knowledge and technology. Governments are increasing their budgetary investment in education and technology each year to improve the national education standards and science and technology productivity. Nevertheless, achievement in education and technology requires accumulation. Despite such significant growth, low efficiency in investment faces constant criticism (So 2011). Lin et al. (2010) shows that by increasing budgetary inputs, the outputs of education and technology differ across countries. Thus, input-output efficiency is a crucial factor both in education and technology. Wu (2009) proved that efficiency on the output growth is the main driver of growth disparity. As both are noteworthy issues, evaluating the efficiency of education and technology depends not only on the amount of public input but also on operation efficiency and policy sustainability.
Lavado and Cabanda (2009) pointed out that efficiency is defined as the deviation from the frontier that represents the maximum output attainable from each input level. Efficiency is estimated using data envelopment analysis (DEA), and it can help in budget allocation and rationalization (Lavado and Cabanda 2009). Park (2015) insisted that DEA is adopted to measure efficiency and productivity. For example, Cordero-Ferrera et al. (2008) measured educational efficiency by using DEA for evaluating schools. Lin et al. (2010) applies the performance framework in competitive advantage issues associated with the DEA method to evaluate the relative efficiency of technology across countries. Therefore, DEA is an appropriate approach to measure the input-output efficiency of education and technology. DEA is adopted to measure efficiency and productivity; it is a nonparametric method in operations research and economics for the estimation of production frontiers. DEA is a linear programming model to measure the relative efficiencies of decision-making units (DMUs) (Cooper et al. 1997) allowing each DMU to choose the optimal weights of inputs and outputs which maximize its relative efficiency (Cherchye et al. 2007). It calculates relative efficiency scores for a set of peer entities in the range of [0, 1]. Each entity pursuing the same objective is called a DMU and has common multiple input-output variables. For this reason, DEA is an appropriate approach to measure the input-output efficiency of education and technology.
The first part of this paper focuses on measuring the efficiency of education and technology. The next section further identifies their effect on national development by using panel data, such as national comprehensive competitiveness.
Many studies (Cordero-Ferrera et al. 2008; Mu et al. 2010; Grosskopf et al. 2014) show how the efficiency of education and technology affect the development of a country. Grosskopf et al. (2014) implicated the effect of technical and school efficiencies on economic development. The potential applications and strengths of DEA and intellectual capital in assessing the performance of technology development program are also highlighted (Lu and Hung 2011). Realizing the importance of technology as a critical driving force for national competitive advantage, government has been steadily increasing their public budget in recent years (So 2011). Lu et al. (2016) examined technology and socio-economic efficiencies of Taiwan’s dual-use technology development programs using DEA. They showed that these efficiencies are substantially higher than socio-economic efficiency and provided insights into the policy of resource utilization. These input-output efficiencies exert a certain effect on national development.
The contribution of this paper mainly on measuring the efficiency of technology and education through the DEA model; On the basis of results of technology and education efficiency, measuring their influences on national development. Change the fact that the past measure only focused on inputs, ignoring the efficiency of technology and education. The evaluation on efficiency of technology and education can highlight the effective utilization of resources, it is more reasonable to evaluate education and technology development. No one used efficiency as drivers to measure its influence on the development of a country before.
There are some limitations of the study. It is necessary to consider the consistency international panel data. Although it is the international database, many countries index statistics caliber is not completely consistent. In addition, it is still necessary to verify if the objective factors are accurate, we only use the control factor of population and GDP per capita, which remains to be further studied.
The rest of this paper is structured as follows. Section 2 reviews the literature on measuring the efficiency of education and technology, and discussing the significance of a series of efficiency indicators to determine the extent and nature education and technology. Section 3 focuses on the research design, data resources, and methodology. Section 4 describes the results of using DEA model and panel data to calculate the input-output efficiency of education and technology of each country; and select some logarithmic indicators to eliminate the heteroscedasticity and improve the fitting degree of the calculated results to evaluate the effects of educational efficiency and technological efficiency on national development. Section 5 concludes this paper.
2. Literature Review
Education and technology not only focus on budget input but also depended on use efficiency and continuous input. High-efficiency and long-term resource guarantee and the effect on national development are worthy of research.
Geva-May (2001) provided a series of efficiency indicators to determine the extent and nature of Israeli higher education policy goal attainment of Israeli universities. Lavado and Cabanda (2009) selected expenditures and secondary enrollment rates to evaluate the educational efficiency of the Philippines. Bursalioglu and Selim (2015) stated that investigating their efficiency in academic and research activities is important, along with the factors that determine efficiency by using DEA, including public expenditure in higher education and the ratio of higher education graduates to the total population. Aristovnik and Obadić (2014) also used the DEA method to study educational efficiency provided in the secondary and tertiary education sectors. Lassibille and Gomez (2000) and Grosskopf et al. (2014) selected the secondary school enrollment to reflect school efficiency and description of national education systems. Chen and Chen (2011) adopted DEA to evaluate the efficiency of Taiwanese universities and judge the efficiency of cost expenditures. Chang et al. (2012) used DEA to evaluate the allocated education resources. Thus, total public expenditure in education (percentage of gross domestic product (GDP)) and total public expenditure on education per capita are selected as key input indicators (Mu et al. 2010); secondary school enrollment and higher education achievement are selected as key output indicators. Overall, DEA is viewed as an effective method to evaluate educational efficiency.
The findings of the present study highlight the importance of intellectual capital in achieving research and development (R&D) and high levels of technology development program efficiency (Mu et al. 2010; Lu and Hung 2011). Mu et al. (2010) developed the national innovative development index and the national innovation capacity index with a view to monitor the progress in innovation development. Park (2015) analyzed efficiency and productivity change within government subsidy recipients of a national technology innovation R&D program. This finding implies that the government should control the ratio of the subsidy to the total R&D budget. Thus, evaluation and management of R&D performance are now an important consideration in national R&D activities (So 2011). Clermont (2016) revealed that the initial positive developments of effectiveness and efficiency are mainly due to technology advances, whereas the following decreases are basically a result of technology backwardness. Wei et al. (2016) pointed out that a country has also increased the input of technology and R&D to prompt technological reformation and imported technology absorption. Park (2014) analyzed the efficiency of small- and medium-sized enterprises of a national technology innovation R&D program. Choi and Hwang (2014) considered that patent can be viewed as a key indicator of technology development efficiency. Park (2015) pointed out that intellectual property-related output includes publications and patents. Lin et al. (2010) pointed out each country’s annual research and development (R&D) expenditures are treated as input while patents and academic publications, indexed by Science Citation Index (SCI) and Engineering Index (EI), are considered as outputs. Thus, the four performance factors are published articles, patent applications and registrations, patents used, and profited commercialization. In addition, the economic effects of R&D investment may not be realized in the short term, and, thus, additional research using longitudinal data is needed to confirm the findings (Mu et al. 2010; So 2011). Park (2015) showed that Sharma and Thomas (2008) compared the national R&D programs of 22 countries and found that a small number of R&D programs conducted by developing countries were benchmarks located on the frontier. Bitman and Sharif (2008) examined the characteristics of five common methodologies for evaluating R&D performance, and one of them is DEA. Rouse and Putterill (2003) selected three typical methods for the analysis of performance productivity, such as stochastic frontier analysis, total factor productivity, and DEA. In addition, the IMD World Competitiveness Yearbook has provided the science base and technology base in its indicator system (Mu et al. 2010). Thus, total expenditure on R&D and total R&D personnel nationwide are selected as key input indicators. Scientific articles, patent applications and grants are selected as key output indicators.
3. Research Design
3.1. Research Question and Methods
This research makes two main goals based on education and technology, which is better to provide an approach to improve its implementation and success. This study adopts DEA as a main analyzing tool to measure and compare the results of different countries using the efficiency score. In this study, we not only quantitatively measured efficiencies of education and technology but also paid special attention to analyzing their effects on national competitive and development, and energy, export, high-tech and employment.
Goal 1: Measuring DEA on education and technology
By measuring DEA, we compare and analyze the efficiency of education and technology among different countries and judge the next tendency.
Park (2014) revealed that based on the analysis of technological efficiency, the central measures of DEA efficiency scores were reduced as the government R&D subsidy size increases. Park (2015) implied that the government should control the ratio of the subsidy to the total R&D budget with an appropriate upper limit.
Goal 2: Identifying the effects of educational and technological efficiencies on national development
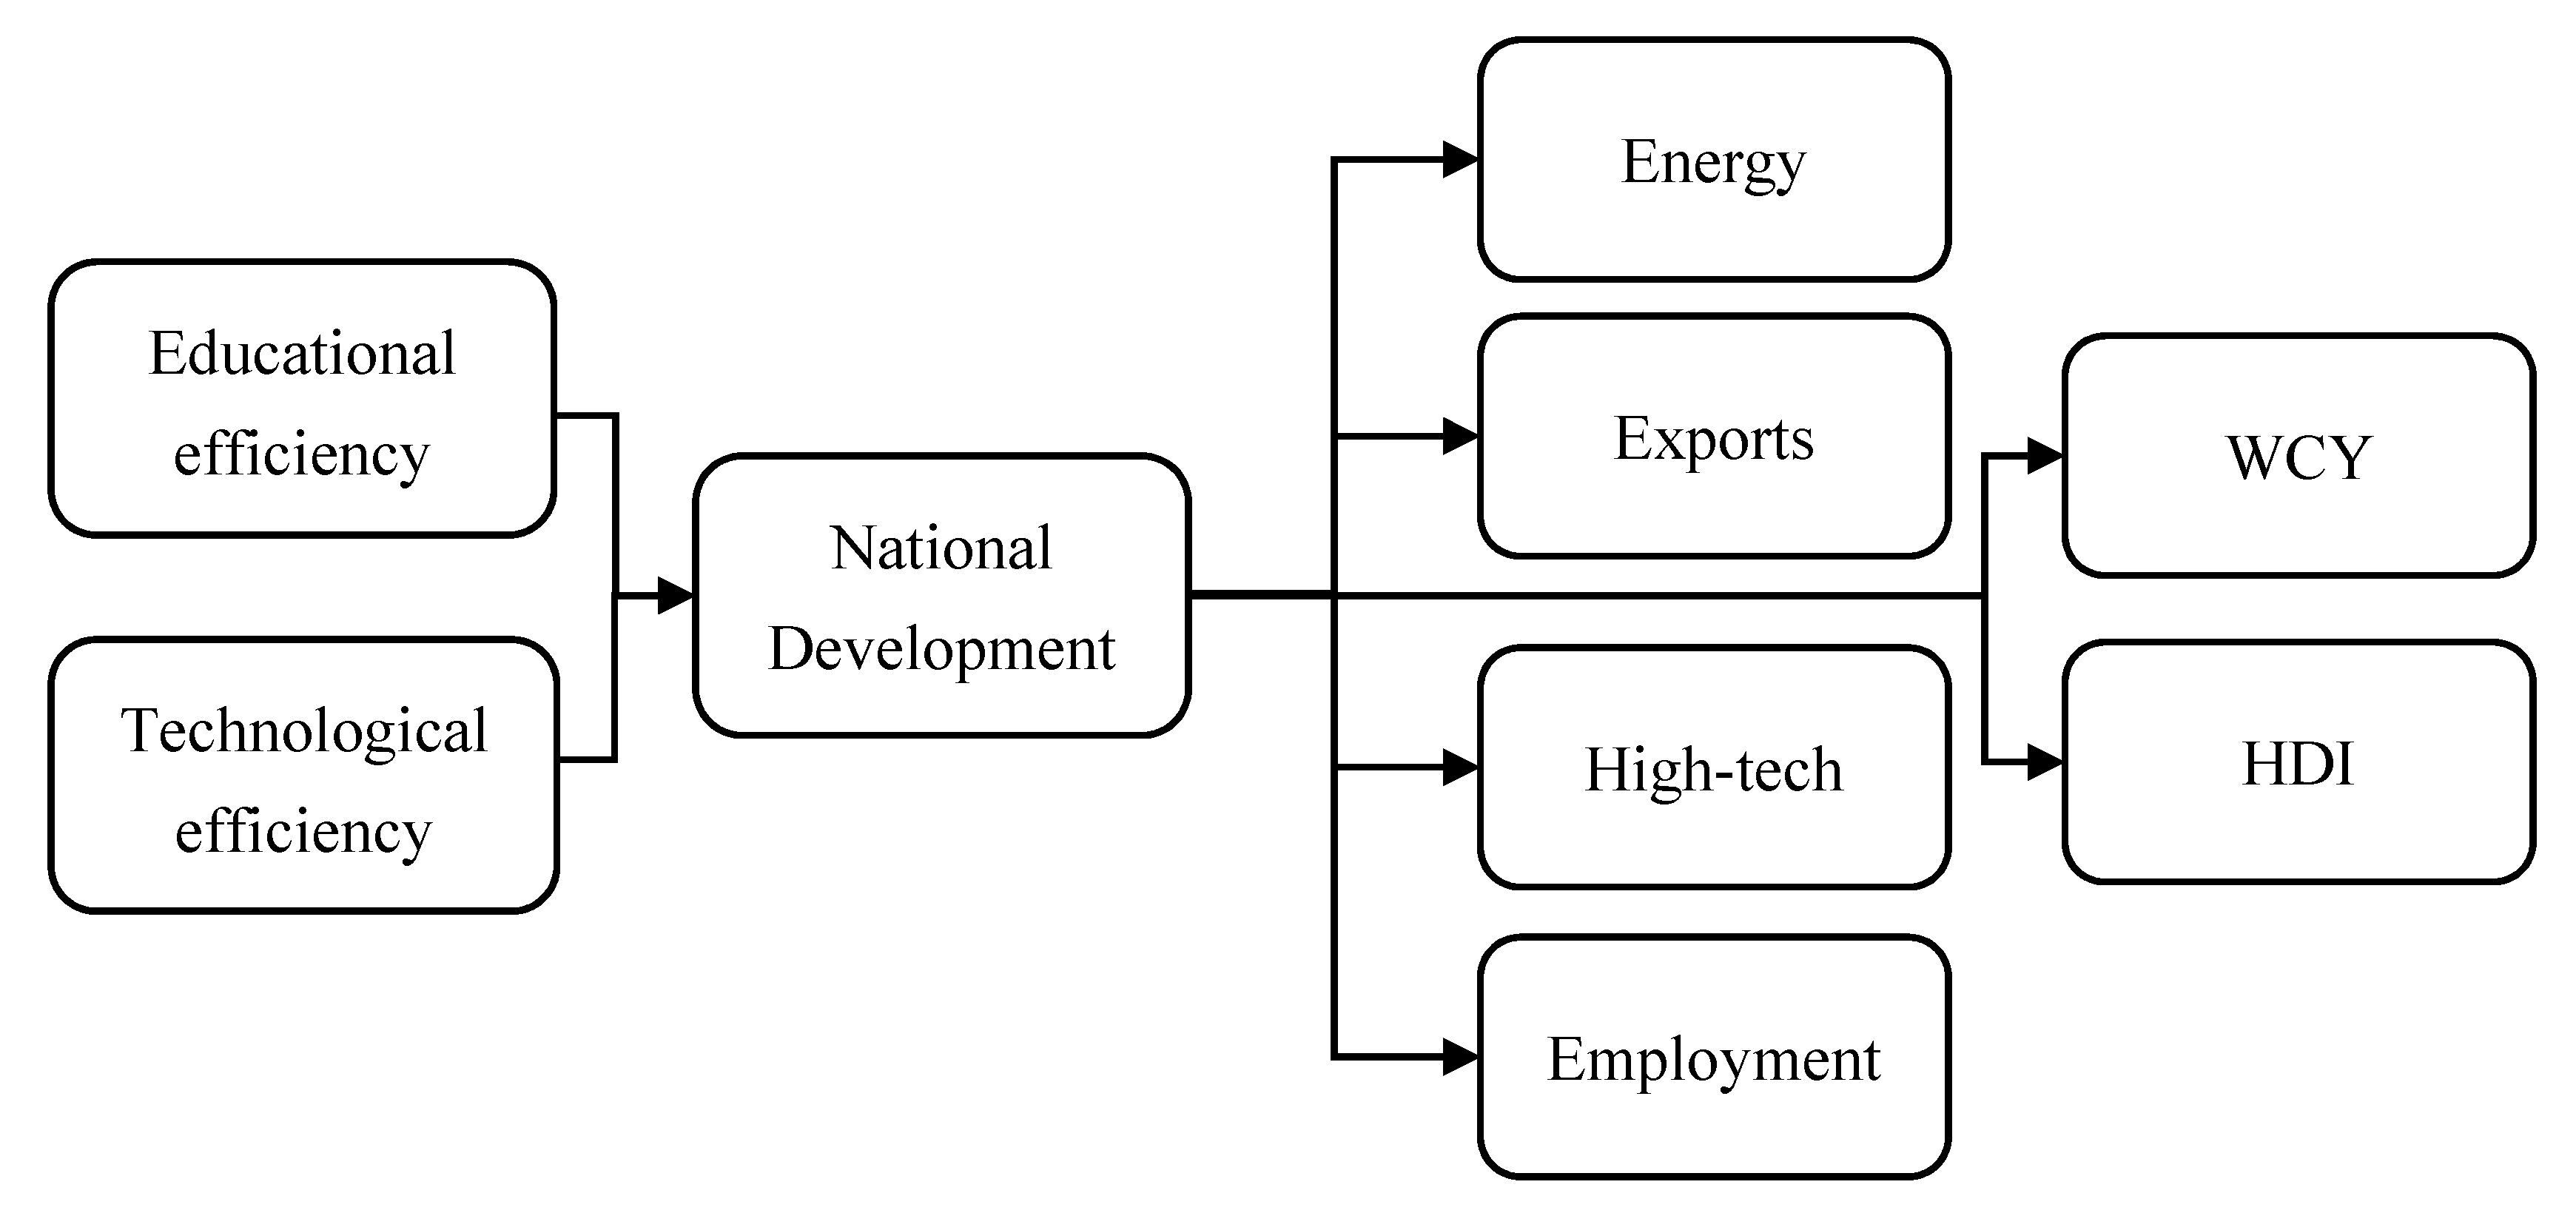
Based on the input-output efficiency of education and technology, we identify its effect on the country’s macro and micro factors via the two-way fixed effect panel data, as shown in Figure 1. We measure the efficiency of technology and education first, and then judge their impacts on national development using efficiency of technology and education as DEA independent variables. The elements of national development including export, high technology, and employment, as well as WCY and IMD, We propose national competitiveness and the level of human development as macroscopic factors reflecting the level of national development, the IMD World Competitiveness Yearbook (WCY), and Human Development Index (HDI), respectively.
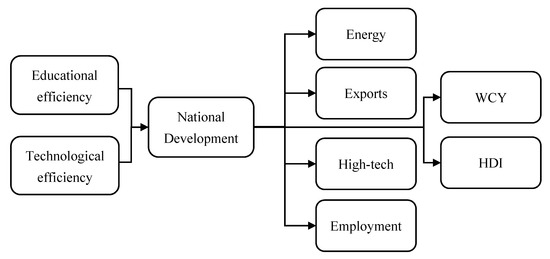
Figure 1.
Relationship among input-output efficiency and national development factors.
We further propose four micro factors, namely, energy, export, high technology, and employment, as a reflection of the national level of development of micro-factors, in order to find implications and managerial insights which may be applied to improve the efficiency of education and technology. Population and GDP per capita are used in the panel data model as national control variables.
3.2. Data Collection and Indicators
Through the previous study and discussion, we construct the DEA model of the efficiency of education and technology, shown in Table 1, according to the following indicators as input and output variables.

Table 1.
DEA models: input-output variable.
We have selected a series of representative indicators to further determine the effect of efficiency on national development, as shown in Table 2. WCY and HDI are comprehensive indicators that reflect the level of national development.
Table 2.
Summary of the variables in the level of national development.
- ➢
- WCY is an annual report published by the Swiss-based International Institute for Management Development on the competitiveness of nations, which has been published since 1989.
- ➢
- HDI is a composite statistic of life expectancy, education, and per capita income indicators, which are used to rank countries into four tiers of human development and published by United Nations Development Program since 1990.
We have chosen some representative indicators to support the national elements of development based on the literature and the international authoritative database.
Energy Energy and CO2 emission intensities can be used as representative indicators of national energy consumption.
- ➢
- Energy intensity: amount of energy consumed for each dollar of GDP.
- ➢
- CO2 emission intensity: total CO2 emissions refer to the mass of CO2 released from the burning (combustion) of fuel in a particular country or region.
Export Exports of goods, exports of goods per capita and exports of goods growth can be used as representative indicators of national export and economic trade activity.
High technology High-tech industry is unarguably important for national development. High-tech export value and high-tech industries which accounted for the proportion of the manufacturing sector are the most representative indicators.
- ➢
- High-tech exports (m $): High-tech exports are products with high R&D intensity, such as in aerospace, computers, pharmaceuticals, scientific instruments, and electrical machinery.
- ➢
- High-tech exports (%): This variable denotes the percentage of manufactured exports. High-tech exports are products with high R&D intensity, such as in aerospace, computers, pharmaceuticals, scientific instruments, and electrical machinery.
Employment Employment is a key factor reflecting national economic development and social stability. The total employment population, proportion of the employed population, and the change/growth of the employment rate are some representative indicators.
Fifty-three countries or regions are selected, and unstructured panel data are collected from 2000 to 2014. The above data need be standardized. We calculated the input-output efficiency of education and technology using the DEA software (Worcester Polytechnic Institute, Worcester, MA, USA) and further evaluated the effect of educational and technological efficiencies on national development using STATA software (StataCorp LLC, College Station, TX, USA).
Some US technology output data are not available from the World Intellectual Property Organization. Thus, US was not selected as a sample country, which is also the limitation of this study.
4. Results
4.1. Descriptive of Input-Output Efficiency of Education and Technology
The input-output efficiency of education and technology of each country are calculated from 2000 to 2014, and we take their average efficiency level. The correlation coefficient among the efficiency of education and technology reaches 0.22 (p value < 0.01) using Pearson correlation analysis. In addition, technological efficiency is positively correlated with GDP per capita (r = 0.17, p value <0.01), indicating that a higher GDP per country may be caused by a higher efficiency in science and technology. Educational efficiency is positively correlated with population market size (r = 0.35, p value <0.01) but negatively correlated with GDP per capita (r = −0.18, p value <0.01).
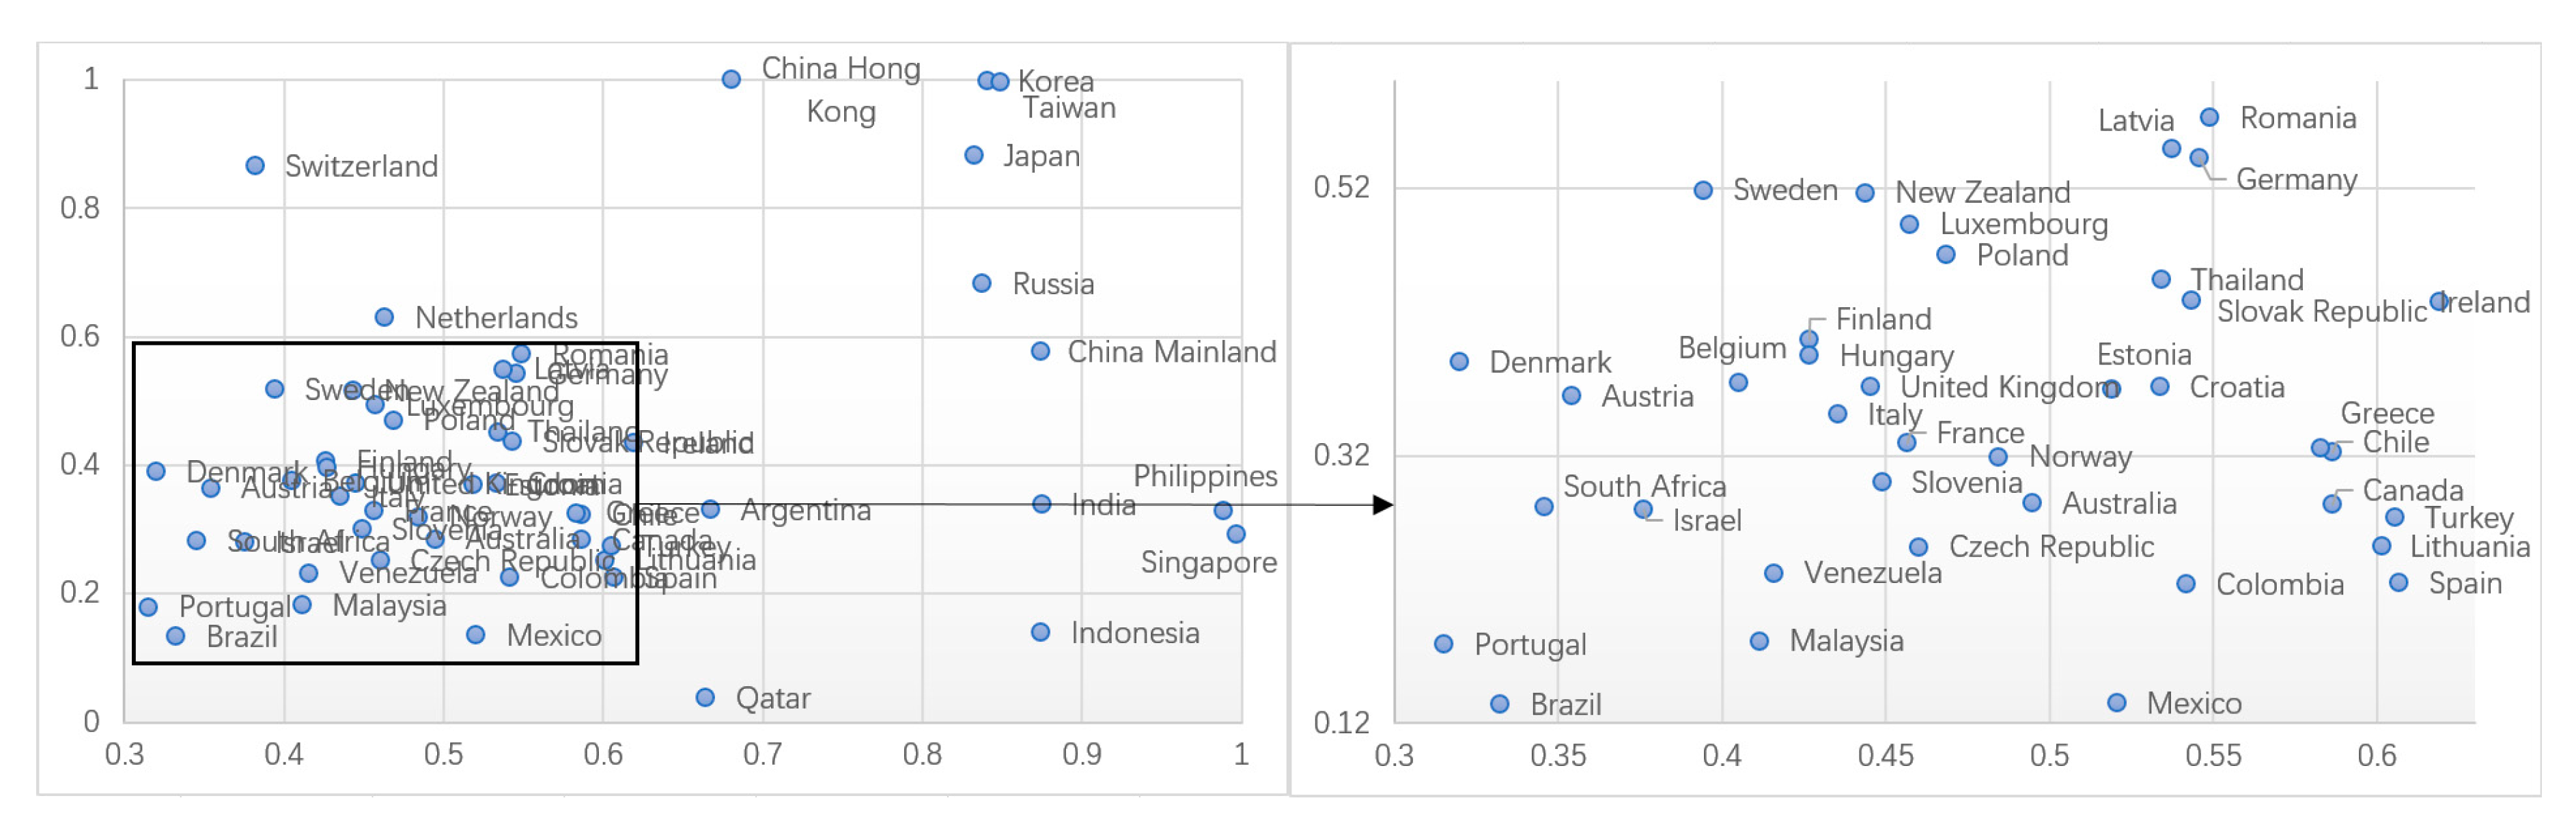
According to the average results of educational (x axis) and technological efficiencies (y axis), we build the DEA matrix of 53 countries or regions, as shown in Figure 2, which is used to analyze the input-output efficiency of education and technology in various countries.
Figure 2.
Efficiency of education and technology in a matrix description.
Figure 2 shows that, countries with high efficiency of education and technology are less, most countries located on the medium level. Most countries at medium level are developed European countries such as Britain and Germany, except for Thailand. The counties at low level are almost developing countries such as Brazil and Malaysia. Among the 53 countries, the input-output efficiency of education of Singapore, Philippines, India, Mainland China, Indonesia, Taiwan, Korea, Russia, and Japan are most prominent (DEA > 0.8); the input-output efficiency of technology of China, Hong Kong, Korea, Taiwan, Japan, and Switzerland are most efficient (DEA > 0.8). Through further analysis, we reveal that the countries with remarkable results in educational efficiency and technological efficiency are mainly concentrated in East Asia. These countries almost covered the “Four Asian Dragons” and “Tiger Cub Economies”. Japan, Korea, and Taiwan have outstanding results in education and technology in promoting the East Asian economy, and the world economy has played the “engine” role. We proposed that education and technology have a significant effect on promoting national economic growth and development, especially in the East Asia. We will test it by static unstructured panel data. Moreover, the output efficiency of European regions and other traditional developed economies in education and technology are significantly behind the East Asia.
4.2. Effects of Educational Efficiency and Technological Efficiency on National Development
Based on Goal 2, we will identify the effects of efficiency of education and technology on national macro and micro development from WCY, HDI to energy, export, high technology, and employment. Population and GDP per capita are used in the panel data model by fixed effects within regression as control variables. We selected some logarithmic indicators to eliminate the heteroscedasticity and improve the fitting degree of the calculated results.
4.3. Effects of Education and Technology on WCY and HDI
WCY is dedicated to the advancement of knowledge on world competitiveness by offering benchmarking services for countries and companies using the latest and most relevant data on the subject. WCY has pioneered research on how nations and enterprises compete to lay the foundations for future prosperity for over 25 years.
HDI is a composite statistic of life expectancy, education, and per capita income indicators, which are used to rank countries into four tiers of human development. A country scores a higher HDI when the lifespan, education level, and GDP per capita are higher. The HDI was published by the United Nations Development Program, often framed in terms of whether people are able to “be” and “do” desirable things in their life.
Population and GDP per capita have significant effect on the level of national competitiveness based on the analysis of static unstructured panel data. After increasing the educational and technological efficiency variables, the overall description of the model has been improved, indicating that education and technology have positive effect on the level of national competitiveness.
However, in the HDI test, GDP per capita is promoted significantly, but the effect of the population is not obvious. After increasing the efficiency variables, technological efficiency and GDP per capita still promote development, but population and educational efficiency have negative effect, shown in Table 3. Studies have shown that the total population is too large to cause the uneven development, according to the demographic situation of these countries.
Table 3.
Effect of education and technology on WCY and HDI.
4.4. Effects of Education and Technology on Energy
In Table 4, population and GDP per capita contribute to energy intensity reduction, indicating that the larger the population size, the higher the GDP per capita, thereby reducing energy intensity. The effect of technological efficiency on energy intensity is not obvious. However, educational efficiency has a significant effect on energy intensity; the higher the educational output, the more energy is consumed. This phenomenon may be due to the fact that some countries with emerging education are mainly some of the economically emerging countries in Asia and are not as good as the traditional developed countries in terms of energy intensity.
Table 4.
Effect of education and technology on energy.
GDP per capita helps to reduce CO2 emissions intensity, indicating that the economy is more developed if CO2 emissions intensity is lower. Thus, the effect of technology efficiency is not obvious, but educational efficiency has a significant effect on CO2 emissions intensity, indicating that the higher the educational output, more CO2 is consumed, which is related to the development stage of educationally emerging countries. In addition, the large population also contributes to the reduction of CO2 emissions intensity.
Some scholars show that the technological development can improve regional energy efficiency in the longitudinal case study (Wei et al. 2016); however, in the global context, the effect of technological efficiency on energy intensity is not obvious.
4.5. Effects of Education and Technology on Exports
In Table 5, population size contributes to the promotion of exports of goods, but it is not appropriate to gauge the export of goods per capita and exports of goods growth. Development of some developing countries is not balanced because of the large population. Countries with higher GDP per capita, mainly developed countries, have obvious advantages in the export of goods and exports of goods per capita. However, the level of development is already mature, and growth in the exports of goods is already declining.
Table 5.
Effect of education and technology on exports.
After obtaining technological and educational efficiencies, we found that the technological efficiency has a significant effect on both exports of goods and exports of goods per capita, but educational efficiency has no significant effect on exports. We deduce that high technological efficiency can directly affect the technical content of goods and is appropriate for improving value of products and exports, but educational efficiency is still in the basic stage and cannot be directly converted into commodity value.
4.6. Effects of Education and Technology on High-Tech
In Table 6, population and GDP per capita have a significant effect on high-tech exports, whether in the total size or proportion. The level of technological efficiency has a significant positive effect on high-tech exports; however, educational efficiency has an effect on the proportion of high-tech exports and has no significant effect on the total size. This phenomenon may be the rapid increase in the level of education in developing countries, and its technological level has not yet reached the expected results. In short, the effect of educational and technological efficiencies on high-tech exports is even greater than their effect on general products exports, which has an important role in improving the technological content and economic value added of export products.
Table 6.
Effect of education and technology on high-tech exports.
4.7. Effects of Education and Technology on Employment
In Table 7, population is positively related to total employment, but there is a negative effect on employment rate and employment growth rate because some developing countries with large population size have low employment rate. The higher the GDP per capita, with strong national economy, the higher the employment rate, but the economically developed countries usually do not have labor–intensive employment, and employment scale is in reverse relationship.
Table 7.
Effect of education and technology on employment.
The efficiency of technology is proportional to the economic level, which is positive effect on the employment rate. Raising educational efficiency also has a positive effect on the employment scale and rate. Developing education has a positive role on the stability and development both in developed and developing countries.
In sum, based on various perspectives, educational and technological efficiencies have varying degrees of effect on the country’s competitiveness and balanced development, as well as energy efficiency, export, and employment. Increasing the input and output of education and improving technological efficiency are inevitable choices whether it is a developed or developing country, regardless of which stage of development.
5. Conclusions
In this study, we selected input and output indicators, measured educational efficiency and technological efficiency of 53 sample countries, and measured the input-output efficiency of these countries in education and technology. By measuring DEA, we compared and analyzed the efficiency of education and technology among different countries and judged the next tendency. Based on Goal 2, we identified the effects of efficiency of education and technology on national macro and micro development from WCY, HDI to energy, export, high technology, and employment. Population and GDP per capita were used in the panel data model by fixed effects within regression as control variables. We selected some logarithmic indicators to eliminate the heteroscedasticity and improve the fitting degree of the calculated results.
This study focused on the efficiency that reflects the effectiveness of resources utilization; it is a more reasonable measure for the assessment of the development of technology and education instead of measuring the development of the technology and education input. In this study, we measured the efficiency of technology and education through the DEA model, and further measured their influences on the national development on the basis of results of technology and education efficiency measuring. Efficiency used as drivers to measure its influence on the development of a country for the first time.
Based on matrix analysis on educational and technological efficiencies, the most competitive countries in East Asia and Southeast Asia have achieved good results in educational output, even some developing countries including Philippines, India, Mainland China, and Indonesia. Korea, Taiwan, and Japan are countries where educational and technological efficiencies are prominent. Based on these findings, East Asian and Southeast Asian countries have great potential for development. How to further improve educational and science and technological output efficiency is the next step.
We further evaluate the effect of educational and technological efficiencies on national competitiveness, balanced development of the country, national energy efficiency, export, and employment according to the nonstructural panel data. Both the efficiency of education and science and technology positively affect the level of national competitiveness. The efficiency of science and technology has an effect on the balanced development of the country, but that of education has played a counter-productive role, which may be due to the rapid development of education in some developing countries and the lack of balance in other areas. Educational efficiency has a large role and related the country’s educational development. Energy intensity and CO2 emissions of these countries lag behind developed countries, leading to higher educational level and higher energy intensity. In terms of exports, countries with high technological efficiency have a clear advantage in terms of total export volume and per capita exports, particularly high-tech exports. For educationally efficient countries, high-tech products in exports have obvious advantages. Therefore, national exports have an obvious role in enhancing education and technology, either in dev eloped countries or China. The effect of the level of employment in the country and educational efficiency on the promotion of employment remains obvious.
China is a typical developing country. In the past two decades, science and technology or education has made considerable progress. From the early “invigorating the country through science” to the current “popular entrepreneurship and innovation,” a series of national policies has made great progress. Although China’s education and technology has been rapid development, due to the weak foundation, there is a big gap with the developed countries (Mu et al. 2010). Educational efficiency has some advantages. However, China has obvious deficiencies in technological efficiency, indicating the need for a transformation process. The products of education will be transformed into the products of science and technology to increase the market value.
The effect of technology efficiency is not obvious, but educational efficiency has a significant effect on energy intensity; the higher the educational output, the more energy is consumed. Therefore, it is worth to keep the balance between education and energy intensity. We found that the technological efficiency has a significant effect on both exports of goods and exports of goods per capita, but educational efficiency has no significant effect on exports. Thus it is necessary to improve technology efficiency to keep advantages in exports. The efficiency of technology is proportional to the economic level, which is positive effect on the employment rate. Raising educational efficiency also has a positive effect on the country’s employment scale and rate. Developing education has a positive role on the stability and development both in developed and developing countries. In sum, based on various perspectives, educational and technological efficiencies have varying degrees of effect on the country’s competitiveness and balanced development, as well as energy efficiency, export, and employment. Increasing the input and output of education and improving technological efficiency are inevitable choices whether it is a developed or developing country, regardless of which stage of development.
Acknowledgments
The authors gratefully acknowledge financial support from the China Postdoctoral Science Foundation funded project (2017M610937 & 2017M610098).
Author Contributions
Huan Xu and Fangtao Liu designed the paper; Huan Xu finished the literature review; Fangtao Liu analyzed the data and completed the empirical study; Huan Xu and Fangtao Liu wrote the paper together.
Conflicts of Interest
The authors declare no conflict of interest.
References
- Aristovnik, Aleksander, and Alka Obadić. 2014. Measuring relative efficiency of secondary education in selected EU and OECD countries: The case of Slovenia and Croatia. Technological and Economic Development of Economy 20: 419–33. [Google Scholar] [CrossRef]
- Bitman, William Robert, and Nawaz Sharif. 2008. A Conceptual Framework for Ranking R&D Projects. IEEE Transactions on Engineering Management 55: 267–78. [Google Scholar]
- Bursalioglu, Sibel Aybarc, and Sibel Selim. 2015. Factors Determining the Efficiency of Higher Education in the European Union and Turkey. BILIG 74: 45–69. [Google Scholar]
- Chang, Te-Yi, Pi-Heng Chung, and Shiuh-Sheng Hsu. 2012. Two-stage performance model for evaluating the managerial efficiency of higher education: Application by the Taiwanese tourism and leisure department. Journal of Hospitality, Leisure, Sport and Tourism Education 11: 168–77. [Google Scholar] [CrossRef]
- Chen, Jui-Kuei, and I.-Shuo Chen. 2011. Inno-Qual efficiency of higher education: Empirical testing using data envelopment analysis. Expert Systems with Applications 38: 1823–34. [Google Scholar] [CrossRef]
- Cherchye, Laurens, Willem Moesen, Nicky Rogge, and Tom Van Puyenbroeck. 2007. An introduction to ‘benefit of the doubt’ composite indicators. Social Indicators Research 82: 111–45. [Google Scholar] [CrossRef]
- Choi, Jinho, and Yong-Sik Hwang. 2014. Patent keyword network analysis for improving technology development efficiency. Technological Forecasting and Social Change 83: 170–82. [Google Scholar] [CrossRef]
- Clermont, Marcel. 2016. Effectiveness and efficiency of research in Germany over time: An analysis of German business schools between 2001 and 2009. Scientometrics 108: 1347–81. [Google Scholar] [CrossRef]
- Cooper, William, Lawrence Seiford, and Abraham Charnes. 1997. Data Envelopment Analysis: Theory, Methodology, and Applications, References and DEA-Solver Software. Boston: Kluwer Academic. [Google Scholar]
- Cordero-Ferrera, Jose Manuel, Francisco Pedraja-Chaparro, and Javier Salinas-Jimenez. 2008. Measuring efficiency in education: An analysis of different approaches for incorporating non-discretionary inputs. Applied Economics 40: 1323–39. [Google Scholar] [CrossRef]
- Geva-May, Iris. 2001. Higher education and attainment of policy goals: Interpretations for efficiency indicators in Israel. Higher Education 42: 265–305. [Google Scholar] [CrossRef]
- Grosskopf, Shawna, Kathy J. Hayes, and Lori L. Taylor. 2014. Efficiency in Education: Research and Implications. Applied Economic Perspectives and Policy 36: 175–210. [Google Scholar] [CrossRef]
- Lassibille, Gérard, and Lucía Navarro Gómez. 2000. Organization and Efficiency of Education Systems: Some empirical findings. Comparative Education 36: 7–19. [Google Scholar] [CrossRef]
- Lavado, Rouselle F., and Emilyn C. Cabanda. 2009. The efficiency of health and education expenditures in the Philippines. Central European Journal of Operations Research 17: 275–91. [Google Scholar] [CrossRef]
- Lin, Chin-Huang, Ho-Li Yang, and Dian-Yan Liou. 2010. A cross-national comparative analysis of industrial policy and competitive advantage. International Journal of Technology Management 49: 93–106. [Google Scholar] [CrossRef]
- Lu, Wen-Min, and Shiu-Wan Hung. 2011. Exploring the operating efficiency of Technology Development Programs by an intellectual capital perspective—A case study of Taiwan. Technovation 31: 374–83. [Google Scholar] [CrossRef]
- Lu, Wen-Min, Qian Long Kweh, Mohammad Nourani, and Feng-Wen Huang. 2016. Evaluating the efficiency of dual-use technology development programs from the R&D and socio-economic perspectives. Omega 62: 82–92. [Google Scholar]
- Mu, Rongping, Zhongbao Ren, Hefa Song, and Fang Chen. 2010. Innovative development and innovation capacity-building in China. International Journal Technology Management 51: 427–52. [Google Scholar] [CrossRef]
- Park, Sungmin. 2014. Analyzing the efficiency of small and medium-sized enterprises of a national technology innovation research and development program. SpringerPlus 3: 403. [Google Scholar] [CrossRef] [PubMed]
- Park, Sungmin. 2015. Evaluating the efficiency and productivity change within government subsidy recipients of a national technology innovation research and development program. R&D Management 45: 549–68. [Google Scholar]
- Rouse, Paul, and Martin Putterill. 2003. An integral framework for performance measurement. Management Decision 41: 791–805. [Google Scholar] [CrossRef]
- Sharma, Seema, and V. J. Thomas. 2008. Inter-country R&D efficiency analysis: An application of data envelopment analysis. Scientometrics 76: 483–501. [Google Scholar]
- So, Soon-Hu. 2011. Efficiency Analysis of R&D Investment for Technology Development in Regional Strategic Industries using Non-Radial SBM Model. Journal of Industrial Economics and Business 24: 1169–88. [Google Scholar]
- Wei, William X., Dezhi Chen, and Daiping Hu. 2016. Study on the Evolvement of Technology Development and Energy Efficiency-A Case Study of the Past 30 Years of Development in Shanghai. Sustainability 8: 457. [Google Scholar] [CrossRef]
- Wu, Jiangxing. 2009. Technology, Efficiency, Capital Accumulation and Chinese Regional Development Disparity. Quantitative & Technical Economics 26: 28–38. [Google Scholar]
© 2017 by the authors. Licensee MDPI, Basel, Switzerland. This article is an open access article distributed under the terms and conditions of the Creative Commons Attribution (CC BY) license (http://creativecommons.org/licenses/by/4.0/).