1. Introduction
In recent years, urban scholars across the social and environmental sciences have focused much theoretical and empirical attention on understanding and explaining the connections between resilience and post-disaster recovery and rebuilding [
1,
2,
3,
4,
5]. Probably the most comprehensive development of the notion of resilience, as expressed in studies of ecology and social systems, defines the concept as a return to normalcy or a pre-disaster state of stability or equilibrium. This “engineering” concept of resilience concentrates on stability at a presumed steady-state, and stresses resistance to a disturbance and the speed of return to the equilibrium point. Other non-equilibrium approaches view resilience as akin to adaptive capacity and explore the ability of cities to rebound, regenerate, and renew when affected by a major disaster or other perturbation [
6,
7,
8,
9,
10]. Such an approach eschews a notion of resilience as reaching an end-point or finale [
11,
12,
13,
14]. In the biological, ecological, and social sciences resilience is connected to ideas of functional interdependence, innovation, and transformability [
15,
16,
17,
18,
19]. The resilience approach emphasizes non-linear dynamics, thresholds, uncertainty, surprise when a system is faced with exogenous shocks. Such an approach stresses how periods of gradual change interplay with periods of volatile and rapid transformation and how macro and micro dynamics interact across temporal and spatial scales. The growing importance and pervasiveness of the resilience concept across fields—sociology, economics, ecology, environmental science, and so on—attests to the increasing popularity of the term to understand ecosystem dynamics, recovery from disaster, and social-ecological transformations [
20].
Informed by theoretical and empirical studies of social-ecological resilience, and based on a multi-method analysis of several data sources, we examine the ways in which post-disaster repopulation outcomes connect with social inequalities and ethnoracial diversity, using a case study of recovery outcomes in post-Katrina New Orleans. New Orleans is important to study because it represents a city that straddles the challenges of recent exogenous shocks occurring over long-term chronic distress. Since 2005, the region has experienced three major shocks including Hurricane Katrina, the Great Recession, and the Deepwater Horizon oil spill. These traumatic events have taken place in a context of slowly evolving “slow burn” stresses such as climate warming, sea level rise, and subsidence. Moreover, New Orleans has long been known as a city with troublesome social inequalities, high rates of poverty, and omnipresent community struggles linked to class conflict and racial injustice. These endemic social problems combined with an international reputation as a place of rich culture and celebrated heritage intimate New Orleans as a place of irony, paradox, and contradiction.
Our goal is to investigate the influence of ethnoracial diversity and social inequality on post-disaster recovery outcomes in the city. Three questions motivate this study: Do traumatic events alter processes and patterns of ethnoracial diversity? How do levels of ethnoracial diversity and social inequality interact to influence post-disaster recovery outcomes? How do post-disaster recovery outcomes shape resident perceptions of resilience? We begin by situating our research questions in the context of a burgeoning interdisciplinary debate on the drives and processes of post-disaster social-ecological recovery. Next, we discuss our methods, data sources, and analytical approach. Specifically, we use GIS methods, quantitative analysis, ethnographic field observations, and semi-structured interviews to investigate the recovery process in New Orleans. The rationale of our multi-method approach is underpinned by the principle of triangulation, which implies that researchers should seek to ensure that they are not over-reliant on a single research method and should instead employ more than one measurement procedure when investigating a research problem. That is, to enhance confidence in findings we use multiple methods. We also use triangulation as a means to discover new knowledge, new processes, and new trends vis-à-vis post-disaster recovery outcomes. We then present our findings based on our multi-method research design. Finally, we discuss the implications of our research for scholarship on post-disaster recovery and rebuilding.
2. Diversity, Resilience, and Post-Disaster Recovery
In the fields of urban studies and urban ecology, studies of post-disaster recovery have increasingly focused on “adaptive capacity”, “self-organization”, “diversity”, “transformability” and “resilience” as major factors that explain variation in the pace and trajectory of rebuilding [
21,
22]. In this conception, recovery rates vary according to the degree to which the system can build and increase the capacityfor learning, self-reorganization, renewal, and innovation when faced with disturbances [
23,
24]. In particular, scholars in a variety of different field have used the concept of resilience to illuminate regional change and link different types of regional stresses to patterns and processes of urban recovery [
25]. For post-disaster human systems, resilience lies in the ability of groups, organizations, and institutions to access and effectively use political, economic, cultural, and natural resources for recovery, transformation, and innovation. As noted, the ability of a municipality and surrounding cities to weather a disaster, according to Wallace and Wallace, “depends on the size of social networks in its neighborhoods and on the interconnection between the social networks” ([
26], p. 1). In this network conception of social resilience, “networks composed of a diversity of ‘bridging’ links to a diverse web of resources and ‘bonding’ links that build trust strengthen a community’s ability to adapt to change”. But networks composed only of “bonding” links can impose constraining social norms, foster group homophily, reinforce distrust of non-members and thereby erode resilience [
27]. Social and institutional networks exhibit varying degrees of organization, cohesion, flexibility, and resource flows. In resilient systems, networks are interdependent, heterogeneous, collaborative, and functionally redundant, with reserve capacity achieved through duplication, interchangeability, and cross-scale interconnections [
28,
29].
The view of cities as complex adaptive systems animates resilience scholarship that trumpets the value of “diversity” as a source of urban resilience to urban trauma. Researchers claim that diversity is essential in buffering the impact of exogenous shocks and disturbances in cities through practices that promote institutional differentiation, functional interdependence, and land-use and land-cover heterogeneity [
30]. Uneven spatial distribution of ethnic and racial groups across neighborhoods often coincides with uneven access to institutional and economic resources as well as exposure to hazards and other social problems (e.g., crime, pollution, and so on) [
31,
32,
33,
34,
35]. Adger
et al. [
23] argue that urban social diversity can confer resilience to the extent that governance and management frameworks can spread risk by diversifying patterns of resource use and by encouraging alternative activities and lifestyles. Such practices are analogous to the way management of a financial portfolio is able to sustain the growth in financial markets. In addition, diversity in the form of heterogeneous policies, socio-legal regulations, and land-use patterns and practices represent a mix of assets that can build functional redundancy to enhance the capacity of systems to face economic and environmental shocks and build resilience [
31]. Likewise, scholars acknowledge that practices that homogenize key elements of a system, eliminate redundancies, or concentrate resources can degrade adaptive capacities and proliferate vulnerabilities to environmental and socio-economic crises [
32].
Scholars have documented how various types and degrees of diversity can influence the stability and functioning of social-ecological systems. Wallace and Wallace [
26] have examined how the decline of ethnoracial diversity in New York City during the 1970s contributed to a loss of resilience and a proliferation of social problems including housing abandonment, drug use, violent crime, tuberculosis, and low-weight births. Increases in racial segregation eroded longstanding, intergenerational networks that previously linked diverse ethnic groups to strong social institutions embedded in particular neighborhoods. For example, the Italian presence in East Harlem almost disappeared, and East Harlem became Spanish Harlem. Central Harlem had health areas (aggregations of approximately 10 census tracts) that had approximately 98 percent African-American population by 1980. Increasing segregation and declining diversity meant that there were very few opportunities to support the maintenance of linkages between social networks of differing characteristics. The network-eroding effects of segregation were exacerbated by population displacement. Decades of building social, economic, and political institutions were undermined in New York and other cities through highway displacement, urban renewal relocations, and outmigration of residents to the expanding suburbs [
23]. In short, declines in ethnoracial diversity translated into declines in the number and strength of networked connections and an increase in the vulnerability of groups to economic downturns, fire and disease epidemics, and fiscal crisis of public institutions.
In this paper, we do not equate post-disaster “repopulation” or “recovery” with “resilience”
per se. A post-disaster city can experience a high rate of repopulation and reinvestment with extreme class and racial inequalities as measured by high levels of poverty, unemployment, and segregation.
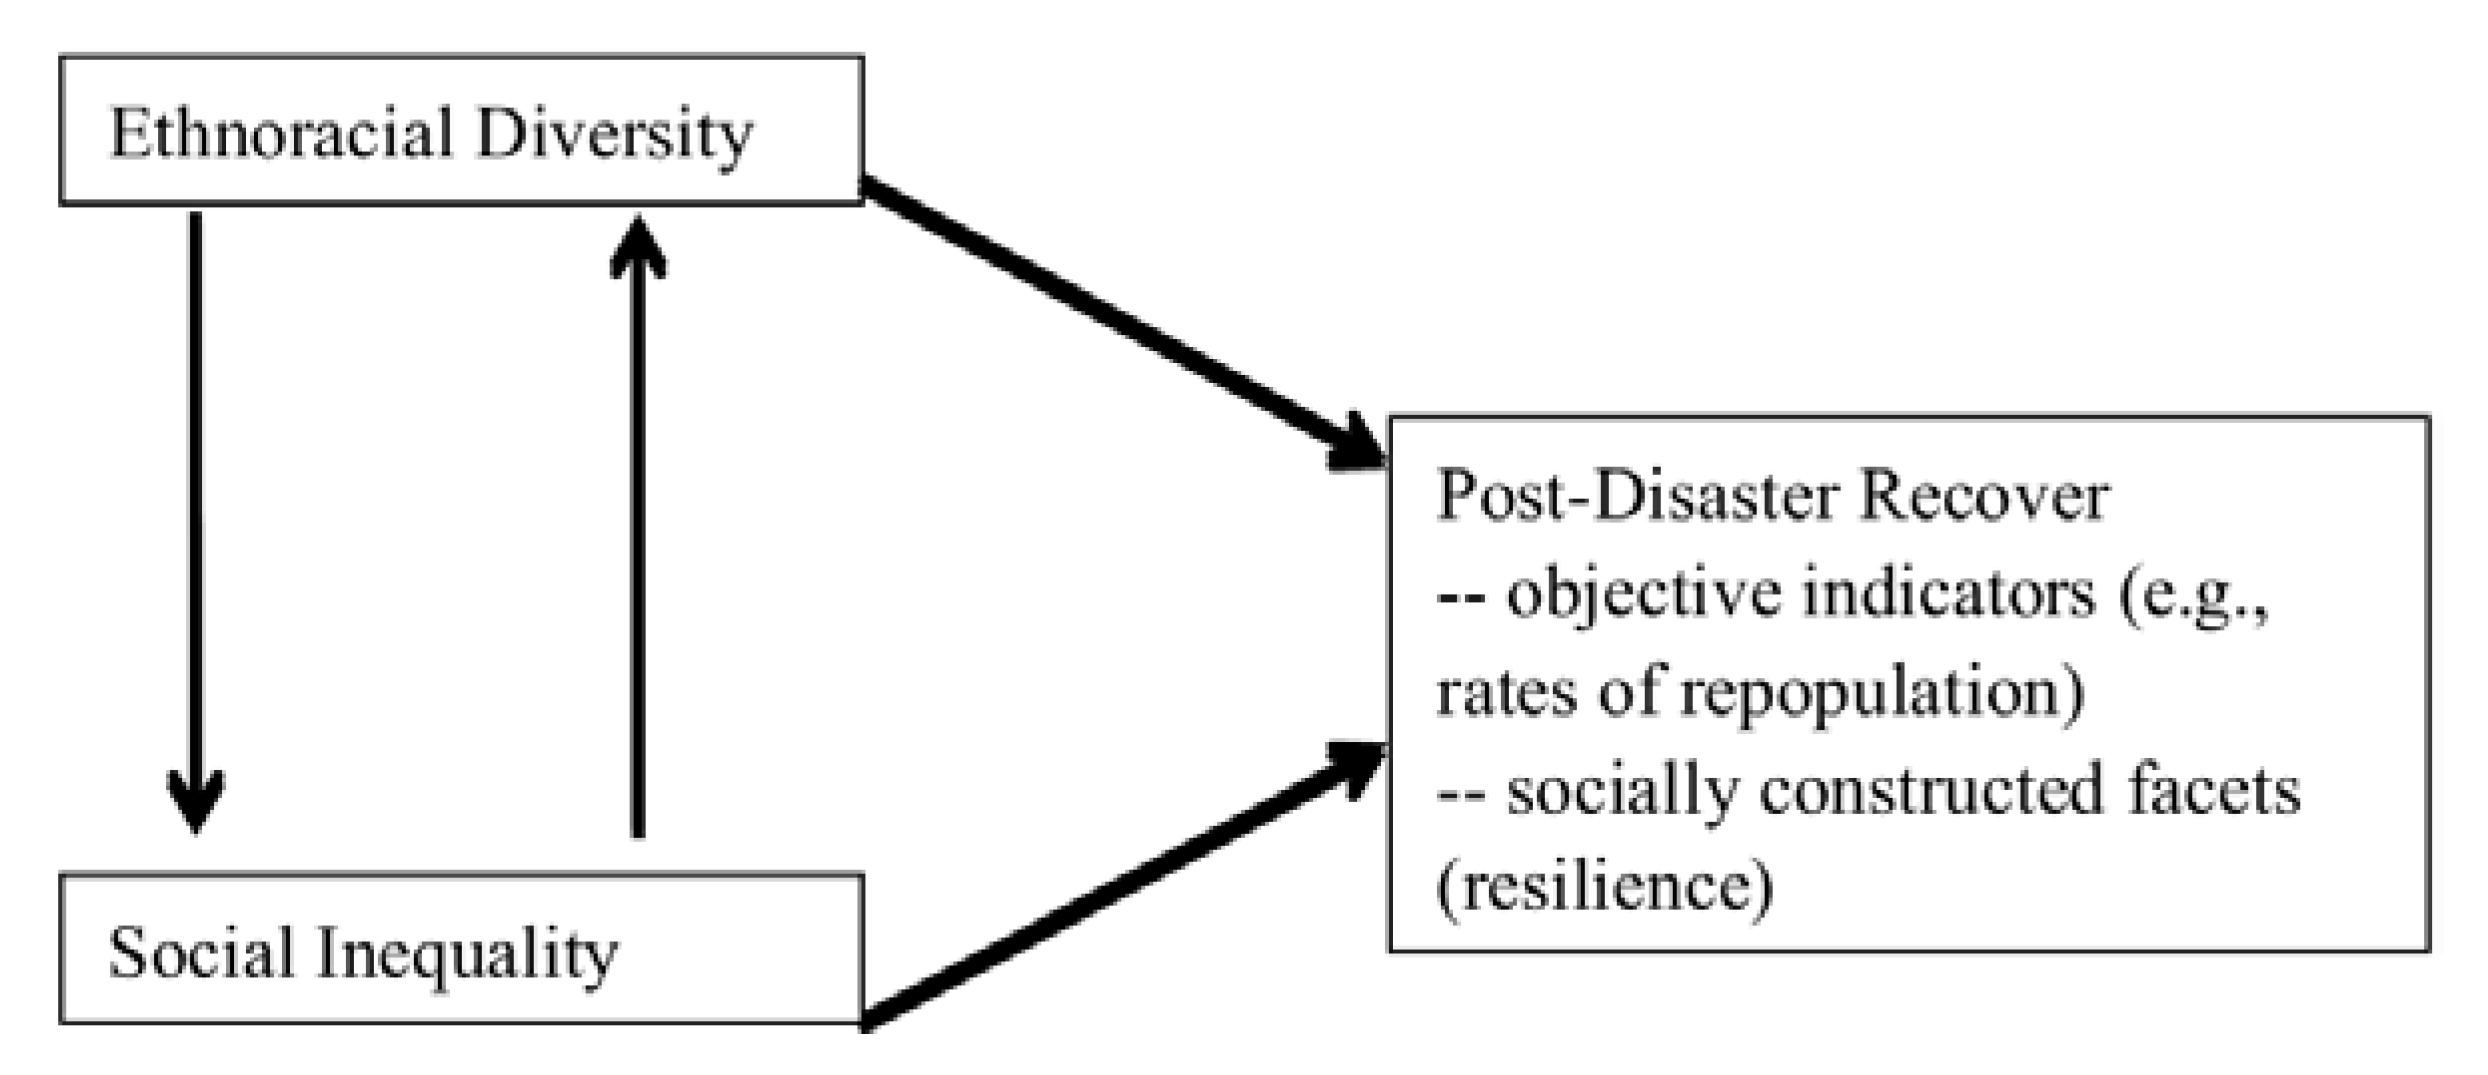
Figure 1 lays out our conceptual and analytical framework. Accordingly, our approach does not employ an operational conception of resilience and ask resilience “of what to what” [
34]. Rather, we analyze the post-Katrina recovery process by addressing the question of how repopulation outcomes and processes influence resident constructions of resilience. This approach addresses the ways in which resilience is not just an objective category but a malleable and socially constructed term that is fashioned through peoples’ efforts to promote community recovery. Understanding the ways in which post-disaster recovery outcomes interlock with social constructions of resilience is an important task given the increasing vulnerability of urban populations to hazards, disturbances, and disasters [
35,
36].
Figure 1.
Conceptual and Analytical Framework.
Figure 1.
Conceptual and Analytical Framework.
3. Methods, Data Sources, and Analytical Approach
The failure of the Army Corps of Engineers’ levee system during Hurricane Katrina sparked the largest population displacement in U.S. history and radically altered the organization and character of New Orleans’s urban neighborhoods. The hurricane caused catastrophic property damage along the Mississippi and Alabama coasts with 90,000 square miles of the Gulf Coast region designated as federal disaster areas, an area almost as large as the United Kingdom. The levee breaches flooded over 80 percent of the urbanized footprint of the city of New Orleans on the east bank of the Mississippi River, with some areas under twelve feet of water into September 2005. Additionally, some of neighboring Jefferson Parish to the west and all of St. Bernard Parish to the east suffered deep deluges. Nearly 228,000 occupied housing units, reflecting more than 45 percent of the metropolitan total also flooded. This total included 120,000 owner-occupied units (39 percent of the metropolitan area total) and 108,000 units occupied by renters (56 percent of the metropolitan total). More than 70,000 elderly people and 124,126 children—57,300 of them residing in single-parent families—lived in the flooded areas ([
37], pp. 14–15). In short, the intensity of Hurricane Katrina’s destruction, unequal effects, and disproportionate impacts on the disadvantaged makes a study of post-Katrina New Orleans timely and important.
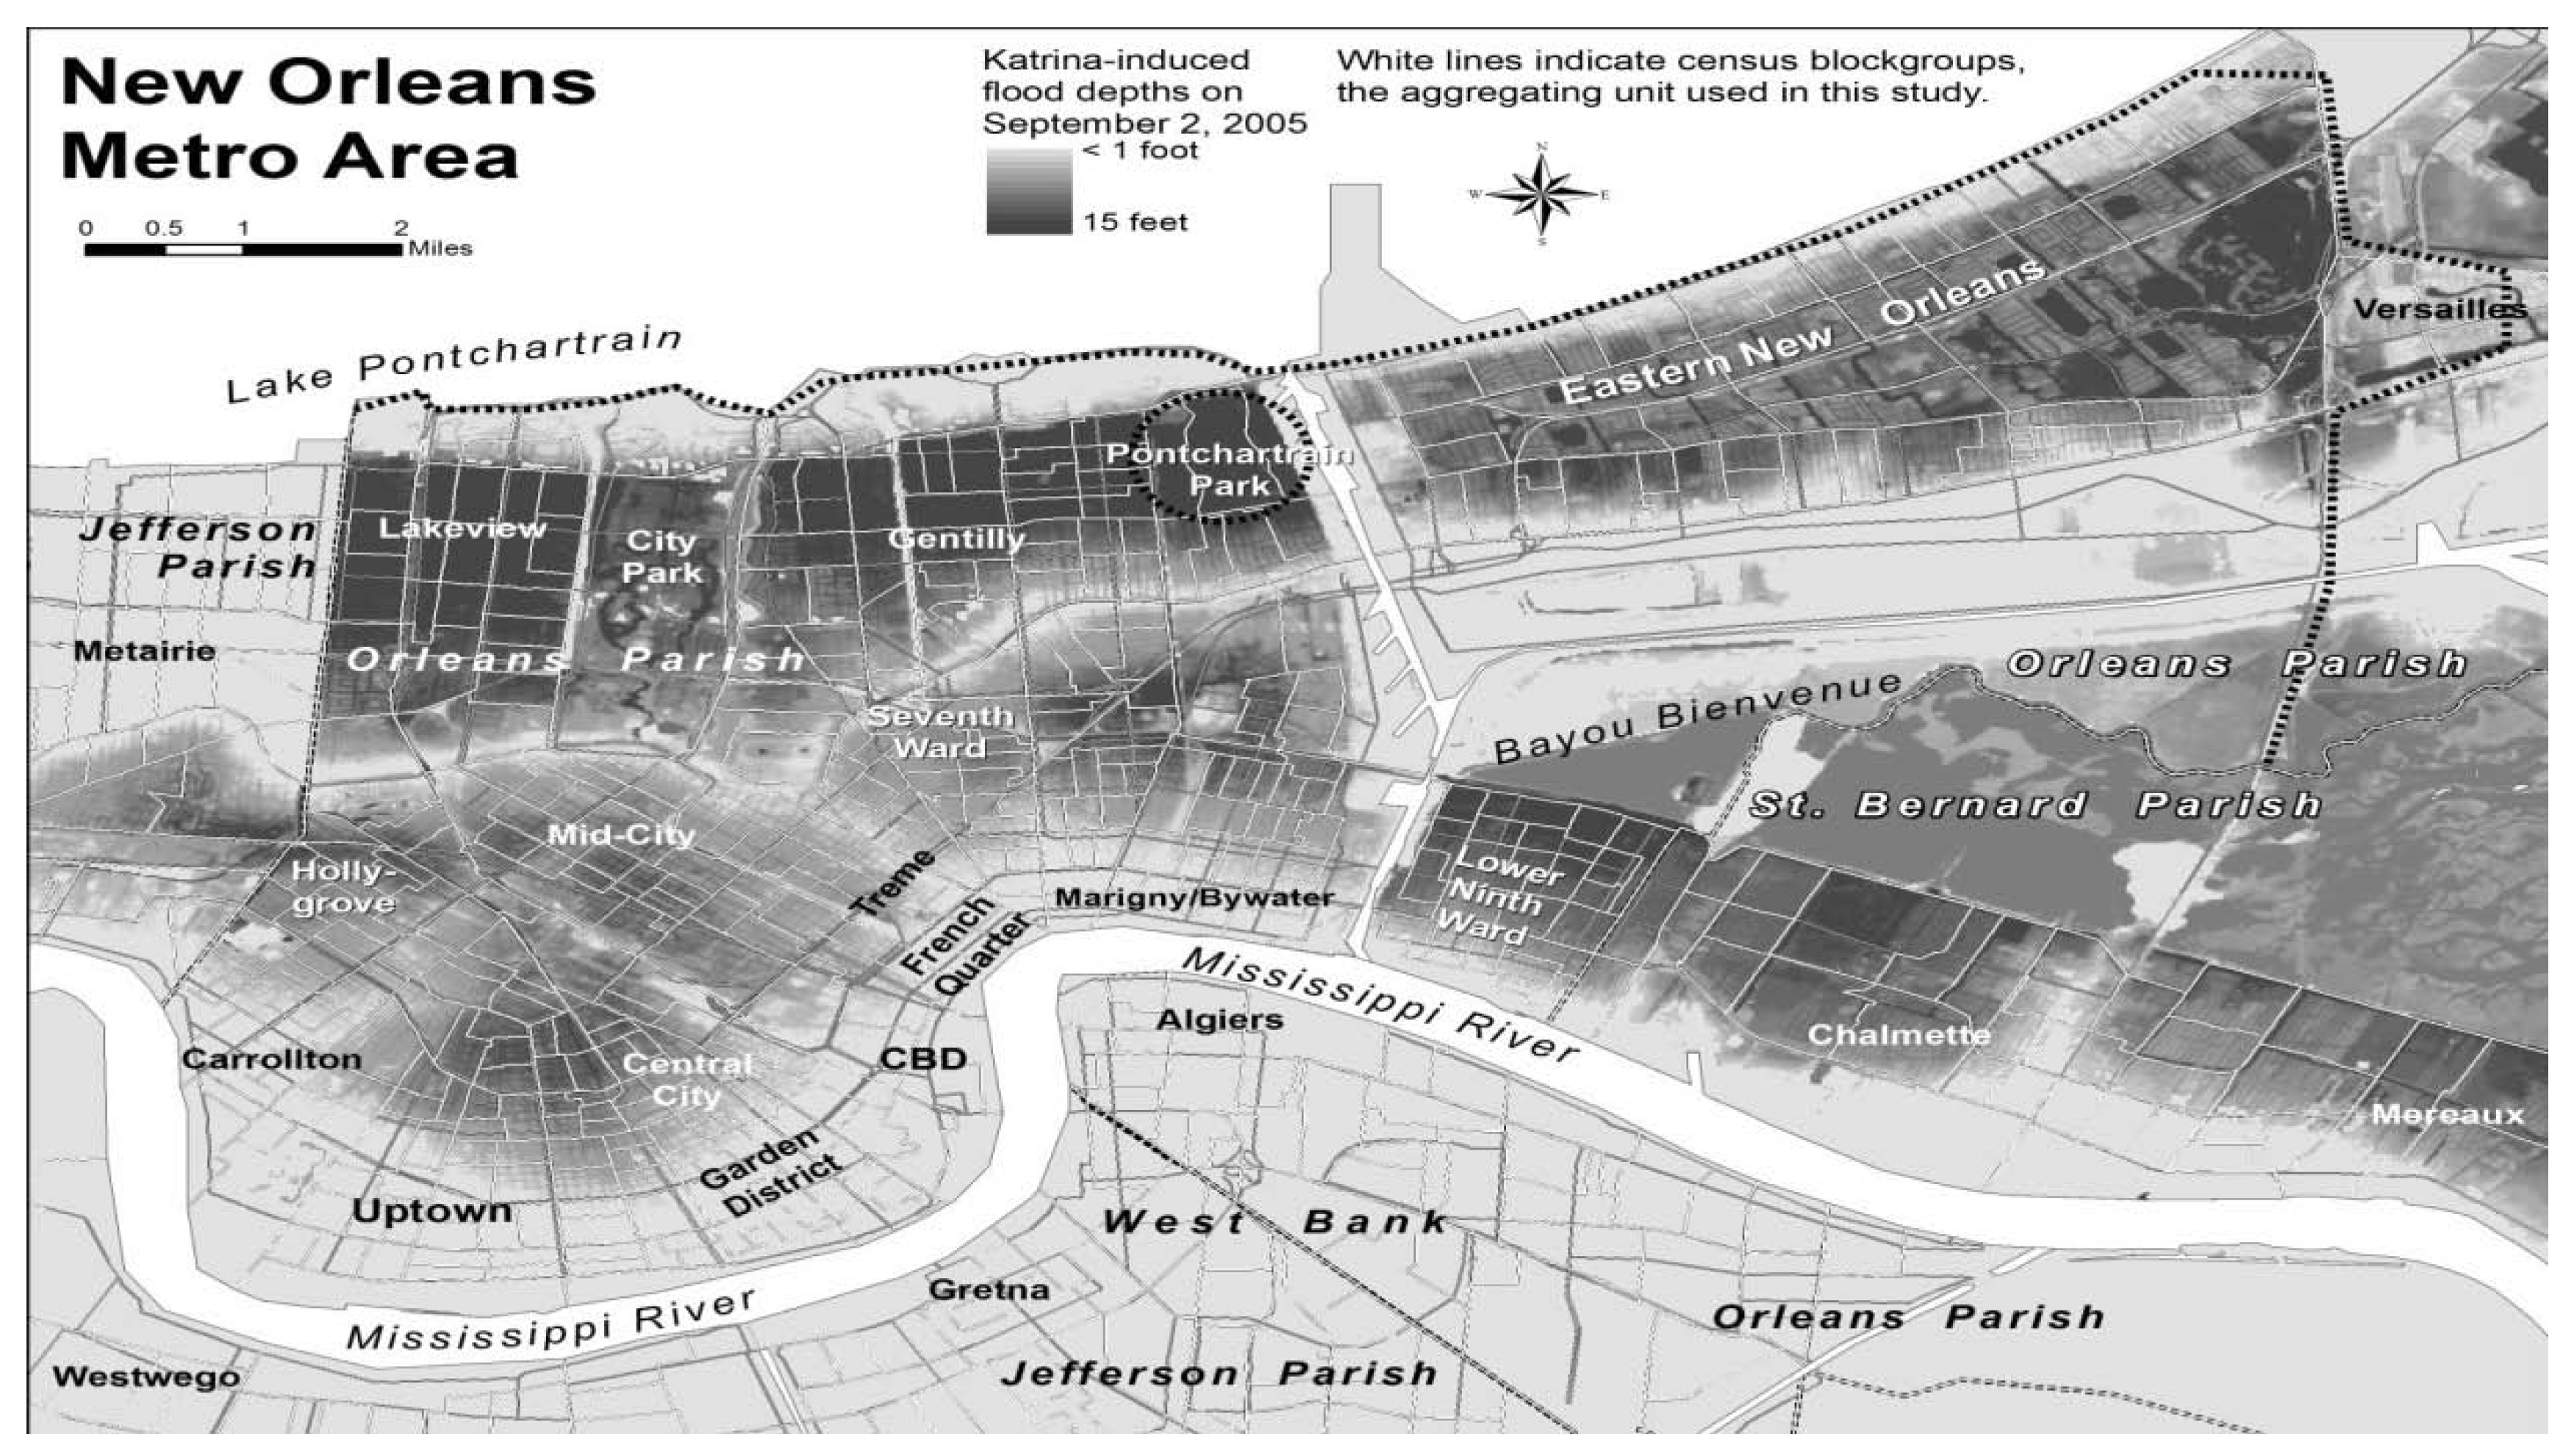
The map (
Figure 2) shows Katrina-induced flooding by its depth as measured by the Federal Emergency Management Administration (FEMA) on 2 September 2005, four days after the hurricane and levee breaches, and two days after the deluge peaked within the bowl-shaped city. The map shows flooding as measured at one foot increments overlaid with U.S. Census blockgroups (
N = 466)—the aggregating unit by which we conduct our analysis—and parish boundaries courtesy of Environmental Systems Research, Inc. (ESRI). The map shows that the darker the area, the deeper the flood water. Light gray areas reflect lower levels of flooding. We use flood depth as a measure of flood damage. FEMA studies, which assess structural damage produced by flooding, have noted that flood water that reaches 24 inches can carry away most automobiles and cause costly damage to property [
38]. Consistent with past research [
39,
40], we defined flood damage in terms of water depth and constructed an ordinal variable of “no flooding” (under six inches on 2 September 2005); “moderate flooding” (0.5 inches to 2.9 feet) and “deep flooding” (over three feet).
Figure 2.
Map of New Orleans showing flood depth by census block group.
Figure 2.
Map of New Orleans showing flood depth by census block group.
Source: Map prepared by Richard Campanella, March 2009.
3.1. City-Level Spatial Analysis Using Geographic Information Systems (GIS)
Our principle neighborhood-level variable of social diversity—ethnoracial diversity—is based on racial and ethnic composition. We use the Gibbs-Martin [
41] index to measure social diversity, defined as:
where
p is the proportion of individuals in the nominal racial/ethnic category in a given census blockgroup. We use this diversity index as a statistic to measure the probability that two randomly selected individuals from a given geographical area will be of different racial/ethnic backgrounds. If all people of a given area are of the same racial/ethnic background, the diversity index is zero (perfect homogeneity). Indices closer to 1 indicate a highly diverse racial/ethnic composition, toward perfect heterogeneity. We use the index as a measure of racial mixing and concentration, e.g., low levels can be seen as evidence of racial clustering and lack of interaction and contact with other ethnic and racial groups. High levels indicate a variety of ethnoracial groups and ethnoracial networks and connections.
Data on demographics before and after Hurricane Katrina are derived from the 2000 and 2010 U.S. Census of Orleans Parish aggregated at the block level, but analyzed at the blockgroup level because it was at that spatial scale that median household income (MHHI) was posted. Because of numerous micro-changes in blocks during this ten year period, we decided to use the 2000 blockgroup polygons as the spatial analysis unit. Scholars have noted that smaller units of analysis (blockgroups) tend to be modestly more homogeneous than larger ones (census tracts) [
42]. A major advantage of blockgroup analysis includes the ability to measure diversity in sub-neighborhood areas and to achieve a maximum degree of geographic drill-down enabling the most micro-perspective of demographics for a neighborhood or part of a study area. Our nominal categories include non-hispanic white, black, Hispanic, Asian, American Indian, Hawaiian/Pacific Islander, Multi-race, and Other. The vast majority of the New Orleans population fell into the first four categories (see
Table 1).
Table 1.
Total population and ethnoracial population in New Orleans, 2000–2011.
Table 1.
Total population and ethnoracial population in New Orleans, 2000–2011.
| Orleans Parish | |
|---|
| | 2000 | 2010 |
|---|
| Total Population | 484,674 | | 360,740 | |
| Ethnoracial Diversity | | | | |
| White alone, not Hispanic | 128,871 | 26.6% | 112,347 | 31.1% |
| Black or African American alone, not Hispanic | 323,392 | 66.7% | 213,489 | 59.2% |
| Hispanic (Any Race) | 14,826 | 3.1% | 18,927 | 5.2% |
| Asian alone, not Hispanic | 11,007 | 2.3% | 10,583 | 2.9% |
| Other, not Hispanic | 6,666 | 1.4% | 5,394 | 1.5% |
We back-aggregated the 2010 block-level demographics into the 2000 blockgroup polygons, using a “spatial join” (overlay) function in ESRI ArcMap 10.0 Geographical Information Systems (GIS). This process united the tabular attributes of the 2010 data with their spatial counterparts in the 2000 data, such that the output file had the spatial extents of the blockgroups as they stood in 2000 but the demographics of that area in both 2000 and 2010. The vast majority of blockgroups were identical in both decennial years; however, their internal reference numbers had been changed, which disallowed a traditional “database join” using a key item and necessitated a spatial join. All results were carefully checked for successful transmission, and no errors were found.
A detailed measurement of Katrina flood depth conducted by FEMA on 2 September 2005 was handled in a similar fashion, for example, by back-aggregating the vectorized postings of flood depth and averaging them within each Year-2000 blockgroup. This process provided a sound metric of level of damage, since the vast majority of Katrina destruction came from flood rather than wind, and the deeper the water, the greater the damage. The Gibbs-Martin index formula was then computed on the temporal pair, which was then differenced by subtracting the older metric from the more recent. The greater the magnitude of the positive number, the more that blockgroup diversified; the more negative, the more homogenized it became.
We aggregated MHHI (which reflects household incomes from 1999 reported in 2000) into five ordinal categories: “well below city average” was set at less than $20,350 (which represents 75 percent of the city average of $27,133); “below city average” (75–92 percent of city average, or $20,350 to $24,962); “city average” (92–108 percent of city average, or $24,962 to $29,304); “above city average” (108–127 percent of city average, or $29,304 to $34,459) and “well above city average” (greater than 127 percent of city average, or > $34,459). The metrics from the hundreds of blockgroups analyzed were then aggregated into unique spatial categories controlling for the three flood-damage slices and the five MHHI slices, a total of fifteen categories.
3.2. Neighborhood Level Analysis Using Ethnographic Field Observations and Interviews
In addition to our GIS analysis of census bureau data, we draw on ethnographic field observations and interviews conducted with neighborhood stakeholders in the Lower Ninth Ward neighborhood in New Orleans. This qualitative data provides a supportive and complementary role to our quantitative data collection and statistical analysis. One purpose of the interview and ethnographic data collection was to uncover how associations observed in the quantitative analyses manifest themselves in residents’ daily lives. A second purpose was to provide additional, in-depth information to triangulate methods and data sources to enhance validity and reliability. A third reason was to grasp and understand local residents’ experiences with post-disaster redevelopment, individually and collectively, and identify the mechanisms that influence different rates of neighborhood repopulation. A final reason was to explore conceptions of resilience in resident voices to highlight tensions between idealized conceptions and complicated realities of the post-Katrina rebuilding process.
We used a snowball sampling strategy to solicit participation from 25 community stakeholders. We contacted leaders of neighborhood coalitions, civic rights groups, and local non-profit organizations. We undertook interviews to compare and contrast experiences, understandings, and framing strategies that residents use to interpret the redevelopment of New Orleans neighborhoods in the years since Hurricane Katrina. We asked questions about the history and organization of the particular urban neighborhoods, the pace and trajectory of neighborhood recovery, and the challenges and opportunities that different neighborhoods and non-profit organizations faced in the years following the levee breaks. We also asked different residents, non-profit and neighborhood leaders about their views of Katrina’s impact on neighborhoods, the role of governments in responding to the disaster, and the ways in which different policies have both helped and hindered the rebuilding effort. To facilitate analysis, the transcribed interviews were coded in themes such as “perceptions of neighborhood resilience”, “perceptions of the impact of government policies and programs”, and “perceptions of resilience at the city level”, perceptions of resilience pertaining to different social-ecological systems and institutions—e.g., health care, education, economy, political system, flood and storm control, disaster management, ecosystem, etc.” Finally, we used Atlas.ti, a qualitative data software program, to assist with coding and structuring the interview data.
Overall, our ethnographic and interview methods complement our quantitative research in a number of ways. First, ethnography and interviews offer an opportunity to compare and contrast generalizing and particularizing analyses and findings, thus offering an opportunity for triangulating data sources and methods. Identifying similar results with different types of data enhances confidence in these results. Second, the inductive nature of ethnography and qualitative research can highlight the grassroots institutions and localized interactions around which organizing for community recovery and conflict may occur, such as disaster aid for housing recovery, reinvestment in schools, policing and security/safety, and environmental sustainability. Finally, ethnography can elucidate the mechanisms and explanations not observable in census data or GIS analyses. For example, GIS analyses can highlight changes in ethnoracial diversity and reveal demographic trends. Ethnographies can show how and why these socio-spatial changes and demographic trends occur. In short, the advantage of combining quantitative and qualitative data is that it provides a way of examining, in detail, the post-disaster recovery and transformation of a city, neighborhood, or series of neighborhoods that could be difficult to infer from one data source alone.
4. Ethnoracial Diversity and Socio-Spatial Inequality
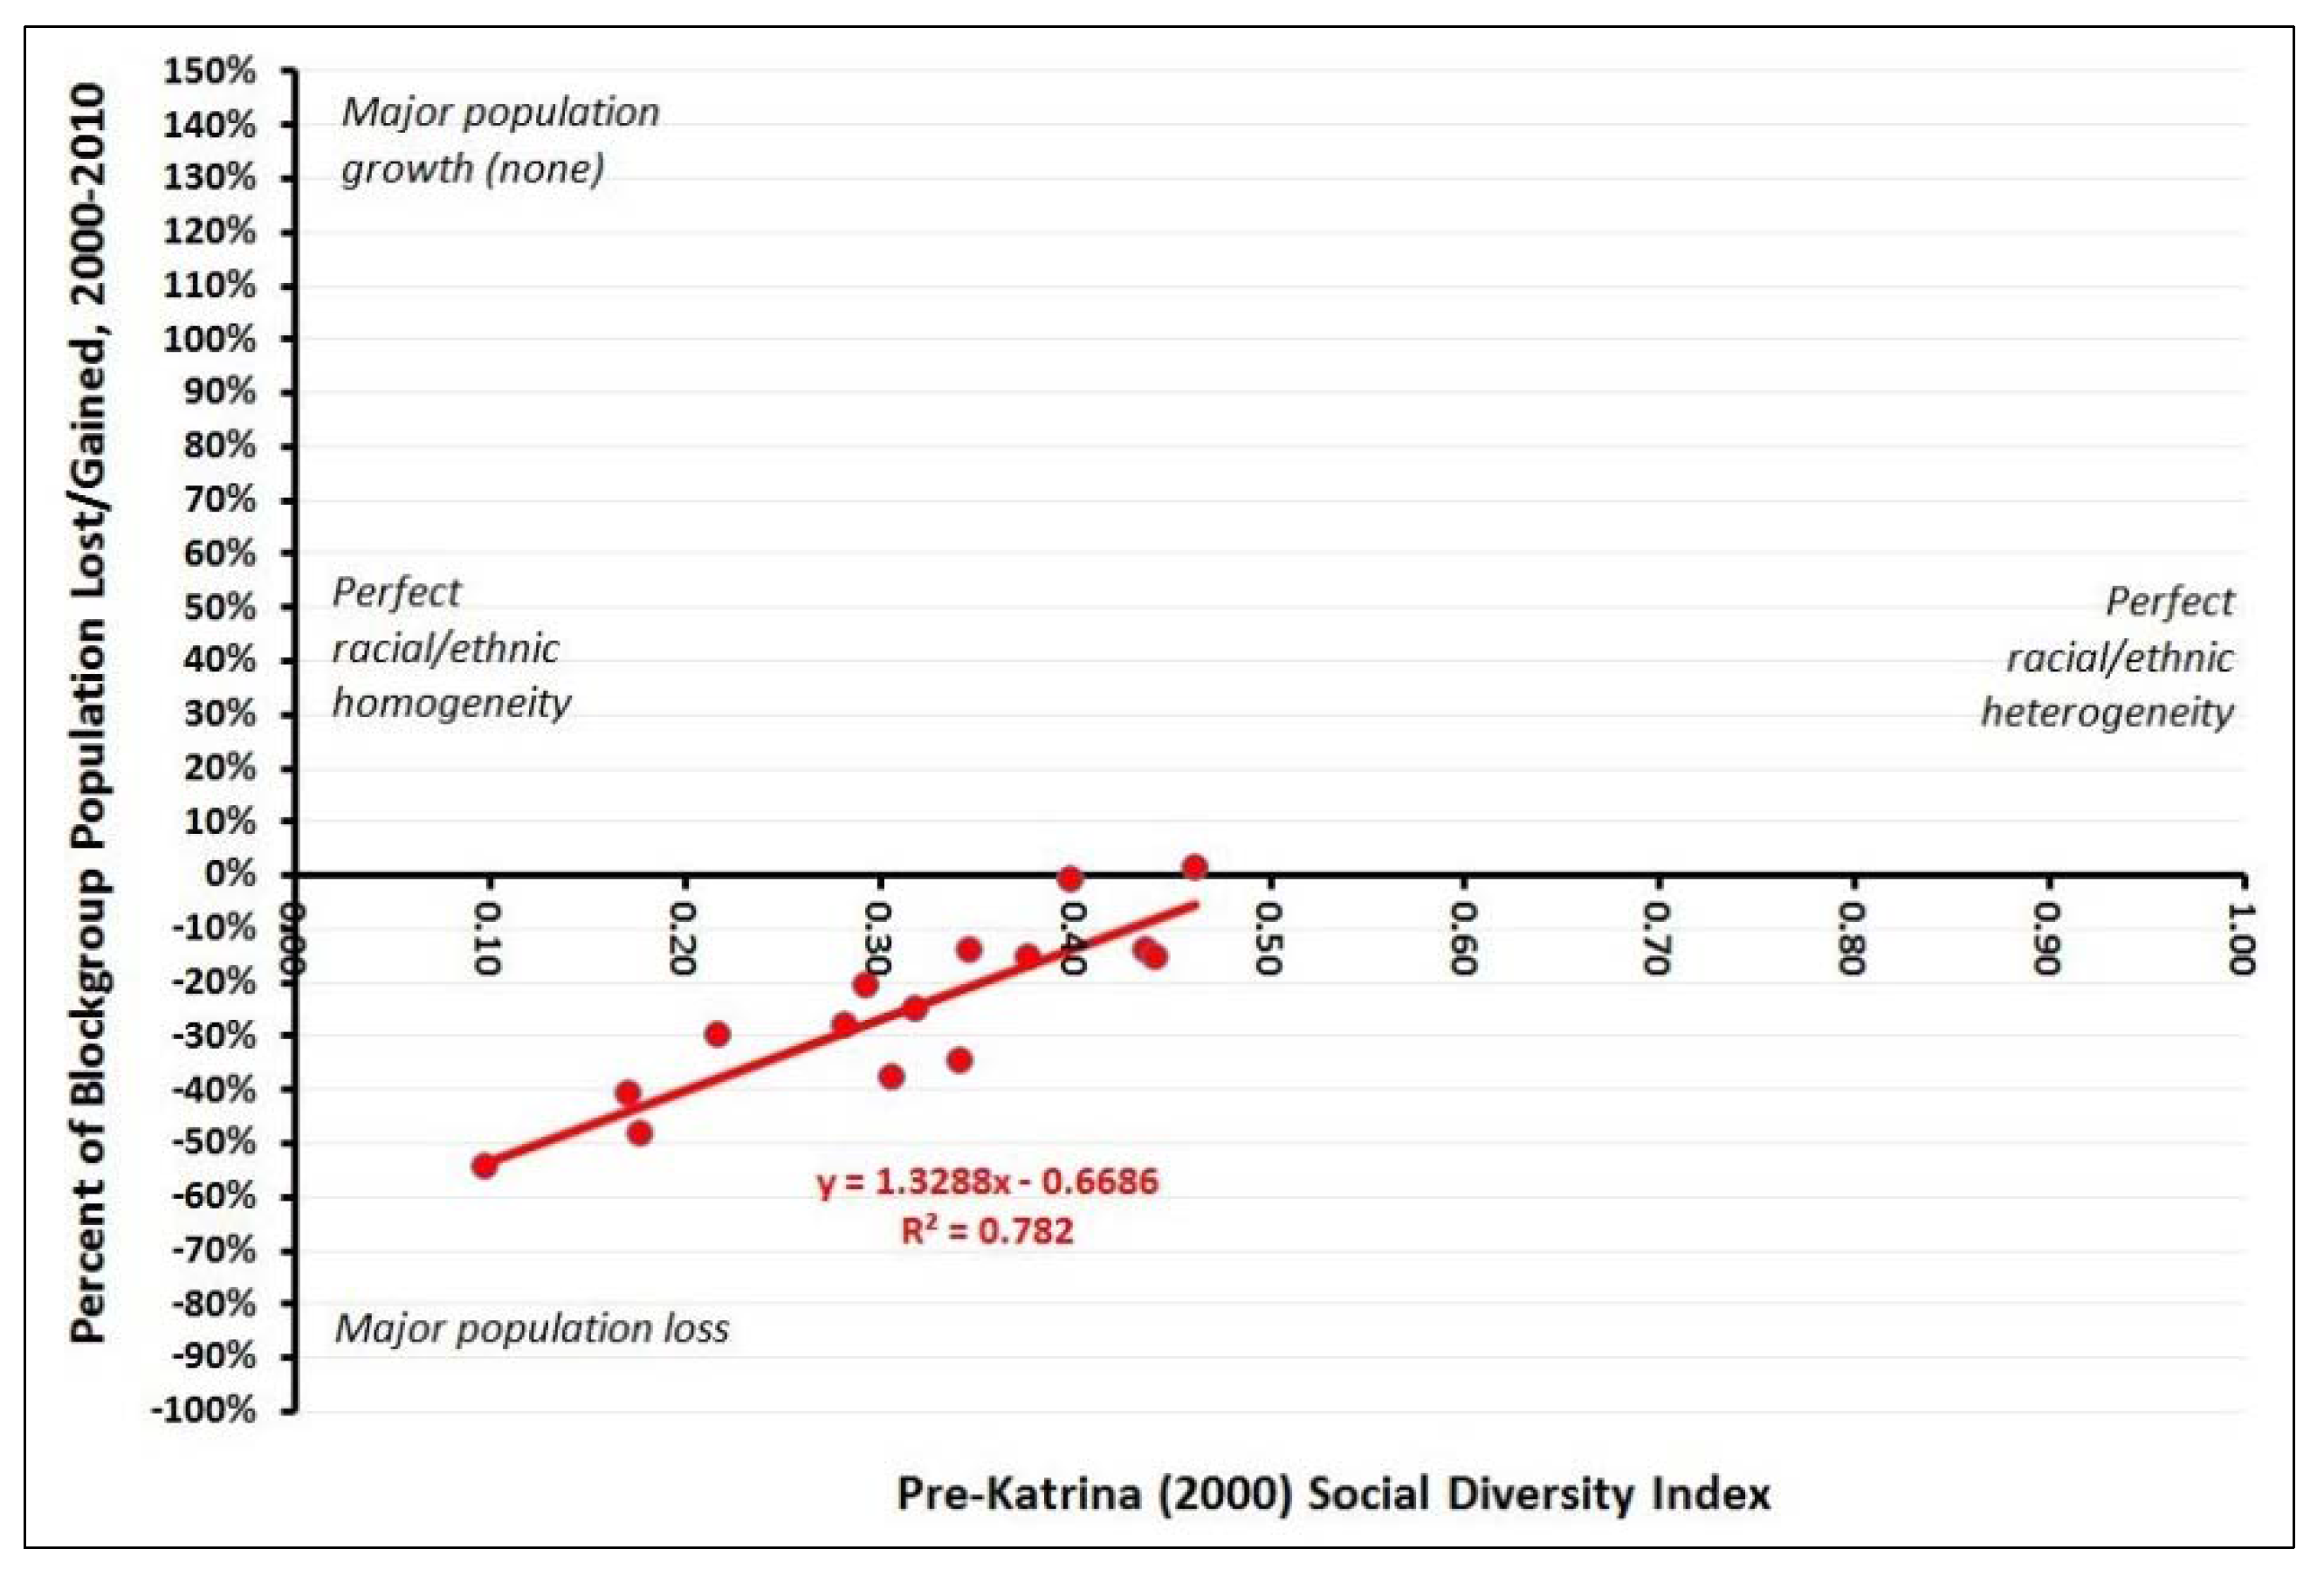
A major question we address is whether ethnoracial diversity had a significant impact on post-Katrina repopulation rates after controlling for income and flood depth. These relationships are probed in
Figure 3 and
Figure 4. Each figure shows a scatterplot of the level of ethnoracial diversity on the y-axis and repopulation rates on the x-axis.
Figure 3 reports on the relationship between ethnoracial diversity in 2000 and post-Katrina repopulation, while
Figure 4 reports on the relationship between ethnoracial diversity in 2010 and post-Katrina repopulation. Each figure shows the average regression line and also the R
2 (explained variance) for the regression, summarizing how strong the relationship is between ethnoracial diversity and repopulation.
Figure 3 suggests that pre-Katrina ethnoracial diversity exhibited a fairly strong positive relationship (R
2 = 0.79) with population recovery. That is, areas that were nearly totally homogenous according to the 2000 Census, with Gibbs-Martin indices in the 0.10–0.25 range, had the weakest population recovery rates. Areas that were more diverse (with Gibbs-Martin indices in the 0.25 to 0.46 range) fared better, having lost 15 percent to 40 percent of their populations or, in the most diverse areas, having mostly maintained their populations. No area had a diversity metric greater than 0.46. This figure suggests that while some areas were more diverse than others and they fared better in recovering their populations, no area was truly heterogeneous.
When we shift our question to inspect the relationship between post-Katrina ethnoracial diversity and repopulation, the relationship intensifies to R
2 = 0.85 (see
Figure 4). Areas that were the most diverse, relative to the rest of the city, when enumerated in 2010, also had the highest population recovery rates. The least diverse had the lowest return rates. Overall, approximately 61 percent of all 485 blockgroups witnessed increases in ethnoracial heterogeneity while 38 percent (
N = 185) of all blockgroups saw their diversity index move toward greater homogeneity. Block groups that did not flood saw their diversity score increase from 0.386 to 0.414 from 2000 to 2010 while blockgroups that flooded deeply witnessed an increase from 0.218 to 0.224 during the same time. Overall,
Figure 3 and
Figure 4 reveal strong associations between ethnoracial diversity and repopulation. In both figures the regression lines have a clearly positive slope and the explained variance is substantial.
Figure 3.
Relationships Between Pre-Katrina (2000) Social Diversity and Post-Katrina (2000–2010) Population Recovery.
Figure 3.
Relationships Between Pre-Katrina (2000) Social Diversity and Post-Katrina (2000–2010) Population Recovery.
Figure 4.
Relationships Between Post-Katrina (2010) Social Diversity and Post-Katrina (2000–2010) Population Recovery.
Figure 4.
Relationships Between Post-Katrina (2010) Social Diversity and Post-Katrina (2000–2010) Population Recovery.
Increases in ethnoracial diversity reflect post-Katrina declines in the African American population and a growth in the number and percentage of Hispanic and Asian residents. Before Hurricane Katrina, the vast majority of the most racially homogenous areas in New Orleans were African-American, and because most African-Americans in New Orleans are significantly poorer than whites, many members of this population found themselves in a socially vulnerable position when confronted with the disaster-induced displacement [
43,
44]. In our analysis of blockgroup data, African American residents made up 76 percent of the population that lived in deeply flooded areas, respectively. By contrast, whites made up just 20.6 percent of those who lived in neighborhoods that flooded deeply. Additionally, African Americans also found themselves more geographically exposed to the hazard, because they predominated in the eastern half of the metropolis, which suffered more than half of the total flooding due to its canal-scared landscape and proximity to the storm surge. African-Americans were also more likely to live on lower topographic zones and areas with low base-flood elevation levels relative to whites and people of higher socioeconomic status [
45]. Moreover, the return of African Americans has been sluggish because many tended to live in areas that experienced greater flooding and hence suffered more severe housing damage.
Finally,
Table 2 summarizes changes in ethnoracial diversity at the blockgroup level based on flood depth and median household income. When examining the diversity index in 2000, we see that blockgroups that flooded deeply reported low ethnoracial diversity scores within each of the five income groups. When examining changes in ethnoracial diversity pre- and post-Katrina, we see that all three damage categories—e.g., none/minimal, moderate flooding, and deep flooding—in the lowest income group (well below city average) saw their ethnoracial diversity score increase though moderate and deeply flooded areas experienced higher rates of diversification than blockgroups that experienced no flooding. Overall, within each of the five income categories, blockgroups that experienced high levels of trauma (flooded deeply) were more ethnic and racially homogeneous before Hurricane Katrina than areas that experienced moderate or no flooding. In addition, areas that were more ethnic and racially diverse before the disaster tended to experience less damage.
It is important to note that these ethnoracial diversity scores are very low and increases and decreases have been quite small. Two generalizations can be made from these data. First, low levels on the ethnoracial diversity index indicate extreme social homogeneity and therefore a low probability that randomly selected individuals from blockgroups will interact with different ethnic and racial groups. Low diversity neighborhoods characterize New Orleans and reflect ethnic and racial isolation and separation rather than intermingling and inclusion. Second, low diversity scores suggest entrenched socio-spatial inequality, a pattern that reveals the centrality of racial/ethnic segregation as a major characteristic of New Orleans neighborhoods. In 2000, New Orleans ranked as one of the nation’s most segregated metropolitan areas with a dissimilarity index of 0.690, a figure that remained virtually unchanged over two decades, from 0.683 in 1990 and 0.700 in 1980. By 2010, this level of segregation had declined to 0.633, a substantial decline, but a high figure nevertheless. The dissimilarity index measures the degree to which two groups are evenly spread among census tracts in a given city. Evenness is defined with respect to the racial composition of the city as a whole. With values ranging from 0 to 1, the index gives the percentage of one group who would have to move to achieve an even residential pattern—one where every tract replicates the group composition of the city. A value of 0.60 or above is considered very high. For example, a score of 0.60 for black-white segregation means that 60 percent of either group would have to move to a different tract for the two groups to become equally distributed [
46].
Table 2.
Median household income, flood damage, and change in social diversity index by census blockgroup, 2000–2010.
Table 2.
Median household income, flood damage, and change in social diversity index by census blockgroup, 2000–2010.
| Median Household Income (MHHI) | Flood Depth | Mean social diversity index, 2000 | Standard Deviation | Mean social diversity index, 2010 | Standard Deviation | Change in Diversity Score | Percent Change in Diversity Score |
|---|
| Well below city average | None/minimal | 0.29 | 0.18 | 0.36 | 0.21 | 0.07 | 23% |
| | Moderate | 0.17 | 0.18 | 0.27 | 0.20 | 0.10 | 60% |
| | Deep | 0.10 | 0.12 | 0.16 | 0.15 | 0.06 | 59% |
| Below city average | None/minimal | 0.44 | 0.18 | 0.42 | 0.19 | −0.02 | −4% |
| | Moderate | 0.22 | 0.17 | 0.31 | 0.19 | 0.09 | 43% |
| | Deep | 0.18 | 0.20 | 0.21 | 0.21 | 0.03 | 18% |
| Average | None/minimal | 0.44 | 0.13 | 0.45 | 0.13 | 0.01 | 3% |
| | Moderate | 0.32 | 0.19 | 0.37 | 0.21 | 0.05 | 14% |
| | Deep | 0.34 | 0.24 | 0.29 | 0.23 | −0.06 | −16% |
| Above city average | None/minimal | 0.46 | 0.15 | 0.40 | 0.12 | −0.06 | −13% |
| | Moderate | 0.38 | 0.16 | 0.36 | 0.17 | −0.01 | −3% |
| | Deep | 0.31 | 0.23 | 0.25 | 0.21 | −0.06 | −19% |
| Well above city average | None/minimal | 0.40 | 0.14 | 0.43 | 0.15 | 0.04 | 9% |
| | Moderate | 0.35 | 0.15 | 0.34 | 0.16 | −0.01 | −3% |
| | Deep | 0.28 | 0.16 | 0.26 | 0.15 | −0.02 | −6% |
Before Katrina, New Orleans had the second-highest rate of African American concentrated poverty in the nation, with 37 percent of the city’s African American population living in neighborhoods of concentrated poverty. While this poverty rate declined to 32 percent in 2010, poverty figures reveal striking racial differences in poverty. Poverty rates for African Americans are more than double that of whites (14 percent in 2010) and, even more striking, the poverty rate for African American children below age 17 stands at 48 percent, almost seven times the poverty rate for white children (7 percent) [
47]. Median household income by race in Orleans Parish also reveals extreme racial disparities. In 2010, the median household income for whites was $57,031 well above the city average of $37,726. In contrast, the median household income level for African Americans was $30,167, well below the city average [
48].
In short, modest gains in ethnoracial diversity have occurred in a context of intense and highly rigid patterns of racial residential segregation and high poverty rates. Despite the dramatic demographic reordering of neighborhoods since the disaster, the vestiges of segregation continue to permeate the socio-spatial makeup of the city and its neighborhoods. We can understand post-Katrina recovery and repopulation trends in the context of larger socio-spatial relations including enduring patterns of concentrated poverty and residential segregation. In the decades after 1970, the emergence of concentrated poverty and extreme segregation created a city with dramatic and troubling racial and class disparities [
49,
50,
51,
52]. While the entire city suffered from a low median household income and other social problems, the African American population suffered even more [
53]. Moreover, the concentrated geographic pattern of poverty and residential segregation sharpened and intensified these problems among poor African Americans [
54]. As a result, by the time Hurricane Katrina roared ashore, New Orleans had become a place sharply divided by race and class—a city where many poor black residents were geographically isolated from the rest of the population [
55]. Because black neighborhoods experienced greater flooding and population loss after the deluge, these neighborhoods were more likely to diversify than areas that experienced less flooding and less population loss. Thus, post-Katrina repopulation rates reflect the legacies of past socio-spatial inequalities of race/ethnicity and class.
4.1. Resident Perceptions of Resilience: Insights from Ethnographic Field Observations and Interviews
Since the collapse of the Army Corps of Engineers levee system after Hurricane Katrina, the Lower Ninth Ward has attracted much attention from media and researchers interested in understanding resident interactions, reactions, and interpretations of the ongoing recovery and rebuilding process. Like other areas in the city, up to ten feet of floodwater engulfed the neighborhood—the worst degree of inundation in the city—and repopulation and physical rebuilding have been slow. By 2010, the neighborhood had only recovered approximately 20 percent of its pre-Katrina population (see
Table 3). According to the 2010 census, only 2842 Lower Ninth Ward residents live in the neighborhood out of a pre-Katrina population of 14,008. During 2006 and 2007, many of the flooded homes in the Ninth Ward were bulldozed rather than repopulated by homeowners, a development that caused a 60 percent drop in the percentage of total housing units in the Lower Ninth Ward, from to 5601 housing units to 2039, a loss of 3562 units.
Through our interviews and ethnographic research, we have found that attachment to place is considered a strong indicator of neighborhood resilience but “attachment” has different meanings for residents. Several activities have been initiated by the Center for Sustainable Engagement and Development (CSED), local non-profit organizations, to inculcate a sense of place and foster an appreciation of the history and culture of the neighborhood. These activities include the “Food Action Plan” to promote urban farming and healthy food choices, the “Sustainability Series—Living with Water, Discussion and Site Tour”, and the creation of Pam’s Place, named in honor of CSED founder Pam Dashiell—a landscape depot, community garden and wetlands restoration exhibit. The aim of these and other community activities is to “restore the Lower Ninth Ward as a safe, environmentally just and economically vibrant community”, according to one person we interviewed [
56]. A strong sense of place is exemplified in many of the initiatives undertaken by CSED, such as supporting the construction of the Alfred Lawless School system that was flooded during the storm, the development of economic opportunities along the commercial corridors of the neighborhood, and assisting with efforts to establish a grocery store in the community.
Table 3.
Total population and ethnic/racial population for New Orleans and the Lower Ninth Ward, 2000–2010.
Table 3.
Total population and ethnic/racial population for New Orleans and the Lower Ninth Ward, 2000–2010.
| | | | Change |
|---|
| | 2000 | 2010 | 2000-2010 |
|---|
| Orleans Parish: | | | |
|---|
| Total Population | 484,676 | 343,829 | −140,845 (−29%) |
| White | 128,871 (27%) | 104,770 (30%) | −24,101 (−37%) |
| African American | 323,392 (67%) | 204,866 (60%) | −118,526 (−19%) |
| Asian | 11,007 (2.0%) | 9,988 (3.0%) | −1,019 (−9.0%) |
| Hispanic | 14,826 | 18,051 | 3,225 (21%) |
| Lower Ninth Ward: | | | |
| Total Population | 14,008 | 2,842 | −11,166 (−79.7%) |
| White | 73 (0.5%) | 50 (1.8%) | −23 (−31.5%) |
| African American | 13,813 (98.6%) | 2,713 (95.5%) | −11,100 (−80%) |
| Asian | 5 (<0.1%) | 2 (0.1%) | 3 (−60%) |
| Hispanic | 70 (0.5%) | 42 (1.5%) | 28 (−40%) |
For some residents, resilience is not a static descriptor of a neighborhood but is expressed in actions that assist with coastal restoration and wetlands regeneration. Resilience is also expressed, according to some residents, in efforts to eliminate blight, enhance walkability, and assist with the return of displaced residents. There is an important feedback loop working through these activities: place attachment generating activities foster a resilient neighborhood and a resilient neighborhood creates the conditions and context for engaged residents to generate strong attachments to community. There is an understanding among residents that place attachment is important for community resilience, and enhancing community resilience means strengthening people–place connections. Here bridging ties with extra-local organizations and federal and state government agencies (e.g., FEMA, Army Corps of Engineers, Louisiana Economic Development, etc.) interconnect with bonding ties among residents to shape and influence resident constructions of resilience. Bridging ties are not just networks for funneling resources but cross-scale interactions that facilitate information exchange and communication.
One meaning of resilience that radiates from the voices of residents is one in which current revitalization efforts are clearly and explicitly connected with collective memories and authentic accounts of the past. Resilience means the preservation of the neighborhood’s history and knowledge, including knowledge of the surrounding wetland ecosystem. According to one resident we interviewed:
Actually, community restoration must be about residents becoming active stewards and caretakers of the environment. The culture of the wetlands, the waterways, and bayous must interact with the Lower Ninth Ward. If not, then culture will dissolve. An upscale development does mean community restoration or the preservation of culture. Cultures sit in neighborhoods and it is vital that we maintain that knowledge base—the history and culture of the community—in order to be resilient. And if history gets lost then we lose our community because there’s nobody to say, that’s not really what it was, no this is how it was.
The above quote suggests a meaning of resilience that is rooted in a conception of the Lower Ninth Ward as integrated with the nearby wetlands ecosystem. In particular, a source of hope and inspiration is the restoration of the Bayou Bienvenue, a 31,000 acre wetland ecosystem that has experience severe degradation from a combination of land and water management practices compounded by rising sea levels (see
Figure 2). Understanding the trends of the ecosystem degradation is an important starting point for the ecosystem restoration and community resilience. The meaning is widely shared and is actively promoted by community organizations and non-profit organizations working in the neighborhood. According to the website of the CSED:
The health and well-being of the Lower Ninth Ward—its resilience as a community—is deeply intertwined with the Mississippi River on the south and the Bayou Bienvenue Wetland Triangle to the north. This new understanding continues to inform Coastal Sustainability and the critical role of wetlands throughout New Orleans, across Louisiana and along the Gulf Coast.
In the quotes below, two residents reflect on the integration of the community with collective knowledge of the Bayou Bienvenue ecosystem that surrounds the neighborhood on the north, east, and south sides. For some residents, neighborhood identity is inseparable from the nearby marshes and bayous. Thus, resilience means not just repopulation and physical rebuilding but restoring the health and sustainability of the surrounding Bayou Bienvenue ecosystem. As one person told us,
People’s attachment with the bayou makes the community less isolated than in the past. Since the storm, people are paying more attention to the bayou and wetlands and this has created an opportunity for the community to be more engaged. Also, when you look at the children and teenagers in the Lower Ninth Ward and also those who didn’t grow up in that community but maybe came from other places, and can see how quickly the attachment to the natural environment becomes. People are now aware of how bayou can produce devastation. And this creates new opportunities for community preservation because people are more engaged with the bayou. We are not as isolated as we once were because people want to come to visit and learn from the Ninth Ward.
Through various activities with residents and stakeholders, we are trying to make sure that the community and others continue to build a knowledge base about the area. While research and studies are important, there is still so much more to know about. I’ve seen in other parts of the country, how a body of water can make a community, or reinvent a community, whether it’s a port city or a bay, and I think the bayou has that kind of possibility of what it can make to the lower nine and to New Orleans.
Another interesting finding from our ethnographic field observations is the diversity of opinions and views of “sustainability” in discussions of resilience. In addition to typical neighborhood calls for repaired streets and code enforcement, Lower Ninth Ward residents now regularly lobby for sustainable development including structurally sound levees, bayou restoration, and environmentally sensitive construction. Yet tensions have emerged over whether “green” sustainability practices—e.g., radiant barrier installations, rooftop solar arrays, compact fluorescent light bulb replacements, and so on—are the best use of resources and time for creating and maintaining community resilience. Some residents have voiced concern that green sustainability practices, especially those espoused by extra-local non-profit organizations and foundations, are piecemeal and ad hoc. They “address individual homes but not the community as a whole”, according to one resident [
61]. Moreover, for some residents the emphasis on green sustainability diverts attention from more important social problems that plague the neighborhood such as intense poverty, chronic unemployment, poor schools, inadequate health care, and so on). As one resident told us,
It is great for the homes in the community to be green and conserve energy. But that is not enough. Restoration means restoring a sense of community not just the houses. This is an important issue that I think people do not understand. Green homes do not make a resilient community.
Overall, Lower Ninth Ward residents have a common desire for resilient neighborhood institutions but they do not always agree on what resilience means. Like the scholarly literature that reveals mixed, diverse, and conflicting conceptions and indicators of resilience, residents have constructed a variety of meanings of resilience to understand the post-Katrina recovery process and to situate themselves as active agents in community rebuilding. In particular, residents routinely call for increased “sustainability” and “sustainable” engagement and development as a means to achieving great neighborhood recovery and resilience. At the same time, residents are mindful that resilience also means accepting and being aware of the continued vulnerability of the neighborhood and region to storms, floods, and other climate change induced disturbances. A resilient neighborhood, according to some neighbors we interviewed, is an “engaged” neighborhood that is active in taking steps to prepare for future hazards and disasters. Indeed, according to some residents, vulnerability awareness and disaster preparation are important mechanisms for fostering strong bonding links among people that reflects and reinforces a resilient community identity. These points suggest that for residents, resilience and vulnerability are not opposites or conflicting concepts but integral to everyday life and community organization.
5. Conclusions
Over the years, pundits and researchers have debated whether post-Katrina recovery and rebuilding efforts reflect a continuance of past socio-demographic disparities around the nexus of race and class or whether the region is experiencing a lessening of inequality and becoming more sustainable and resilient to disasters. A number of researchers and officials maintain that while the region has suffered greatly, public and private reinvestments have spurred a remarkable recovery. For Michael Hecht, president and CEO of Greater New Orleans Inc., New Orleans is a resilient city that “offers lessons for the rest of the United States. We are sitting in the middle of one of the greatest urban revivals of our lifetime. There is a real lesson in rebirth and recovery here for the entire nation. All you have to do is believe in miracles” [
63]. Based on a comprehensive examination of the region in 2010 using 20 key indicators, the Brookings Institution observed that the New Orleans area “has become more ‘resilient’, with increased civic capacity and new systemic reforms, better positioning the metro area to adapt and transform its future” ([
64], p. 2). Overall, according to the Brookings Institution, despite two post-Katrina blows—the Great Recession and the BP oil spill in the Gulf of Mexico—the “greater New Orleans is rebounding and, in some ways, doing so better than before” the Hurricane Katrina disaster ([
64], p. 5).
Our analysis both challenges and supports these assertions. Pronouncements of resilience are are socially constructed and interconnect with questions of recovery indicators, pace, and scale. Moreover, our ethnographic field observations and interviews point to the multidimensionality of resilience in which resident perceptions show resilience to be heterogeneous, conflictual, and contested. The malleability and fluidity of resilience emanates from stakeholders’ different and sometimes competing notions of their neighborhood’s identity. These points dovetail with Amundsen’s [
65] recent call for researchers to consider the multidimensional, complex, and dynamic nature of resilience. Although some New Orleans residents may consider their neighborhoods to be resilient, the rate and magnitude of expected systemic global changes, especially climate change and increasing storm intensity and frequency, means that current resilience may be fleeting and ephemeral. Moreover, the current reality of rising sea levels and subsidence in southern Louisiana means that future resilience cannot be taken for granted and may in fact be an illusion.
Finally, our study suggests several directions for future research on the linkages among diversity, inequality, and post-disaster recovery. While scholars have pointed out that diversity is essential for absorbing disturbance and helping with regeneration and reorganization following disturbance, there is no guarantee that all types of diversity will result in positive outcomes. Moreover, Nelson
et al. [
32], Bell
et al. [
66], and Janssen [
67] have suggested that diversity has trade-offs and can have costs, as well as benefits, in both ecological and social contexts. We have focused on one measure of diversity (ethnoracial diversity) and examined its interaction with inequality and damage to investigate post-disaster repopulation trends at the neighborhood scale. More research is needed to assess whether different types of diversity—e.g., institutions, socioeconomic status, land-uses, jobs, spatial distribution of housing, and so on—can produce different post-disaster outcomes and/or contribute to new risks and vulnerabilities. Moreover, we need more investigation on how the diversity of cross-scale interactions, networks, and flows of resources can shape and determine the pace and trajectory of post-disaster repopulation and recovery. It might be that some types of diversity may proliferate vulnerabilities to perturbation. The interactions among different types of diversity and different forms of inequality deserve careful attention.

