Article

Assessing the Impact of Immigration on Peruvian Society: A Quantitative Approach to the Analysis of Economical, Social, Educational and Governmental Indicators (2000–2022)

by
Victor Andres Ayma Quirita
1,*,
Walter Aliaga
2,
Victor Hugo Ayma Quirita
2 and
Juan David Cárdenas
2
1
Departamento Académico de Ingeniería, Pontificia Universidad Católica del Perú, Av. Universitaria 1801, San Miguel, Lima 15088, Peru
2
Department of Engineering, Universidad del Pacífico, Jr. Gral, Jirón Luis Sánchez Cerro 2141, Jesús María, Lima 15072, Peru
*
Author to whom correspondence should be addressed.
Soc. Sci. 2026, 15(7), 464; https://doi.org/10.3390/socsci15070464
Submission received: 17 March 2026 / Revised: 11 May 2026 / Accepted: 13 May 2026 / Published: 10 July 2026

Abstract

In this study, we conduct an exploratory and econometric assessment of the multidimensional impact of recent immigration, predominantly Venezuelan, on Peru (2000–2022). Utilizing 4565 time-series indicators, we apply a two-stage methodology: Pearson correlations to identify baseline exploratory associations, followed by Ordinary Least Squares (OLS) with temporal controls and First Differences models to isolate genuine structural effects from time-trend artifacts and spurious correlations. Econometric validation refines oversimplified public narratives. Socially, immigration robustly correlates with increased food insecurity, localized detainments, and a reduced youth demographic, while aggregate crime complaints are identified as a time-trend artifact. Economically, migration structurally stimulates income for the poorest 40% and broadens financial inclusion, despite negatively impacting aggregate macroeconomic consumption. Educationally, the influx of skilled migrants robustly drives scientific publications and increases average formal education years, though it introduces challenges like delayed primary school attendance and a negative shift in educational gender parity. Finally, perceived impacts on central government expenditures and consumption tax revenues are econometrically isolated as either time-trend artifacts or spurious correlations rather than direct migratory consequences. This approach separates true structural responses from historical inertia, providing a balanced, quantitative perspective on migration in Peru.

1. Introduction

Migration, a ubiquitous social phenomenon in human history, involves groups of people leaving their native regions to assimilate into new social environments (Bhugra and Becker 2005). The literature on the subject reveals that migration has been driven by the search for more opportunities and better living conditions (Castelli 2018). Although these migratory movements may have minimal impact on global scales, they can produce significant local changes when the migratory influx is substantial (Bove and Elia 2017), not only affecting economic dynamics, but also carrying various cultural influences that gradually integrate into the societies of destination countries (Bhugra and Becker 2005; Bove and Elia 2017).
In Latin America, socioeconomic disparities have led to the migration of people from less developed countries to those with greater opportunities. Since the election of President Hugo Chávez in 2013, the political and social crisis in Venezuela has caused a significant exodus of its citizens to various destinations, exposing a complex interaction of political and economic factors driving migration in the region (Castelli 2018; Clemens and Postel 2018).
Peru has experienced a drastic shift in its migratory patterns due to the regional crisis. While the Venezuelan presence was marginal in 2007 with only 2924 registered individuals (CELADE 2026), the population grew to approximately 1,000,000 by 2019 (Groeger et al. 2024). Throughout the 2018–2022 period, this flow became the predominant component of immigration, increasing from 33,255 to 1,502,269 individuals (R4V 2026). The scale of this phenomenon is evidenced by the fact that the estimated Venezuelan stock alone has surpassed the total historical record of formal foreign residents; while the National Institute of Statistics and Informatics (Instituto Nacional de Estadística e Informática, INEI) recorded a cumulative total of 1,347,893 foreign residents between 2007 and 2021—with a concentration peak of 34.7% in 2021 alone—the Venezuelan population already exceeded 1.5 million by 2022 (INEI 2022b; R4V 2026). This discrepancy underscores a significant volume of irregular or pending migratory status, consolidating this group as the primary demographic driver in contemporary Peru.
In recent years, immigration rates to Peru have increased significantly. This rise has clarified notable challenges, including discrimination and social exclusion, often exacerbated by the news in the media (Eguren 2021; Freier and Perez 2021; Said and Jara 2022). A study revealed that crime is a predominant topic in Peruvian news about Venezuelan migrants, representing up to 84.5% of the coverage in the printed media and up to 87% in television reports (Maeda et al. 2021). These figures point to a worrying bias in the media, which can distort public perception and exacerbate the integration difficulties faced by the Venezuelan people.
Despite growing challenges, the comprehensive impact of this wave of immigration on Peru’s society remains an area of active research. Contemporary studies, especially those that focus on the increase in Venezuelan immigration in 2018, employ qualitative methodologies to explore social implications, along with quantitative approaches to examine economic effects. This research aims to fill a significant gap in the existing literature by developing a quantitative study on the impact of immigration on various aspects of Peruvian society, such as economy, social interactions, education, and government indicators.
Initially, research on general immigration focused on two main areas: economic and social impacts. Subsequently, the discussion moved to Venezuelan migrants, highlighting key literature in this domain related to social, economic, health, and government issues.
In general immigration, socially, the initial positive reception of immigrants in Peru rapidly shifted to rejection and xenophobia, which later consolidated into racism exacerbated by health and economic crises (Palla 2023). This trend aligns with the negative attitudes of health workers in Lima towards immigrants, despite their acceptance of the access of immigrants to health and education services (Hervias et al. 2019).
Economically, studies have explored the interaction between minimum wage, immigration, and the labor market, finding negligible effects for Peru (Canchari et al. 2021), with mixed findings in other studies ranging from positive to negative impacts, particularly in the informal sector in the case of adverse effects. A significant correlation was also observed between immigration and the employed labor force in Peru during 2015–2019, highlighting the dominance of Venezuela in the migration flow with 71.31% of the total (Ramirez 2022).
The social effect of Venezuelan migration reveals adverse reactions from the Peruvian population, marked by discrimination leading to unfavorable work conditions and often pushing immigrants towards informality (Alarcón et al. 2022; Eguren 2021; Freier and Perez 2021), and hindering socioeconomic integration. Institutional discrimination, particularly after 2018, has been identified, along with a tendency to associate migrants with criminal activities in the media and political discourse (Eguren 2021; Freier and Perez 2021), with migrants responding through satire or intra-group separation (Pérez and Freier 2022).
The economic impact of Venezuelan migration is ambivalent, showing both positive and negative aspects. Some studies indicate job creation and an increased likelihood of employment in the service sector in areas with migrant populations (Groeger et al. 2024; Morales and Pierola 2020), while others report job loss among less educated locals as a potential migration impact (Asencios and Castellares 2020). The association of migration with informal work is seen both negatively, as a source of informality (Oviedo 2018; Vera and Jiménez 2022), and positively, as a reduction in the likelihood of informal employment (Morales and Pierola 2020). The effects on wages and incomes vary, from positive increases in income (Groeger et al. 2024), negligible effects (Vera and Jiménez 2022), to negative impacts (Morales and Pierola 2020; Oviedo 2018). Venezuelan migrants, typically more educated, are seen positively toward entrepreneurship and are expected to contribute positively to long-term consumption, gross domestic product (GDP), and productivity (Asencios and Castellares 2020; Oviedo 2018).
In health, Venezuelan migrants face difficulties accessing health services (Huerta-Vera et al. 2021; Mendoza and Miranda 2019), including issues related to sexual health, violence, and discrimination. However, their potential contribution to the healthcare workforce, given their qualifications, is significant (Mendoza and Miranda 2019). The increase in HIV patients, mainly due to infected migrants, is addressed by antiretroviral therapy (ART), although at suboptimal rates (Huerta-Vera et al. 2021). A high degree of food insecurity is also observed among Venezuelan migrants, with significant mental health impacts (Hernández-Vásquez et al. 2023).
Regarding the government policies on Venezuelan migrants, two phases are evident: an initial open migration phase under President Pedro Pablo Kuczynski until early 2018 and a securitization phase beginning in 2018 under President Martin Vizcarra, reinforced by media-fueled xenophobic attitudes (Said and Jara 2022). The openness of the government is driven by the expectations of economic gain, but there is a strong public and political aversion to foreigners, perceived negatively in terms of public safety and local employment (Wright et al. 2021). Subsequent administrations (Pedro Castillo and Dina Boluarte) have been characterized by policies that threaten the repatriation of Venezuelan migrants with criminal records or inadequate documentation. With regard to this aspect, the current literature on the topic remains sparse.
This paper transcends the prevailing government perspectives and public sentiments regarding immigrants, striving for an unbiased assessment of the true impact of migration. Using quantitative time-series correlation analysis, this research aims to pinpoint and scrutinize key sectors influenced by migration, thus illuminating the genuine effects of such movements within Peru.
The main contribution of this study is the revelation of previously unknown dynamics and an in-depth investigation of the unique effects of migration in the Peruvian context. Furthermore, it seeks to provide a more balanced view of the impact of migration, clarifying the tarnished image of Venezuelan migration portrayed by the media.
The paper is structured as follows. Section 2 outlines the methodology, Section 3 presents the main findings, and Section 4 contrasts these with the recent literature. Finally, conclusions are drawn in Section 5.

2. Material and Methods

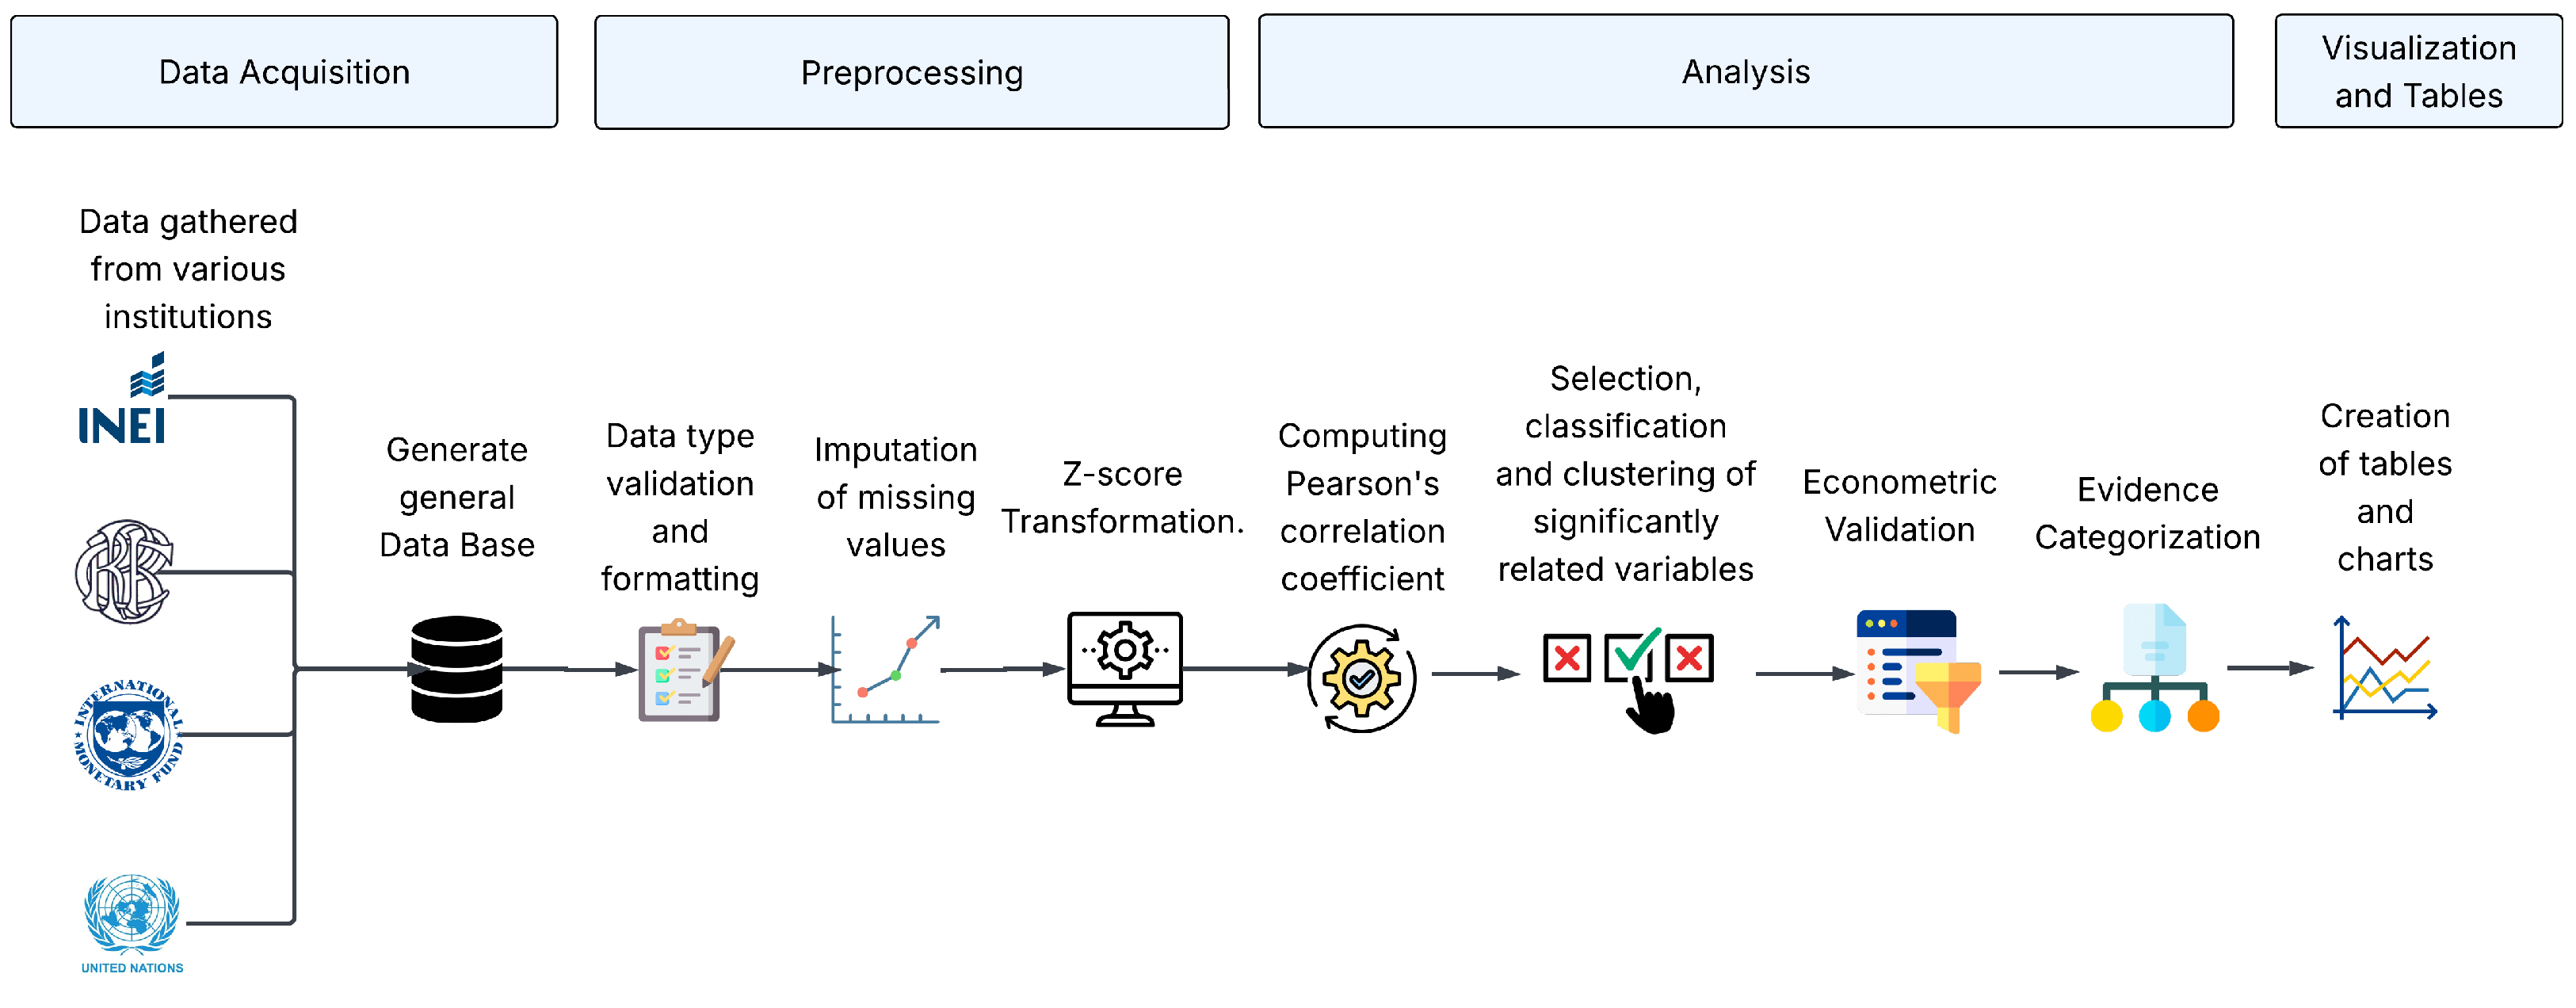
Figure 1 delineates the methodological framework employed in this research. The process begins with Data Acquisition from authoritative sources, followed by the unification of various time series into a single comprehensive database. The Preprocessing phase involves data type validation, formatting, and the imputation of missing values to ensure data integrity. To address discrepancies in measurement scales, a Z-score transformation is applied, standardizing the series to a common scale.
The Analysis stage commences by computing Pearson’s correlation coefficients to identify variables with significant associations to migratory flows. These variables are subsequently selected, classified, and clustered. To ensure the robustness of the findings, the framework incorporates an Econometric Validation protocol, utilizing OLS with trend controls and First Differences models to mitigate the risk of spurious correlations. This leads to an Evidence Categorization step, where results are classified based on their statistical persistence. The process culminates in Visualization and Tables, which present both the strongest exploratory correlations and the statistically significant econometric impacts in distinct, structured formats. In the following, each stage of the procedure is described.
Data processing, econometric analysis, and visualization were conducted using Python v3.13 (Python Software Foundation, Wilmington, DE, USA) via Jupyter Notebook v7.0. The analytical workflow utilized pandas v2.2, NumPy v1.26, SciPy v1.12, Matplotlib v3.8, and Seaborn v0.13 (NumFOCUS, Austin, TX, USA).

2.1. Data Acquisition

Data were systematically collected from five authoritative sources, including the Central Reserve Bank of Peru (BCRP), the World Bank, the International Monetary Fund (IMF), the National Institute of Statistics and Informatics (INEI), and the United Nations, accessed via DatosMacro.com.
This compilation encompassed a wide range of indicators covering the economic, social, educational, immigration, public safety, and health domains. The dataset comprises annual records for each variable, covering the period from 2000 to 2022.
The selection of this specific time frame was guided by the beginning of consistent data recording across most series at the beginning of the twentieth century. All data used in this research is hosted in an online repository (Ayma Quirita et al. 2023) and is freely available from the corresponding author upon request.

2.2. Data Preprocessing

The initial step in data preprocessing involved validating the numerical nature of the data and rectifying inconsistencies in the format of decimal separators and notation of missing values, which varied between sources.
Subsequently, missing values within the time series were addressed by linear interpolation. This process entails estimating missing data points by constructing new data points within the range of a discrete set of known data points. Essentially, for a missing value, linear interpolation creates a straight line between the two nearest known values in the series and uses this line to estimate the missing value. This technique is particularly useful for maintaining the continuity of time series data (Noor et al. 2015).
The final stage of the preprocessing involved standardizing the data using the Z-score transformation. Each time series was transformed to have a mean of zero ( μ = 0 ) and a standard deviation of one ( σ = 1 ), according to the following equation:
Z i = X i μ σ
This standardization step was crucial to minimize discrepancies arising from the vastly different scales inherent to the dataset (for example, some series had proportions ranging from zero to one, while others were quantified in millions) (Montgomery et al. 2021). Furthermore, this transformation is critical for the subsequent econometric modeling.

2.3. Analysis

2.3.1. Exploratory Correlation Analysis

The primary objective of this analysis was to identify time series exhibiting a strong correlation with the total influx of immigrants to Peru. To this end, Pearson’s correlation coefficients were systematically calculated on an annual basis, directly comparing each indicator with immigration data for the corresponding year (Inafuko and Donet 2012). This methodology involved correlating, for example, migration figures for the year 2000 with each indicator for that same year, repeating the process for all subsequent periods. Series yielding a significant correlation coefficient—approximately ± 0.9 —were prioritized for further examination, as they represent variables closely associated with immigration patterns (Abegaz et al. 2023; Kim and Kim 2016).
During this phase, the series were systematically categorized by impact domain. Series representing analogous concepts, despite minor definitional variations, were aggregated through a meticulous keyword-based methodology. To ensure the statistical validity of these aggregates, Pearson’s coefficients (r) were transformed using Fisher’s z-transformation:
z = arctanh ( r ) = 1 2 ln 1 + r 1 r
The mean correlation for each group was calculated in the z-space to mitigate the bias inherent in the direct arithmetic averaging of correlation coefficients (Borenstein et al. 2009). Following standard inferential practices, a significance level of α = 0.05 was established. Consequently, 95% confidence intervals (C.I.) were constructed for each aggregated indicator based on the standard error of the transformed values:
S E z = 1 n 3
where n = 23 denotes the number of annual observations. These intervals, along with their corresponding p-values, facilitate the assessment of the statistical significance and inferential stability of the observed associations (Cohen et al. 2013).
Furthermore, the analysis incorporated specific series that, based on conventional theoretical reasoning, were presumed to be associated with migration. This included indicators analogous to those showing high correlation but exhibiting divergent trends, such as government consumption at both central and local levels.
Finally, certain time series were deliberately excluded from in-depth analysis. This exclusion was based on the absence of a clear mechanistic link to immigration, the potential for spurious correlations, or instances where the association was considered tautological or self-evident, thus precluding the need for further exploration.

2.3.2. Econometric Validation and Trend Control

This section outlines the econometric validation protocol designed to ensure the robustness of the findings by systematically isolating the structural impact of immigration from shared historical inertia. To accomplish this, a two-phase refutation process was employed, utilizing an Ordinary Least Squares (OLS) model with a linear time control alongside a First Differences model (Tsay 2005; Wooldridge 2010). By applying these models and rigorously estimating standard errors, the protocol establishes definitive criteria for classifying the observed statistical associations into three distinct categories: robust structural effects, time-trend artifacts, or spurious correlations.
Although this econometric framework successfully mitigates the influence of historical inertia, the aggregated nature of the time series may still obscure latent real-world dynamics. These unobserved variables represent potential sources of variance that, while not explicitly captured by formal indicators, fundamentally shape the broader socioeconomic context in which migratory trends and their subsequent impacts unfold (Wooldridge 2016).
A.
Temporal Inertia Control Model (OLS with Trend)
In the first instance, an Ordinary Least Squares (OLS) regression model was executed, including a time control variable (t) to isolate the net impact of immigration from the inertial growth of the indicators (Hamilton 2020). The formal specification is:
Y t = β 0 + β mig X t + β t t + ϵ t
where Y t represents the socioeconomic indicator, X t the migratory flow, and t the linear trend.
B.
First Differences Model
As a definitive test of robustness, a first-differences model was applied to eliminate potential unit roots and evaluate the relationship between interannual variations (shocks) (Dougherty 2011). This model assesses whether a sudden increase in immigration translates into an immediate change in the indicator:
Δ Y t = α + β Δ Δ X t + u t
where Δ Y t = Y t Y t 1 and Δ X t = X t X t 1 .
C.
Standard Error Estimation and Matrix Formulation
For both models, the Standard Error ( S E ) of the estimators was calculated using the classical OLS matrix formulation to ensure reproducibility. First, the residual variance ( σ ^ 2 ) was estimated as:
σ ^ 2 = t = 1 n ( Y t Y ^ t ) 2 n p
where n represents the observations and p the estimated parameters. The S E is derived from the variance-covariance matrix:
Var ( β ^ ) = σ ^ 2 ( X T X ) 1
The S E for the migratory coefficient is the square root of the corresponding diagonal element: S E ( β ^ ) = diag ( Var ( β ^ ) ) j , j . In Model A, the S E accounts for potential multicollinearity with the time trend, while in Model B, S E ( β ^ Δ ) is sensitive to interannual volatility and operates with n 1 observations due to the differencing process, representing a more rigorous stress test for the data (Greene 2000).
D.
Evidence Classification Criteria
To systematically evaluate the underlying nature of the statistical relationships and avoid misattributing macroeconomic inertia to migratory phenomena, the econometric outcomes were classified into three distinct categories. This classification depends strictly on the statistical persistence of the migration coefficients in both the levels model ( β mig ) and the differenced model ( β Δ ):
  • Robust Effect:
    Criteria: The coefficient in the First Differences model ( β Δ ) is statistically significant ( p < 0.05 ).
    Rationale: This classification indicates a direct, structural response to migratory shocks. Surviving the differencing process demonstrates that an immediate, atypical variation in the migratory flow directly corresponds to a proportional variation in the socioeconomic indicator. The effect is tangible and completely isolated from the natural historical growth or inertial trends of the nation.
  • Time-Trend Artifact:
    Criteria: The migration coefficient in the OLS model with a linear trend ( β mig ) is statistically significant ( p < 0.05 ), but the coefficient in the First Differences model ( β Δ ) completely loses significance ( p 0.05 ).
    Rationale: This occurs because the variables share a sustained historical trajectory driven by complex, unobserved macroeconomic factors that a simple linear time control (t) in the OLS model fails to capture. Consequently, the OLS model incorrectly attributes this shared inertia to the migratory flow. However, when the First Differences model eliminates all cumulative inertia to isolate pure interannual shocks, the lack of significance in β Δ reveals that there is no true causal linkage. The initial correlation was merely an illusion driven by time.
  • Spurious: Criteria: Neither the OLS coefficient ( β mig ) nor the First Differences coefficient ( β Δ ) achieve statistical significance under rigorous controls, or the direction of the effect (positive/negative) is inherently contradictory between models.
    Rationale: This classification confirms that any high baseline correlation observed during the exploratory phase was the result of mathematical noise or random coincidence. The variables exhibit no consistent underlying structural or inertial relationship when subjected to systematic econometric stress.

2.4. Visualizations and Tables

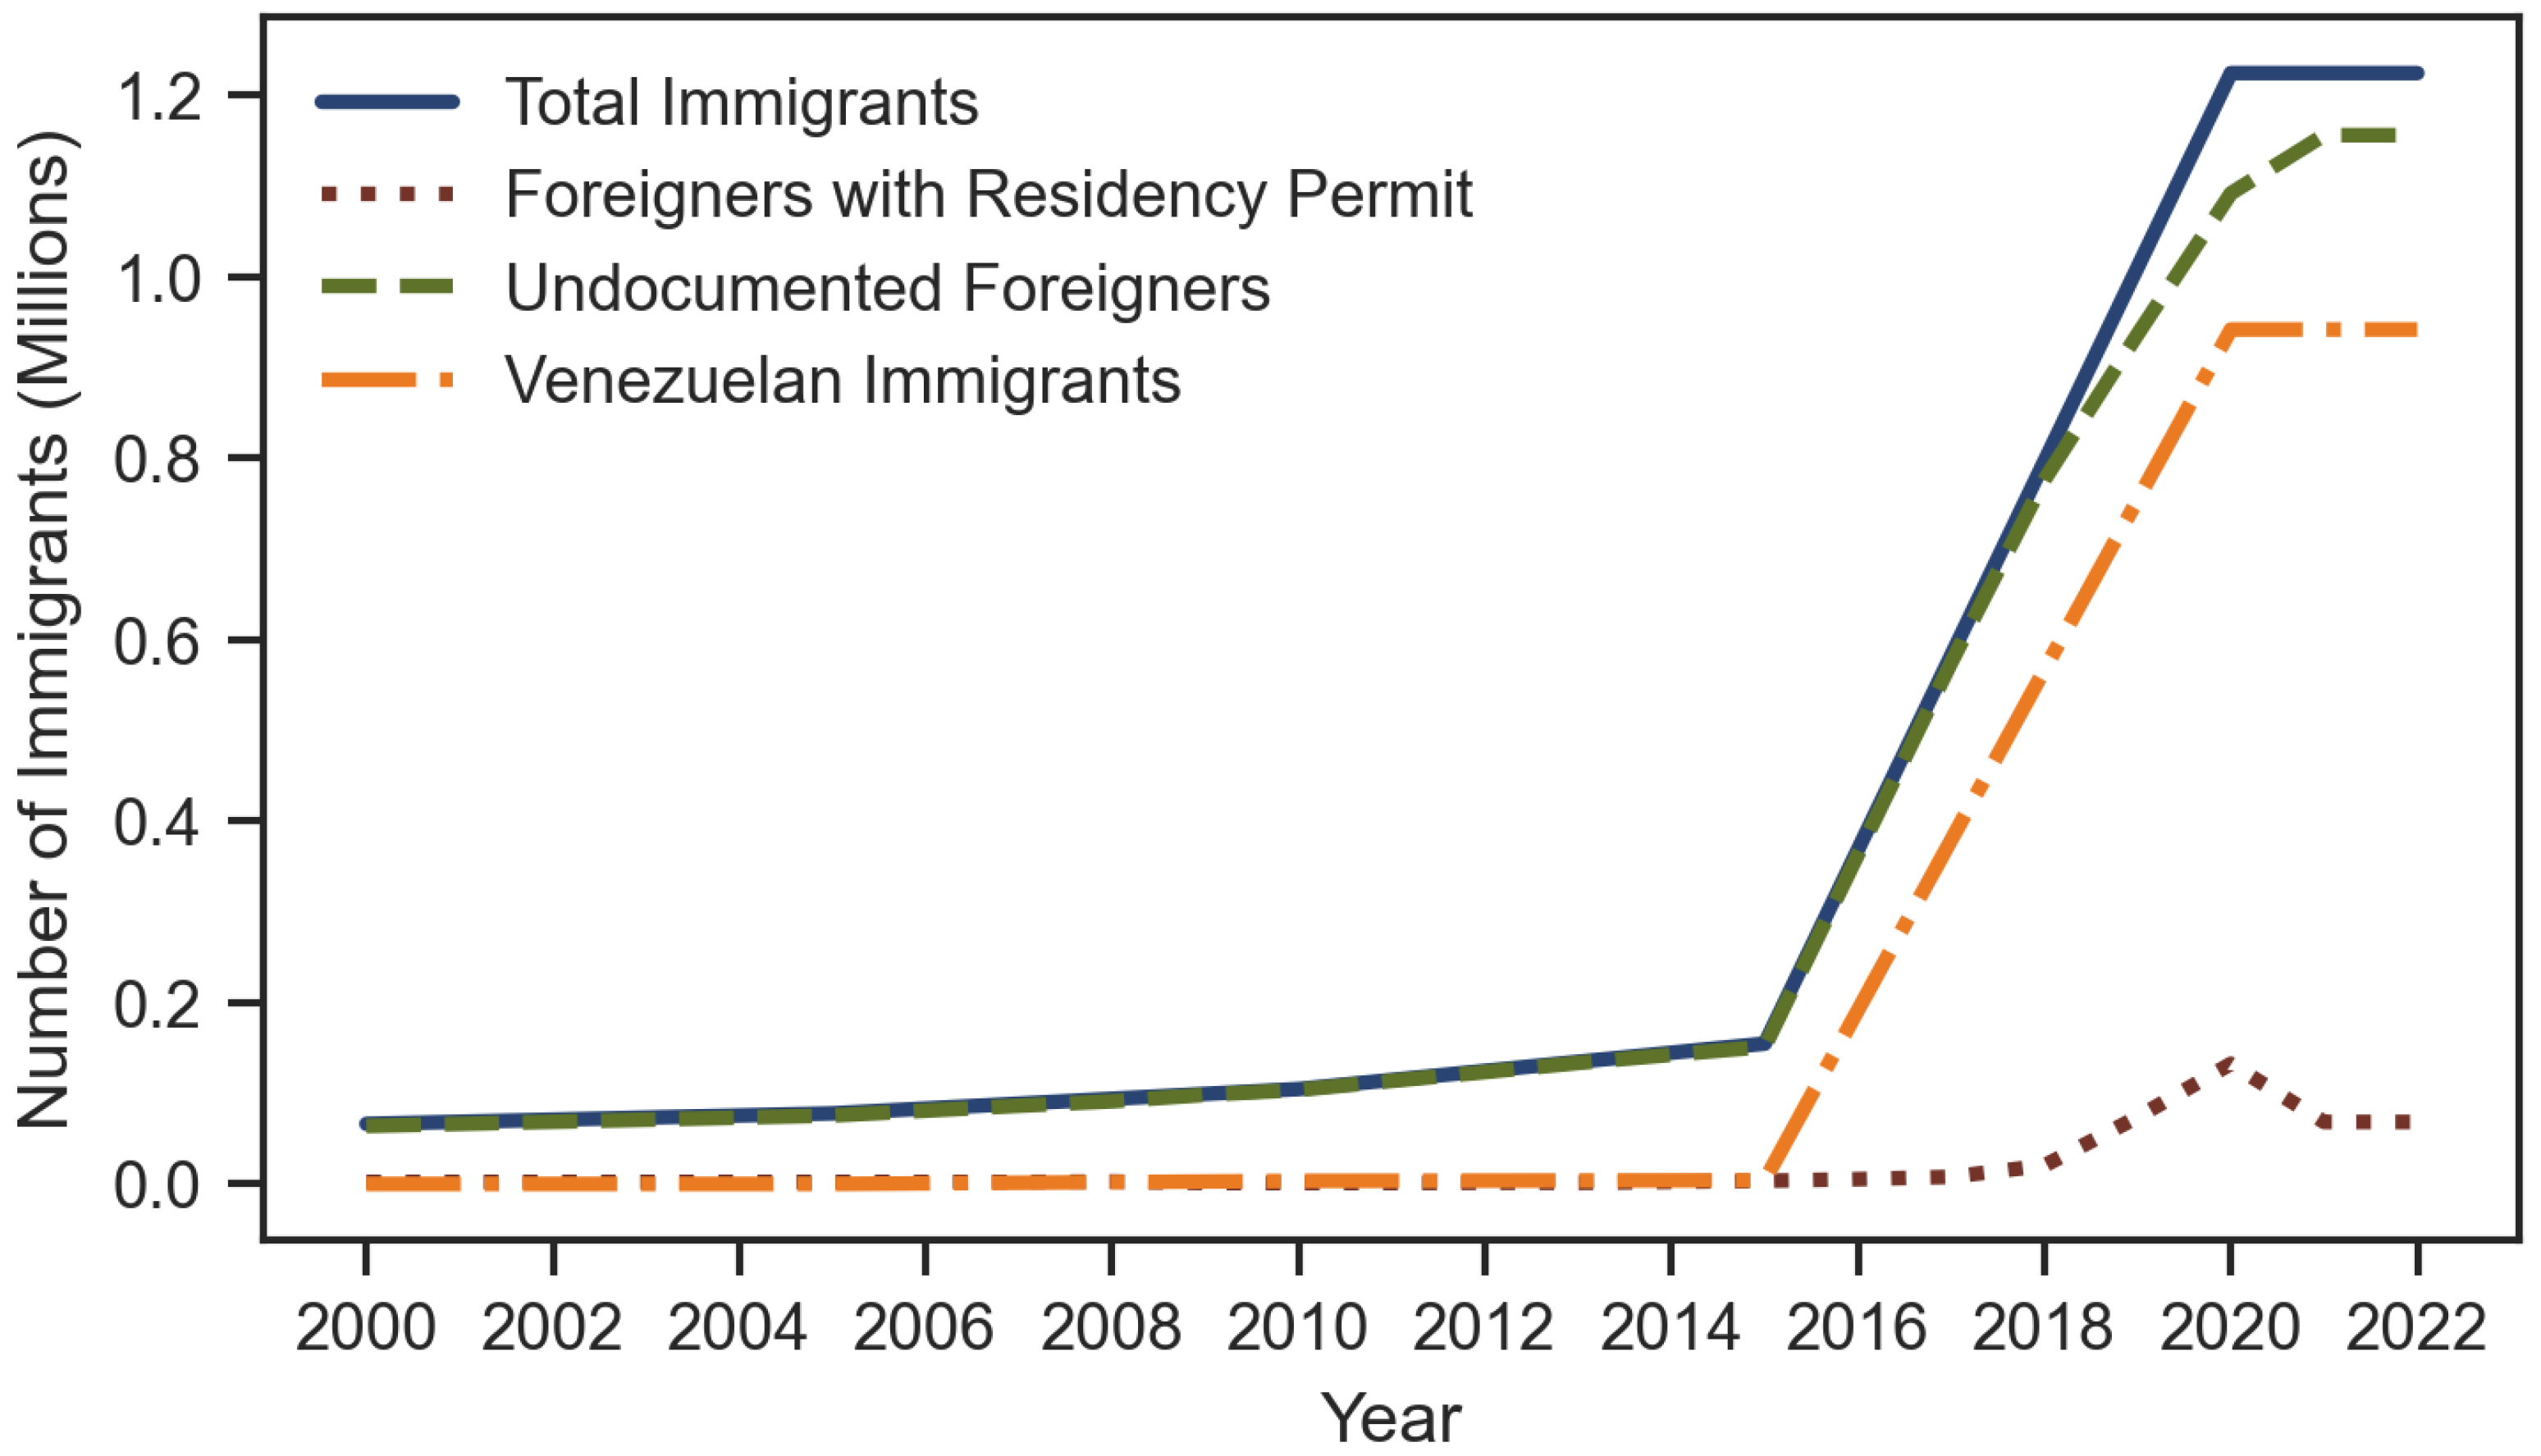
Concluding the analysis, a comprehensive time series graph was constructed, illustrating the immigration trend and providing subdivisions such as documented/undocumented foreigners and Venezuelan migrants in particular.
Impact analysis was systematically conveyed through a tiered presentation of structured tables. Initial exploratory results were organized into thematic tables (Social, Economic, Educational, and Governmental), displaying Pearson coefficients with their respective 95% confidence intervals and significance levels (p-values).
Subsequently, a comprehensive econometric validation table was constructed in a landscape format to consolidate the results of the OLS and First Differences models. This master table was designed to facilitate a direct comparison between baseline associations and robust impacts, utilizing panels to categorize the evidence status of each indicator.

3. Results

The study focused on a comprehensive set of 4565 indicators, organized into 15 distinct groups. Using these data, an initial graphical representation was created to depict the trends in immigrant flow to Peru over recent decades.
A key aspect of this analysis was the differentiation between documented migrants, identified by their possession of a foreign resident card, and undocumented migrants. This distinction is effectively demonstrated in Figure 2. Furthermore, a specific emphasis was placed on visualizing Venezuelan migration, highlighting its importance in the recent period.
The findings are presented in two analytical stages. The first stage details the most robust correlations (both positive and negative), identifying which indicators exhibit significant co-variance with migratory flows. The second stage, involving rigorous econometric validation, evaluates the underlying nature of this relationship to assess the statistical significance and magnitude of the association between migration and the pre-selected indicators. This methodological approach isolates the co-movement from shared temporal inertia, effectively distinguishing robust structural correlations from spurious relationships driven by common trends, without asserting strict causality.

3.1. Exploratory Correlation Findings

To operationalize the first stage of this assessment, migratory dynamics were examined against a meticulously selected set of time series across four primary domains: Social (Table 1), Economic (Table 2), Educational (Table 3), and Governmental (Table 4). This classification facilitates a comprehensive impact assessment, identifying how the migratory phenomenon interacts with different facets of national development prior to the econometric stress tests.
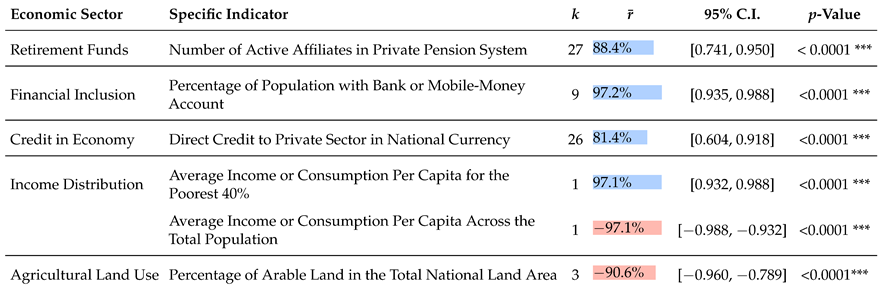
Within each domain, the series were stratified into four indicators with strong positive correlations and two with pronounced negative correlations to provide a balanced overview of the observed trends. For each variable, the tables report the number of averaged series (k), the adjusted mean correlation ( r ¯ ), the 95% confidence intervals (C.I.), and the associated p-values to ensure statistical rigor. While the most representative categories are discussed in this section, the remaining indicators that exhibit high statistical significance are detailed in the Appendix A.
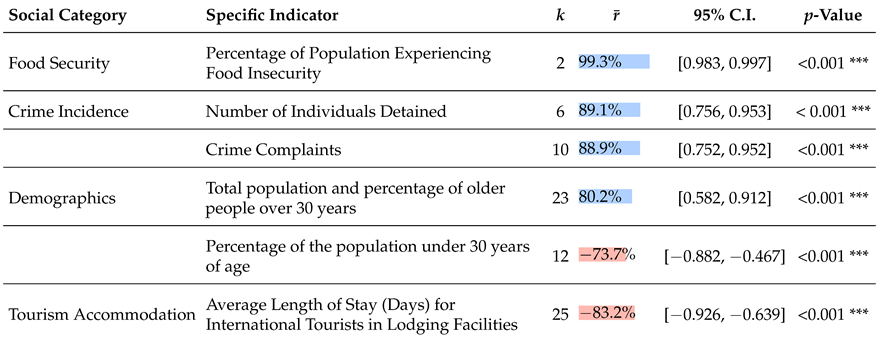
In Table 1, three primary categories are identified that exhibit trends corresponding to migratory flows, along with one category showing an inverse trend. These include food insecurity, the prevalence of criminal activities, and population demographics, which encompass both the total population and the proportion of individuals over 30 years of age. Unlike these, the category of tourist accommodation stands out as being negatively correlated with migration patterns. The incidence of food insecurity, which includes severe and moderate cases, reflects the patterns observed in migration trends.
Similarly, the trend toward citizen insecurity is evident from the number of individuals detained in various categories, including offenses against personal liberty, life, property, drug trafficking and consumption, and public safety. In the same vein, the number of complaints filed in different categories of crime (in general, against personal liberty, domestic violence, corruption, human trafficking, public safety, property, life, and vehicle theft) also follows this pattern.
Furthermore, the total population (both male and female) shows a trend consistent with migration movements, as does the proportion of the population over 30 years of age. However, the proportion of the population under 30 years shows a distinct negative correlation with migration flows. Similarly, the average duration of stays in accommodation by international visitors presents a significant negative correlation.
In the analysis of the economic indicators presented in Table 2, five main categories emerge. Initially, a correlation is observed between participation in private pension schemes and immigration trends, with varying degrees of association between different regions. The banking sector also exhibits parallel trends among diverse demographic groups, indicating an increased integration of individuals into the financial system, either through accounts in financial institutions or mobile money service providers.
Additionally, direct credit to the private sector in the national currency shares this trend, as evaluated in each region of the country. Furthermore, there is a significant positive correlation between average consumption or income and the economic status of the lowest 40% of the population. In contrast, there is a marked negative correlation between the overall consumption of the total population and migration flows. The data also reveal a decline in arable land concurrent with an increase in immigration over time.
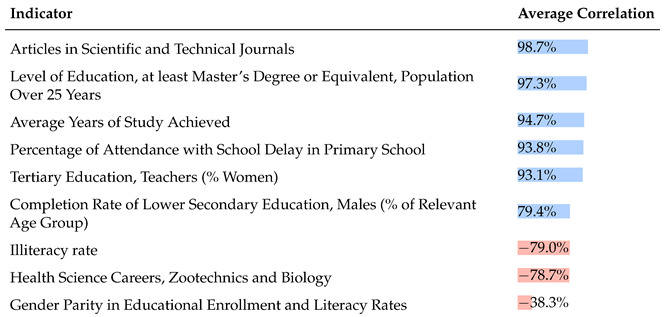
In the educational sector, as detailed in Table 3, there is a significant correlation between immigration patterns and the average years of education for both male and female students. This correlation is also observed in the proportion of delayed school enrollments, particularly at the primary education level.
Additionally, the number of scientific articles published also demonstrates a positive trend similar to migration flows. Similarly, the number of individuals with a master’s degree or higher (including males, females, and the total population) exhibits a similar pattern. In contrast, the rate of illiteracy shows a strong negative correlation.
Interestingly, gender parity in education shows a divergent trend in relation to immigration patterns. This is illustrated by the ratio of female to male students in both primary and secondary education and the proportion of literate young women compared to men, as well as the enrollment ratio at the primary, secondary, and tertiary levels, each demonstrating varying levels of correlation.
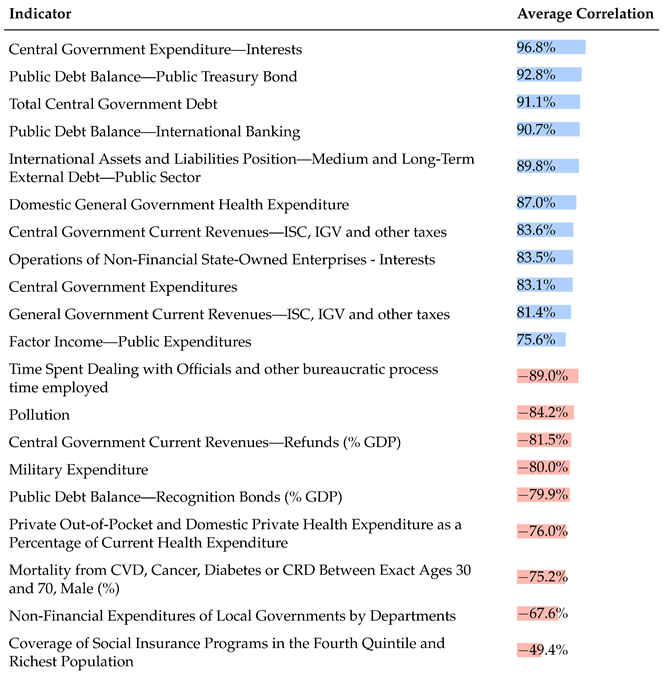
In the context of state governance, as defined in Table 4, a noticeable alignment is observed between variations in migratory flows and both government expenditures and revenues.
Specifically, central government expenditure reflects these migration trends. However, an inverse correlation is noted in the spending patterns of local governments (by departments) in non-financial expenditure. Concerning revenue, a significant parallel is evident between the central government’s taxes (income from selective consumption tax (ISC) and general sales tax (IGV), as well as income tax and other tax revenues, including the total tax revenues), and migration patterns.
Likewise, the general government’s revenues also share this positive trend (in taxes similar to those of the central government, such as ISC, IGV, and income tax). Furthermore, health expenditure closely follows migratory trends, as indicated by the central government’s investment in health and the current state health expenditure.
In contrast, out-of-pocket expenditure and domestic private health expenditure, when expressed as a percentage of current health expenditure, exhibit a significant negative correlation with immigration data records.
These findings across the social, economic, and governmental domains provide a preliminary landscape of the statistical associations present in the data. However, while these patterns suggest a strong relationship between immigration and national development indicators, they are inherently limited by their bivariate nature. Consequently, the analysis moves beyond exploratory metrics to a confirmatory stage to determine if these associations persist under more rigorous statistical controls.

3.2. Econometric Validation Outcomes

As presented in the preceding exploratory analysis, almost all evaluated indicators exhibit highly significant baseline correlations with the migratory flow ( p < 0.001 ), with the sole exception of gender parity in educational enrollment and literacy rates ( p = 0.005 ). While these bivariate correlations highlight strong statistical associations, Pearson’s coefficient does not account for the inertial macroeconomic and demographic growth of the country over the 2000–2022 period.
To rigorously isolate the true impact of immigration from underlying temporal dynamics and avoid spurious conclusions, two advanced econometric models were applied: an Ordinary Least Squares (OLS) regression controlling for a linear time trend, and a First Differences model to evaluate the response to immediate migratory shocks. The results of this econometric validation are consolidated in Table 5. The table is organized into four thematic panels (Social, Economic, Educational, and Governmental Indicators) to provide a multidimensional view of the phenomenon. Each row evaluates a specific dependent variable against the baseline correlation ( r ¯ ). The columns detail the estimated coefficients ( β ), standard errors ( S E ), and goodness-of-fit measures ( R a d j 2 and F-statistic) for both the time-trend adjusted OLS and the first differences specifications. Finally, the “Evidence Status” column provides a qualitative synthesis.
Following the methodological criteria, the econometric outcomes are classified according to their statistical persistence under strict controls. An indicator exhibits a robust effect if it demonstrates a direct, structural relationship by responding immediately to sudden migratory shocks. Conversely, a relationship is deemed a time-trend artifact if the initial baseline correlation is merely a byproduct of the country’s historical growth trajectory, losing its validity once temporal inertia is factored out. Finally, spurious results denote variables that fail to maintain any consistent statistical association when subjected to rigorous econometric specifications.
Applying this framework, the First Differences model confirms that multiple variables maintain statistical significance after differencing, thereby exhibiting a robust effect isolated from the nation’s natural organic growth. Within the social dimension, immigration directly influences food insecurity rates, the number of detained individuals, the demographic share of the youth population (under 30), and the average length of stay for international tourists. Economically, the analysis reveals structural associations with average income levels—for both the poorest 40% and the general population—as well as enhanced financial inclusion via bank or mobile-money accounts. Notably, the educational sector displays exceptional resilience to econometric stress; the data confirms substantive impacts on scientific journal publications, postgraduate degree attainment, average years of formal education, primary school attendance delays, and shifts in educational gender parity.
On the other hand, the validation process categorizes a distinct set of highly correlated variables as time-trend artifacts. Indicators such as total central government expenditure, local government non-financial expenditures, private health spending, crime complaints, total population, the aging demographic (over 30), active private pension affiliates, and the percentage of arable land are shown to be primarily driven by shared inertial growth. Finally, variables that lose significance upon the introduction of baseline controls—specifically general government health expenditure, tax revenues, direct credit to the private sector, and the illiteracy rate—are strictly classified as spurious correlations.

Interpretation of Coefficient Sign Inversions

A critical observation from the econometric analysis is the sign inversion of specific indicators when transitioning from baseline Pearson correlations to robust specification models. These inversions are not statistical anomalies but empirically validate the necessity of our time-trend (t) and First Differences ( Δ ) controls.
For highly structural variables with deterministic linear trends, such as total population ( r Y , t = 0.996 ), the baseline correlation with immigration is strongly positive due to parallel historical growth. However, when introducing a time control in the OLS framework, the β mig coefficient isolates the orthogonal components in accordance with the Frisch–Waugh–Lovell theorem (Wooldridge 2016). The resulting negative coefficient ( β mig = 0.074 , p < 0.05 ) accurately reflects that short-term positive shocks in immigration are correlated with negative deviations from the deterministic population growth trend. A complementary effect is observed in the youth demographic (population under 30), which exhibits a strong secular decline ( r Y , t = 0.979 ). After partialling out this historical downward trend, the positive OLS coefficient ( β mig = 0.314 ) reveals that migratory influxes actively dampen the demographic aging effect. Furthermore, apparent sign inversions in specific aggregated economic indicators (e.g., Direct Credit to Private Sector) reveal a classic macroeconomic aggregation bias, akin to Simpson’s Paradox (Pesaran and Smith 1995). The baseline coefficient ( r ¯ = + 0.813 ) is derived from a Fisher z-transformation, which uniformly averages the individual correlations of all regional sub-series, correctly indicating that the vast majority of regional financial sectors respond positively to migratory flows. Conversely, the econometric models ( β mig = 0.674 ) evaluate the absolute aggregated volume of credit, which is entirely dominated by a heavily weighted, structurally divergent outlier (the capital region). This mathematical divergence highlights the critical distinction between widespread regional microeconomic responses and heavily concentrated absolute macroeconomic volume.
The First Differences model further unmasks long-term spurious relationships driven by unobserved common trends. For instance, both immigration flows and general government tax revenue exhibit strong historical upward trajectories, resulting in a high baseline correlation ( r ¯ = + 0.834 ). However, the First Differences coefficient uncovers the immediate short-term dynamics ( β Δ = 0.268 ): sudden year-over-year migratory influxes are associated with contemporaneous decelerations or negative shocks in tax revenue growth, likely reflecting immediate macroeconomic absorption costs or informal labor market pressures. Conversely, the strong negative baseline correlation observed with the illiteracy rate ( r ¯ = 0.790 ) is completely neutralized in the First Differences model ( β Δ = 0.011 , not significant). This explicitly demonstrates that annual migratory shocks have no causal effect on illiteracy rates, proving that the baseline relationship was purely a spurious artifact of opposing secular trends (i.e., natural educational improvements occurring concurrently with rising immigration).


4. Discussion

It is important to note that, in general, many of the study findings are supported by previous research, while some relationships are novel to the literature and others present results contradictory to common beliefs. Additionally, it is important to note that although the study was conducted on total migration, from around 2015 onward, migratory flow was dominated by Venezuelan migration. As such, many of the effects of general migration are strongly related to Venezuelan migration, though not limited to it.
In the social domain, econometric validation confirms a robust structural correlation between migration patterns and food insecurity, corroborating prevalent research (Hernández-Vásquez et al. 2023). The relationship between migration and public security, however, requires careful sociological distinction; the anticipated increase in crime is fundamentally a reflection of the challenging socioeconomic conditions in the vulnerable, poverty-stricken communities where migrants settle, rather than an inherent migratory characteristic (Bell and Machin 2011). This complexity manifests in the data through a counter-intuitive divergence: while the number of detainees exhibits a robust correlation due to immediate, localized law enforcement interactions, the overall volume of crime complaints is isolated as a time-trend artifact driven by secular national dynamics rather than immigrant criminality.
Similarly, while absolute population growth and the increasing demographic of individuals over thirty—a trend often noted in general migration reports (OIM 2016)—are identified as mere parallel historical artifacts, the consequential decrease in the proportion of the population under thirty remains a robust, structural effect. This dynamic occurs because the national population growth was historically decelerating (INEI 2022a), rather than indiscriminately driving absolute aggregate volume, migratory influxes actively dampened this demographic aging effect by structurally altering the underlying age composition.
Finally, the downward trend in the number of days spent in accommodations by foreigners is validated as a robust indicator, pointing to erratic settlement behaviors and high mobility likely caused by constant displacement and financial instability within a segment of the migrant population.
In general, economic indicators suggest an underlying increase in the country’s economic activity and production (Asencios and Castellares 2020; Bove and Elia 2017), though this is accompanied by complex, heterogeneous effects regarding formality, financial integration, and consumption patterns. When evaluating labor formality, the initial correlation suggesting an increase in enrollment in the private pension system is isolated by the econometric models as a time-trend artifact. This indicates that such increases reflect gradual, long-term national formalization trends rather than a direct structural consequence of recent migration.
Financial and consumption metrics present further econometric divergences. While broadened access to banking services demonstrates a robust structural relationship with migratory influxes, the apparent baseline increase in direct credit to the private sector is classified strictly as a spurious correlation, lacking true causal linkage to the migratory phenomenon. In terms of consumption dynamics (Groeger et al. 2024), a robust structural divergence emerges across socioeconomic strata: the income and consumption of the poorest 40% of the population exhibit a robust positive correlation with migration, whereas aggregate general consumption displays a robust contrary trend. This implies that migratory integration actively stimulates economic velocity within lower-income segments, even as broader macroeconomic consumption faces downward pressure.
Finally, territorial and labor force indicators align with these nuanced findings. The apparent reduction in arable land is confirmed to be a time-trend artifact, driven by secular urban expansion and general demographic growth rather than immediate migratory shocks. Correspondingly, while theoretical frameworks anticipate an expansion in both the economically active population and the employed fraction (Ramirez 2022), the empirical data evidences only modestly positive correlations that fail to reach structural robustness in the short term. This suggests that the full influence of migration on aggregate labor force variables is subject to significant macroeconomic absorption lags; the labor market may require a longer-term horizon to fully internalize the demographic shift before it manifests as a structural co-movement. This explains why, despite the intuitive expectation of a strong impact on employment, the results currently reflect a transition phase rather than a consolidated trend.
In the educational domain, econometric validation confirms that the majority of identified indicators are robust, with the exception of the illiteracy rate, which is isolated as a spurious correlation. The robust structural relationship between migration patterns and the increase in average years of formal education, academic publications, and the attainment of master’s degrees suggests a successful integration of highly skilled professional migrants (Asencios and Castellares 2020). This trend reflects a qualitative shift in the labor and academic market as overseas qualifications gain institutional recognition. Conversely, the observed decline in the illiteracy rate, while intuitively linked to the influx of educated individuals, is econometrically proven to be a spurious artifact of pre-existing national educational improvements rather than a direct consequence of migratory shocks.
In the realm of school-age education, a robust association is observed with delayed school attendance, likely linked to the arrival of school-aged migrants facing integration barriers. Notably, the correlation with “School enrollment, primary (% gross)” remains unexpectedly low ( r = 0.408 ), challenging the assumption of immediate and regular primary school registration. This statistical divergence suggests a pronounced tendency towards delayed enrollment within this demographic, frequently exacerbated by the lack of required legal documentation and administrative hurdles (Summers et al. 2022).
Finally, a robust negative shift was identified in the gender ratio within education, indicating that the presence of women relative to men decreased as the migratory influx intensified. Given the absence of existing literature addressing these educational dynamics from a gender-differentiated perspective, this finding constitutes a novel contribution to the understanding of how migratory flows may unintentionally alter the gender balance within host educational systems.
In the realm of governance and fiscal policy, econometric validation reveals a critical distinction: while consumption taxes (ISC, IGV) and general government expenditures initially show strong correlations with migration, these relationships are classified strictly as spurious correlations or time-trend artifacts. Specifically, the increase in total central government expenditure exhibits an increasing trend driven by the expanding population’s service demands; however, this is isolated as a temporal artifact of the country’s natural expansion over the last two decades. In parallel, although increased tax revenues (ISC, IGV) align with theoretical expansions in productive capacities (Asencios and Castellares 2020) and government openness (Wright et al. 2021), they are identified as spurious, indicating that the reported baseline correlation lacks a robust structural link to migratory shocks and is likely driven by unobserved common inflationary or growth trends.
A significant fiscal inconsistency further characterizes the robust findings: while consumption-based taxes show a positive relationship, taxes on business profits reveal a negative correlation ( r = 0.642 ). This divergence suggests that the economic contribution of the migratory influx is heavily concentrated in the informal labor market and consumer demand, rather than formal corporate profitability.
Regarding the healthcare sector, the data presents a counter-intuitive divergence in robust classifications. General government expenditure on health is isolated as a spurious correlation, likely due to the extraordinary and non-structural impact of the COVID-19 pandemic on public budgets. In contrast, private and out-of-pocket health expenditures are identified as time-trend artifacts with a downward trajectory. This suggests that while public health spending was driven by exogenous crisis-related factors, the decline in private spending reflects a long-term inertial shift—where the government has increasingly absorbed healthcare costs for the growing population—rather than a direct structural response to the migratory phenomenon itself (Huerta-Vera et al. 2021; Mendoza and Miranda 2019).

5. Conclusions

This comprehensive study involved a deep dive into the multifaceted impacts of immigration on Peruvian society, covering economic, social, educational, and government aspects. The analytical framework began with a broad exploratory correlation assessment to identify potential linkages, which were then subjected to an essential filtering stage through two econometric models. By implementing an OLS model with temporal inertia control and a First Differences model, the research aimed to isolate structural migratory shifts from spurious associations and historical artifacts that often mimic causal relationships. Using quantitative data from authoritative sources (BCRP, World Bank, IMF, INEI, and UN), this structured approach offers a nuanced perspective that challenges prevalent perceptions regarding the effects of migration in Peru.
The social science study has revealed intricate correlations linking immigration to various socioeconomic factors. Econometric validation confirms a robust structural relationship with food insecurity, the number of detainees, and a decrease in the proportion of the young population, alongside erratic settlement patterns evidenced by shorter stays in temporary accommodations. While absolute growth in the elderly population and crime complaints were identified as time-trend artifacts driven by national inertia, the study highlights the multifaceted relationship between immigration and social dynamics.
The study presents economic evidence of a distinctly stratified impact of migration, characterized by a dual structural behavior in income distribution. Econometric validation confirms a robust positive correlation with the average income of the 40% poorest population segment, suggesting that migration stimulates economic vitality at the base of the pyramid; however, this contrasts with a robust negative correlation regarding the overall population’s average income. Beyond these structural shifts, other indicators require careful nuance: the growth in Private Pension System affiliates and the reduction in arable land were isolated as mere time-trend artifacts of long-term national expansion. Furthermore, while banking activity shows robust financial integration, the surge in private sector credit was identified as a spurious correlation. This evidence suggests that while migration effectively drives growth within specific lower-income strata, its aggregate macroeconomic influence remains complex and non-uniform.
In the educational sector, the influx of skilled migrants impacts several key areas with robust structural consistency: there is a notable enhancement in scientific publication output, an increase in the average years of education, and a higher proportion of the population with postgraduate qualifications. Conversely, the reduction in illiteracy rates was proven to be a spurious artifact of pre-existing national trends. Furthermore, the migration influx has led to a robust change in gender parity, evidenced by a decreased women-to-men ratio in educational attainment. Although the correlation with early primary school enrollment is unexpectedly low, this is attributed to a robust pattern of late school enrollment among migrants, indicating distinct administrative barriers to educational integration.
The government impacts of migration are diverse and multifaceted, though many align with broader temporal trends. While central government expenditures and consumption taxes (IGV, ISC) scale in tandem with the population, they are identified as temporal artifacts or spurious correlations rather than direct structural consequences of migration. A complex fiscal scenario emerges where taxes on business profits reveal a robust negative correlation, indicative of a concentration in informal labor markets. In the healthcare sector, the increase in public spending is isolated as a spurious effect of the COVID-19 pandemic, while the decline in other forms of healthcare financing represents a long-term inertial shift in how the government absorbs the costs of a growing population.
By providing a balanced, data-driven analysis, this research enriches the migration discourse and challenges oversimplified media narratives by revealing an influence that extends far beyond criminality. This methodological framework establishes a quantitative foundation that successfully separates genuine structural responses from historical inertia.

Limitations and Future Research

Despite these contributions, it is crucial to acknowledge that this exploration is inherently bounded by the visibility and aggregate nature of the macroeconomic indicators utilized. While the econometric models applied in this study provide a rigorous control framework, they possess inherent limitations in capturing latent real-world factors. Specifically, the data may not fully reflect the structural volatility of the informal labor market, the immediate socioeconomic shocks caused by sudden shifts in migratory policy, or the qualitative nuances of social integration and political stability. These unobserved dynamics represent essential contextual layers that fundamentally shape the broader landscape in which these migrations occur, indicating that the quantitative findings must be interpreted alongside the complex, unquantifiable realities of the migratory phenomenon.
Beyond these substantive considerations, two methodological constraints inherent to the research design merit explicit acknowledgment. First, the analysis is based on 23 annual observations, which inherently limits the statistical power of the econometric specifications and constrains the inclusion of multiple simultaneous controls within a single model. The two-stage validation strategy adopted here partially mitigates this limitation by sequentially testing each indicator through complementary specifications, but it does not eliminate the small-sample concern entirely. Second, while the First Differences specification effectively rules out shared temporal inertia as a source of co-movement, it does not constitute strict causal identification in the econometric sense. The robust effects reported throughout this study should therefore be interpreted as statistical associations that survive rigorous controls for trend confounding, rather than as causal claims. Establishing causal mechanisms would require complementary research designs—such as natural experiments, instrumental variables, or subnational panel data—capable of exploiting exogenous variation in migratory flows.
The research also highlights the importance of further investigation into the long-term implications of migration, suggesting the analysis of time-lagged correlation series. Additionally, it acknowledges the labor-intensive nature of classifying and clustering indicators into four impact areas, a process currently conducted manually but with the potential for semiautomation to streamline data processing and enhance focus on interpretation of results.

Author Contributions

Conceptualization, V.A.A.Q., W.A., V.H.A.Q. and J.D.C.; methodology, V.A.A.Q., W.A., V.H.A.Q. and J.D.C.; software, J.D.C.; validation, V.A.A.Q., W.A. and V.H.A.Q.; formal analysis, V.A.A.Q., W.A., V.H.A.Q. and J.D.C.; investigation, V.A.A.Q., W.A., V.H.A.Q. and J.D.C.; data curation, J.D.C.; writing—original draft preparation, J.D.C.; writing—review and editing, V.A.A.Q., W.A., V.H.A.Q. and J.D.C.; visualization, V.A.A.Q. and J.D.C.; supervision, V.A.A.Q. and W.A.; project administration, W.A. All authors have read and agreed to the published version of the manuscript.

Funding

This research received no external funding.

Institutional Review Board Statement

Not applicable. This study does not involve human or animal subjects in an experimental or clinical setting, as it relies entirely on the quantitative analysis of publicly available, aggregated macroeconomic and social data.

Informed Consent Statement

Not applicable. The study did not involve the direct participation of human subjects.

Data Availability Statement

The aggregated data presented in this study are openly available in the online repository as cited in (Ayma Quirita et al. 2023). The raw time-series data were derived from resources available in the public domain, including the Central Reserve Bank of Peru (BCRP), the World Bank, the International Monetary Fund (IMF), the National Institute of Statistics and Informatics (INI), and the United Nations. Further details are available from the corresponding author upon request.

Acknowledgments

During the preparation of this manuscript/study, the author(s) used Gemini 3.1 Pro and Writefull Premium for language editing, including stylistic, grammatical, and syntax corrections. The authors have reviewed and edited the output and take full responsibility for the content of this publication.

Conflicts of Interest

The authors declare no conflicts of interest.

Appendix A

Table A1. Social Indicators.
Socsci 15 00464 i005
Note: Blue bars represent positive correlations, while red bars represent negative correlations.
Table A2. Economic Indicators (Positive Correlation).
Socsci 15 00464 i006
Note: Blue bars represent positive correlations, while red bars represent negative correlations.
Table A3. Economic Indicators (Negative Correlation).
Socsci 15 00464 i007
Note: Blue bars represent positive correlations, while red bars represent negative correlations.
Table A4. Education Indicators.
Socsci 15 00464 i008
Note: Blue bars represent positive correlations, while red bars represent negative correlations.
Table A5. Government Indicators.
Socsci 15 00464 i009
Note: Blue bars represent positive correlations, while red bars represent negative correlations.

References

  1. Abegaz, Mekonnen Bogale, Kenenisa Lemi Debela, and Reta Megersa Hundie. 2023. The effect of governance on entrepreneurship: From all income economies perspective. Journal of Innovation and Entrepreneurship 12: 1. [Google Scholar] [CrossRef] [Scilit]
  2. Alarcón, Renato D., Antonio Lozano-Vargas, Elvia Velásquez, Silvia Gaviria, José Ordoñez-Mancheno, Miriam Lucio, and Alina Uribe. 2022. Venezuelan migration in latin america: History and sociodemographic aspects. Revista de Neuro-Psiquiatria 85: 107–16. [Google Scholar] [CrossRef] [Scilit]
  3. Asencios, Roger, and Renzo Castellares. 2020. The impact of venezuelan immigration on employment and wages: The peruvian case. Documentos de Trabajo 2: 2020. [Google Scholar]
  4. Ayma Quirita, Victor Andrés, Walter Aliaga, Victor Hugo Ayma Quirita, and Juan David Cardenas. 2023. Dataset for: Assessing the Impact of Immigration on Peruvian Society. Available online: https://drive.google.com/drive/folders/1tGtzwmviK6esOOrB4E4vwgNPf5-z8Fej?usp=sharing (accessed on 15 November 2023).
  5. Bell, Brian, and Stephen Machin. 2011. The Impact of Migration on Crime and Victimisation; London: LSE London for the Migration Advisory Committee. Available online: https://www.gov.uk/government/publications/impact-of-migration-on-crime-and-victimisation (accessed on 20 October 2023).
  6. Bhugra, Dinesh, and Matthew Becker. 2005. Migration, cultural bereavement and cultural identity. World Psychiatry 4: 18–24. [Google Scholar] [PubMed]
  7. Borenstein, Michael, Larry V. Hedges, Julian P. T. Higgins, and Hannah R. Rothstein. 2009. Introduction to Meta-Analysis. Chichester: John Wiley & Sons, Ltd. [Google Scholar] [CrossRef] [Scilit]
  8. Bove, Vincenzo, and Leandro Elia. 2017. Migration, diversity, and economic growth. World Development 89: 227–39. [Google Scholar] [CrossRef] [Scilit]
  9. Canchari, Juan Marcos Vilchez, Aura Elisa Quiñones Li, Alejandrina Magdalena Carhuachin Herrera, and Hada Del Rosal Bustamante Sanchez. 2021. Minimum wage, immigration and its effects on peruvian employment. Revista Iberoamericana de la Educación 1: 1–14. [Google Scholar]
  10. Castelli, Francesco. 2018. Drivers of migration: Why do people move? Journal of Travel Medicine 25: tay040. [Google Scholar] [CrossRef] [Scilit] [PubMed]
  11. CELADE. 2026. Investigación de la Migración Internacional en Latinoamérica (Imila). Base de Datos de Microdatos Censales Sobre Migración Internacional. Available online: https://celade.cepal.org/bdcelade/imila/ (accessed on 8 May 2026).
  12. Clemens, Michael A., and Hannah M. Postel. 2018. Deterring emigration with foreign aid: An overview of evidence from low-income countries. Population and Development Review 44: 667–93. [Google Scholar] [CrossRef] [Scilit] [PubMed]
  13. Cohen, Jacob, Patricia Cohen, Stephen G. West, and Leona S. Aiken. 2013. Applied Multiple Regression/Correlation Analysis for the Behavioral Sciences. New York: Routledge. [Google Scholar]
  14. Dougherty, Christopher. 2011. Introduction to Econometrics. Oxford: Oxford University Press. [Google Scholar]
  15. Eguren, Joaquin. 2021. La inmigración venezolana y su impacto en américa latina y el caribe. Revista de Humanidades y Ciencias Sociales 67: 59–65. [Google Scholar] [CrossRef] [Scilit]
  16. Freier, Luisa Feline, and Leda M. Perez. 2021. Nationality-based criminalisation of south-south migration - the experience of venezuelan forced migrants in peru. European Journal on Criminal Policy and Research 27: 113–33. [Google Scholar] [CrossRef] [Scilit] [PubMed]
  17. Greene, William H. 2000. Econometric Analysis, 4th ed. Upper Saddle River: Prentice Hall, pp. 201–15. [Google Scholar]
  18. Groeger, Andre, Gianmarco León-Ciliotta, and Steven Stillman. 2024. Immigration, labor markets and discrimination: Evidence from the venezuelan exodus in peru. World Development 174: 106437. [Google Scholar] [CrossRef] [Scilit]
  19. Hamilton, James D. 2020. Time Series Analysis. Princeton: Princeton University Press. [Google Scholar]
  20. Hernández-Vásquez, Akram, Fabriccio J. Visconti-Lopez, Alexandra C. Rojas-Cueva, Leandro Nicolás Grendas, and Diego Azañedo. 2023. Food insecurity and mental health among venezuelan migrants and refugees living in peru: Secondary data analysis of a cross-sectional survey. Nutrients 15: 3102. [Google Scholar] [CrossRef] [Scilit]
  21. Hervias, Belissa, Keiky Malca, Norma Huansi, and Juan Morales. 2019. Attitudes among lima healthcare workers against the arrival of foreign migrants. Paper presented at 2019 IEEE Sciences and Humanities International Research Conference (SHIRCON), Lima, Peru, November 13–15; pp. 1–4. [Google Scholar]
  22. Huerta-Vera, Genesis S., Manuel A. Amarista, Fernando A. Mejia, Ana B. Graña, Elsa V. Gonzalez-Lagos, and Eduardo Gotuzzo. 2021. Clinical situation of venezuelan migrants living with hiv in a hospital in lima, peru. International Journal of STD & AIDS 32: 1157–64. [Google Scholar] [CrossRef] [Scilit] [PubMed]
  23. Inafuko, Jorge Toma, and Jorge Luis Rubio Donet. 2012. Estadística Aplicada: Primera Parte. Apuntes de Estudio: 64. Lima: Universidad del Pacífico. [Google Scholar]
  24. INEI. 2022a. Perú: 50 años de cambios, desafíos y oportunidades poblacionales. In Compendio: Población y Demografía. Lima: Informe, Instituto Nacional de Estadística e Informática. [Google Scholar]
  25. INEI. 2022b. Perú: Estadísticas de la Emigración Internacional de Peruanos e Inmigración de Extranjeros, 1990–2021. Technical Report. Lima: INEI.
  26. Kim, Jong In, and Gukbin Kim. 2016. Country-level socioeconomic indicators associated with healthy life expectancy: Income, urbanization, schooling, and internet users: 2000–2012. Social Indicators Research 129: 391–402. [Google Scholar] [CrossRef] [Scilit]
  27. Maeda, Jessica, Tessy Palacios, Gabriela Ramos, and Paola Velarde. 2021. La Xenofobia en la Lucha Contra la Discriminación en el Perú. Lima: Instituto de Democracia y Derechos Humanos de la Pontificia Universidad Católica del Perú (IDEHPUCP). [Google Scholar]
  28. Mendoza, Walter, and J. Jaime Miranda. 2019. La inmigración venezolana en el perú desafíos y oportunidades desde la perspectiva de la salud. Revista Peruana de Medicina Experimental y Salud Pública 36: 497–503. [Google Scholar] [CrossRef] [Scilit] [PubMed]
  29. Montgomery, Douglas C., Elizabeth A. Peck, and G. Geoffrey Vining. 2021. Introduction to Linear Regression Analysis. Hoboken: John Wiley & Sons. [Google Scholar]
  30. Morales, Fernando, and Martha Denisse Pierola. 2020. Venezuelan Migration in Peru: Short-Term Adjustments in the Labor Market. Lima: Inter-American Development Bank. [Google Scholar] [CrossRef] [Scilit]
  31. Noor, Norazian Mohamed, Mohd Mustafa Al Bakri Abdullah, Ahmad Shukri Yahaya, and Nor Azam Ramli. 2015. Comparison of linear interpolation method and mean method to replace the missing values in environmental data set. In Geopolymer and Green Technology Materials. Wollerau: Trans Tech Publications Ltd., vol. 803, pp. 278–81. [Google Scholar] [CrossRef] [Scilit]
  32. OIM. 2016. Análisis: Flujos Migratorios de Venezolanos en Sudamérica, Mayo 2018. San Isidro: OIM. [Google Scholar]
  33. Oviedo, Jhon Valdiglesias. 2018. Efectos de corto plazo de la inmigración venezolana en el perú. Pensamiento Crítico 23: 73–96. [Google Scholar] [CrossRef] [Scilit]
  34. Palla, Irene. 2023. Autonomia delle persone in movimento e antropologia compromessa: Riflessioni sulle reciproche influenze nella gestione dell’immigrazione in perù. Archivio Antropologico Mediterraneo 25: aam.6779. [Google Scholar] [CrossRef] [Scilit]
  35. Pesaran, M. Hashem, and Ron Smith. 1995. Estimating long-run relationships from dynamic heterogeneous panels. Journal of Econometrics 68: 79–113. [Google Scholar] [CrossRef] [Scilit]
  36. Pérez, Leda M., and Luisa Feline Freier. 2022. My brother the “other”: Use of satire and boundary-making by venezuelan migrants in peru. Social Inclusion 10: 72–83. [Google Scholar] [CrossRef] [Scilit]
  37. R4V. 2026. Refugiados y Migrantes de Venezuela. Available online: https://www.r4v.info/es/refugiadosymigrantes (accessed on 8 May 2026).
  38. Ramirez, Maria Murcia. 2022. Impacto de la Inmigración en la Población Económicamente activa Ocupada del Perú Periodo 2015–2019. Ph.D. dissertation, Universidad Nacional de la Amazonía Peruana, Loreto, Peru. [Google Scholar]
  39. Said, Valeria Aron, and Soledad Castillo Jara. 2022. Reacting to change within change: Adaptive leadership and the peruvian response to venezuelan immigration. International Migration 60: 57–76. [Google Scholar] [CrossRef] [Scilit]
  40. Summers, Katharine, Jessica Crist, and Bernhard Streitwieser. 2022. Education as an opportunity for integration: Assessing colombia, peru, and chile’s educational responses to the venezuelan migration crisis. Journal on Migration and Human Security 10: 95–112. [Google Scholar] [CrossRef] [Scilit]
  41. Tsay, Ruey S. 2005. Analysis of Financial Time Series. Hoboken: John Wiley & Sons. [Google Scholar]
  42. Vera, Celia P., and Bruno Jiménez. 2022. Do Immigrants Take or Create Natives Jobs? Evidence of Venezuelan Immigration in Peru. Lima: Lima School of Economics. [Google Scholar]
  43. Wooldridge, Jeffrey M. 2010. Econometric Analysis of Cross Section and Panel Data. Cambridge: MIT Press. [Google Scholar]
  44. Wooldridge, Jeffrey M. 2016. Introductory Econometrics a Modern Approach. Boston: South-Western Cengage Learning. [Google Scholar]
  45. Wright, Julia L., Daniel Barber, Sofia Scataglini, and Sudhakar L. Rajulu. 2021. Advances in Simulation and Digital Human Modeling: Proceedings of the AHFE 2021 Virtual Conferences on Human Factors and Simulation, and Digital Human Modeling and Applied Optimization, July 25–29, 2021, USA. New York: Springer Nature, vol. 264. [Google Scholar]
Figure 1. Flowchart of Research Methodology. Arrows indicate the sequential workflow. Logos represent data sources, while the colored icons, lines, and symbols serve as illustrative visual aids for each analytical stage.
Socsci 15 00464 g001
Figure 2. Trends in Immigration to Peru Over Recent Decades with a Distinction Between Documented and Undocumented Migrants and Emphasis on Venezuelan Migration.
Socsci 15 00464 g002
Table 1. Social Aspects.
Socsci 15 00464 i001
Note: Blue bars represent positive correlations, while red bars represent negative correlations. *** p < 0.001 .
Table 2. Economic Aspects.
Socsci 15 00464 i002
Note: Blue bars represent positive correlations, while red bars represent negative correlations. *** p < 0.001 .
Table 3. Educational Aspects.
Socsci 15 00464 i003
Note: Blue bars represent positive correlations, while red bars represent negative correlations.** p < 0.01 , *** p < 0.001 .
Table 4. Governmental Aspects.
Socsci 15 00464 i004
Note: Blue bars represent positive correlations, while red bars represent negative correlations. *** p < 0.001 .
Table 5. Econometric Validation of Migration Impacts: Time-Trend Control and First Differences Models.
Dependent Variable ( Y t )BaselineOLS with Trend ( X t , t )First Differences ( Δ Y t , Δ X t )Evidence Status
Corr ( r ¯ ) β mig SE R adj 2 F-Stat β Δ SE R adj 2 F-Stat
Panel A: Social Indicators
Average Length of Stay (Days) for International Tourists−0.832 ***−1.072 ***0.1320.8776.9−0.430 *0.2020.144.5Robust Effect
Crime Complaints0.889 ***0.732 ***0.1390.8668.20.0290.224−0.050.0Time Artifact
Number of Individuals Detained0.891 ***0.677 ***0.0810.95223.50.683 ***0.1630.4417.5Robust Effect
Percentage of Population Food Insecurity0.993 ***1.026 ***0.0440.99764.90.799 ***0.1340.6235.3Robust Effect
Percentage of population under 30 years−0.737 ***0.314 ***0.0340.991314.20.627 **0.1740.3613.0Robust Effect
Total population and % of older people > 300.802 ***−0.074 *0.0300.991679.5−0.2260.2180.001.1Time Artifact
Panel B: Economic Indicators
Avg. Income/Consumption (Total Pop.)−0.971 ***−1.123 ***0.0830.95210.4−0.734 ***0.1520.5223.4Robust Effect
Avg. Income/Consumption (Poorest 40%)0.971 ***1.123 ***0.0830.95210.40.734 ***0.1520.5223.4Robust Effect
Direct Credit to Private Sector (NC)0.814 ***−0.6750.3540.092.10.0030.224−0.050.0Spurious
Number of Active Affiliates Private Pension0.884 ***0.228 ***0.0261.002215.20.3970.2050.123.7Time Artifact
Percentage of Arable Land−0.906 ***−0.815 ***0.1700.7942.7−0.3320.2110.072.5Time Artifact
Percentage of Pop. with Bank/Mobile Account0.972 ***0.745 ***0.0730.96278.30.688 ***0.1620.4518.0Robust Effect
Panel C: Educational Indicators
Average Years of Formal Education0.952 ***0.612 ***0.0780.96239.60.520*0.1910.237.4Robust Effect
Gender Parity in Educational Enrollment−0.561 **−1.180 ***0.2240.6420.3−0.544 **0.1880.268.4Robust Effect
Illiteracy rate−0.790 ***-0.0800.1400.8667.80.0110.224−0.050.0Spurious
Number of Articles in Scientific Journals0.987 ***0.791 ***0.0340.991284.80.861 ***0.1140.7357.3Robust Effect
Pop. > 25 with Master’s or Higher0.973 ***1.034 ***0.0870.95190.40.726***0.1540.5022.3Robust Effect
Primary school delayed attendance0.938 ***0.783 ***0.1290.8881.50.486 *0.1950.206.2Robust Effect
Panel D: Governmental Indicators
General Govt. Expenditure on Health0.881 ***0.0740.0460.98714.80.3490.2100.082.8Spurious
Non-financial expenditures (Local Govt.)−0.715 ***−1.414 ***0.1890.7432.4-0.3600.2090.093.0Time Artifact
Private Health Expenditure (% of Current)−0.803 ***−0.555 **0.1700.7942.7-0.1540.221−0.030.5Time Artifact
Central Govt. Tax Revenue (ISC, IGV)0.842 ***0.0350.0960.93155.7−0.2690.2150.031.6Spurious
Tax Revenue of the General Government0.834 ***0.0350.0980.93148.5−0.2680.2150.031.6Spurious
Total Expenditure by Central Government0.852 ***0.259 ***0.0600.97409.00.2260.2180.001.1Time Artifact
Note: *** p < 0.001, ** p < 0.01, * p < 0.05. OLS models control for a linear time trend (t). βt parameters are omitted for brevity. Central Gov. tax represents only national-level revenue (SUNAT), while General Gov. tax includes subnational taxes and Social Security contributions (EsSalud/ONP).
Disclaimer/Publisher’s Note: The statements, opinions and data contained in all publications are solely those of the individual author(s) and contributor(s) and not of MDPI and/or the editor(s). MDPI and/or the editor(s) disclaim responsibility for any injury to people or property resulting from any ideas, methods, instructions or products referred to in the content.