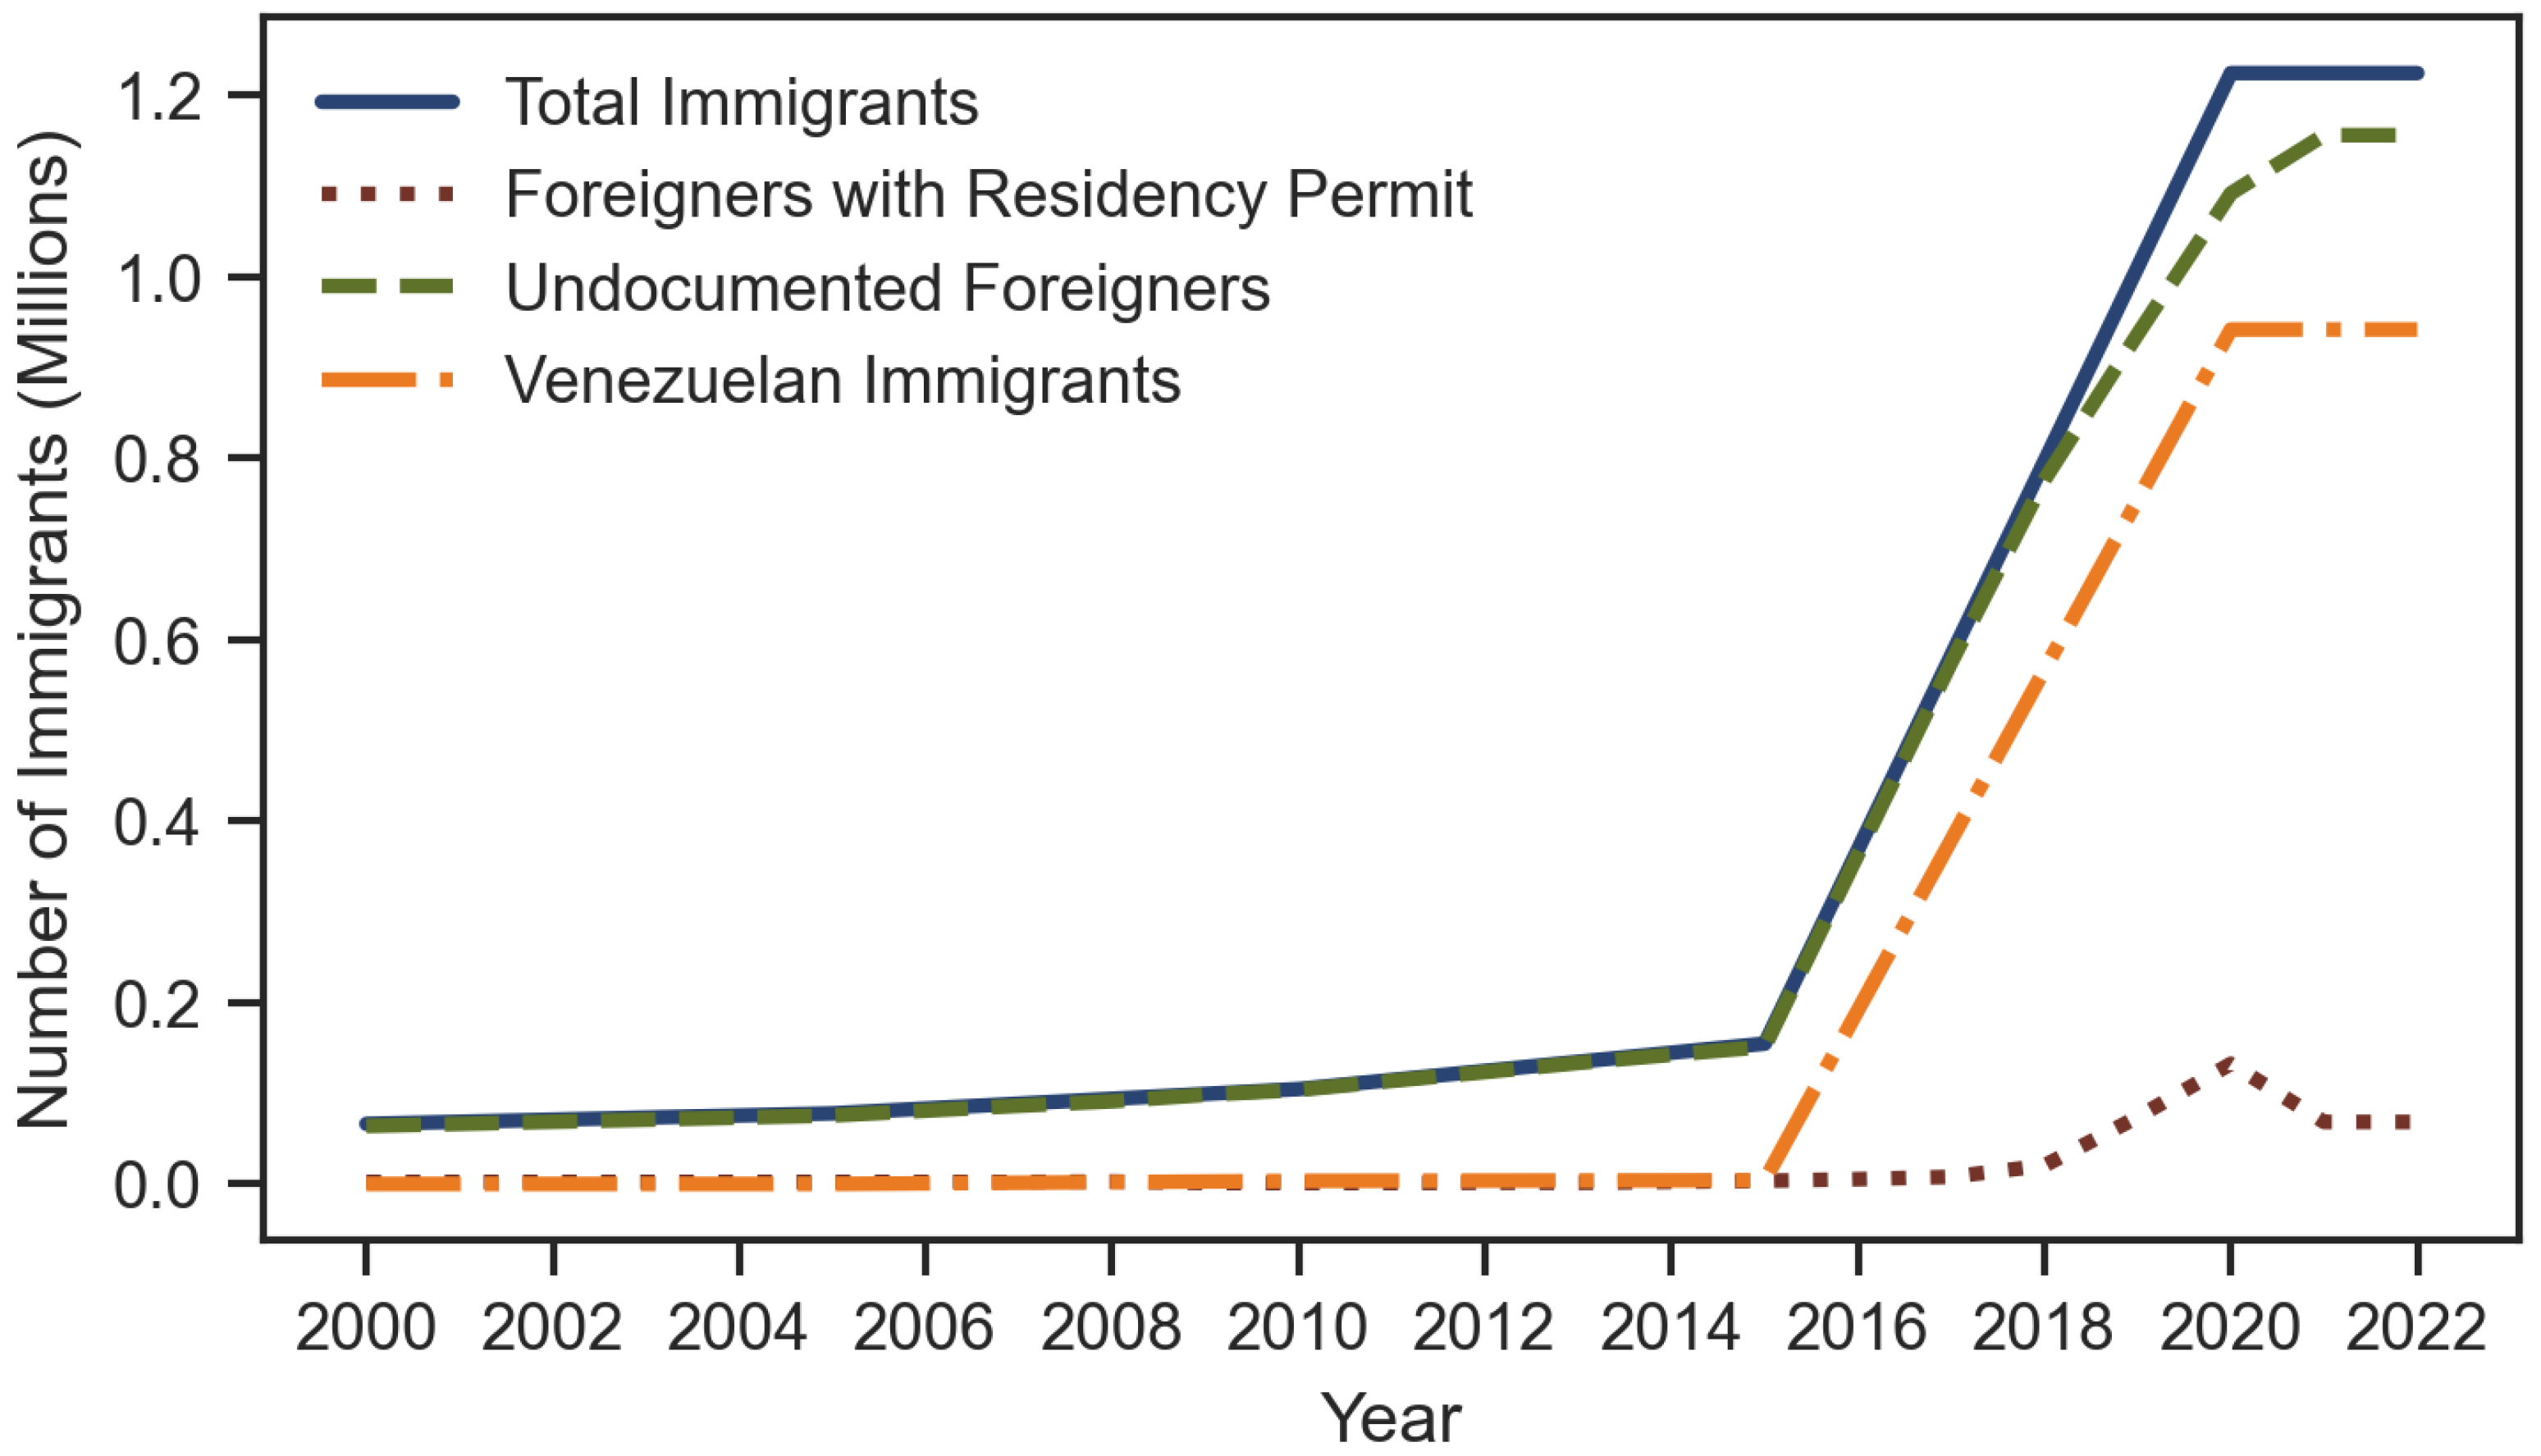
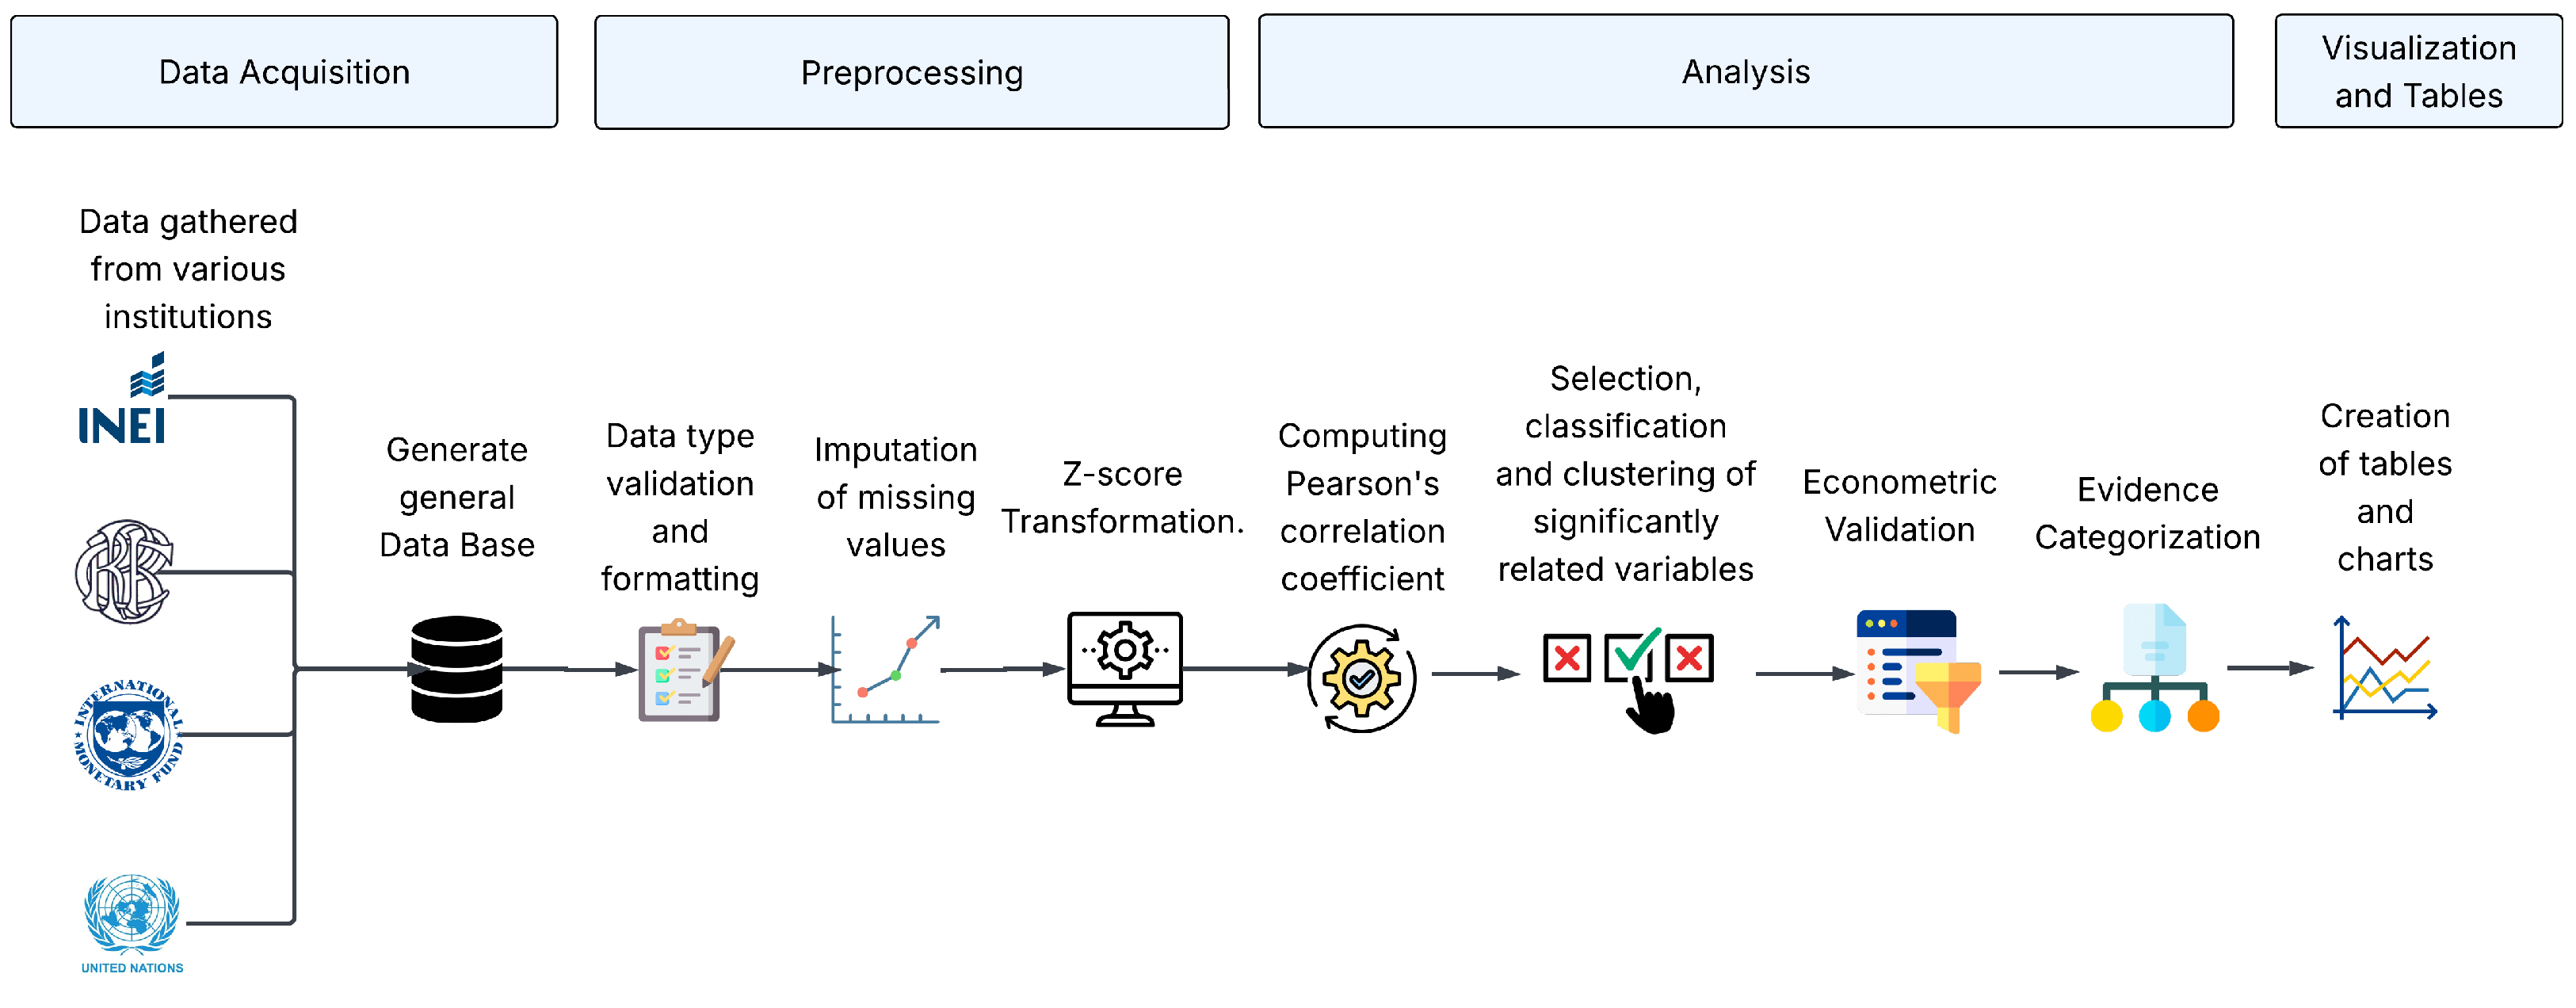
The study focused on a comprehensive set of 4565 indicators, organized into 15 distinct groups. Using these data, an initial graphical representation was created to depict the trends in immigrant flow to Peru over recent decades.
The findings are presented in two analytical stages. The first stage details the most robust correlations (both positive and negative), identifying which indicators exhibit significant co-variance with migratory flows. The second stage, involving rigorous econometric validation, evaluates the underlying nature of this relationship to assess the statistical significance and magnitude of the association between migration and the pre-selected indicators. This methodological approach isolates the co-movement from shared temporal inertia, effectively distinguishing robust structural correlations from spurious relationships driven by common trends, without asserting strict causality.
3.1. Exploratory Correlation Findings
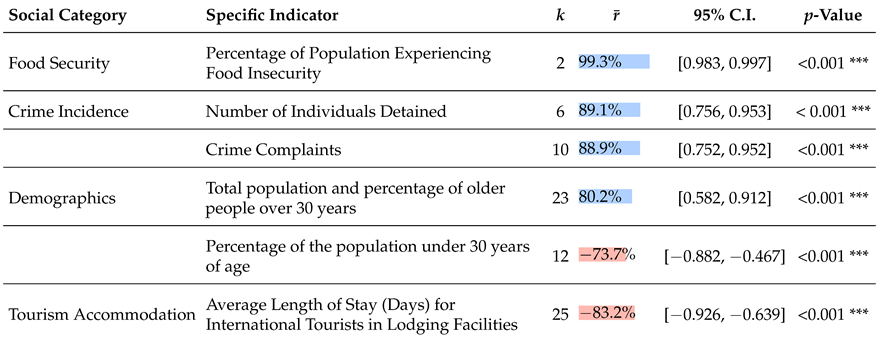
To operationalize the first stage of this assessment, migratory dynamics were examined against a meticulously selected set of time series across four primary domains: Social (
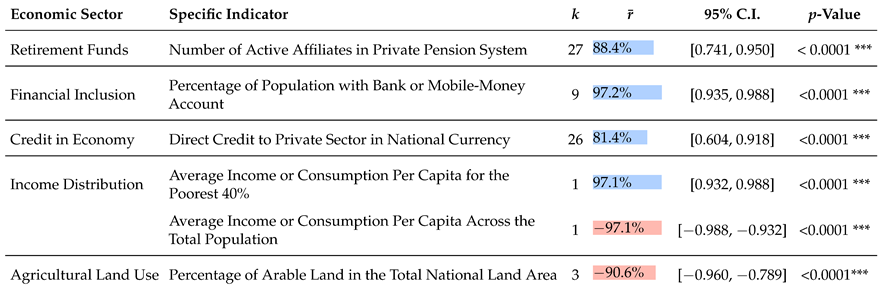
Table 1), Economic (
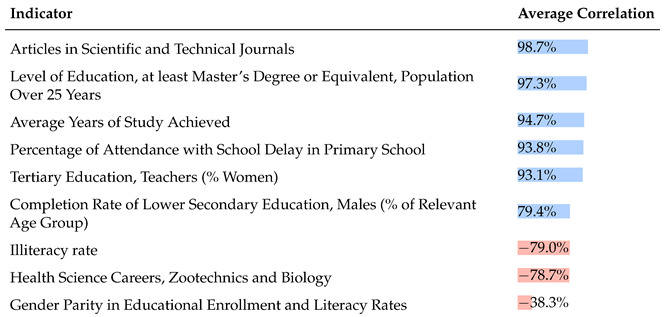
Table 2), Educational (
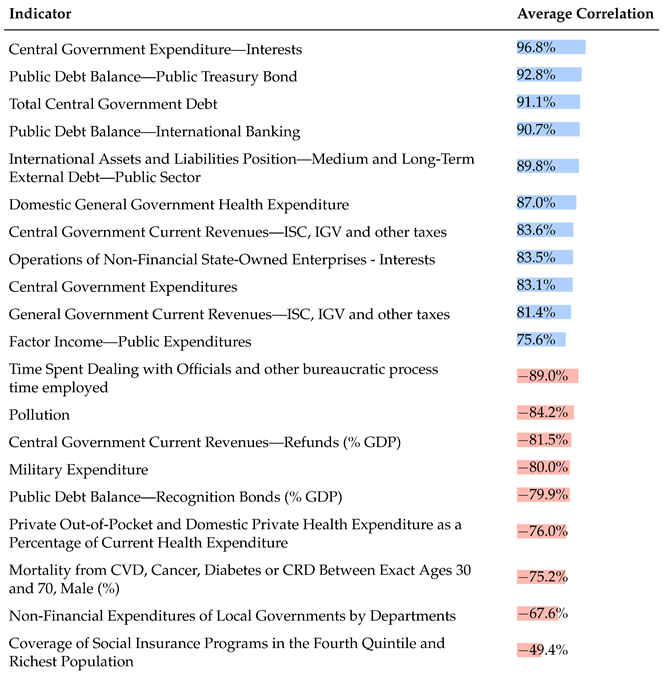
Table 3), and Governmental (
Table 4). This classification facilitates a comprehensive impact assessment, identifying how the migratory phenomenon interacts with different facets of national development prior to the econometric stress tests.
Within each domain, the series were stratified into four indicators with strong positive correlations and two with pronounced negative correlations to provide a balanced overview of the observed trends. For each variable, the tables report the number of averaged series (
k), the adjusted mean correlation (
), the 95% confidence intervals (C.I.), and the associated
p-values to ensure statistical rigor. While the most representative categories are discussed in this section, the remaining indicators that exhibit high statistical significance are detailed in the
Appendix A.
In
Table 1, three primary categories are identified that exhibit trends corresponding to migratory flows, along with one category showing an inverse trend. These include food insecurity, the prevalence of criminal activities, and population demographics, which encompass both the total population and the proportion of individuals over 30 years of age. Unlike these, the category of tourist accommodation stands out as being negatively correlated with migration patterns. The incidence of food insecurity, which includes severe and moderate cases, reflects the patterns observed in migration trends.
Similarly, the trend toward citizen insecurity is evident from the number of individuals detained in various categories, including offenses against personal liberty, life, property, drug trafficking and consumption, and public safety. In the same vein, the number of complaints filed in different categories of crime (in general, against personal liberty, domestic violence, corruption, human trafficking, public safety, property, life, and vehicle theft) also follows this pattern.
Furthermore, the total population (both male and female) shows a trend consistent with migration movements, as does the proportion of the population over 30 years of age. However, the proportion of the population under 30 years shows a distinct negative correlation with migration flows. Similarly, the average duration of stays in accommodation by international visitors presents a significant negative correlation.
In the analysis of the economic indicators presented in
Table 2, five main categories emerge. Initially, a correlation is observed between participation in private pension schemes and immigration trends, with varying degrees of association between different regions. The banking sector also exhibits parallel trends among diverse demographic groups, indicating an increased integration of individuals into the financial system, either through accounts in financial institutions or mobile money service providers.
Additionally, direct credit to the private sector in the national currency shares this trend, as evaluated in each region of the country. Furthermore, there is a significant positive correlation between average consumption or income and the economic status of the lowest 40% of the population. In contrast, there is a marked negative correlation between the overall consumption of the total population and migration flows. The data also reveal a decline in arable land concurrent with an increase in immigration over time.
In the educational sector, as detailed in
Table 3, there is a significant correlation between immigration patterns and the average years of education for both male and female students. This correlation is also observed in the proportion of delayed school enrollments, particularly at the primary education level.
Additionally, the number of scientific articles published also demonstrates a positive trend similar to migration flows. Similarly, the number of individuals with a master’s degree or higher (including males, females, and the total population) exhibits a similar pattern. In contrast, the rate of illiteracy shows a strong negative correlation.
Interestingly, gender parity in education shows a divergent trend in relation to immigration patterns. This is illustrated by the ratio of female to male students in both primary and secondary education and the proportion of literate young women compared to men, as well as the enrollment ratio at the primary, secondary, and tertiary levels, each demonstrating varying levels of correlation.
In the context of state governance, as defined in
Table 4, a noticeable alignment is observed between variations in migratory flows and both government expenditures and revenues.
Specifically, central government expenditure reflects these migration trends. However, an inverse correlation is noted in the spending patterns of local governments (by departments) in non-financial expenditure. Concerning revenue, a significant parallel is evident between the central government’s taxes (income from selective consumption tax (ISC) and general sales tax (IGV), as well as income tax and other tax revenues, including the total tax revenues), and migration patterns.
Likewise, the general government’s revenues also share this positive trend (in taxes similar to those of the central government, such as ISC, IGV, and income tax). Furthermore, health expenditure closely follows migratory trends, as indicated by the central government’s investment in health and the current state health expenditure.
In contrast, out-of-pocket expenditure and domestic private health expenditure, when expressed as a percentage of current health expenditure, exhibit a significant negative correlation with immigration data records.
These findings across the social, economic, and governmental domains provide a preliminary landscape of the statistical associations present in the data. However, while these patterns suggest a strong relationship between immigration and national development indicators, they are inherently limited by their bivariate nature. Consequently, the analysis moves beyond exploratory metrics to a confirmatory stage to determine if these associations persist under more rigorous statistical controls.
3.2. Econometric Validation Outcomes
As presented in the preceding exploratory analysis, almost all evaluated indicators exhibit highly significant baseline correlations with the migratory flow (), with the sole exception of gender parity in educational enrollment and literacy rates (). While these bivariate correlations highlight strong statistical associations, Pearson’s coefficient does not account for the inertial macroeconomic and demographic growth of the country over the 2000–2022 period.
To rigorously isolate the true impact of immigration from underlying temporal dynamics and avoid spurious conclusions, two advanced econometric models were applied: an Ordinary Least Squares (OLS) regression controlling for a linear time trend, and a First Differences model to evaluate the response to immediate migratory shocks. The results of this econometric validation are consolidated in
Table 5. The table is organized into four thematic panels (Social, Economic, Educational, and Governmental Indicators) to provide a multidimensional view of the phenomenon. Each row evaluates a specific dependent variable against the baseline correlation (
). The columns detail the estimated coefficients (
), standard errors (
), and goodness-of-fit measures (
and
F-statistic) for both the time-trend adjusted OLS and the first differences specifications. Finally, the “Evidence Status” column provides a qualitative synthesis.
Following the methodological criteria, the econometric outcomes are classified according to their statistical persistence under strict controls. An indicator exhibits a robust effect if it demonstrates a direct, structural relationship by responding immediately to sudden migratory shocks. Conversely, a relationship is deemed a time-trend artifact if the initial baseline correlation is merely a byproduct of the country’s historical growth trajectory, losing its validity once temporal inertia is factored out. Finally, spurious results denote variables that fail to maintain any consistent statistical association when subjected to rigorous econometric specifications.
Applying this framework, the First Differences model confirms that multiple variables maintain statistical significance after differencing, thereby exhibiting a robust effect isolated from the nation’s natural organic growth. Within the social dimension, immigration directly influences food insecurity rates, the number of detained individuals, the demographic share of the youth population (under 30), and the average length of stay for international tourists. Economically, the analysis reveals structural associations with average income levels—for both the poorest 40% and the general population—as well as enhanced financial inclusion via bank or mobile-money accounts. Notably, the educational sector displays exceptional resilience to econometric stress; the data confirms substantive impacts on scientific journal publications, postgraduate degree attainment, average years of formal education, primary school attendance delays, and shifts in educational gender parity.
On the other hand, the validation process categorizes a distinct set of highly correlated variables as time-trend artifacts. Indicators such as total central government expenditure, local government non-financial expenditures, private health spending, crime complaints, total population, the aging demographic (over 30), active private pension affiliates, and the percentage of arable land are shown to be primarily driven by shared inertial growth. Finally, variables that lose significance upon the introduction of baseline controls—specifically general government health expenditure, tax revenues, direct credit to the private sector, and the illiteracy rate—are strictly classified as spurious correlations.
Interpretation of Coefficient Sign Inversions
A critical observation from the econometric analysis is the sign inversion of specific indicators when transitioning from baseline Pearson correlations to robust specification models. These inversions are not statistical anomalies but empirically validate the necessity of our time-trend (t) and First Differences () controls.
For highly structural variables with deterministic linear trends, such as total population (
), the baseline correlation with immigration is strongly positive due to parallel historical growth. However, when introducing a time control in the OLS framework, the
coefficient isolates the orthogonal components in accordance with the Frisch–Waugh–Lovell theorem (
Wooldridge 2016). The resulting negative coefficient (
) accurately reflects that short-term positive shocks in immigration are correlated with negative deviations from the deterministic population growth trend. A complementary effect is observed in the youth demographic (population under 30), which exhibits a strong secular decline (
). After partialling out this historical downward trend, the positive OLS coefficient (
) reveals that migratory influxes actively dampen the demographic aging effect. Furthermore, apparent sign inversions in specific aggregated economic indicators (e.g., Direct Credit to Private Sector) reveal a classic macroeconomic aggregation bias, akin to Simpson’s Paradox (
Pesaran and Smith 1995). The baseline coefficient (
) is derived from a Fisher
z-transformation, which uniformly averages the individual correlations of all regional sub-series, correctly indicating that the vast majority of regional financial sectors respond positively to migratory flows. Conversely, the econometric models (
) evaluate the absolute aggregated volume of credit, which is entirely dominated by a heavily weighted, structurally divergent outlier (the capital region). This mathematical divergence highlights the critical distinction between widespread regional microeconomic responses and heavily concentrated absolute macroeconomic volume.
The First Differences model further unmasks long-term spurious relationships driven by unobserved common trends. For instance, both immigration flows and general government tax revenue exhibit strong historical upward trajectories, resulting in a high baseline correlation (). However, the First Differences coefficient uncovers the immediate short-term dynamics (): sudden year-over-year migratory influxes are associated with contemporaneous decelerations or negative shocks in tax revenue growth, likely reflecting immediate macroeconomic absorption costs or informal labor market pressures. Conversely, the strong negative baseline correlation observed with the illiteracy rate () is completely neutralized in the First Differences model (, not significant). This explicitly demonstrates that annual migratory shocks have no causal effect on illiteracy rates, proving that the baseline relationship was purely a spurious artifact of opposing secular trends (i.e., natural educational improvements occurring concurrently with rising immigration).




 ,
,