1. Introduction
1.1. Remittances as Data Infrastructure and a Case of Big Data in Political Communication
Remittances are one of the most visible expressions of this strategy. They connect labour markets in destination countries with households, local economies and welfare needs in countries of origin, and they acquire public meaning when they are measured, aggregated, compared and communicated.
The analytical move of this article is therefore to treat remittances as quantified objects embedded in data-driven political processes. Observed NBR data and model-based World Bank/KNOMAD estimates are not read as a simple opposition between true and false numbers, but as infrastructures that allow different calculations and narratives to circulate, including through digitally mediated forms of connective action and political participation (
Bennett and Segerberg 2013).
The article asks: how do remittance data regimes and presentation choices produce divergent representations of the UK–Romania corridor, and what are the implications for political communication, diaspora governance and the analysis of bottom-up welfare practices? This framing keeps the empirical comparison connected to the broader question of how metrics legitimise public claims about migration, welfare responsibility and national performance.
1.2. Economic Peripheralization, Inequalities and Emerging Social Policies
This article uses the concept of emerging social policies to describe welfare-relevant practices that arise when households, communities and transnational actors compensate for gaps in state-centred welfare provision. The concept is not used here as a metaphor for general social change. It is operationalised through observable mechanisms: cross-border transfers, family support, community intermediation, public recognition of diaspora contribution and the circulation of metrics that convert private transfers into policy-relevant evidence.
This operationalisation connects the concept to bottom-up policy approaches. Bottom-up policies do not replace formal public policy; rather, they identify forms of problem-solving that originate among citizens, communities or local actors and may later be recognised, coordinated or incorporated by institutions. Recent work on two-pronged approaches to complex policy problems stresses the need to combine macro-policy instruments with citizen-level and small-scale participation (
Angelakis 2025). Likewise, scholarship on mainstreaming citizen science in policy shows that policy systems often need to adapt their structures, capacities and routines in order to make citizen-generated knowledge usable for public decision-making (
Hölscher et al. 2025).
By analogy, remittance practices can be read as bottom-up welfare practices: they are initiated by households and migrants rather than by ministries, but they may become policy-relevant when their aggregate volume is measured, interpreted and used in communication about national resilience, social protection, diaspora belonging or economic vulnerability.
The term emerging social policies is therefore defined in this article as the set of community-generated and transnationally mediated welfare practices that become visible through remittances and that acquire political significance when they are quantified and narrated. The concept has three empirical anchors in this study: household-level support from migrants, aggregate remittance statistics, and public communication that frames diaspora transfers as economic or social contribution.
This definition also introduces a critical limitation. Remittances may alleviate household vulnerability, but they do not automatically constitute equitable or democratically accountable social policy. They can reduce pressure on public budgets while shifting responsibility for welfare onto migrant households. For this reason, the article treats emerging social policies as an analytical category requiring empirical caution, not as a normative celebration of welfare substitution.
1.3. Multimodal Migration and the Phenomenon of Personal Remittances
Migration and remittances are central to the empirical case because they connect individual mobility, household welfare and public metrics. The article focuses on Romanian migration to the United Kingdom because the corridor is socially significant and because its remittance flows are represented differently by observed and modelled data infrastructures.
For migrant families, migration can be understood as a total social phenomenon in a limited analytical sense: it affects income, care arrangements, language practices, intergenerational relations and political belonging (
Mauss 2002;
de Haas et al. 2020;
Stark and Bloom 1985). This formulation does not imply that migration has the same effects for all families. It indicates that the remittance transfer is embedded in a wider social reorganisation of family life.
Romania is a relevant case because outward migration has been large by European standards. OECD data identify Romania as a major emigration country, and World Bank analysis shows that outward migration contributed substantially to population decline during the post-2000 period (
World Bank 2018;
OECD 2019,
2025). Working-age migration affects labour supply, family welfare and the social-policy environment in which remittances become important.
The scale of Romanian emigration gives remittances a dual meaning. At the household level, they are part of family survival, investment or care strategies. At the aggregate level, they become macro-social indicators that may be used to describe diaspora contribution, national dependence on external labour markets or the limits of domestic welfare provision. This dual meaning is precisely why data presentation matters.
The research problem is therefore not only how much money is transferred from the United Kingdom to Romania, but how different data regimes make those transfers interpretable. A nominal increase, a real-price adjustment, an employment-scaled estimate or a smoothed trend can each support different claims about welfare, national performance and diaspora responsibility.
1.4. Research Contribution
The contribution of the article is threefold. First, it compares observed and model-based remittance data while avoiding a rigid binary between institutional sources. Second, it shows how calculation choices—nominal reporting, deflation, employment scaling, smoothing and index construction—shape the narratives that can be built from remittance data. Third, it links these measurement choices to political communication and emerging bottom-up welfare practices.
This approach keeps the analysis focused on data infrastructures. Claims about migration, welfare substitution and economic attractiveness are not treated as stand-alone conclusions; they are treated as examples of how remittance numbers become politically meaningful when inserted into media, policy and diaspora-facing communication.
The article therefore advances a cautious argument: remittance statistics are indispensable for understanding transnational welfare practices, but their political use requires transparency about source differences, assumptions, price adjustments, proxy variables, uncertainty assumptions and the limits of single-number indicators (
Stiglitz and Rothschild 1970).
2. From Metrics to Political Communication and Digital Governance
This section develops the analytical framework used in the empirical analysis. The framework is organised as a chain: remittance practices are quantified by data infrastructures; quantified outputs acquire authority through metric power; modelled values and forecasts operate as anticipatory devices; media and policy systems translate numbers into public narratives; and these narratives can recast household transfers as bottom-up welfare practices or national performance indicators.
The concepts used in the article therefore operate at different levels rather than as separate labels. Quantification explains how heterogeneous transfers become comparable data. Metric power explains why those data can become authoritative. Algorithmic governmentality explains the public relevance of modelling, proxy selection and forecasting. Hybrid media systems explain how numbers circulate beyond technical institutions. Emerging social policies explain why remittances matter for welfare analysis when households and diasporas compensate for state limitations.
2.1. Quantification and Data Infrastructures
Quantification is not a neutral mirror of social reality. It formats phenomena into categories, currencies, time intervals and comparable series, making some relationships legible while obscuring others (
Espeland and Stevens 2008). In the remittance domain, this means that household transfers become policy-relevant only after they have passed through reporting channels, balance-of-payments categories, exchange-rate conversions, bilateral matrices or estimation models.
The comparison between NBR and World Bank/KNOMAD data is therefore a comparison of infrastructures and transformations. NBR values are treated as observed balance-of-payments statistics compiled within the external-sector statistical system and aligned with BPM6 classifications. By contrast, the World Bank/KNOMAD bilateral matrix is treated as a model-based allocation of inward remittances across source corridors, using migrant-stock and income variables to improve cross-country comparability (
National Bank of Romania 2024;
Ratha et al. 2022;
KNOMAD and World Bank 2022). The two sources are not ranked as simply true or false. They are read as different measurement regimes whose assumptions shape what becomes visible in the UK–Romania corridor.
2.2. Metric Power, Narrative and Political Legibility
Once remittance figures are published, they can exercise metric power: they become authoritative signals that support claims about diaspora contribution, national economic performance or welfare dependence (
Beer 2016). A figure such as total annual remittances can be used to narrate the diaspora as an economic stabiliser, while a real-term decline can support a narrative of weakened household support. The political meaning depends on how the metric is calculated and presented.
The transfer-balance indicator discussed later in the article illustrates this point. As
Fourcade (
2016) argues, ordinalisation turns complex social processes into comparable rankings or scores. Such simplification is communicatively powerful, but it also requires caution because the resulting index can exclude wage dynamics, productivity, public services, investment, return migration and other determinants of economic attractiveness.
2.3. Algorithmic Governmentality and Modelling Uncertainty
Model-based remittance estimates and short-horizon forecasts can function as anticipatory devices.
Rouvroy and Berns (
2013) describe algorithmic governmentality as a mode of governing through correlations and projections that influence decision-making without always making assumptions explicit. Applied to remittances, this means that modelled values may shape policy debate even when uncertainty, proxy choices or data gaps remain invisible to non-specialist audiences.
This is why the article reports nominal values, real values, employment-scaled scenarios and moving averages separately. The purpose is not to add technical complexity for its own sake, but to show which assumptions are doing interpretive work. A smoothed or employment-scaled series may be useful, yet it must not circulate as if it were a direct observation.
2.4. Emerging Social Policies as Bottom-Up Welfare Practices
The concept of emerging social policies is used as an analytical bridge between remittance measurement and welfare interpretation. In this article, emerging social policies refer to bottom-up, transnational and community-mediated welfare practices that become visible when migrant households support relatives, local communities or social reproduction in the country of origin. The concept is related to bottom-up policy approaches that emphasise citizen participation, co-production and global social-policy innovation, as well as the need for institutions to recognise knowledge and practices generated outside formal policy hierarchies (
Angelakis 2025;
Hölscher et al. 2025).
The critical point is that bottom-up does not mean apolitical or automatically beneficial. Remittances may support household welfare, but they can also shift burdens from public institutions to migrants and families. Treating remittances as emerging social policies therefore requires two empirical anchors: evidence of transfers and a transparent account of how those transfers are translated into policy-relevant claims.
2.5. Hybrid Media Circulation and Illustrative Public Communication
Remittance metrics become politically consequential when they circulate beyond specialist datasets. In a hybrid media system, figures produced by central banks, international organisations and statistical agencies are recontextualised by journalists, political actors, platform publics and diaspora organisations (
Chadwick 2013). Methodological uncertainty is often reduced during this circulation, while rhetorical clarity increases.
Several public examples illustrate this mechanism. The International Organization for Migration’s World Migration Report 2024 used a global development frame in which remittances were presented as a major source of cross-border support and compared with other international financial flows (
International Organization for Migration 2024). A World Bank press release framed global remittances through a forecast narrative—remittances slowed in 2023 and were expected to grow faster in 2024—thereby turning model-based projections into a policy-facing storyline (
World Bank 2024). Romanian media similarly translated NBR-related figures into a headline about Romanians abroad sending record amounts home in 2023, linking remittances to GDP, foreign direct investment and the current account deficit (
Romania Journal 2024). In diaspora-facing political commentary, remittances are also connected to representation, recognition and electoral behaviour, as illustrated by public discussion of Romanian migrant workers and diaspora voting in 2025 (
Besliu 2025).
These examples are not used as a full media-content analysis. They are illustrative evidence of how remittance numbers travel from measurement infrastructures into political communication. They show why the calculation choices examined in the Results section matter: the headline-ready figure is never just a number, but a condensed narrative about migration, welfare, national belonging and state performance.
3. Research
3.1. Research Design: From Source Comparison to Presentation Comparison
The empirical design is organised around presentation and calculation choices rather than around a simple institutional dichotomy. The article compares NBR observed data and World Bank/KNOMAD-based estimates, but its central question is how remittance figures become meaningful when they are reported as nominal values, deflated into real values, compared year by year, smoothed through moving averages, extended through employment-scaled scenarios or condensed into a transfer-balance indicator.
This organisation keeps the paper’s empirical work aligned with its theoretical framework. Nominal values show communicative scale. Real values show welfare relevance. Year-by-year changes create stories of growth or decline. Moving averages create stability and trend-like readability. Employment-scaled scenarios reveal the role of proxy assumptions. Transfer-balance indicators demonstrate how single-number indices can convert remittance flows into broader claims about national dependence or attractiveness.
3.2. Data Sources and Harmonisation
The analysis uses secondary, aggregated and publicly available data from five source families. First, observed UK-to-Romania personal-remittance receipts are taken from National Bank of Romania balance-of-payments statistics; the NBR metadata describe balance-of-payments statistics as external transactions between Romania and the rest of the world, classified in line with BPM6 (
International Monetary Fund 2009) and disseminated through press releases, the interactive database, statistical datasets and regular publications (
National Bank of Romania 2024,
2025). Quarterly NBR values are aggregated to annual totals for complete calendar years. Second, the World Bank/KNOMAD Bilateral Remittance Matrix 2021 is used only as a corridor baseline, with related bilateral-flow context from the
Migration Policy Institute (
2021), not as an annual observed series (
KNOMAD and World Bank 2022). Third, the World Bank methodological note on the bilateral matrix explains that the estimates allocate inward remittances to source countries using migrant-stock and relative-income variables; this is why the matrix is treated here as model-based (
Ratha and Shaw 2007;
Ratha et al. 2022). Fourth, the ONS/HMRC PAYE Real Time Information dataset is used as an administrative-payroll proxy for Romanian payrolled employees in the United Kingdom; ONS/HMRC state that PAYE RTI statistics cover people paid through Pay As You Earn and that early monthly estimates are provisional and revised as additional submissions arrive (
Office for National Statistics and HM Revenue and Customs 2024). Fifth, UK CPI deflators are drawn from the ONS consumer price inflation tables, and Romania-level remittance receipts and payments used in the transfer-balance indicator come from the World Bank World Development Indicators series BX.TRF.PWKR.CD.DT and BM.TRF.PWKR.CD.DT (
Office for National Statistics 2026;
World Bank 2026a,
2026b).
To make the distinction between institutional data and author calculations explicit, the tables label observed NBR data, model-based World Bank/KNOMAD baseline values, employment-scaled scenarios, CPI-deflated real values, moving-average outputs and transfer-balance indicators separately. Currency conversion, CPI deflation, employment scaling and smoothing are therefore treated as reproducible transformations rather than as additional institutional observations.
The harmonisation procedure separates source data from author calculations. Nominal values are retained because this is the form in which remittance figures usually circulate in media and policy communication. Real values are author-calculated by deflating nominal GBP values with the UK Consumer Price Index from ONS consumer price inflation tables, using 2021 as the base year:
The distinction between nominal and real values is central. A nominal increase may coexist with a weaker real increase, with a flattening in purchasing power or with a decline in real terms. The analysis therefore avoids drawing welfare conclusions from nominal amounts alone.
3.3. Employment-Scaled Estimates and Uncertainty
For the World Bank/KNOMAD-based corridor series, the extrapolation is calculated from the 2021 bilateral baseline as follows:
where R_t is the estimated remittance volume in year t, R_2021 is the World Bank/KNOMAD 2021 UK-to-Romania baseline, E_t is the annual average number of Romanian payrolled employees in the UK in year t, and E_2021 is the corresponding 2021 employment level. The calculation is used only as an employment-scaled scenario. It does not claim that employment mechanically determines remittances.
The reason for including the employment scenario is methodological. It demonstrates how a model-based corridor baseline can be extended when direct annual corridor observations are unavailable, and it shows how proxy selection affects the apparent trend. The limitations are substantial. PAYE RTI counts employees paid through the PAYE system and is therefore not a measure of all Romanian migrants or all Romanian workers in the United Kingdom. It does not capture self-employment outside PAYE, and the most recent observations may be revised as additional RTI submissions are processed (
Office for National Statistics and HM Revenue and Customs 2024). Wages may change independently of headcount, and remittance behaviour also depends on household needs, exchange rates, transfer costs, length of stay and informal channels. These limitations are part of the argument about data infrastructures, not incidental weaknesses to be ignored.
3.4. Moving Averages and the Transfer-Balance Indicator
A three-year simple moving average is applied to both the NBR-based and World Bank/KNOMAD-based series in order to examine how smoothing changes interpretation. The one-step forward forecast is calculated as:
The moving average is used as a communicative smoothing device rather than as a high-confidence predictive model. It helps demonstrate how a volatile or divergent short series can be transformed into a more stable policy-facing narrative.
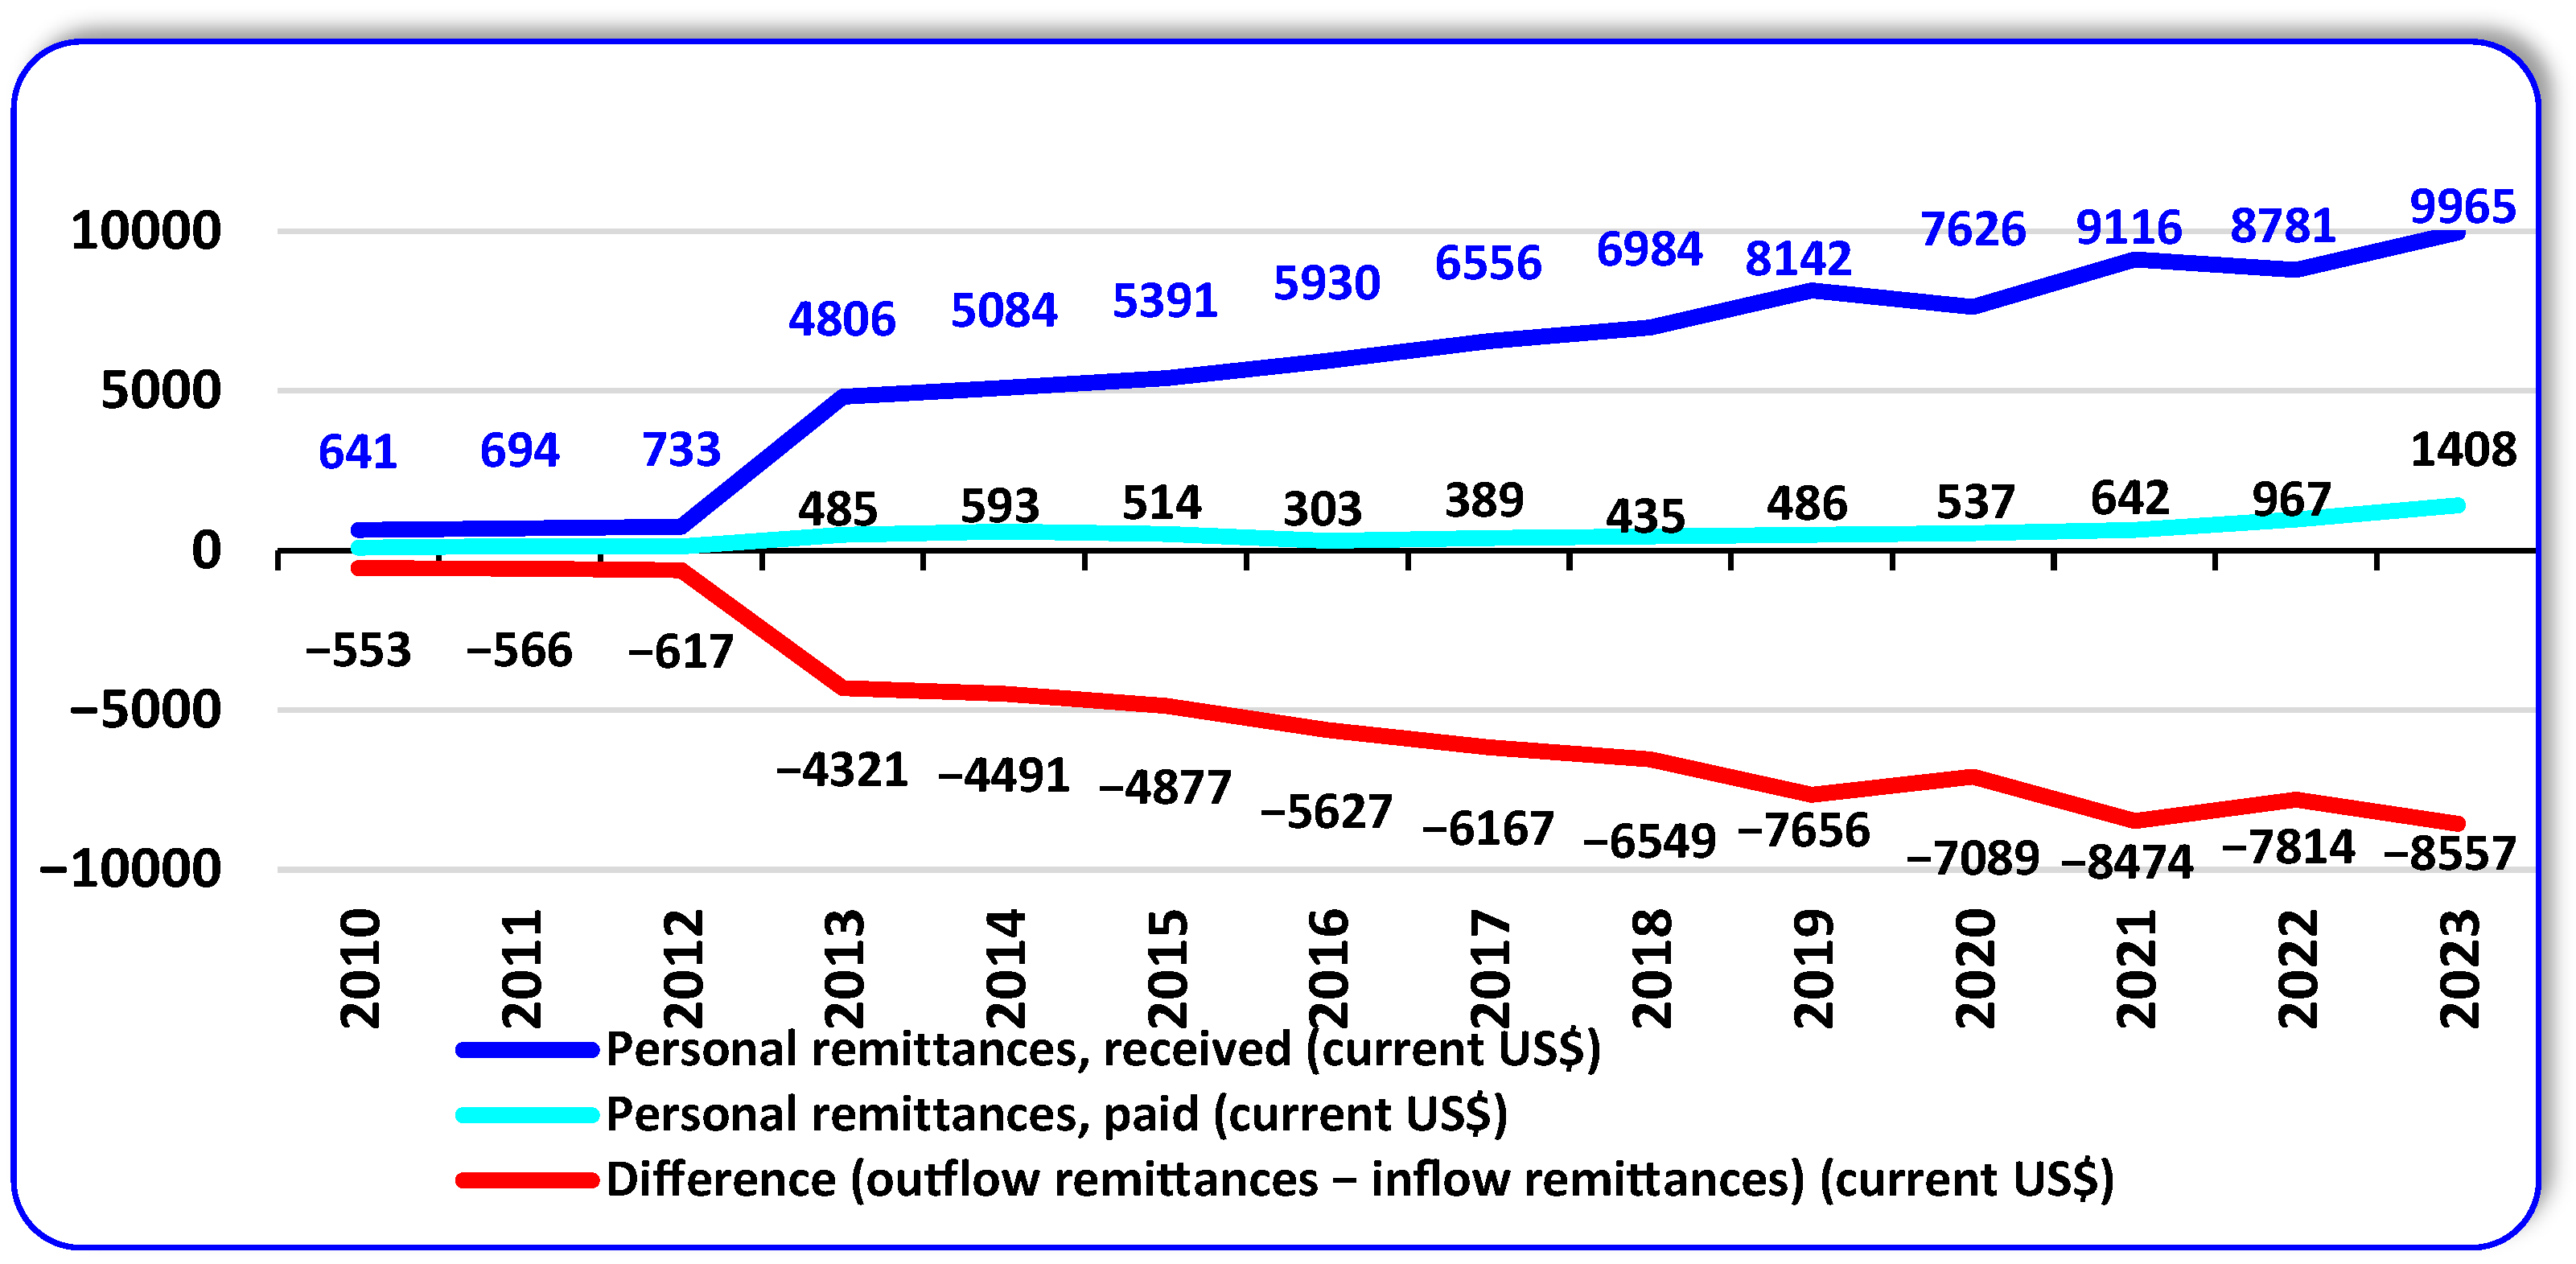
The transfer-balance indicator is author-calculated from World Bank World Development Indicators by subtracting personal remittances received by Romania (BX.TRF.PWKR.CD.DT) from personal remittances paid by Romania (BM.TRF.PWKR.CD.DT):
Because Romania receives more personal remittances than it pays out, the indicator is negative. A more negative value is interpreted only as a sign of stronger net reliance on inflows. The indicator is not a comprehensive measure of national economic attractiveness and is not treated as a central empirical finding. It is included to show how indices can become politically meaningful by compressing complex migration–economy relations into a single number.
3.5. Illustrative Political-Communication Material
To connect the measurement analysis to political communication, the article also uses a small purposive set of public texts and recognises that social media and digital-trace data can shape political narratives (
Jungherr 2015;
Tufekci 2017): a World Bank press release on global remittance trends and forecasts, a Romanian media report on record diaspora remittances in 2023, and a public commentary linking Romanian diaspora remittances to political representation and electoral behaviour. These examples are not used as a representative corpus or a content analysis. They are used to illustrate how remittance figures move from data infrastructures into public narratives.
4. Results: How Calculation and Presentation Shape Remittance Narratives
The results are organised around the article’s analytical chain. The section first compares nominal and real values, then shows how an employment-scaled scenario changes the apparent trend, how year-by-year and moving-average presentations alter interpretation, and how an illustrative transfer-balance indicator can become a politically meaningful but limited index. The emphasis is consistently on how calculation and presentation choices shape remittance narratives.
4.1. Transfer-Balance Indicator as a Limited Contextual Illustration
As shown in
Figure 1, the transfer-balance indicator provides contextual evidence of how remittance statistics can be converted into a national-performance signal. It is calculated as remittances paid minus remittances received. In Romania’s case, the series is negative because inflows exceed outflows. The indicator does not prove economic unattractiveness by itself, and it is not used as a primary result. It is included to show how an index can invite political interpretation when a complex relationship between migration and the economy is condensed into a single value.
Figure 1 frames the empirical analysis by showing how remittance balances can become index-like indicators. The following sections do not treat the index as a direct measure of Romania’s economic attractiveness. They unpack the more important question: how nominal reporting, real-price adjustment, proxy-based modelling and smoothing alter the claims that can be made from remittance data.
4.2. Nominal and Real Values in the Observed NBR Series
Table 1 reports the NBR observed series in nominal currency equivalents and in real GBP values at constant 2021 prices. Nominal values are useful for public communication because they correspond to headline amounts. Real values are necessary for welfare interpretation because they approximate purchasing-power meaning. The two measures are therefore interpreted together.
The interpretation is more cautious than one based on nominal values alone. In nominal euro terms, NBR receipts rise from EUR 1189.5 million in 2021 to EUR 1707.6 million in 2024. In nominal GBP terms, they rise from GBP 1022.5 million to GBP 1445.3 million. After adjustment to constant 2021 prices, however, the increase is from GBP 1022.5 million to GBP 1204.6 million. The direction remains positive, but the real increase is much smaller than the nominal increase. The welfare implication is therefore narrower: remittances remain a major community-welfare resource, but nominal growth should not be read as a proportional increase in household purchasing power.
4.3. World Bank/KNOMAD-Based Estimates and the Employment-Scaled Scenario
Table 2 presents an employment-scaled scenario rather than direct annual observations. The scenario starts from the World Bank/KNOMAD 2021 bilateral baseline and extends it with an ONS PAYE/HMRC RTI employment ratio. This construction is useful precisely because it makes the assumptions of model-based extension visible: a corridor baseline, a labour-market proxy, exchange-rate conversion and inflation adjustment.
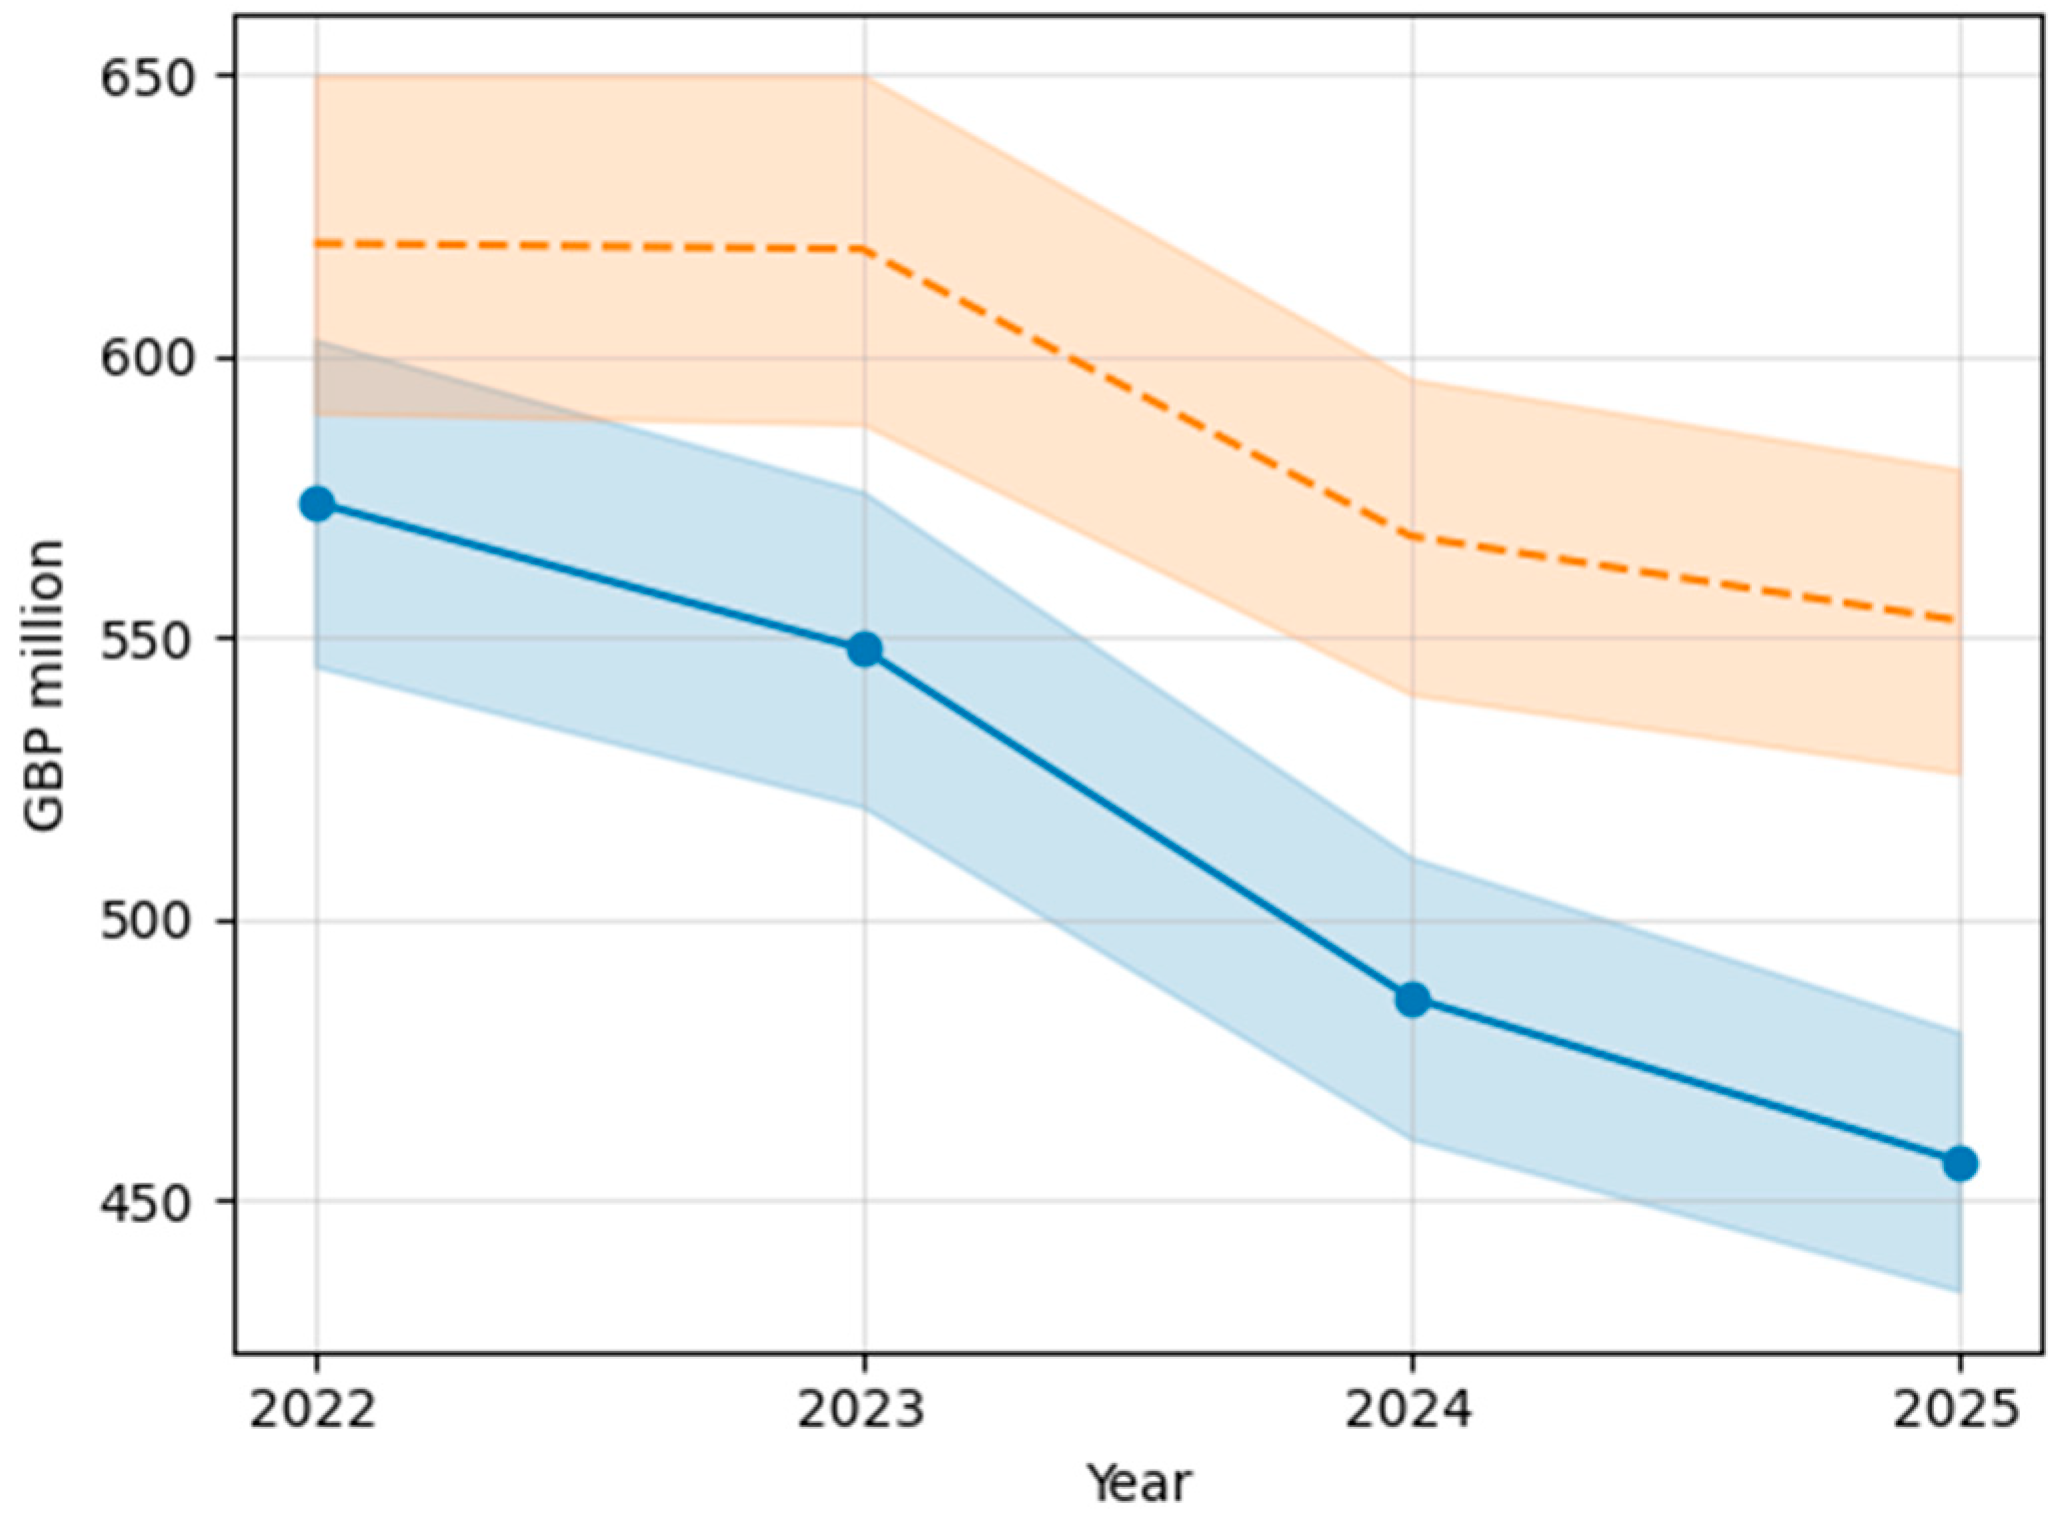
The table is best read as a modelling experiment rather than a replacement for observed flows. It asks what happens to the remittance narrative if the latest available World Bank/KNOMAD bilateral baseline is extended by assuming that corridor remittance capacity co-varies with the number of Romanian payrolled employees in the UK. The real series declines from GBP 574 million in 2022 to GBP 457 million in 2025. This contrasts with the NBR observed series, where real values increase between 2021 and 2024. The contrast is analytically useful because it demonstrates how adding employment and inflation considerations can transform the apparent direction of a trend.
Figure 2 visualises this contrast by distinguishing the nominal scenario from the real-price scenario and by showing the uncertainty bands around both series.
The interpretation should therefore not be that employment alone explains remittances. The stronger point is methodological: modelled data infrastructures rely on baselines, proxies and extrapolations, and those assumptions can become invisible when a headline number circulates. The employment-scaled scenario is included to make this process explicit, not to offer a definitive causal estimate.
4.4. Year-by-Year Change: Why Nominal Growth and Real Welfare Effects Diverge
Year-by-year interpretation is politically attractive because it permits simple stories of growth or decline. The comparison shows that those stories depend on the chosen price basis and denominator. In the NBR series, nominal remittances rise throughout 2021–2024; real values also rise, but more moderately. In the employment-scaled scenario, real values decline after 2022 because the scenario combines employment dynamics with inflation adjustment. A public actor using nominal NBR values could narrate an expanding diaspora contribution; one using real employment-scaled values could narrate weakening purchasing-power support. Both narratives are conditional on the assumptions behind the numbers. This result supports the article’s core claim. Remittance data become politically meaningful through the calculation conventions that precede publication and through the presentation conventions that accompany them. Nominal values produce communicative scale; real values produce welfare interpretation; year-by-year rates produce stories of acceleration or decline. The empirical task is not to choose a single winning number but to disclose what each number is designed to show and what it cannot show.
4.5. Moving Averages and the Politics of Smoothing
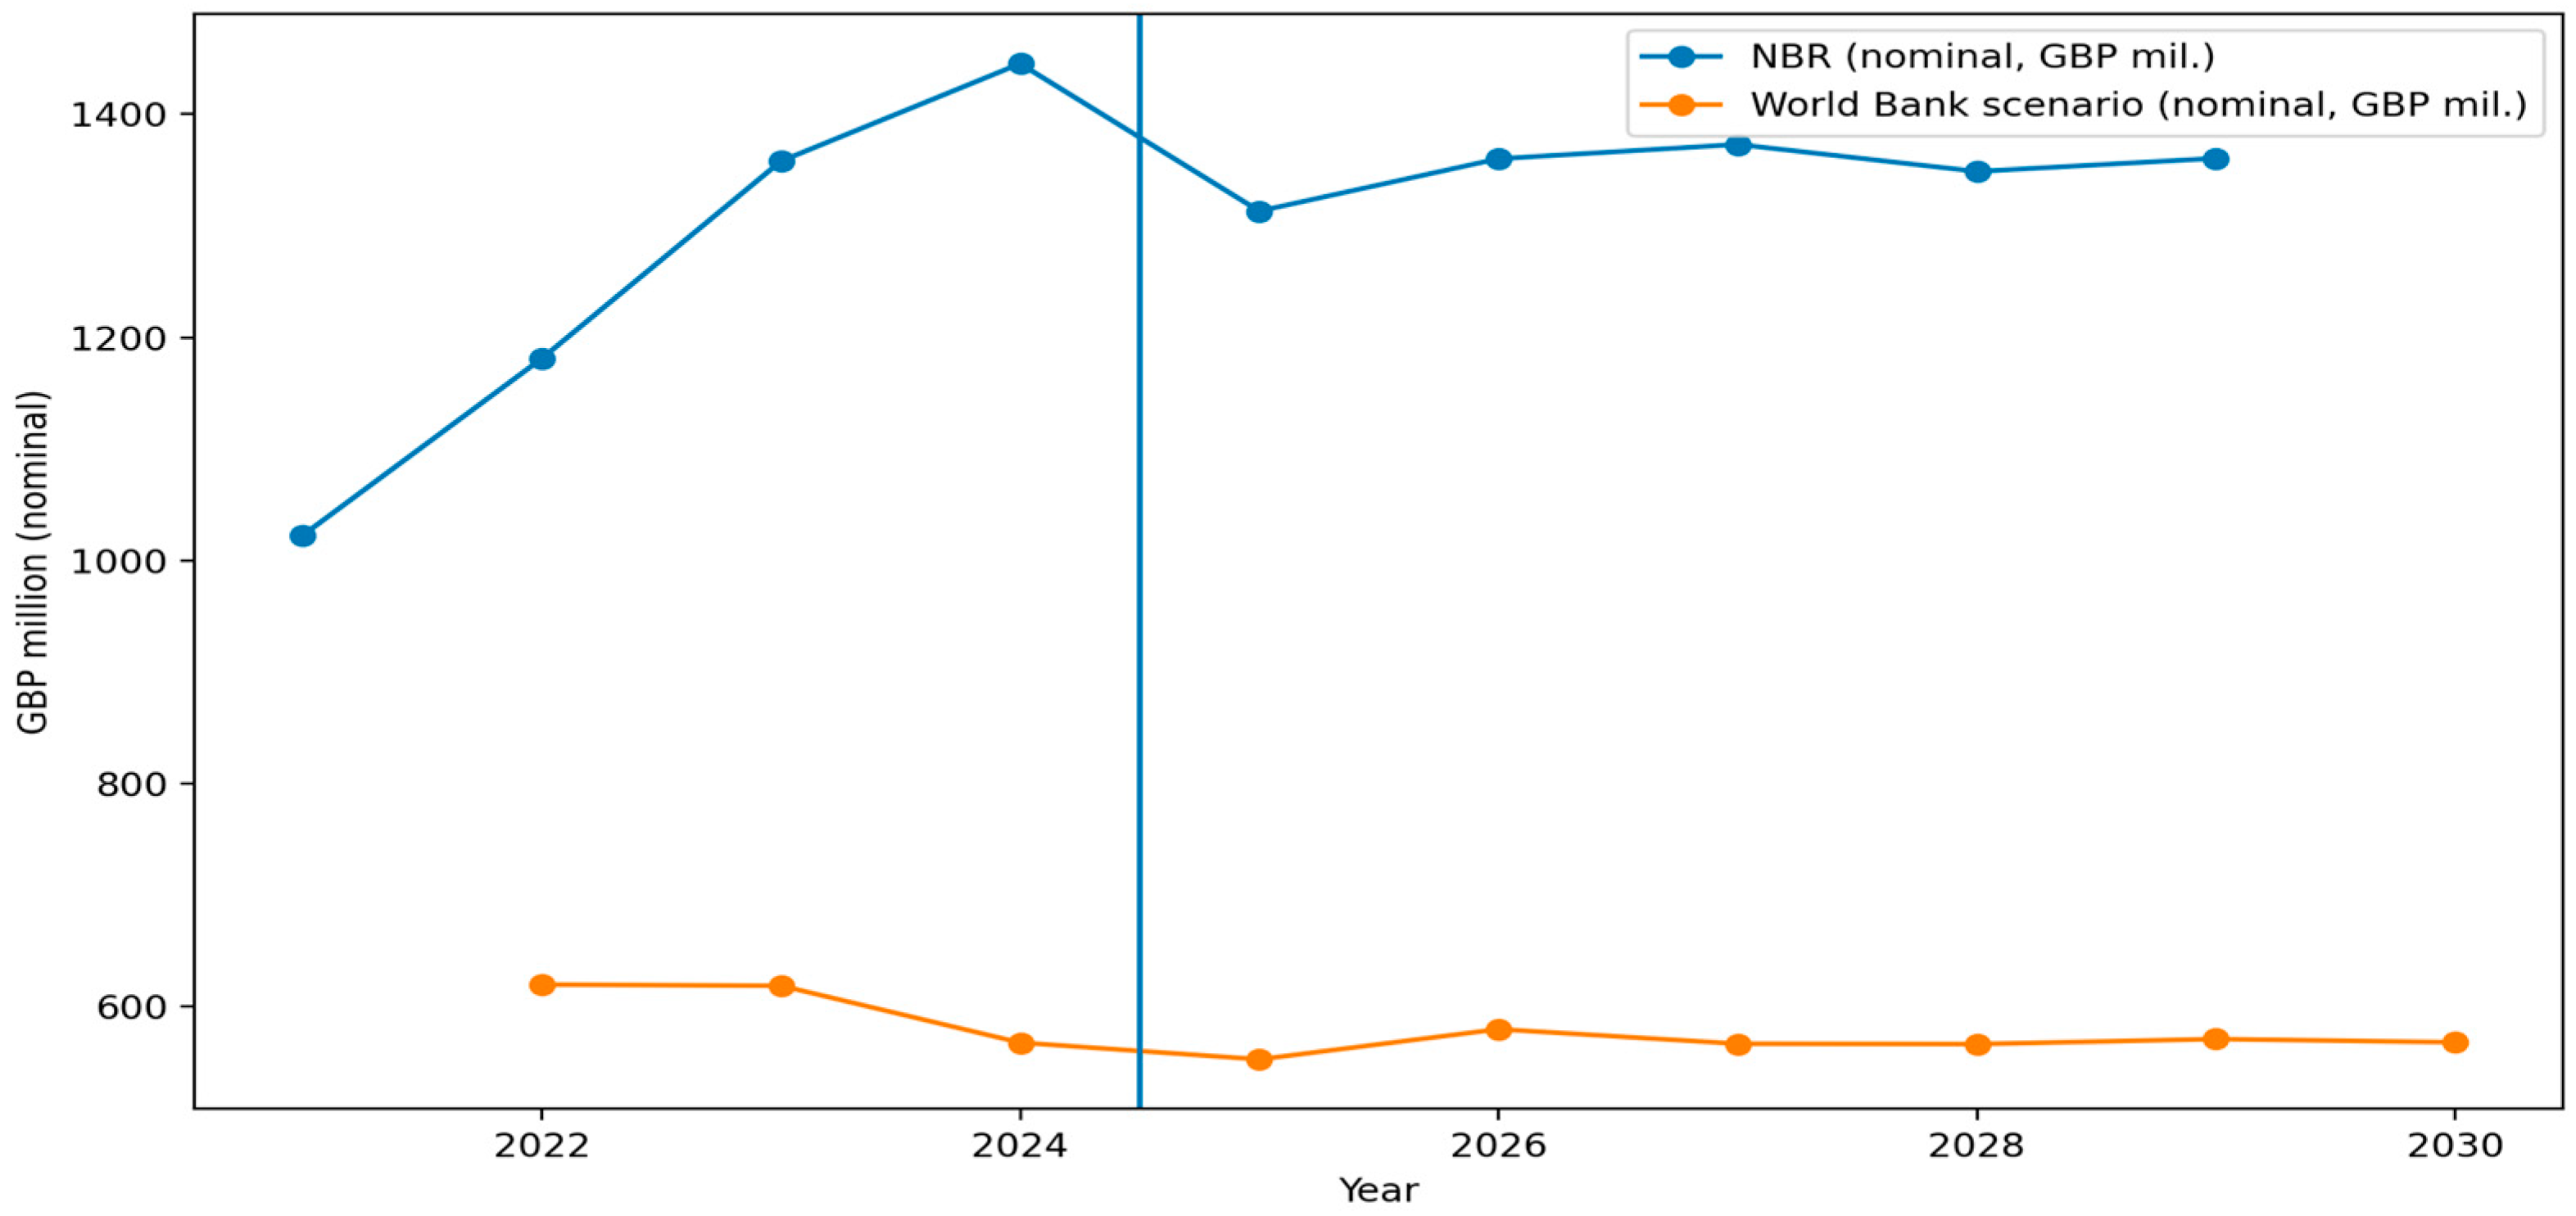
The three-year simple moving average is retained as a communicative smoothing device rather than as a robust long-term forecast. Smoothing can be useful because short annual series are volatile and policy audiences often prefer stable trajectories. At the same time, smoothing can conceal turning points and uncertainty.
Table 3 and
Figure 3 therefore report the historical series and recursive SMA values as a transparency exercise.
The moving-average results produce a flatter and more stable narrative than the annual values. This is analytically useful but politically consequential. A smoothed series can make remittances appear structurally stable even when the underlying sources disagree about recent direction. Moving averages are therefore readable but not neutral: they can improve interpretability while reducing the visibility of uncertainty and divergence between data infrastructures.
4.6. Employment, Remittances and the Limits of Proxy Modelling
The relationship between employment and remittances is treated as a limited modelling assumption rather than as a direct causal claim. The employment-scaled calculation assumes only that, if the number of payrolled Romanian employees changes, the modelled remittance capacity of the corridor may change proportionally. This is plausible enough for a sensitivity scenario but too narrow for a definitive estimate.
The limitations are substantial. PAYE RTI excludes the self-employed; multiple-job holding may complicate interpretation; wages may change independently of headcount; and remittance behaviour may be shaped by family needs, return plans, exchange rates, transfer costs and informal channels. These limitations explain why the calculation is presented as a scenario. Its inclusion is justified because it illustrates how modelled data infrastructures fill gaps by combining a baseline with assumptions about migrant stocks, employment or income proxies.
4.7. Data Source Differences, Migration Typologies and Interpretive Caution
The distinction between migration driven by economic necessity and migration associated with status must be treated as a theoretical lens rather than as an empirical classification directly observable in the remittance datasets. Migration theory has long emphasised that migration decisions are shaped by household strategies, labour-market structures, income expectations, risk diversification and social networks (
Stark and Bloom 1985;
Massey et al. 1993;
de Haas et al. 2020). Veblen’s concept of pecuniary emulation is relevant to status-oriented consumption and status display, but it should not be used to classify remittance flows without additional evidence (
Veblen 1899).
Accordingly, the study does not claim that NBR data necessarily include status migration while World Bank/KNOMAD data necessarily capture only migration of necessity. A more cautious formulation is that observed banking data may include transfers that differ from the labour-remittance pattern assumed by model-based estimates, including high-value transfers, capital movements or transfers by self-employed and higher-income migrants. Conversely, model-based matrices may smooth or understate atypical flows because their assumptions are designed for comparability rather than corridor-specific complexity. This interpretation is consistent with the broader argument about data infrastructures: each source makes certain practices visible while pushing others to the margins.
4.8. Synthesis: Calculation Choices as Political Agenda-Setting Devices
Table 4 summarises the organisation of the results. The analytical emphasis is on calculation and presentation choices rather than on a rigid NBR-versus-World Bank opposition.
The comprehensive implication is that the political meaning of remittances is not contained in the raw data alone. It is produced by a chain of decisions: source selection, currency conversion, inflation adjustment, proxy choice, smoothing, index construction and public framing. The same corridor can be narrated as growing, declining, stabilising or becoming more dependent on diaspora transfers depending on which part of the chain is foregrounded. This is the article’s central contribution to the study of remittances as data infrastructure in political communication.
4.9. Empirical Illustrations: From Remittance Figures to Public Narratives
The public communication examples show how the statistical operations analysed above can become narratives. The World Bank press release on remittances slowing in 2023 and growing faster in 2024 illustrates how model-based estimates and forecasts are converted into a forward-looking global development storyline (
World Bank 2024). The communicative focus is not only the numerical estimate, but the trend claim and the risk environment attached to it.
Romanian media coverage of 2023 remittances provides a corridor-specific illustration. A news report framed Romanians abroad as sending record amounts home, compared the total with GDP and foreign direct investment, and linked remittances to the current account deficit and currency stability (
Romania Journal 2024). This example shows how nominal figures can acquire macroeconomic and national-performance meaning when they are placed next to FDI or GDP.
Diaspora-facing political commentary adds a third layer. Public debate around Romanian migrant workers in 2025 connected remittances to recognition, representation and electoral behaviour, illustrating how economic contribution can be translated into claims about political belonging and state responsibility (
Besliu 2025). These examples are limited, but they demonstrate that remittance metrics circulate as more than technical data: they become compact narratives about who sustains families, who contributes to the national economy and who deserves political attention.
5. Conclusions
This article has examined remittances as data infrastructures in political communication rather than as financial transfers alone. The empirical contribution is not a simple opposition between NBR and World Bank/KNOMAD data. The more important issue is how remittance data are calculated, adjusted, smoothed, indexed and presented before they become politically meaningful.
The results show that nominal values are powerful communicative objects but can exaggerate welfare implications if used alone. Real values at constant 2021 prices provide a more appropriate basis for discussing purchasing power and household welfare. In the NBR observed series, remittances increase in real terms between 2021 and 2024, but the increase is considerably smaller than the nominal series suggests. In the World Bank/KNOMAD-based employment-scaled scenario, real values decline after 2022, demonstrating how proxy-based modelling and inflation adjustment can produce a different reading of the same corridor.
The concept of emerging social policies has been operationalised as bottom-up, transnational and community-mediated welfare practice. Remittances are empirically relevant to this concept because they show how migrant households and diaspora communities can support family welfare outside formal state provision. At the same time, the article treats this process critically: private transfers may alleviate vulnerability, but they can also shift responsibility from public institutions to migrants and families.
The transfer-balance indicator has been used only as an illustrative index of net reliance on remittance inflows. It is not a comprehensive measure of Romania’s economic attractiveness. Its value lies in showing how a single-number indicator can travel easily into political communication and convert complex migration–economy relationships into a simplified evaluative signal.
The public communication examples confirm that remittance figures can be mobilised as development narratives, macroeconomic narratives and diaspora-recognition narratives. A forecasted global trend, a headline about record Romanian remittances or an electoral commentary about diaspora contribution can each draw on remittance statistics while suppressing some of the uncertainty and calculation choices behind them.
The main recommendation is methodological transparency. Research and public communication on remittances should distinguish observed and modelled series; report both nominal and real values; state whether figures are annual, smoothed or forecasted; disclose proxy variables such as employment; and avoid presenting single-number indices as comprehensive measures of national performance (
Stiglitz and Rothschild 1970). Such transparency would reduce the risk that remittance statistics become politically powerful while their assumptions remain invisible.
Future research should extend the time series, incorporate self-employment and informal transfer channels where data become available, including the channels noted in UK remittance research (
Migration Observatory 2018), and compare the UK–Romania corridor with other European corridors. A systematic media analysis and qualitative research with migrant households would also be necessary to connect aggregate data with the lived mechanisms through which remittances support family welfare, social reproduction and diaspora belonging.
Author Contributions
Conceptualization, C.B.; methodology, C.B. and N.G.; software, C.B.; validation, C.B. and N.G.; formal analysis, C.B.; investigation, C.B.; resources, C.B. and N.G.; data curation, C.B.; writing—original draft preparation, C.B.; writing—review and editing, C.B. and N.G.; visualisation, C.B.; supervision, N.G. All authors have read and agreed to the published version of the manuscript.
Funding
This research received no external funding.
Institutional Review Board Statement
Not applicable. The study uses aggregated public secondary data and does not involve human participants or animals.
Informed Consent Statement
Not applicable for studies not involving humans.
Data Availability Statement
All primary source datasets used in this article are publicly available from the National Bank of Romania balance-of-payments statistics, the World Bank/KNOMAD Bilateral Remittance Matrix 2021, ONS/HMRC PAYE Real Time Information, ONS consumer price inflation tables, and World Bank World Development Indicators.
Acknowledgments
The authors have reviewed and edited the manuscript and take full responsibility for the content of this publication.
Conflicts of Interest
The authors declare no conflicts of interest.
References
- Angelakis, Antonios. 2025. The Political Economy of Green Transition: The Need for a Two-Pronged Approach to Address Climate Change and the Necessity of Science Citizens. Economies 13: 23. [Google Scholar] [CrossRef]
- Beer, David. 2016. Metric Power. London: Palgrave Macmillan. [Google Scholar]
- Bennett, W. Lance, and Alexandra Segerberg. 2013. The Logic of Connective Action: Digital Media and the Personalization of Contentious Politics. Cambridge, MA: Cambridge University Press. [Google Scholar]
- Besliu, Raluca. 2025. The EU Gave Romania’s Migrant Workers the Chance to Build a New Life. Why Are They Turning Against It? The Guardian, July 2. Available online: https://www.theguardian.com/commentisfree/2025/jul/02/eu-romania-migrant-workers-jobs-eurosceptic (accessed on 7 May 2026).
- Biswas, Sattwick Dey, Cleopas Gabriel Sambo, and Sony Pellissery, eds. 2024. The Politics of Welfare in the Global South. Oxford: Oxford University Press. [Google Scholar]
- Chadwick, Andrew. 2013. The Hybrid Media System: Politics and Power. Oxford: Oxford University Press. [Google Scholar]
- Cheney-Lippold, John. 2017. We Are Data: Algorithms and the Making of Our Digital Selves. New York: NYU Press. [Google Scholar]
- Couldry, Nick, and Ulises A. Mejias. 2019a. Data Colonialism: Rethinking Big Data’s Relation to the Contemporary Subject. Television & New Media 20: 336–49. [Google Scholar] [CrossRef]
- Couldry, Nick, and Ulises A. Mejias. 2019b. The Costs of Connection: How Data Is Colonizing Human Life and Appropriating It for Capitalism. Stanford: Stanford University Press. [Google Scholar]
- de Haas, Hein, Stephen Castles, and Mark J. Miller. 2020. The Age of Migration: International Population Movements in the Modern World, 6th ed. London: Red Globe Press. [Google Scholar]
- Espeland, Wendy Nelson, and Mitchell L. Stevens. 2008. A Sociology of Quantification. European Journal of Sociology 49: 401–36. [Google Scholar] [CrossRef]
- Fourcade, Marion. 2016. Ordinalization: Lewis A. Coser Memorial Award for Theoretical Agenda Setting 2014. Sociological Theory 34: 175–95. [Google Scholar] [CrossRef]
- Hölscher, Katharina, Julia M. Wittmayer, V. Igno Notermans, Madeleine Cléa Montanari, Antonella Passani, and Annelli Janssen. 2025. Mainstreaming Citizen Science in Policy: Adaptations Needed in Policy and How to Achieve Them in Five European Countries. Environmental Science and Policy 171: 104148. [Google Scholar] [CrossRef]
- International Labour Organization. 2024. World Employment and Social Outlook: Trends 2024. Geneva: International Labour Office. Available online: https://www.ilo.org/publications/world-employment-and-social-outlook-trends-2024 (accessed on 7 May 2026).
- International Monetary Fund. 2009. Balance of Payments and International Investment Position Manual, Sixth Edition (BPM6). Washington, DC: International Monetary Fund. Available online: https://www.imf.org/external/pubs/ft/bop/2007/bopman6.htm (accessed on 15 May 2026).
- International Organization for Migration. 2024. World Migration Report 2024. Geneva: International Organization for Migration. Available online: https://worldmigrationreport.iom.int/ (accessed on 7 May 2026).
- Jungherr, Andreas. 2015. Analyzing Political Communication with Digital Trace Data: The Role of Twitter, Facebook, and Other Social Media. Cambridge, MA: Cambridge University Press. [Google Scholar]
- Kaasch, Alexandra. 2015. Shaping Global Health Policy. Basingstoke: Palgrave Macmillan. [Google Scholar]
- Kaasch, Alexandra. 2019. Exploring Theoretical Approaches to Global Social Policy Research. Global Social Policy 19: 87–104. [Google Scholar] [CrossRef]
- Kitchin, Rob. 2014. The Data Revolution: Big Data, Open Data, Data Infrastructures and Their Consequences. London: SAGE. [Google Scholar]
- KNOMAD and World Bank. 2022. Bilateral Remittance Matrix 2021. Washington, DC: World Bank/KNOMAD. Available online: https://www.knomad.org/sites/default/files/2022-12/bilateral_remittance_matrix_2021_0.xlsx (accessed on 15 May 2026).
- Massey, Douglas S., Joaquin Arango, Graeme Hugo, Ali Kouaouci, Adela Pellegrino, and J. Edward Taylor. 1993. Theories of International Migration: A Review and Appraisal. Population and Development Review 19: 431–66. [Google Scholar] [CrossRef]
- Mauss, Marcel. 2002. The Gift: Forms and Functions of Exchange in Archaic Societies. Available online: https://classiques.uqam.ca/classiques/mauss_marcel/socio_et_anthropo/2_essai_sur_le_don/essai_sur_le_don.pdf (accessed on 22 December 2025).
- Mayer-Schönberger, Viktor, and Kenneth Cukier. 2013. Big Data: A Revolution That Will Transform How We Live, Work, and Think. Boston: Houghton Mifflin Harcourt. [Google Scholar]
- Migration Observatory. 2018. Migrant Remittances to and from the UK. Oxford: COMPAS, University of Oxford. Available online: https://migrationobservatory.ox.ac.uk/resources/briefings/migrant-remittances-to-and-from-the-uk/ (accessed on 15 May 2026).
- Migration Policy Institute. 2021. Bilateral Remittance Flows. Washington, DC: Migration Policy Institute. Available online: https://www.migrationpolicy.org/programs/data-hub/charts/bilateral-remittance-flows (accessed on 23 December 2025).
- Milanovic, Branko. 2016. Global Inequality: A New Approach for the Age of Globalization. Cambridge, MA: Harvard University Press. [Google Scholar]
- Mückenberger, Ulrich, Heiner Fechner, and Irene Dingeldey. 2025. Constructing Worlds of Labour. Global Social Policy 25: 1–24. [Google Scholar]
- National Bank of Romania. 2024. Balance of Payment Statistics: Metadata. Bucharest: National Bank of Romania. Available online: https://www.bnr.ro/uploads/editor/1155124250.pdf (accessed on 15 May 2026).
- National Bank of Romania. 2025. Monthly Bulletin No. 1/2025. Bucharest: National Bank of Romania. Available online: https://www.bnr.ro/uploads/2025-03-07monthlybulletinno.012025_documentpdf_545_1743160358.pdf (accessed on 15 May 2026).
- OECD. 2019. Talent Abroad: A Review of Romanian Emigrants. Paris: OECD Publishing. [Google Scholar] [CrossRef]
- OECD. 2025. OECD Reviews of Labour Market and Social Policies: Romania 2025. Paris: OECD Publishing. [Google Scholar] [CrossRef]
- Office for National Statistics. 2026. Consumer Price Inflation Tables; Newport: Office for National Statistics. Available online: https://www.ons.gov.uk/economy/inflationandpriceindices/datasets/consumerpriceinflation (accessed on 15 May 2026).
- Office for National Statistics and HM Revenue and Customs. 2024. Earnings and Employment from Pay as You Earn Real Time Information, UK: December 2024; Newport: Office for National Statistics. Available online: https://www.ons.gov.uk/employmentandlabourmarket/peopleinwork/earningsandworkinghours/bulletins/earningsandemploymentfrompayasyouearnrealtimeinformationuk/december2024 (accessed on 15 May 2026).
- Ratha, Dilip, and William Shaw. 2007. South-South Migration and Remittances. Washington, DC: World Bank and Migration Policy Institute. Available online: https://openknowledge.worldbank.org/handle/10986/6733 (accessed on 23 December 2025).
- Ratha, Dilip, Sonia Plaza, and Eung Ju Kim. 2022. Bilateral Remittance Matrix (New). People Move Blog. World Bank Blogs, December 19. Available online: https://blogs.worldbank.org/en/peoplemove/bilateral-remittance-matrix-new (accessed on 15 May 2026).
- Romania Journal. 2024. Romanians Abroad Sent Record Amounts Home in 2023. Romania Journal, July 16. Available online: https://www.romaniajournal.ro/business/financial/romanians-abroad-sent-record-amounts-home-in-2023/ (accessed on 7 May 2026).
- Rouvroy, Antoinette, and Thomas Berns. 2013. Algorithmic Governmentality and Prospects of Emancipation. Réseaux 177: 163–96. [Google Scholar] [CrossRef]
- Stark, Oded, and David E. Bloom. 1985. The New Economics of Labor Migration. American Economic Review 75: 173–78. [Google Scholar]
- Stiglitz, Joseph E., and Michael Rothschild. 1970. Increasing Risk: I. A Definition. Journal of Economic Theory 2: 225–43. [Google Scholar] [CrossRef]
- Taylor, Linnet, and Dennis Broeders. 2015. In the Name of Development: Power, Profit and the Datafication of the Global South. Geoforum 64: 229–37. [Google Scholar] [CrossRef]
- Tufekci, Zeynep. 2017. Twitter and Tear Gas: The Power and Fragility of Networked Protest. New Haven: Yale University Press. [Google Scholar]
- UNDP. 2024. Human Development Report 2023/2024: Breaking the Gridlock: Reimagining Cooperation in a Polarized World. New York: United Nations Development Programme. Available online: https://hdr.undp.org/content/human-development-report-2023-24 (accessed on 7 May 2026).
- Veblen, Thorstein. 1899. The Theory of the Leisure Class: An Economic Study of Institutions. New York: Macmillan. [Google Scholar]
- World Bank. 2018. Romania Systematic Country Diagnostic Background Note: Migration. Washington, DC: World Bank. Available online: https://documents.worldbank.org/ (accessed on 7 May 2026).
- World Bank. 2024. Remittances Slowed in 2023, Expected to Grow Faster in 2024. Press Release, 26 June 2024. Washington, DC: World Bank. Available online: https://www.worldbank.org/en/news/press-release/2024/06/26/remittances-slowed-in-2023-expected-to-grow-faster-in-2024 (accessed on 7 May 2026).
- World Bank. 2026a. Personal Remittances, Paid (Current US$)—Romania. World Development Indicators. Washington, DC: World Bank. Available online: https://data.worldbank.org/indicator/BM.TRF.PWKR.CD.DT?locations=RO (accessed on 15 May 2026).
- World Bank. 2026b. Personal Remittances, Received (Current US$)—Romania. World Development Indicators. Washington, DC: World Bank. Available online: https://data.worldbank.org/indicator/BX.TRF.PWKR.CD.DT?locations=RO (accessed on 15 May 2026).
- Yi, Ilcheong, Alexandra Kaasch, and Kelly Stetter. 2024. Emerging Trends in Social Policy from the South: Challenges and Innovations in Emerging Economies. Bristol: Policy Press. [Google Scholar]
| Disclaimer/Publisher’s Note: The statements, opinions and data contained in all publications are solely those of the individual author(s) and contributor(s) and not of MDPI and/or the editor(s). MDPI and/or the editor(s) disclaim responsibility for any injury to people or property resulting from any ideas, methods, instructions or products referred to in the content. |