Digital Construction Technology and Job-Site Equipment Demonstration: Modelling Relationship Strategies for Technology Adoption


Abstract
1. Introduction
2. Terms, Concepts and Theories of Technology Adoption
2.1. Digital Construction Technology
2.2. Technology Adoption and Dissemination
2.3. Technology Exhibition
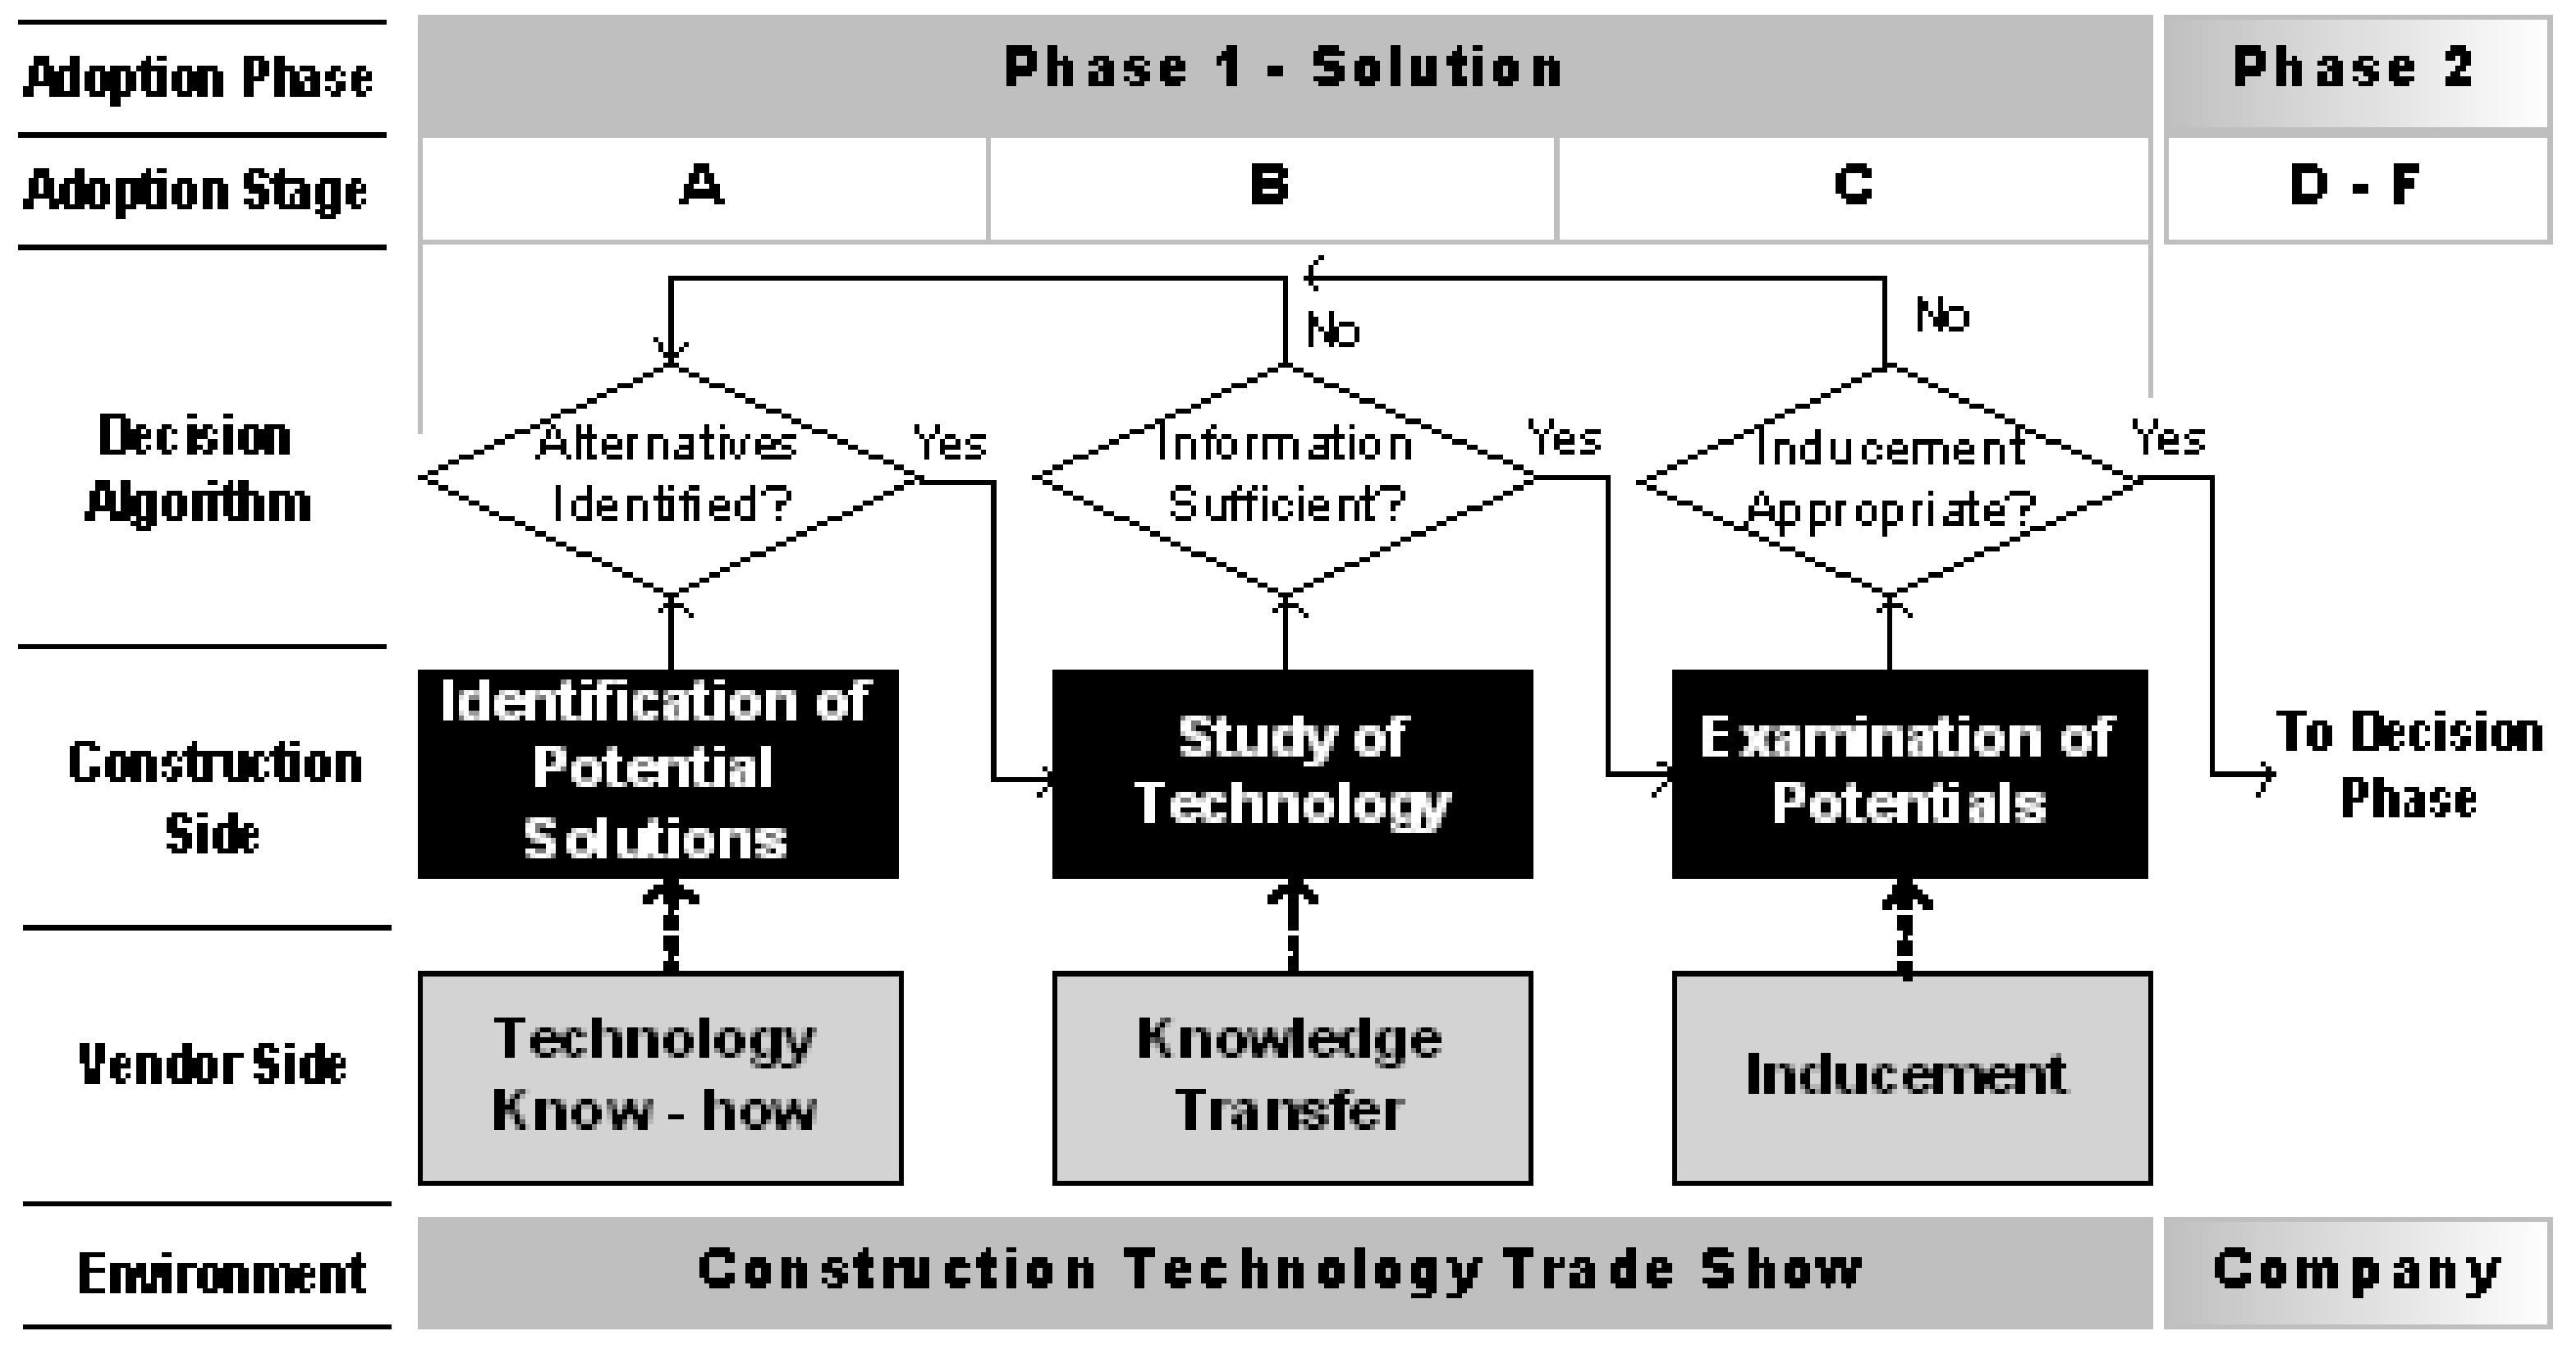
3. Theoretical Framework and Gap in the Literature
4. Proposed Variables and Hypotheses Development
4.1. Technology Attributes and Relevant Information
4.2. Vendors Interactions, Communication and Networking Facility
5. Research Methodology
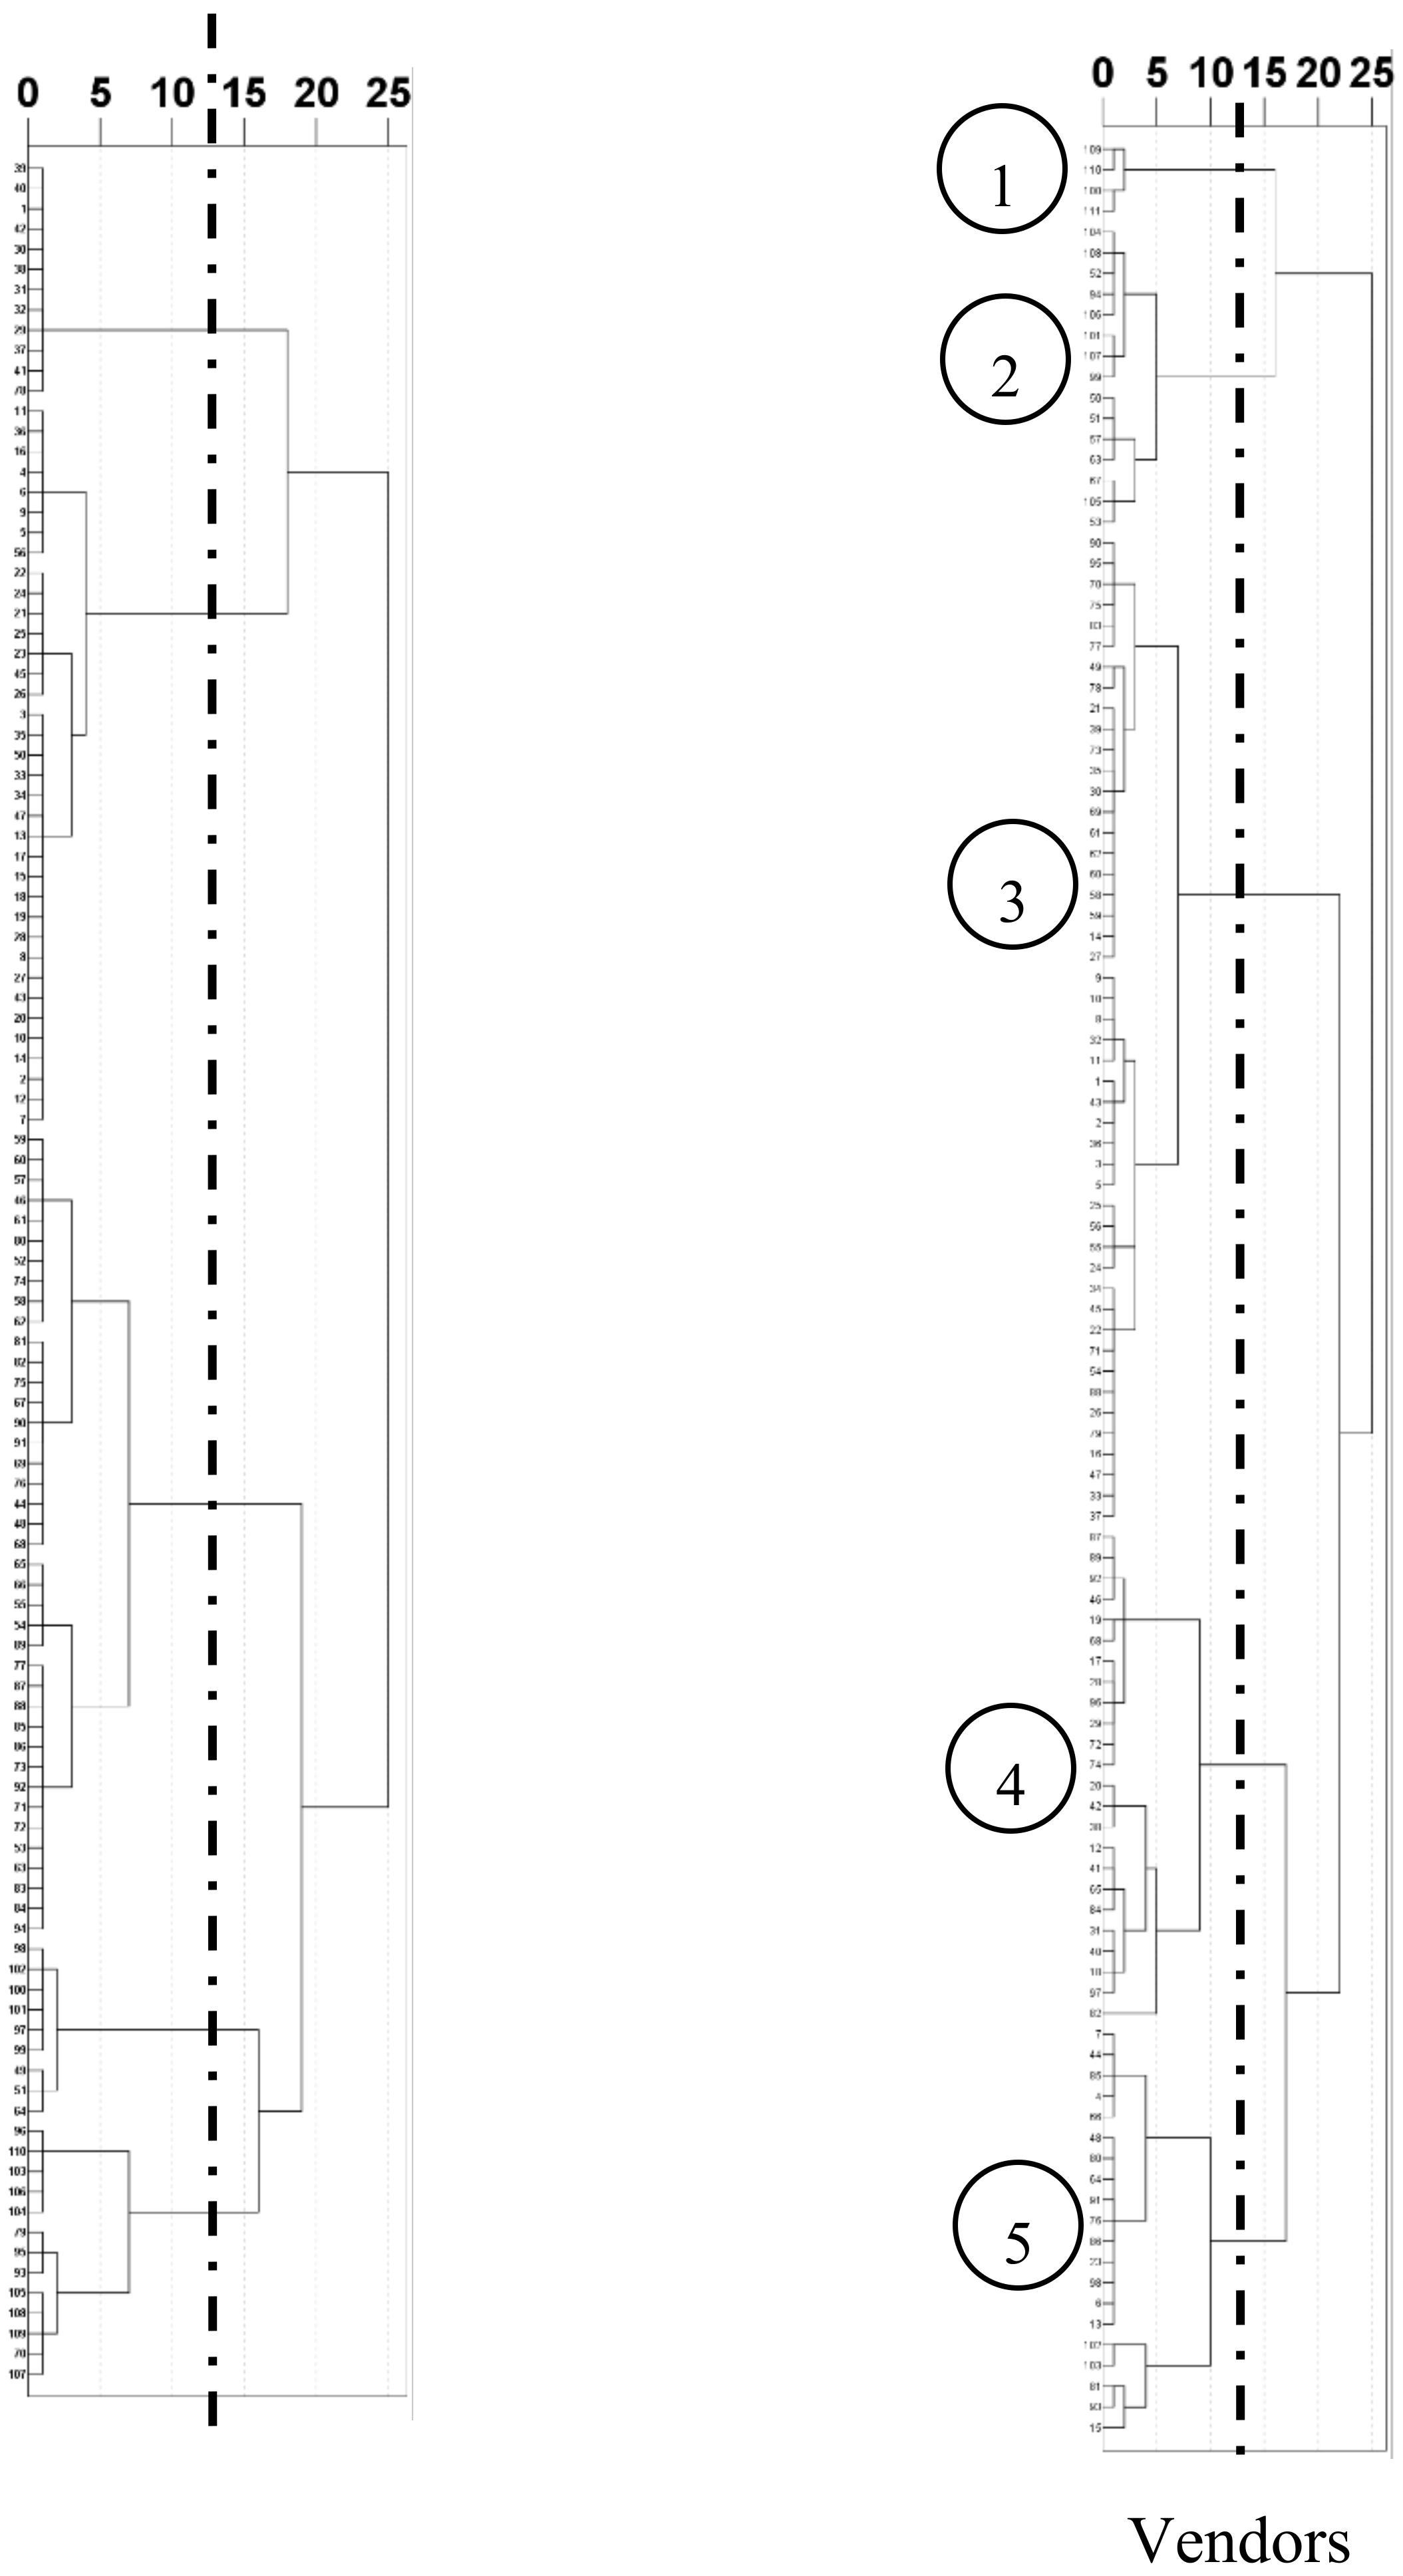
6. Data Analysis and Results
“Customers check all the technical data. [...]They check technology, cost of machine per year. Very often they ask the sub-supplier [local dealers] can you do a spare and wear parts proposal for one year when the pump is working 8000 h per year. They analyse the technical, commercial, delivery time, then they come to a decision. It’s not the cheapest that gets the order, the most reliable gets the order. Technology and delivery time: this is important.”(26.20 #cn1)
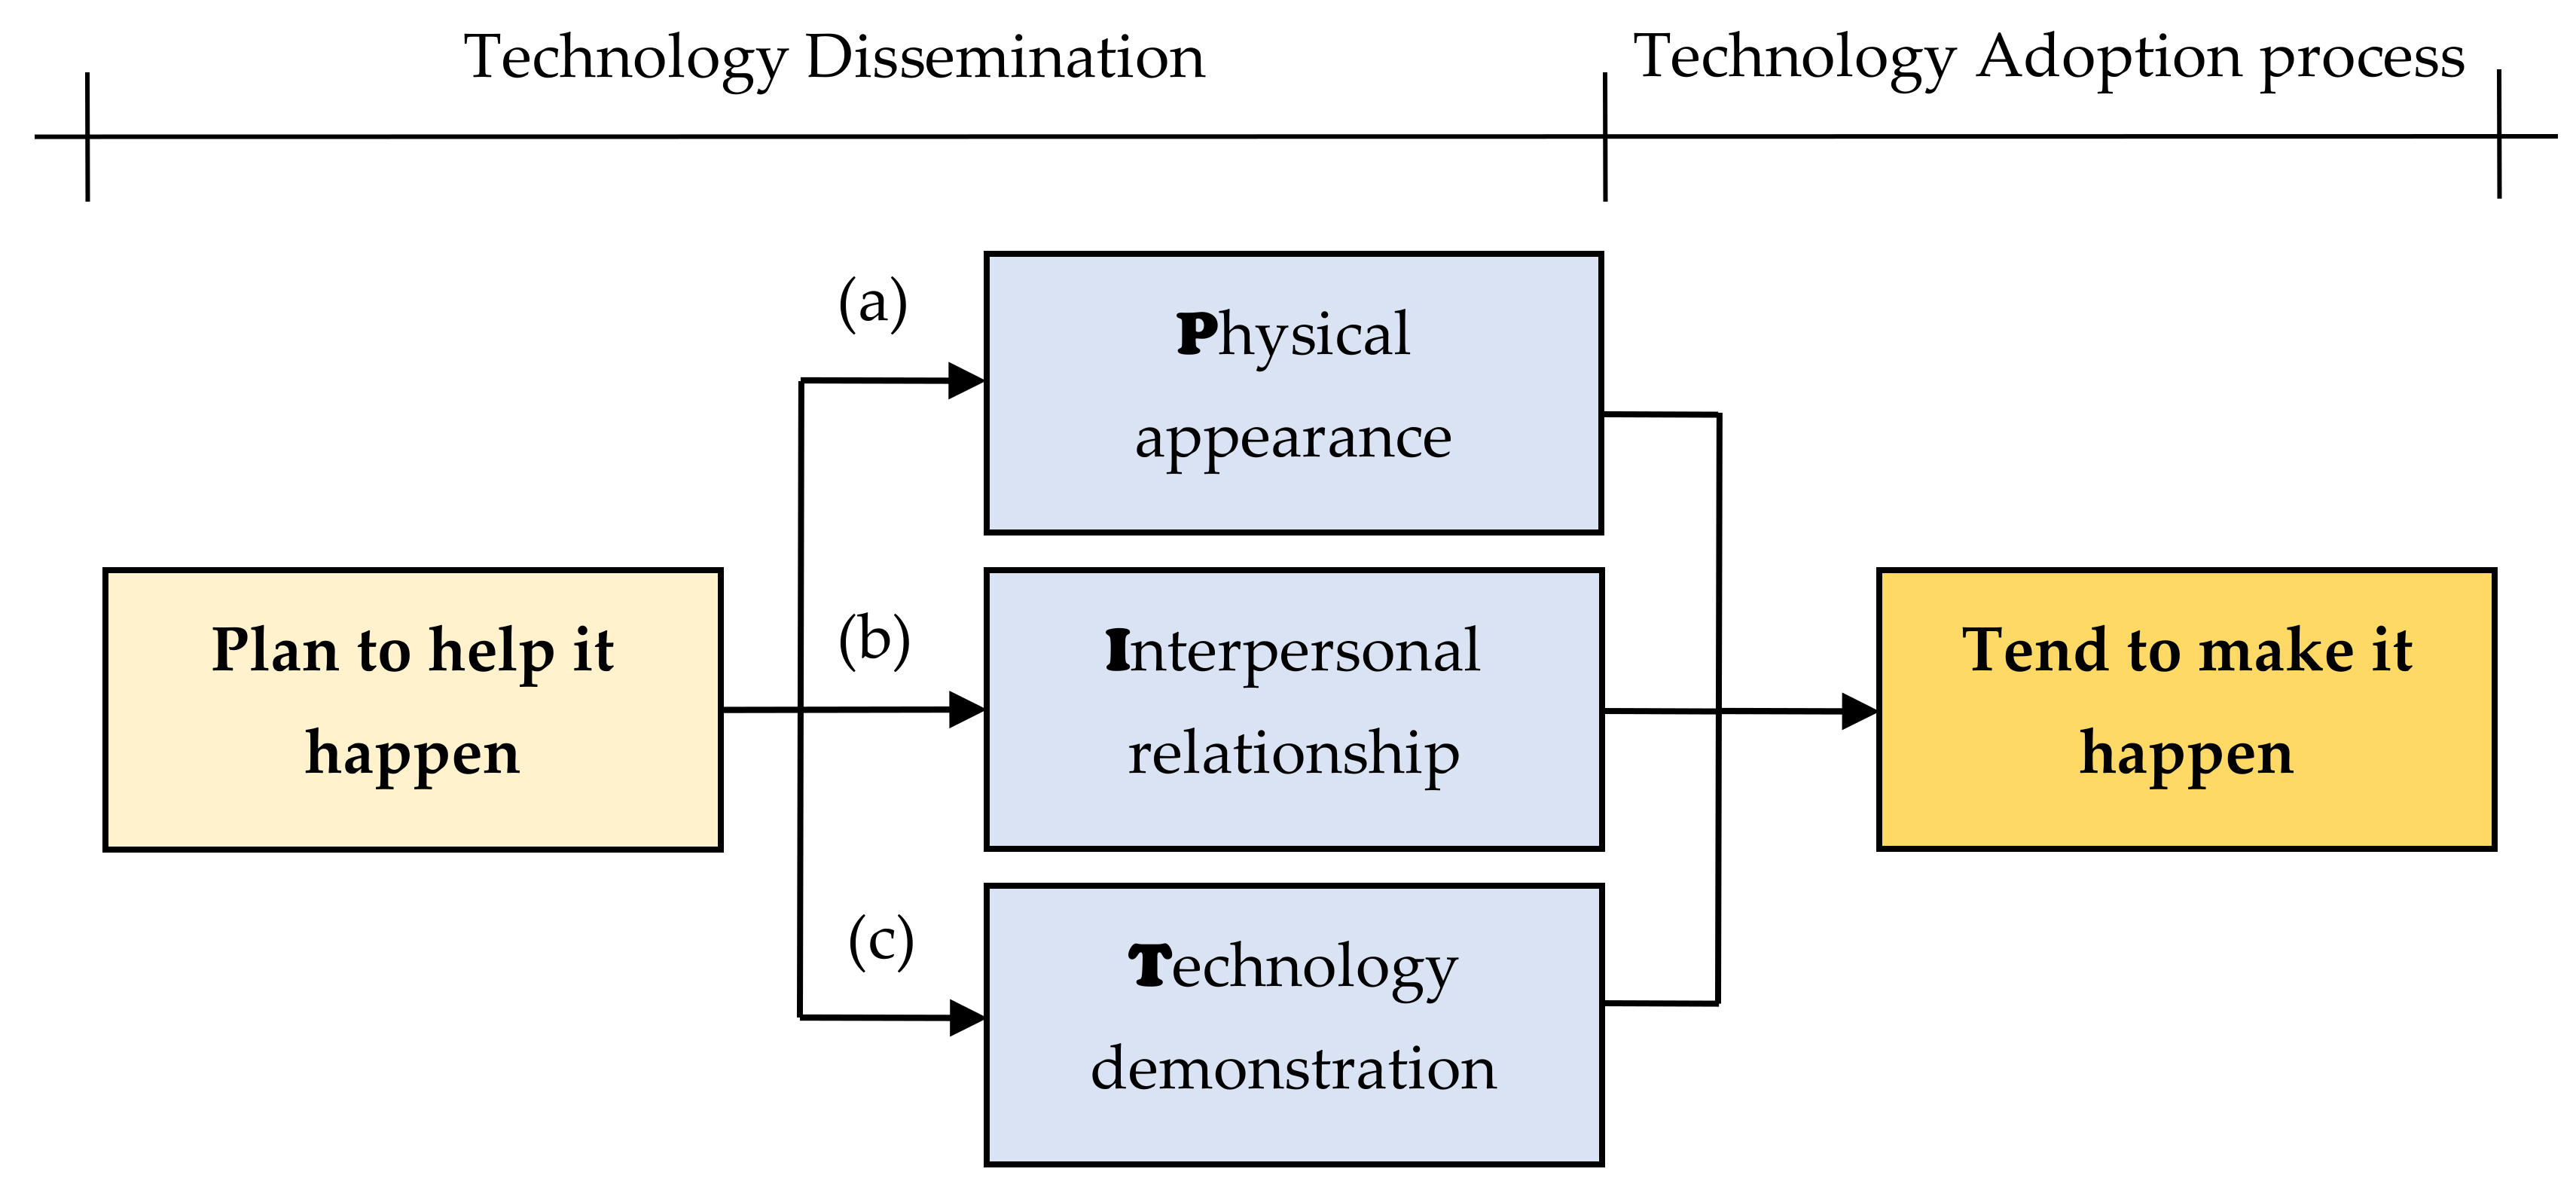
7. Theoretical Model Development for Technology Dissemination
7.1. Physical Appearance
7.2. Interpersonal Relationship
7.3. Technology Demonstration
8. Research Implications and an Agenda for Future Studies
9. Conclusions
Author Contributions
Funding
Conflicts of Interest
References
- Statista. Global Construction Machinery Market—Outlook Through 2015. Available online: http://www.statista.com/statistics/280344/size-of-the-global-construction-machinery-market/ (accessed on 26 June 2019).
- Castro-Lacouture, D.; Medaglia, A.L.; Skibniewski, M. Supply Chain Optimization Tool for Purchasing Decisions in B2B Construction Marketplaces. Autom. Constr. 2007, 16, 569–575. [Google Scholar] [CrossRef]
- Miozzo, M.; Dewick, P. Building competitive advantage: Innovation and corporate governance in European construction. Res. Policy 2002, 31, 989–1008. [Google Scholar] [CrossRef]
- Sepasgozar, M.S.; Davis, S. Construction Technology Adoption Cube: An Investigation on Process, Factors, Barriers, Drivers and Decision Makers Using NVivo and AHP Analysis. Buildings 2018, 8, 74. [Google Scholar] [CrossRef]
- Kale, S.; Arditi, D. Innovation Diffusion Modeling in the Construction Industry. J. Constr. Eng. Manag. 2010, 136, 329–340. [Google Scholar] [CrossRef]
- Cooper, R.G. Product Leadership: Creating and Launching Superior New Products; Perseus Books: Cambridge, UK, 1999. [Google Scholar]
- Gourville, J.T. The Curse of Innovation: A Theory of Why Innovative New Products Fail in the Marketplace; Harvard Business School: Boston, MA, USA, 2005. [Google Scholar]
- Heldal, I.; Fomin, V.V.; Wijkmark, C.H. Technology Adoption Failure Through the Prism of an Organizational Regulation Model. In Proceedings of the European Conference on Knowledge Management, Svalbard, Norway, 18–20 September 2018. [Google Scholar]
- Panuwatwanich, K.; Stewart, R.A. Evaluating Innovation Diffusion Readiness among Architectural and Engineering Design Firms: Empirical Evidence from Australia. Autom. Constr. 2012, 27, 50–59. [Google Scholar] [CrossRef]
- Li, H.; Cao, J.; Castro-Lacouture, D.; Skibniewski, M. A framework for developing a unified B2B e-trading construction marketplace. Autom. Constr. 2003, 12, 201–211. [Google Scholar] [CrossRef]
- Ioannou, P.; Liu, L. Advanced Construction Technology System—ACTS. J. Constr. Eng. Manag. 1993, 119, 288–306. [Google Scholar] [CrossRef]
- Allmon, E.; Haas, C.T.; Borcherding, J.D.; Goodrum, P.M. U.S. Construction Labor Productivity Trends, 1970–1998. J. Constr. Eng. Manag. 2000, 126, 97–104. [Google Scholar] [CrossRef]
- Astebro, T. Noncapital Investment Costs and the Adoption of CAD and CNC in U.S. Metalworking Industries. RAND J. Econ. 2002, 33, 672–688. [Google Scholar] [CrossRef]
- Hoppe, H.C. The Timing of New Technology Adoption: Theoretical Models and Empirical Evidence. Manch. Sch. 2002, 70, 56–76. [Google Scholar] [CrossRef]
- Goodrum, P.M.; Haas, C.T. Long-Term Impact of Equipment Technology on Labor Productivity in the U.S. Construction Industry at the Activity Level. J. Constr. Eng. Manag. 2004, 130, 124–133. [Google Scholar] [CrossRef]
- Goodrum, P.M.; Zhai, D.; Yasin, M.F. Relationship between Changes in Material Technology and Construction Productivity. J. Constr. Eng. Manag. 2009, 135, 278–287. [Google Scholar] [CrossRef]
- Li, N.; Becerik-Gerber, B. Life-Cycle Approach for Implementing RFID Technology in Construction: Learning from Academic and Industry Use Cases. J. Constr. Eng. Manag. 2011, 137, 1089–1098. [Google Scholar] [CrossRef]
- Zhai, D.; Goodrum, P.M.; Haas, C.T.; Caldas, C.H. Relationship between automation and integration of construction information systems and labor productivity. J. Constr. Eng. Manag. 2009, 135, 746–753. [Google Scholar] [CrossRef]
- Schexnayder, C.J.; David, S.A. Past and Future of Construction Equipment—Part IV. J. Constr. Eng. Manag. 2002, 128, 279–286. [Google Scholar] [CrossRef]
- Tatum, C. Process of Innovation in Construction Firm. J. Constr. Eng. Manag. 1987, 113, 648–663. [Google Scholar] [CrossRef]
- Nicolini, D.; Holti, R.; Smalley, M. Integrating project activities: The theory and practice of managing the supply chain through clusters. Constr. Manag. Econ. 2001, 19, 37–47. [Google Scholar] [CrossRef]
- Bowden, S.; Dorr, A.; Thorpe, T.; Anumba, C. Mobile ICT support for construction process improvement. Autom. Constr. 2006, 15, 664–676. [Google Scholar] [CrossRef]
- Nikas, A.; Poulymenakou, A.; Kriaris, P. Investigating Antecedents and Drivers Affecting the Adoption of Collaboration Technologies in the Construction Industry. Autom. Constr. 2007, 16, 632–641. [Google Scholar] [CrossRef]
- Harty, C. Implementing Innovation in Construction: Contexts, Relative Boundedness and Actor-Network Theory. Constr. Manag. Econ. 2008, 26, 1029–1041. [Google Scholar] [CrossRef]
- Milliou, C.; Petrakis, E. Timing of technology adoption and product market competition. Int. J. Ind. Organ. 2011, 29, 511–523. [Google Scholar] [CrossRef]
- IBM. Innovation Index of Australian Industry; Boreham, G., Ed.; Melbourn Institute of Appliad Economic and Social Research Melbourn: Melbourne, Australia, 2010; pp. 1–24. [Google Scholar]
- Munkvold, B.E. Challenges of IT implementation for supporting collaboration in distributed organizations. Eur. J. Inf. Syst. 1999, 8, 260–272. [Google Scholar] [CrossRef]
- Sepasgozar, S.M.; Wang, C.; Shirowzhan, S. Challenges and Opportunities for Implementation of Laser Scanners in Building Construction. In Proceedings of the 33rd International Symposium on Automation and Robotics in Construction, Auburn, AL, USA, 18–21 July 2016. [Google Scholar]
- ABS. Innovation in Australian Business in Innovation in Australian Busines; Australian Bureau of Statistics Canberra: Belconnen, Australia, 2009.
- Sepasgozar, S.M.; Davis, S.R.; Li, H.; Luo, X. Modeling the Implementation Process for New Construction Technologies: Thematic Analysis Based on Australian and US Practices. J. Manag. Eng. 2018, 34, 05018005. [Google Scholar] [CrossRef]
- O’Connor, J.; Yang, L. Project Performance versus Use of Technologies at Project and Phase Levels. J. Constr. Eng. Manag. 2004, 130, 322–329. [Google Scholar] [CrossRef]
- Kang, Y.; O’Brien, W.J.; Thomas, S.; Chapman, R.E. Impact of Information Technologies on Performance: Cross Study Comparison. J. Constr. Eng. Manag. 2008, 134, 852–863. [Google Scholar] [CrossRef]
- Shirowzhan, S.; Sepasgozarb, S.M.E.; Zainic, I.; Wangd, C. An integrated GIS and Wi-Fi based Locating system for improving construction labor communications. In Proceedings of the 34th International Symposium on Automation and Robotics in Construction, Taipei, Taiwan, 28 June–1 July 2017. [Google Scholar]
- Sepasgozar, S.M.E.; Davis, S. Diffusion Pattern Recognition of Technology Vendors in Construction. In Construction Research Congress; American Society of Civil Engineers: Atlanta, Georgia, 2014; pp. 2106–2115. [Google Scholar] [CrossRef]
- Sepasgozar, S.M.E.; Loosemore, M.; Davis, S.R. Conceptualising information and equipment technology adoption in construction A critical review of existing research. Eng. Constr. Archit. Manag. 2016, 23, 158–176. [Google Scholar] [CrossRef]
- Shapira, A.; Lucko, G.; Schexnayder, C.J. Cranes for building construction projects. J. Constr. Eng. Manag. 2007, 133, 690–700. [Google Scholar] [CrossRef]
- Seo, J.; Duque, L.; Wacker, J. Drone-enabled bridge inspection methodology and application. Autom. Constr. 2018, 94, 112–126. [Google Scholar] [CrossRef]
- Rakha, T.; Gorodetsky, A. Review of Unmanned Aerial System (UAS) applications in the built environment: Towards automated building inspection procedures using drones. Autom. Constr. 2018, 93, 252–264. [Google Scholar] [CrossRef]
- Shirowzhan, S.; Sepasgozar, S.M. Spatial Analysis Using Temporal Point Clouds in Advanced GIS: Methods for Ground Elevation Extraction in Slant Areas and Building Classifications. ISPRS Int. J. Geo-Inf. 2019, 8, 120. [Google Scholar] [CrossRef]
- Shirowzhan, S.; Sepasgozar, S.M.E. Utilisation of a New Terrestrial Scanner for Reconstruction of As-built Models: A Comparative Study. In International Symposium on Automation and Robotics in Construction; Vilnius Gediminas Technical University, Department of Construction Economics & Property: Vilnius Gediminas, Lithuania, 2015. [Google Scholar]
- Sepasgozar, S.M.; Lim, S.; Shirowzhan, S. Implementation of Rapid As-built Building Information Modeling Using Mobile LiDAR. In Proceedings of the Construction Research Congress 2014, Atlanta, GA, USA, 19–21 May 2014; American Society of Civil Engineers: Atlanta, GA, USA, 2014. [Google Scholar] [CrossRef]
- Shirowzhan, S.; Lim, S.; Trinder, J. Enhanced autocorrelation-based algorithms for filtering airborne lidar data over urban areas. J. Surv. Eng. 2016, 142, 04015008. [Google Scholar] [CrossRef]
- Shirowzhan, S.; Trinder, J. Building classification from lidar data for spatio-temporal assessment of 3D urban developments. Procedia Eng. 2017, 180, 1453–1461. [Google Scholar] [CrossRef]
- Li, H.; Chan, G.; WaiWong, J.K.; Skitmore, M. Real-time locating systems applications in construction. Autom. Constr. 2016, 63, 37–47. [Google Scholar] [CrossRef]
- Sepasgozar, S.M.E.; Loosemore, M. The role of customers and vendors in modern construction equipment technology diffusion. Eng. Constr. Archit. Manag. 2017, 24, 1203–1221. [Google Scholar] [CrossRef]
- Sepasgozar, S.M.E.; Li, H.; Shirowzhan, S.; Tam, V.W.Y. Methods for monitoring construction off-road vehicle emissions: A critical review for identifying deficiencies and directions. Environ. Sci. Pollut. Res. 2019, 26, 15779–15794. [Google Scholar] [CrossRef] [PubMed]
- Hofmann-Wellenhof, B.; Lichtenegger, H.; Collins, J. Global Positioning System: Theory and Practice; Springer Science & Business Media: Berlin, Germany, 2012. [Google Scholar]
- Howard, J.A.; Moore, W.L. Changes in Consumer Behavior over the Product Life Cycle. Read. Manag. Innov. 1988, 2, 122–130. [Google Scholar]
- Rogers, E.M. Diffusion of Innovations; Free Press: New York, NY, USA, 2003. [Google Scholar]
- Hausman, A.; Stock, J.R. Adoption and implementation of technological innovations within long-term relationships. J. Bus. Res. 2003, 56, 681–686. [Google Scholar] [CrossRef]
- Michaelis, B.; Stegmaier, R.; Sonntag, K. The role of transformational leadership, commitment to change, and climate for initiative. J. Manag. Psychol. 2010, 25, 408–429. [Google Scholar] [CrossRef]
- Damanpour, F.; Schneider, M. Phases of the Adoption of Innovation in Organizations: Effects of Environment, Organization and Top Managers1. Br. J. Manag. 2006, 17, 215–236. [Google Scholar] [CrossRef]
- Ying, H.; Sepasgozar, S.M.; Akbar, N. Key Factors Affecting Construction Organizations’ Acceptance of BIM: A Comparative Study. In Proceedings of the 2016 Modular and Offsite Construction [MOC] Summit, Banff, AB, Canada, 21–24 May 2019. [Google Scholar]
- Venkatesh, V.; Thong, J.Y.L.; Chan, F.K.Y.; Hu, P.J.; Brown, S.A. Extending the two-stage information systems continuance model: Incorporating UTAUT predictors and the role of context. Inf. Syst. J. 2011, 21, 527–555. [Google Scholar] [CrossRef]
- Oshlyansky, L.; Cairns, P.; Thimbleby, H. Validating the Unified Theory of Acceptance and Use of Technology (UTAUT) tool cross-culturally. In Proceedings of the 21st British HCI Group Annual Conference on People and Computers, Lancaster, UK, 3–7 September 2007. [Google Scholar]
- Anderson, F.; Schaan, S. Innovation, Advanced Technologies and Practices in the Construction and Related Industries: National Estimates; Statistics Canada/National Research Council of Canada: Ottawa, ON, Canada, 2001. [Google Scholar]
- Dubois, A.; Gadde, L.-E. The Construction Industry as a Loosely Coupled System: Implications for Productivity and Innovation. Constr. Manag. Econ. 2002, 20, 621–631. [Google Scholar] [CrossRef]
- Gopalakrishna, S.; Lilien, G.L. A Three-Stage Model of Industrial Trade Show Performance. Mark. Sci. 1995, 14, 22–42. [Google Scholar] [CrossRef]
- Hansen, K. Measuring Performance at Trade Shows: Scale Development and Validation. J. Bus. Res. 2004, 57, 1–13. [Google Scholar] [CrossRef]
- Smith, T.M.; Hama, K.; Smith, P.M. The Effect of Successful Trade Show Attendance on Future Show Interest: Exploring Japanese Attendee Perspectives of Domestic and Offshore International Events. J. Bus. Ind. Mark. 2003, 18, 403–418. [Google Scholar] [CrossRef]
- Golfetto, F.; Salle, R.; Borghini, S.; Rinallo, D. Opening the Network: Bridging the IMP Tradition and Other Research Perspectives. Ind. Mark. Manag. 2007, 36, 844–848. [Google Scholar] [CrossRef]
- Reychav, I. Antecedents to Acquisition of Knowledge in Trade Shows. Knowl. Process Manag. 2011, 18, 230–240. [Google Scholar] [CrossRef]
- Bettis-Outland, H.; Johnston, W.J.; Wilson, R.D. Using Trade Show Information to Enhance Company Success: An Empirical Investigation. J. Bus. Ind. Mark. 2012, 27, 384–391. [Google Scholar] [CrossRef]
- Hakura, D.; Jaumotte, F. The Role of Inter-and Intraindustry Trade in Technology Diffusion; International Monetary Fund: Washington, DC, USA, 1999. [Google Scholar]
- Rinallo, D.; Borghini, S.; Golfetto, F. Exploring Visitor Experiences at Trade Shows. J. Bus. Ind. Mark. 2010, 25, 249–258. [Google Scholar] [CrossRef]
- Bettis-Outland, H.; Guillory, M.D. Emotional intelligence and organizational learning at trade shows. J. Bus. Ind. Mark. 2018, 33, 126–133. [Google Scholar] [CrossRef]
- Lee, A.H.I.; Wang, W.-M.; Lin, T.-Y. An Evaluation Framework for Technology Transfer of New Equipment in High Technology Industry. Technol. Forecast. Soc. Chang. 2010, 77, 135–150. [Google Scholar] [CrossRef]
- Reychav, I. Knowledge sharing in a trade show: a learning spiral model. VINE 2009, 39, 143–158. [Google Scholar] [CrossRef]
- Kerin, R.A.; Cron, W.L. Assessing Trade Show Functions and Performance: An Exploratory Study. J. Market. 1987, 51, 87–94. [Google Scholar] [CrossRef]
- Tanner, J.F., Jr.; Chonko, L.B. Trade show objectives, management, and staffing practices. Ind. Market. Manag. 1995, 24, 257–264. [Google Scholar] [CrossRef]
- Holt, G.; Edwards, D. Analysis of UK Off-Highway Construction Machinery Market and Its Consumers, Using New-Sales Data. J. Constr. Eng. Manag. 2012, 139, 529–537. [Google Scholar] [CrossRef]
- Grandzol, C.J.; Grandzol, J.R. Chantey Castings: A Hands-On Simulation to Teach Constraint Management and Demand-Driven Supply Chain Approaches. Decis. Sci. J. Innov. Educ. 2018, 16, 6–22. [Google Scholar] [CrossRef]
- Hultsman, W. From the Eyes of an Exhibitor: Characteristics that Make Exhibitions a Success for all Stakeholders. J. Conv. Exhib. Manag. 2001, 3, 27–44. [Google Scholar] [CrossRef]
- Tanner, J.F., Jr. Leveling the playing field: Factors influencing trade show success for small companies. Ind. Mark. Manag. 2002, 31, 229–239. [Google Scholar] [CrossRef]
- Situma, S.P. The Effectiveness of Trade Shows and Exhibitions as Organizational Marketing Tool (Analysis of Selected Companies in Mombasa). Int. J. Bus. Soci. Sci. 2012, 3, 219–230. [Google Scholar]
- TriComB2B. The Considered Purchase Decision in TriComB2B 2011, TriComB2B and the University of Daytopn School of Business Adminstration Ohio. Available online: https://www.tricomb2b.com/sites/default/files/sites/default/files/uploads/TriComB2B-UD_Research_Report-2013.pdf (accessed on 26 June 2019).
- Geroski, P.A. Models of Technology Diffusion. Res. Policy 2000, 29, 603–625. [Google Scholar] [CrossRef]
- Sepasgozar, S.M.; Davis, S.R.; Loosemore, M. Dissemination Practices of Construction Sites’ Technology Vendors in Technology Exhibitions. J. Manag. Eng. 2018, 34, 04018038. [Google Scholar] [CrossRef]
- Johannessen, J.-A.; Olsen, B.; Lumpkin, G.T. Innovation As Newness: What Is New, How New, and New to Whom? Eur. J. Innov. Manag. 2001, 4, 20–31. [Google Scholar] [CrossRef]
- John, C.H.; Pouder, R.W. Technology Clusters versus Industry Clusters: Resources, Networks, and Regional Advantages. Growth Chang. 2006, 37, 141–171. [Google Scholar] [CrossRef]
- Karahanna, E.; Straub, D.W.; Chervany, N.L. Information technology adoption across time: A cross-sectional comparison of pre-adoption and post-adoption beliefs. MIS Q. 1999, 23, 183–213. [Google Scholar] [CrossRef]
- Harrison-Walker, L.J. The Measurement of Word-of-Mouth Communication and an Investigation of Service Quality and Customer Commitment as Potential Antecedents. J. Serv. Res. 2001, 4, 60–75. [Google Scholar] [CrossRef]
- Sweeney, J.C.; Soutar, G.N.; Mazzarol, T. Factors influencing word of mouth effectiveness: Receiver perspectives. Eur. J. Mark. 2008, 42, 344–364. [Google Scholar] [CrossRef]
- Godar, S.H.; O’Connor, P.J. Same Time Next Year—Buyer Trade Show Motives. Ind. Mark. Manag. 2001, 30, 77–86. [Google Scholar] [CrossRef]
- Lee, E.-J.; Lee, J.; Schumann, D.W. The Influence of Communication Source and Mode on Consumer Adoption of Technological Innovations. J. Consum. Aff. 2002, 36, 1–27. [Google Scholar] [CrossRef]
- Ling-yee, L. Marketing Resources and Performance of Exhibitor Firms in Trade Shows: A Contingent Resource Perspective. Ind. Mark. Manag. 2007, 36, 360–370. [Google Scholar] [CrossRef]
- Yuksel, U.; Voola, R. Travel Trade Shows: Exploratory Study of Exhibitors’ Perceptions. J. Bus. Ind. Market. 2010, 25, 293–300. [Google Scholar] [CrossRef]
- Fichman, R.G. Information Technology Diffusion: A Review of Empirical Research. In Proceedings of the International Conference on Information Systems, Dallas, TX, USA, 13–16 December 1992; pp. 195–206. [Google Scholar]
- Wu, I.-L.; Chiu, M.-L. Organizational Applications of IT Innovation and Firm’s Competitive Performance: A Resource-Based View and the Innovation Diffusion Approach. J. Eng. Technol. Manag. 2015, 35, 25–44. [Google Scholar] [CrossRef]
- Robertson, T.S.; Gatignon, H. Competitive Effects on Technology Diffusion. J. Market. 1986, 50, 1–12. [Google Scholar] [CrossRef]
- Patton, M.Q. Qualitative Evaluation and Research Methods; Sage: Thousand Oaks, CA, USA, 1990. [Google Scholar]
- Abowitz, D.; Toole, T. Mixed Method Research: Fundamental Issues of Design, Validity, and Reliability in Construction Research. J. Constr. Eng. Manag. 2009, 136, 108–116. [Google Scholar] [CrossRef]
- Schultze, U.; Avital, M. Designing Interviews to Generate Rich Data for Information Systems Research. Inf. Organ. 2011, 21, 1–16. [Google Scholar] [CrossRef]
- Denzin, N.K. The Research Act: A Theoretical Introduction to Sociological Methods; Transaction Publishers: Piscataway, NJ, USA, 1970. [Google Scholar]
- Mathison, S. Why Triangulate? Educ. Res. 1988, 17, 13–17. [Google Scholar] [CrossRef]
- Belk, R.W. Handbook of Qualitative Research Methods in Marketing; Edward Elgar Publishing: Cheltenham, UK, 2008. [Google Scholar]
- Schroeder, J. Critical Visual Analysis; Belk, R, Ed.; Edward Elgar: Aldershot, UK, 2006; pp. 303–321. [Google Scholar]
- Mitchell, A.A. The Effect of Verbal and Visual Components of Advertisements on Brand Attitudes and Attitude Toward the Advertisement. J. Consum. Res. 1986, 13, 12–24. [Google Scholar] [CrossRef]
- Van Leeuwen, T.; Jewitt, C. The Handbook of Visual Analysis; SAGE: Thousand Oaks, CA, USA, 2001. [Google Scholar]
- Jain, A.K. Data clustering: 50 years beyond K-means. Pattern Recognit. Lett. 2010, 31, 651–666. [Google Scholar] [CrossRef]
- Huang, Z. Extensions to the k-Means Algorithm for Clustering Large Data Sets with Categorical Values. Data Min. Knowl. Discov. 1998, 2, 283–304. [Google Scholar] [CrossRef]
- Zhao, Y.; Karypis, G.; Fayyad, U. Hierarchical Clustering Algorithms for Document Datasets. Data Min. Knowl. Discov. 2005, 10, 141–168. [Google Scholar] [CrossRef]
- Bryman, A. Social Research Methods; Oxford University Press: New York, NY, USA, 2012. [Google Scholar]
- Corbin, J.; Strauss, A. Basics of Qualitative Research: Techniques and Procedures for Developing Grounded Theory; Sage Publications: Thousand Oaks, CA, USA, 2008. [Google Scholar]
- Yin, R.K. Qualitative Research from Start to Finish; Guilford Press: New York, NY, USA, 2010. [Google Scholar]
- Glaser, B.; Strauss, A. The Discovery of Grounded Theory; Weidenfield & Nicolson: London, UK, 1967. [Google Scholar]
- Gioia, D.A.; Corley, K.G.; Hamilton, A.L. Seeking qualitative rigor in inductive research notes on the gioia methodology. Organ. Res. Methods 2013, 16, 15–31. [Google Scholar] [CrossRef]
- Sepasgozar, S.M.; Davis, S.; Loosemore, M.; Bernold, L. An investigation of modern building equipment technology adoption in the Australian construction industry. Eng. Constr. Archit. Manag. 2018, 25, 1075–1091. [Google Scholar] [CrossRef]
- Corswant, F.V.; Tunälv, C. Coordinating Customers and Proactive Suppliers: A Case Study of Supplier Collaboration in Product Development. J. Eng. Technol. Manag. 2002, 19, 249–261. [Google Scholar] [CrossRef]
- Siskind, B. Powerful Exhibit Marketing: The Complete Guide to Successful Trade Shows, Conferences, and Consumer Shows; John Wiley & Sons: Toronto, ON, Canada, 2008. [Google Scholar]
- Hommels, A.; Peters, P.; Bijker, W.E. Techno therapy or nurtured niches? Technology studies and the evaluation of radical innovations. Res. Policy 2007, 36, 1088–1099. [Google Scholar] [CrossRef]
- Felin, T.; Zenger, T.R. Closed or Open Innovation? Problem Solving and the Governance Choice. Res. Policy 2014, 43, 914–925. [Google Scholar] [CrossRef]
- Gopalakrishna, S.; Roster, C.A.; Sridhar, S. An exploratory study of attendee activities at a business trade show. J. Bus. Ind. Market. 2010, 25, 241–248. [Google Scholar] [CrossRef]
- Lee, C.H.; Kim, S.Y. Differential Effects of Determinants on Multi-dimensions of Trade Show Performance: By Three Stages of Pre-show, At-show, and Post-show Activities. Ind. Market. Manag. 2008, 37, 784–796. [Google Scholar] [CrossRef]
- Soilen, K.S. Trade Show Intelligence. In Exhibit Marketing and Trade Show Intelligence; Springer: New York, NY, USA, 2013; pp. 127–136. [Google Scholar]
- Habets, T.; Voordijk, H.; van der Sijde, P. The adoption of innovative asphalt equipment in road construction. Constr. Innov. Inf. Process Manag. 2011, 11, 229–245. [Google Scholar] [CrossRef]
- Bansal, H.S.; Voyer, P.A. Word-of-mouth Processes within a Services Purchase Decision Context. J. Serv. Res. 2000, 3, 166–177. [Google Scholar] [CrossRef]
- Gottlieb, U.; Brown, M.; Ferrier, L. Consumer Perceptions of Trade Show Effectiveness: Scale Development and Validation within a B2C Context. Eur. J. Market. 2014, 48, 89–107. [Google Scholar] [CrossRef]
- Buttle, F.A. Word of mouth: Understanding and Managing Referral Marketing. J. Strateg. Market. 1998, 6, 241–254. [Google Scholar] [CrossRef]
- Kreivi, M. Matti Muhos, Lingyun Wang, and Pekka Kess. Trade Fairs to Advance SME Internationalisation: Case China, Industrial Engineering and Management Working Papers 2011/6. 2011. Available online: https://pdfs.semanticscholar.org/eda9/3cc4be8353020e03d51940b65712572deefe.pdf (accessed on 29 June 2019).
- Smith, T.M.; Gopalakrishna, S.; Smith, P.M. The complementary effect of trade shows on personal selling. Int. J. Res. Market. 2004, 21, 61–76. [Google Scholar] [CrossRef]
- Aspers, P.; Darr, A. Trade Shows and the Creation of Market and Industry. Sociol. Rev. 2011, 59, 758–778. [Google Scholar] [CrossRef]
- KHLGrouThe world’s Largest Construction Machinery Manufacturers in 2011. 2012 cited 2013. Available online: http://www.statista.com/statistics/234198/leading-construction-machinery-manufacturers-worldwide-based-on-revenue/ (accessed on 29 June 2019).
- Didehvar, N.; Teymourifard, M.; Mojtahedi, M.; Sepasgozar, I.D. An Investigation on Virtual Information Modeling Acceptance Based on Project Management Knowledge Areas. Buildings 2018, 8, 80. [Google Scholar] [CrossRef]
- Foroozanfar, M.; Samad, M.E.S. Modeling Green Digital Technology Implementation in Construction. In Proceedings of the Construction Research Congress, New Orleans, LA, USA, 2–4 April 2018. [Google Scholar]
- Peansupap, V.; Walker, D. Exploratory Factors Influencing Information and Communication Technology Diffusion and Adoption within Australian Construction Organizations: A Micro Analysis. In Construction Innovation; Sage: Thousand Oaks, CA, USA, 2005; pp. 135–157. [Google Scholar]
- Rogers, E.M. Diffusion of Innovations, 4th ed.; Free Press: New York, NY, USA, 1995. [Google Scholar]
- Moore, G.A. Crossing the Chasm: Marketing and Selling High-Tech Products to Mainstream Consumers; HarperBusiness: New York, NY, USA, 1991. [Google Scholar]
- Tidd, J. A Review of Innovation Models; Imperial College London: London, UK, 2006. [Google Scholar]
- Sepasgozar, S.M.; Davis, S.R. A Decision Framework for Advanced Construction Technology Adoption. In Proceedings of the Transportation Research Board 94th Annual Meeting, Washington, DC, USA, 11–15 January 2015. [Google Scholar]
- Hong, Y.; Hammad, A.W.A.; Sepasgozar, S.; Akbarnezhad, A. BIM adoption model for small and medium construction organisations in Australia. Eng. Constr. Archit. Manag. 2018, 26, 154–183. [Google Scholar] [CrossRef]
- Hong, Y.; Samad, M.E.; Sepasgozar, A.; Ahmadian, F.F.; Akbarnezhad, A. Factors influencing BIM adoption in small and medium sized construction organizations. In Proceedings of the 33rd ISARC, Auburn, AL, USA, 18–21 July 2016. [Google Scholar]
- Shirowzhan, S.; Sepasgozar, S.M.E.; Li, H.; Trinder, J. Spatial compactness metrics and Constrained Voxel Automata development for analyzing 3D densification and applying to point clouds: A synthetic review. Autom. Constr. 2018, 96, 236–249. [Google Scholar] [CrossRef]
- Sepasgozar, S.M.E.; Limb, S.; Shirowzhanc, S.; Kimd, Y.M. Implementation of As-Built Information Modelling Using Mobile and Terrestrial Lidar Systems. In Proceedings of the 31st International Symposium on Automation and Robotics in Construction and Mining, Sydney, Australia, 9–11 July 2014. [Google Scholar]
- Sepasgozar, S.M.E.; Forsythe, P.; Shirowzhan, S. Evaluation of terrestrial and mobile scanner technologies for part-built information modeling. J. Constr. Eng. Manag. 2018, 144, 04018110. [Google Scholar] [CrossRef]
- Shirowzhan, S.; Sepasgozar, S.M.E.; Li, H.; Trinder, J.; Tang, P. Comparative analysis of machine learning and point-based algorithms for detecting 3D changes in buildings over time using bi-temporal lidar data. Autom. Constr. 2019, 105, 102841. [Google Scholar] [CrossRef]
- Shirowzhan, S.; Sepasgozar, S.; Liu, C. Monitoring physical progress of indoor buildings using mobile and terrestrial point clouds. In Proceedings of the Construction Research Congress, New Orleans, LA, USA, 2–4 April 2018. [Google Scholar]
- Tahmasebinia, F.; Niemelä, M.; Sepasgozar, S.M.E.; Lai, T.Y.; Su, W.; Reddy, K.R.; Shirowzhan, S.; Marroquin, F.A. Three-Dimensional Printing Using Recycled High-Density Polyethylene: Technological Challenges and Future Directions for Construction. Buildings 2018, 8, 165. [Google Scholar] [CrossRef]
- Sepasgozar, S.M.; Bernold, L.E. Factors Influencing the Decision of Technology Adoption in Construction. In Proceedings of the Developing the Frontier of Sustainable Design, Engineering, and Construction—ICSDEC, Fort Worth, TX, USA, 7–9 November 2012. [Google Scholar]


| Examples | Description | Applications |
|---|---|---|
| Crane equipped with programmable system | Programable systems for controlling and monitoring; with a remote control for controlling from outside the operator cabinet; Camera and anti-collision systems [36]. | Transport materials vertically and horizontally. |
| Unmanned aerial Systems/Vehicles (UAS/UAV) | An aircraft without a human pilot aboard used for analysis and inspection of construction sites. | For bridge inspection and damage identification [37], building performance, visualising heat transfer [38] |
| Light Detection and Ranging (lidar) and laser scanners | A method using light in the form of a pulsed laser to measure variable distances [39]. | As-built modelling [40,41], urban analytics [42,43] |
| Real-time locating system (RTLS) | A device to locate the current geographic position of an object (e.g., labour or material) and tracking them [44]. | To collect traffic data from Site, monitor safety by tracking the locations of both workers, etc. |
| Autonomous Haulage System (AHS) | With a high precision GPS, milliwave radar and optic-fibre gyro to control the exact position of the unmanned trucks [45]. | Extend operating times, reduce manpower costs and equipment wear and tear, fuel consumption and emissions [46], eliminate human driving errors [45]. |
| Global positioning system (GPS) | A satellite-based navigation system that identifies the position of the electronic device [47]. | Track the location of vehicles and estimates materials installation times [44]. |
| Radio frequency identification (RFID) | Reads, stores and retrieves data by using a radio frequency compatible integrated circuit [44]. | Commonly used in indoor areas for tracking (e.g., buildings and hospitals). |
| Score (Rank) | 1 | 2 | 3 | 4 | 5 |
|---|---|---|---|---|---|
| Booth size | 0–35 | 36–70 | 71–199 | 200–499 | 500 and more |
| Booth designed area | all not designed | <36 | 37–80 | 81–100 | >100 |
| General booth type | not designed | basic designed | basic designed | upgraded design | unique design |
| Conversation room | no | a part of inside space | > 1 spot for Conversation | special space | extra room |
| Number of sale person | 1–2 persons | 3–5 persons | 6–8 persons | 9–12 persons | >12 persons |
| Number of open sides | - | 1 | 2 | 3 | 4 |
| Wall height | <2 m | 2.1–3 | 3.1–4 | >4 | |
| Table position | Front | Back | Side Perimeter | Middle | Random |
| Lighting and electricals | N/A | normal | light focused on the product | extra lighting | designed color lighting |
| Brand maturity | unknown or new | known by local people | known by some experts | known by experts | known by most of users |
| Asset value (* 1000) | < $9 | $10–29 | $30–59 | $60–199 | > $200 |
| Number of exhibited technologies | 1 to 3 | 4 to 6 | 7to 10 | 11 to 15 | > 15 |
| Technology demonstration | N/A | simple show | special demo- static | dynamic, virtual demo | live demonstration |
| Presenting potential of technology | N/A | simple show | showing the capability | maximum capability | interactions with other machines |
| Technology models | N/A | one simple model/Parts | Handicrafts/ models | cut/section model | site model/ sort of products |
| Showcases | N/A | Simple/table for cases | short glass case | tall glass case | designed glass case |
| Stand displays | N/A | simple brochure stand | folding/swing up stand | designed stands | shelves |
| Number of posters | 0–1 | 2–3 | 3–4 | 4–5 | > 5 |
| Poster size | <A2 | 2*A2 | 3*A2 | 5*A2 | >5 A2 |
| Poster content | product series/model- photo | key aspects- product dimension | specific technology photo | product capacity | product full specification /in-use |
| Advertising material print out brochure | N/A | flyer | <5 | 5-8 | >8 |
| Vendor catalogue hand out | general Tech/brand | technology written explanation | photo- specific series- separately | Eng. sketching- graph | in-use sketching- performance |
| Video and Visualisation | N/A | audio/a laptop or computer | video LCD | simulator / videos | live noise- product noise and performance |
| Product Advertising | General | <3 cases | 4-6 cases | 7-10 cases | >11 cases |
| Number of Staff | 1–2 persons | 3–5 persons | 6–8 persons | 9–12 persons | >12 persons |
| Function of Staff | advertiser | sale person | expert | mechanic | managers and technicians |
| Class | Strategy | Attitude |
|---|---|---|
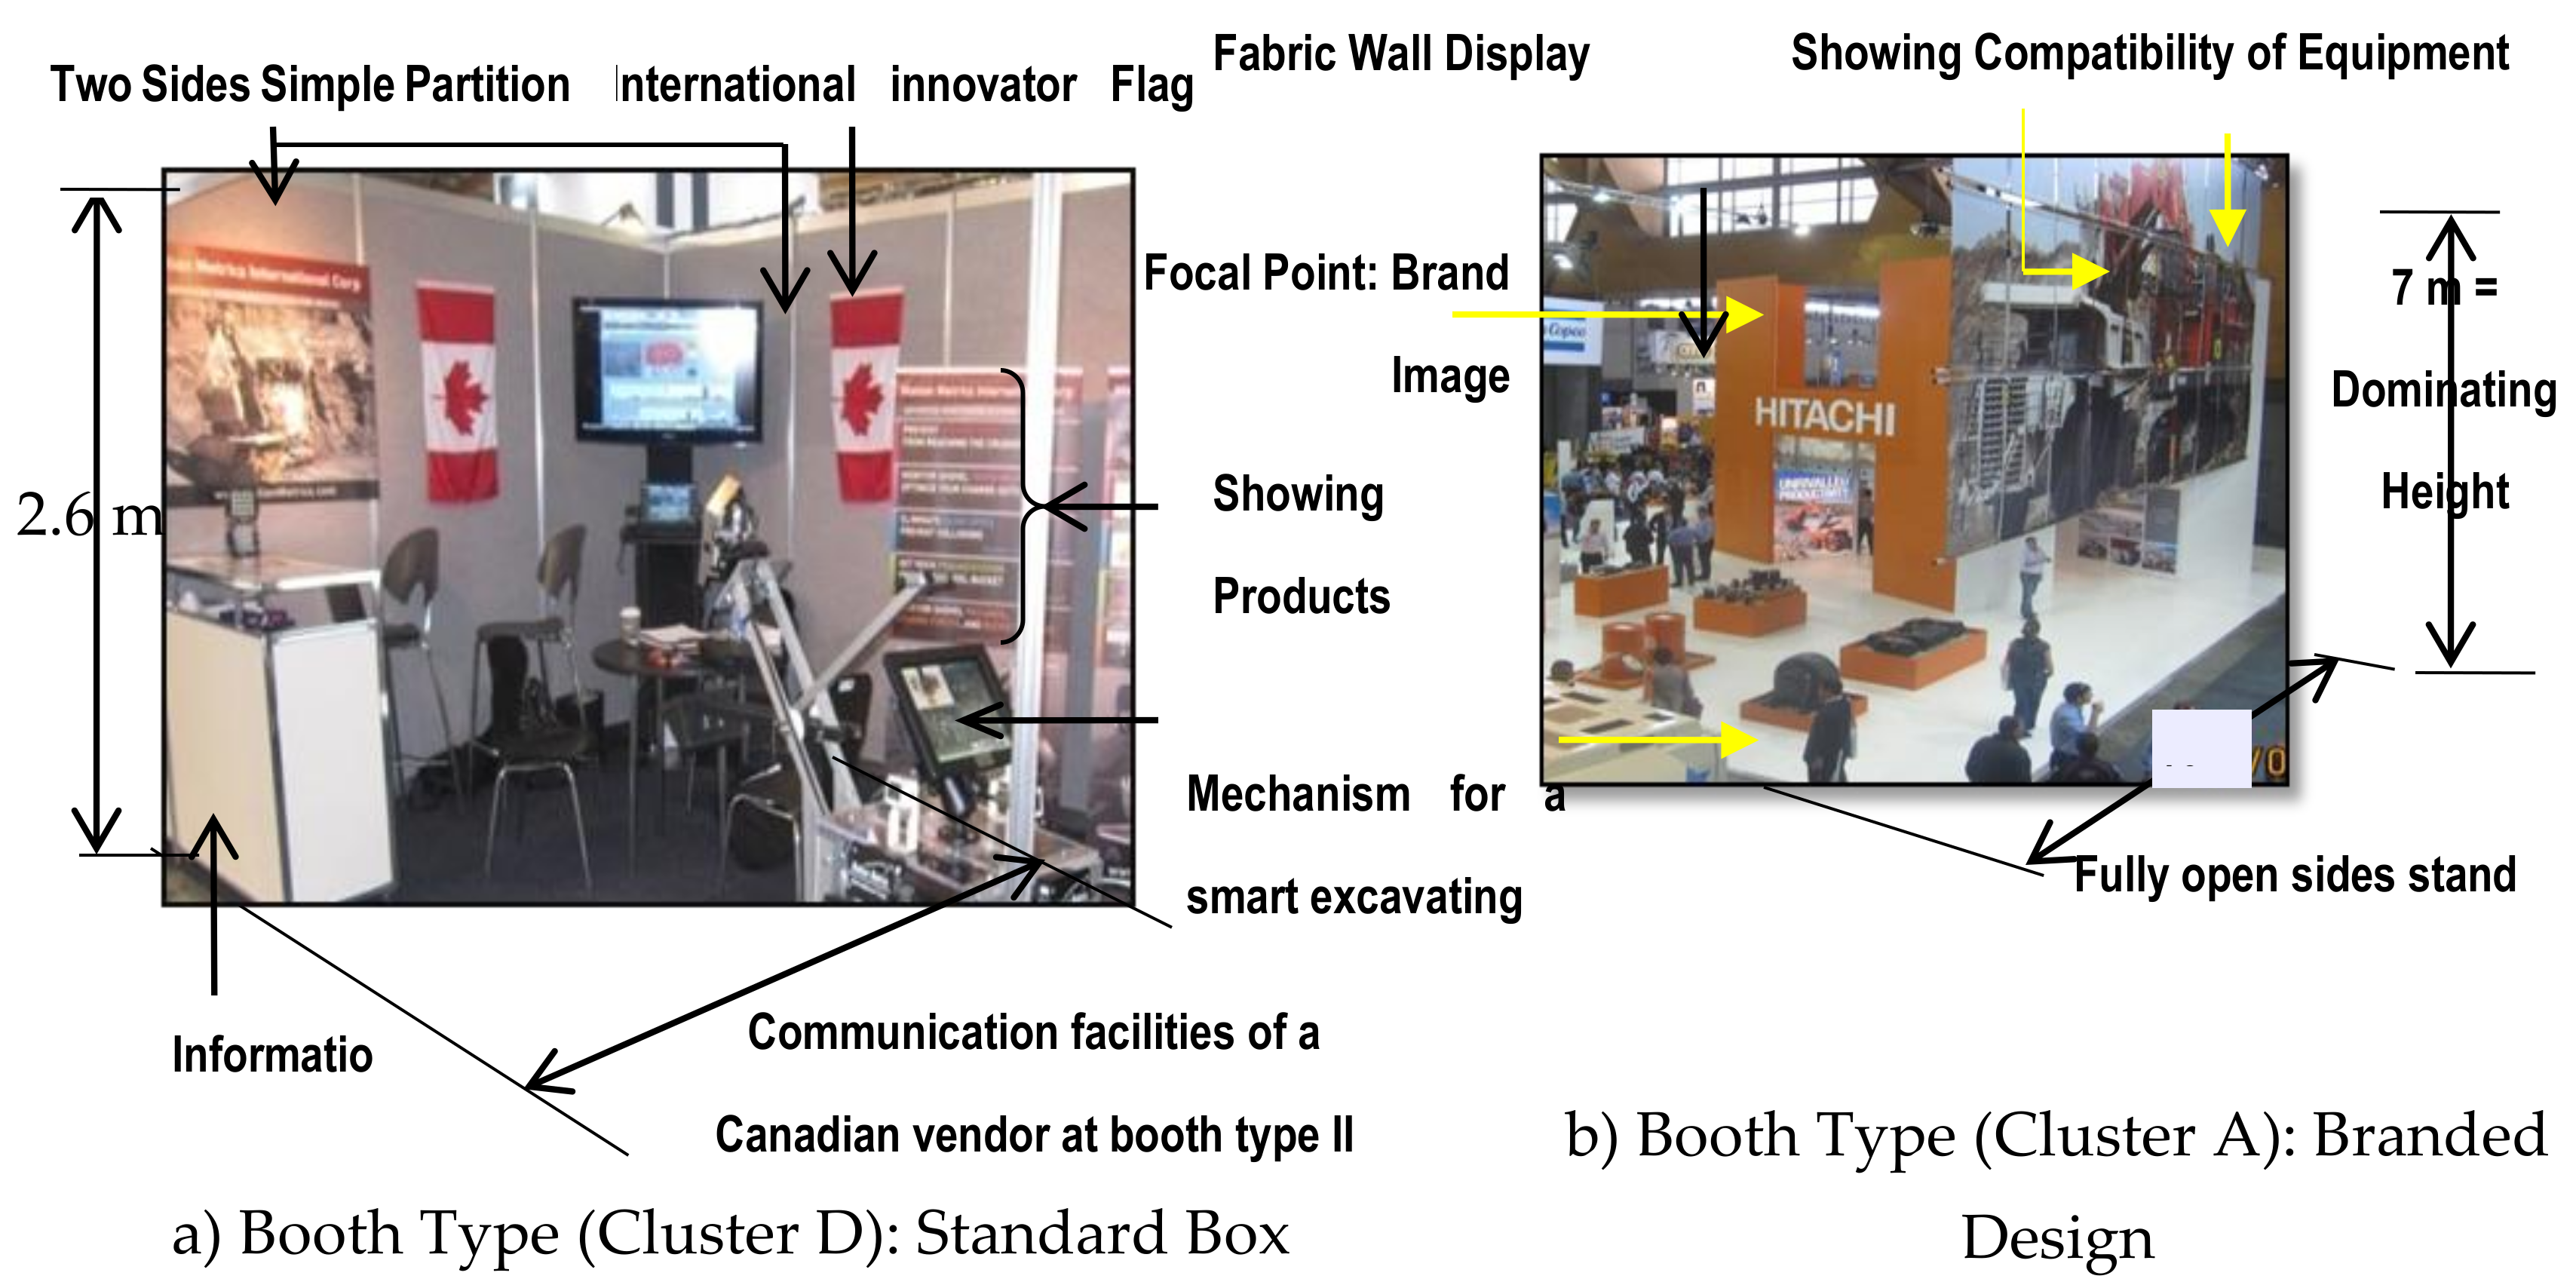
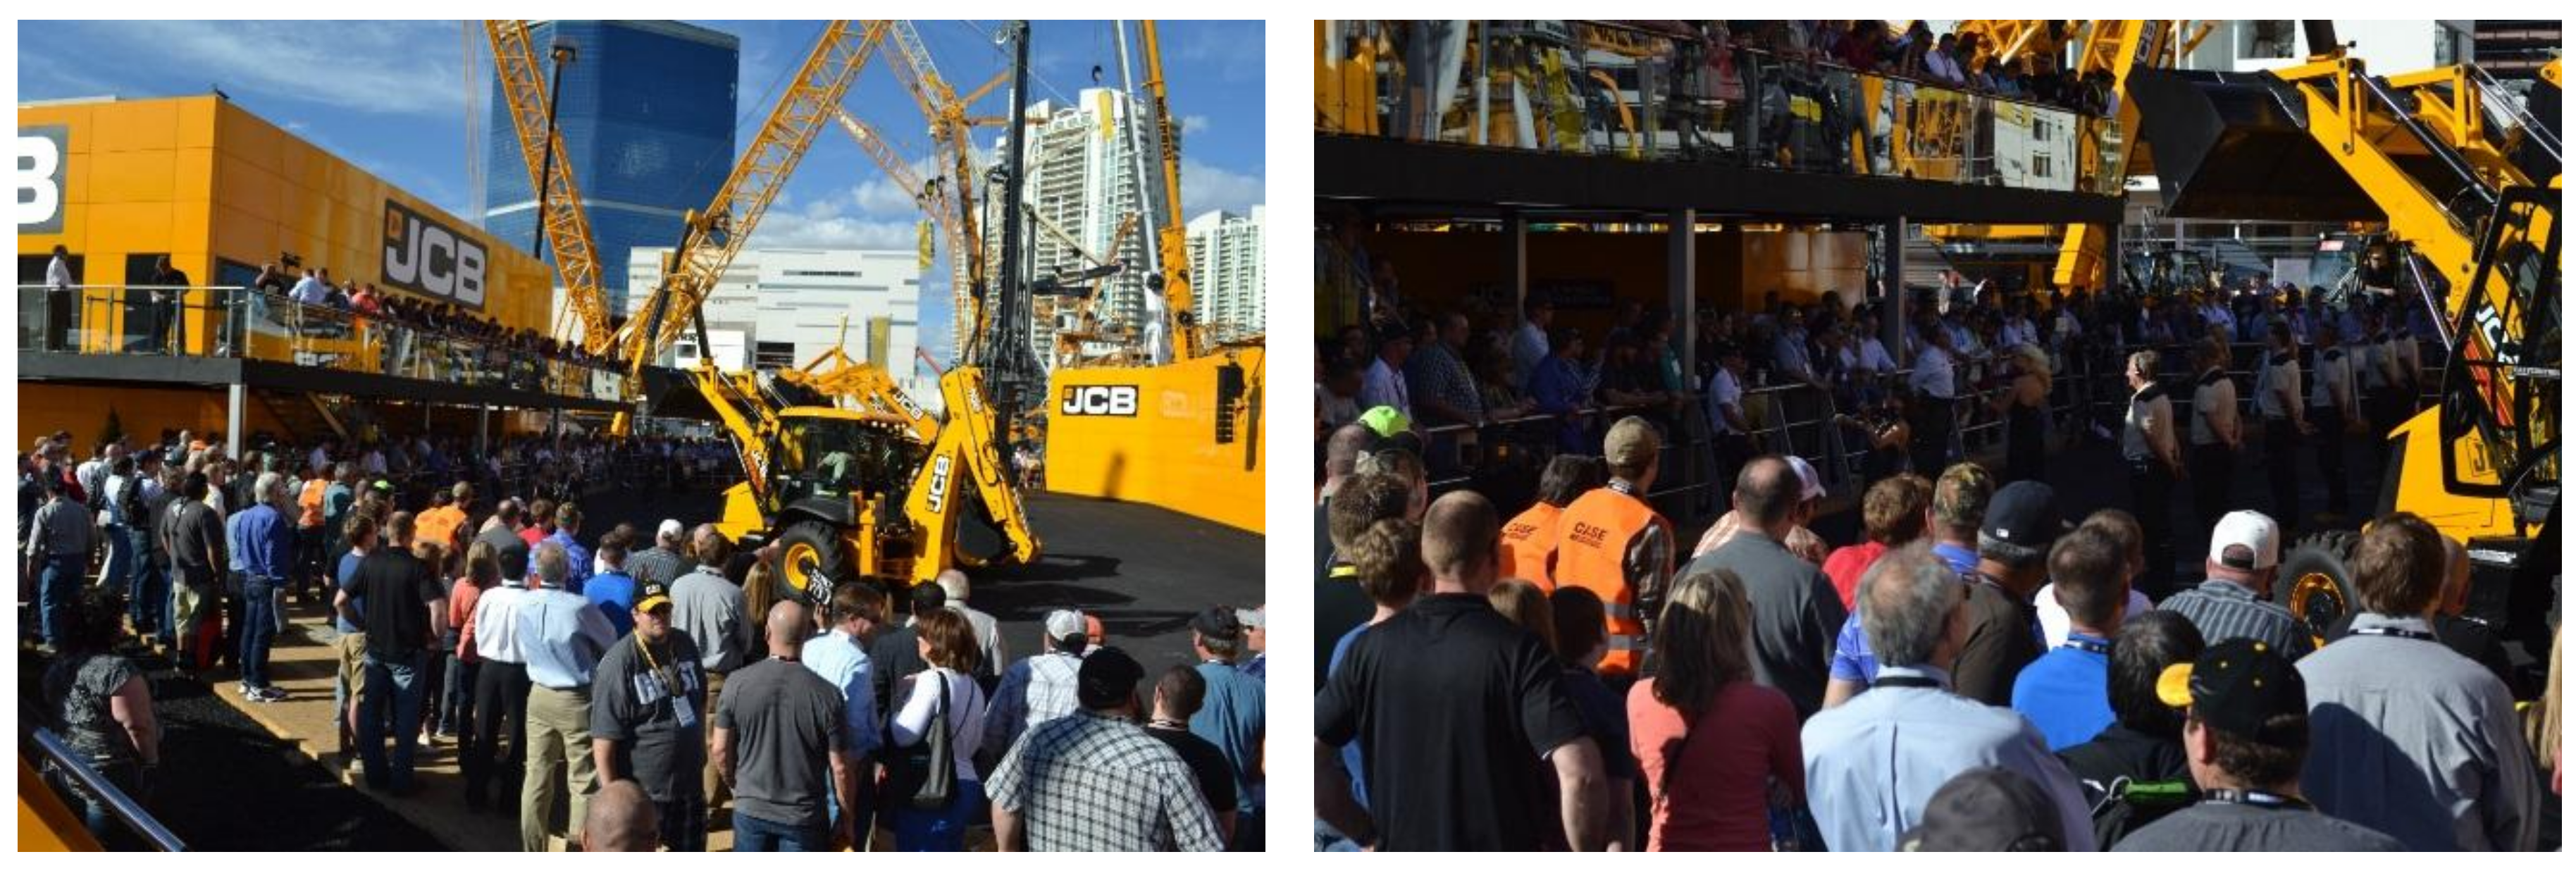
| Class A | booth design area; food catering; live celebrities; >12 booth staff; technology live demonstration | Focused on brand awareness, provide references from previous customers at booth, developed relationships, made engineers and after sales persons available, provided conversation areas, established an anchor booth. Could be called “brand vendors” [113] or “leader vendors” [65]. Attractive to potential adopters to communicate with [113]. |
| Class B | >165M far from main distance; located close to class A vendors; three sides of their booth open; upgraded designed; 4M product height. | Relatively spacious booth without dynamic and extensive environment. Could be called “niche/defender vendors”. Established spacious space for communication; used unique colour for both and product. |
| Class C | 2~3 sides of their booth open; upgraded designed booth; big size posters. | Peninsula-type booth [113]. They want to be differentiated than competitors of class B or D. Made conversation special space available. |
| Class D | ~71 to 199 M^2 booth size; sited close to a road; close to class B or C located; two sides of booths open; 2 M wall high; known by professionals. | Brand shopper for tools and light equipment that could not be offered by class A vendors, are targeted. Because brand maturity of these vendors is greater than class E vendors. This cluster is comparable with class E because of the similarity of their technologies. |
| Class E | Used table/desk/cases for technology; used less socialisation; 4–6 product lines at booth; used one simple model or section. | Utilised low-cost strategies made awareness of existence, used basic configurations, include entrepreneur vendors; the smallest booth size distinguish them; according to Gopalakrishna [113], niche tool shoppers are interested to these vendors. |
| Vendor Cluster | Product and Examples | Technology Know-how | Knowledge Transfer |
|---|---|---|---|
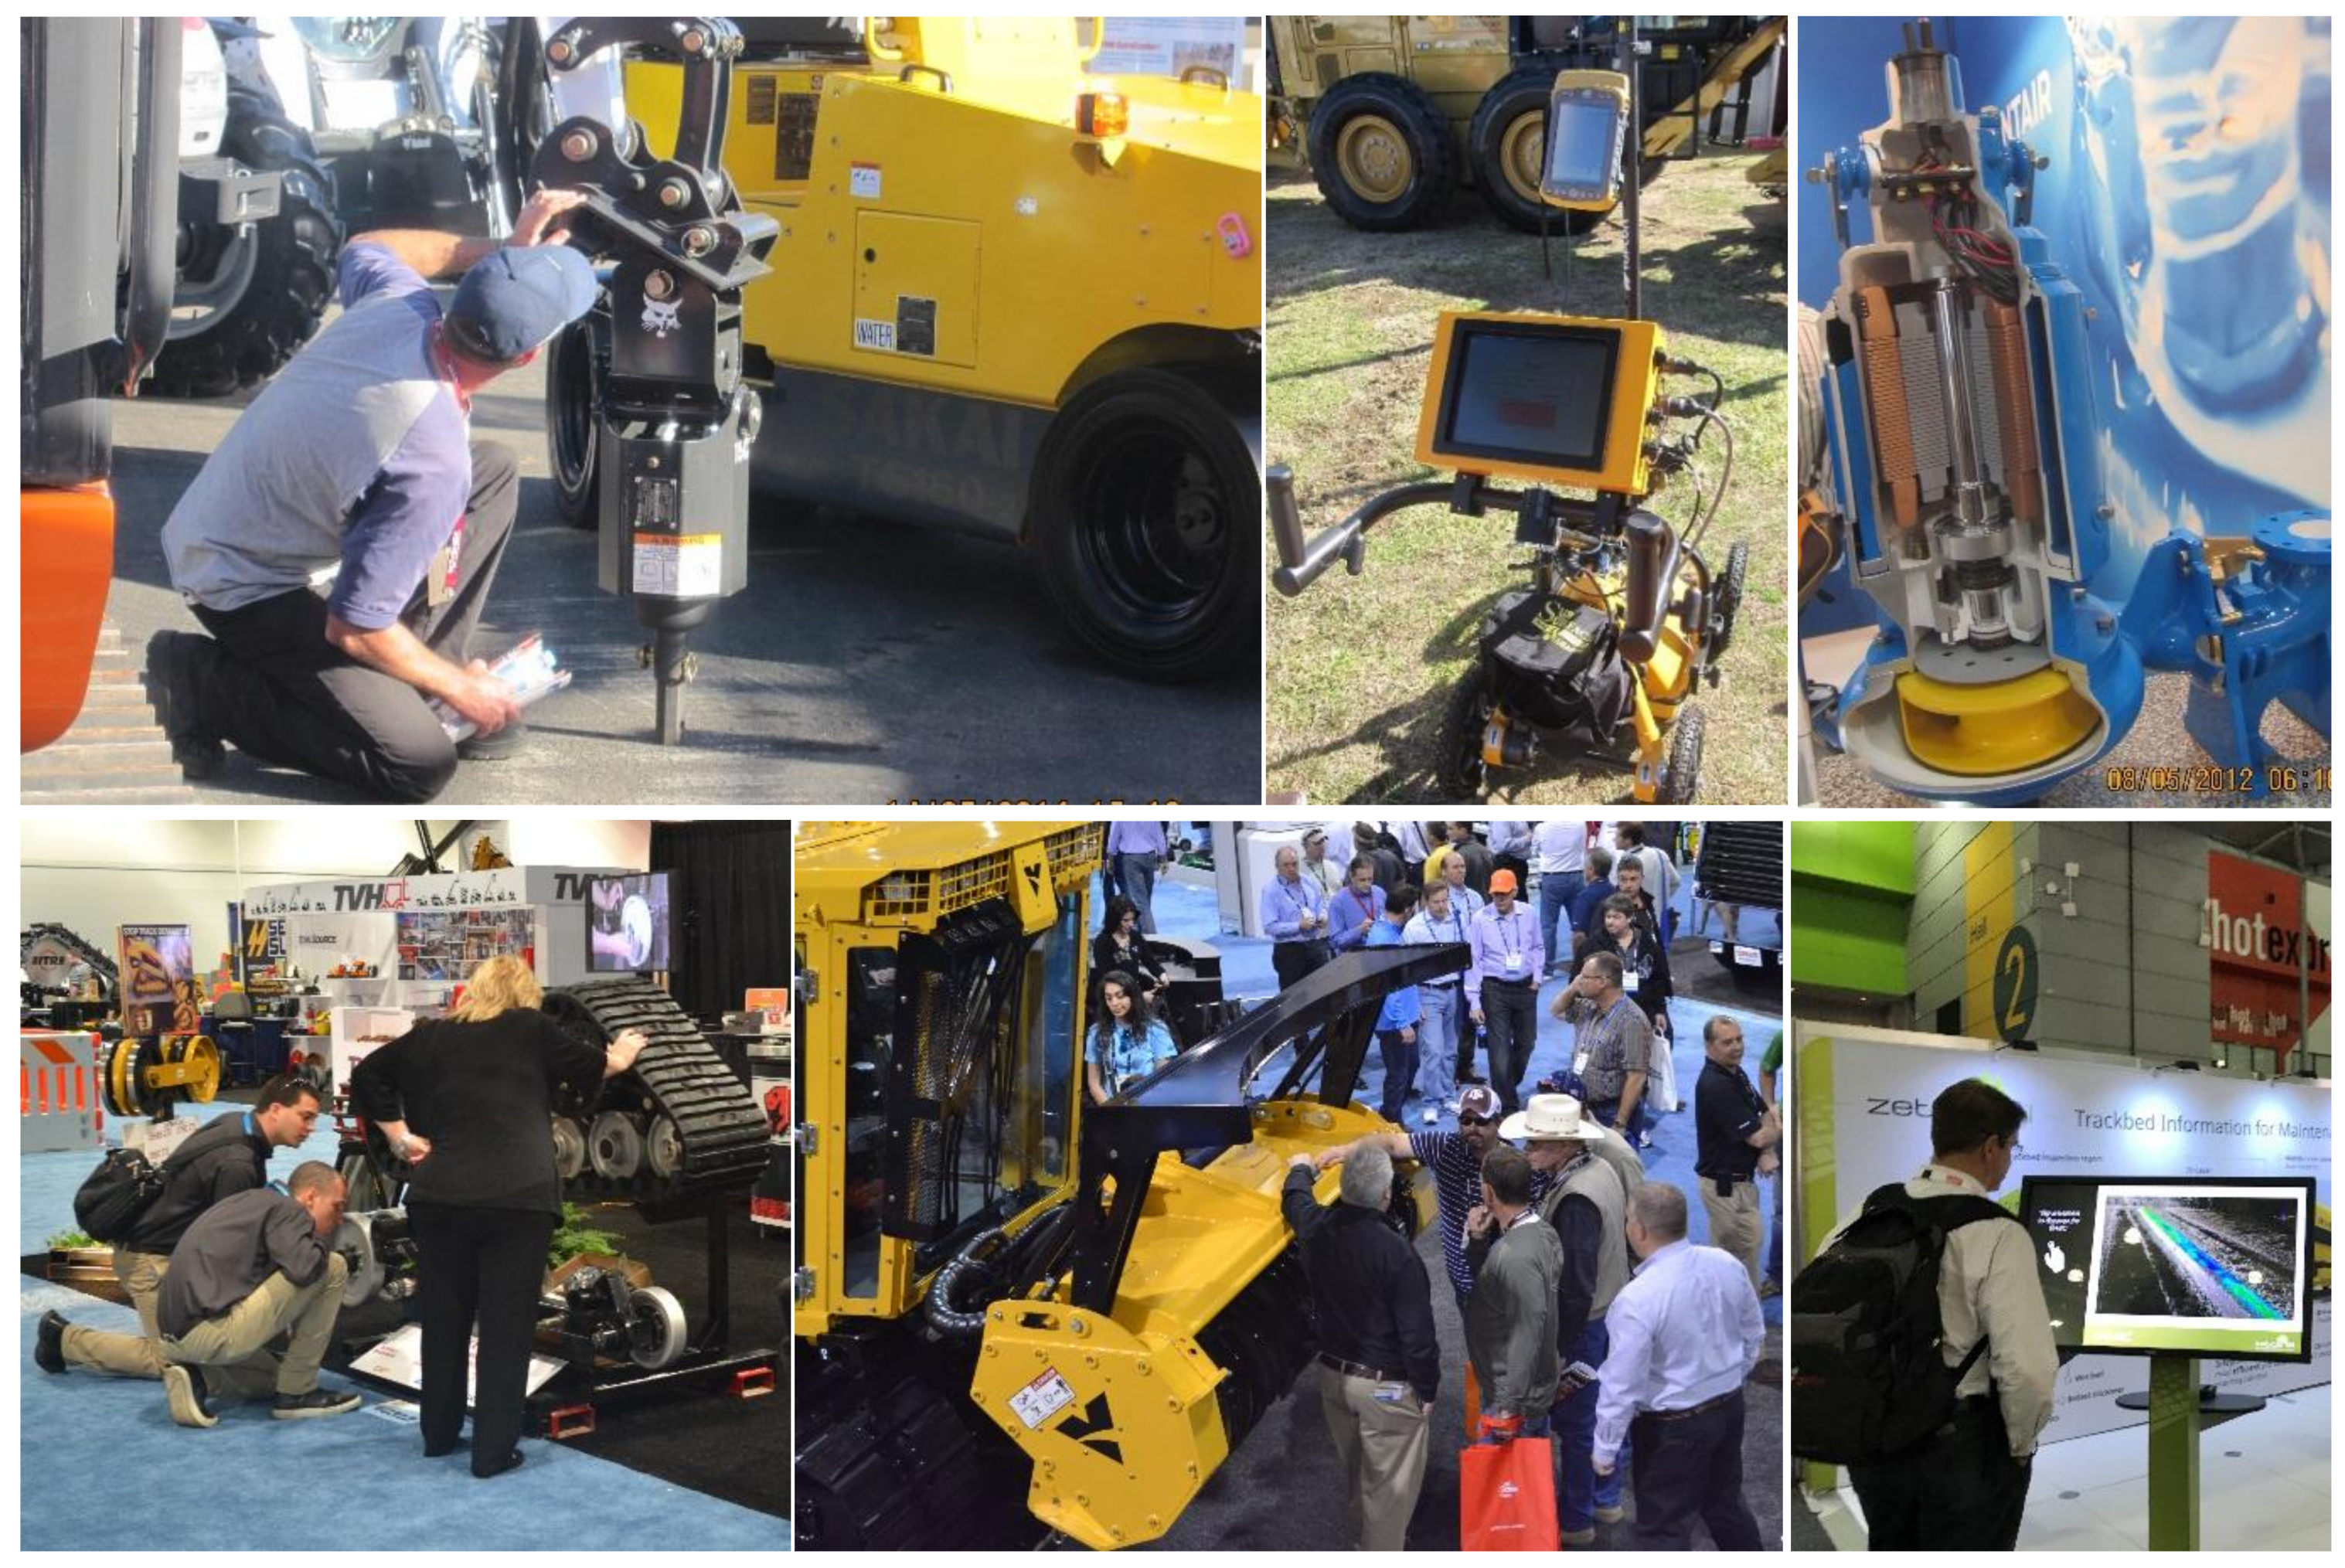
| I | Heavy equipment (CAT, Hyundai) Plants (JOY, P&H) Multi product Lines (Hitachi) | Extensive activities to attract potential adopters (Booth type V, specific conversation room) Presenting technologies using a wide range of tools | Generate explicit and implicit knowledge using about 10 personnel Detail information about emission, engine specification |
| II | Tools Mini equipment Little Innovation | Activities to attract potential adopters (Booth type V, specific conversation room) Presenting real size of small scale product |
| Category | Type | Tools |
|---|---|---|
| Paper-based information | Catalogue, brochure, expo directory book, news and advertisements in newspapers | Folding brochure stands, open shelve stands, mesh brochure stands, swing up brochure stands, LCD multimedia stands, weather proof stand frames, hanging fabric rails |
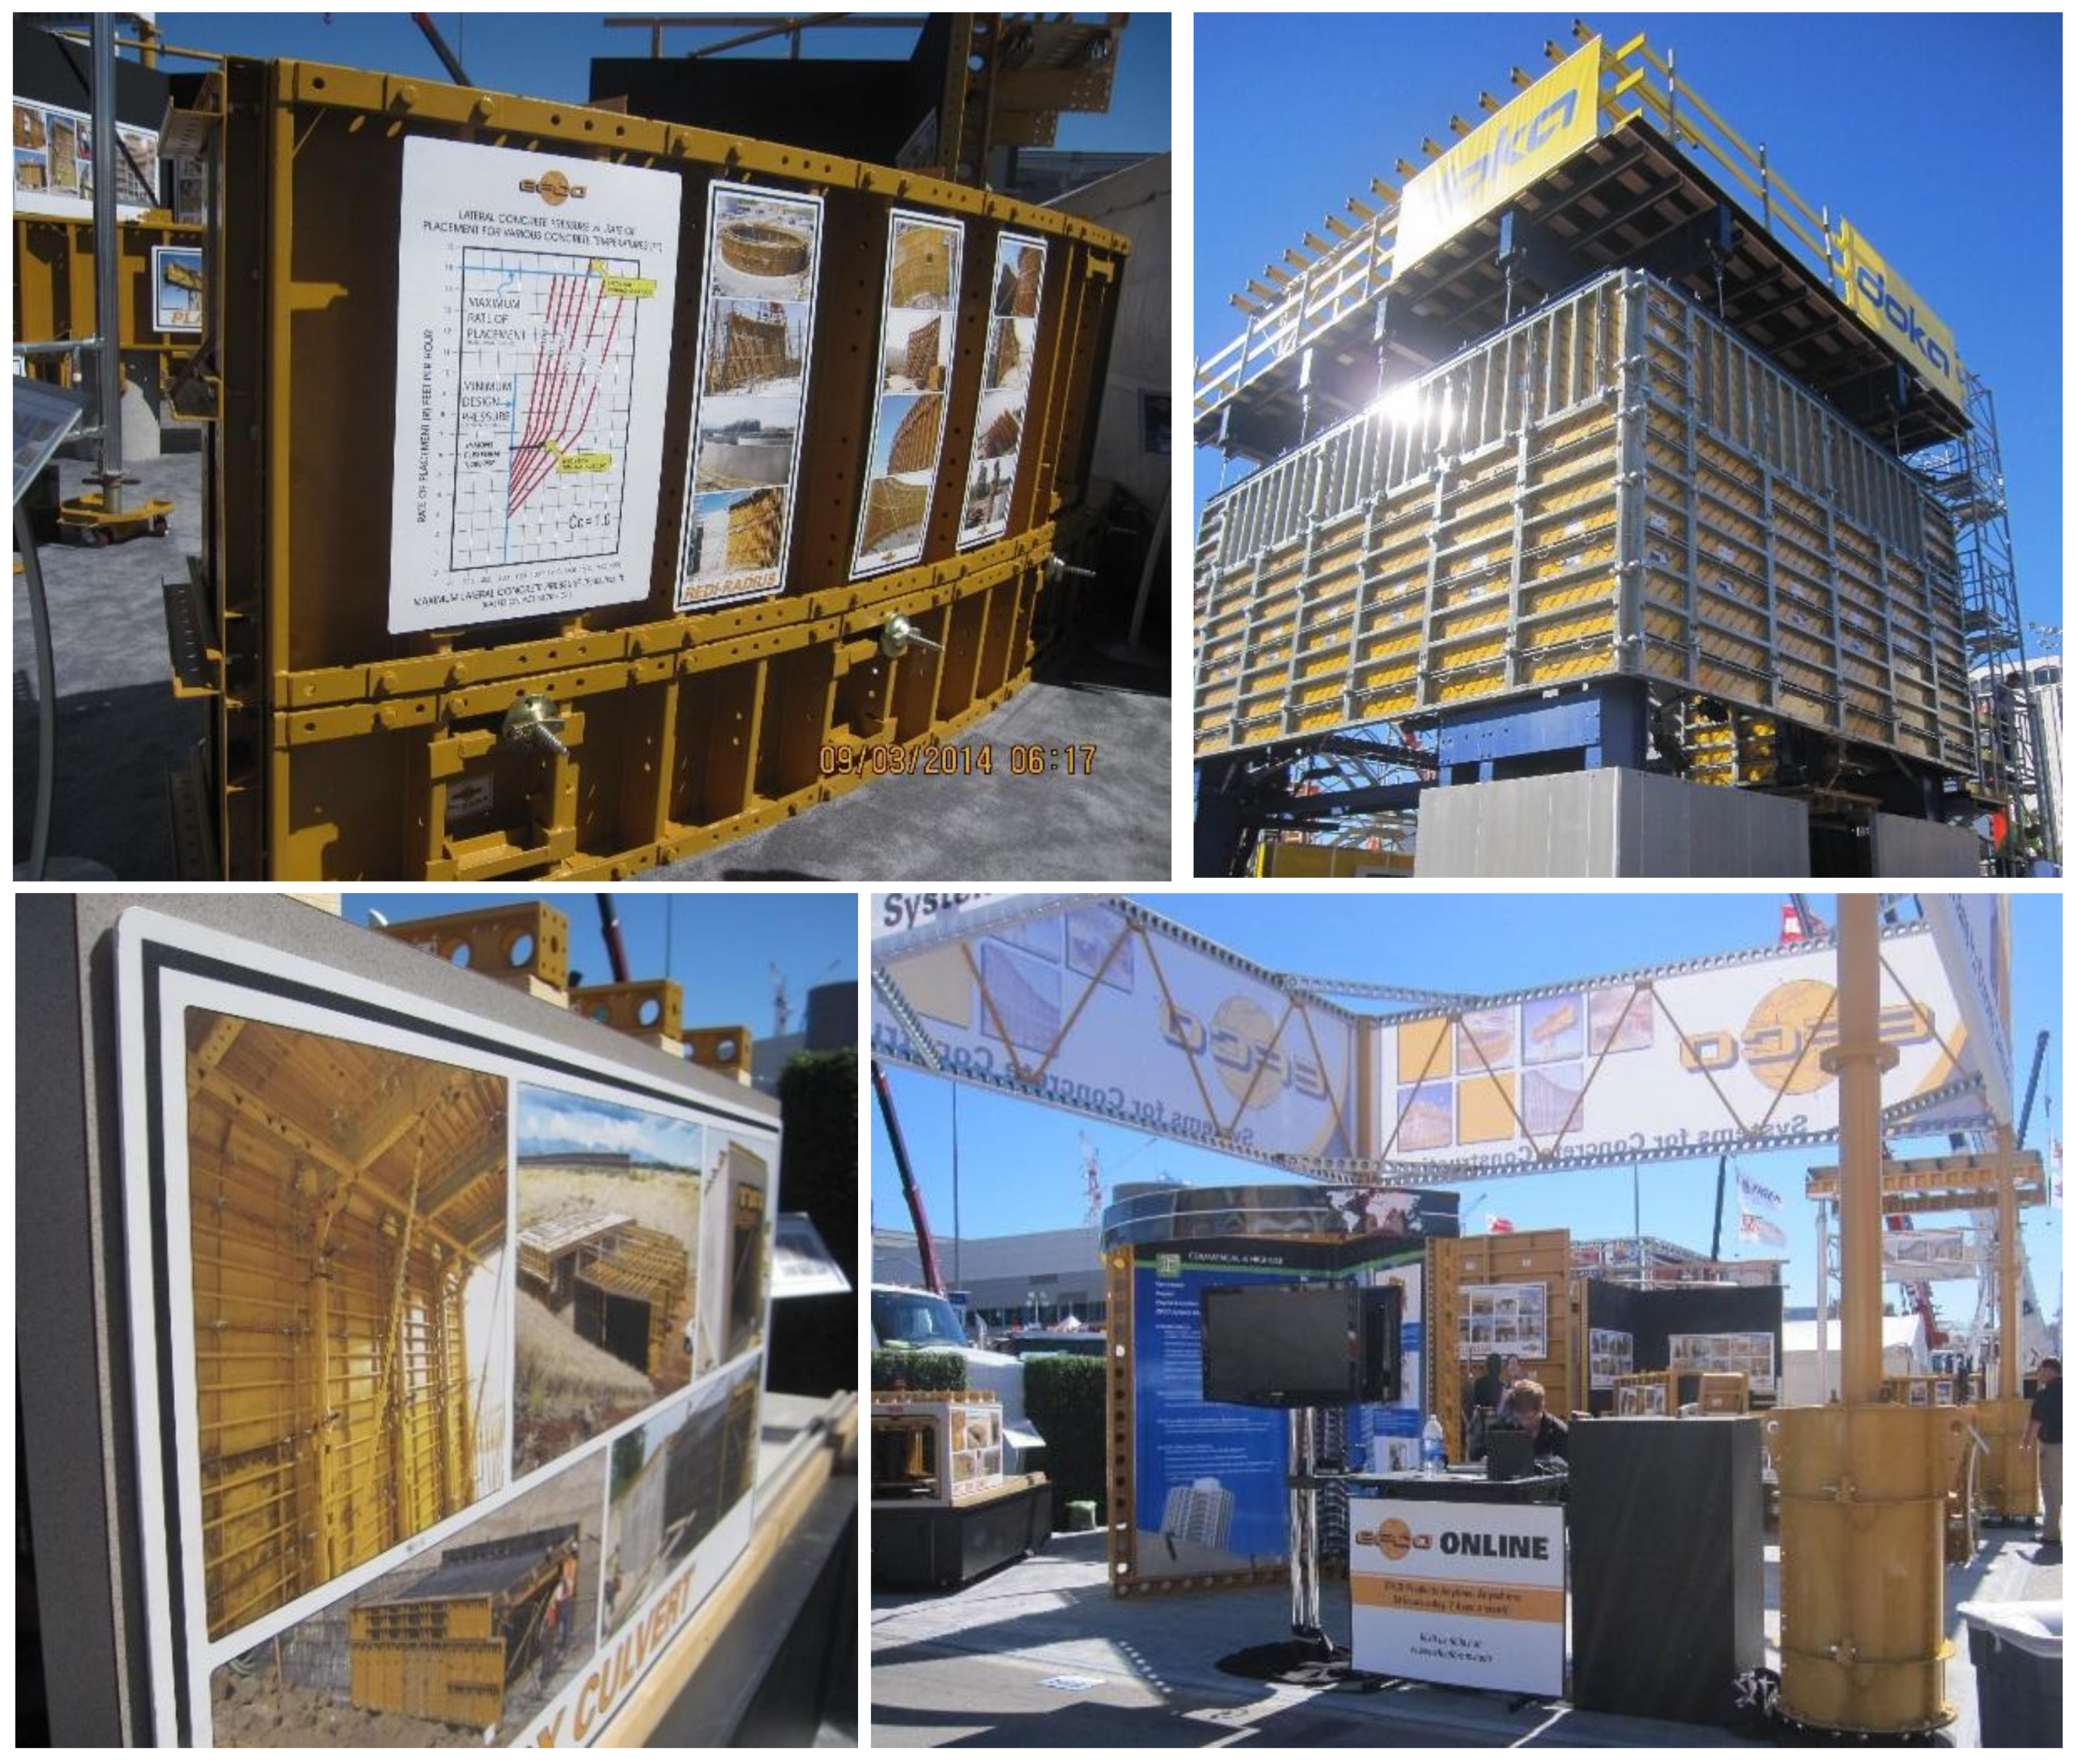
| Static displays | Teardrop flags, posters, floor poster displays, billboard displays, Poster displays in weatherproof coverings, wall banners, weatherproof light boxes | Flags, billboard frameworks, wall hangings |
| 3D models | Real samples and a section of a model | Models |
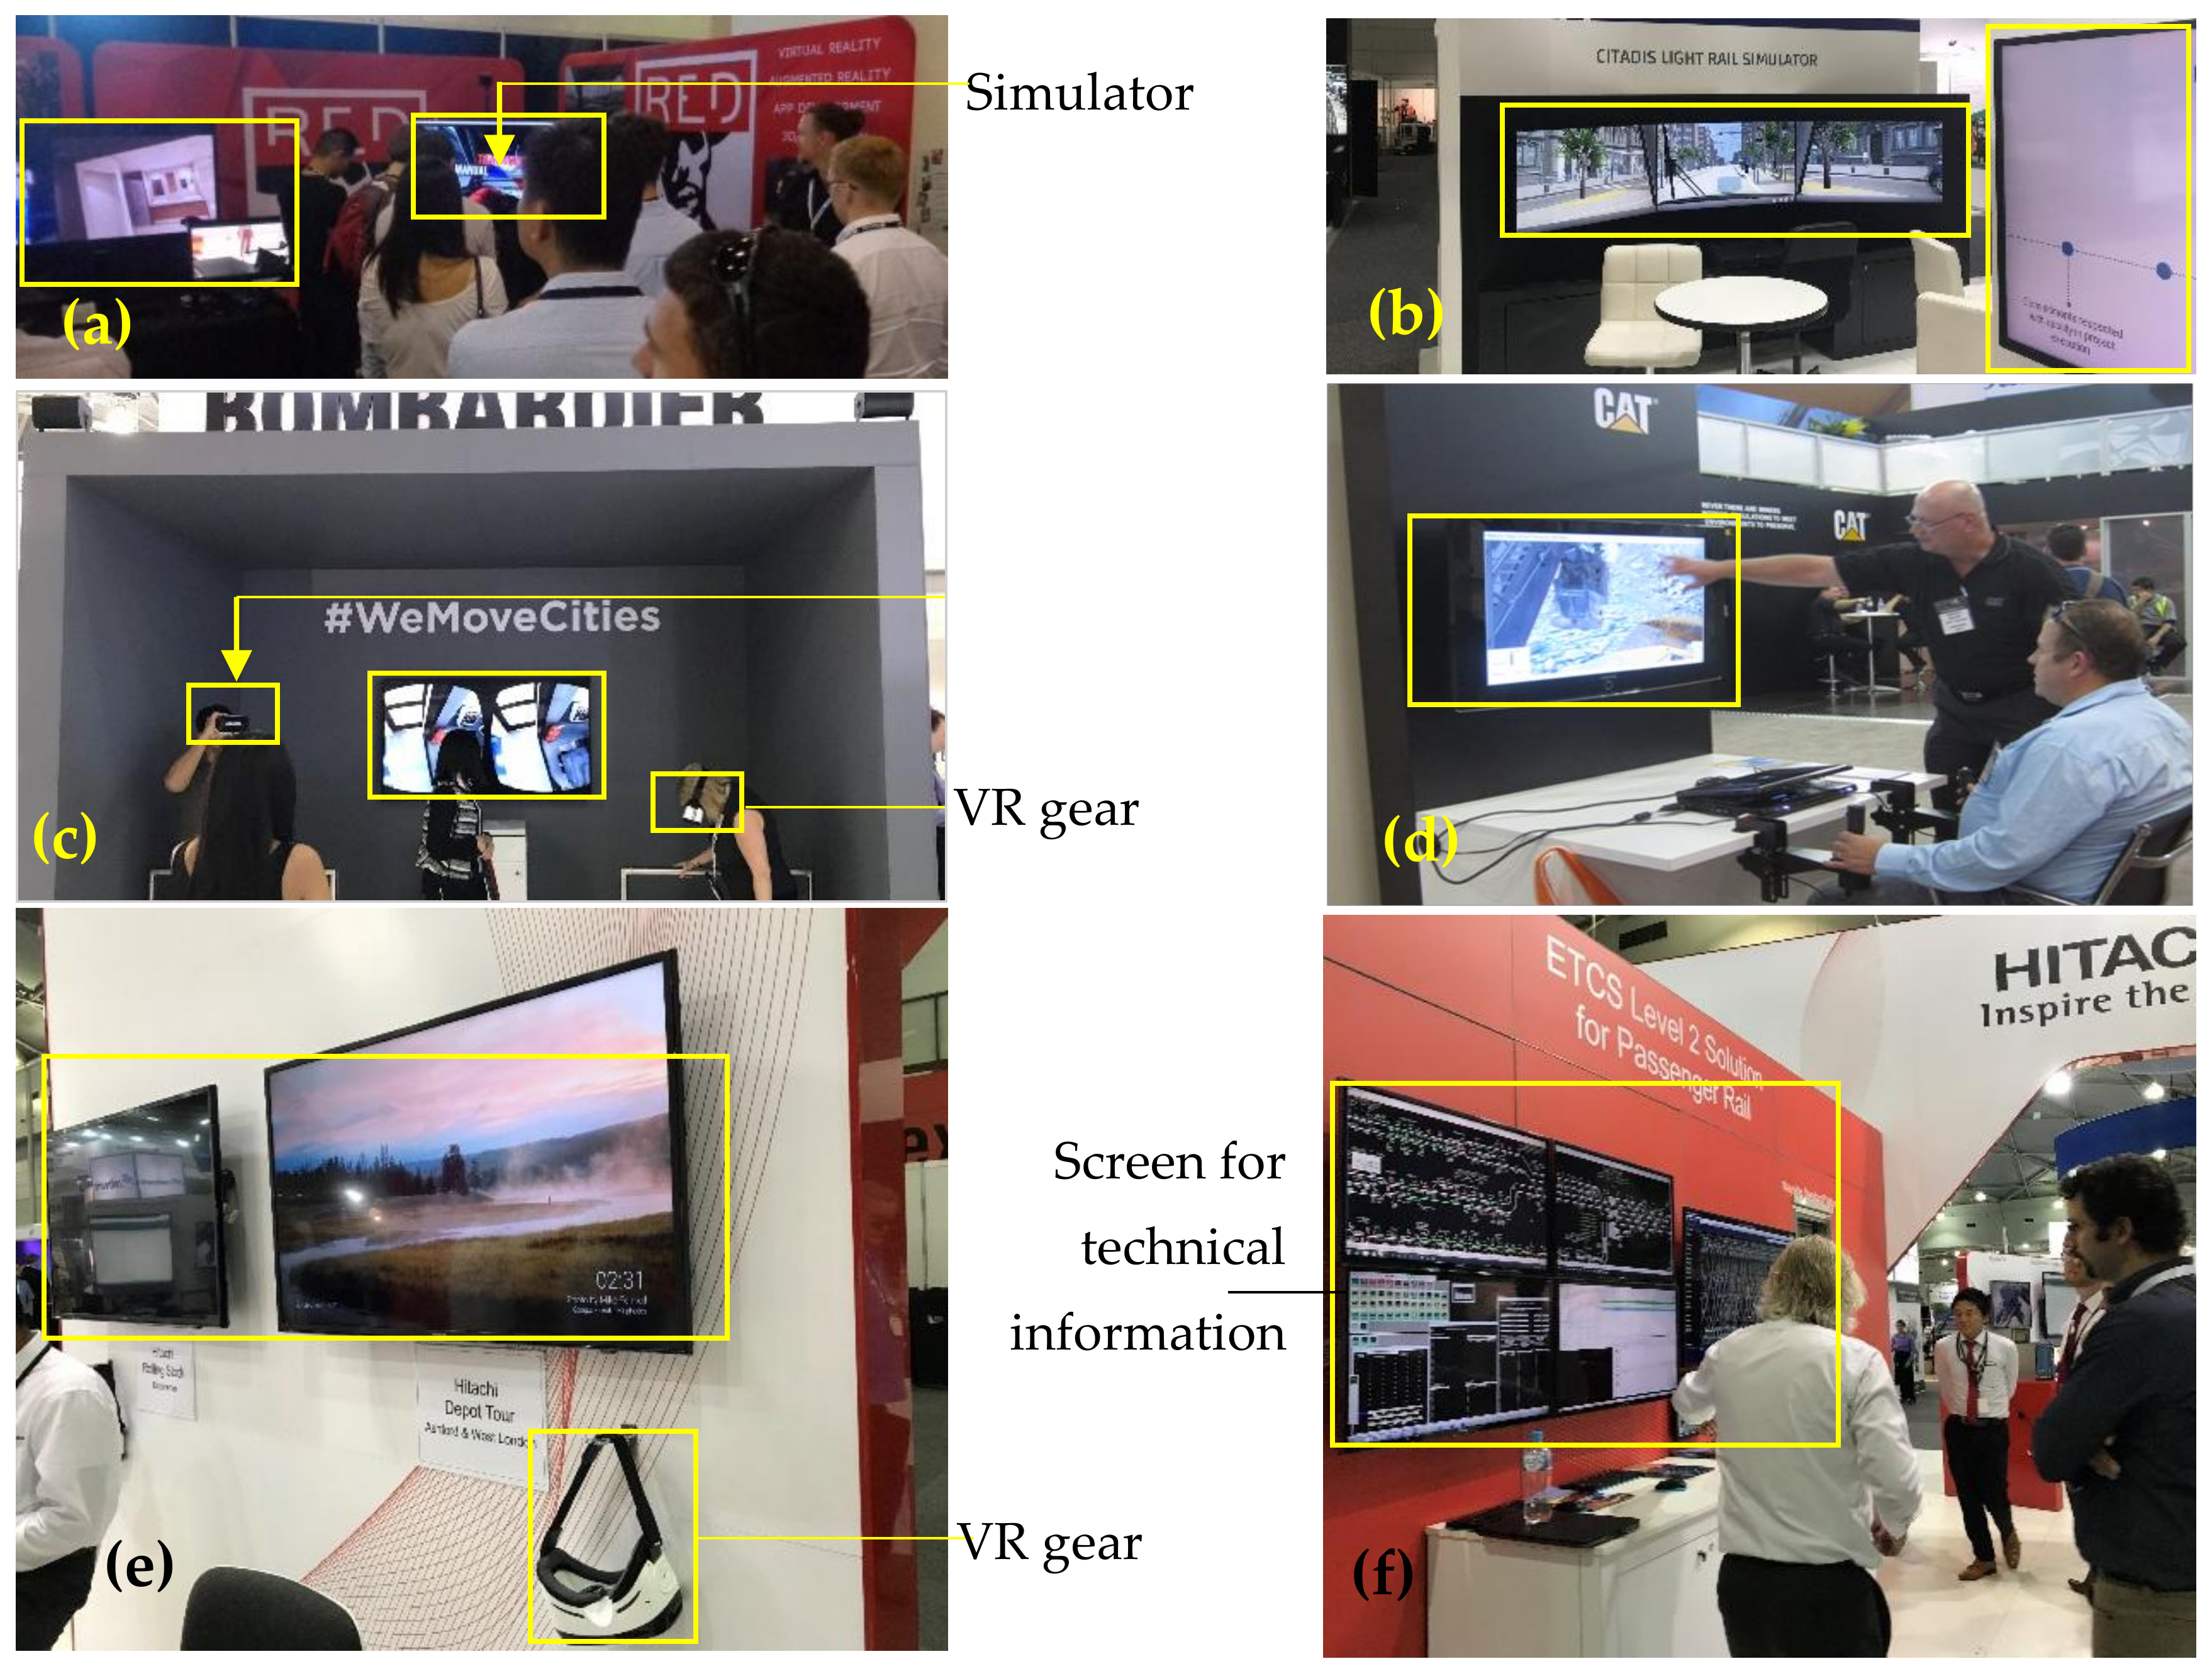
| Digital devices | LED, LCD, simulators | Simulator |
| Broad casting and web-based | Video, clips, the TE electronic or online directory, digital or online advertisement | TV, radio, and other electronic devices, internet network |
| Social events and live demonstration | Inside and out-side TEs | Invitation letters, advertisements, oral invitations and flyers |
| Sales people at booths | Oral explanation, motivational speakers, developing contacts to provide further information | Special space to chat, meeting room, VIP, extra chairs with refreshments and other attractions |
© 2019 by the authors. Licensee MDPI, Basel, Switzerland. This article is an open access article distributed under the terms and conditions of the Creative Commons Attribution (CC BY) license (http://creativecommons.org/licenses/by/4.0/).
Share and Cite
Sepasgozar, S.M.E.; Davis, S. Digital Construction Technology and Job-Site Equipment Demonstration: Modelling Relationship Strategies for Technology Adoption. Buildings 2019, 9, 158. https://doi.org/10.3390/buildings9070158
Sepasgozar SME, Davis S. Digital Construction Technology and Job-Site Equipment Demonstration: Modelling Relationship Strategies for Technology Adoption. Buildings. 2019; 9(7):158. https://doi.org/10.3390/buildings9070158
Chicago/Turabian StyleSepasgozar, Samad M. E., and Steven Davis. 2019. "Digital Construction Technology and Job-Site Equipment Demonstration: Modelling Relationship Strategies for Technology Adoption" Buildings 9, no. 7: 158. https://doi.org/10.3390/buildings9070158
APA StyleSepasgozar, S. M. E., & Davis, S. (2019). Digital Construction Technology and Job-Site Equipment Demonstration: Modelling Relationship Strategies for Technology Adoption. Buildings, 9(7), 158. https://doi.org/10.3390/buildings9070158