1. Introduction
Sustainability is nowadays a major concern in all industry sectors. The scarcity of non-renewable energy sources has been leading to a paradigm shift towards an increasing adoption of clean energy sources and searching for ways of reducing energy costs.
In buildings this concern is also present, both in the construction and operation stages. In order to reduce energy costs in a sustainable way, it is essential to control multiple indoor environmental parameters related to living comfort and healthiness of the buildings, such as thermal comfort, air quality and visual performance. Air temperature, relative humidity, CO2 concentration and illuminance level are representative examples of parameters that should be under control to comply with regulatory requirements. Nevertheless, a satisfactory control of all parameters simultaneously is not an easy task. In fact, the interactions that often occur are difficult to predict and may have additive or counteracting effects on compliance with regulatory requirements. This can be exemplified by the potential trade-off between thermal comfort and indoor air quality through the ventilation that occurs by natural means in buildings. Natural ventilation is an important facet of good building design to maintain air quality and prevent undesirable condensations. However, it is necessary to keep ventilation levels under control during the winter as the incoming air to the building is detrimental to thermal comfort in this season. In the summer this issue is not so critical as ventilation can even be used to cool the building mass and ambient air, especially at night-time.
The basic driving forces of natural ventilation are wind and buoyancy. Numerous and varied studies on natural ventilation have been conducted over the years that put in evidence those two physical mechanisms and the interaction with the thermal and energy performance of buildings. The cooling potential of night-time ventilation in the summer season to reduce energy use for thermal comfort has been demonstrated for European climates by several authors [
1,
2,
3], suggesting that passive cooling by wind-induced natural ventilation can play an important role in this respect. In fact, controlling the window opening areas and the ventilation time periods according to the indoor and outdoor conditions have been reported as efficient strategies to minimize discomfort by overheating in the Mediterranean climate context [
4,
5]. Continuing advances in numerical algorithms and energy simulation tools are enabling increasingly handling of larger models and data information. More refined analysis of the impacts of driven airflow on the building energy and thermal performance are therefore being possible, as in the case of models that account for the microclimate and urban context effects [
6]. Similar studies on the operation of natural ventilation in buildings have been carried in hot and humid climates. Full-day ventilation was found in [
7] to be a better option compared with night ventilation in case of hot-humid conditions and natural ventilation performance in residential units was shown in [
8] to be more affected by the relative position of windows than building orientation.
In the heating season ventilation based on temperature differences (by stack effect) can play a primordial role in meeting the minimum recommended level for acceptable indoor air quality. A field study on the effects of wind on the stack ventilation performance in an educational building in Central Europe showed that wind has a considerable influence on the airflow rate in the stack ventilation system that could change up to 350% [
9]. Measurements in a residential building in Central Europe as well, with multi-chimneys and pivot windows, revealed, for its part, that in the absence of wind, when there is only stack effect, the air changes per hour slightly exceeded the standard minimum value [
10].
In climates with warm summers and mild winters, as is the case of the countries bordering the southern Mediterranean, building ventilation is essentially driven by natural means, either wind or buoyancy, in contrast to northern European countries, where mechanical ventilation prevails. Natural ventilation is very difficult to predict due to uncertainties related to the variability of meteorological conditions and the occupant behavior regarding windows opening. In Mediterranean climates, the impact of natural ventilation on thermal comfort in summer in residential buildings (where there is no tradition of using active cooling) and on building energy performance in winter (associated with the heating demand to maintain comfort level), continues to be a topic with large potential for research. The present paper addresses the study on the interaction of natural ventilation with the thermal and energy performance of a housing unit in the summer and winter scenarios of a Mediterranean climate. The study is conducted through a modelling and transient simulation approach using an advanced building energy simulation tool - Energy Plus. In the simulations for the summer scenario, the study focuses on the influence of the different daily ventilation periods, the existence or absence of openings in the facades and the impact of cross-ventilation on room ventilation levels. In the simulations carried out for the heating period (winter), the study focuses on the influence of permanent openings (i.e., non-operable) in facades upon room ventilation, and the presence or absence of blowing wind on room ventilation airflows. The research is based on the case study of a dwelling unit representative of residential building typology, construction practices and actual occupancy schedule.
2. Methodology
In natural ventilation of buildings, the air flow through a building is caused by the pressures generated by wind on the building envelope (wind ventilation) and/or pressure differences generated by air density differences caused by indoors-outdoors temperature differences (ventilation by chimney or stack effect). In this type of ventilation, the admission of external air in the building is performed mainly by openings in the facades and by doors and windows. The openings in the facades can be of fixed or adjustable area, whereas the doors and windows can be operated manually or automatically by a building management system.
Wind ventilation can be distinguished between cross-ventilation and single-sided ventilation [
11]. Cross-ventilation is generated by ventilation openings on opposite sides of an enclosed space. In order to have sufficient air flow, there must be a significant wind pressure difference between the inlet and outlet openings. Single-sided ventilation refers to the ventilation generated by openings placed on the same facade. The driving forces for single-sided ventilation are relatively smaller than for cross-ventilation and highly variable.
The methodology followed in this work is based on a case study, representative of traditional building typology and construction, where natural ventilation and thermal and energy performance are analyzed through building dynamic simulation. To perform the multizone thermal and airflow analysis of the selected case study, the building energy simulation EnergyPlus tool [
12] was used, where the different modes of ventilation summarized above can be performed. The program uses the concept of thermal zone, which is an air volume where the thermal conditions can be taken as homogeneous. For calculating thermal loads, EnergyPlus employs a zone heat balance method, which operates with surface and air mass balance modules involving conduction through building elements, convection to the air, short wave radiation absorption and reflectance, and longwave radiant interchange. The energy required from virtual (
Ideal Loads Air System module) or specific HVAC systems to balance those loads and maintain thermal control set-points can also be computed and then the heating and cooling demand of the building assessed. Furthermore, an important modelling issue of the program used in this study is the ability to couple an interzonal airflow model (
AirFlow Network module) with the multizone thermal simulation model. The airflow model allows simulating wind-induced and buoyancy-induced airflows between zones in a building, as well as between the building and the outdoors. The model reduces the building to a network of pressure nodes and air flow links connecting them. The nodes are associated with building zones and building facade locations according to the wind directions. The links represent openings, such as windows, doors and cracks, as well as ventilation components like air inlets, outlets and ducts. The boundary conditions are the wind pressures on the facades and the outdoor air temperatures. By solving air mass balance equations the pressure of each node is calculated and airflow rate of each linkage is determined.
3. Case Study
For studying the natural ventilation features and its impacts on building comfort, thermal and energy performance, a housing unit was modeled and simulated through a widely used and validated building energy simulation tool - EnergyPlus - for specified summer and winter periods.
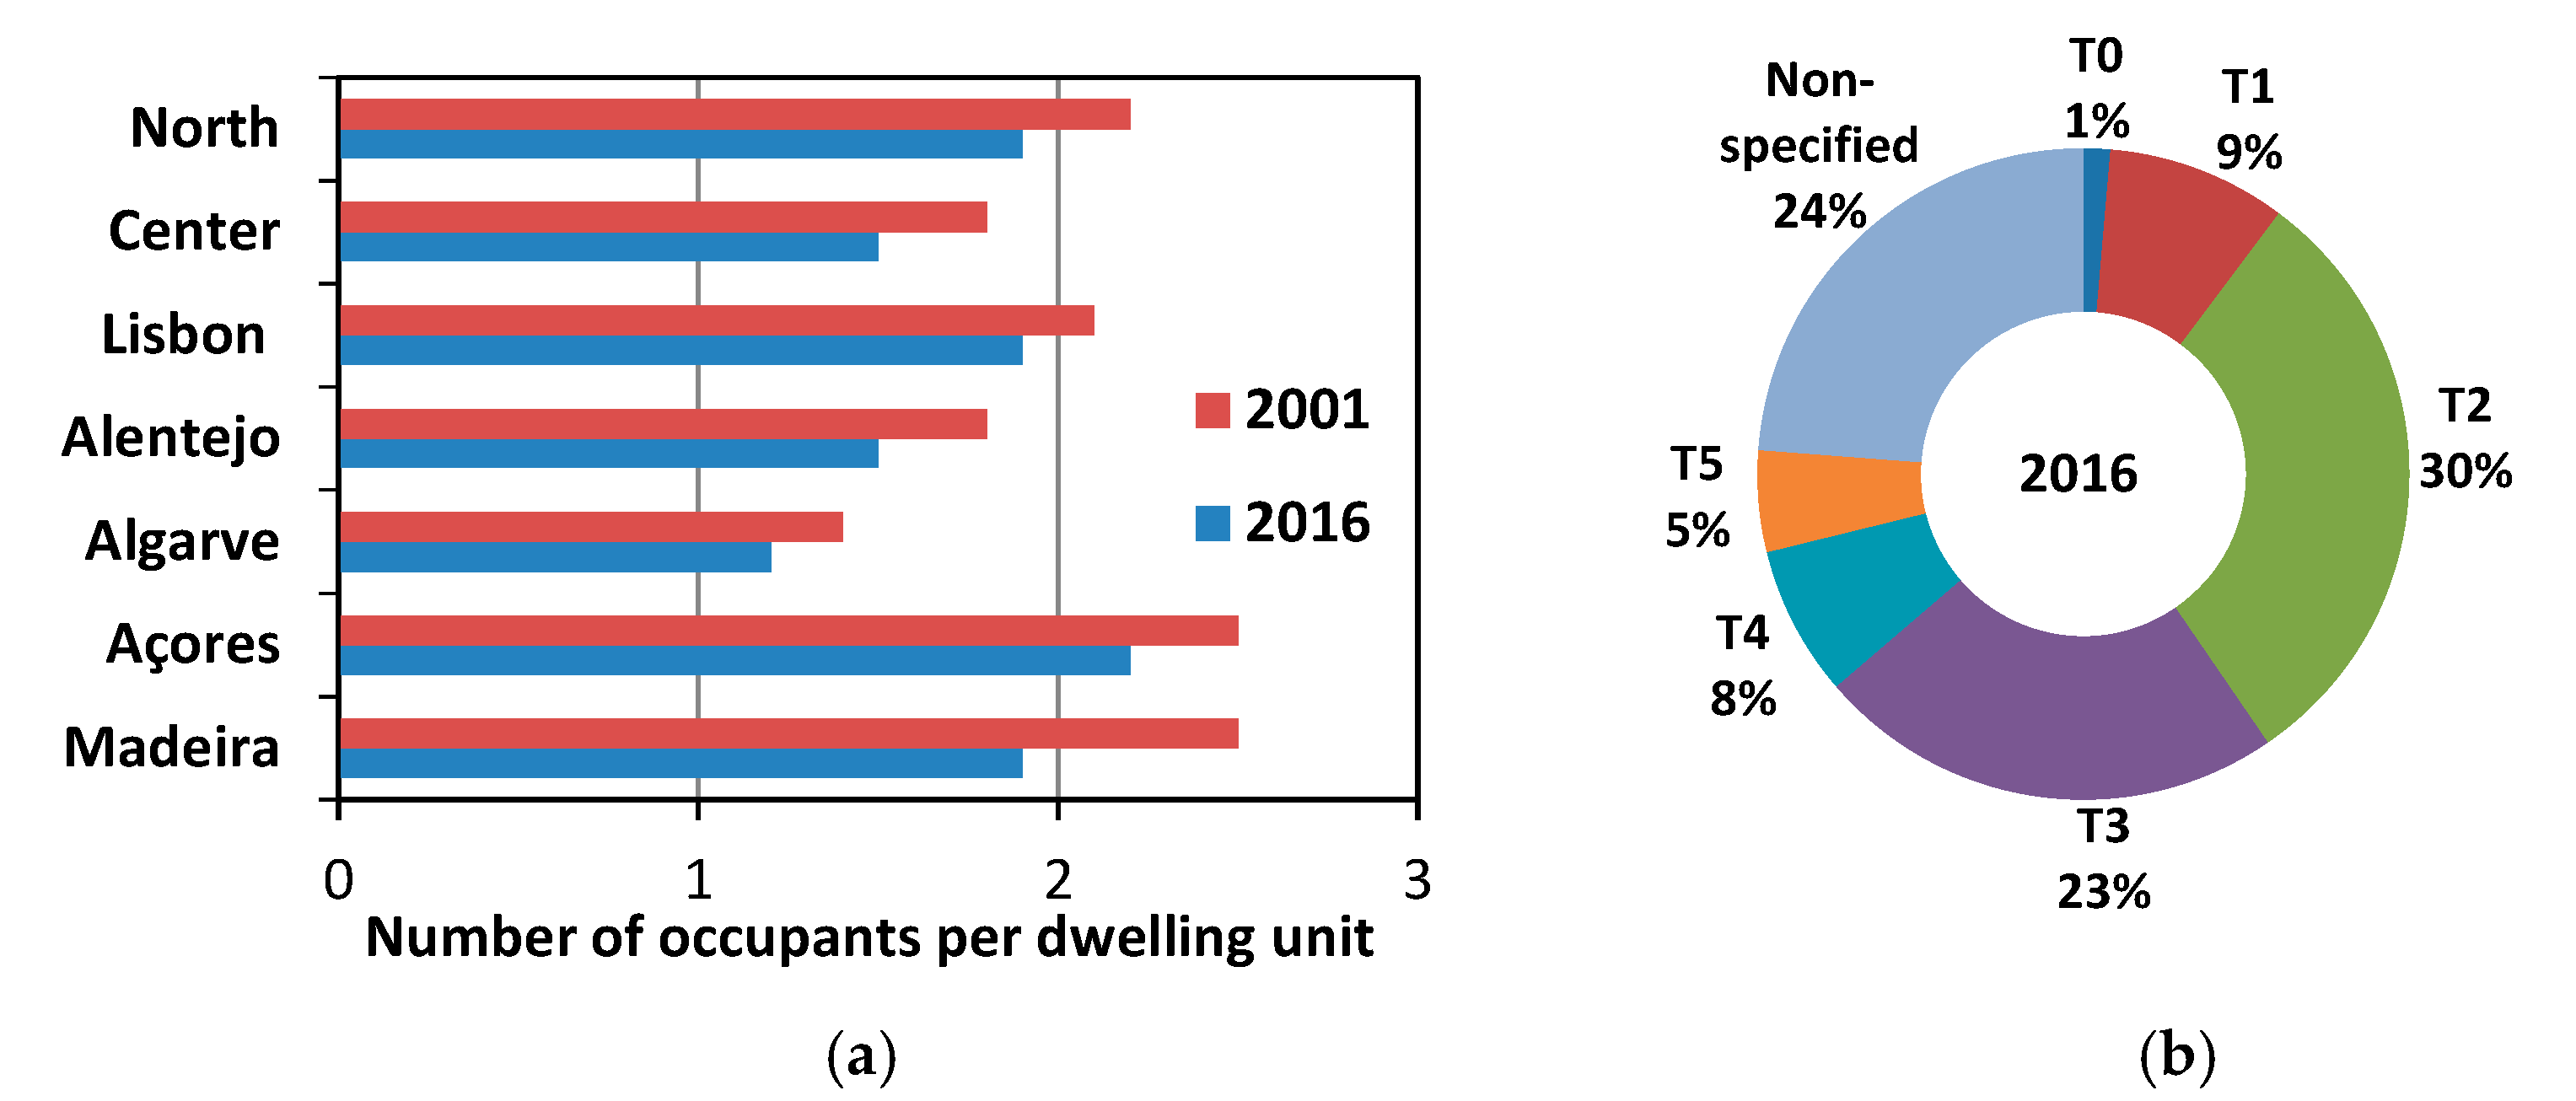
The research case study consists of a 2-bedroom dwelling (T2 typology) located in Lisbon (Portugal) on the first floor of a 5-storey residential apartment building, with glazing spans of the same size (1.5 × 1.2 m) located on two opposing facades oriented in the north and south directions. The remaining facades are oriented east and west and border two similar dwellings (one in the same building and the other in an adjacent building) which are assumed to have an indoor air temperature similar to that of the study model. The dwelling is occupied by a family of 3 people (father, mother and son). The adopted typology, based on the number of bedrooms, and housing occupation are in close accordance with statistical data of Lisbon region as showed in
Figure 1 [
13].
In
Figure 2a a plan view of the dwelling unit is showed and in
Figure 2b a perspective of the EnergyPlus model implemented in Google Sketchup is represented for a better perception of the internal partitioning and thermal envelope.
The model, as seen in
Figure 2b, has two chimneys (ducts) for natural exhaustion, located in the Kitchen and WC, with 12 m of height. They were sized according to the national standard NP 1037-1 [
14], which incorporates methodological approaches from key European standards [
15,
16]. Starting from the minimum volume airflow rates prescribed for the rooms (air intake in the main rooms and air exhaustion in the kitchen and bathroom) and considering the dwelling as a single ventilation zone, the volume flow balance between airflows entering and leaving the dwelling led to cross-sectional areas of 400 cm
2 (20 × 20 cm) and 225 cm
2 (15 × 15 cm) for the Kitchen and WC ducts, respectively. This general approach to design natural ventilation systems is very similar to other national normative documents of countries with Mediterranean-climate regions [
17,
18]. The structural elements of the dwelling unit were selected according to regular construction practice and complying with the requirements of the Portuguese Energy Performance of Residential Buildings Regulation [
19]: exterior walls are double brick (11 + 11 cm) with an air gap (7 cm) partially filled with extruded polystyrene (4 cm), floor slabs are in reinforced concrete (20 cm) and windows are double grazed units (6 + 16 + 6 mm). In
Table 1 the U-value of the construction elements is presented, together with the corresponding boundary conditions and maximum U-value prescribed in the building thermal code. The inner surface temperature of each construction element is linked to the outer surface temperature (θ
so), which is a function of the zone air temperature (θ
z) and the external air temperature (θ
e). This relationship is established by linear coefficients
c1 and
c2, which depend on the type of boundary and whose values are shown in
Table 1 for the case study concerned.
The dwelling has sliding windows and it was assumed that the opening area for ventilation purposes in the summer does not exceed 30% of total surface window area. The permanent openings in the facades for fresh air intake are located in the main rooms (Bedroom 1, Bedroom 2 and Living room). Their sizing was again performed according to the national standard NP 1037-1 [
14], which resulted in a section area of 55 cm
2 that was assigned to all permanent openings in the facades. To assess the impact of permanent ventilation openings other size values, presented in
Section 4.2, were considered to be part of the simulation study.
4. Modelling Assumptions
The present investigation is based on the coupling of thermal and airflow calculations to predict energy and thermal comfort performance in a case study of a traditional dwelling, with usual design and standard construction, modelled under EnergyPlus environment. The study covered both summer and winter climates. In the former case, the simulations are carried out in free-floating conditions, as active cooling in residential buildings is not yet a regular practice in Portugal. In the latter case the simulations are run under thermostatic control mode, with the required heating energy being accounted for. Several thermal zones were considered, one for each room of the model
Figure 2, and all the detailed information of the external construction elements (opaque and glazed) (
Table 1), the building location and orientation, along with the occupancy, equipment and electrical lighting schedules (internal heat gains), necessary to perform true-to-life simulations, were used as model inputs. Particular attention was devoted to the ducts, which work as air outlets, having been considered, as well, as independent themal zones, so that proper temperatures could be calculated and the corresponding buoyancy (stack) effect could arise.
Table 2 summarizes the heat gains from people, lights and equipment associated with each thermal zone. In case of the people, the internal gains are associated with the metabolic rate, which depend on the activity level. Concerning the lights, the power adopted is in accordance with current patterns of use in similar housing typologies. Finally, regarding the equipment, typical household appliances were considered, like computer, television, refrigerator and washing machine. Adequate weighting factors were also considered for the power distribution by the considered daily schedule.
Additional inputs to the airflow model are the flow coefficients (C
s) and exponents for cracks and closed windows and doors - required for the estimation of air infiltration rates -, the height and width of opened windows and doors and correspondent discharge coefficient (C
d) - required for the estimation of air ventilation rates - and the pressure coefficients on the exterior facades – required for estimating wind pressure. For the discharge coefficient, the theoretical value C
d = 0.61 is used and for windows, in particular, the flow coefficient considered is C
s = 1.50 × 10
–4 kg/s.m, which corresponds to a window of air-permeability Class 1, according to standard EN 12207 [
16]. Furthermore, some parameters were taken under control: window opening and degree of opening (maximum of 50% of window area) in summer, depending on the indoor and outdoor temperatures and of its difference; solar shading activation in summer, depending on the intensity of solar radiation on the window (whenever above 300 W/m
2 [
20]); space-heating energy supply, depending on indoor temperature (whenever below 18 °C [
19]).
Finally, weather data is needed to run the coupled energy and airflow simulations and which depend on the geographic region where the model is located. Dry bulb temperature, global horizontal and direct normal solar radiation, wind speed and direction, humidity and barometric pressure are the exterior environmental parameters that affect the building thermal and energy performance as well as the induced airflow rates and the corresponding internal distribution patterns. As the dwelling is located in Lisbon, the respective weather file (INETI Synthetic data for Portugal [
12]), based on hourly data, was used to perform the simulations of the proposed design alternatives described in
Section 4.2. Basic data statistics for outdoor temperature and solar radiation (taking into account only daylight hours) in Lisbon are showed in
Figure 3 and are characteristic of a Mediterranean climate according to the Köppen-Geiger classification (Csa).The summer simulation period encompasses the months of June, July, August and September whereas the winter period ranges from October 31 to May 11, according to REH [
19] guidelines.
4.1. Ventilation Strategy
The study model contemplates outside air intake openings and inside air evacuation zones with interconnections between zones in order to make air flow possible. Wind and buoyancy are the driving forces of natural ventilation. As shown in
Figure 4a, the predominant wind direction is north-south, both in the winter and in the summer, and is perpendicular to the building façades. Although the consideration of surrounding obstacles affecting the wind pressures on the building under study could be considered, this analysis was performed assuming no wind-shielding effects of neighbouring buildings, trees or relief. The ventilation strategy for the dwelling is shown in
Figure 4b, which corresponds to one of the guidance schemes proposed in [
14]. This ventilation strategy treats the dwelling as a single space with free passage of air through all rooms, with air intake in the main ones and air exhaustion in the service rooms.
Figure 4b shows the predictable air-flow paths for this ventilation mode for the case where buoyancy effects dominate over wind pressures, which may occur in winter months when indoor-outdoor temperature difference is high and windows are kept closed. Another possible ventilation design, but which is not attempted in this study, is separate ventilation, in which ventilation is performed separately by independent sectors, involving one or more rooms, with both air intake and air exhaust existing in each sector.
In the summer period the outside air in the base model enters through the windows (operable openings) and permanent openings (non-operable openings) integrated in the facades for ventilation purposes. Windows and openings are installed in the facade walls of Bedroom 1, Bedroom 2 and Living Room, while in the Kitchen facade only a window exists, according to the ventilation strategy followed, which do not consider air intake from outside in service rooms. The Hall acts as a passageway for the air that comes from the main rooms (Room 1, Room 2 and Living Room) and is distributed to the Kitchen and WC. In the service rooms (Kitchen and WC) a duct is installed to perform air exhaustion (
Figure 2b and
Figure 4b).
In the winter period, windows are supposed to be kept closed, for thermal comfort reasons, and the outside air enters the base model only through infiltration from window joints and permanent openings in the façade walls, as in this case ventilation should only be used to provide the required minimum ambient air change. As for the summer period, the Hall works as the passageway of air that comes from the main rooms (Bedroom 1, Bedroom 2 and Living room) and disperses into the Kitchen and WC. Air exhaust is performed in the service rooms (Kitchen and WC) through the ducts there installed (
Figure 2b and
Figure 4b).
4.2. Simulations Framework
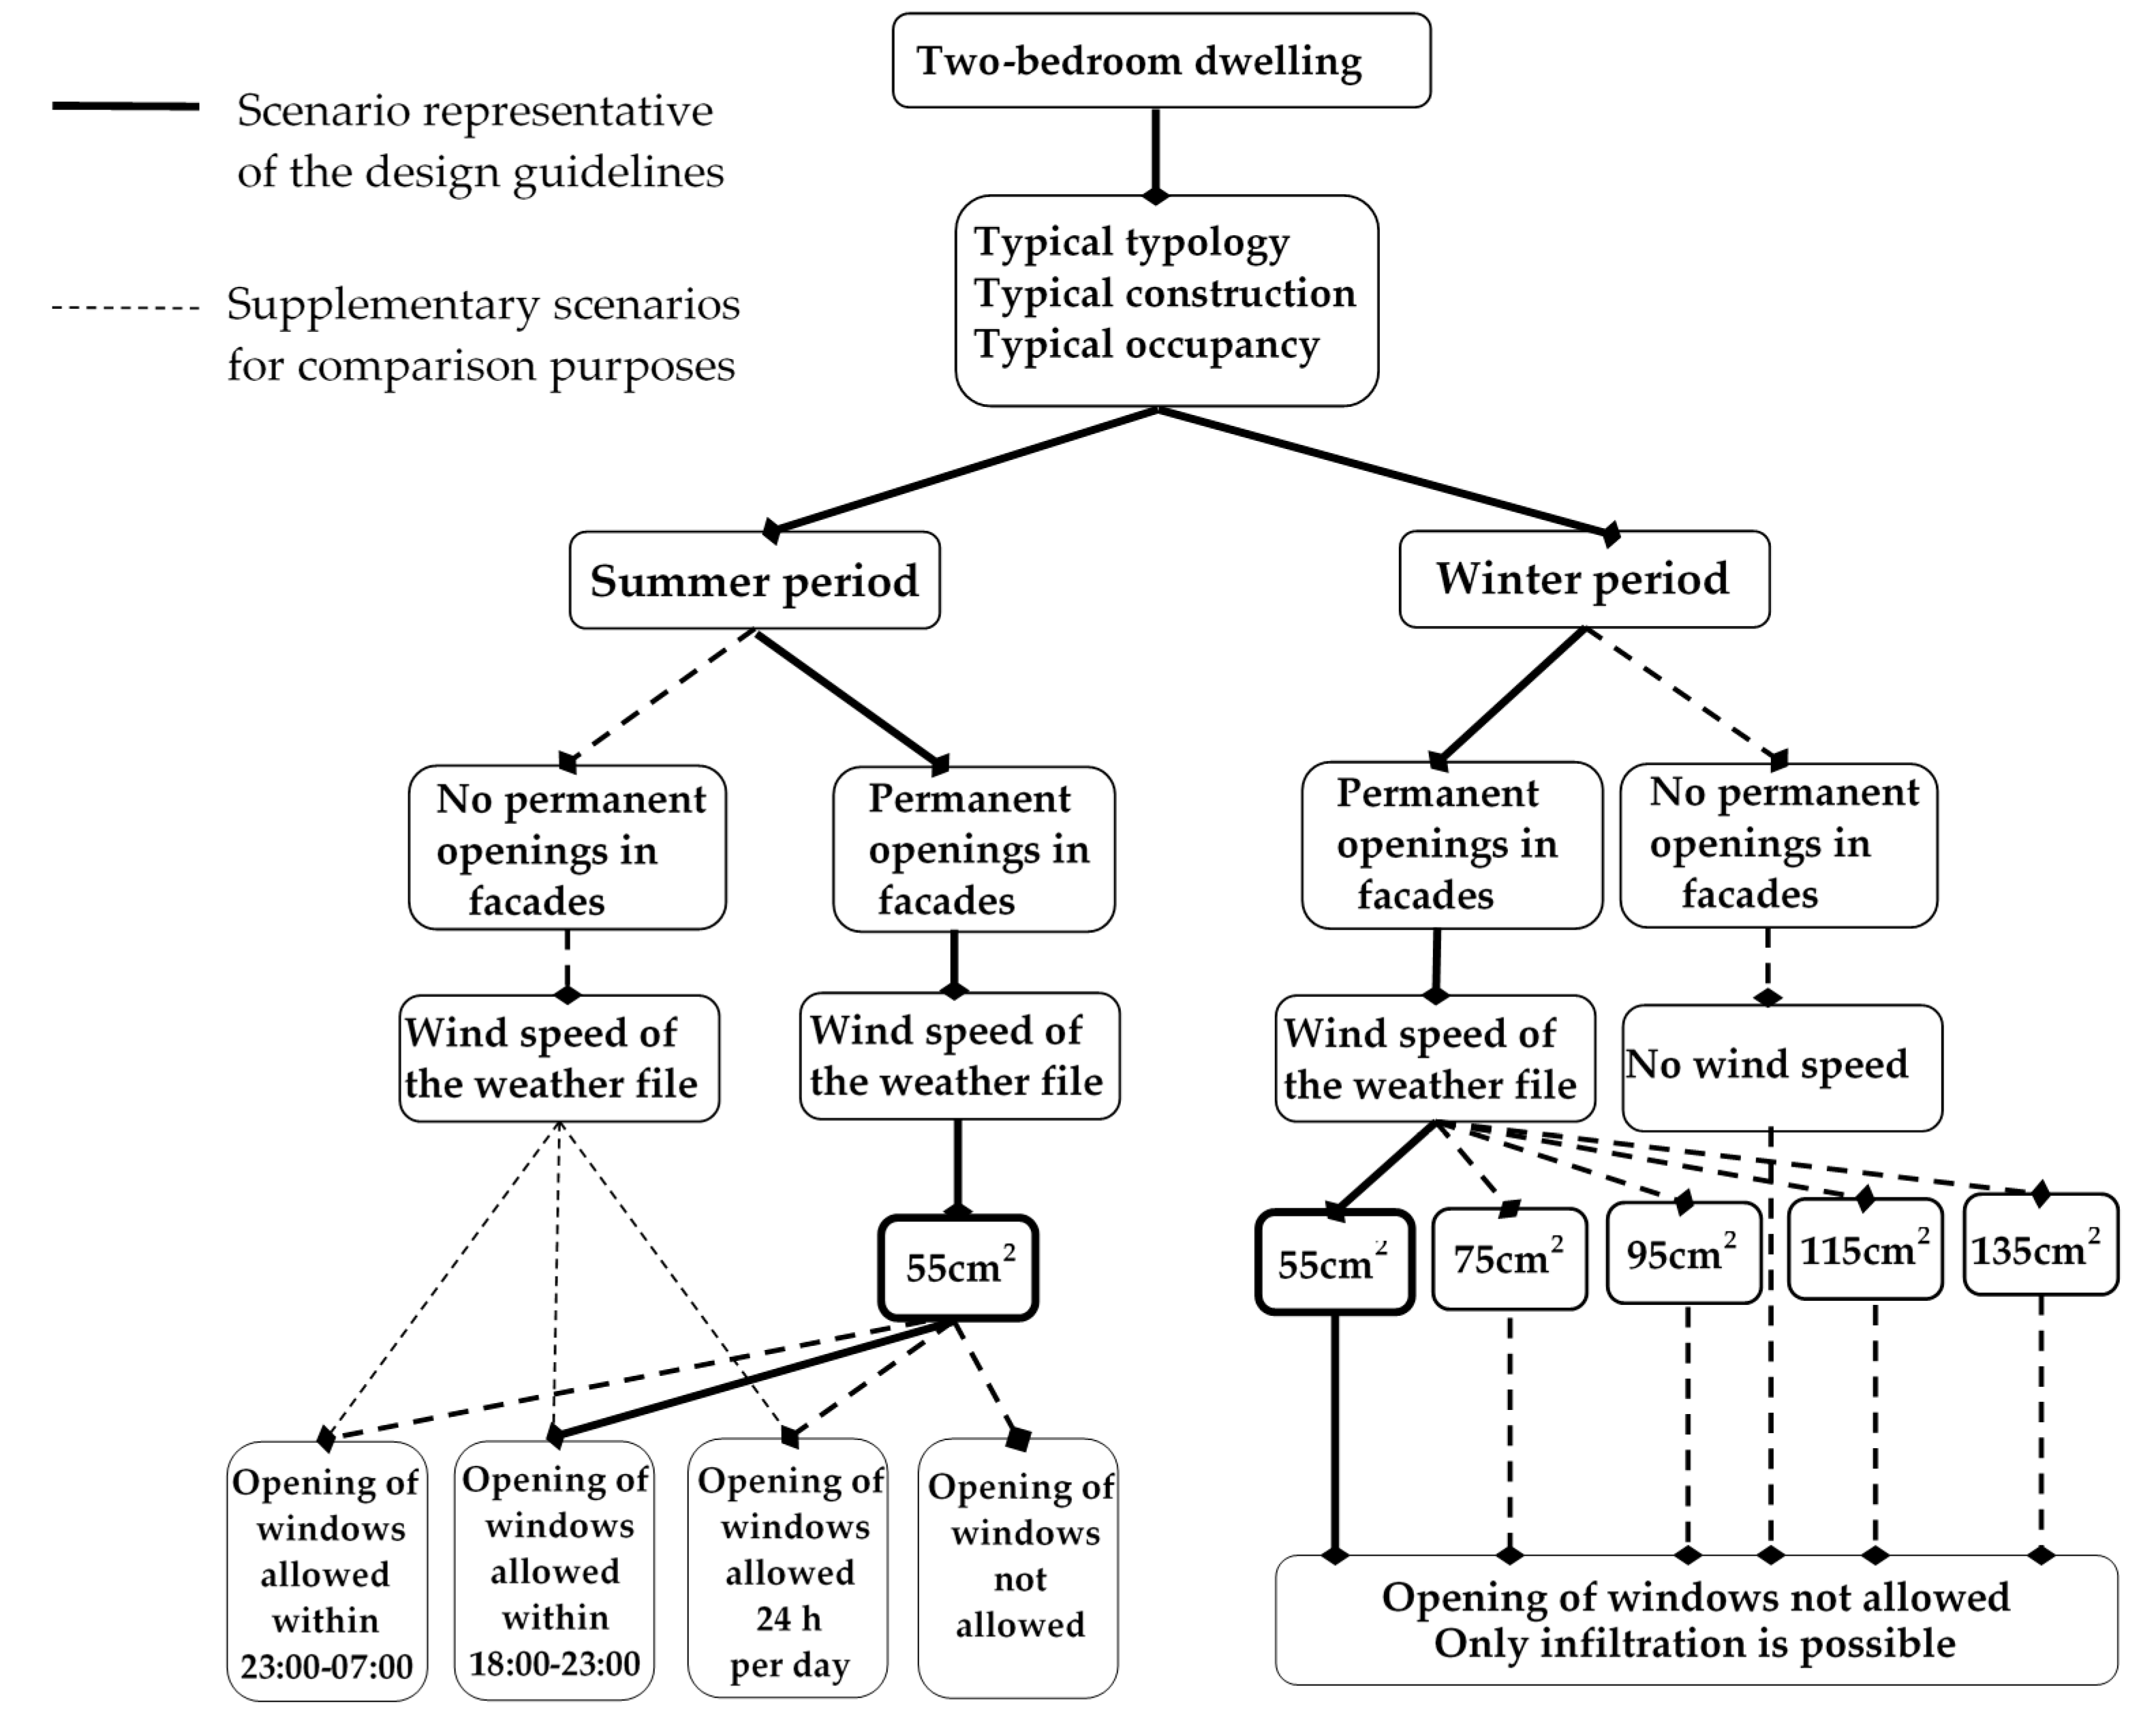
In the summer period it was assumed no air conditioning is used to cool the dwelling unit and that the opening of windows, for ventilation with thermal comfort purposes, is dependent on the inside and outside air temperature levels. Windows are opened whenever the indoor temperature exceeds 25 °C (summer reference comfort temperature) and is higher than outdoor temperature, with the effective ventilation area depending on the indoor-outdoor temperature difference but never exceeding 30% of total window area. The daily periods in which windows are allowed to be opened are also defined in the simulations with the aim to study the impacts on thermal comfort and identify which are the more favorable ones. Two groups of simulations were carried out for the summer period. In the first group the simulations are performed with permanent ventilation openings in the facades (55 cm2 each, corresponding to the design value), while in the second group these openings are absent to assess the differences between results. Three simulations are performed for each group, differentiated by the windows opening schedule: 00:00–07:00, 18:00–23:00 or 24 h per day. Windows are open in these periods for thermal comfort only if the outdoor temperature is helpful. For the first group there will be an extra simulation in which windows do not open at any hour of the day.
For the winter period, where heating energy is supplied whenever the indoor temperature is lower than 18 °C (winter reference comfort temperature), two groups of simulations are performed: in the first group, the aforementioned permanent openings are placed on the exterior walls of the main rooms, while in the second group these openings are absent (this group has only one simulation).
The simulations carried out with openings in the exterior walls are divided into two groups that differ from each other only in terms of the Weather File used. One simulation group is carried out with the original file of the Lisbon city. The other group of simulations uses the same Weather File, but assuming a wind speed of zero throughout the entire simulation period. Each of the groups has five different simulations in which the area of permanent openings for ventilation in the exterior walls varies: 55 cm
2, 75 cm
2, 95 cm
2, 115 cm
2 and 135 cm
2.
Figure 5 illustrates the simulation scenarios used in this study for the summer and winter periods, respectively.
5. Results and Discussion
5.1. Summer Period
In the summer period, a set of simulations covering the scenarios of windows opening shown in
Figure 5 was carried out. The maximum opening area allowed for ventilation is assumed to be 30% of the total glazing area, as mentioned previously. Some indicators were used to compare the different scenarios simulated. The first indicator is the
Average number of air changes per hour (ACH) over a given time period. The second indicator, which is related to the first one, is the percentage of hours in a given time period in which the air changes per hour for a certain room are above the design value (
Percentage of hours with ACH number above the design value - PHAD). The design values are defined in standard NP 1037-1 [
14] as being equal to 1 ACH for the main rooms and 4 ACH for the service rooms. The third indicator is the
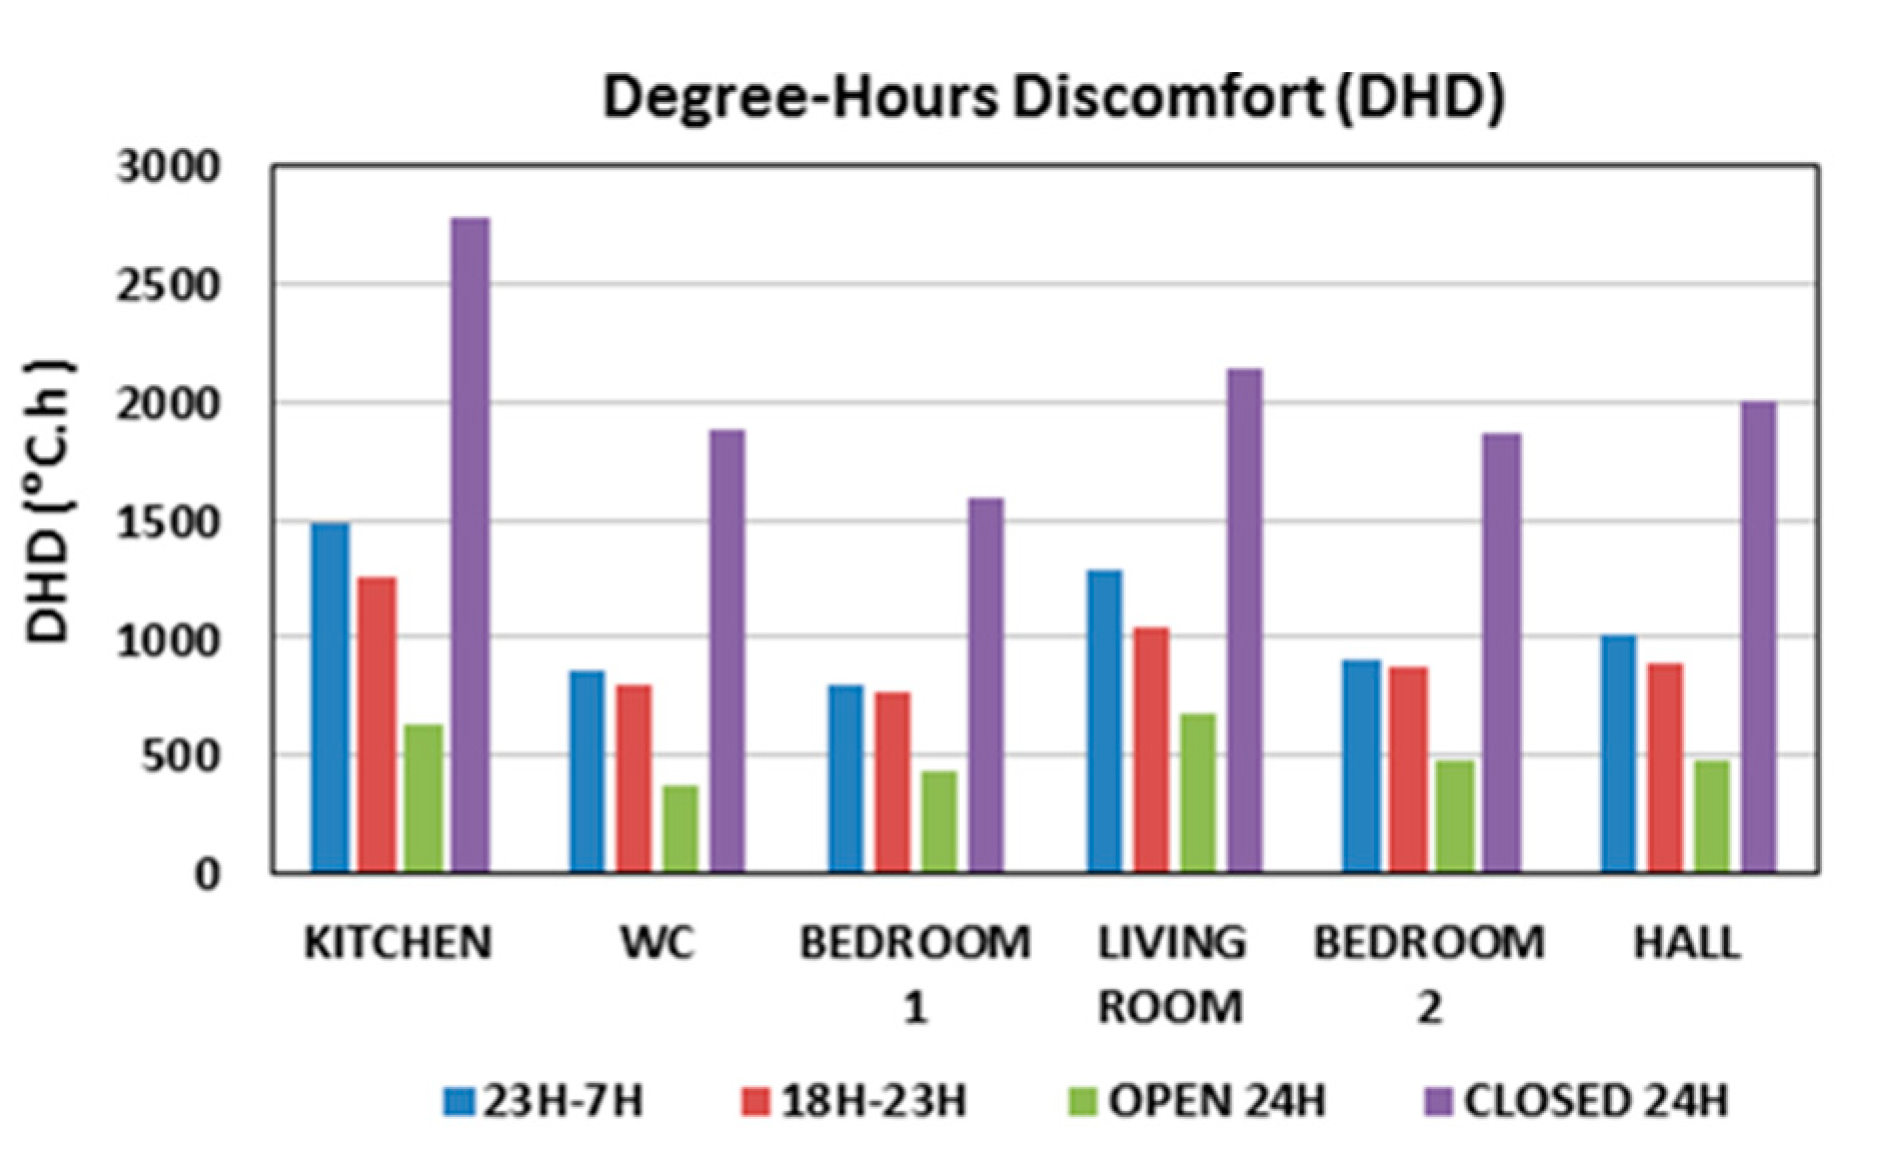
Degree-Hours Discomfort (DHD) from overheating, which provides a measure of the building thermal performance and indoor thermal comfort conditions. It is defined as the sum, over a certain time period, of the positive difference of the observed hourly indoor temperature and the conventional summer indoor comfort temperature (25 °C). Higher DHDs correspond to lower thermal performance and lower indoor comfort conditions in the building.
5.1.1. Results for Permanent Ventilation Openings in the Facades
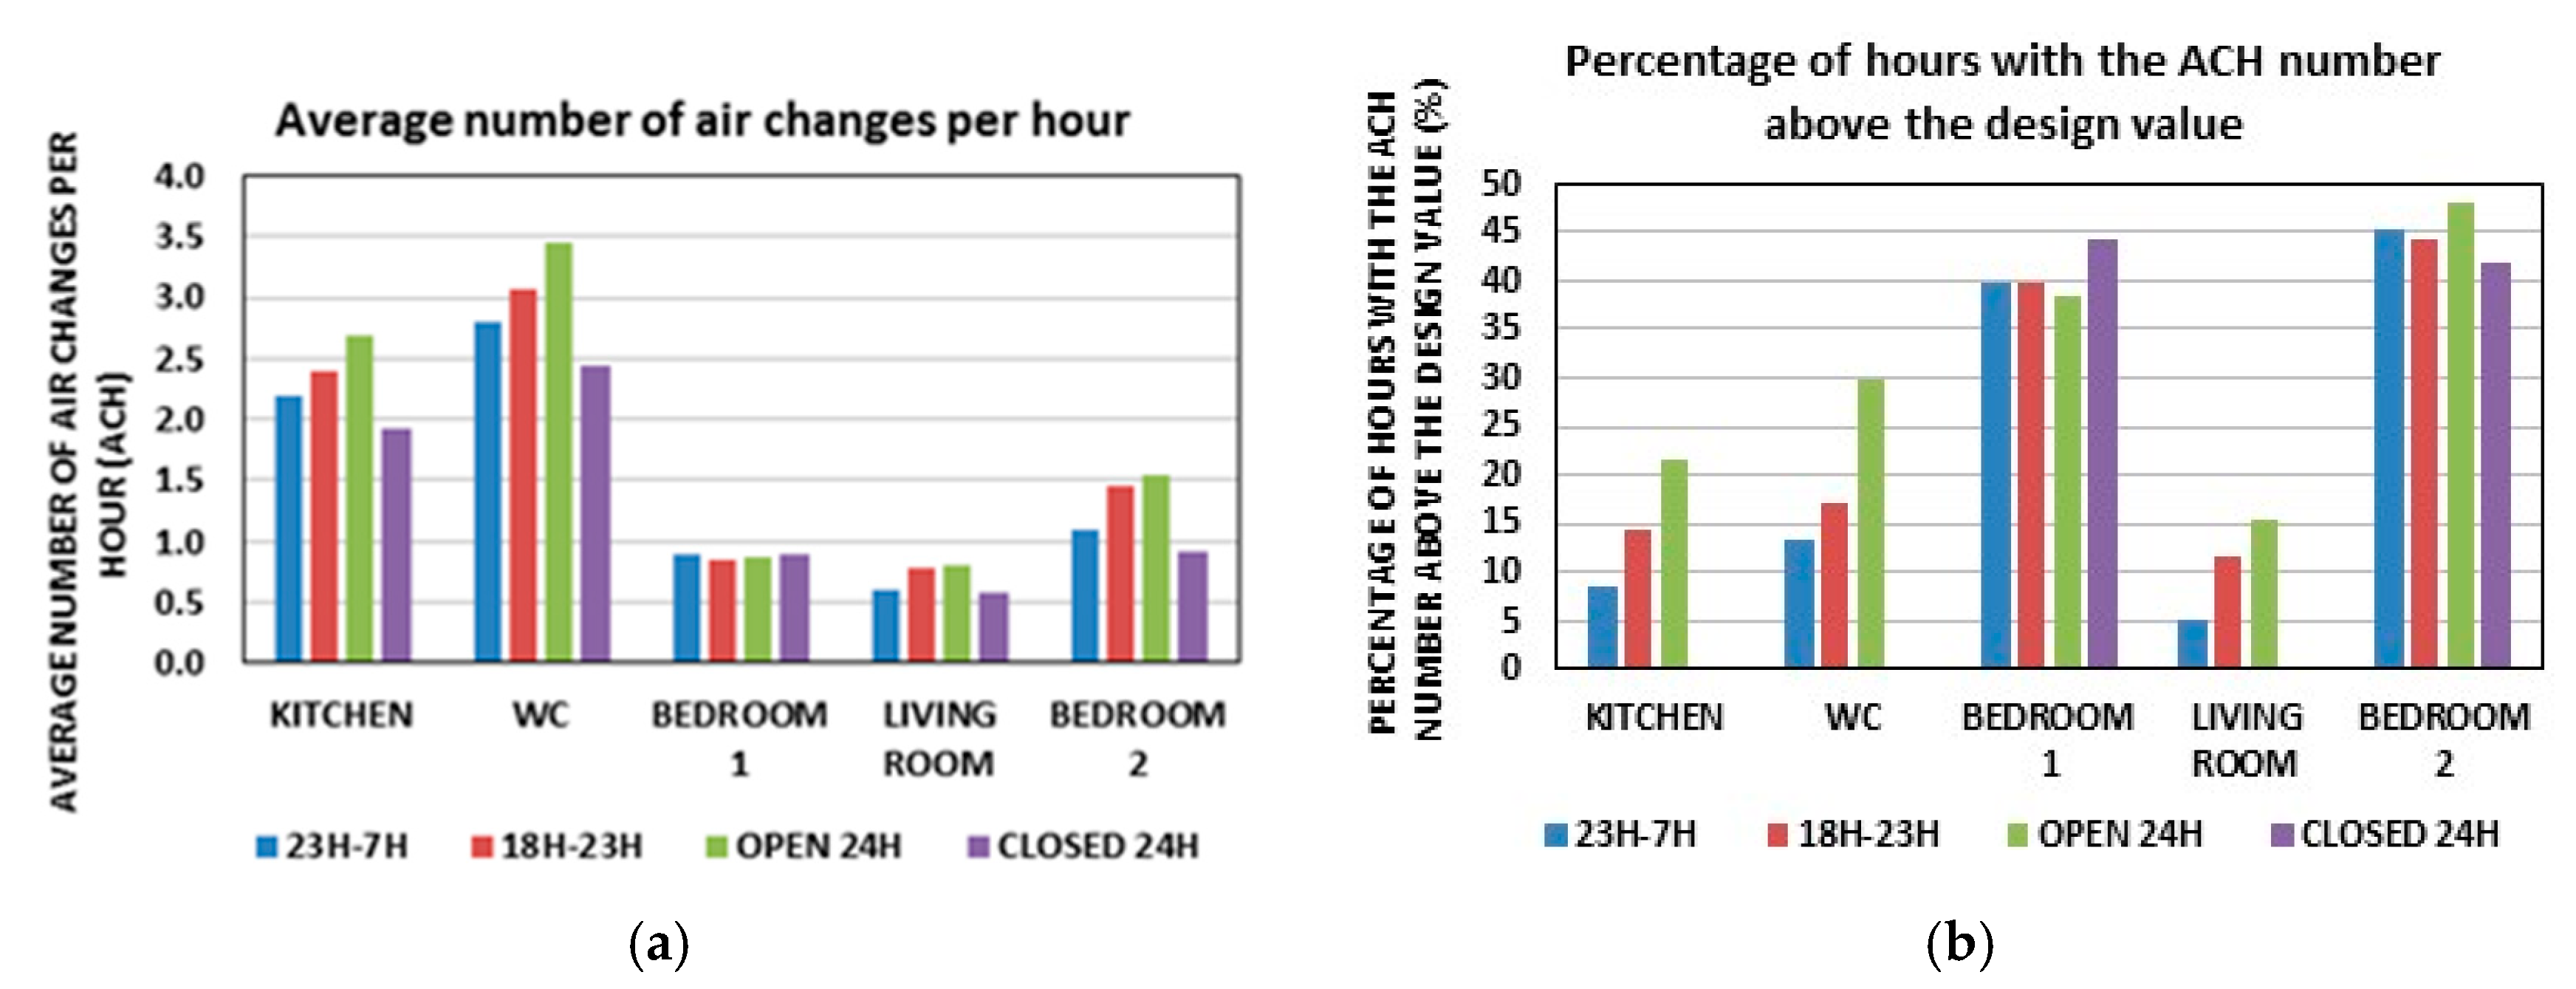
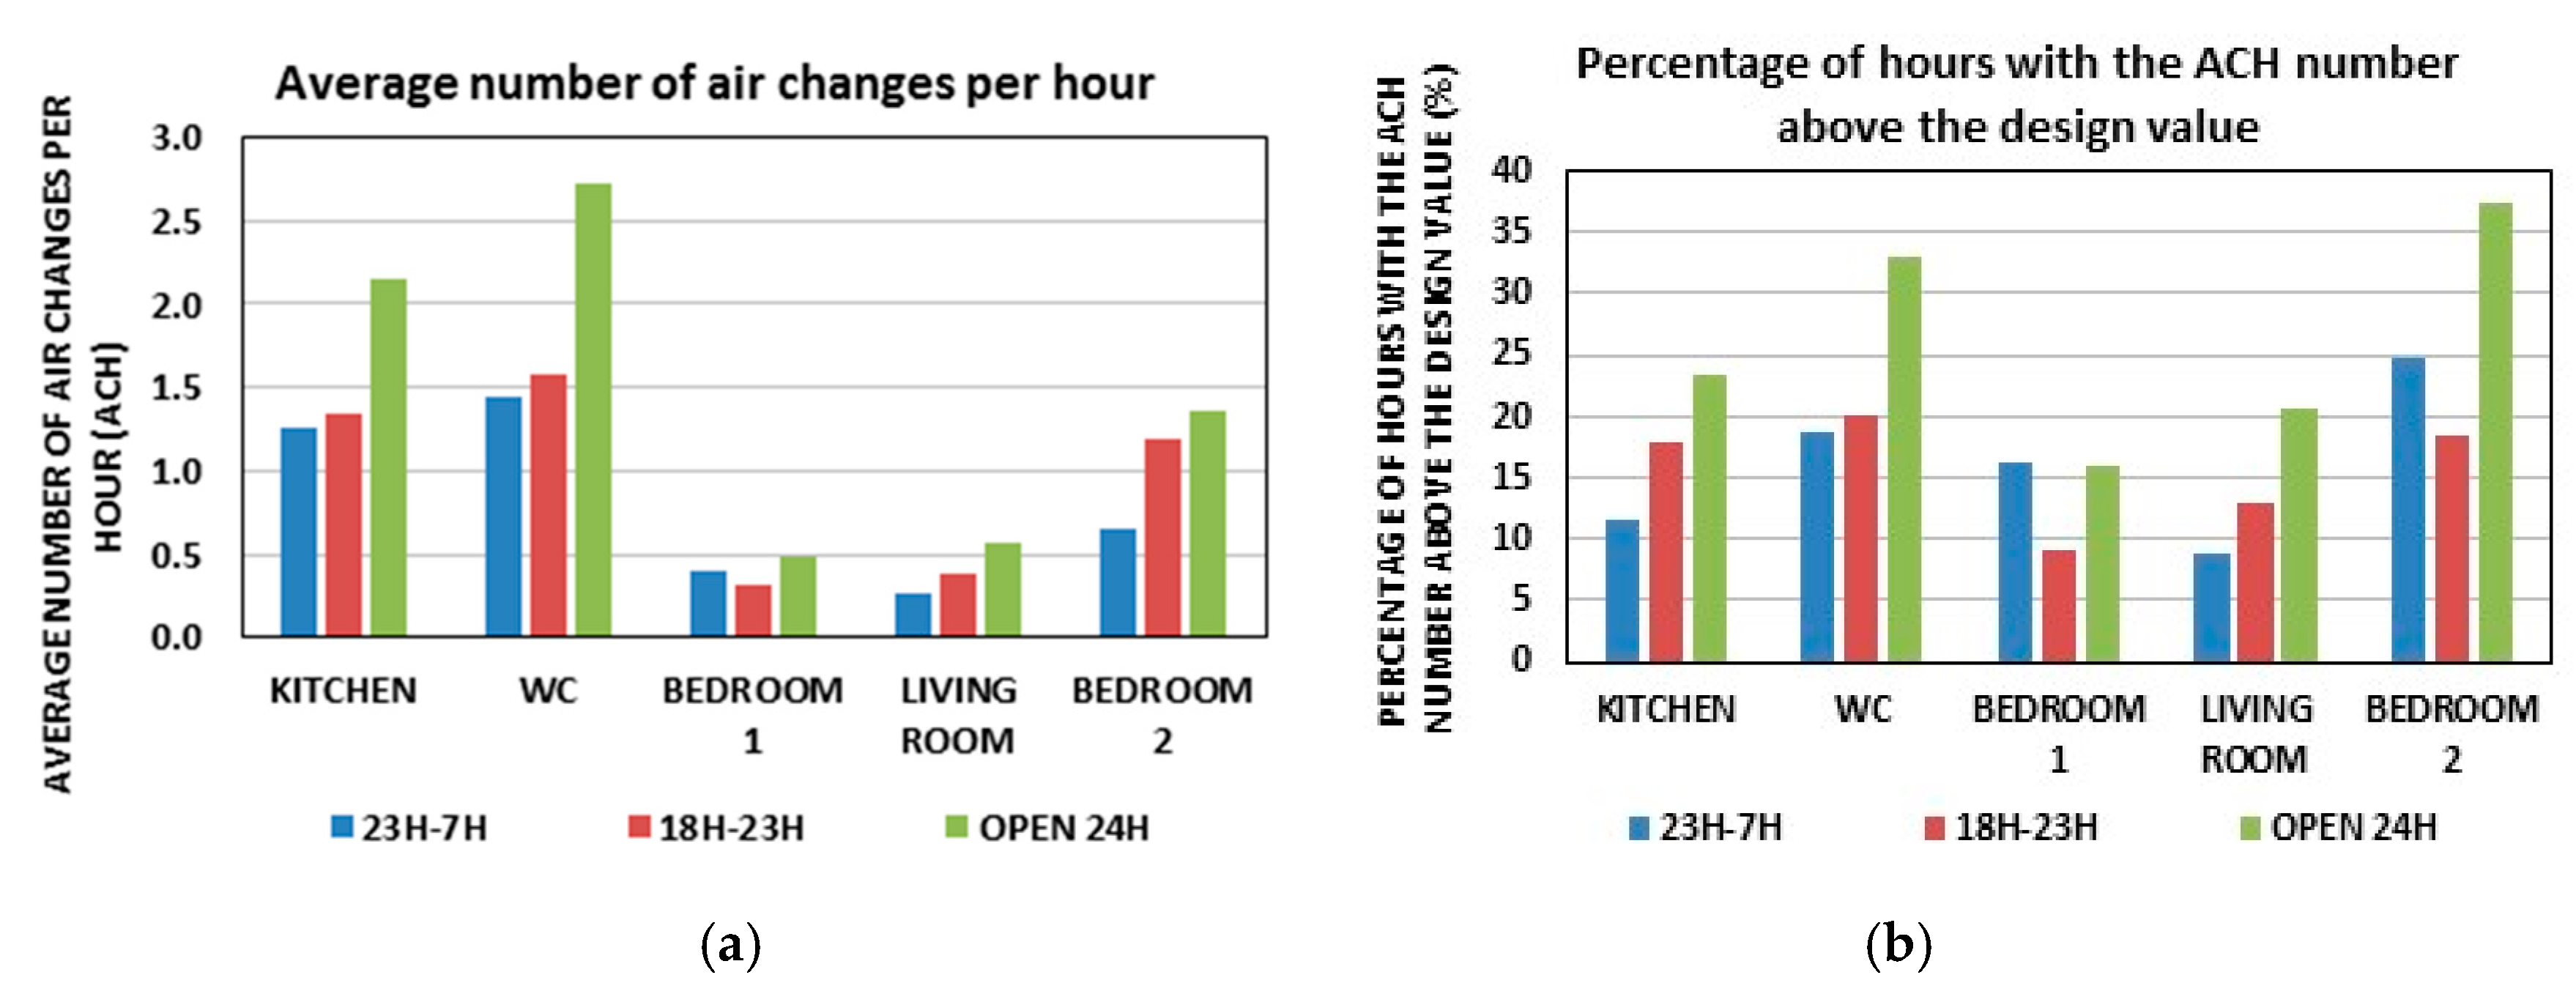
The simulation results in terms of the abovementioned indicators are shown in
Figure 6 and
Figure 7 for the scenario of using permanent openings for ventilation in the facades. The results show that the simulation performed with windows opened during 24 hours per day provides the best results for all indicators, followed by the simulations with permission to open in the periods 18:00–23:00 and 23:00–07:00, respectively. It should be emphasized that ventilation through windows in the periods for which it is allowed only happens when the previously described opening control conditions are satisfied. It is observed from
Figure 6 that service rooms (Kitchen and WC) present the higher ACH numbers, although they not achieve, on average, the prescribed design values. The bedrooms are the divisions that more satisfactorily approach the intended air change rates. As natural ventilation has an inherent stochastic nature, the analysis has to be made in statistical terms.
Figure 6b) shows that air change rates of bedrooms exceed the design value in approximately 50% of the time. These results are in agreement with those of
Figure 6a), which show that air change rates of bedrooms approach, on average, the design value.
The simulation performed with windows permanently closed provides the most unfavorable results for all the indicators, since the infiltration that occurs through the window frames does not yield, on its own, satisfactory thermal and energy results. Evidence of this is the considerable growing of DHD when windows do not open all day (
Figure 7), indicating poor thermal conditions when compared to the cases with windows opening allowed. This fact evidences the strong relationship of thermal comfort with ventilation and that in summer ventilation is desirable to decrease overheating occurrences.
5.1.2. Results for Non-permanent Ventilation Openings in the Facades
Figure 8 and
Figure 9 show the results for the simulations performed for the scenario without permanent ventilation openings in the facades. As in the previous case, the simulation in which windows opening is allowed 24 h per day provides the best results for all the above described indicators. As would be expected, ACH and PHAD are lower in this scenario than in the previous one, since the contribution of the permanent openings for ventilation is not accounted for in this case. Bedroom 2 presents a higher ACH number than Bedroom 1 and Living room, essentially because wind blows preferentially from north (
Figure 4a) and thus directly affect rooms facing this direction. Both in the cases of facades with or without ventilation openings, air change rates present in general higher average values for the period 18:00–23:00 than for 23:00–07:00, which is due to the higher percentage of time (see
Table 3 below) that windows remain open to cool indoor temperature in that period. In fact, it is in the late afternoon and evening that the heat stored in the building mass during the day is released back into the rooms, raising the indoor temperature up to values that can exceed the acceptable comfort limit. In addition, this is the period in which the internal gains have maximum values (
Table 2). Despite the higher ACH, the comfort conditions in the period 18:00–23:00 are lower than those in the period 23:00–07:00, as the DHD number of
Figure 7 and
Figure 9 indicate. This shows that the first period is more critical from this point of view than the second one. The difference in DHD between 18:00–23:00 and 23:00–07:00 periods is more evident when there is no permanent ventilation. This denotes the contribution of permanent ventilation to alignment thermal comfort conditions irrespectively of the ventilation periods of windows. When permanent ventilation openings are not provided, which is the case of a large share of the Portuguese existing buildings, night ventilation through windows is a key factor in reducing thermal discomfort. In this case,
Figure 9 shows that the 23:00–07:00 ventilation period is more effective than the 18:00–23:00 one.
5.1.3. Influence of the Permanent Openings for Ventilation in the Facades
When comparing the set of simulations with and without permanent ventilation openings in facades, it is noticed that simulations with openings show higher values of ACH than the ones without. When windows are opened for comfort reasons, the influence of the permanent openings on the average ACH number is negligible due to the great difference in effective ventilation area (0.55 cm
2/opening) when compared to a window (maximum up to 30% of the area - 0.54 m
2/window). Nevertheless, when windows remain closed a continuing ventilation of the rooms through the facade openings occurs, contributing to a general increase in the ACH number. When openings are present in the facades, ventilation runs continuously and consequently fewer occasions of indoor overheating occur in the summer period, as the DHD numbers of
Figure 7 indicate, when compared to those of the simulated cases without ventilation openings (
Figure 9).
5.1.4. Cross-Ventilation
For investigating the prevalence of cross-ventilation in the dwelling, i.e., ventilation through windows placed in opposite facades, the set of simulations without permanent ventilation openings in facades was analyzed. By observing the percentage of hours per day in which there is outflow of air through the windows (
Table 3), it is noticed that cross-ventilation occurs mostly in the north-south direction, which corresponds to the preferential wind direction.
The percentage of time that windows are open is much greater for the rooms with South exposure—Bedroom 1 and Living room—than for the north facing rooms—Bedroom 2 and Kitchen. The higher solar radiation incidence on the South façade, compared to the north façade, results in higher temperatures in the adjacent rooms, which consequently causes windows to be opened for a greater percentage of hours to drop temperature below 25 °C. From
Table 3 and
Table 4 it is found that the air is mostly evacuated through the chimneys, since they are permanently open, which is not the case of the windows. Given the small difference between outdoor-indoor temperatures in the summer the exhaustion of air through the chimneys in this period is essentially due to the depression caused by wind on the top of the roof, where ducts end.
5.2. Winter Period
Four indicators are used to characterize the simulation results in the winter period. The first two indicators are similar to those used for the summer period: the Average number of air changes per hour (ACH) and the Percentage of hours with the ACH number above the design value (PHAD).
The third indicator used in this period is the
Heating energy needs to maintain the dwelling temperature above the minimum comfort limit of 18 °C in each room during the winter period. The fourth indicator is the percentage of hours in which the air changes for each room are above a minimum value of 0.6 ACH [
19] (
Percentage of hours with the ACH number above the minimum value - PHAM). In fact, although the admission of fresh air through air inlets in winter increases the heating energy costs, a minimum air change is recommended to ensure air quality and reduce condensation risks.
5.2.1. Results for Non-Permanent Ventilation Openings in the Facades
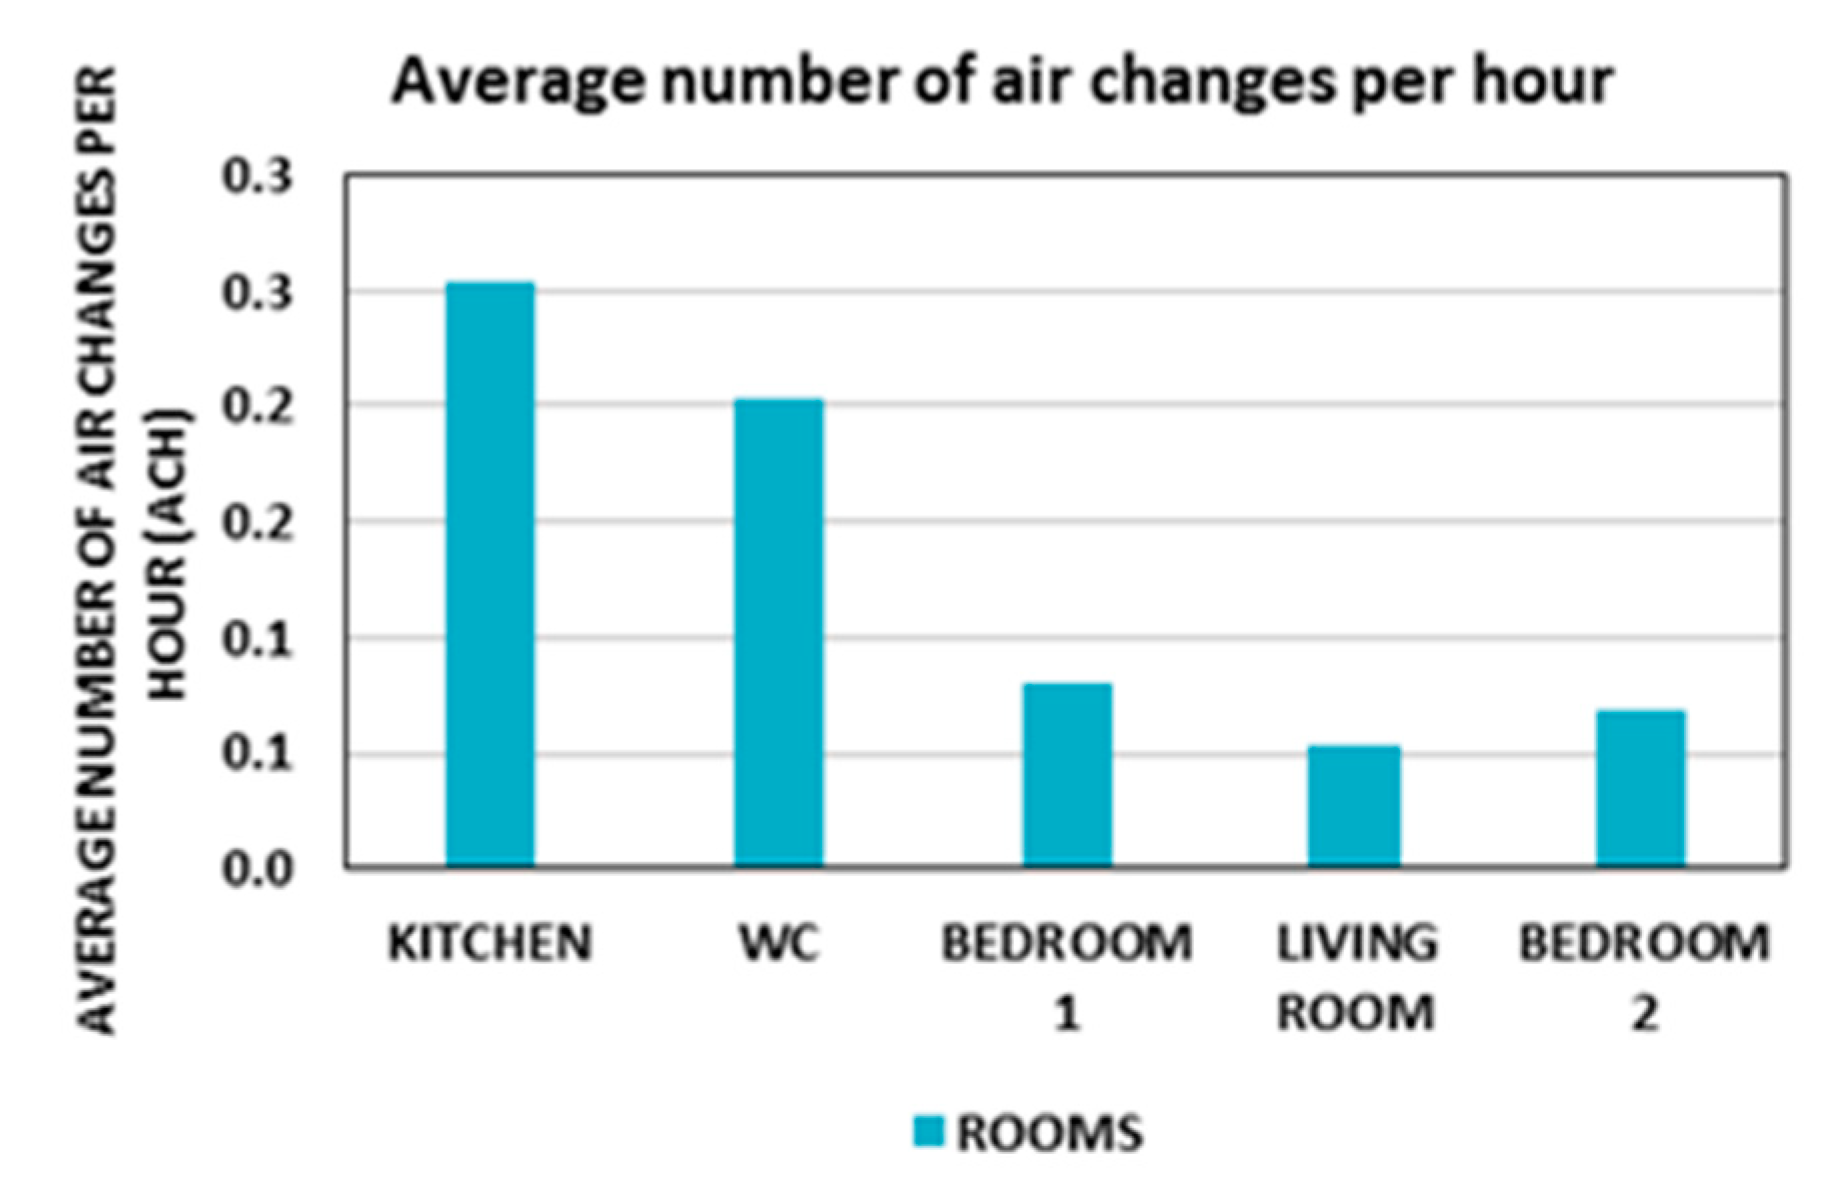
For the simulation performed without permanent openings in the facades, the results show that only residual ventilation of rooms occurs, originated by air infiltration through the window frames (
Figure 10). The resulting average air change rates (ACH) are all below the recommended minimum. This causes PHAD and PHAM to be zero and the energy needs to as low as 120 kWh [
21].
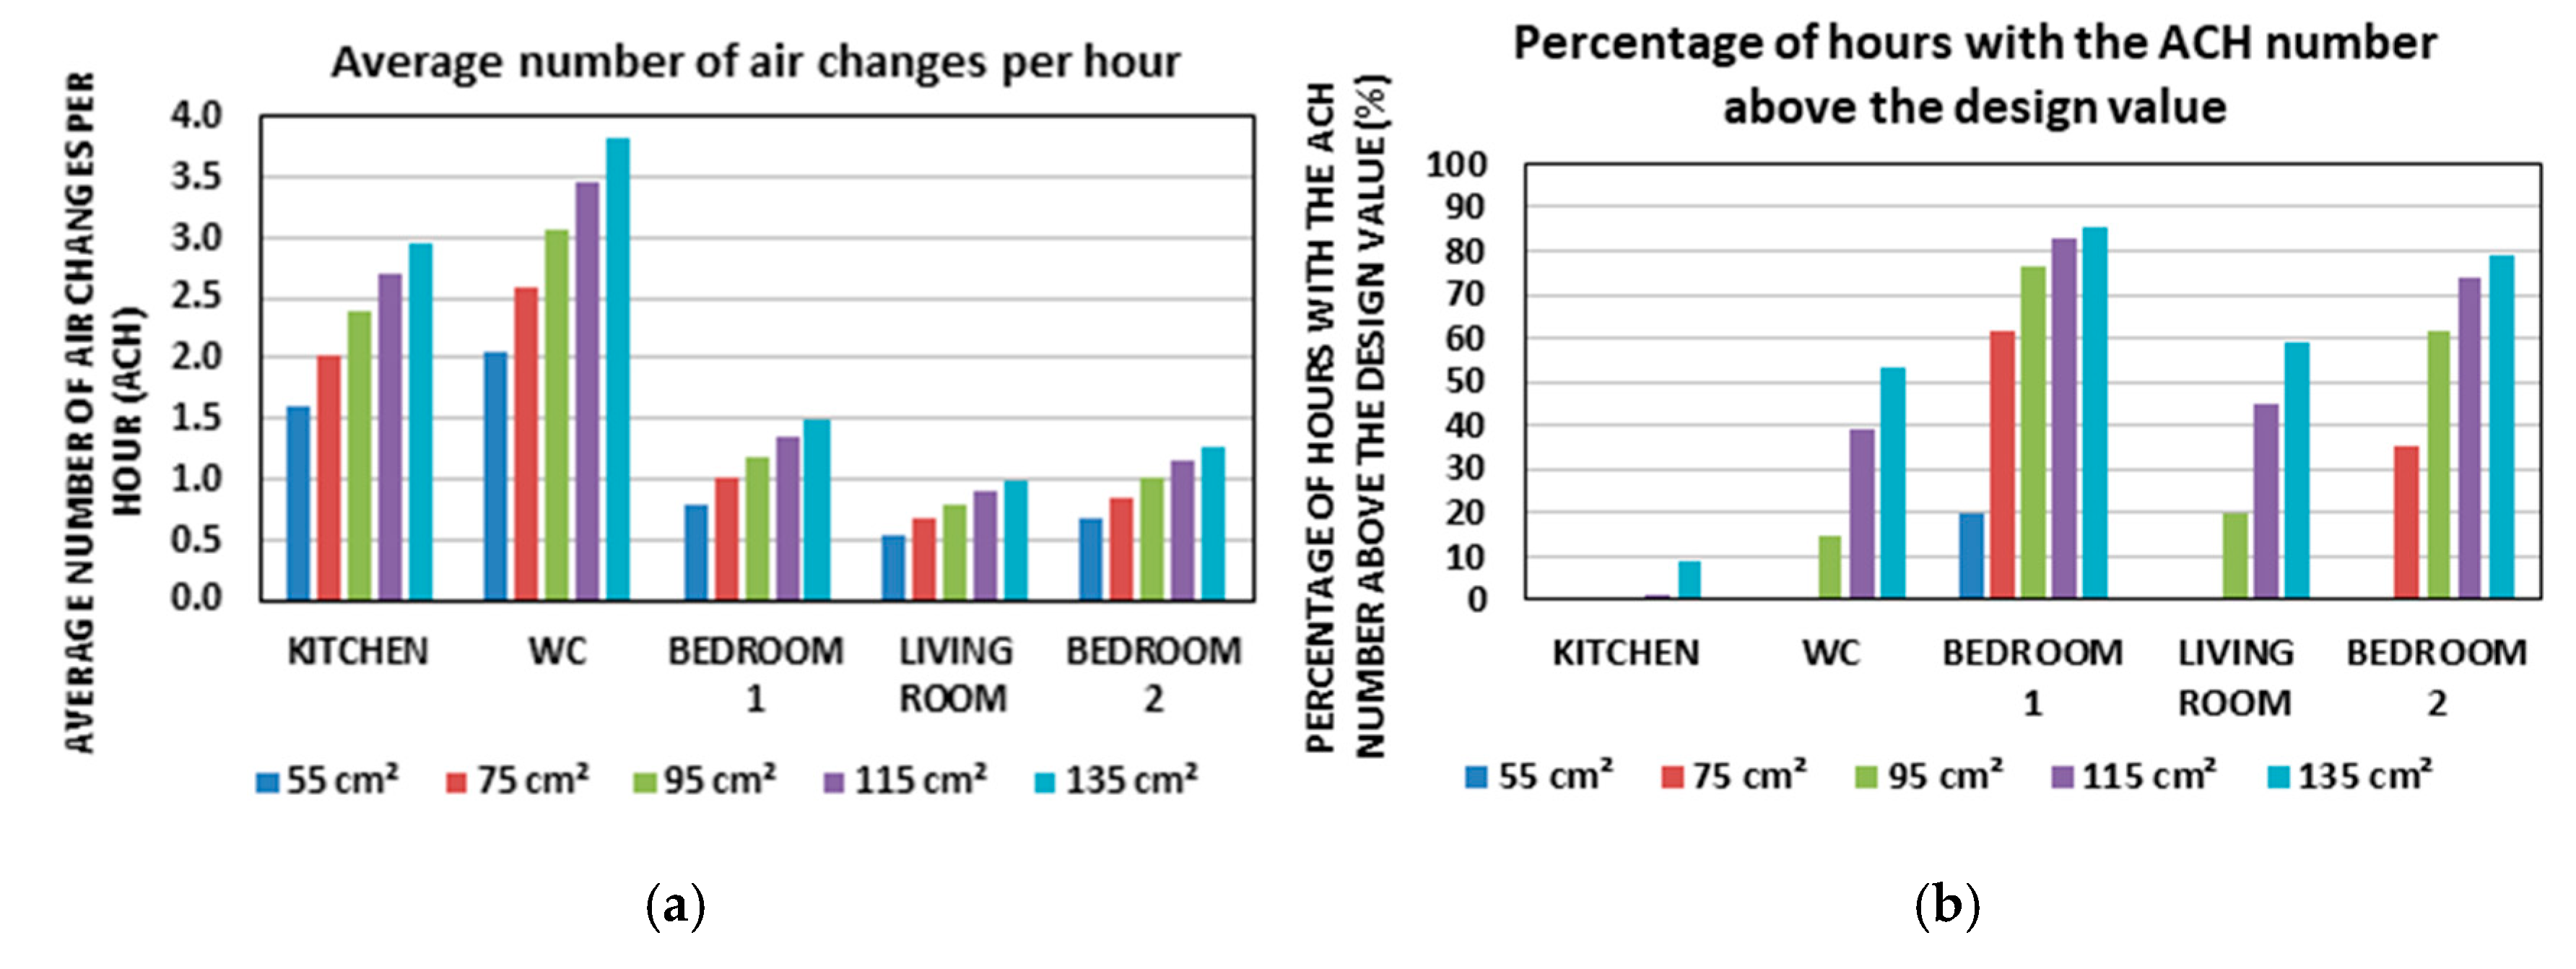
5.2.2. Results for Permanent Ventilation Openings and Wind Speed
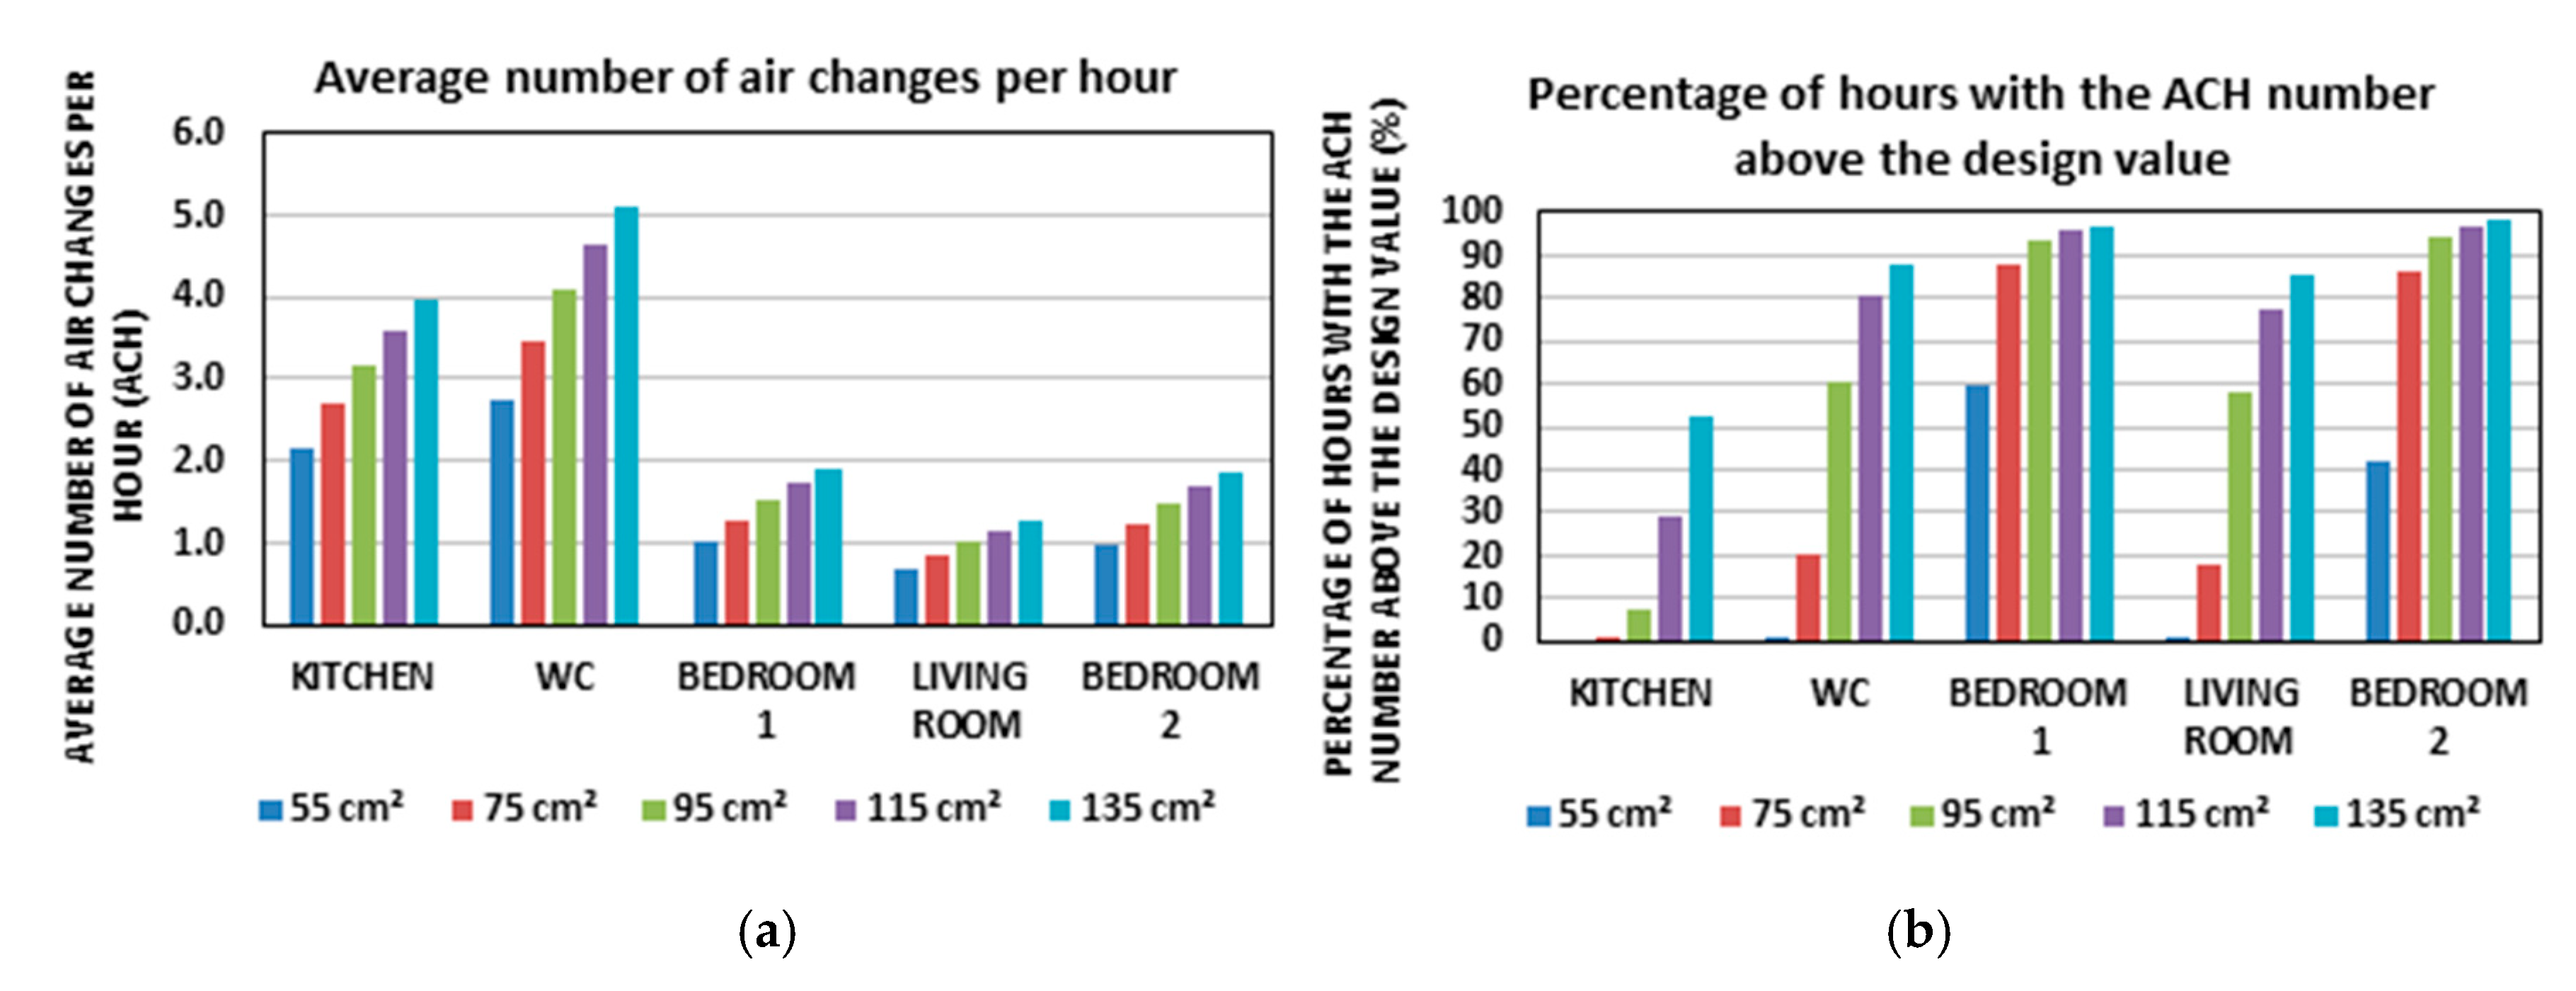
In this group of simulations, the
Average number of air changes per hour (ACH) increases linearly with the increase of the fixed openings area in the facades, as observed in
Figure 11a. This number gets closer to the design values for ventilation opening areas greater than 75 cm
2 in most of the rooms (
Figure 11a).
The PHAD values are low in the simulations for openings area of 55 cm
2 and in general the main rooms provide better results for this indicator than the service rooms (
Figure 11b).
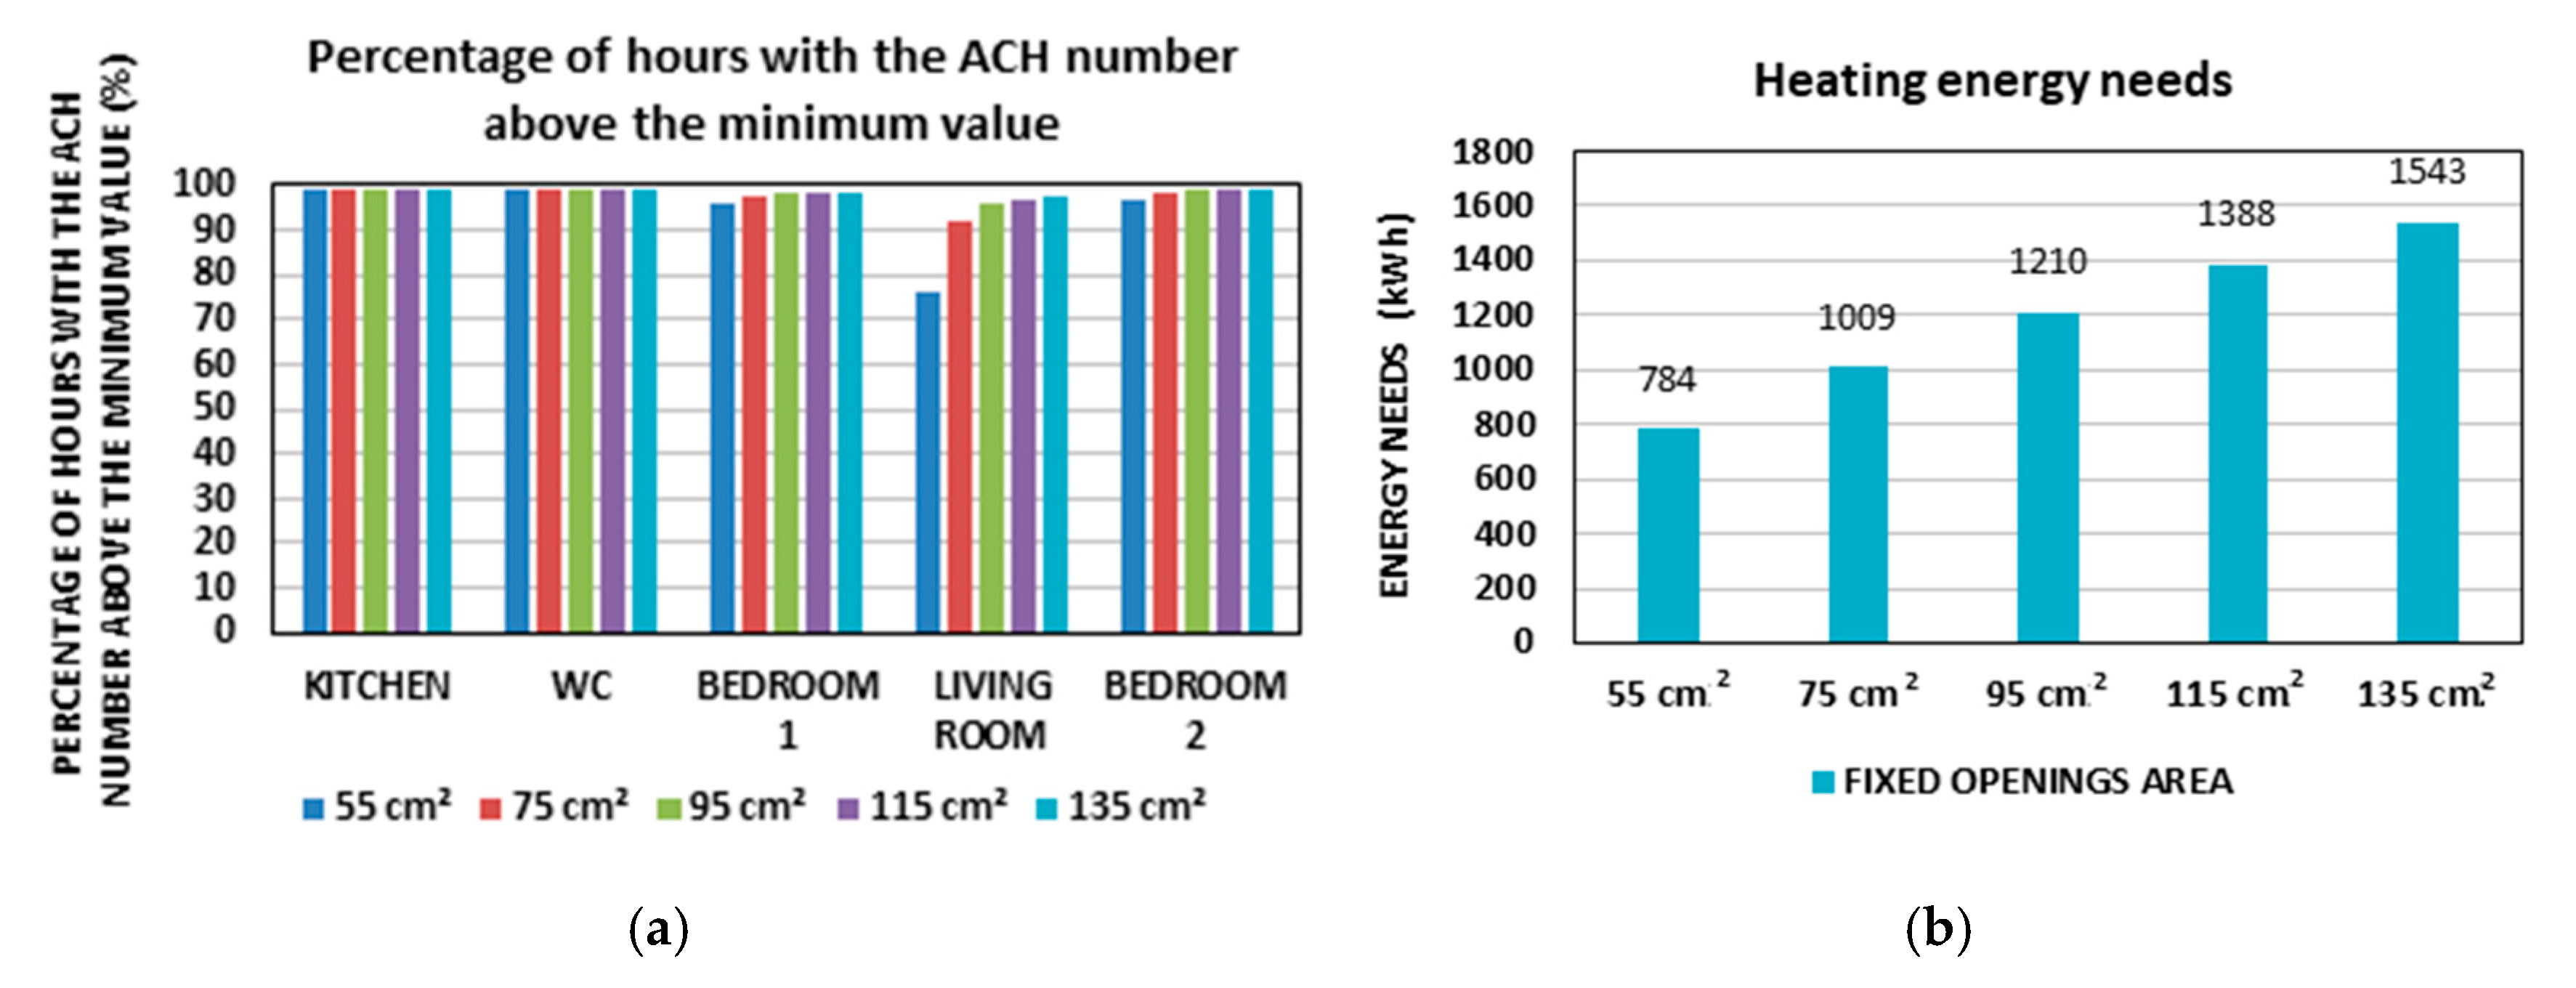
The PHAM indicator shows good results for all rooms, with percentage values greater than 70% (
Figure 12a). The
Heating energy needs naturally increase as the areas of fixed openings increase (
Figure 12b).
5.2.3. Results for Permanent Ventilation Openings and No Wind Speed
As in the previous scenario of
Section 5.2.2, the
Average number of air changes per hour also increases linearly with the increase of the fixed openings area in the facades for this group of simulations. However, this number gets close to the design values only for fixed opening areas greater than 95 cm
2 in most of the rooms (
Figure 13a). The PHAD indicator shows low values for the opening areas in this group of simulations (
Figure 13b). For the service rooms, the percentages of this indicator are too low, especially for the Kitchen. In the main rooms the PHAD value is higher, reaching acceptable values for opening areas over 75 cm
2.
The results for the PHAM indicator are high in general, but are lower than the values reached by the previous simulation group (
Figure 14a).
The
Heating energy needs indicator provides values lower than those reached in the previous simulation group, although they also increase linearly with the increase of the openings area (
Figure 14b). The higher heating energy needs when facades are provided with small natural ventilation openings, compared to the scenario without such openings, can be explained by the increased flow rates of cold air due to permanent ventilation.
5.2.4. Influence of Wind and Stack Effects on Room Ventilation
As observed in
Section 5.2.1 and
Section 5.2.2, the simulations performed using wind velocity as per the Weather file (w/ wind) show better results for all the indicators when compared with the simulations performed using zero wind speed (w/o wind). However, as it can be seen in
Table 5, the relative change (RC) in terms of average air change rates (ACH) is not significant. The rooms have relative changes of less than 35%, with the only exception being the case of Bedroom 2. This room is oriented along the main direction from which the wind is blowing, causing an ACH relative change of almost 50% between the two simulation groups. Anyway, the wind ventilation under no circumstances overcomes ventilation due to the stack effect in the heating season period.
6. Conclusions
This study investigates by computational simulation how the natural ventilation conditions impact the thermal and energy performance of a typical dwelling in a Mediterranean climate, under free-floating and controlled temperature conditions. A multizone model of the dwelling was created and simulated using EnergyPlus. Natural ventilation (infiltration included) through windows, doors, ducts and openings was modelled using the Airflow Network module. The model incorporates windows in opposite facades and openings for permanent ventilation in the main rooms (bedrooms and living room). Combined and isolated effects of wind- and buoyancy- driven ventilation on the thermal and energy performance of the dwelling were analyzed for the summer and winter seasons. The used performance indicators were the Average number of air changes per hour (ACH), Percentage of hours with ACH number above the design value (PHAD), for both summer and winter periods, and the Degree-Hours Discomfort (DHD) for the summer period and Heating energy needs and Percentage of hours with the ACH number above the minimum value (PHAM) for the winter period, respectively.
In the warm period the best results for all the indicators were obtained when windows are allowed to open at any time of day. Since in reality most occupants tend to open the windows when they are at home, the periods 18:00–23:00 and 23:00–07:00 were also tested in the study. By comparing the results of these two periods, either with or without permanent ventilation openings in the facades, the former showed higher ACH and PHAD numbers whereas the latter showed better thermal conditions, represented by a lower DHD number. In period 18:00–23:00, both the release of the accumulated external heat gains and the production of internal heat gains favors ACH increase. Nevertheless, this does not mean that the resulting thermal comfort conditions are better than in other periods with lower ventilation levels. As expected, when permanent ventilation is implemented in the dwelling through specific openings installed in the facades, the results for all indicators have improved compared to the no-openings scenario. The openings help to renew the indoor air in the periods when the windows are closed, also helping the control of the indoor temperature by keeping the DHD number at a lower value.
The study of cross-ventilation for the group of simulations in which there are no openings in the facades showed that cross-ventilation produces better results in relation to the evacuated air volume than ventilation through chimneys. The average number of hours of windows opening is between 12-25% of the total number of hours of the day and the contribution of cross-ventilation to the internal air evacuation in general exceeds 50% of the total volume of air evacuated for the summer period.
In the heating season it was noticed that the chimney effect in general outperforms the wind effect. All rooms have PHAM of more than 70% for the simulation performed with zero wind speed, which means that the chimney effect works well for the Mediterranean climate. The wind speed and direction play a secondary role in the number of Air changes per hour of the rooms. However, their action causes an increase in the ACH value (by stack effect), raising it to values close to the design values in each room.
The area of the permanent openings for ventilation in the facades plays an important role in the thermal and energy performance of the dwelling in this period. The Average number of air changes per hour (ACH) increases by 25% as the area of the fixed openings is increased by 20 cm2, from the initial value of 55 cm2 to the maximum value of 135 cm2, which leads heating energy needs to increase by the same proportion (around 25%).
The opening area of 55 cm
2 that results from the application of Standard NP 1037-1 [
9] shows good results in terms of ACH, since although the ACH of the Living room and Kitchen does not reach the design value, the minimum value of ACH is reached in most of the hours for the heating period.
Natural ventilation in buildings depend on several parameters, some with high uncertainty, such as the meteorological parameters of temperature and wind, and others with high variability, such as the architectural features and exposure conditions of the buildings. In this regard, a more comprehensive study of the shielding effects of surrounding built environment and topography on natural ventilation, not considered in this investigation, is needed. Likewise, the coupling between CFD (Computational Fluid Dynamic) and multizone airflow models, which allow for the prediction of indoor temperature and velocity distributions and correspondently local discomfort, are suggested for more accurate assessment of natural ventilation effects on building indoor environment.


