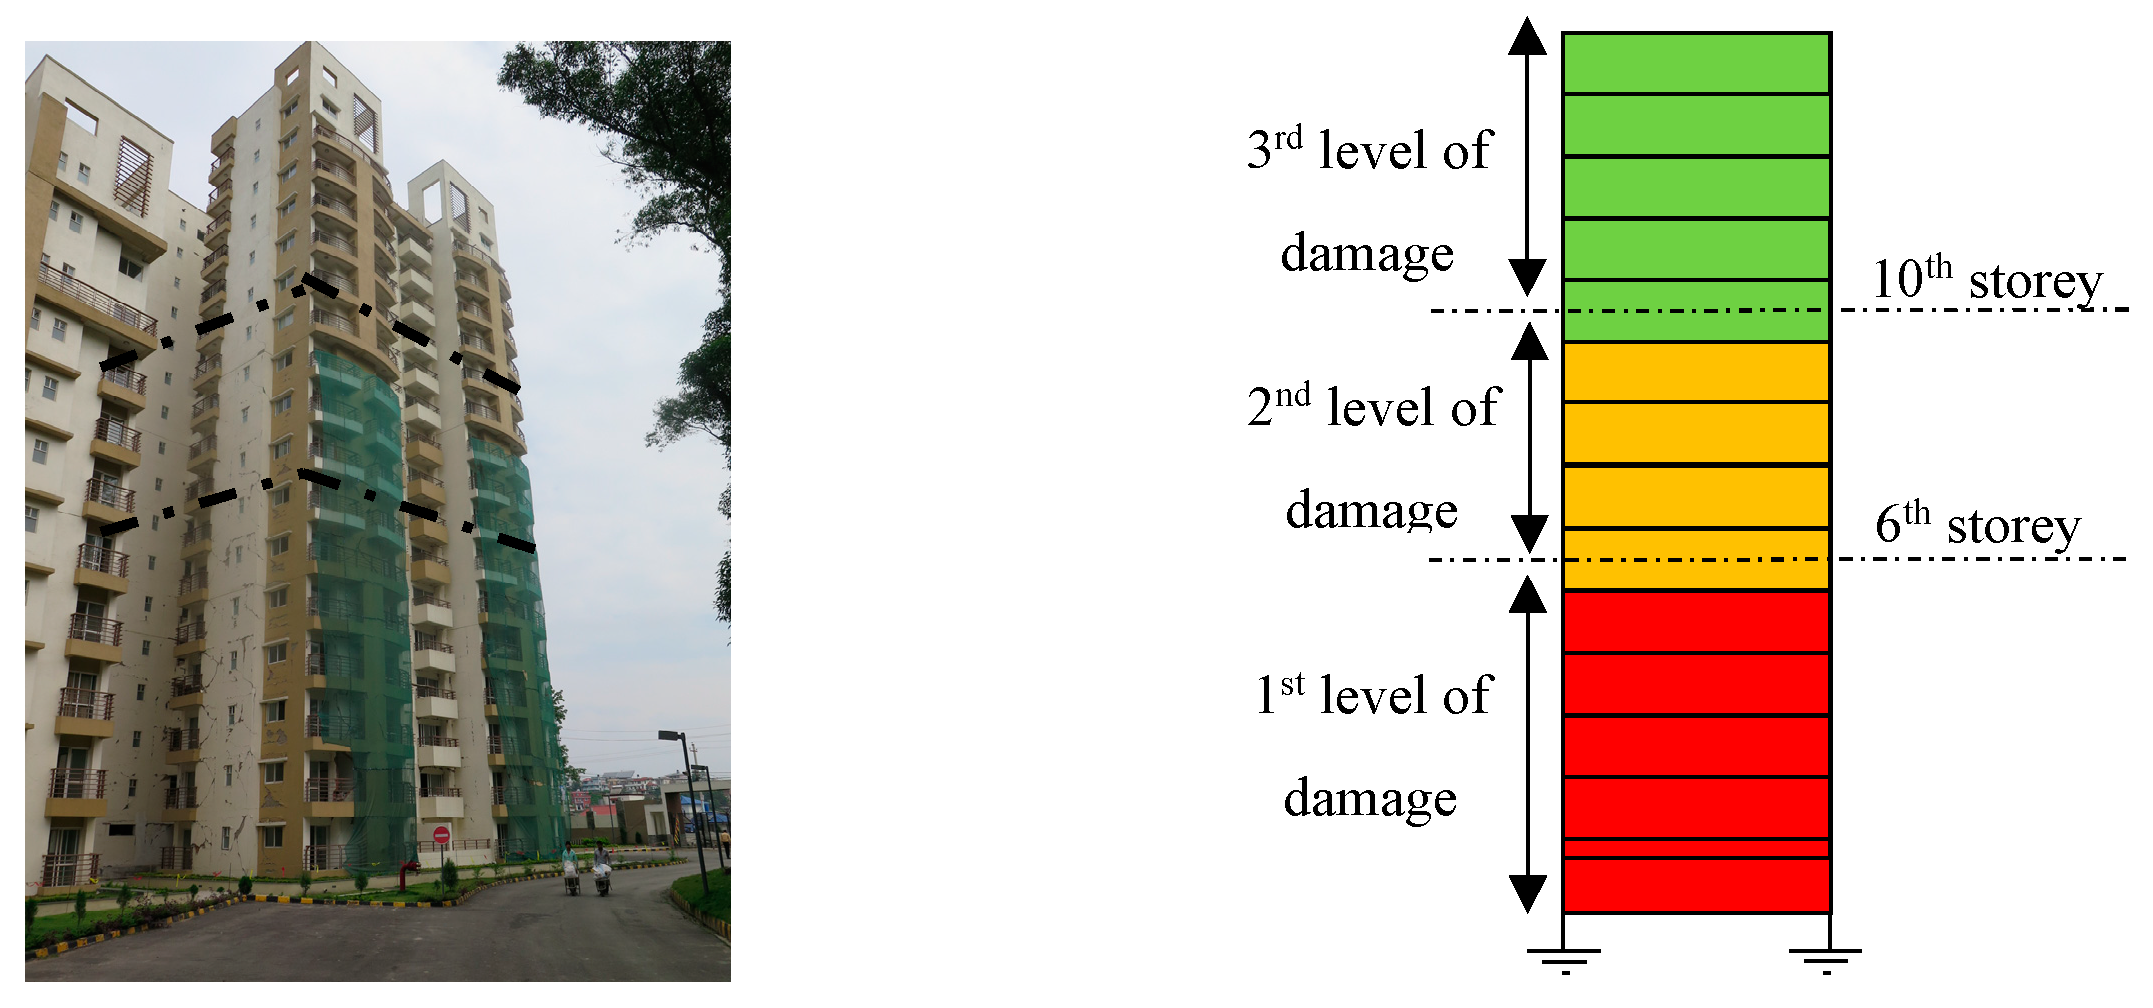
Figure 1.
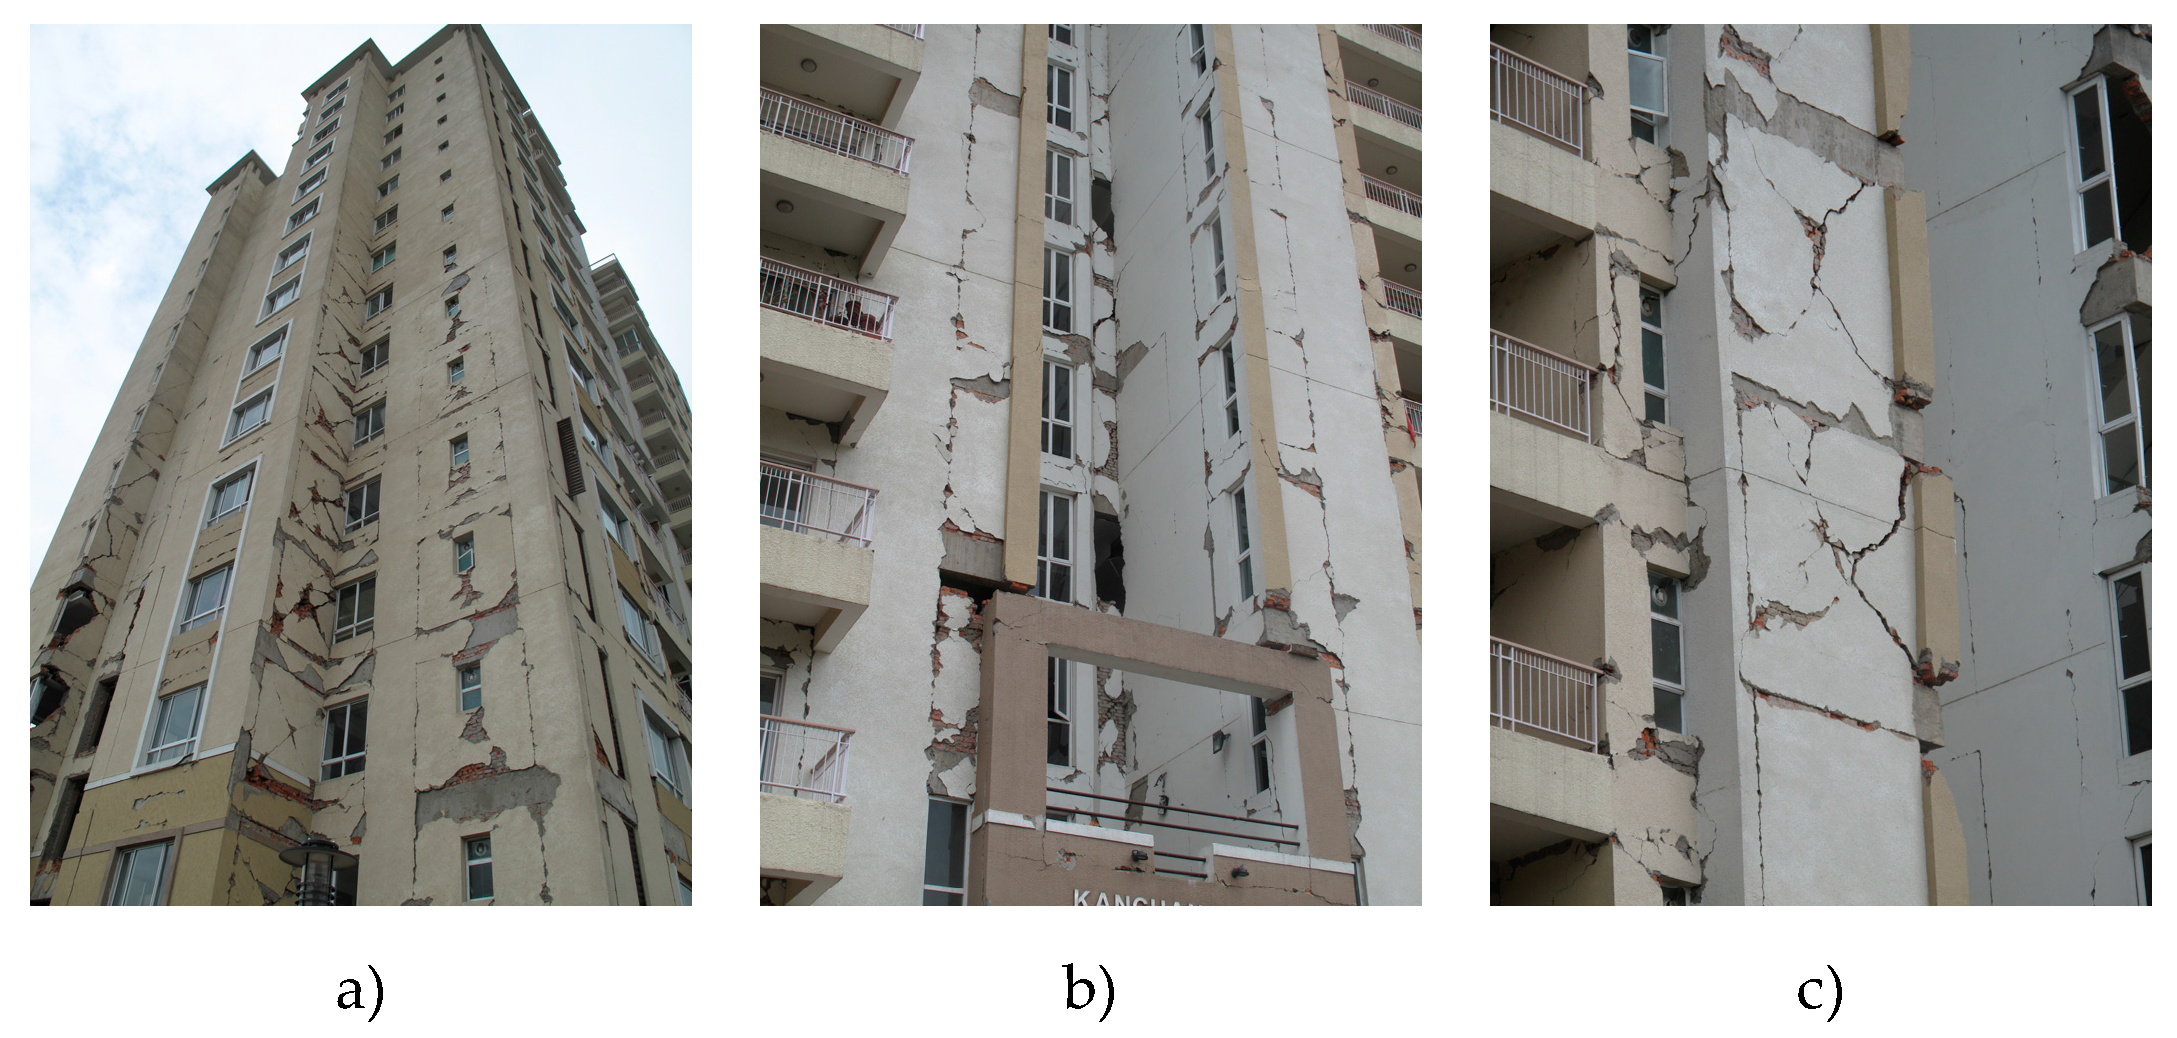
Fourteen-storey reinforced concrete structure damaged after the Gorkha earthquake: (a) distribution of the damages from the first to the seventh storey; (b) detachment of the walls from the envelope frame; (c) diagonal cracking with slight out-of-plane detachment of the wall.
Figure 1.
Fourteen-storey reinforced concrete structure damaged after the Gorkha earthquake: (a) distribution of the damages from the first to the seventh storey; (b) detachment of the walls from the envelope frame; (c) diagonal cracking with slight out-of-plane detachment of the wall.
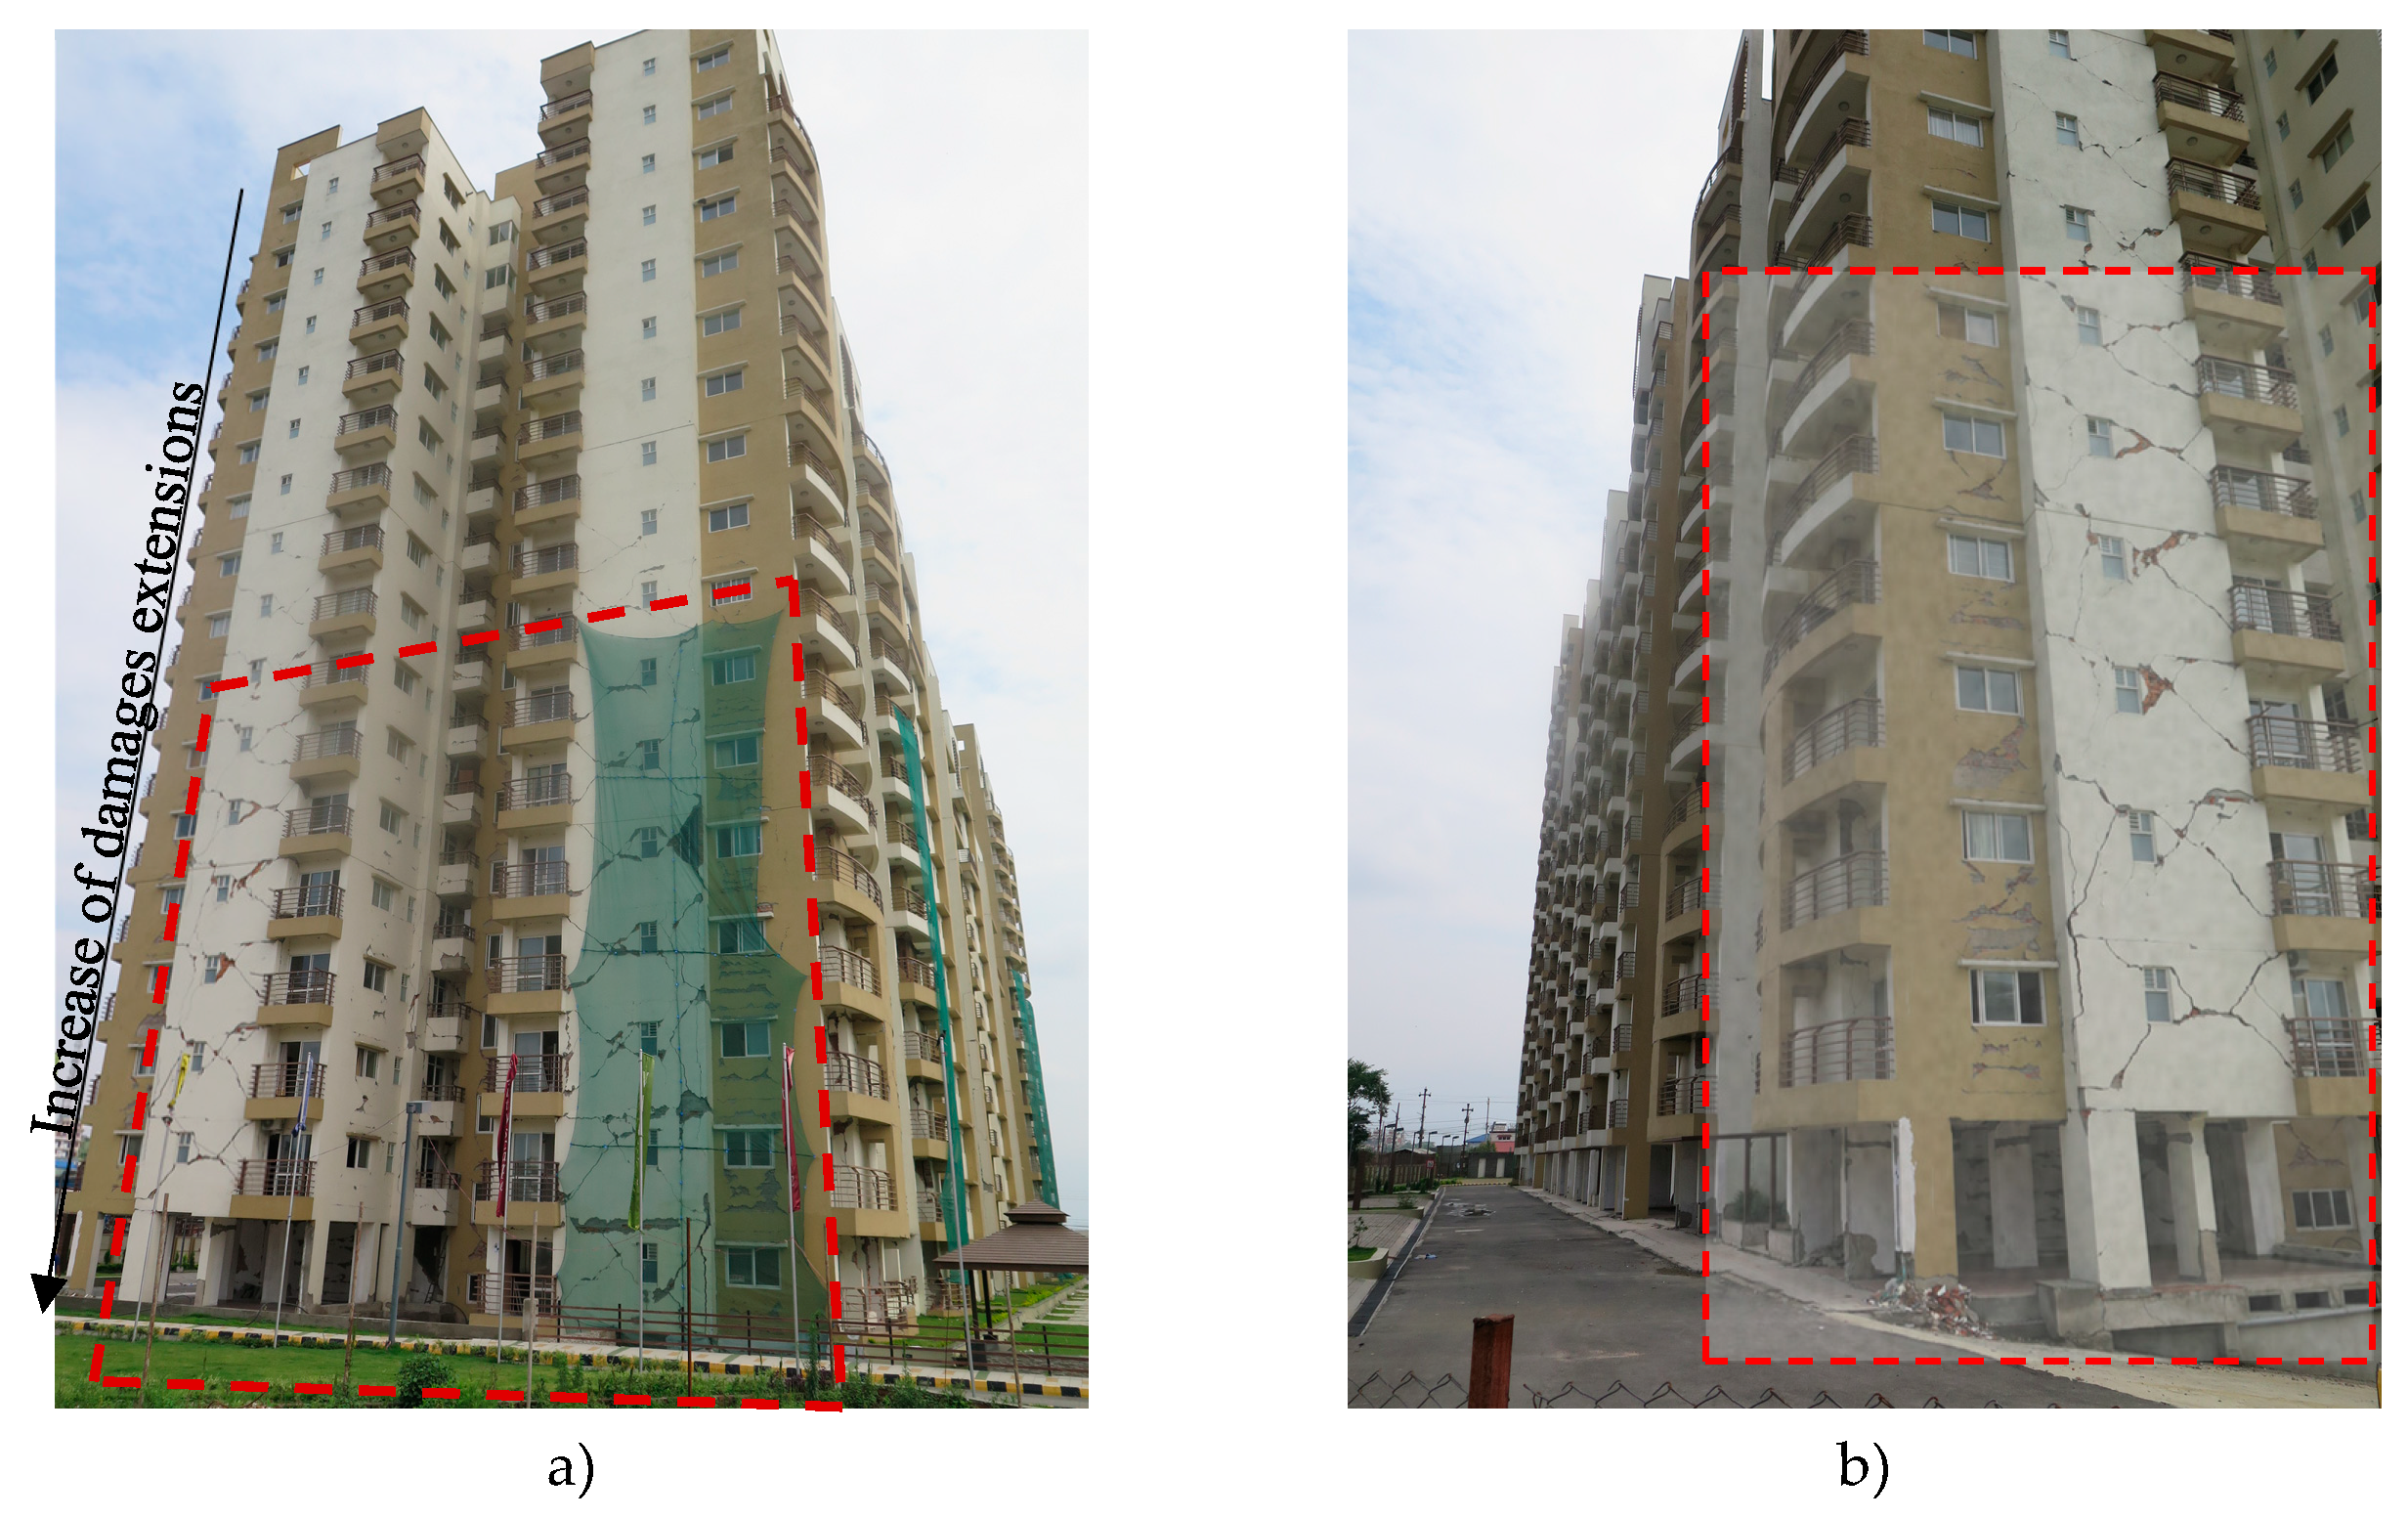
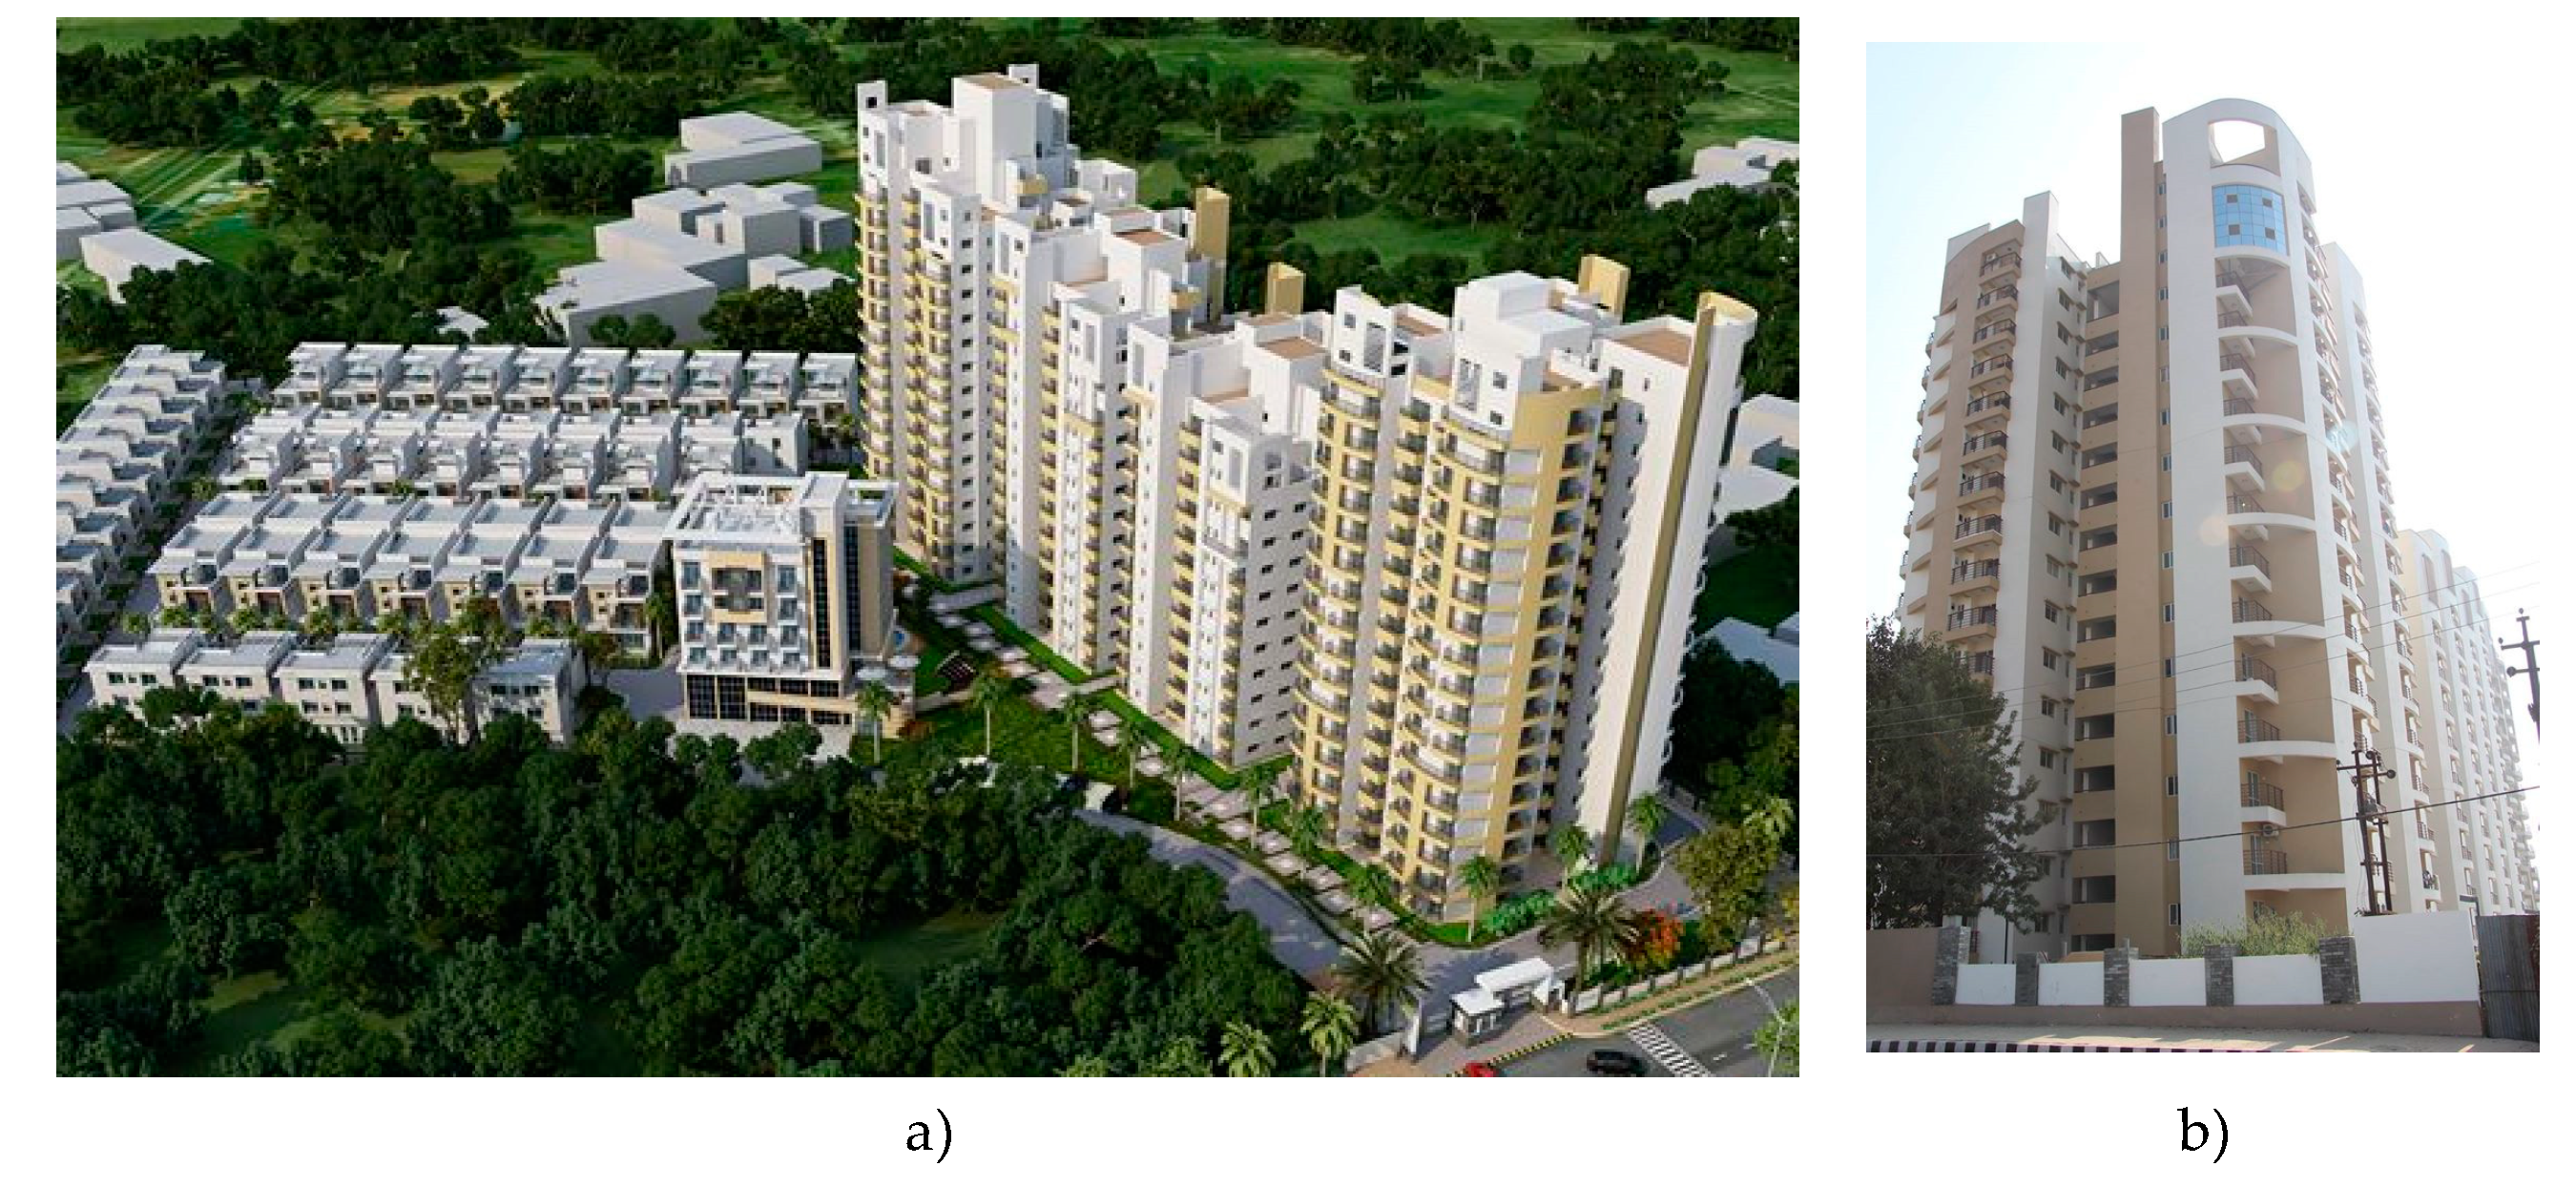
Figure 2.
Global overview of the high-rise structure under study: (a) location of the houses and the high-rise buildings; and (b) front view.
Figure 2.
Global overview of the high-rise structure under study: (a) location of the houses and the high-rise buildings; and (b) front view.
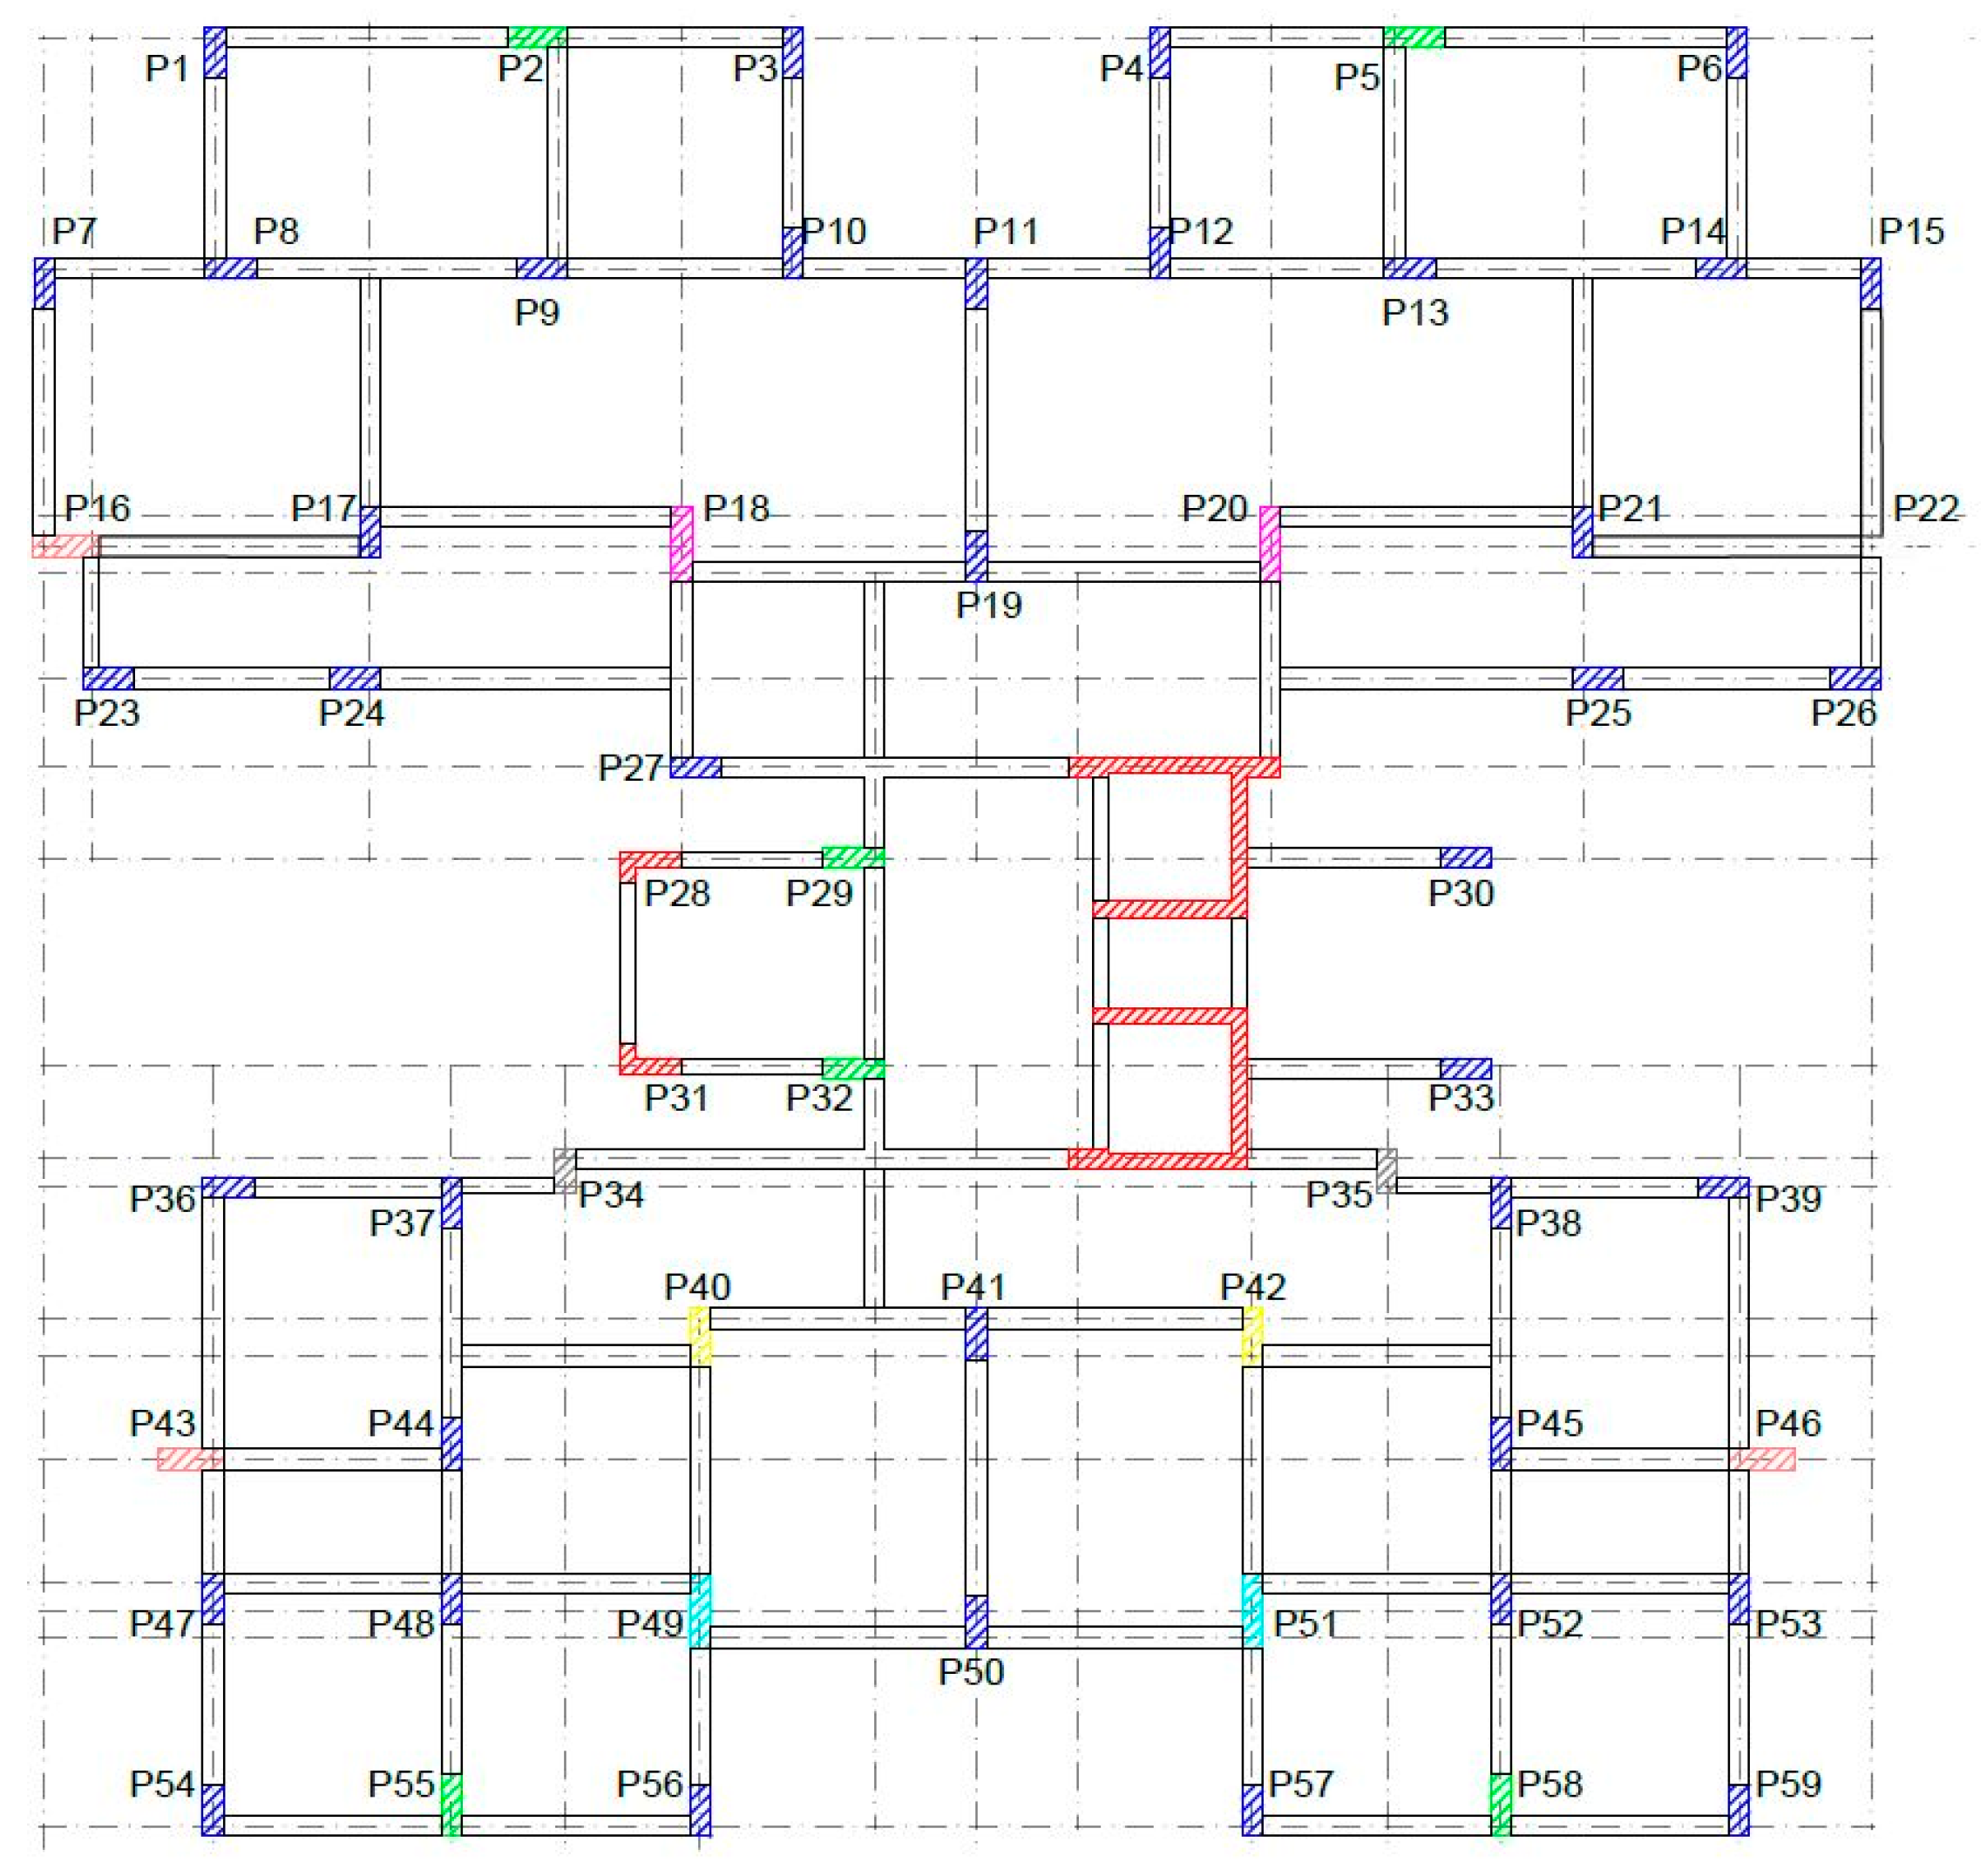
Figure 3.
Case study: columns cross-section.
Figure 3.
Case study: columns cross-section.
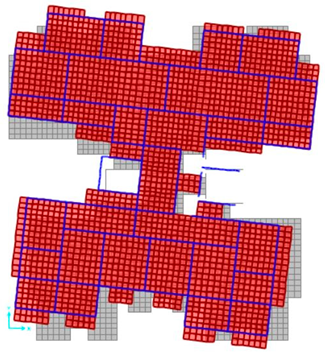
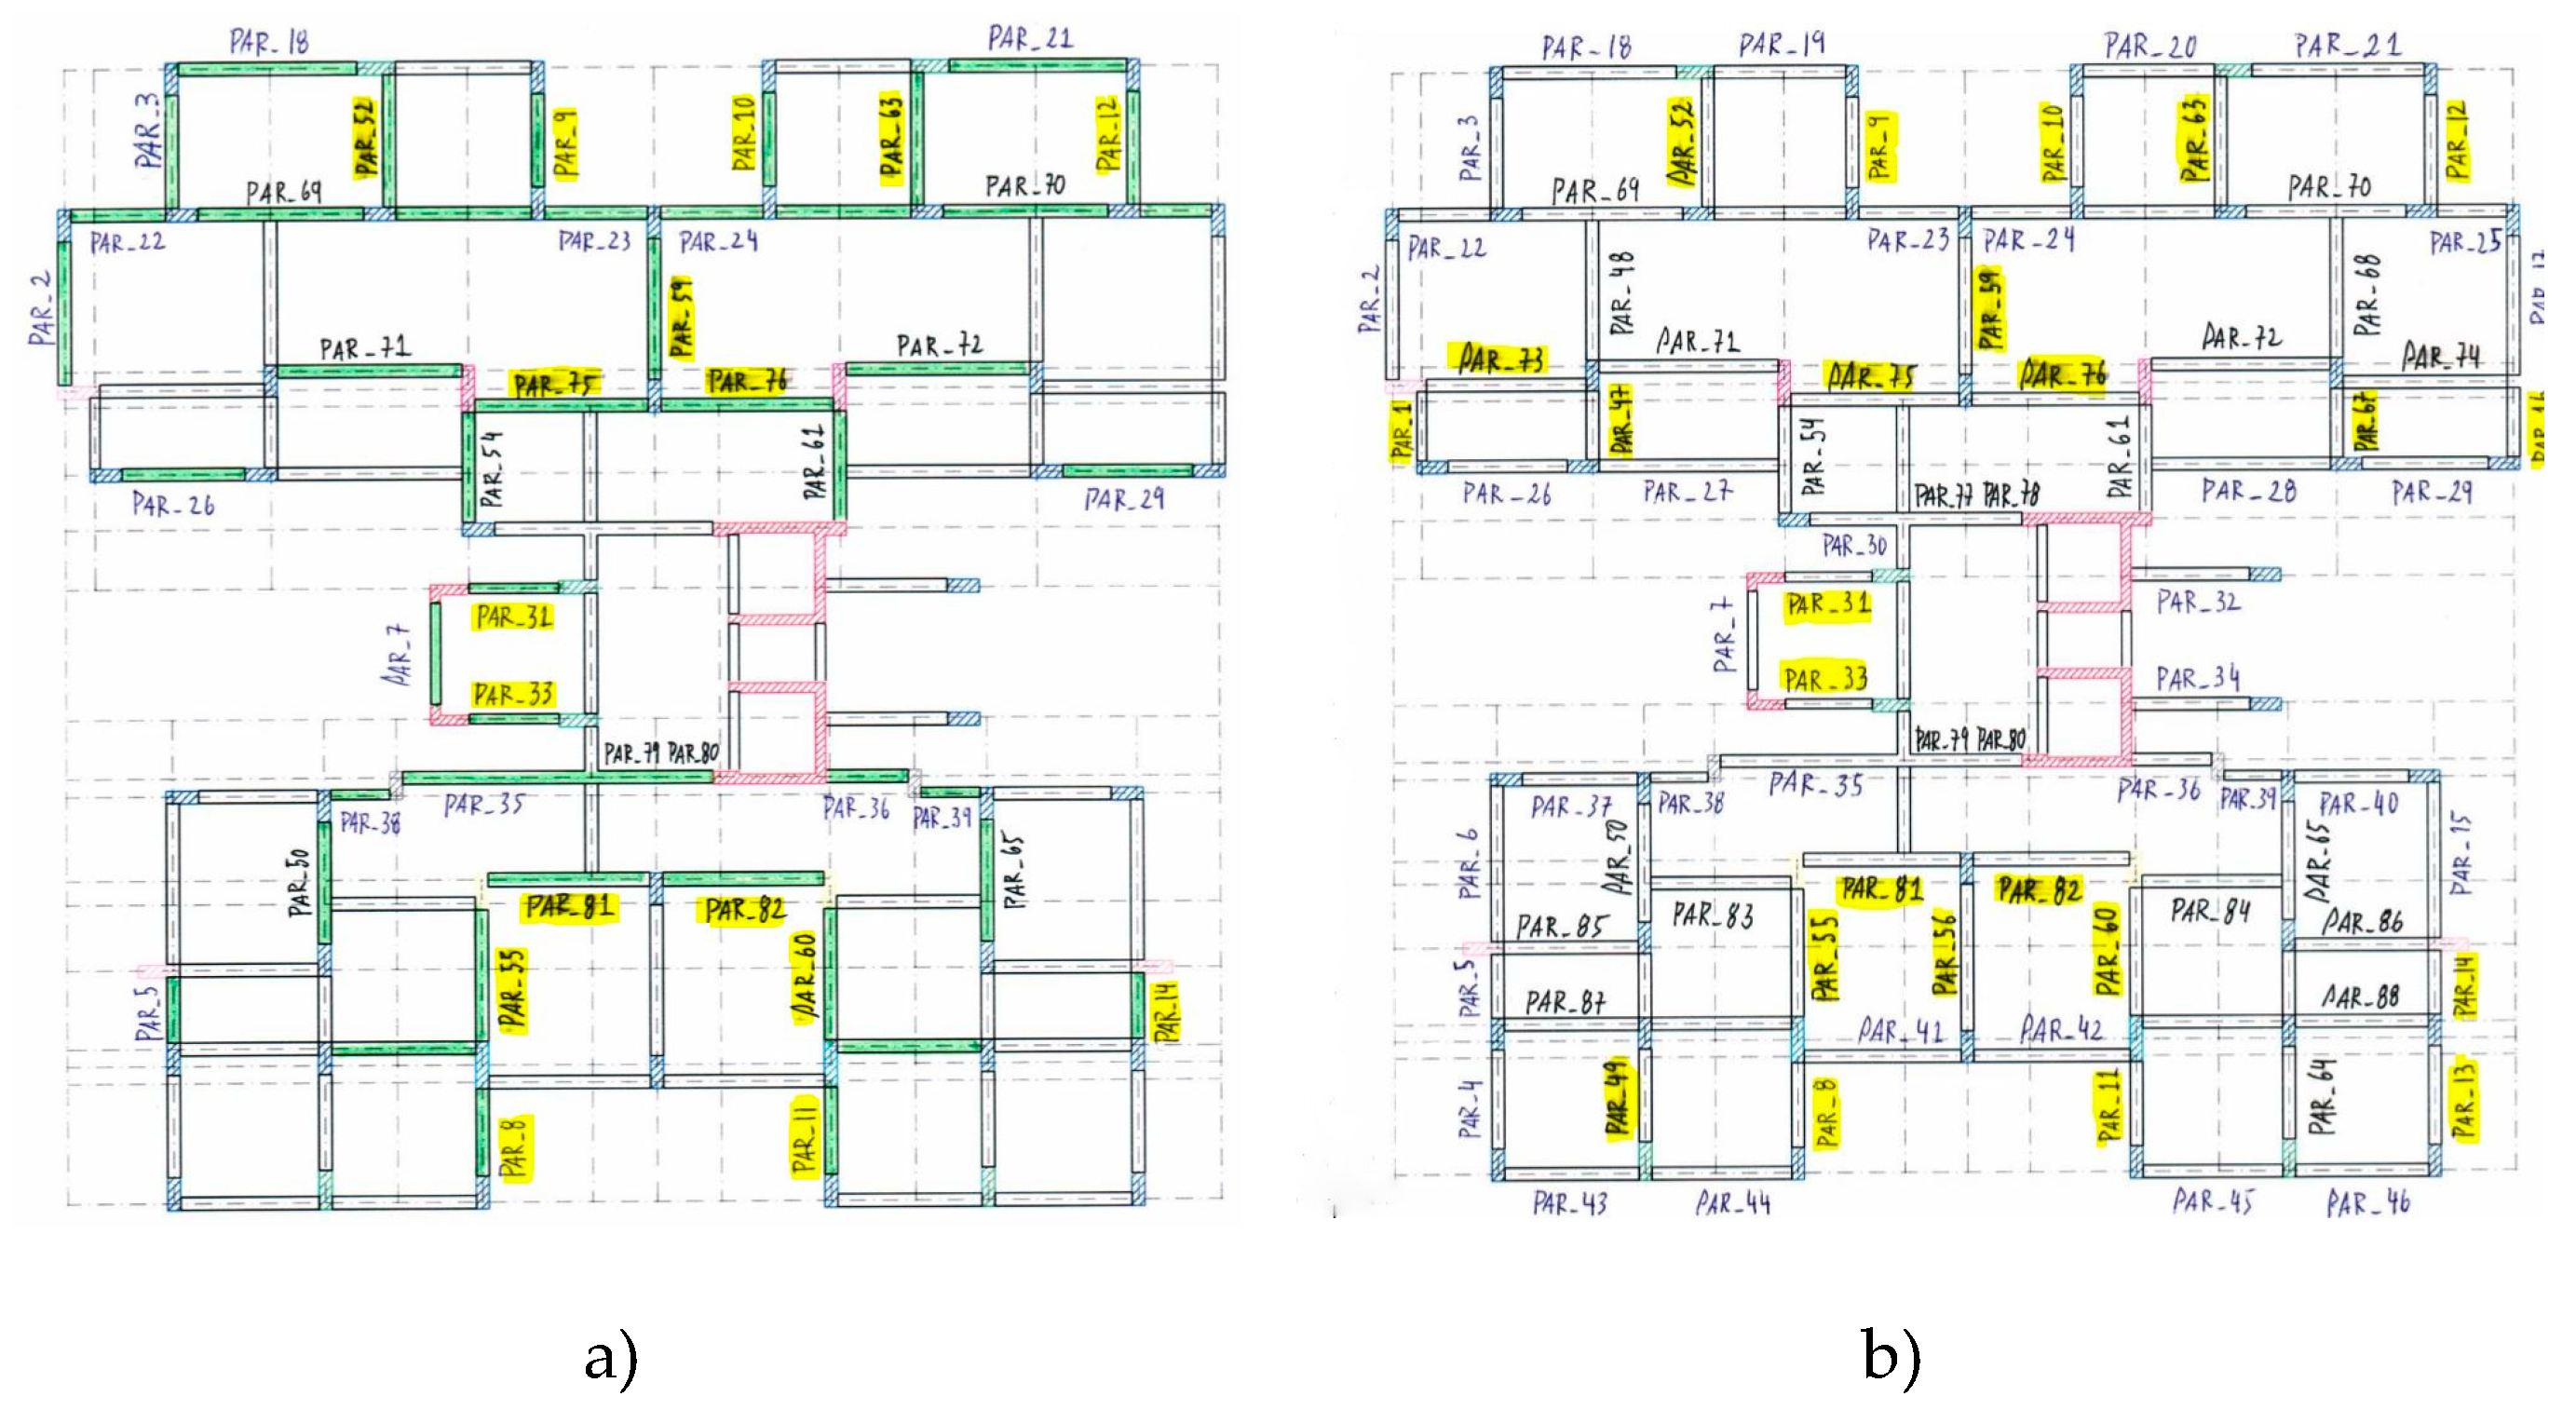
Figure 4.
Distribution of the infill masonry walls: (a) ground floor; and (b) remaining floors. Where Par_€ means infill panel number €.
Figure 4.
Distribution of the infill masonry walls: (a) ground floor; and (b) remaining floors. Where Par_€ means infill panel number €.
Figure 5.
Survey damage assessment of the building: (a) north façade; (b) south-east façade.
Figure 5.
Survey damage assessment of the building: (a) north façade; (b) south-east façade.
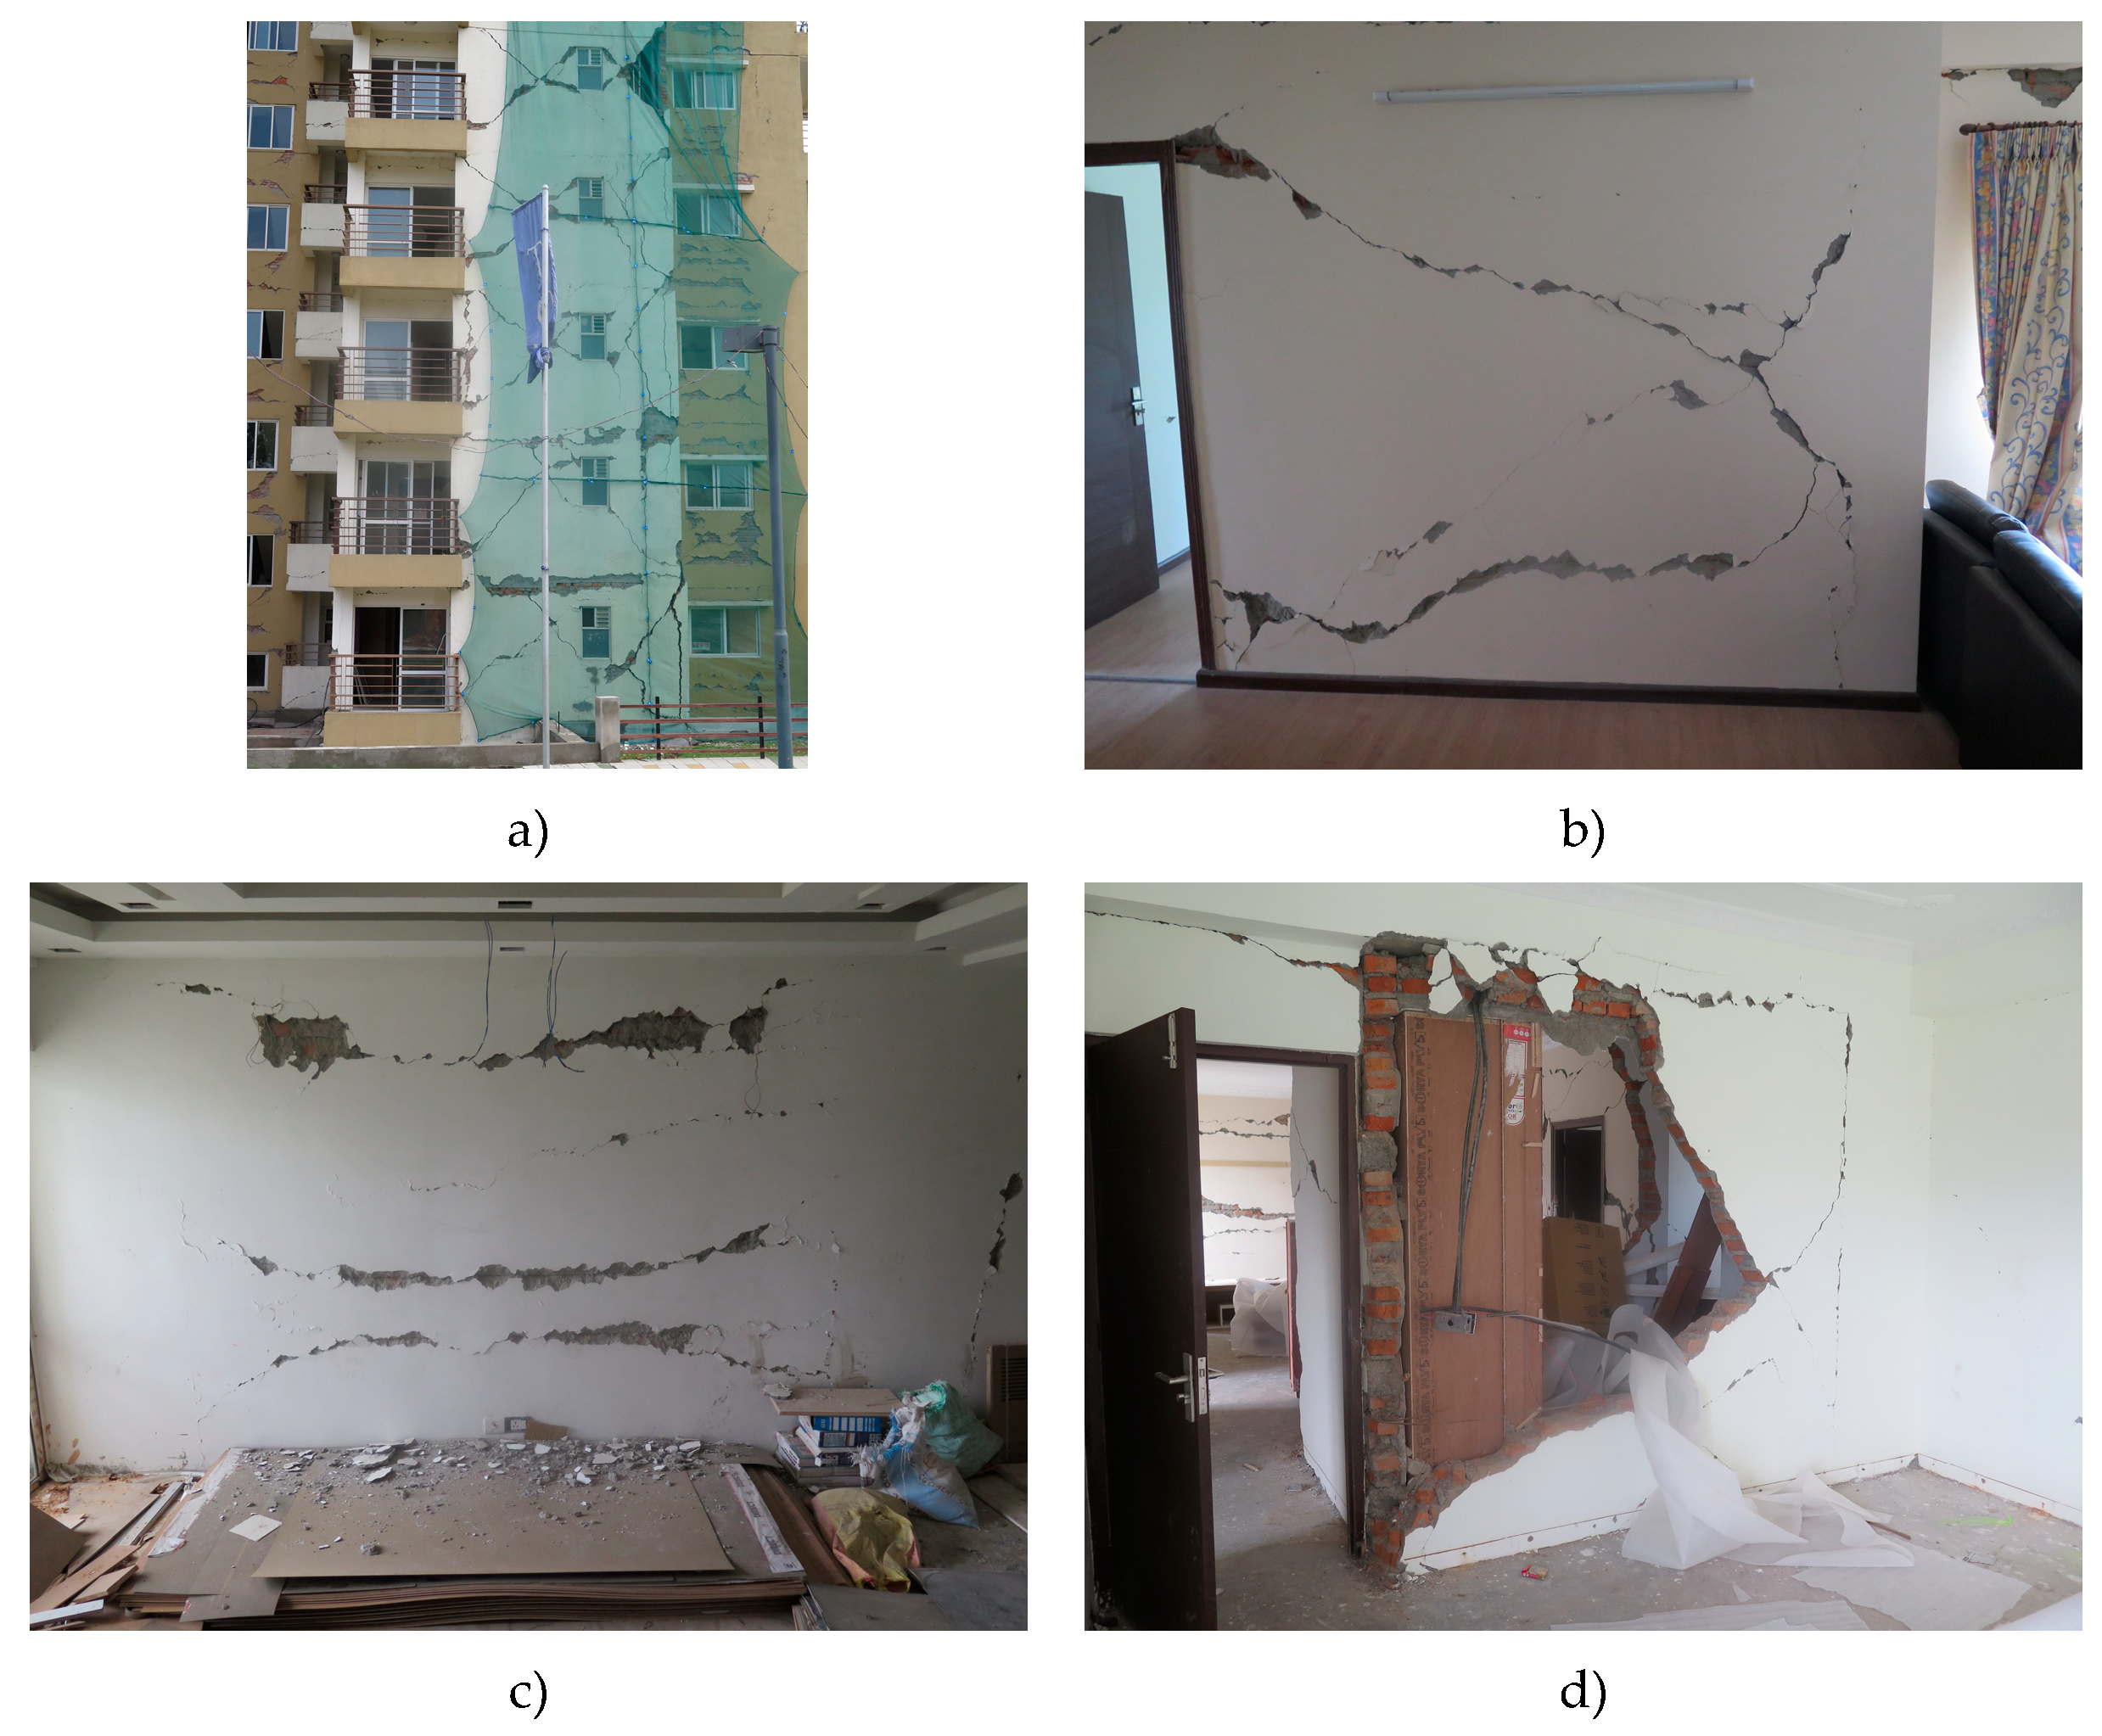
Figure 6.
Survey damage assessment of the interior of the building: (a) diagonal cracking in façade wall; (b) diagonal cracking in interior partition wall; (c) sliding cracking in interior partition wall of storey 1; and (d) out-of-plane collapse of interior partition wall.
Figure 6.
Survey damage assessment of the interior of the building: (a) diagonal cracking in façade wall; (b) diagonal cracking in interior partition wall; (c) sliding cracking in interior partition wall of storey 1; and (d) out-of-plane collapse of interior partition wall.
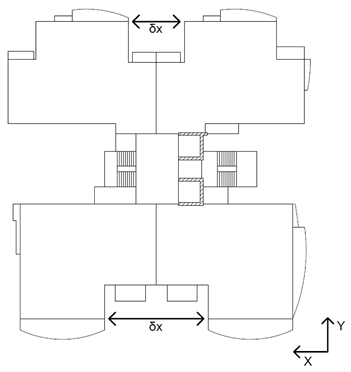
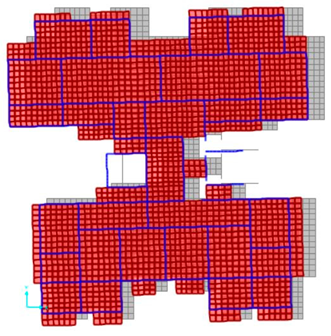
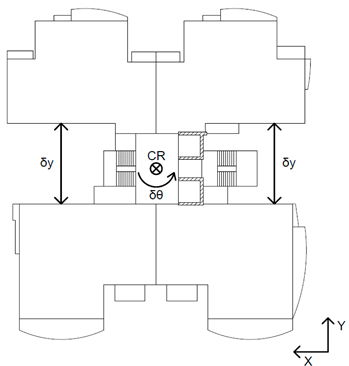
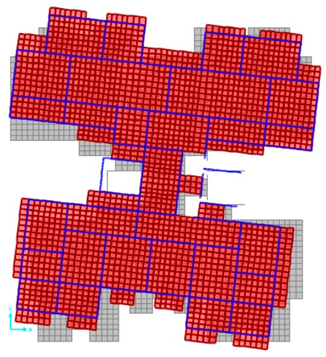
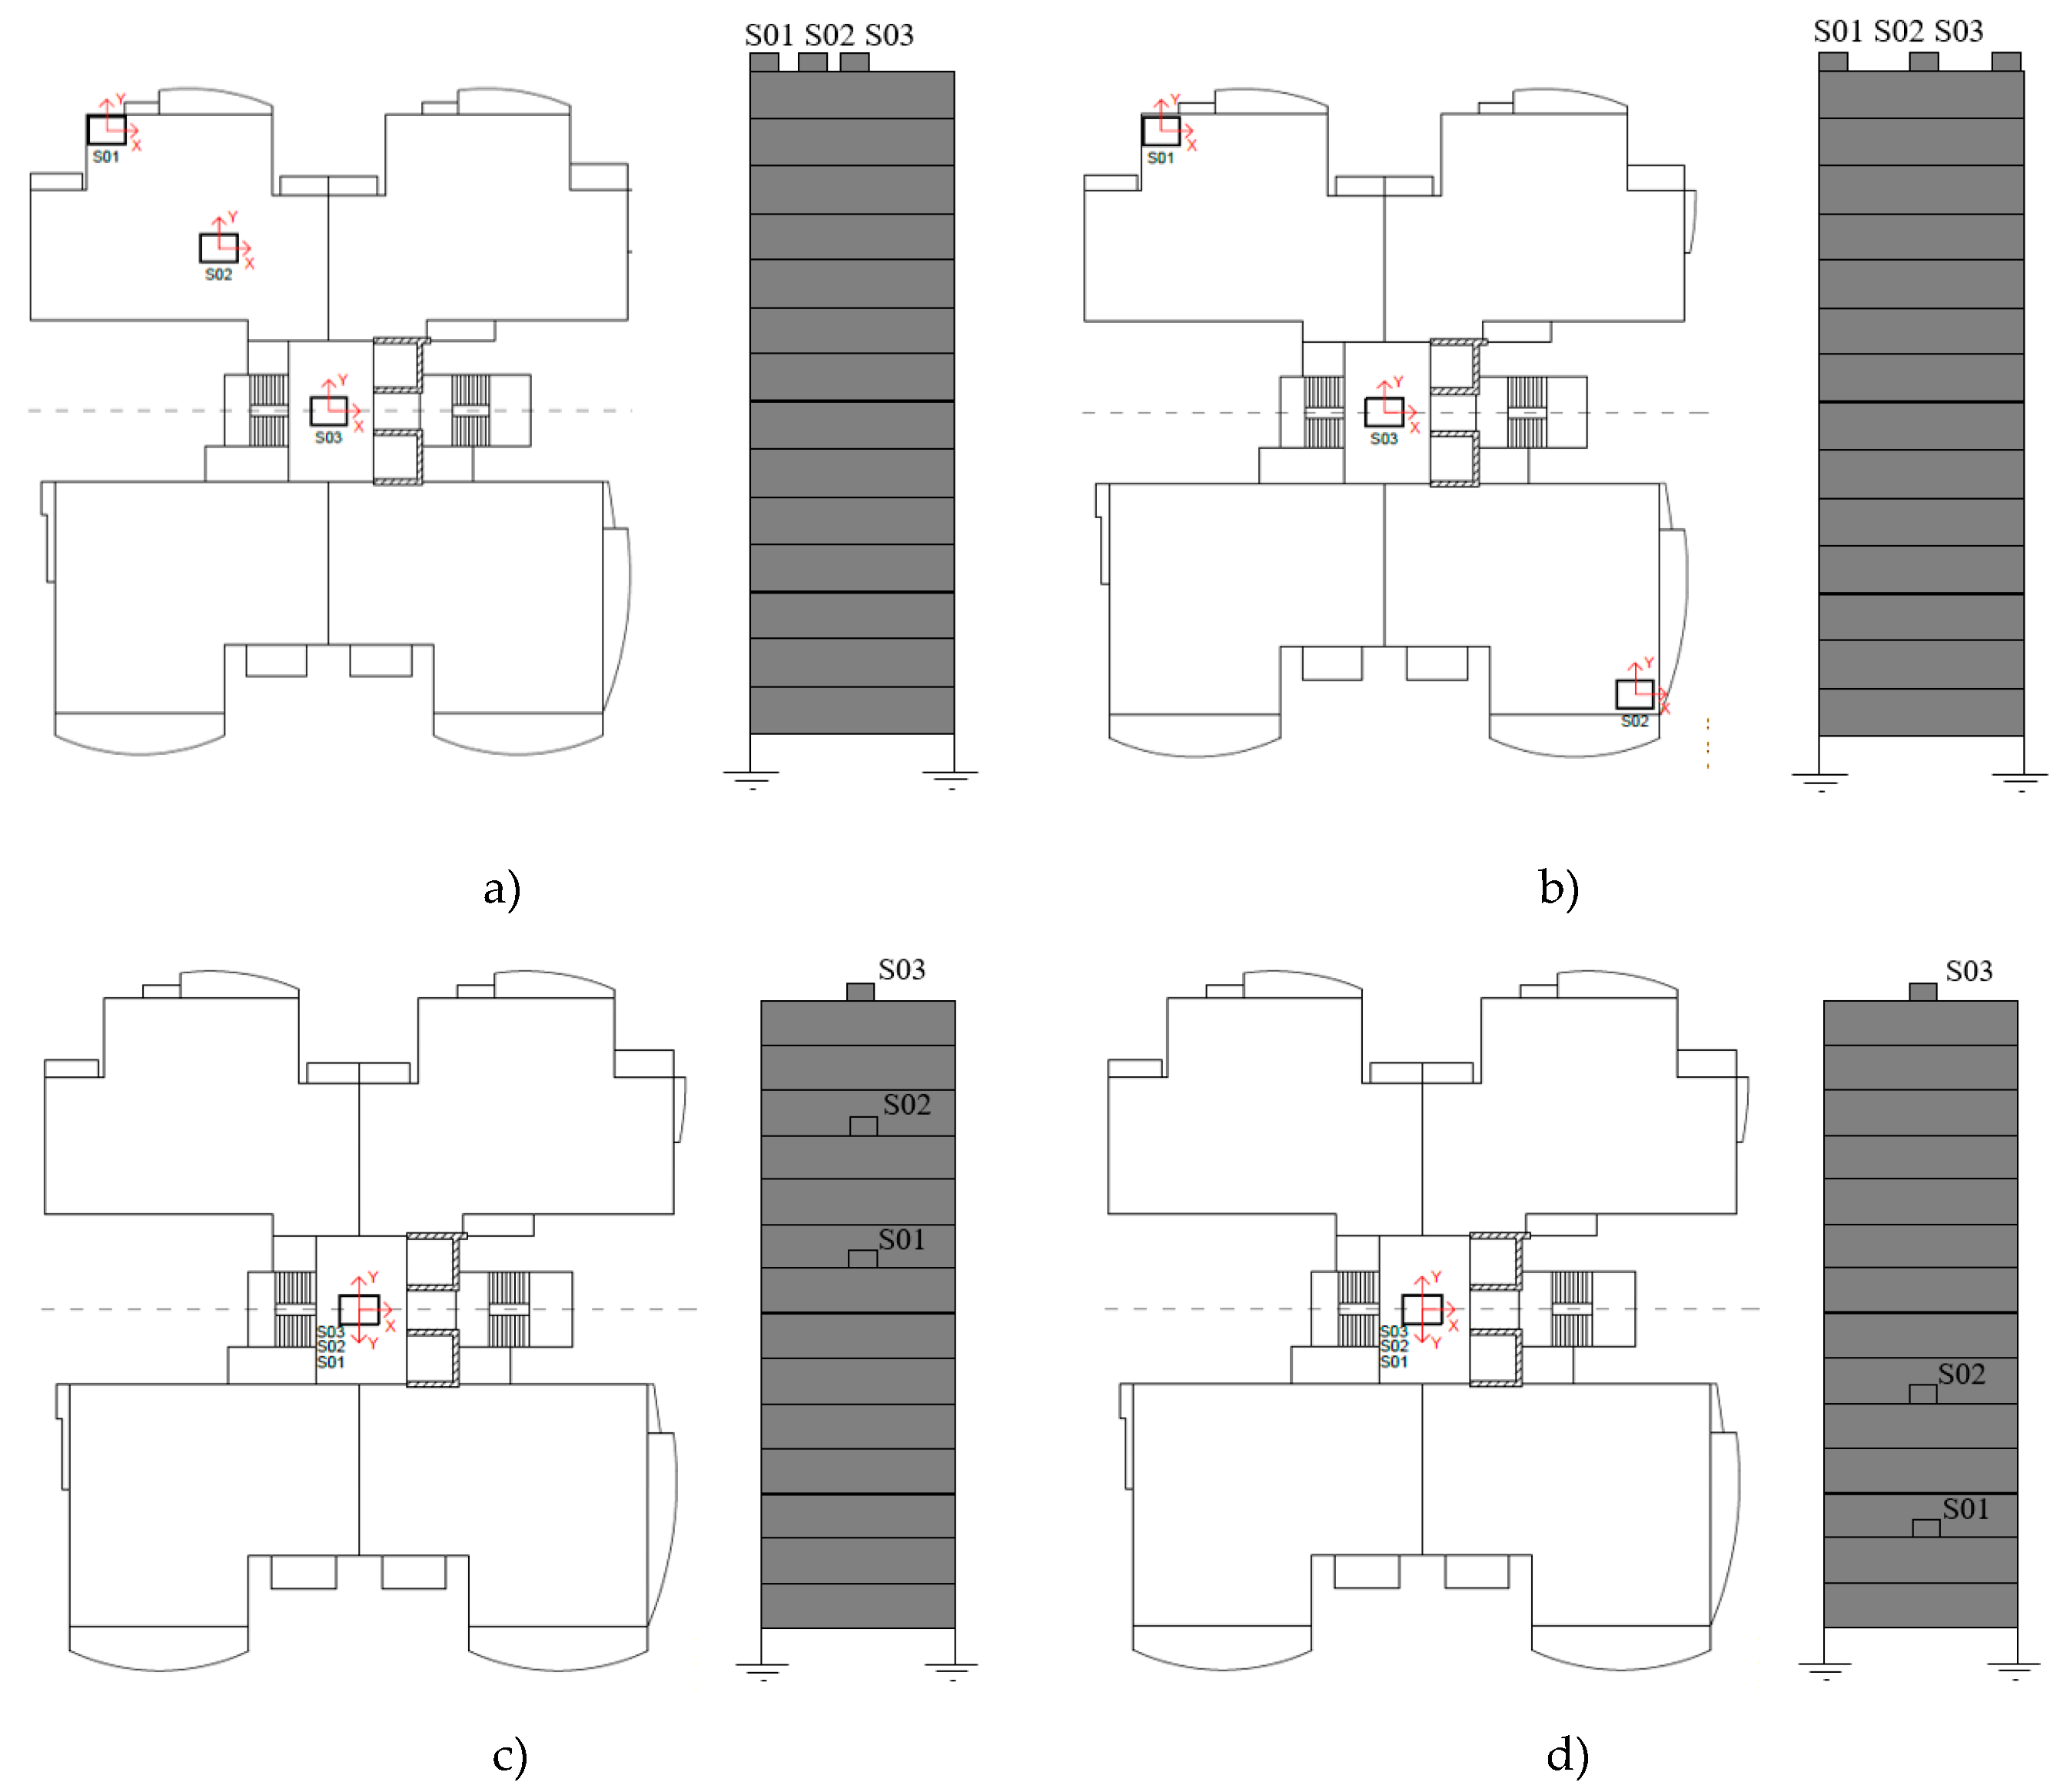
Figure 7.
Ambient vibration tests: schematic layout of the seismometers disposition (a) Setup 1; (b) Setup 2; (c) Setup 3, and (d) Setup 4.
Figure 7.
Ambient vibration tests: schematic layout of the seismometers disposition (a) Setup 1; (b) Setup 2; (c) Setup 3, and (d) Setup 4.
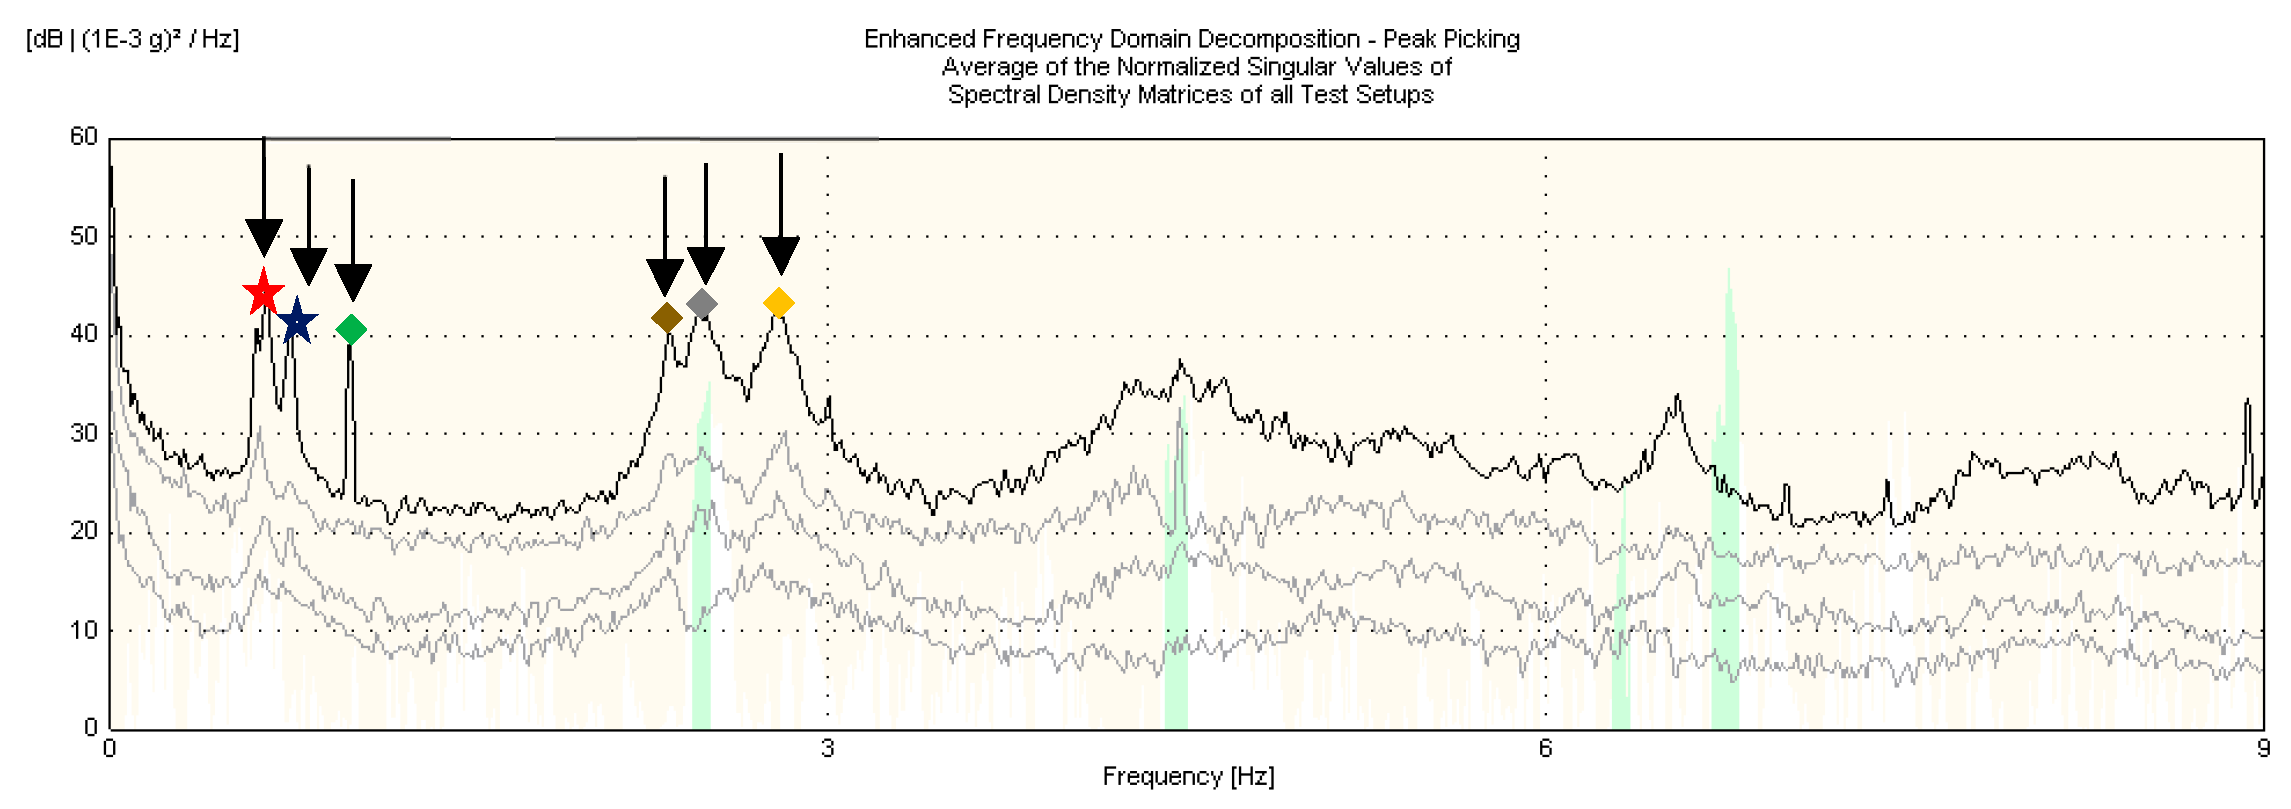
Figure 8.
Ambient vibration test: normalized single values of spectral density matrices.
Figure 8.
Ambient vibration test: normalized single values of spectral density matrices.
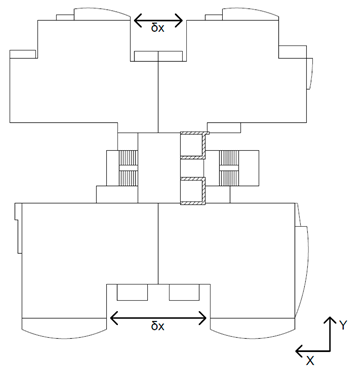
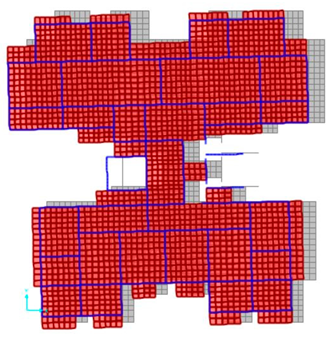
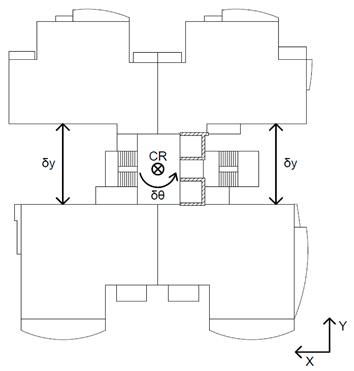
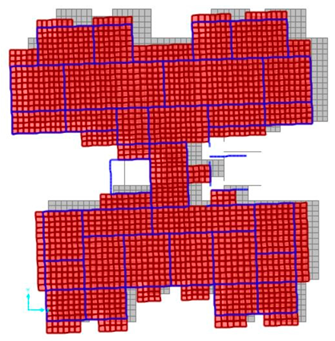
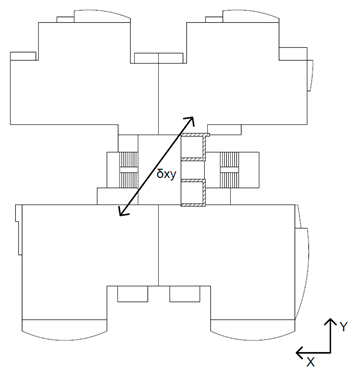
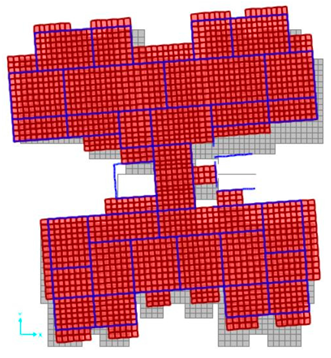
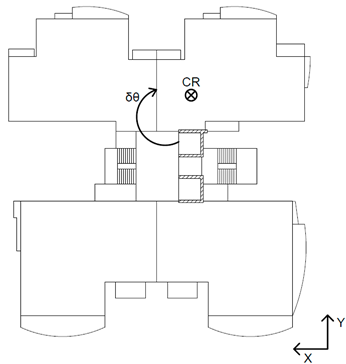
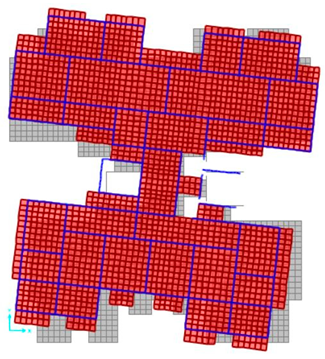
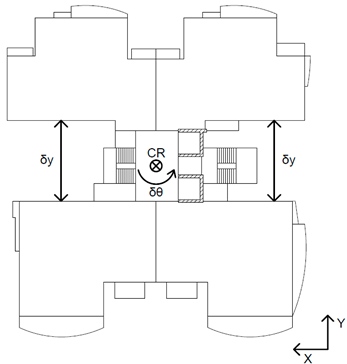
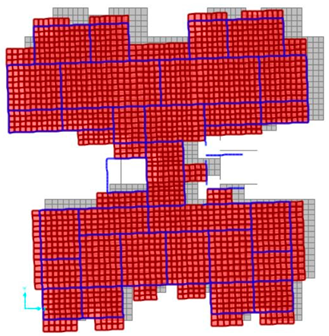
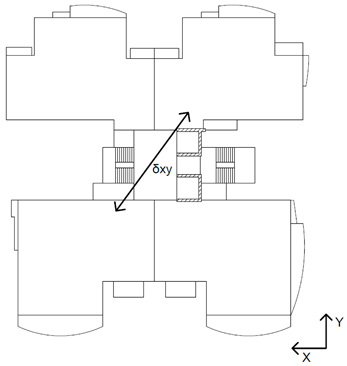
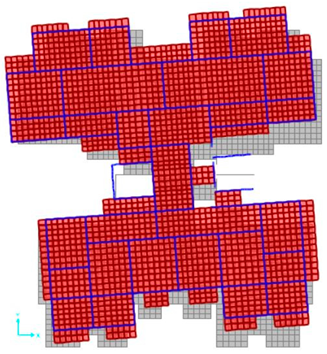
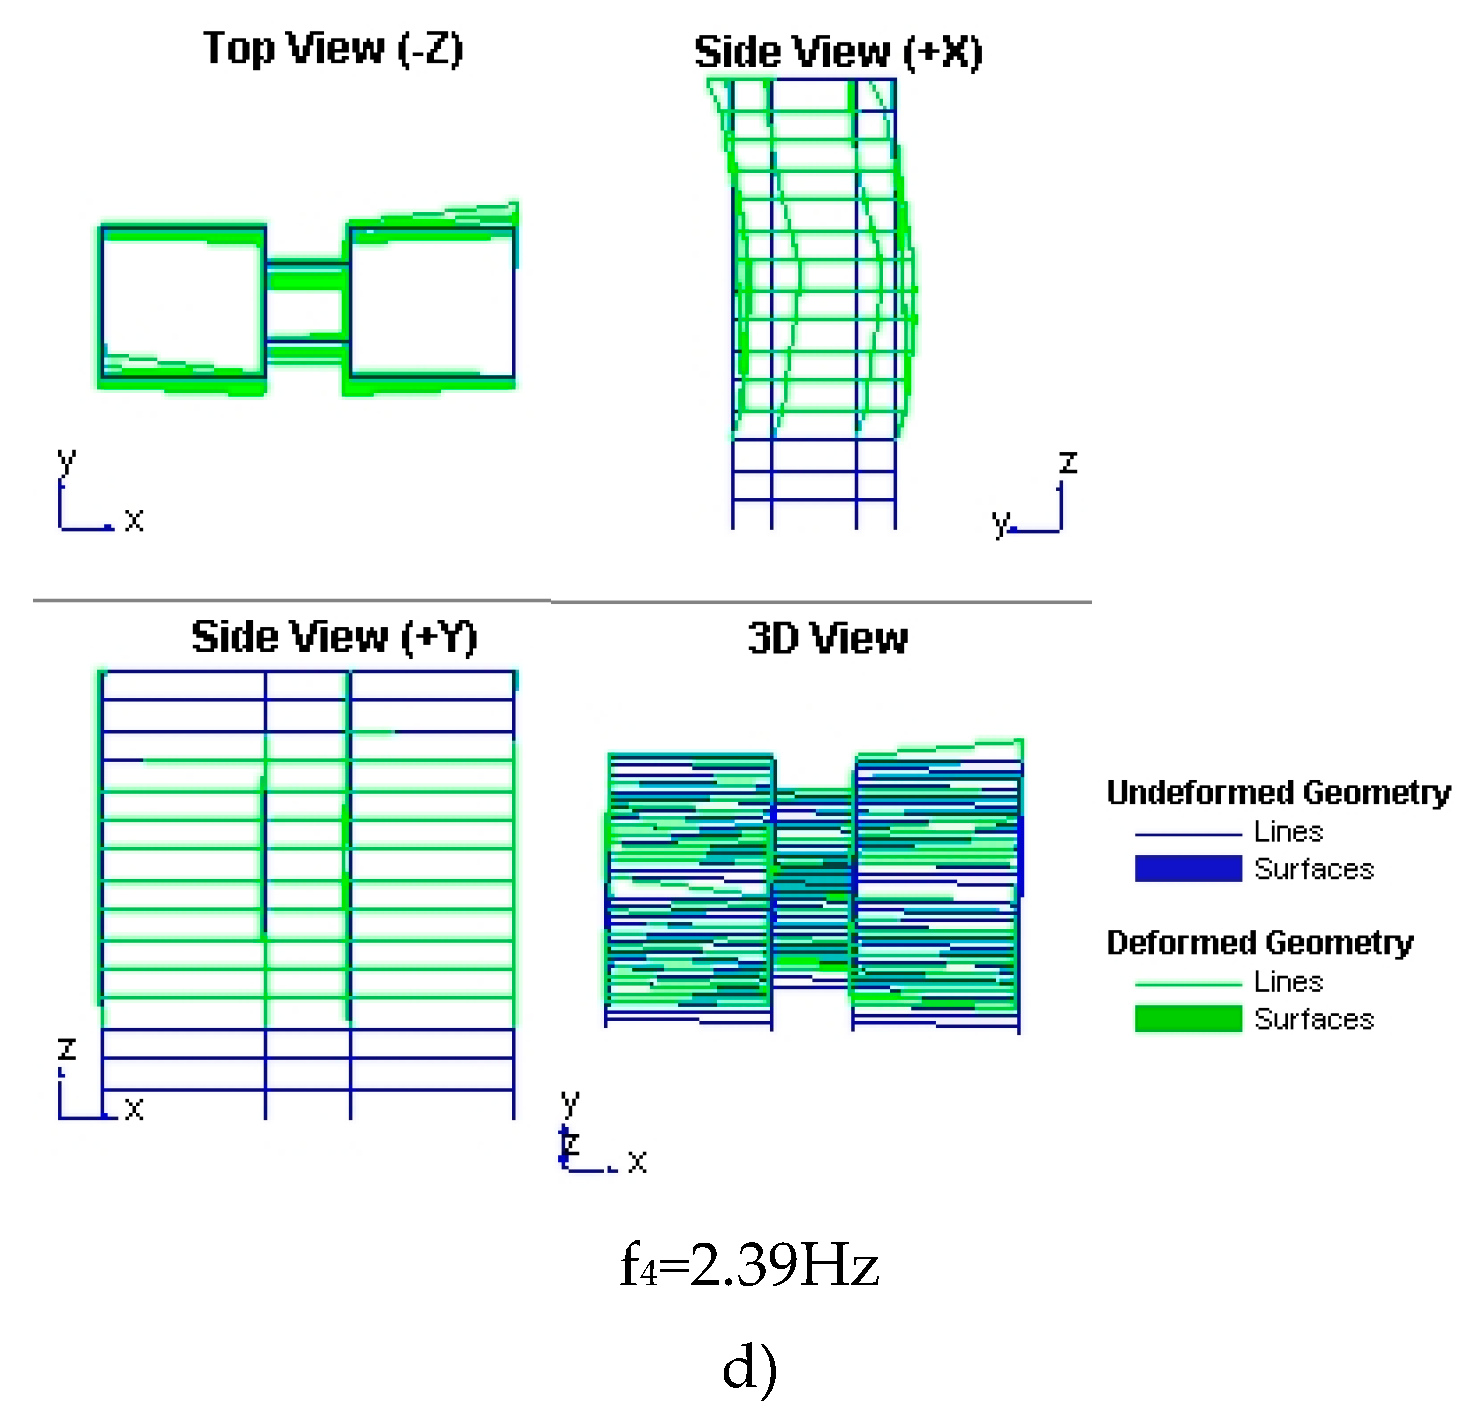
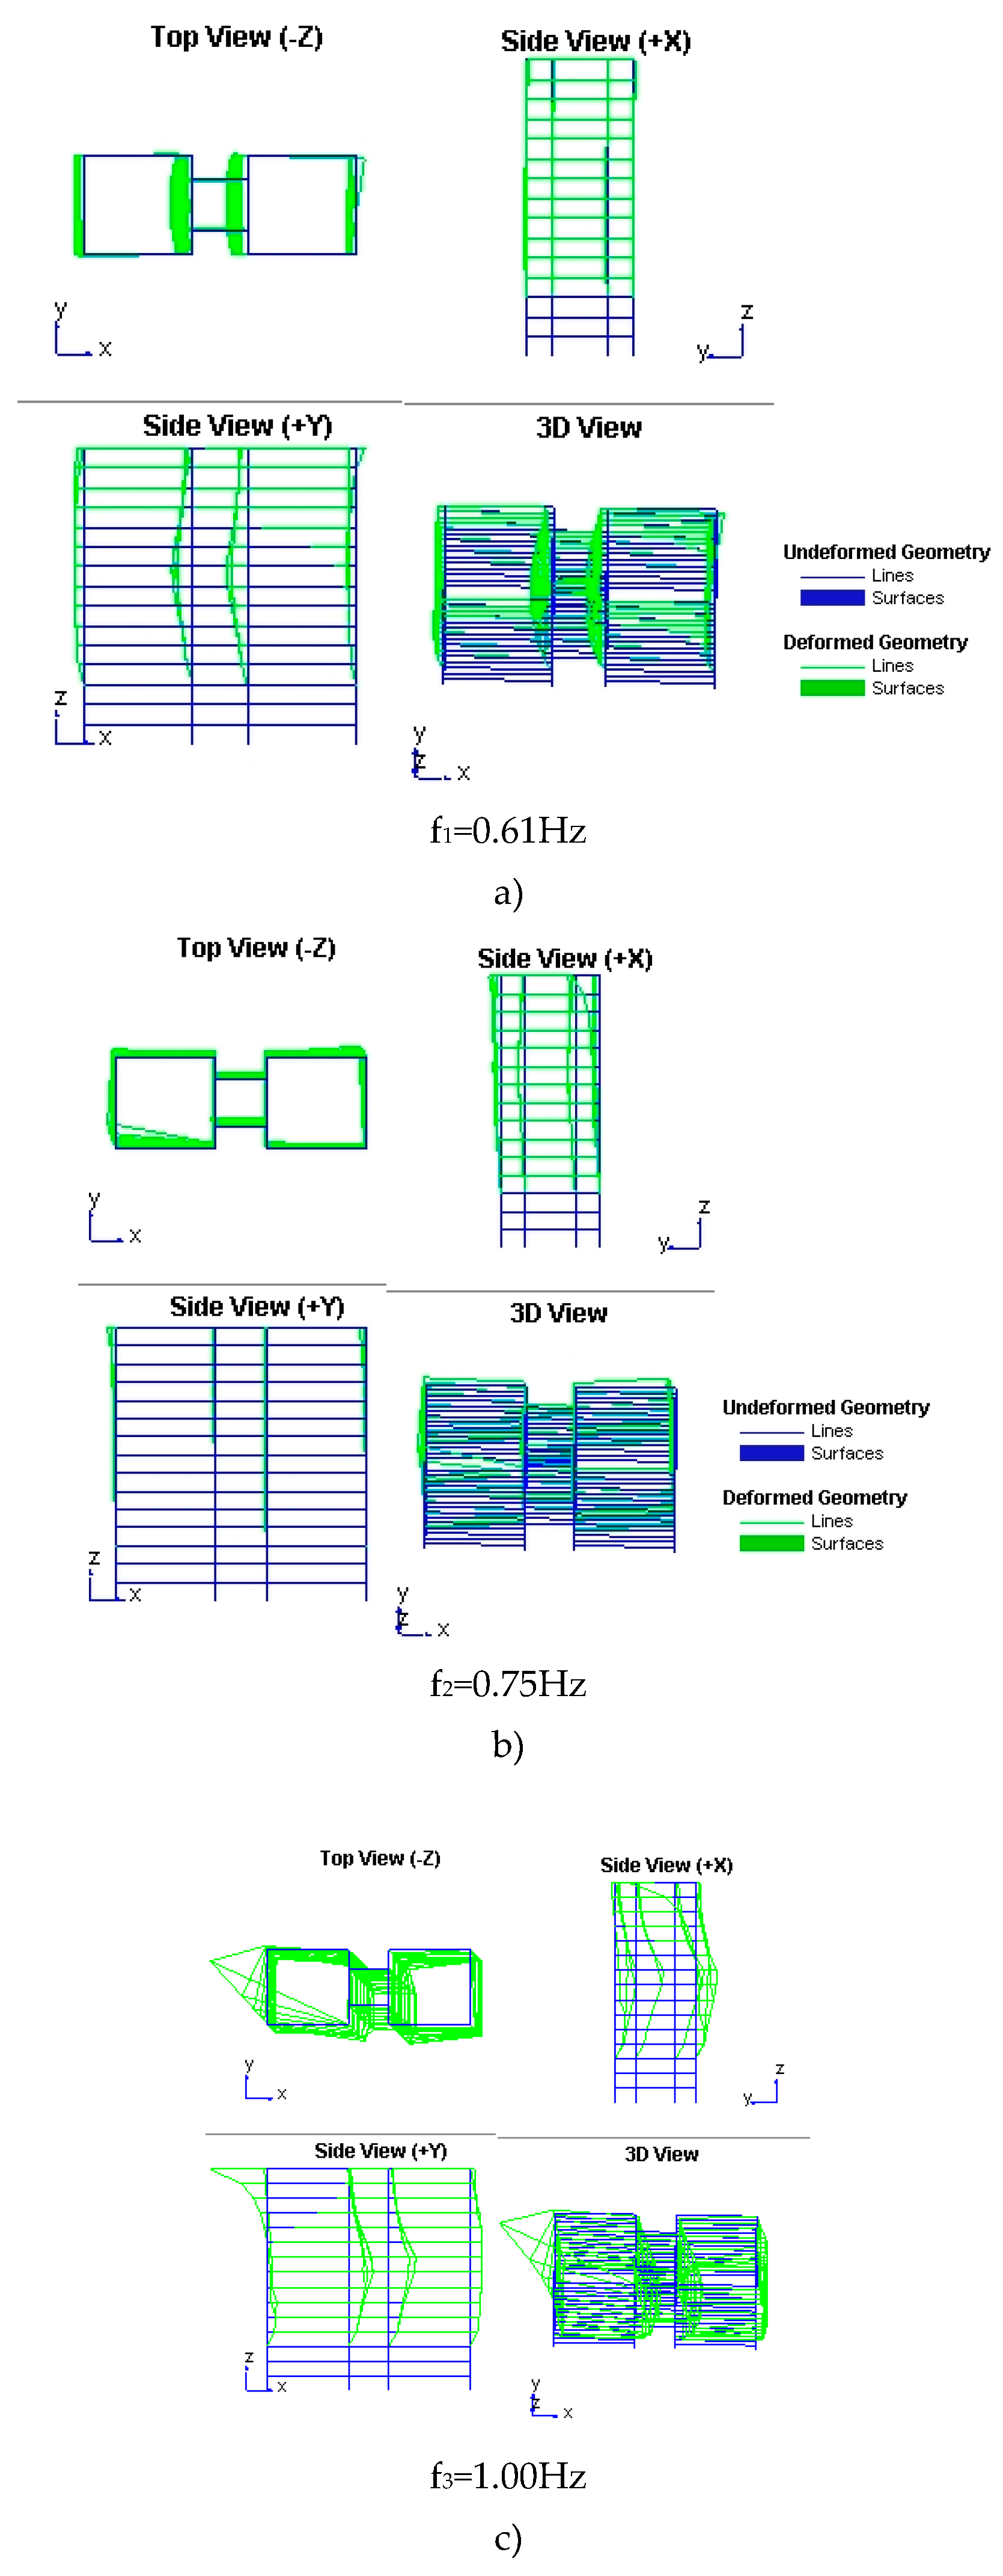
Figure 9.
Ambient vibration test results: vibration modes corresponding to (a) 1st frequency; (b) 2nd frequency, (c) 3rd frequency and (d) 4th frequency.
Figure 9.
Ambient vibration test results: vibration modes corresponding to (a) 1st frequency; (b) 2nd frequency, (c) 3rd frequency and (d) 4th frequency.
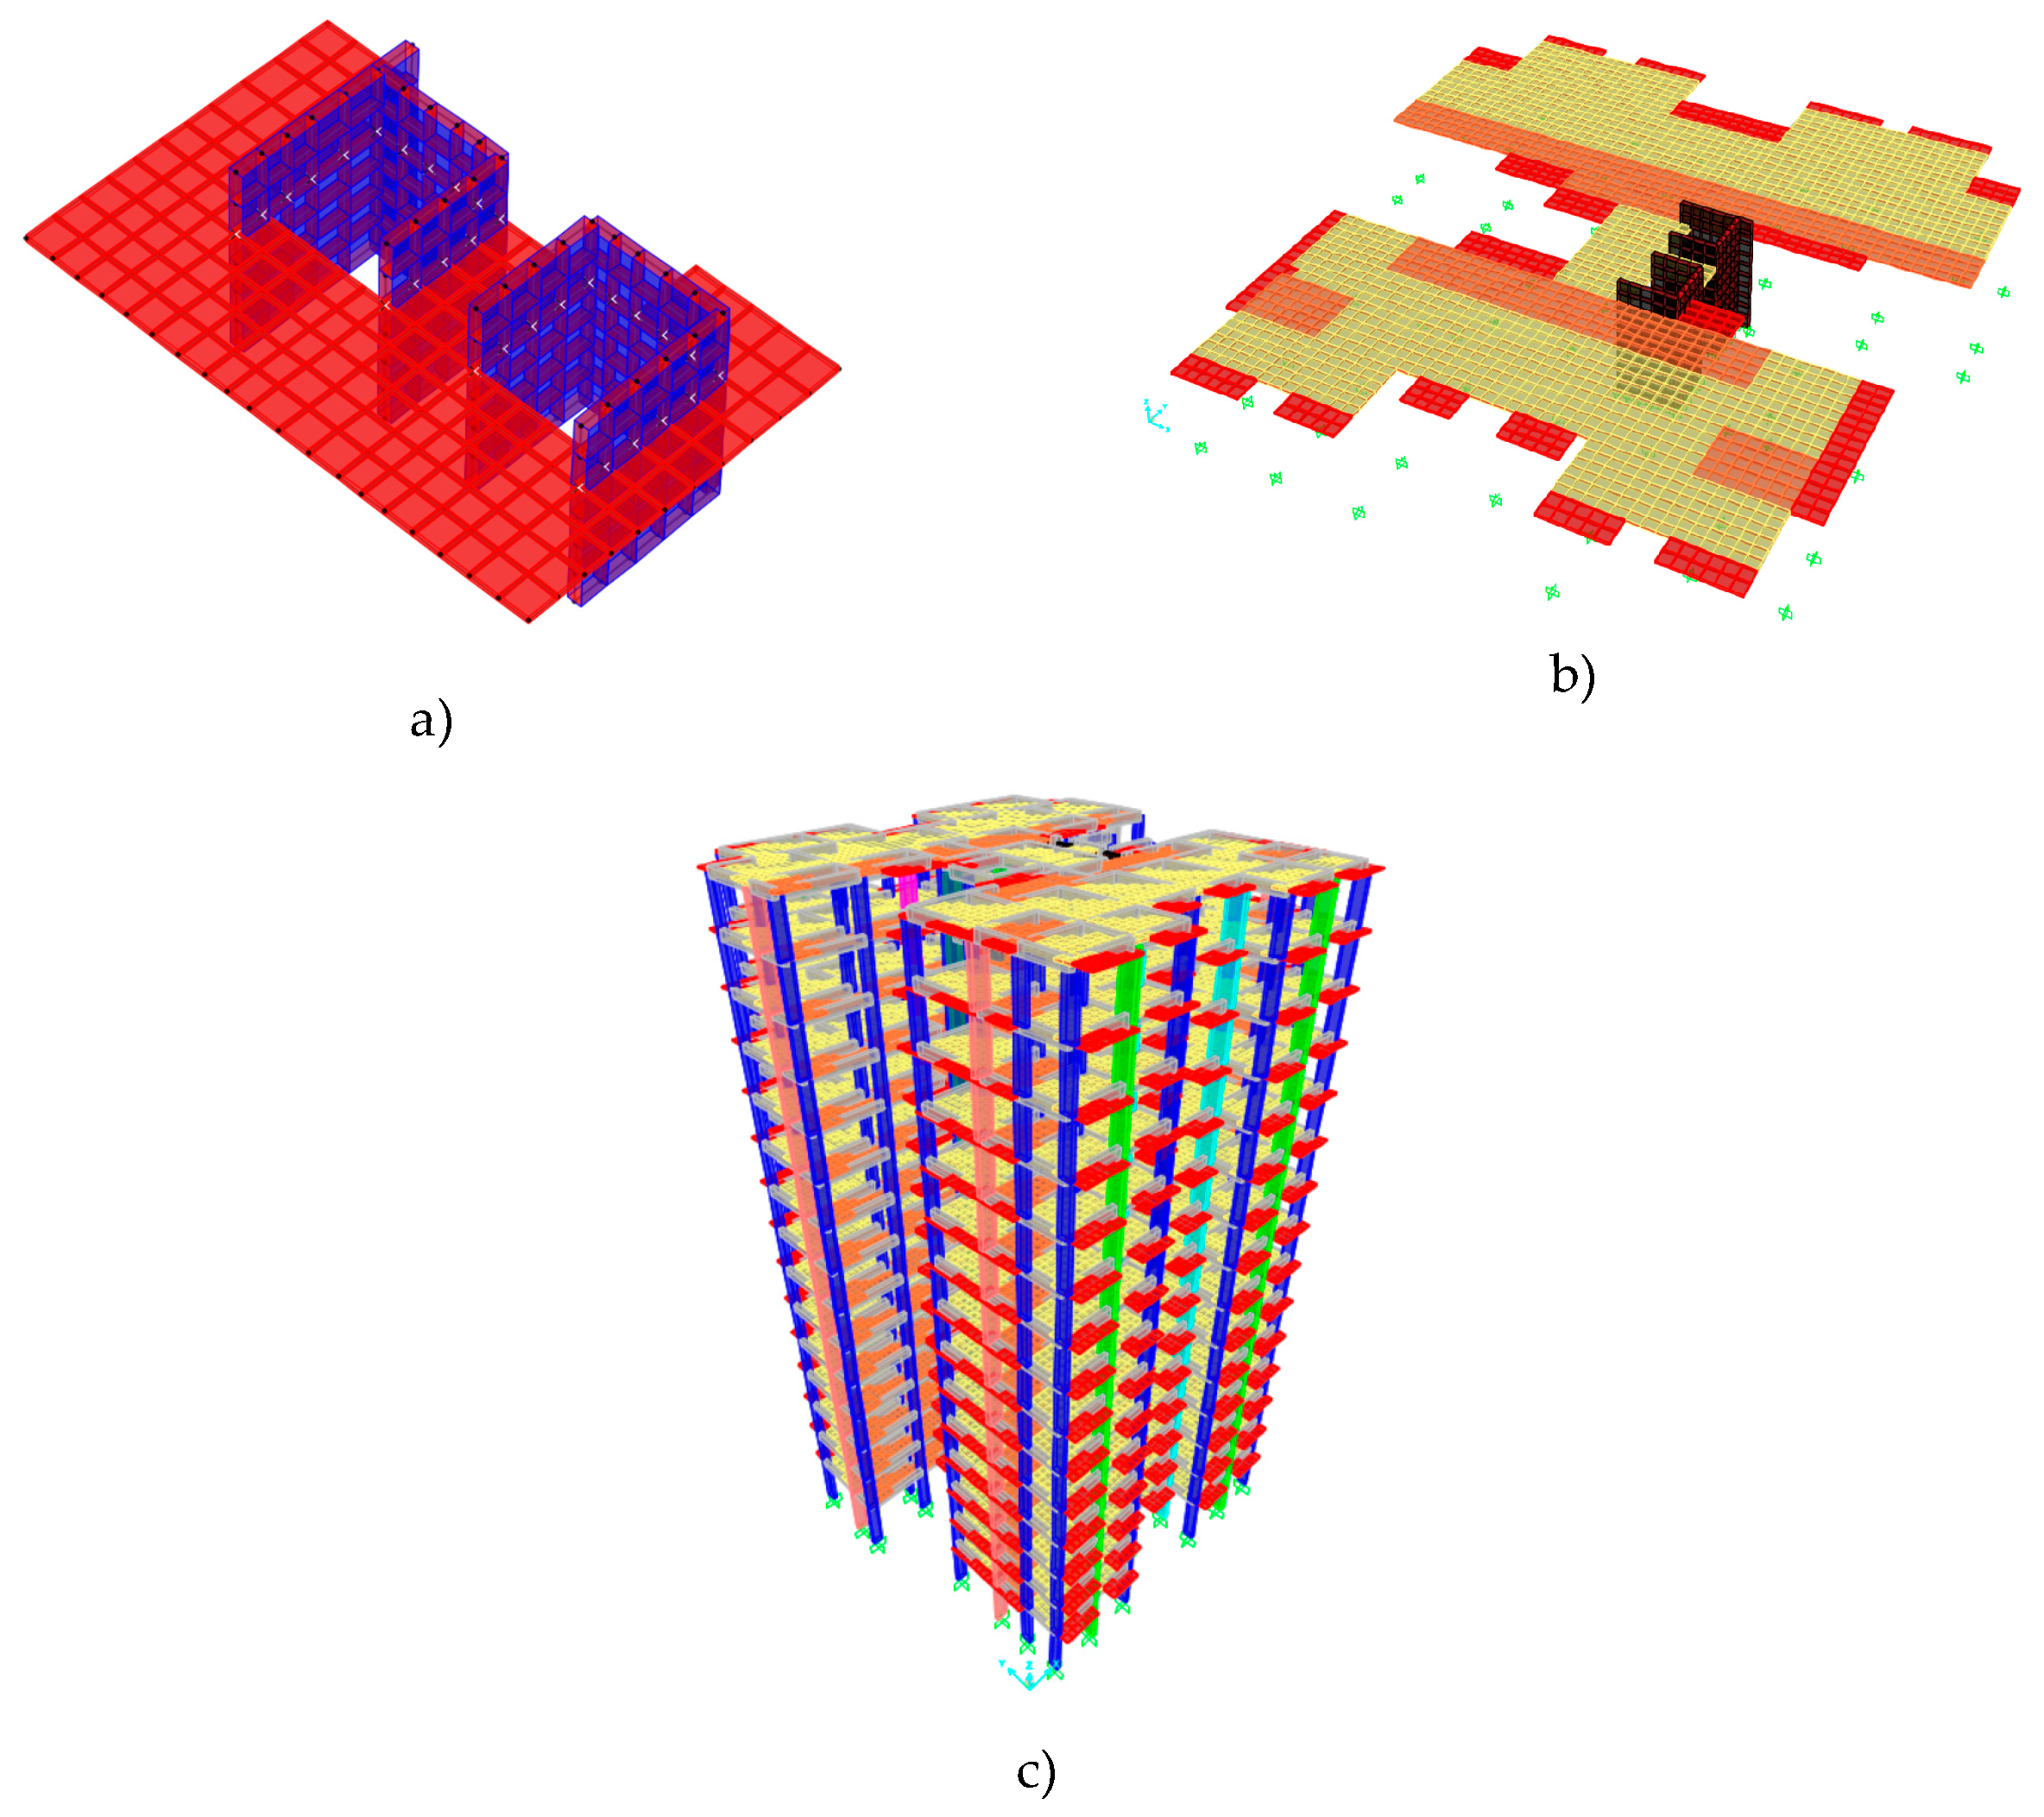
Figure 10.
Numerical modelling of RC structure: (a) detail of the RC cores and slabs connection; (b) plan view; (c) 3D view.
Figure 10.
Numerical modelling of RC structure: (a) detail of the RC cores and slabs connection; (b) plan view; (c) 3D view.
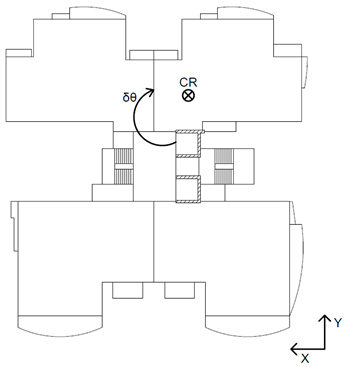
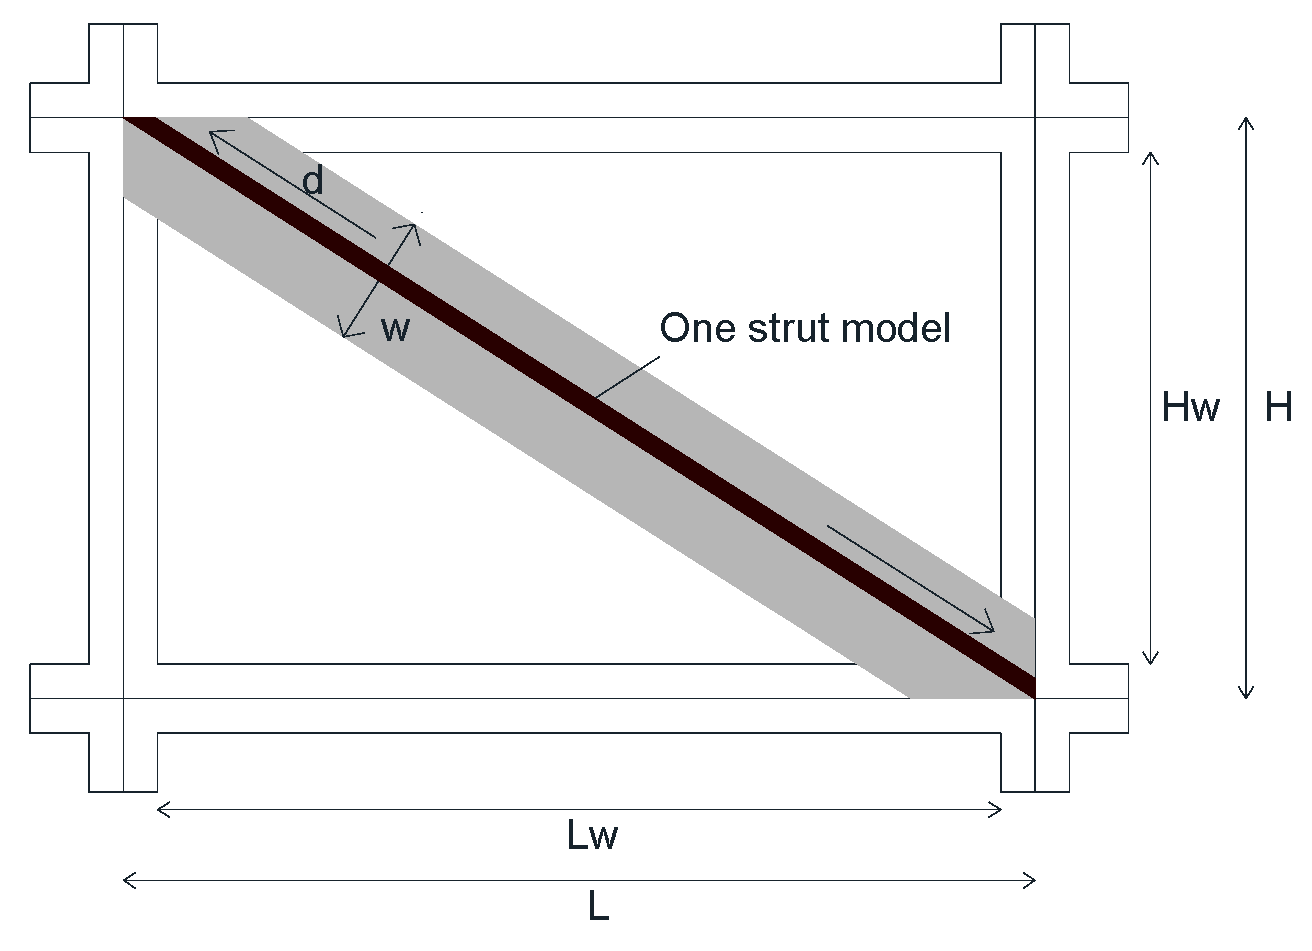
Figure 11.
Infill masonry walls numerical modelling strategy: equivalent one strut model (w—strut width; Lw—panel length; Hw—panel height; H—inter-storey height; L—storey length).
Figure 11.
Infill masonry walls numerical modelling strategy: equivalent one strut model (w—strut width; Lw—panel length; Hw—panel height; H—inter-storey height; L—storey length).
Figure 12.
Schematic layout of the infill masonry wall level of damages assumed.
Figure 12.
Schematic layout of the infill masonry wall level of damages assumed.
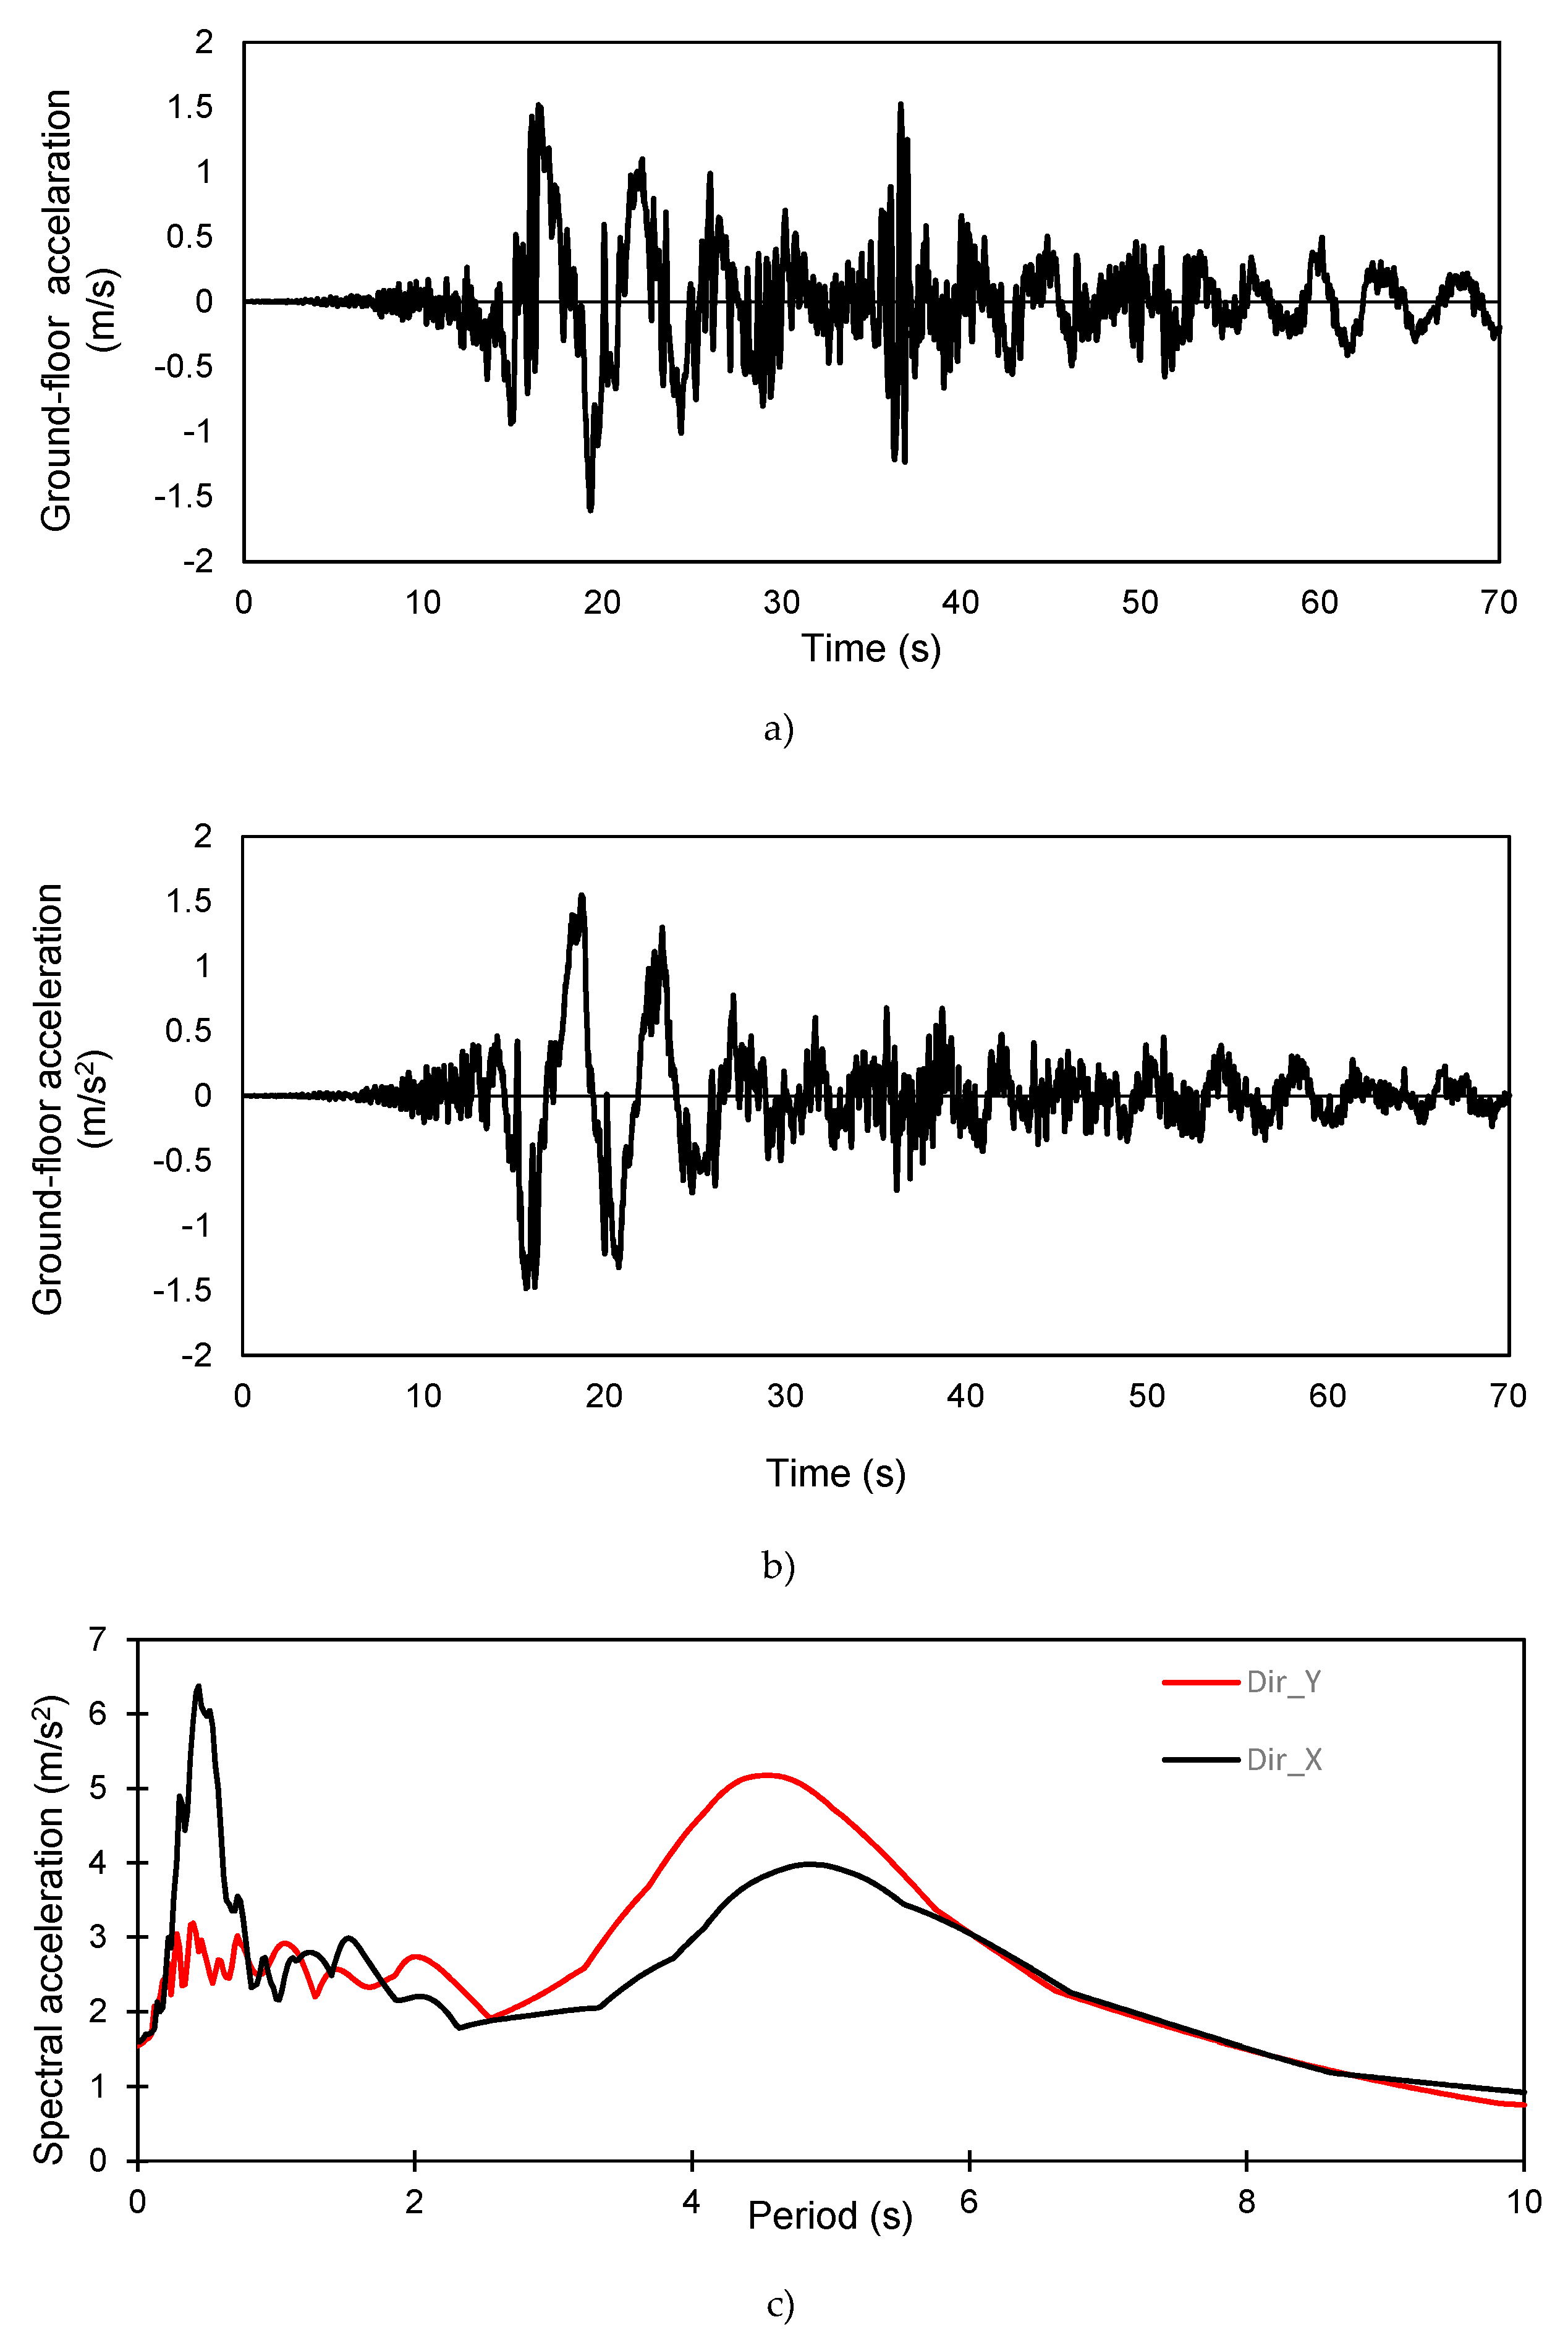
Figure 13.
Linear elastic dynamic analysis: (a) accelerogram (direction X); (b) accelerogram (direction Y); and (c) spectral acceleration.
Figure 13.
Linear elastic dynamic analysis: (a) accelerogram (direction X); (b) accelerogram (direction Y); and (c) spectral acceleration.
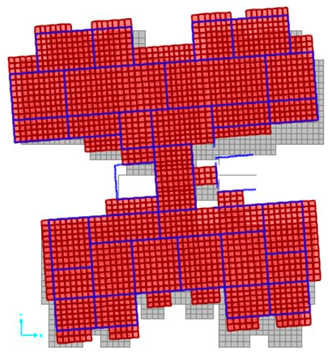
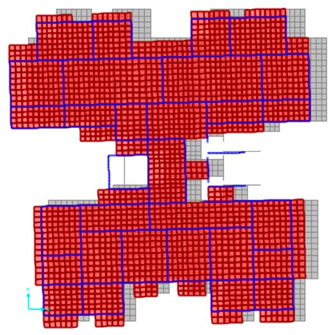
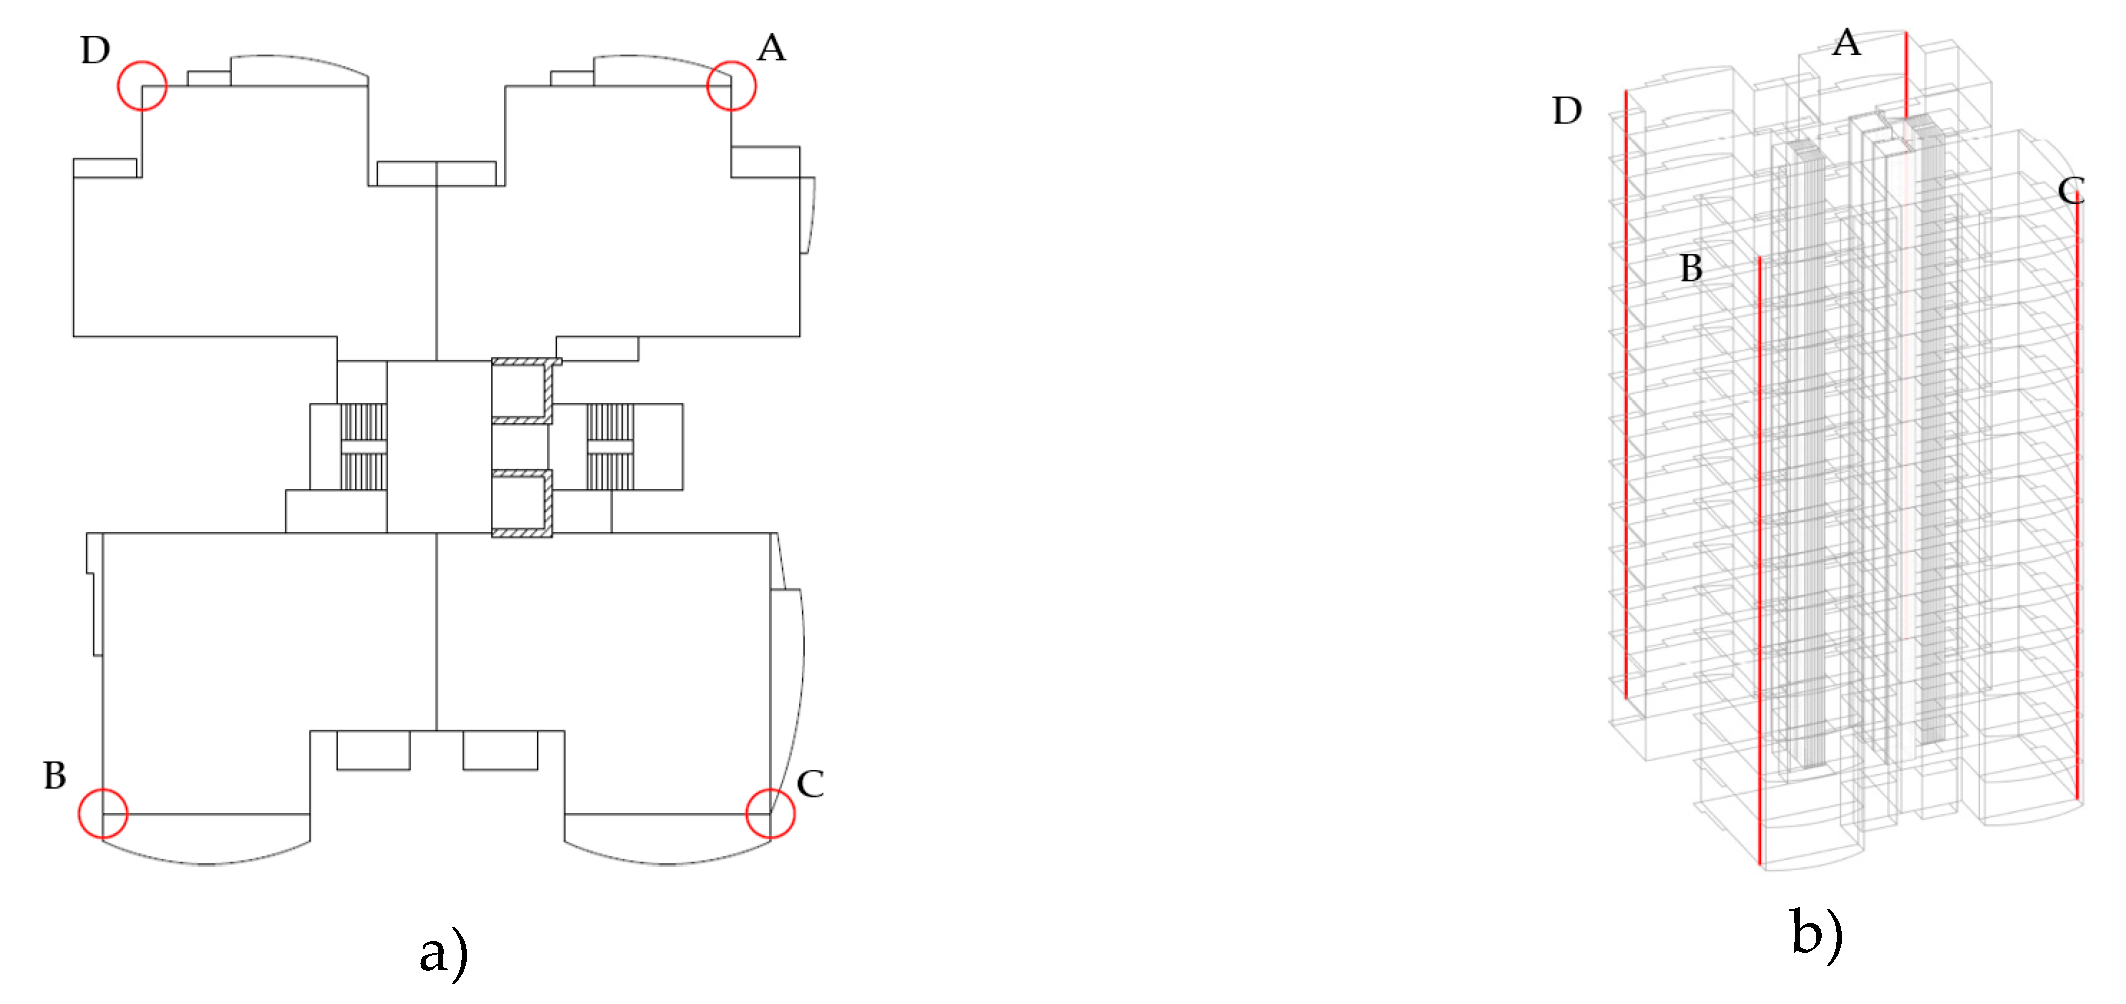
Figure 14.
Linear elastic dynamic analysis: vertical alignments under study (a) plan view; (b) 3D view.
Figure 14.
Linear elastic dynamic analysis: vertical alignments under study (a) plan view; (b) 3D view.
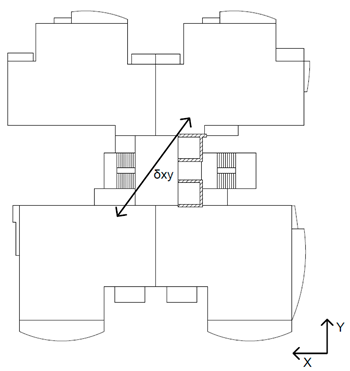
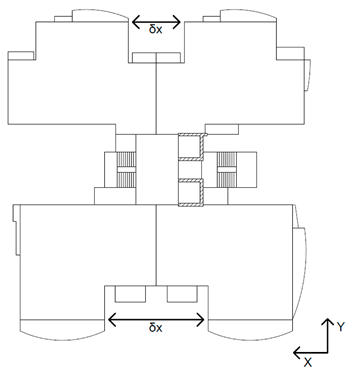
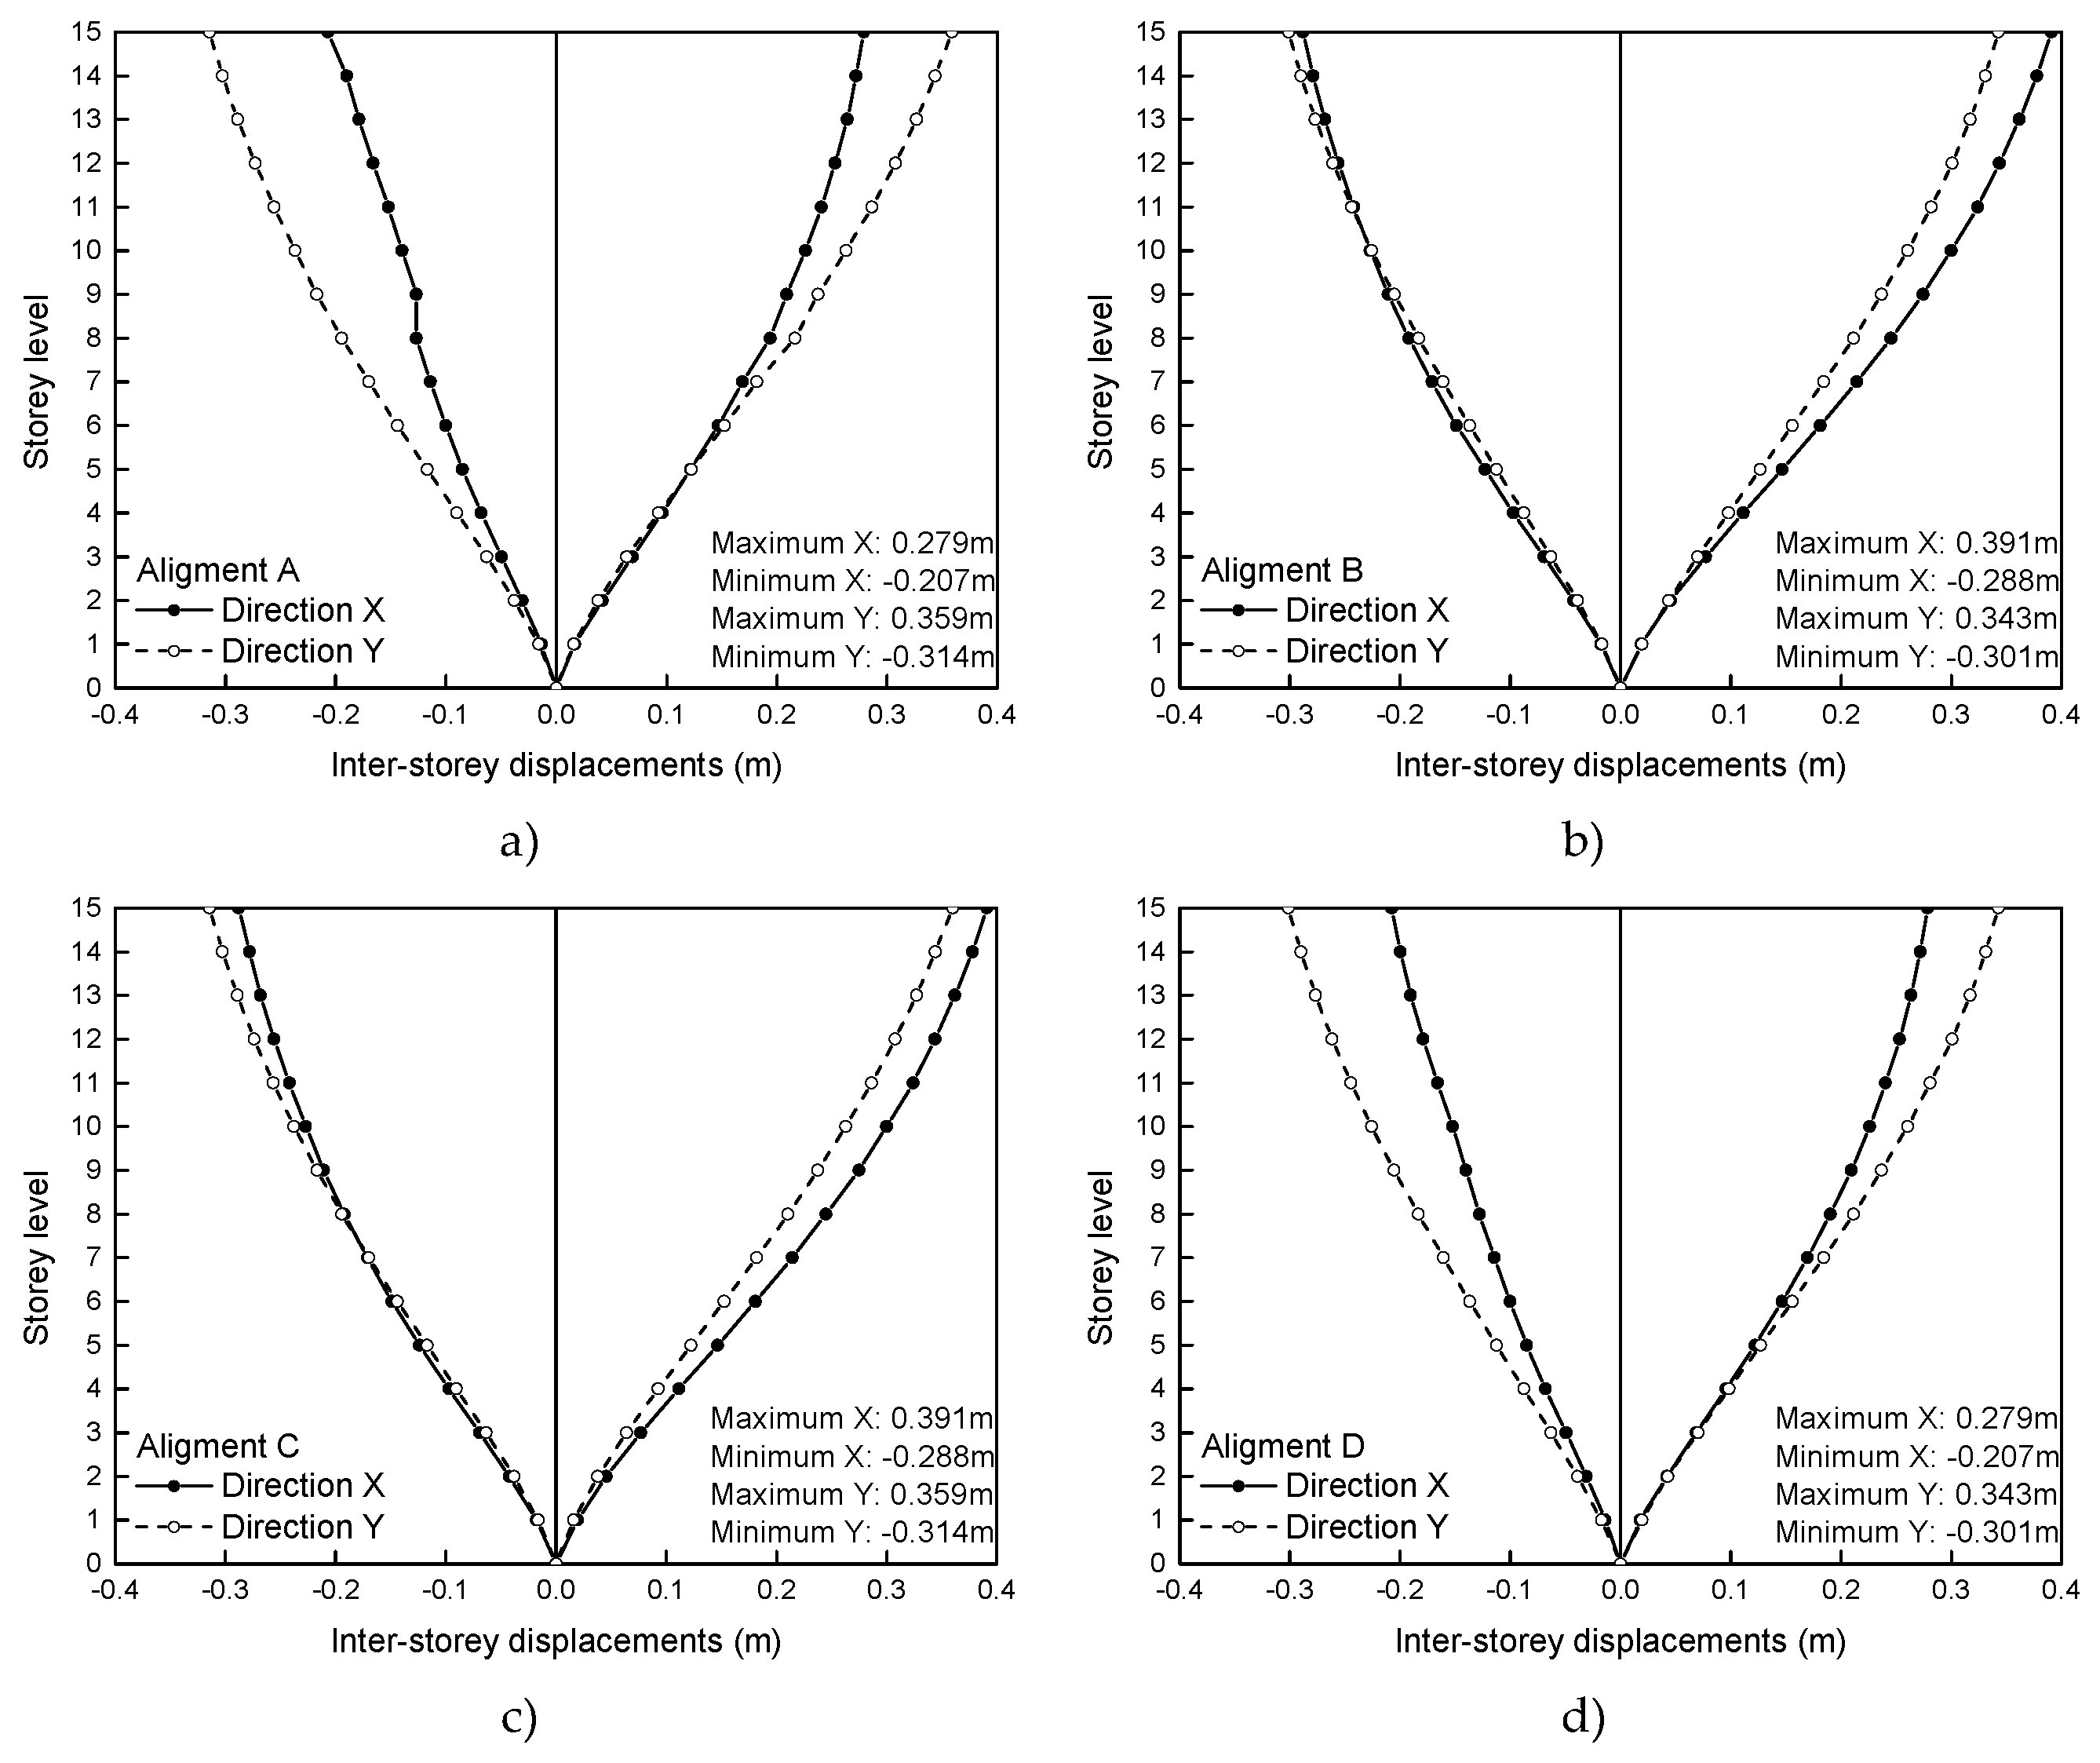
Figure 15.
Linear elastic dynamic analysis result: maximum inter-storey displacement of Model 3 (a) alignment A; (b) alignment B; (c) alignment C and; (d) alignment D.
Figure 15.
Linear elastic dynamic analysis result: maximum inter-storey displacement of Model 3 (a) alignment A; (b) alignment B; (c) alignment C and; (d) alignment D.
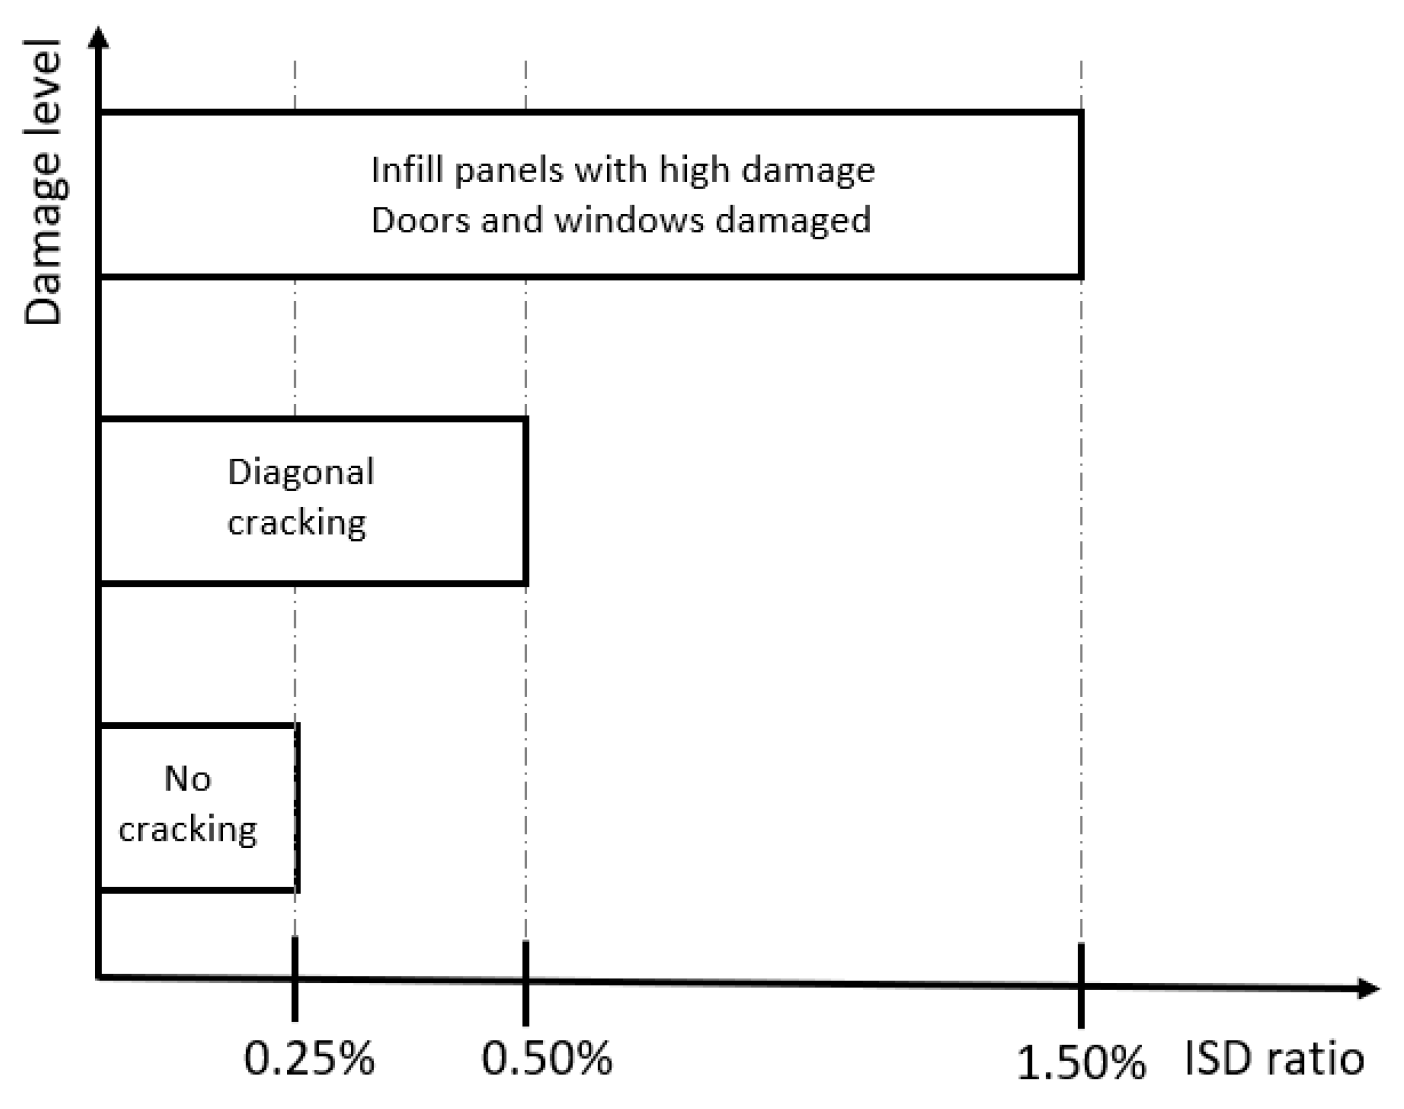
Figure 16.
Relationship between maximum ISD ratio and infill masonry damage level proposed by FEMA-306.
Figure 16.
Relationship between maximum ISD ratio and infill masonry damage level proposed by FEMA-306.
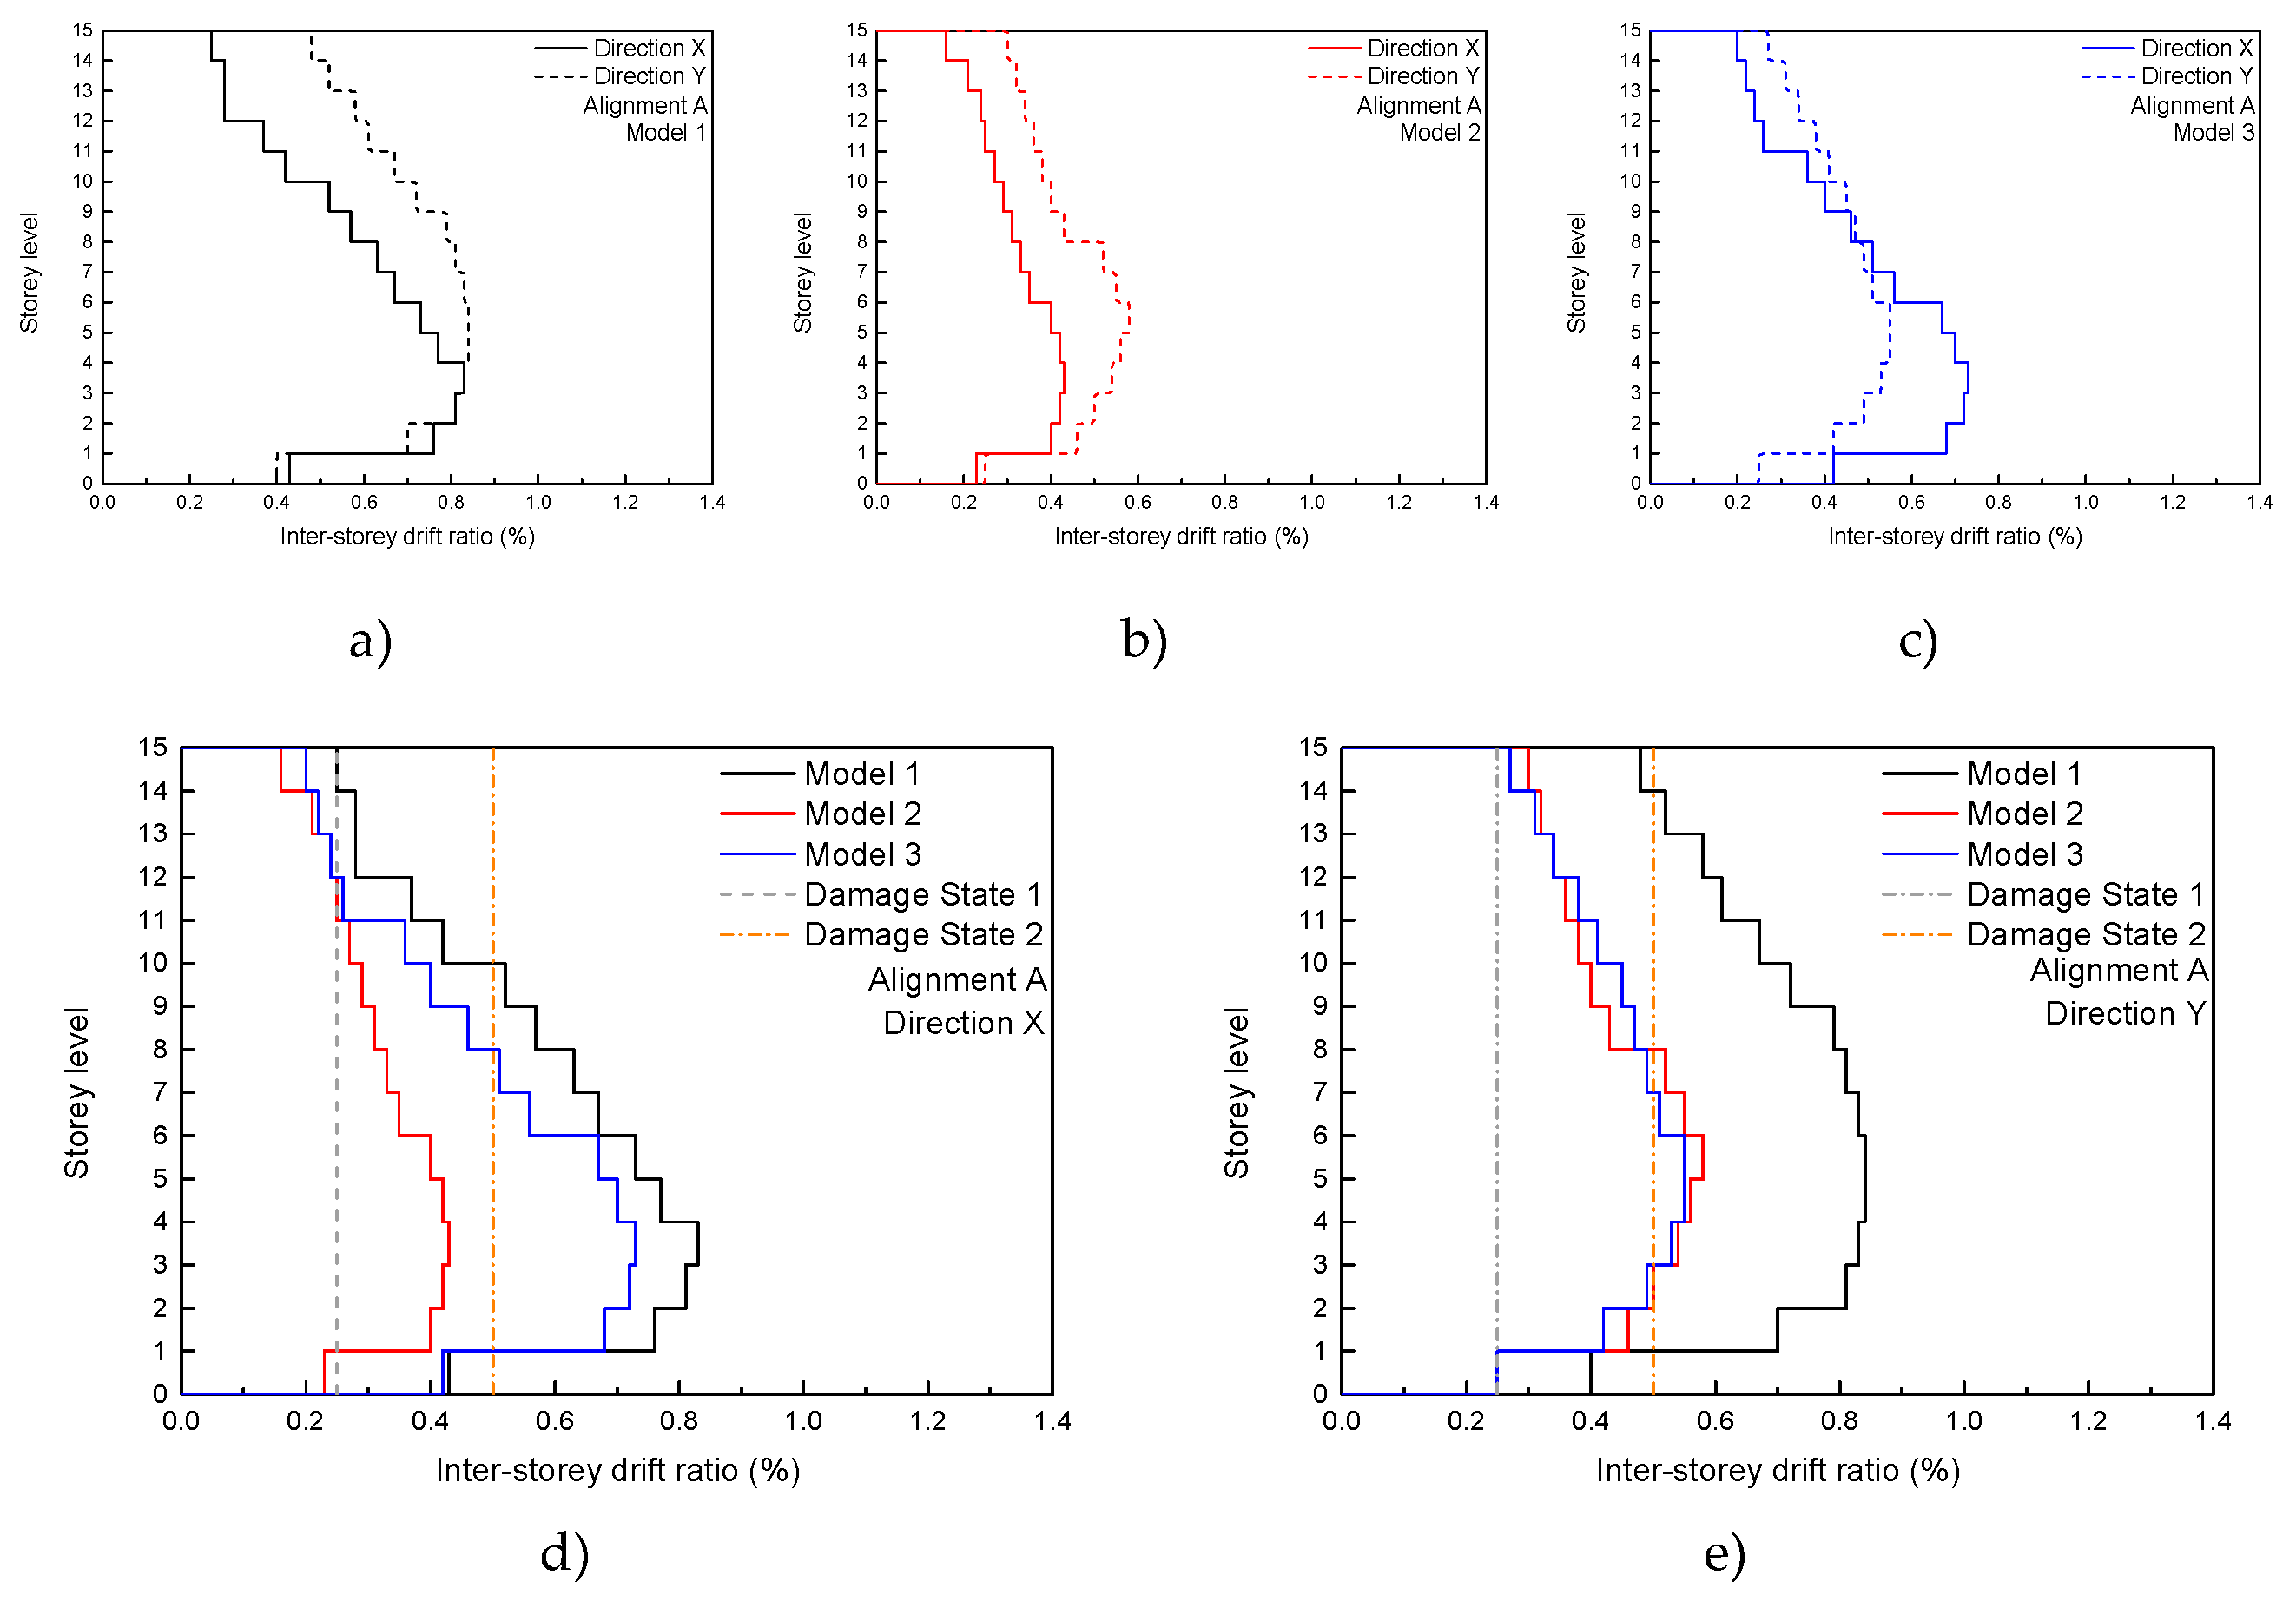
Figure 17.
Linear elastic dynamic analysis result: maximum inter-storey drift ration (alignment A) (a) Model 1; (b) Model 2; (c) Model 3; (d) global comparison (Direction X); and (e) global comparison (direction Y).
Figure 17.
Linear elastic dynamic analysis result: maximum inter-storey drift ration (alignment A) (a) Model 1; (b) Model 2; (c) Model 3; (d) global comparison (Direction X); and (e) global comparison (direction Y).
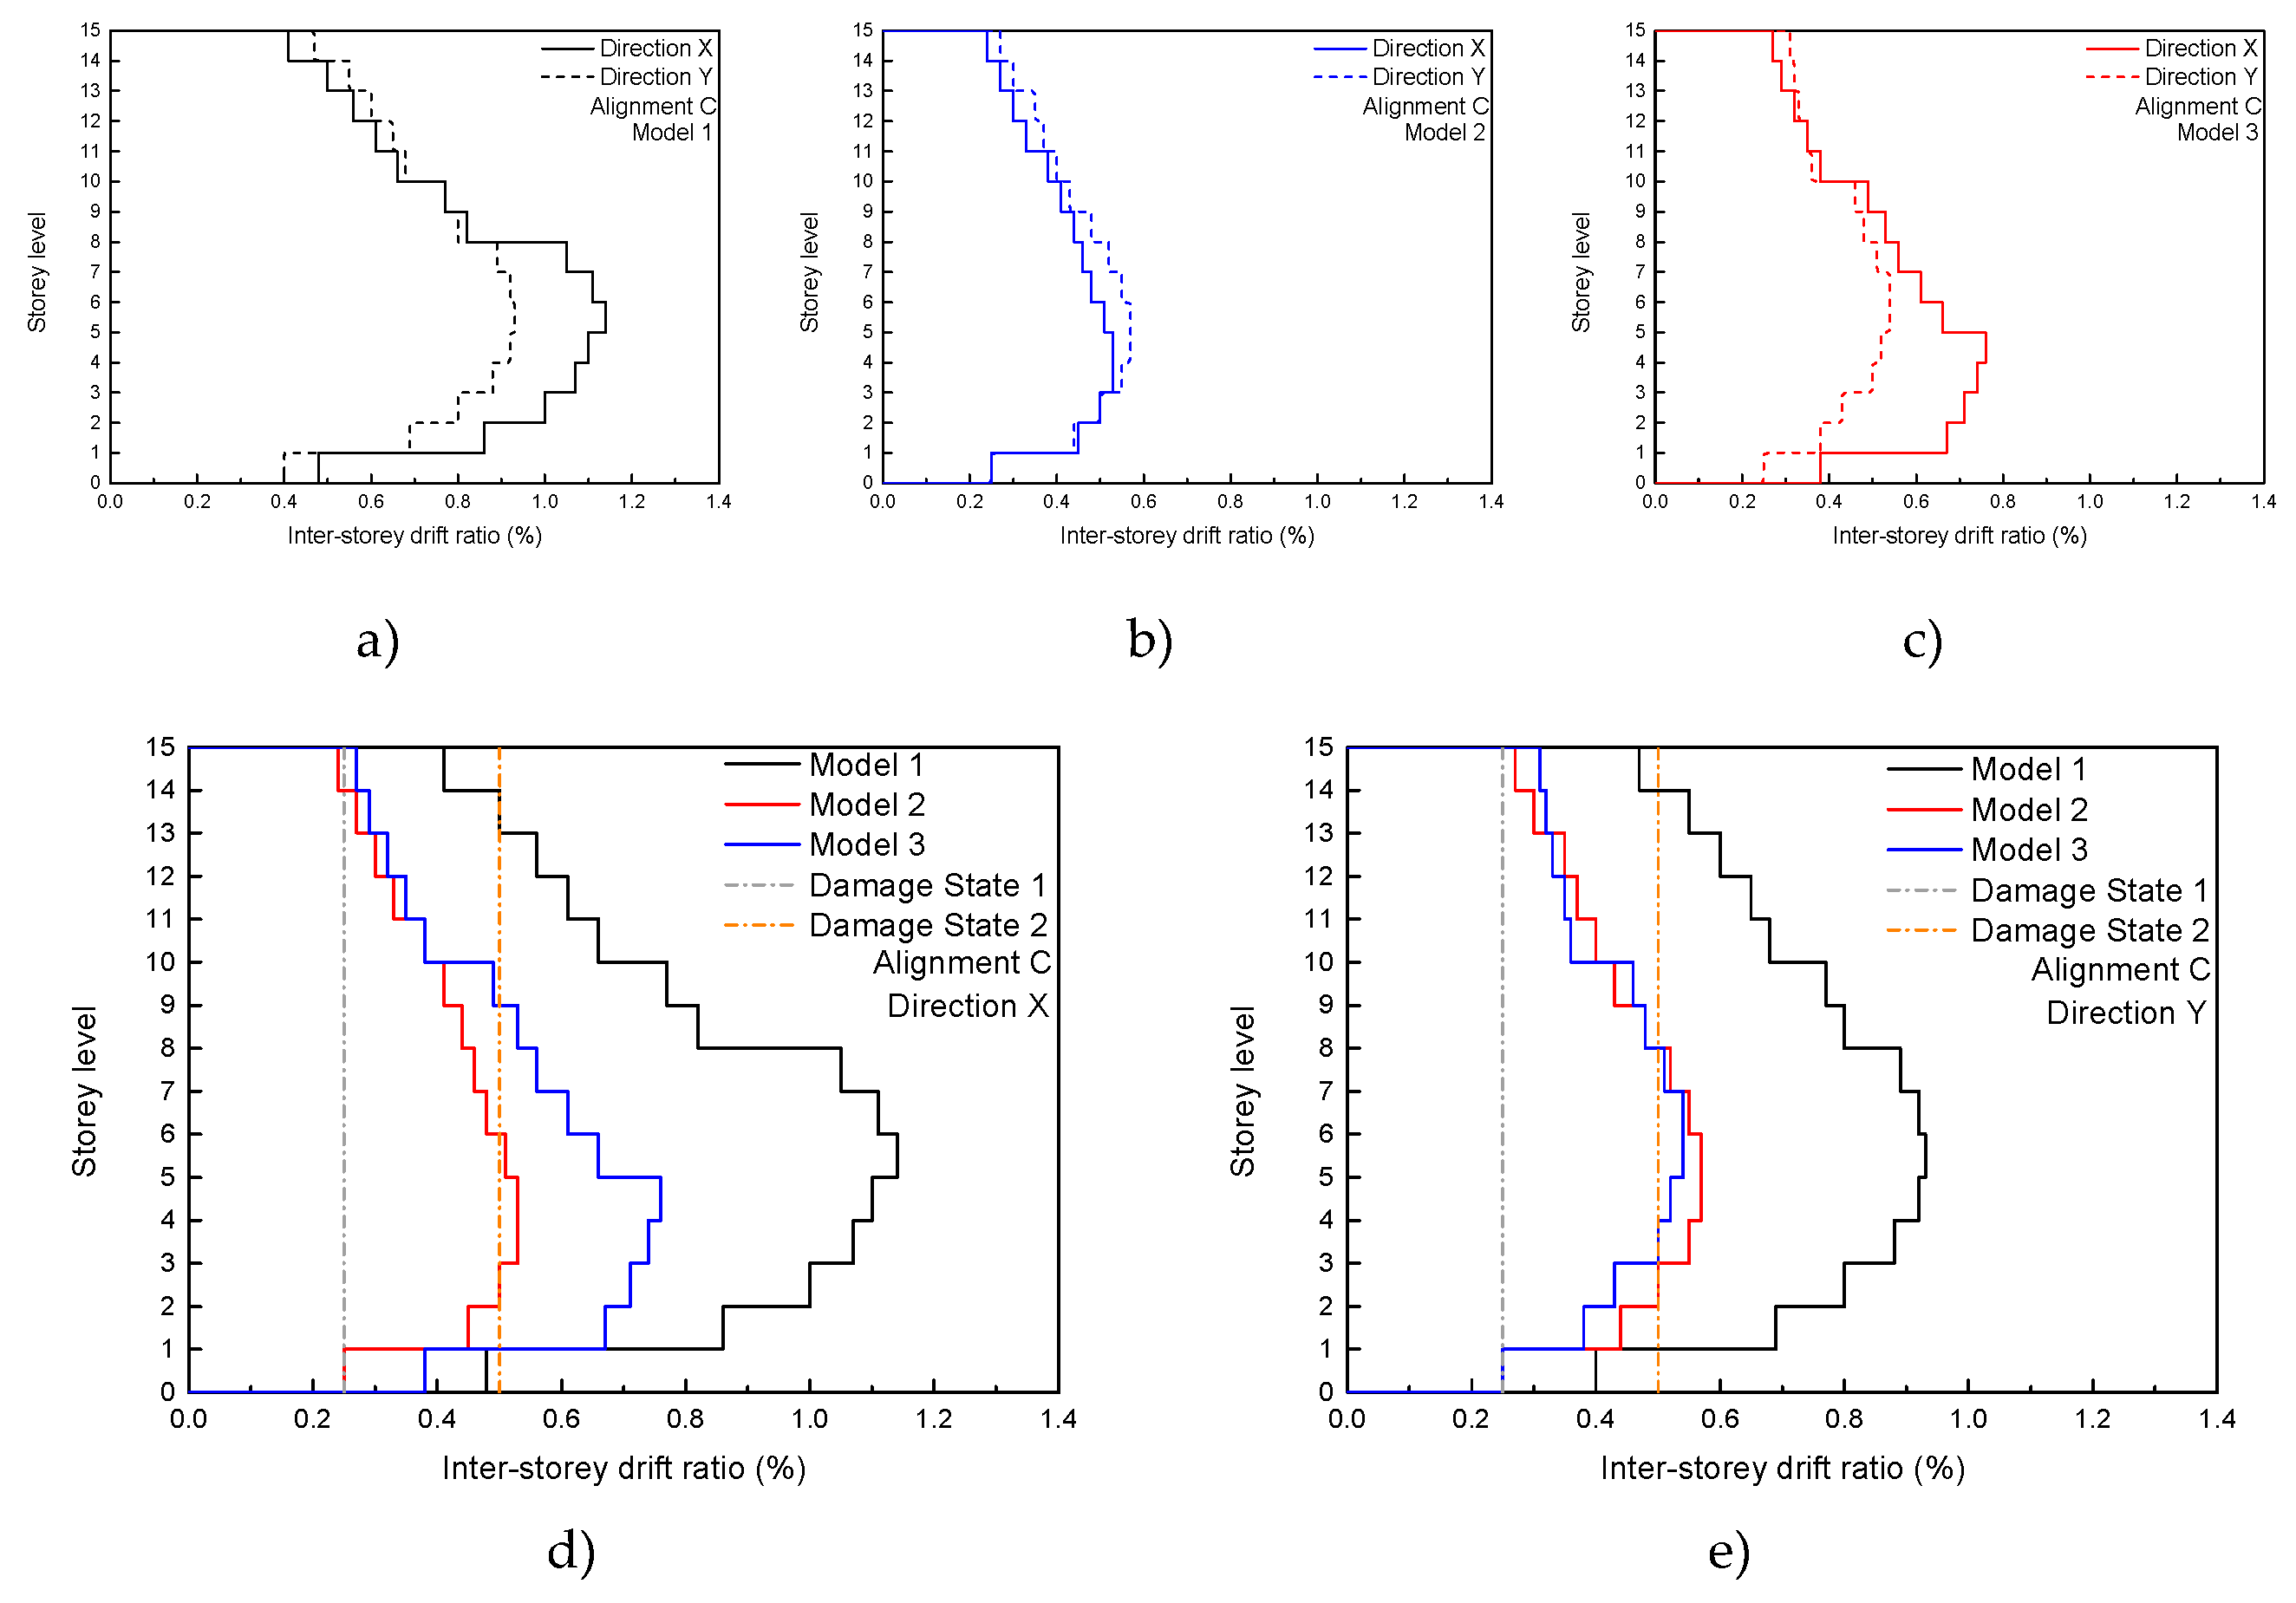
Figure 18.
Linear elastic dynamic analysis result: maximum inter-storey drift ration (alignment C) (a) Model 1; (b) Model 2; (c) Model 3; (d) global comparison (Direction X); and (e) global comparison (direction Y).
Figure 18.
Linear elastic dynamic analysis result: maximum inter-storey drift ration (alignment C) (a) Model 1; (b) Model 2; (c) Model 3; (d) global comparison (Direction X); and (e) global comparison (direction Y).
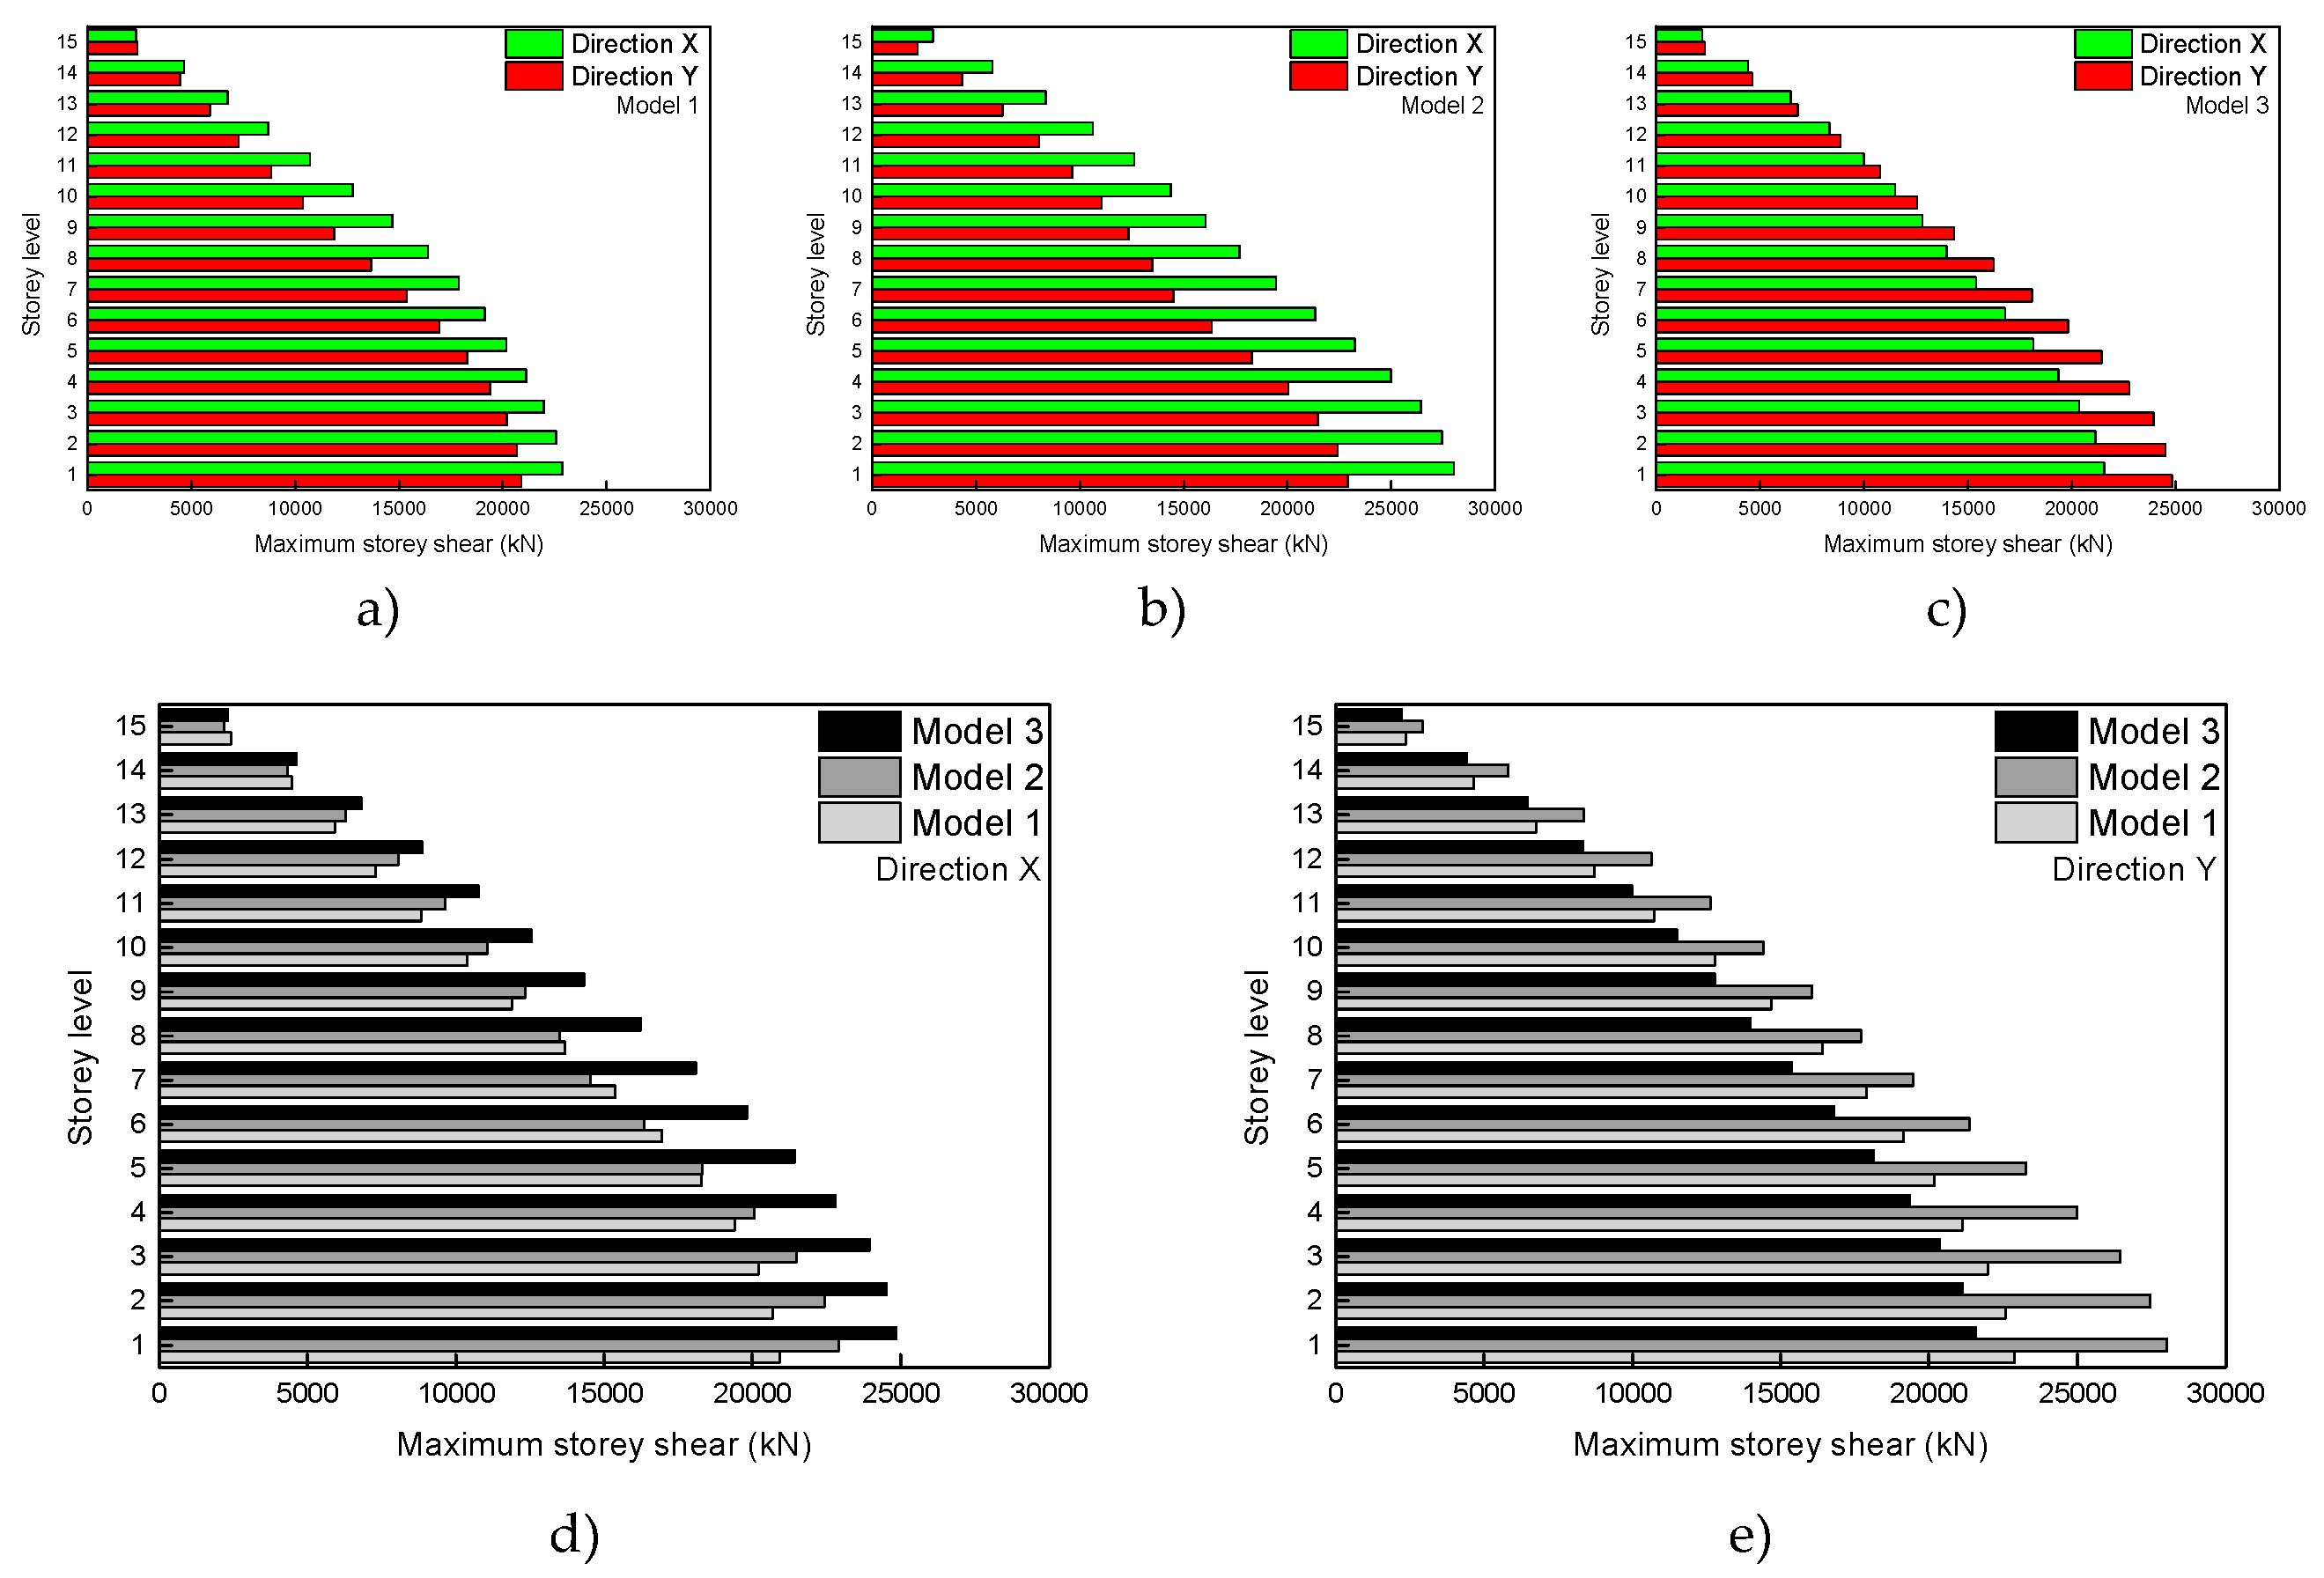
Figure 19.
Linear elastic dynamic analysis result: maximum storey shear (a) Model 1; (b) Model 2; (c) Model 3; (d) global comparison (Direction X); and (e) global comparison (direction Y).
Figure 19.
Linear elastic dynamic analysis result: maximum storey shear (a) Model 1; (b) Model 2; (c) Model 3; (d) global comparison (Direction X); and (e) global comparison (direction Y).
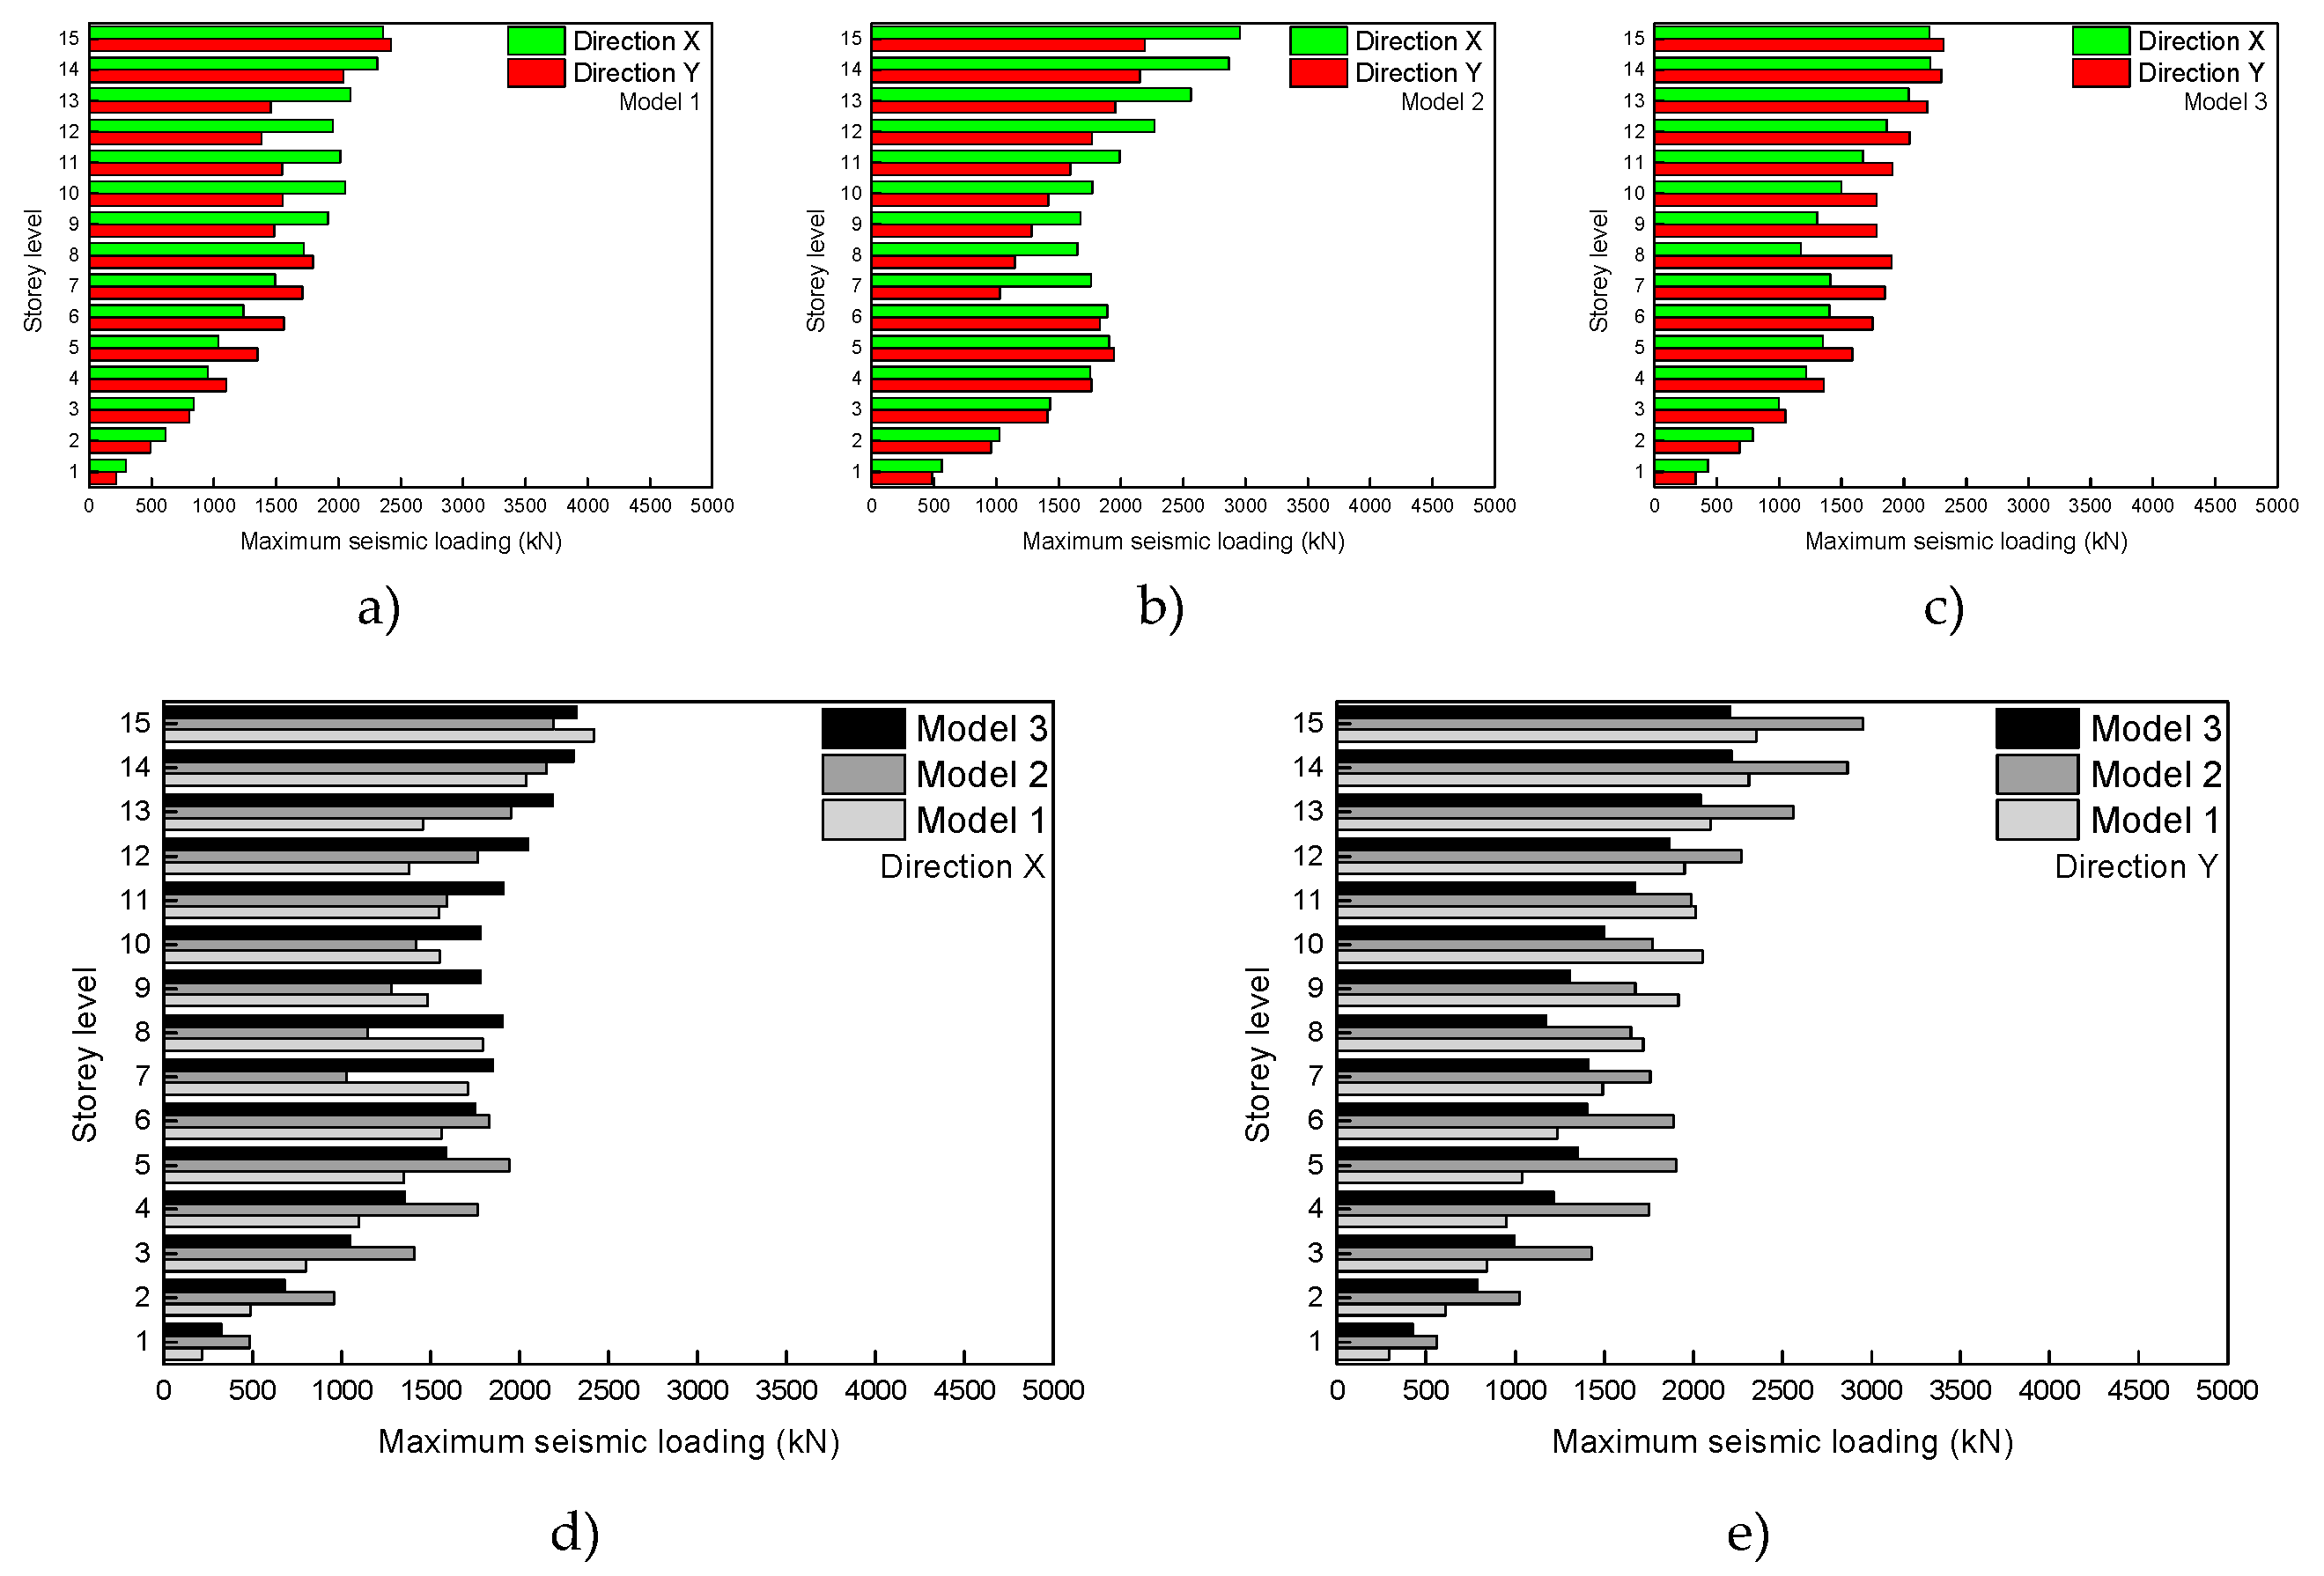
Figure 20.
Linear elastic dynamic analysis result: maximum seismic loading envelope (a) Model 1; (b) Model 2; (c) Model 3; (d) global comparison (Direction X); and (e) global comparison (direction Y).
Figure 20.
Linear elastic dynamic analysis result: maximum seismic loading envelope (a) Model 1; (b) Model 2; (c) Model 3; (d) global comparison (Direction X); and (e) global comparison (direction Y).
Table 1.
Case study: columns cross-section and nomenclature.
Table 1.
Case study: columns cross-section and nomenclature.
| Dimensions [mm] | Color | Columns Nomenclatures |
|---|
| 900 × 300 | Fluorescent green | P2 | P5 | P29 | P32 | P55 | P58 |
| 970 × 300 | Pink | P16 | P43 | P46 |
| 1125 × 300 | Hot pink | P18 | P20 |
| 1100 × 300 | Baby blue | P49 | P51 |
| 855 × 300 | Yellow | P40 | P42 |
| 800 × 300 | Grey | P22 |
| 645 × 300 | Gray | P34 | P35 |
| 750 × 300 | Blue | Remaining columns |
Table 2.
R2 reduction factor.
Table 2.
R2 reduction factor.
| Hw/t | Moderated Damages | Extensive Damages |
|---|
| ≤ 21 | 0.7 | 0.4 |
| > 21 | 0—Repairing strategies are needed |
Table 3.
Modal analysis results: model without infill masonry walls (Model 1).
Table 4.
Modal analyses results: model with undamaged infill masonry walls.
Table 5.
Modal analysis results: model with undamaged infill masonry walls.
Table 5.
Modal analysis results: model with undamaged infill masonry walls.
| Type of Results | Natural Frequencies |
|---|
| 1st Vibration Mode | 2nd Vibration Mode |
|---|
| Experimental | 0.61 | 0.75 |
| Model 1 | 0.52 | 0.57 |
| Model 2 | 0.78 | 0.86 |
Table 6.
Modal analysis results: model with infill masonry walls (damaged)—Model 3.
Table 7.
Modal analyses results: global comparison.
Table 7.
Modal analyses results: global comparison.
| Model | Vibration Modes |
|---|
| f1 | f2 | f3 |
|---|
| Model 1 | 0.52 | 0.57 | 2.14 |
| Model 2 | 0.78 | 0.86 | 2.52 |
| Model 3 | 0.65 | 0.77 | 2.26 |
| experimental | 0.61 | 0.75 | 2.39 |


