1. Introduction
External cladding is an important part in construction and its defect detection is necessary to ensure construction safety [
1,
2,
3]. The current approaches to inspecting external cladding for identifying mistakes or defects are costly and time consuming. This would be even worse if the detection methods found the issue after dismantling the scaffold because the rectification should be done through the boom/scissor lift. To find these issues in the early stages, engineers are required to visit the site every day and spend plenty of time on each project, which increases the construction costs. However, using an automatic edge detection system, which assists in finding the defects, may reduce the time engineers need to spend on site and consequently reduce the construction costs. Thus, automatic edge detection is an urgent need which should be investigated to address the above-mentioned needs using different cameras and algorithms. Photography is gradually being applied in construction using ordinary photography and oblique photography. Unmanned aerial vehicles, three-dimensional (3D) and two-dimensional(2D) cameras and time lapse cameras are widely used in photography. These technologies combining 3D scanners are useful for creating as-built models [
4,
5].
Edge detection is used for preliminarily analyses and identifying features of images by judging edges of the image. Although there are studies on edge and defect detection methods in different disciplines such as face recognition and handwriting [
6,
7], defect detection using the edge detection approach is still an open problem in terms of accuracy and the process of automation [
8]. There are recent attempts in construction such as investigation of asphalt and concrete change monitoring mentioned in [
9] and sewer pipe defect detection examined by Cheng and Wang [
10]. Very recent studies recommend image processing techniques for construction quality control including evaluation of the pavement surface drainage [
11] and measuring the productivity of tunnel earthmoving [
12]. A recent study suggested that CAD models should be updated by image mask filters, colour-based noise removal, and area-based progress estimations [
13]. Huang, et al. [
14] used edge detection algorithms for pavement crack detection with 2D grey-scale. As surroundings are lighter than pavement images in grey-scale images, pavements can be detected by judging brightness. Cha, et al. [
15] detected concrete defect and crack damage based on edge detection. Three hundred and thirty-two raw concrete images have been selected and the results of their image analysis were highly accurate by detecting 90% of cases. Chen, et al. [
16] proposed a video processing method with Bayesian data to detect crack edges on metallic surfaces of nuclear power plants. Feng, et al. [
17] developed a deep active learning system for automatic concrete defect detection including cracks, deposits and water leakages with 87.5% accuracy. Since some objects are not accessible in construction sites or tall buildings, the image processing methods can be used as non-contact based tools including laser scanners [
18] and cameras to collect information from the object and inspect its quality, or for as-built creation [
19]. Thus, it can be judged that recent studies recommend image processing methods for bridge crack inspection [
20], non-contact fatigue crack detection [
19] and concrete crack detection [
21]. However, there is no comprehensive study comparing different cases in modular building construction and offering a solution for defect detection using edge detection algorithms applied on images. In addition, there is no comprehensive study reporting the experimentations of edge detection for investigating defects in external cladding during the installation process.
All detection methods vary for different items. Hence, defect detection approaches for an object such as a concrete wall cannot be used for other objects such as panels. In external cladding, incorrect sitting of a panel, unequal joints in an elevation, and scratches or cracks on the face of a panel are the main defects. It is critical to examine all the detection methods since new technologies collect data in a non-contact manner such as via drones and robots.
Several edge detection algorithms are proposed, so it is necessary to choose which algorithm is better for panel defect detection. Roberts method, the easiest of the seven algorithms, is purposed by [
22], which is one of the basic algorithms for edge detection and many comparisons of facial edge detection have been based on it for several years [
23,
24]. Prewitt and Sobel are more difficult than Roberts, but are still the basic algorithms. Roberts, Prewitt and Sobel can all be used for real time image processing in industry [
25,
26,
27,
28]. LoG and Canny are much difficult than those three, but still commonly used in different aspects [
29,
30,
31,
32]. In order to know the current development of edge detection, especially these seven algorithms, a search based on Web of Science data is shown in
Table 1 with searching “the names of these algorithms AND ‘edge detection’” with “Topic” selection from 2009 to 2018. As this paper is related to civil engineering, the number related to it is listed [
32,
33,
34,
35,
36].
Table 1 reflects that Sobel and Canny are much more discussed than the other five. Thus, it can be stated that Sobel and Canny are more widespread than the others no matter whether electrical electronic engineering or civil engineering are concerned. Electrical and electronic engineering mentions the most detection algorithms. Therefore, it can be presumed that edge detection methods of civil engineering construction are less well known in the construction industry than in electrical and electronic engineering. It is necessary to discuss these edge detection algorithms for development of construction. The current gaps in the literature are the performances of the current algorithms for different types of digital images including 3D and 360s which are different in terms of their performance for quality control in different construction contexts such as modular construction. Hamledari, et al. [
37] suggested that future efforts should be focusing on developing new detection algorithms.
Table 2 lists selected works presenting different applications of these algorithms. There are not relevant papers to RGB-Sobel applications in the literature.
Besides data processing methods, choosing which devices to use for images collection is also an issue to be considered in this research. 3D camera is a new technique in construction. The literature shows that the rate of adopting new technologies in construction is low and depends on the applications developed, usefulness and ease of use [
43,
44,
45,
46]. This paper extends the application of image processing techniques and takes the first step towards using a 3D camera. A 3D camera can be used for showing 360 views to enhance building visualisation and create 3D models of the scanned area. Gupta and Li [
47] compared a 3D camera with Kinect, Faro, Leica and Tango companies’ devices for indoor point cloud panoramas. Results showed that it is the only one that can scan 360 degrees in all directions quickly. Virtanen, et al. [
48] aimed to build a 3D virtual reality environment to show the amount of CO
2, so they used both a mobile laser scanner and a 3D camera to build 3D indoor building models in a computer graphics software, Blender. Virtanen, et al. [
49] used a 3D camera to create an indoor 3D scene as the environment for virtual radio play. Thus, a 3D camera could be a good choice for image data collection because it provides more data than 2D cameras, including 360 panoramas, 3D models and point cloud [
50,
51]. Although 3D office and living buildings are established based on 3D data, no 3D scenes of construction sites or as-built buildings are introduced in published papers.
An intensive literature review shows that other studies employ one or more edge detection techniques for defect detection, however there is not a comprehensive study evaluating several edge detection algorithms, particularly in different scenarios of exterior cladding in construction At the same time, it is necessary to employ different tools for requiring the data including a 3D camera, which is almost ignored in the literature. Hence, this work aims to evaluate the aforementioned seven edge detection algorithms for the purpose of panel defect detection and prioritise them based on some criteria measuring their performance in terms of lower level of error and identification of the expected type of defect. The paper also aimed to use two different scenarios and a new 3D camera.
This paper, first, reviews the literature in the relevant fields. Then, algorithms and validation methods will be discussed. Selected algorithms including Sobel, Canny, Laplacian of Gaussian (LoG), Prewitt, Roberts and RGB-Sobel and fuzzy algorithms are examined for measuring their performance in two scenarios of external cladding. Finally, the results of the algorithms are presented and advantages and limitations are discussed.
2. An Overview of the Context: Modular Construction and Panel Installation
External cladding is a non-loadbearing layer attached to the outside face of a building to protect the building from the effects of weather and provide an aesthetically pleasing appearance [
3]. Cladding does not have to be waterproof, but it is mainly used to stop wind and rain from getting to the building. It is unwise to even allow brick or masonry walls to be exposed to heavy rain as they may absorb water. To make a building waterproof and airtight, a layer of backpan or sarking can be used behind the rainscreen cladding. Cladding can be attached directly to the frame or to an intermediate layer of spacers/sub-frame to provide a cavity and prevent condensation. This cavity also allows installation of thermal insulation on the outer face of the structure which has advantages (such as elimination of thermal bridges) compared to where insulation is installed on the inner face of the external walls. A thermal bridge happens where the floor meets the external wall or where an internal wall meets the external wall, so it is not possible to have a continuous insulation.
There are different types of cladding such as timber, aluminum, fibre cement, masonry or aluminum composite cladding. In the wake of recent fires in residential and commercial buildings, attention has been paid to the fire protection of cladding [
52] used in such buildings, in particular, the use of timber and aluminum composite panels (ACP) with a core comprised of greater than 30% polyethylene [
52]. However, the ACP involved in the case studies in this paper are comprised of a fire-resistant core with a minimum 70% non-combustible mineral, and are acceptable based on the cladding ban regulation in NSW.
To have a better understanding of the application of the proposed edge detection methods for defect detection in this paper, a summary of panel installation is beneficial. Although the current defect detection proposal could be used for different cladding types with open joints, panel installation. Details for ACP cladding is described because it is the product involved in the case studies in this paper. The installation is quite similar to installation of other cladding types.
The main difference between the installation methods for different cladding types is the fixing which could be either concealed or surface fixing. In the concealed fixing, a double-sided tape is used in the back of the panel to fix the panel to the sub-framing, or an embedded attachment (anchor or bracket) is fixed to the back of the panel which will later be used to hang the panel to the sub-framing. Another common type of concealed fixing is cassette fixing where a secret-fixed system is used to fix the panel to the sub-framing. In the surface fixing, the panel is fixed to the sub-framing directly using rivets or screws which can be seen on the face of the panel.
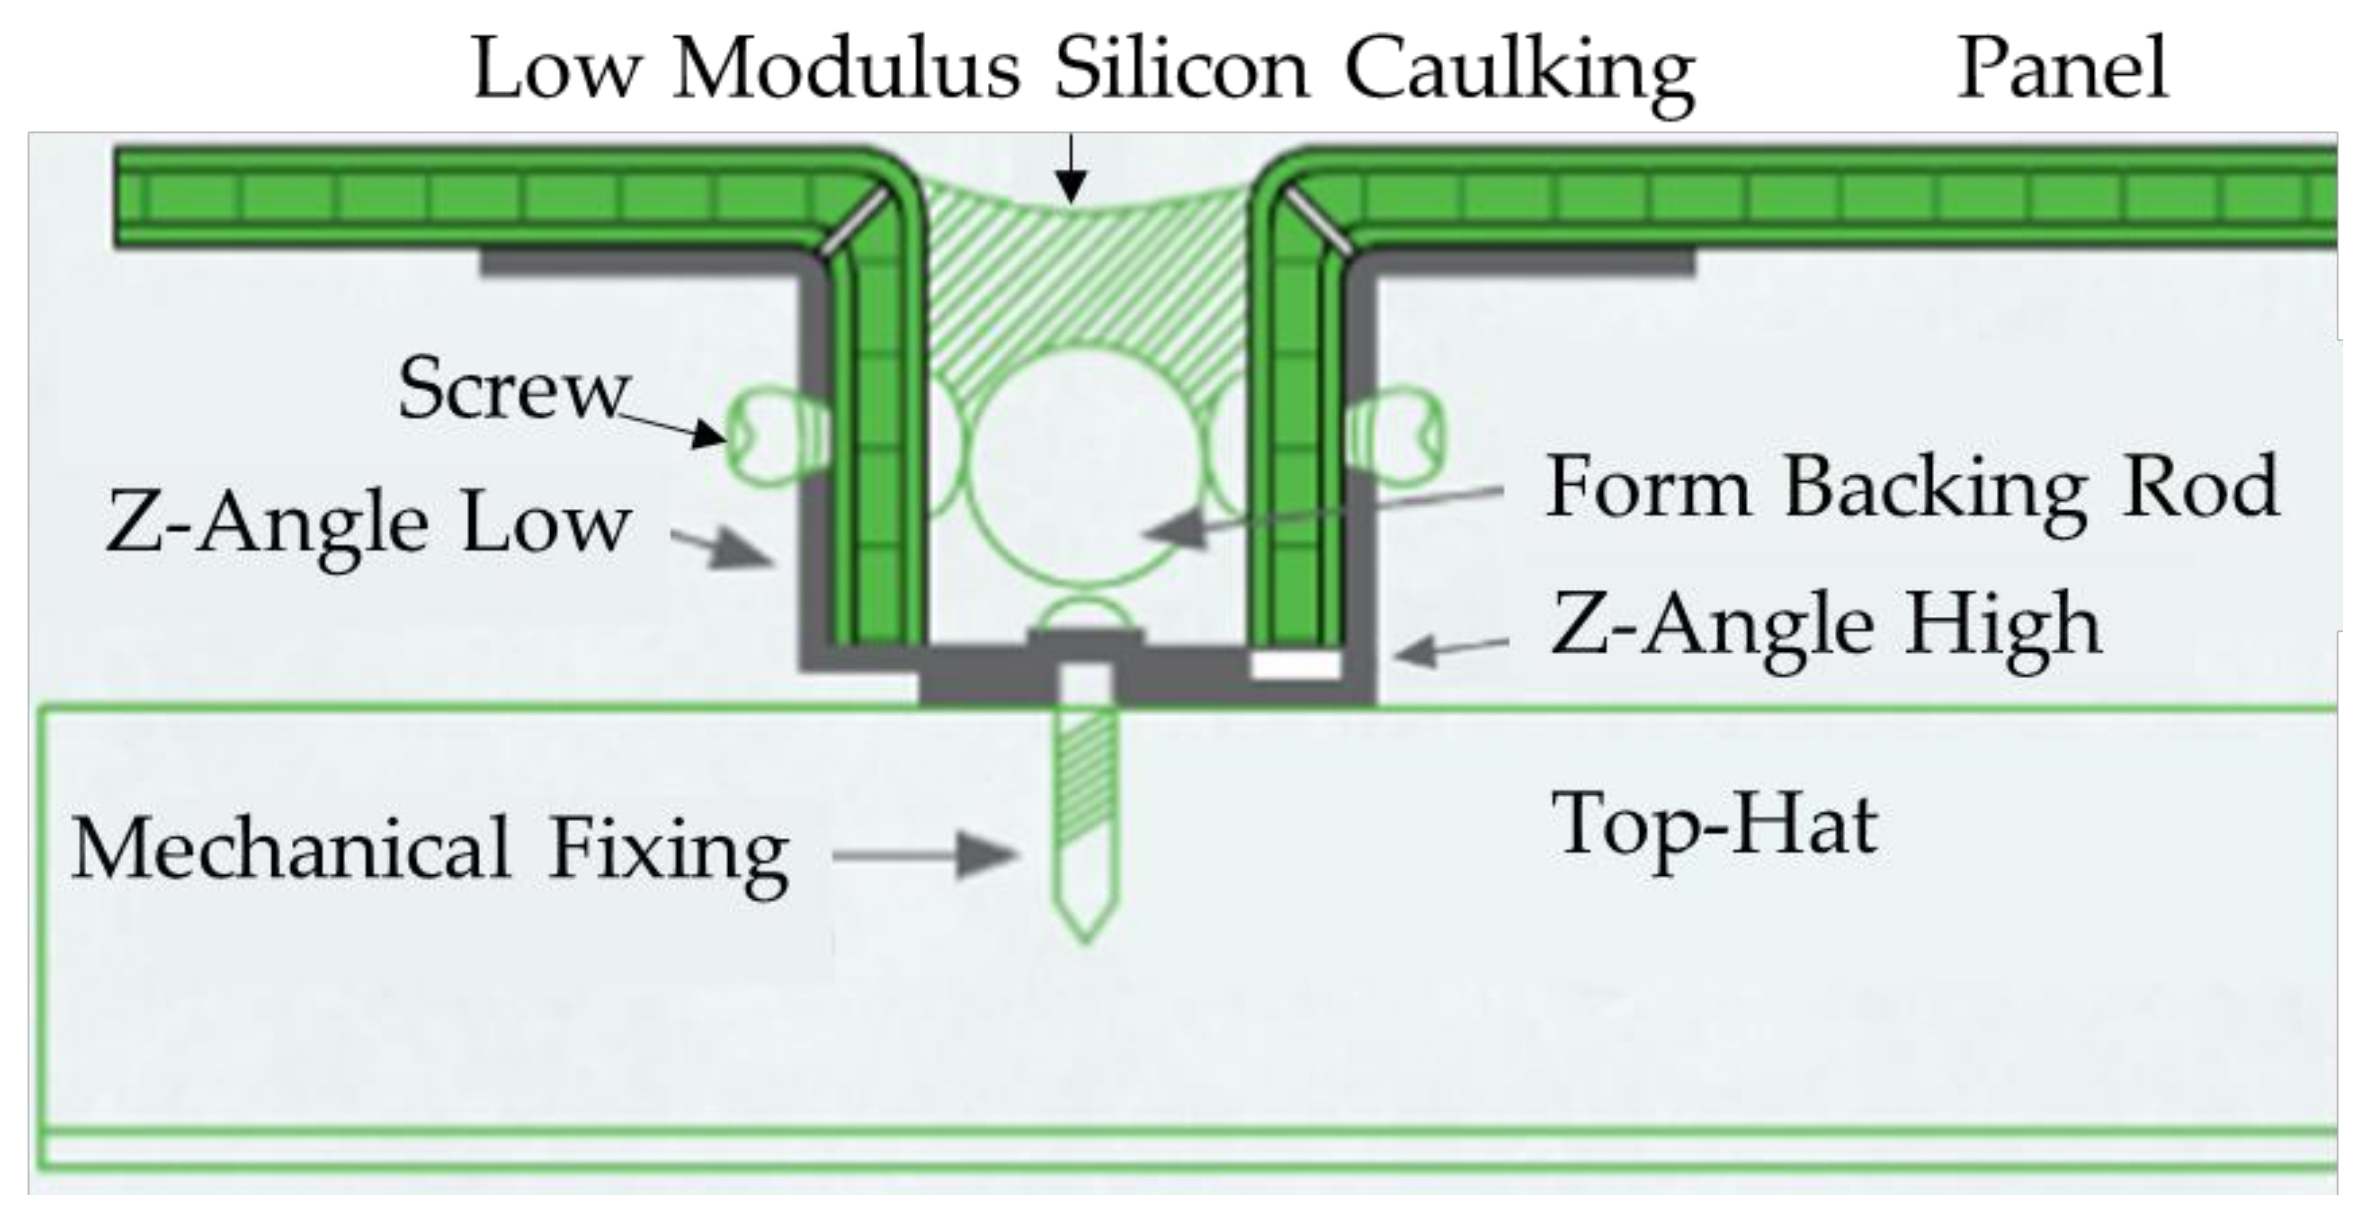
ACP cladding systems generally include horizontal or vertical panels installed on vertical or horizontal top hats using a cassette fixing system as shown in
Figure 1. In this system, the corner of the panels are folded, and a Z-angle is used at these corners to fix the panel to the top hats. It is a joint between the panels, varying from 10 mm to 15 mm width according to the architect’s comment, which can be sealed as shown in
Figure 1, or be left open to allow a better ventilation behind the panels.
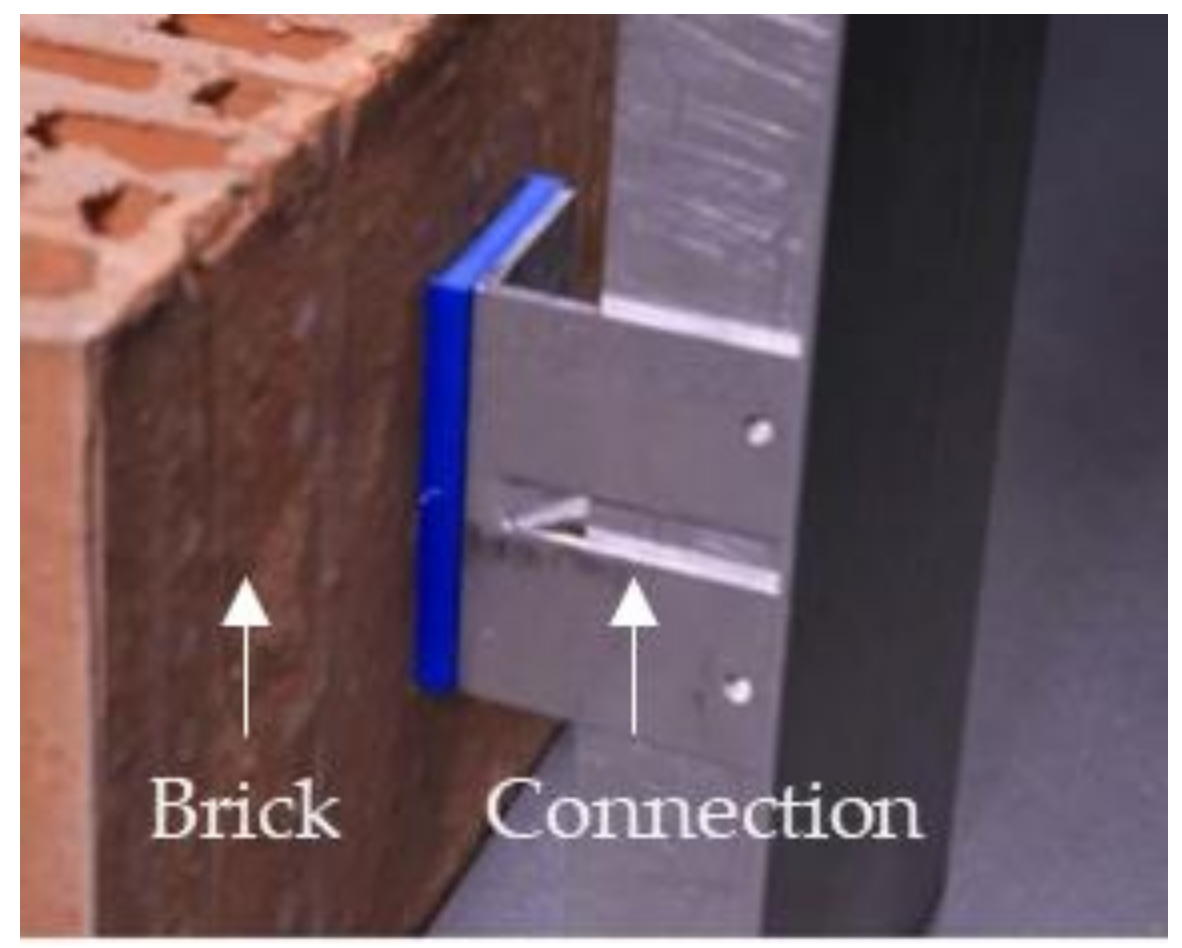
The top hats are fixed to the substrate (which can be brick, concrete or stud wall) using some brackets, as shown in
Figure 2. The spacing between the brackets, or top hats, are normally designed based on the wind loads, and the cladding zone which is the distance between the face of the cladding and the face of the substrate and will be nominated by the architect. The approved boundaries by the council should be considered though, because the panels must not exceed these boundaries.
The joints are typically vertical and horizontal, and the architect lines them up with window mullions or door frames to create the panel layout. However, there might be some curve or diagonal joints to achieve the best aesthetics. This is where mistakes might happen because there are no check points to assist the installation process. To reduce the construction time, the panels could be fabricated based on the approved shop-drawings before arriving on site. However, this reduces the flexibility during panel installation, and the installers should stick to the dimensions and information given in the shop-drawing. Otherwise the defects are unavoidable, and additional time is required to rectify the issues.
3. Methodology
3.1. Data Collection
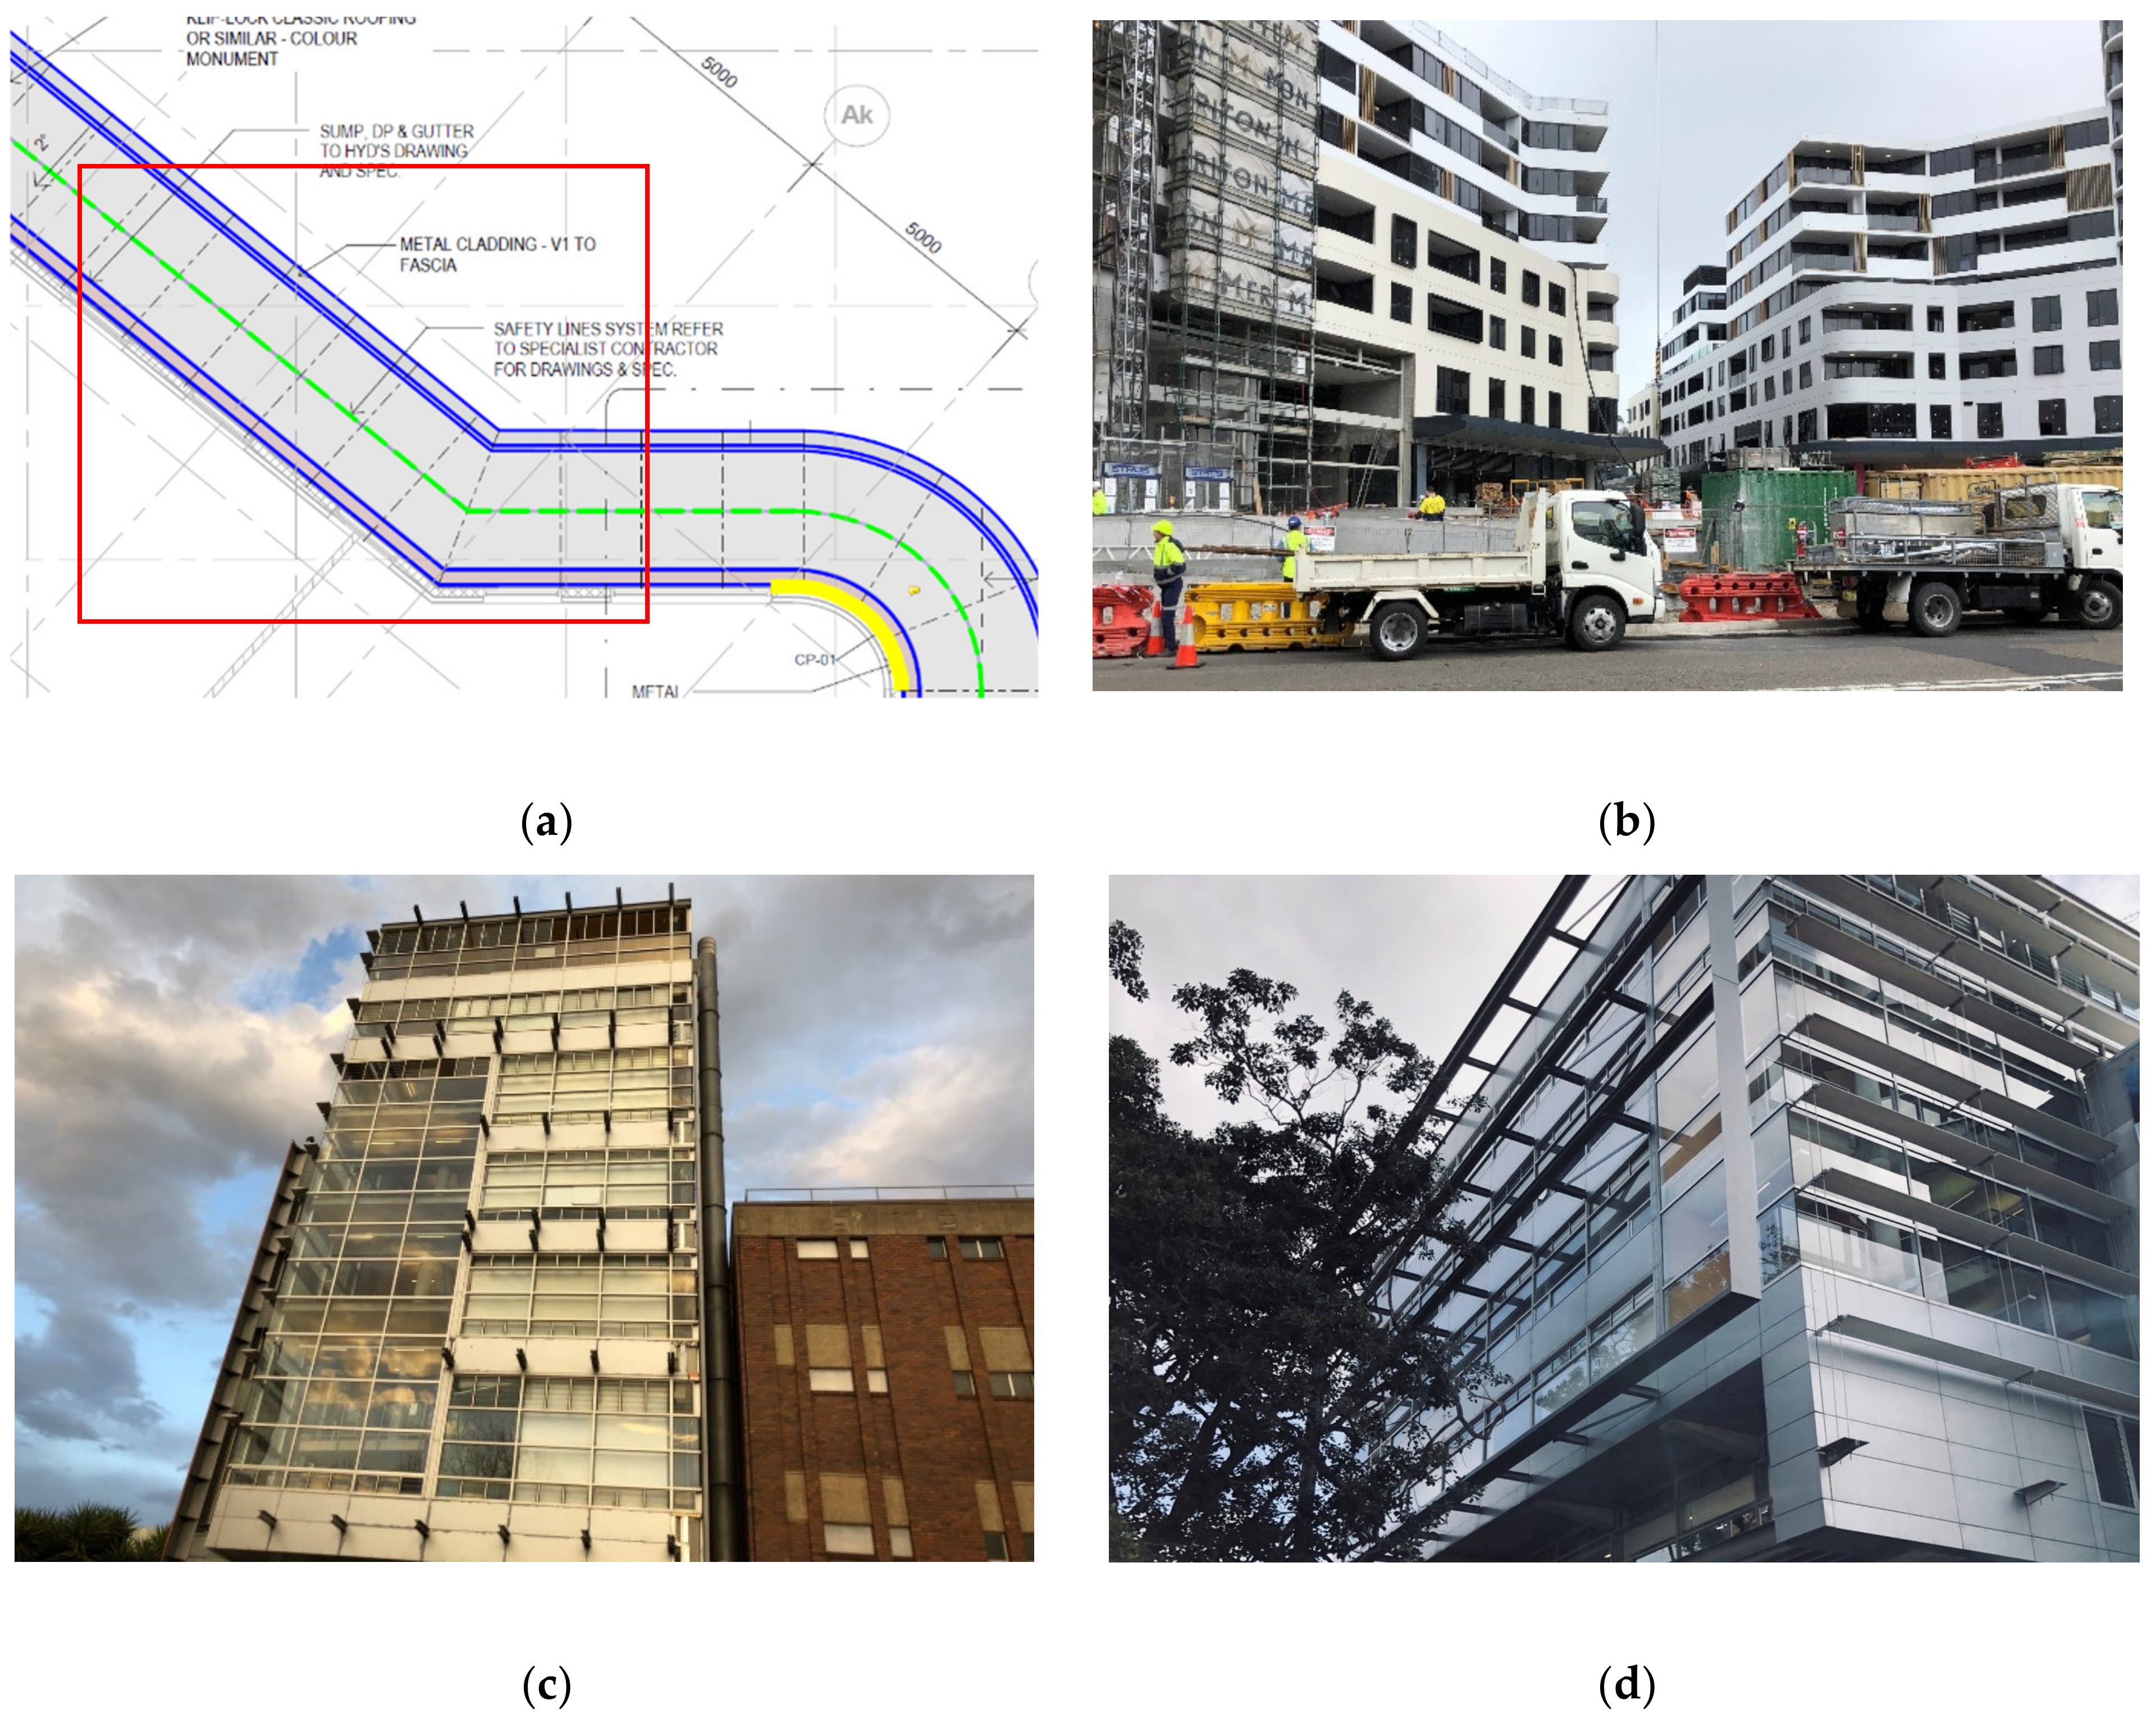
A state-of-the-art 3D camera is chosen for data collection data from the building panels and uses infra-red (IR) light to capture depth data about the environment (Selected buildings for the two designed scenarios are shown in
Figure 3). A 3D camera is usually used for data collection as it can provide more information than an ordinary 2D camera including panorama and depth of image [
53]. As 2D image processing usually spends less running time in a computer to help engineers save time during construction than 3D image processing, this paper prefers to adopt 2D image as the original image. Thus, in this paper, a 3D camera is applied for data collection, but only 2D RGB pictures in the dataset are used. Other information like 3D models and panoramas in it will be applied for further research by authors in future. The 2D images from the 3D camera are used for identifying panel edges. In some cases, screenshots are manually taken from 3D model images, because the 3D image data are panoramas and screenshots by manual operation can remove unwanted elements. Then, all colour screenshots are changed to grey images, because those seven edge detection methods are for grey-scale images.
3.2. Edge Analysis Methods
Seven accredited edge detection methods for 2D image are chosen for panel edge detection in this paper, including Sobel, Canny, LoG, Prewitt, Roberts, RGB-Sobel algorithm and Fuzzy logic-based algorithm. The Fuzzy logic-based algorithm is the method using Fuzzy logic related knowledge. All these seven algorithms are applied for estimating image gradients for edge detection from the original figures of panels. These algorithms can be categorised into two main groups: (i) Six edge detection techniques including Sobel, Canny, LoG, Prewitt, Roberts and RGB-Sobel based methods [
54]; (ii) Fuzzy logic-based method [
42]. Edge operators are used for edge detection, which uses algorithms to produce edge points or edge fragments from an image [
54]. Greyscale image represents the image whose pixel value is from white to black. The proportion of red, green and blue in the image is expressed by a different greyscale. Image segmentation is based on the principle of grey discontinuity at the edges of objects. The feature is beneficial for automatic recognition of cracks [
15,
16].
Filtering and calculating gradient magnitude are two main parts in the calculation steps of Sobel, Canny, LoG, Prewitt, Roberts and RGB-Sobel methods [
54]. Roberts, Prewitt, Sobel and RGB-Sobel only contain gradient magnitude calculation [
54], while LoG and Canny operators conclude filtering and gradient calculation [
54]. Roberts, Prewitt and Sobel are first-order difference operators, while LoG and Canny are second-order difference operators for estimating image gradient. Filtering is using filters to smooth a figure by calculating the weighted average to enlarge greyscale difference at the edges. Calculating the gradient magnitude is important because the edges are found by calculating gradient magnitude of each pixel in an image [
54]. To be specific, filtering can enhance gradients of edges and decrease noises in an image [
54]. After filtering, edges can be detected by calculating gradient magnitude of two adjacent points with a designed threshold. If gradient magnitude is higher than the threshold, that pixel is considered as the edge point. The fuzzy logic algorithm implements different steps from the other six methods. All proposed algorithms are discussed as follows:
The first method is the Sobel operator. The Sobel operator places an emphasis on pixels that are near to the centre of the 3 × 3 matrix to increase the grey difference at edges. The Sobel operator applies two matrices for convolution operation [
55] to filter the image. The horizontal Sobel matrix is flipped 90 degrees from the vertical Sobel matrix. The following are Sobel 3 × 3 matrices:
Calculation of gradient magnitude in the Sobel operator is the following formula [
55], and A represents the matrix of the source image pixels:
The second method is the Canny operator, which is suggested by Canny [
56]. It adds non-maximum suppression after calculating gradient magnitudes. Thus, these main steps are taken in the Canny method: Smoothing images by a certain filter (usually Gaussian filter), finding intensity gradients, applying non-maximum suppression, choosing two thresholds as minimum and maximum and connecting edges. In this research, the Gaussian filter is used. As the Gaussian filter is mentioned in the LoG operator, it will not be repeated in the Canny operator. The software package assigned the threshold based on the pixels of the source image.
The third method is the LoG operator. The LoG is based upon second-order derivatives of the intensity. In detail, it detects zero-crossings of a Laplacian operator applied to a Gaussian-smoothed image, which is also termed as a Marr edge operator.
As for a Laplacian operator, the gradient of function f (x, y) at point (x, y) of image is a vector . Thus, the size of this vector is calculated as follows . The gradient angle is representing the gradient’s direction in edge detection. The matrix of a Laplacian operator is for the 2D signal processing convolution operation. It is symmetrical, so vertical and horizontal changes only need one matrix instead of two. In other words, the Laplacian operator has only one matrix.
The Laplacian operator has unacceptable sensitivity to noise, and its amplitude may produce double edges. In addition, the undetectability of edge direction is also one of the drawbacks of a Laplacian operator. In order to remedy these shortcomings, American scholars [
57] propose an algorithm which uses a Laplacian operator to perform based on Gaussian low-pass filtering first to smooth the image. Combining Gaussian and Laplacian filters, the formula of Gaussian filtering is:
σ is decided by programmers who use it, which is always 1.4 and not changed in this paper. The matrix of discrete approximation to LoG function with σ = 1.4:
Then calculation of gradient magnitude is the same as the aforementioned operators with only changing of the filter matrixes.
Calculation of gradient magnitude in the LoG operator is the following formula [
57]:
The fourth method is the Prewitt operator. In order to increase accuracy, Prewitt [
58] designs 3 × 3 matrices:
The grey difference at the edges can be enlarged based on this convolution operation based on different experiments and applications [
32]. As the numbers are the same in each row of the horizontal matrix and each column of the vertical matrix, it can be stated that this operator does not place any emphasis on pixels of the 3 × 3 matrices. Subsequently, the gradient magnitude of Prewitt is calculated as follows, which is similar to the Roberts algorithm [
54]:
The fifth method is the Roberts operator, which is suggested by Roberts [
22]. It is the simplest algorithm of these methods for edge detection and quickly provides the results. To implement the Roberts operator, the original figure should be firstly converted from RGB into greyscale format. It applies two 2 × 2 matrices to be convolved with the original figure for calculating approximations of the derivatives at each point in figure. They are for vertical and horizontal changes respectively:
.
“
v” stands for vertical and “
h” stands for horizontal. “
v” and “
h” have the same meaning in the following operators. Based on the matrices, the approximate gradient magnitude at each point of the original figure is calculated by the following equation [
22]:
“A” donates the source figure. “×” means the 2D signal processing convolution operation. and denote two resulting figures which contain the vertical and horizontal approximations of the derivative respectively. If the requirement of accuracy is not high, G can be considered as with the use of Roberts operator to simplify calculation.
The sixth method is RGB-Sobel that is an RGB-based algorithm, which is revised based on a Sobel operator. The algorithm includes several steps to detect edges. First, it separates the three colours, red (R), green (G) and blue (B)—from the RGB image and generates three new images. Then, researchers compute horizontal and vertical derivatives of red, blue and green images through applying the Sobel operator. Next, it calculates gradient direction, which is the direction of the largest colour change, and the magnitude of the rate of change. The changes are shown as edges of the original image.
The seventh method is the Fuzzy logic algorithm. Accurate mathematical language and quantitative analysis cannot solve the problem of vague concepts included in images. These concepts need to be dealt with by fuzzy calculation. Fuzzy set theory is usually used to solve problems with imprecise information [
42]. An important step of representing knowledge by means of fuzzy sets is membership function to best represent information. Fuzzy logic is developed from fuzzy set theory considering the degree of membership to a set, which differs from traditional sets [
42].
Fuzzy logic is a technique where operators can input value and obtain output count on the rules chosen by researchers [
42]. It contains the Fuzzy Inference System [
59]. In order to run the Fuzzy Inference System, IF-THEN rules should be made, which is possible to be done by GUI present in the Fuzzy Inference System package.
In this method, selected RGB images were converted into greyscale images, which make it a two-dimensional analysis instead of creating a three-dimensional array. The images can be converted into double-precision data set and scaled, which turns all their elements from (0, 256) in the (0, 1) range to create the membership function. In the function, 0 means black, where there is no inclusion. The value of 1 means white, which refers to inclusion. Thresholds of 0 and 1 represent the degree of fuzziness, referring to the degree of black. In detail, there are five main steps: (1) Converting image to grayscale image; (2) Converting attribute of the image to double-precision data; (3) Scaling pixels in (0,1) range; (4) Obtaining image gradients with Fuzzy template in two x and y axes [
60]; (5) Taking a membership function with zero mean for the gradients to detect edges.
3.3. Validation Tests
The authors employed mean squared error (MSE) [
25], peak signal-to-noise ratio (PSNR) [
61] and structural similarity index (SSIM) methods were used for comparison of the performance of those edge detection operators in a panel defect detection study. They are common methods of image processing analysis. For example, Acharjya, et al. [
62] applied MSE and PSNR for comparing performances of different algorithms for facial image processing. MSE is the mean of square of difference between values of original and processed images. The lower the MSE, the lower the difference between the original and processed images. Thus, an outperforming algorithm will receive a lower MSE result. PSNR is peak signal to noise ratio, which reflects the degree of noises. A higher value means fewer noises and better quality of processed images. Therefore, a better performing algorithm will produce a higher value for PSNR. The equations of MSE and PSNR are provided below based on [
63] and respectively.
Letters m and n donate length and width of the image. Because the place of the pixel in the processed image is the same as the place in the original image, represents the value of the pixel (i,j) in the original image and represents the value of the pixel (i,j) in the processed image.
However, MSE and PSNR ignore the human visual identify theory. Since human eyes always focus on the parts that that person is interested in, the judgment methods of figure similarity between human eyes and a computer are different. In order to consider this issue, this paper adds one more method, SSIM, which considers the human visual identify theory. SSIM evaluates luminance, contrast and structure. Its simplest equation is provided by the following formula [
64]:
and represent the mean pixel values of figures X and Y respectively. and represent standard deviation of figures X and Y respectively. and are constant terms which are used to avoid fluctuation when the mean value approaches zero. Like PSNR, the higher SSIM means structural similarity of X and Y is higher for the better performing method.
There is no threshold for judgment on better performance from MSE, PSNR and SSIM. For example, 20 dB of PSNR can be the best result of a figure and show good performance but the worst of another figure and show a very bad result. Therefore, the values achieved by these metrics should be judged in comparative analyses among various results so that a lower value for MSE and higher values of PSNR and SSIM of the results are determinants of a better performing algorithm.
4. Results and Findings
Two scenarios are selected for analysing their panel’s quality and each has four chosen areas. Panels were used for external cladding in the selected cases. A total number of images for scenarios is 100.
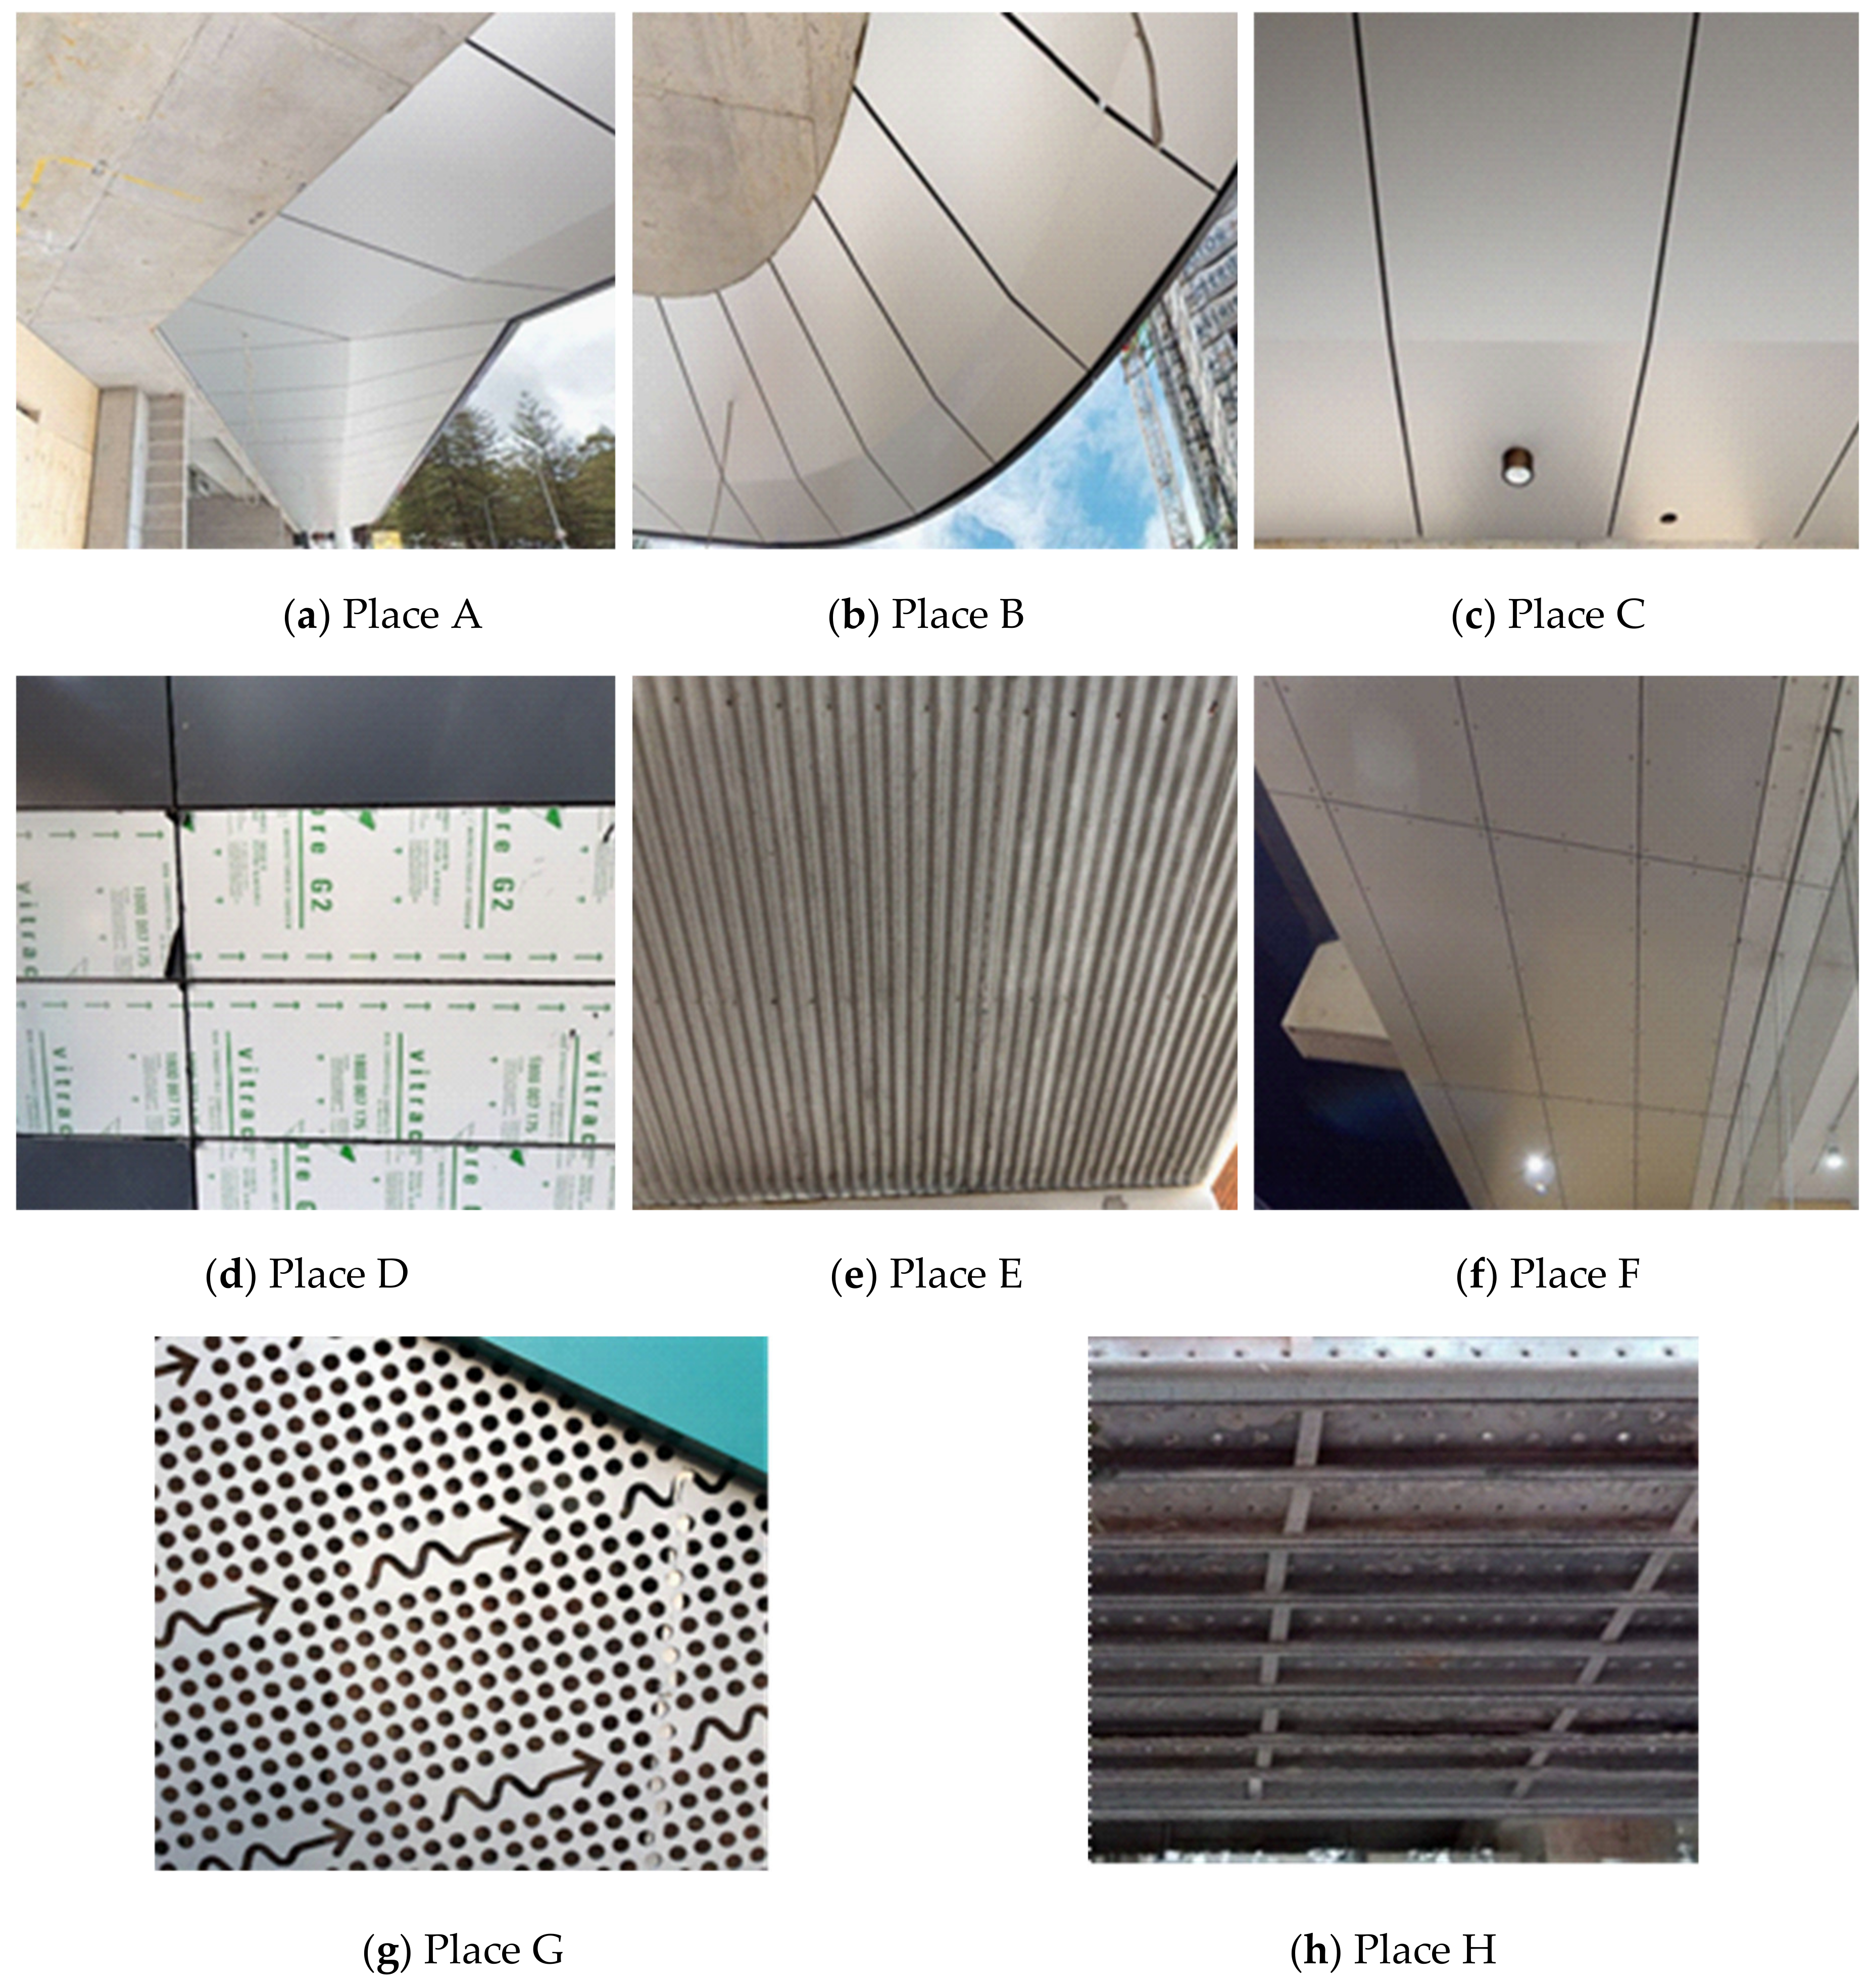
Figure 4 shows selected images from the two building scenarios with their four chosen places, indicated by Place A to H. Eight different panels were chosen for evaluating the image processing methods. In the commercial building 1, four positions of panels include a place containing irregular ceiling panels (Place A), a corner (Place B), an ordinary ceiling (Place C) and a wall with panels (Place D). These four places are chosen because they contain different kinds of ceilings and information. In place A, irregular panels can be used to test edge algorithms when they detect irregular shapes. Place B contains arch panels for judging whether the curve edges are properly installed in the correct location. Place C is for ordinary ceiling panel edge detection and Place D is for wall panel detection as shapes, materials and colours of wall panels and ceiling panels are different.
The second scenario includes panel installations on an educational building, namely Red Centre Building, the University of New South Wales (UNSW), Sydney. Like the first building scenario, four places are chosen, southern outside (Place E), ground floor (Place F), western corner (Place G) and eastern corner (Place H).
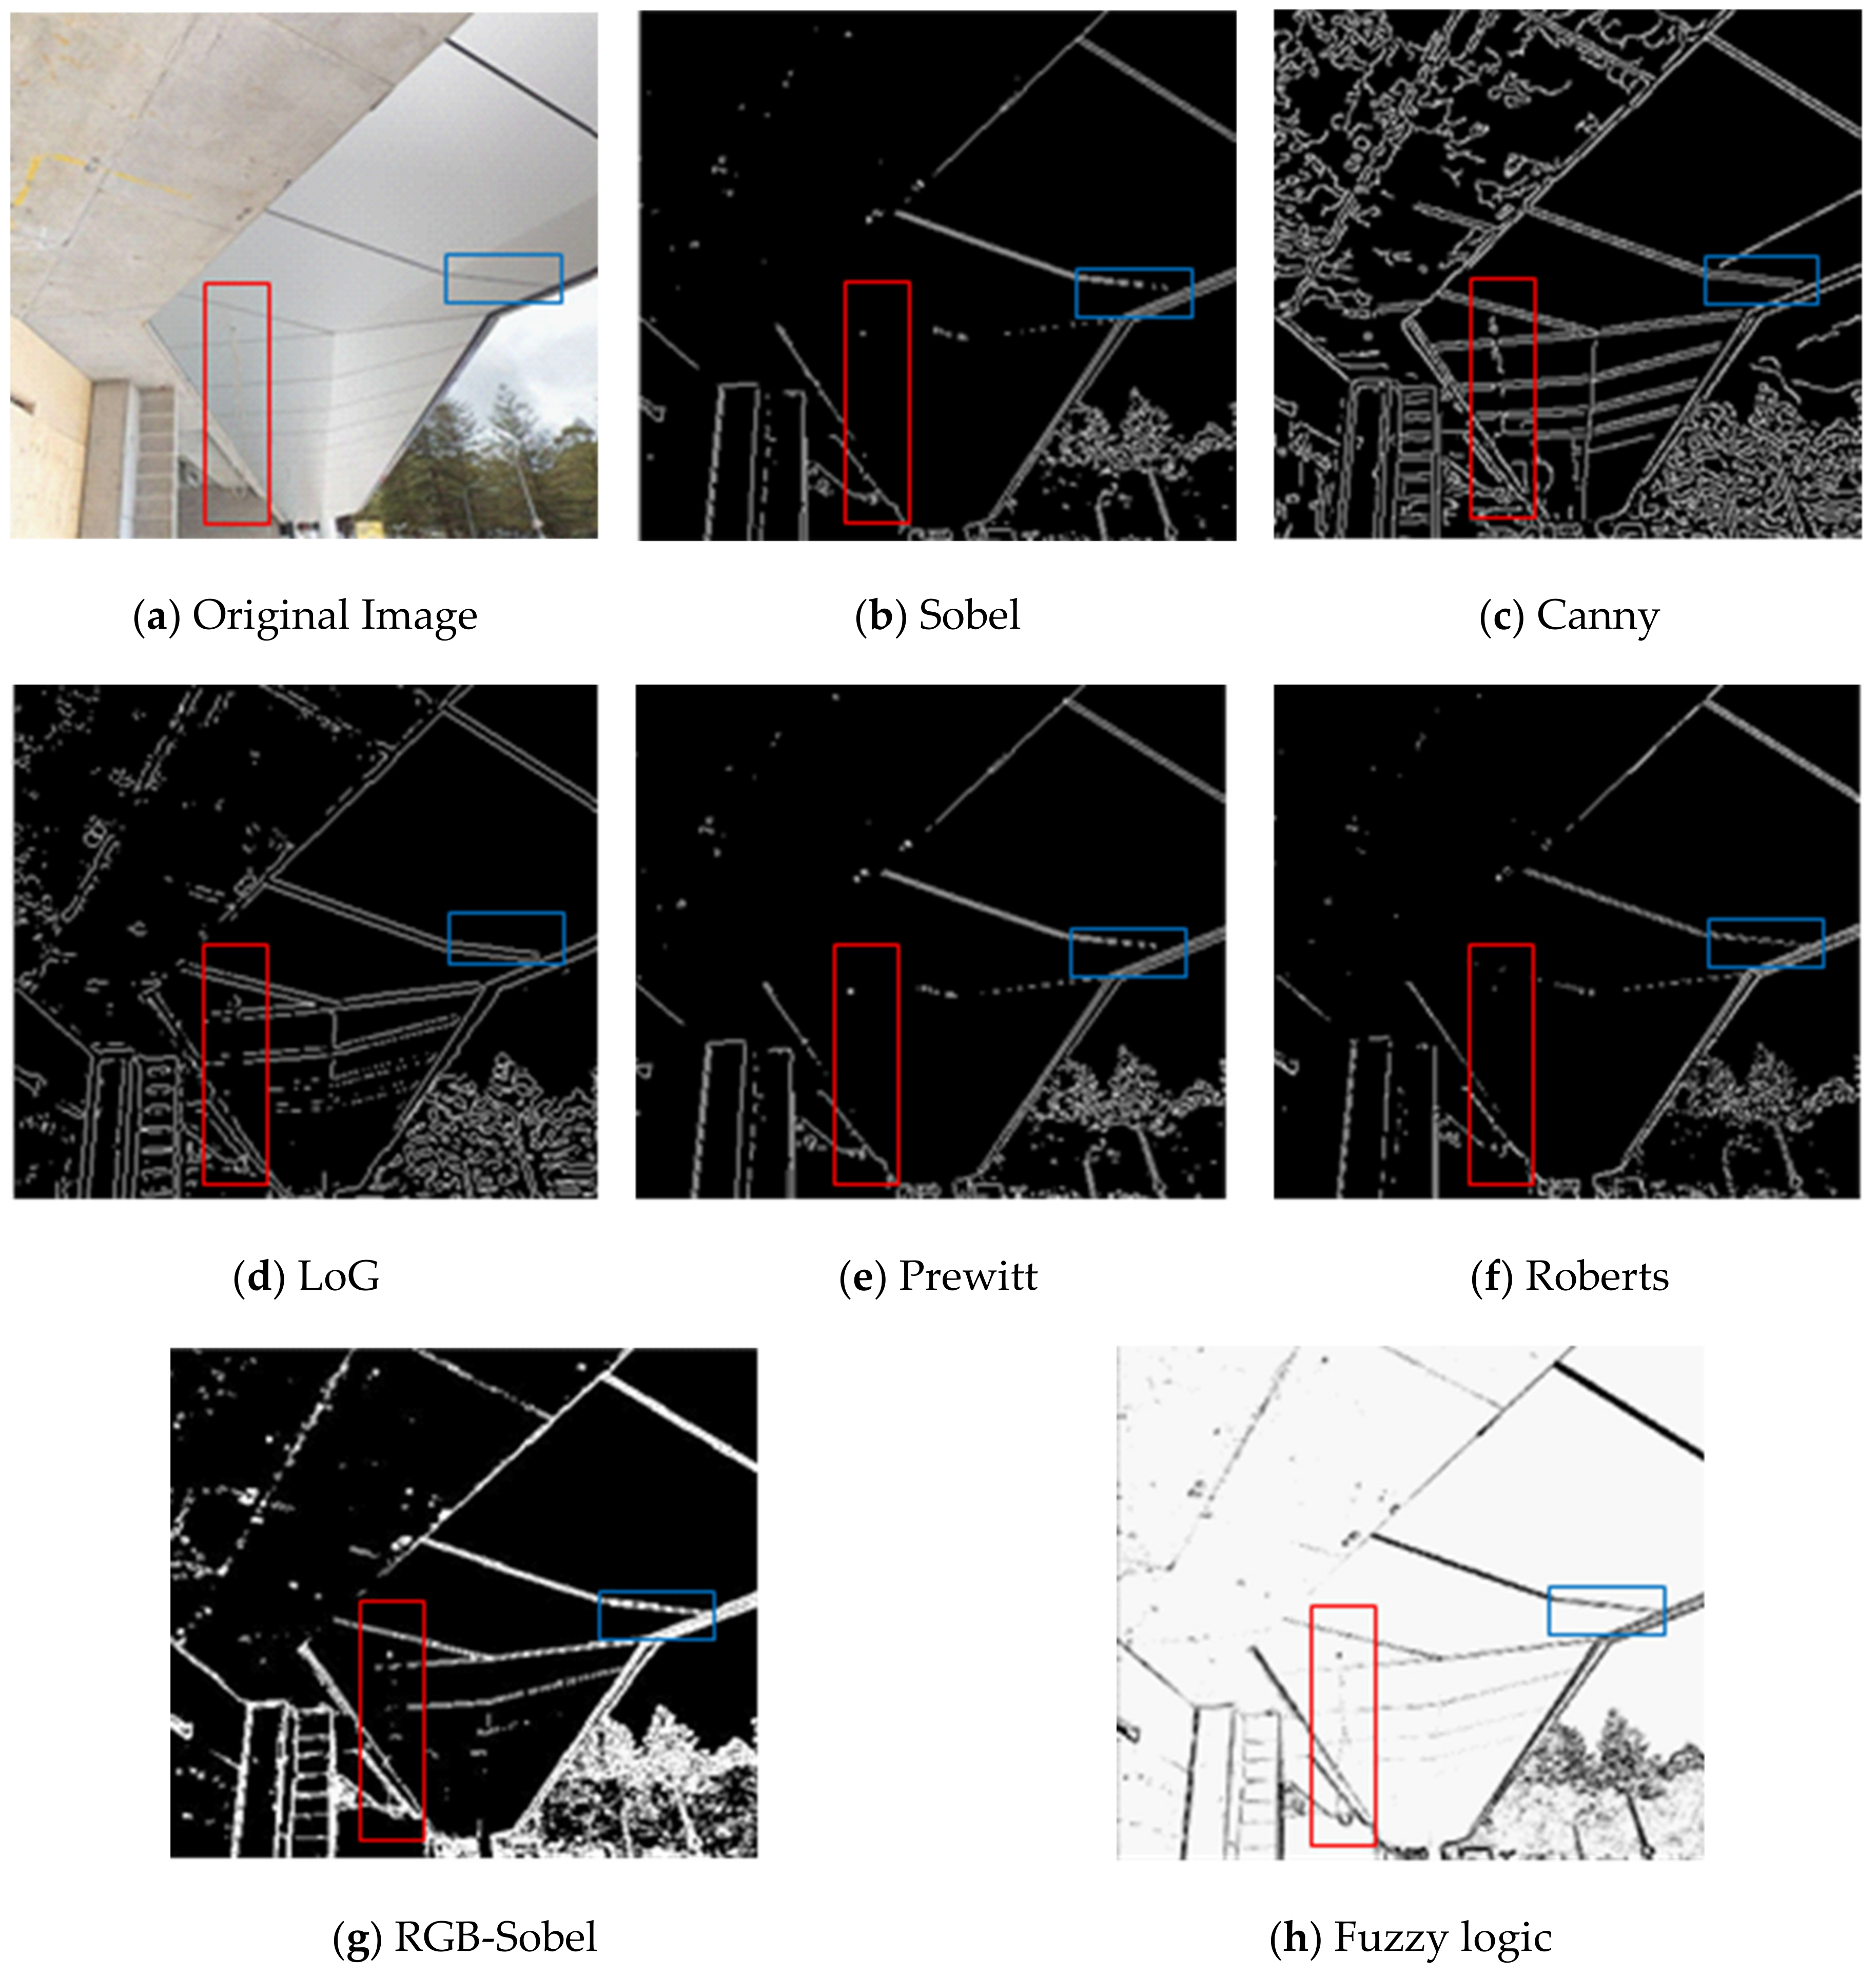
Results of the algorithms applied on the sample of 100 images are analysed using different methods. Selected results are illustrated and explained in
Figure 5. The results are evaluated against different tests or factors as follows:
The first test is false positive and false negative errors. If a detected edge is not a true edge, this error is called “false positive”. If a true edge is omitted, the error is called “false negative”. All these algorithms have false positive and false negative errors. Careful visual inspection of the results of Roberts, Prewitt and Sobel in
Figure 5 shows more “false negative” errors from these algorithms compared to the other explored algorithms [
18]. Also, LoG and Canny produce more “false positive” errors.
Figure 5e detects the most edges from the original figure and panel edges can be shown clearly, but the same problem as
Figure 5d still exists such as presenting too many edges including tree edges. Fuzzy logic algorithm has the least “false negative” errors based on observation. For example, it shows edges of the thin wire hanging on the panel (red rectangle part in
Figure 5 which is hard to be detected). Thus, it can be concluded that most slim edges cannot be detected by Roberts, Sobel and Prewitt. LoG has more false negative errors than Canny but fewer than Sobel, Prewitt and Roberts. Canny can show most edges, but many edges are shown which are not true edges especially when one item has several short edges like trees, and this results in many noises. Fuzzy and RGB-Sobel have fewer both false positive and negative errors.
The second test applied on results is the degree of discontinuity. Each method has different degrees of discontinuity as shown in
Figure 5. For instance, all methods cannot show perfect continuous edges of the selected panels. However, RGB-Sobel and Fuzzy perform better than others in terms of detecting more continuous lines in the image. This may be due to dimness of the original image. Besides, the comparison of the simple Sobel method and the advanced RGB-Sobel method shows RGB-Sobel gives much better results than Sobel. For example,
Figure 5g produces more continuous edges.
The third factor is ease of use for non-experts. Ease of use is one of the important factors for a technology or technique to be employed in construction [
44,
65,
66]. Roberts, Prewitt and Sobel are fast and can be understood easily by non-experts. LoG is easy but needs training and choosing a threshold. Canny is easier than the RGB-Sobel and Fuzzy methods, but it also needs training and choosing a threshold. Canny contains more processing steps than Roberts, Prewitt, Sobel and LoG. RGB-Sobel requires more steps than the other six algorithms and knowledge of RGB colour separating is required for working with this algorithm. Fuzzy is the most complex algorithm because it contains knowledge of Fuzzy logic and the Fuzzy inference system as well as computer vision knowledge.
To evaluate the performance of the algorithms, MSE, PSNR and SSIM are calculated for the difference between processed and original images and noise level respectively.
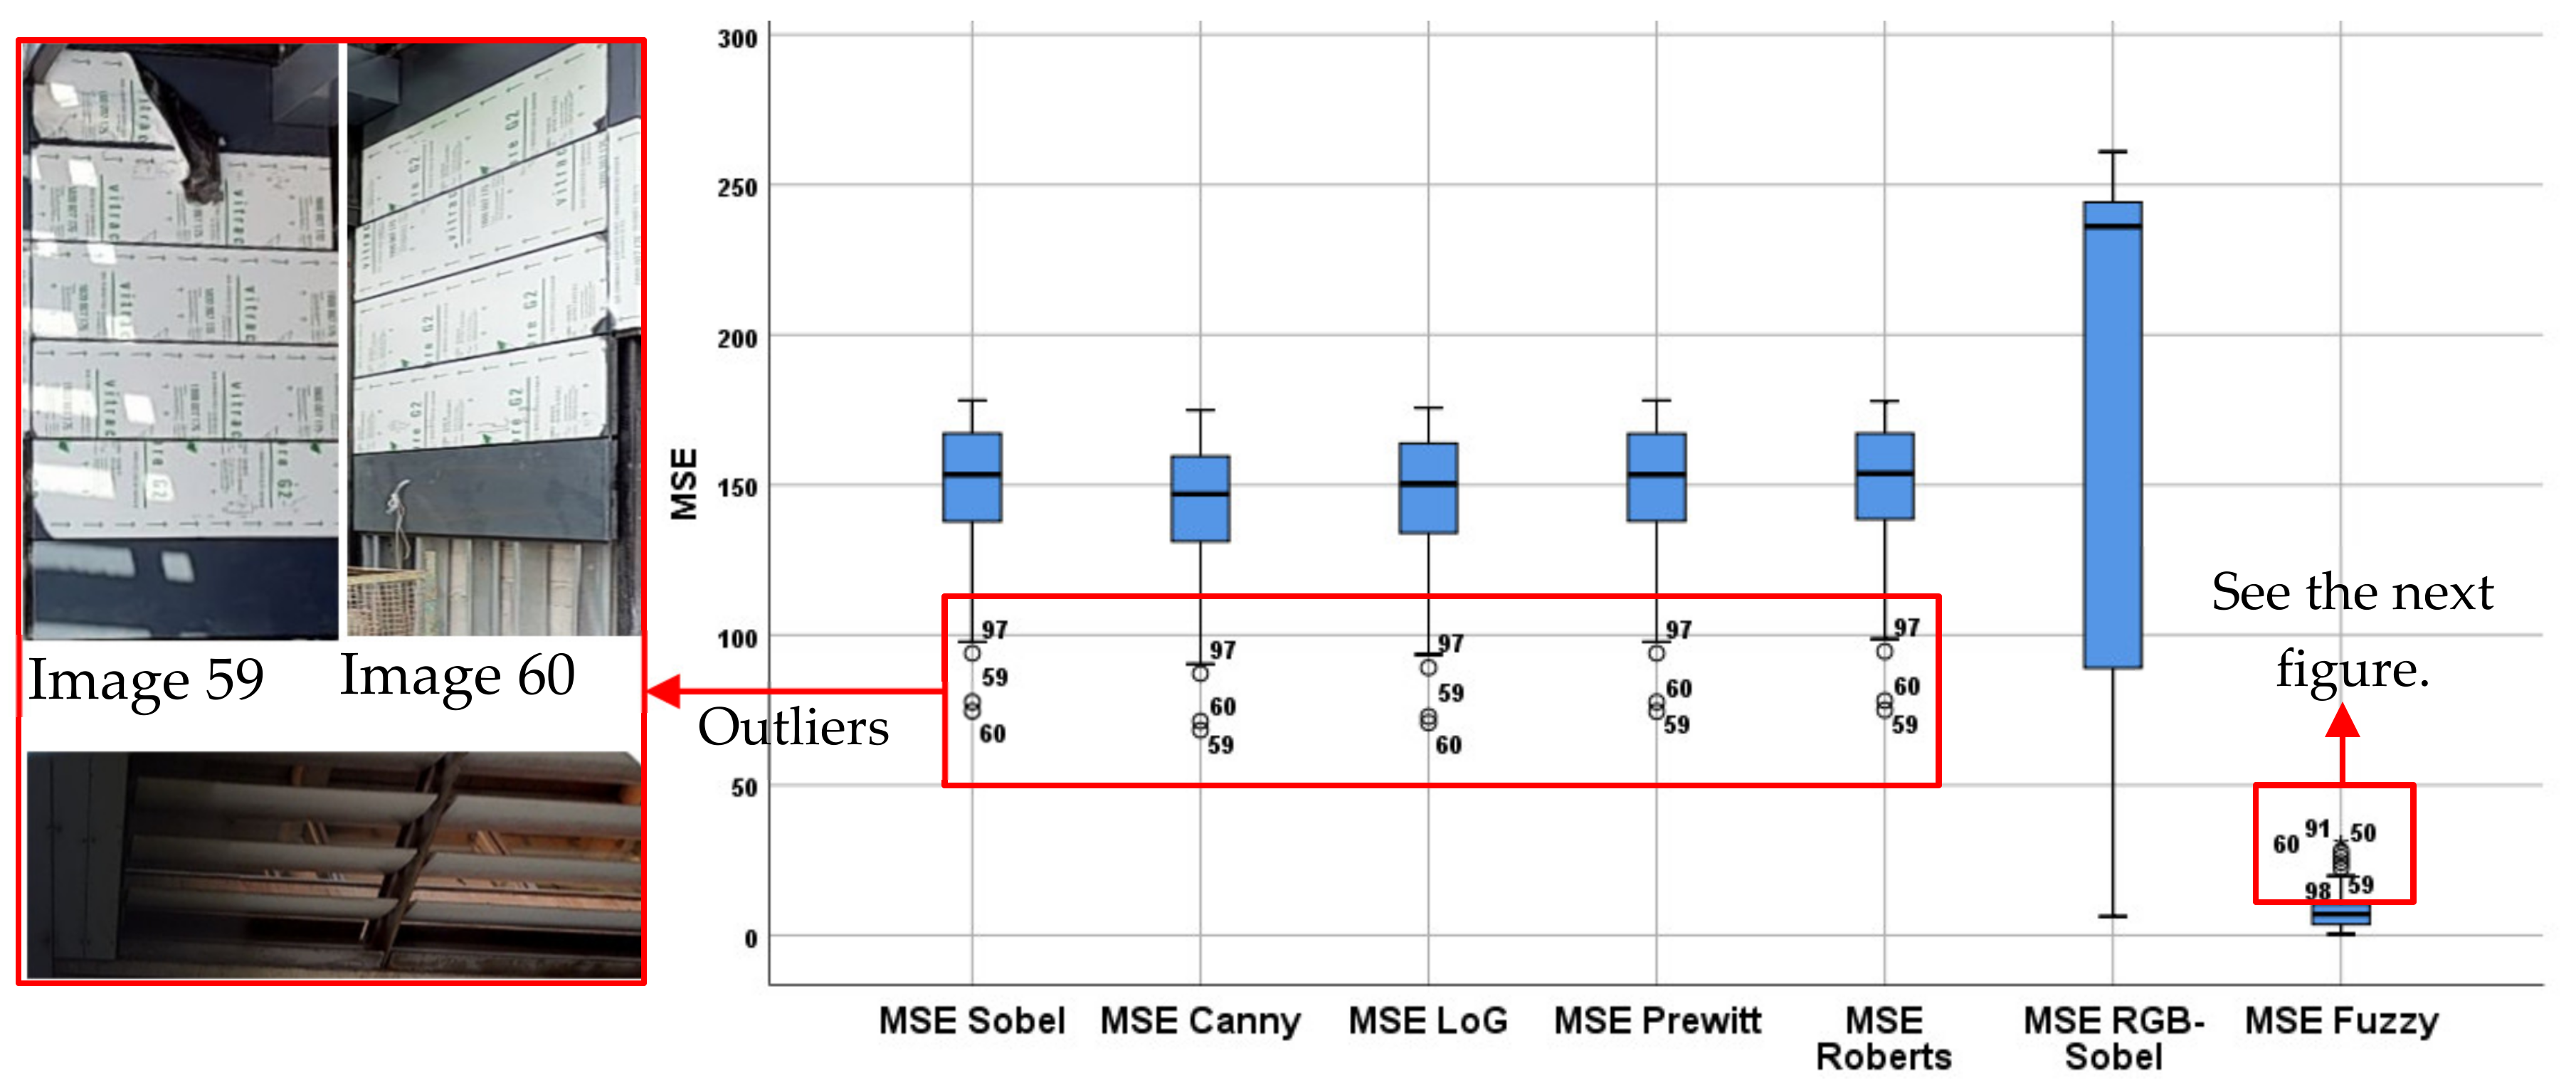
The fourth test for evaluation of the algorithms is to estimate MSE. The results of the mean of MSE for the first five algorithms of Sobel, Canny, LoG, Prewitt and Roberts are close varying from 141.55 to 149.09.
Figure 6 also shows that there are the same outliers in MSE results for these five algorithms including images 59, 60 and 97. The main reason can be the low pixel and small size of the images varying from 91.5 KB to 107 KB for outliers, while the sizes of other images are much larger (e.g., 564 KB for
Figure 5a). The second reason also can be the high level of darkness for image 97, and the covers used on the panel for images 59 and 60.
Figure 6 shows totally different results for RGB-Sobel and Fuzzy. The edge operators convert RGB images to greyscale images and then calculate magnitudes for each, while RGB-Sobel method separates RGB into three monochrome images. However, RGB-Sobel shows the best edge results according to human eyes judgment.
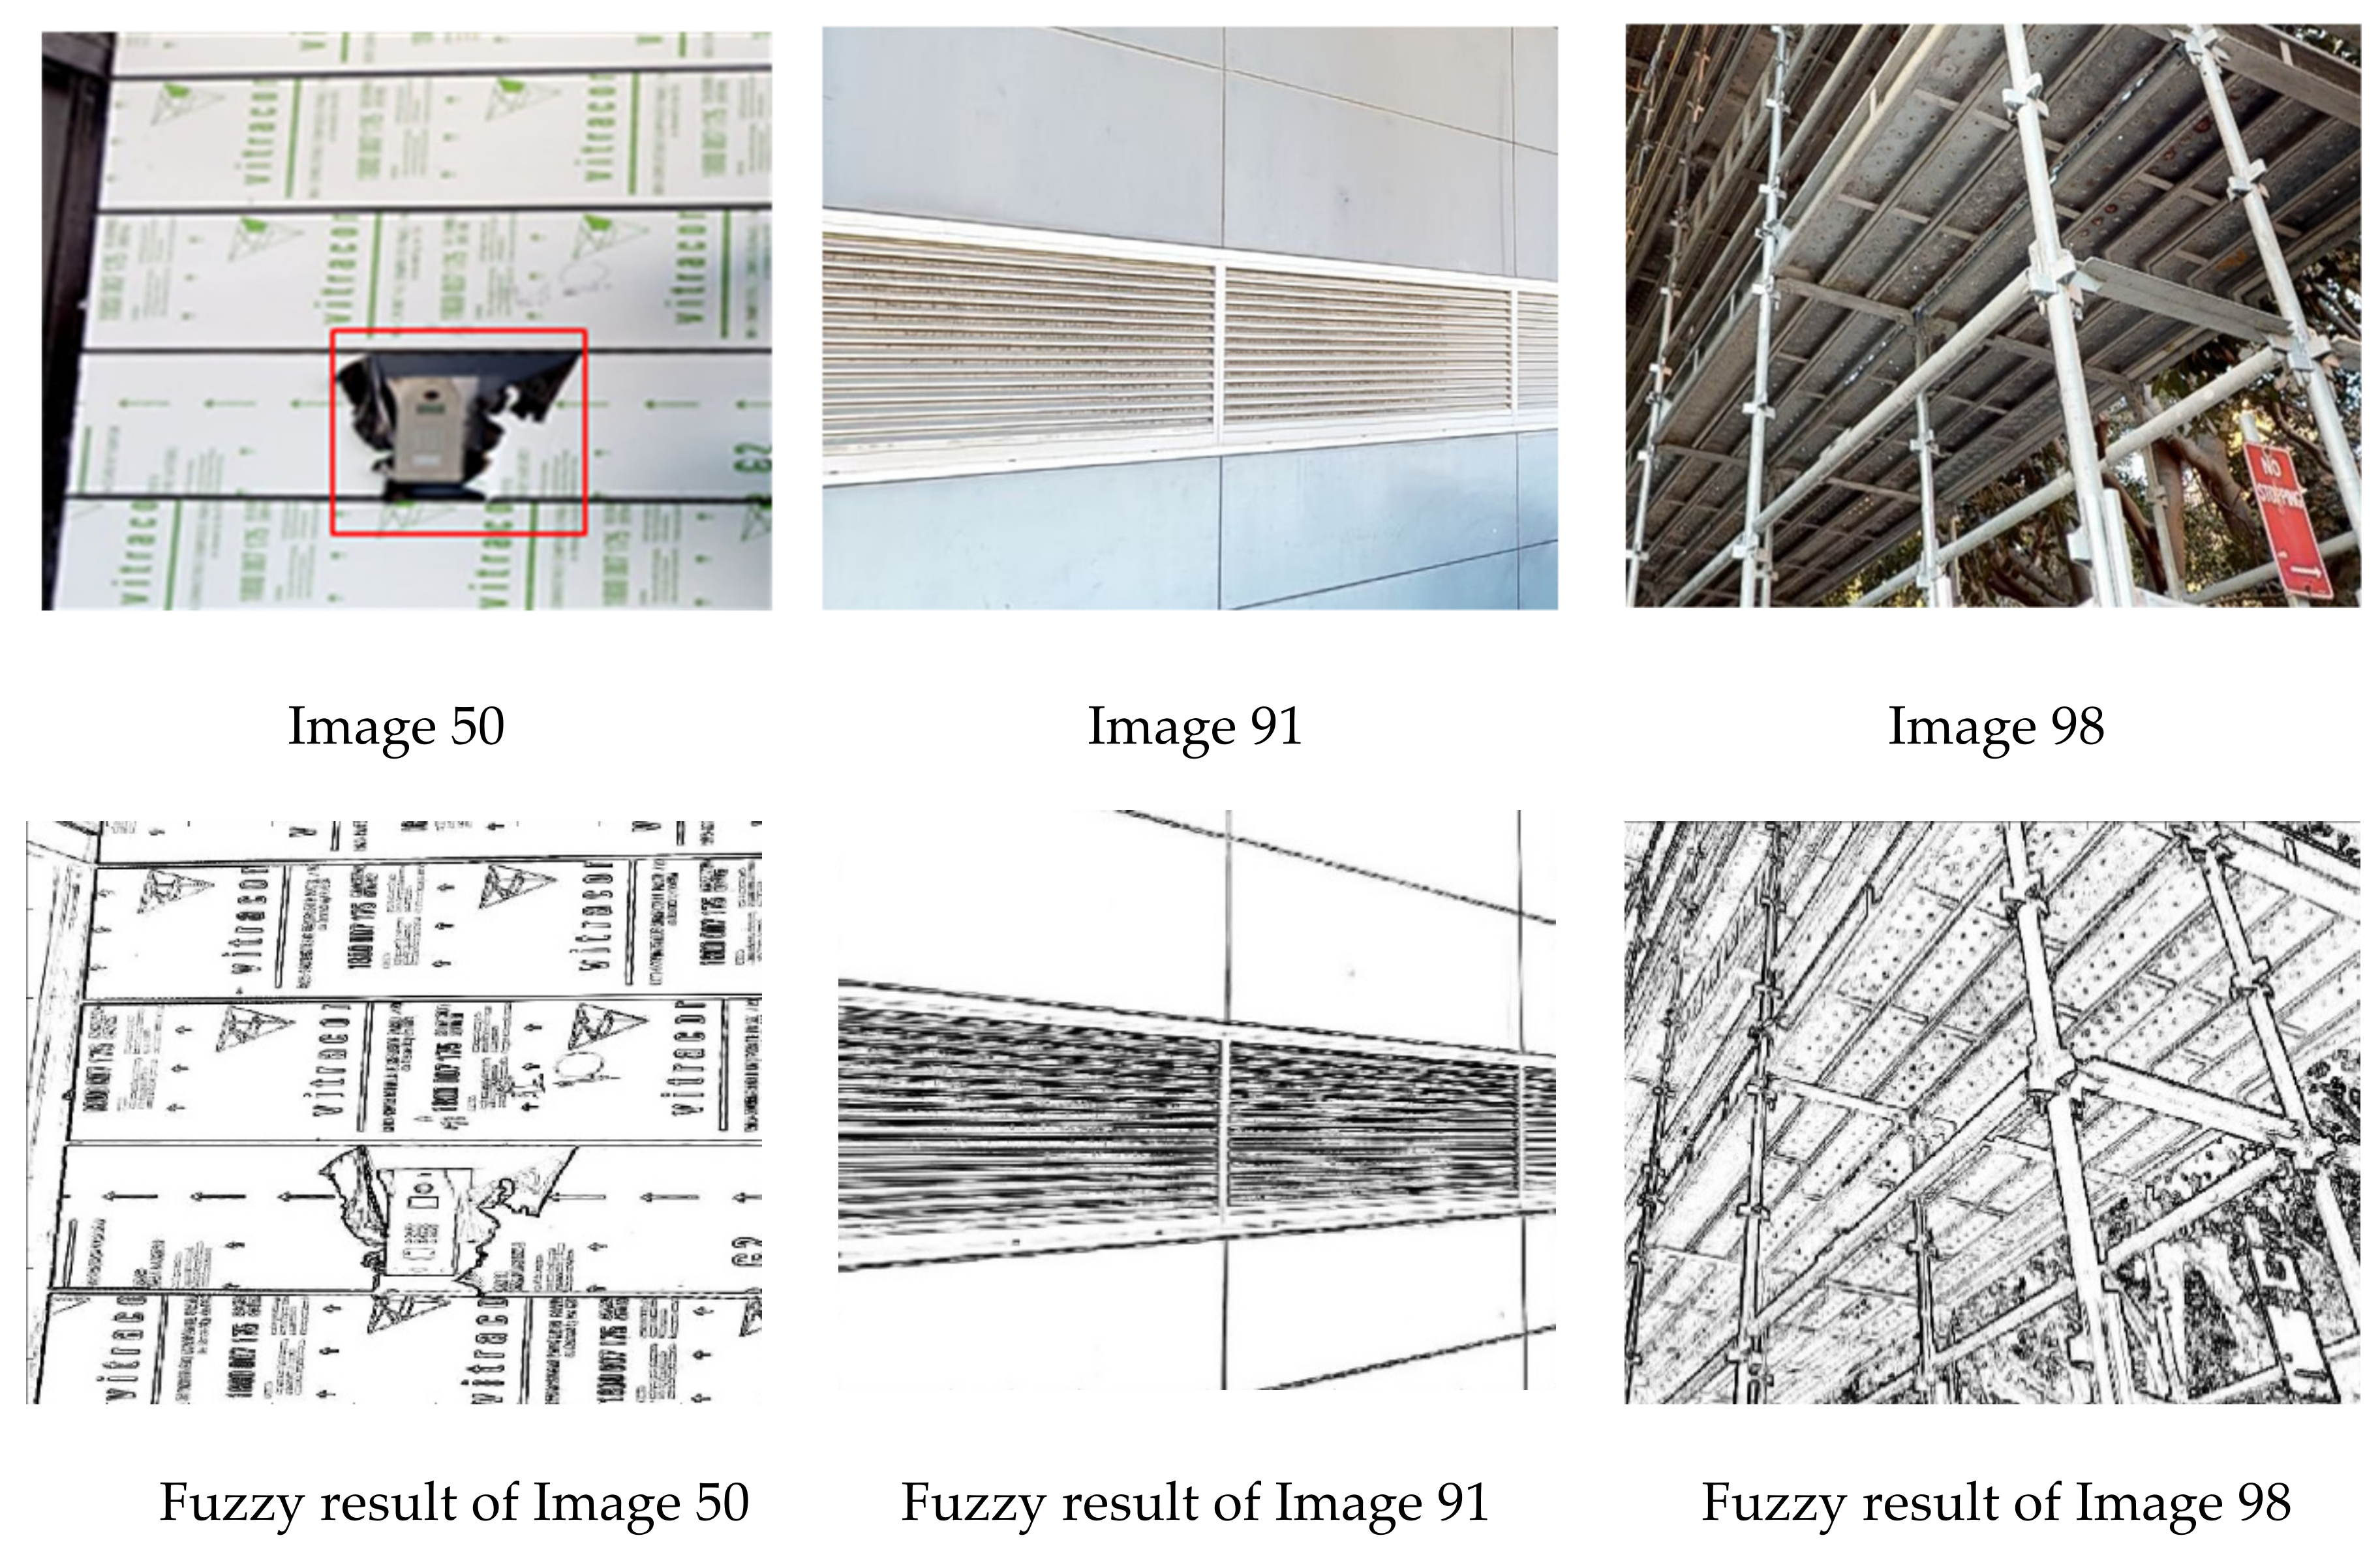
Figure 7 shows the outliers of the fuzzy logic method and the processed results. The cover on the panel in Image 50, less contact or high level of light in Image 91, and the complicated image of scaffolding in terms of many lines in the image can be reasons to be outliers of this method. Different outliers show that the performance of algorithms on contrasting images are different. This suggests the use of both fuzzy logic and one of the first five methods for image processing to verify the results or gain more information about the images. Overall, the results of MSE show that the fuzzy logic method performs better with fewer errors, and the quality of the processed images is also clear and helpful to practitioners in construction.
In addition, a statistical test was applied to identify any significant differences among the results of the processed images using each algorithm applied on the images of each scenario [
67]. Using mix methods are recommended in construction studies [
68], the experimentation of the MSE evaluation found that in RGB-Sobel, scenario one had a significantly higher MSE (230.83 ± 42.70) compared to the MSE of RGB-Sobel results for the second scenario (116.22 ± 111.23),
t(98) = 7.236,
p = 0.000. This experimentation also found that the MSE of Fuzzy Logic, scenario one had statistically significantly higher MSE (9.244 ± 5.825) compared to the MSE of Fuzzy Logic results for the second scenario (6.314 ± 6.12),
t(98) = 2.414,
p = 0.018.
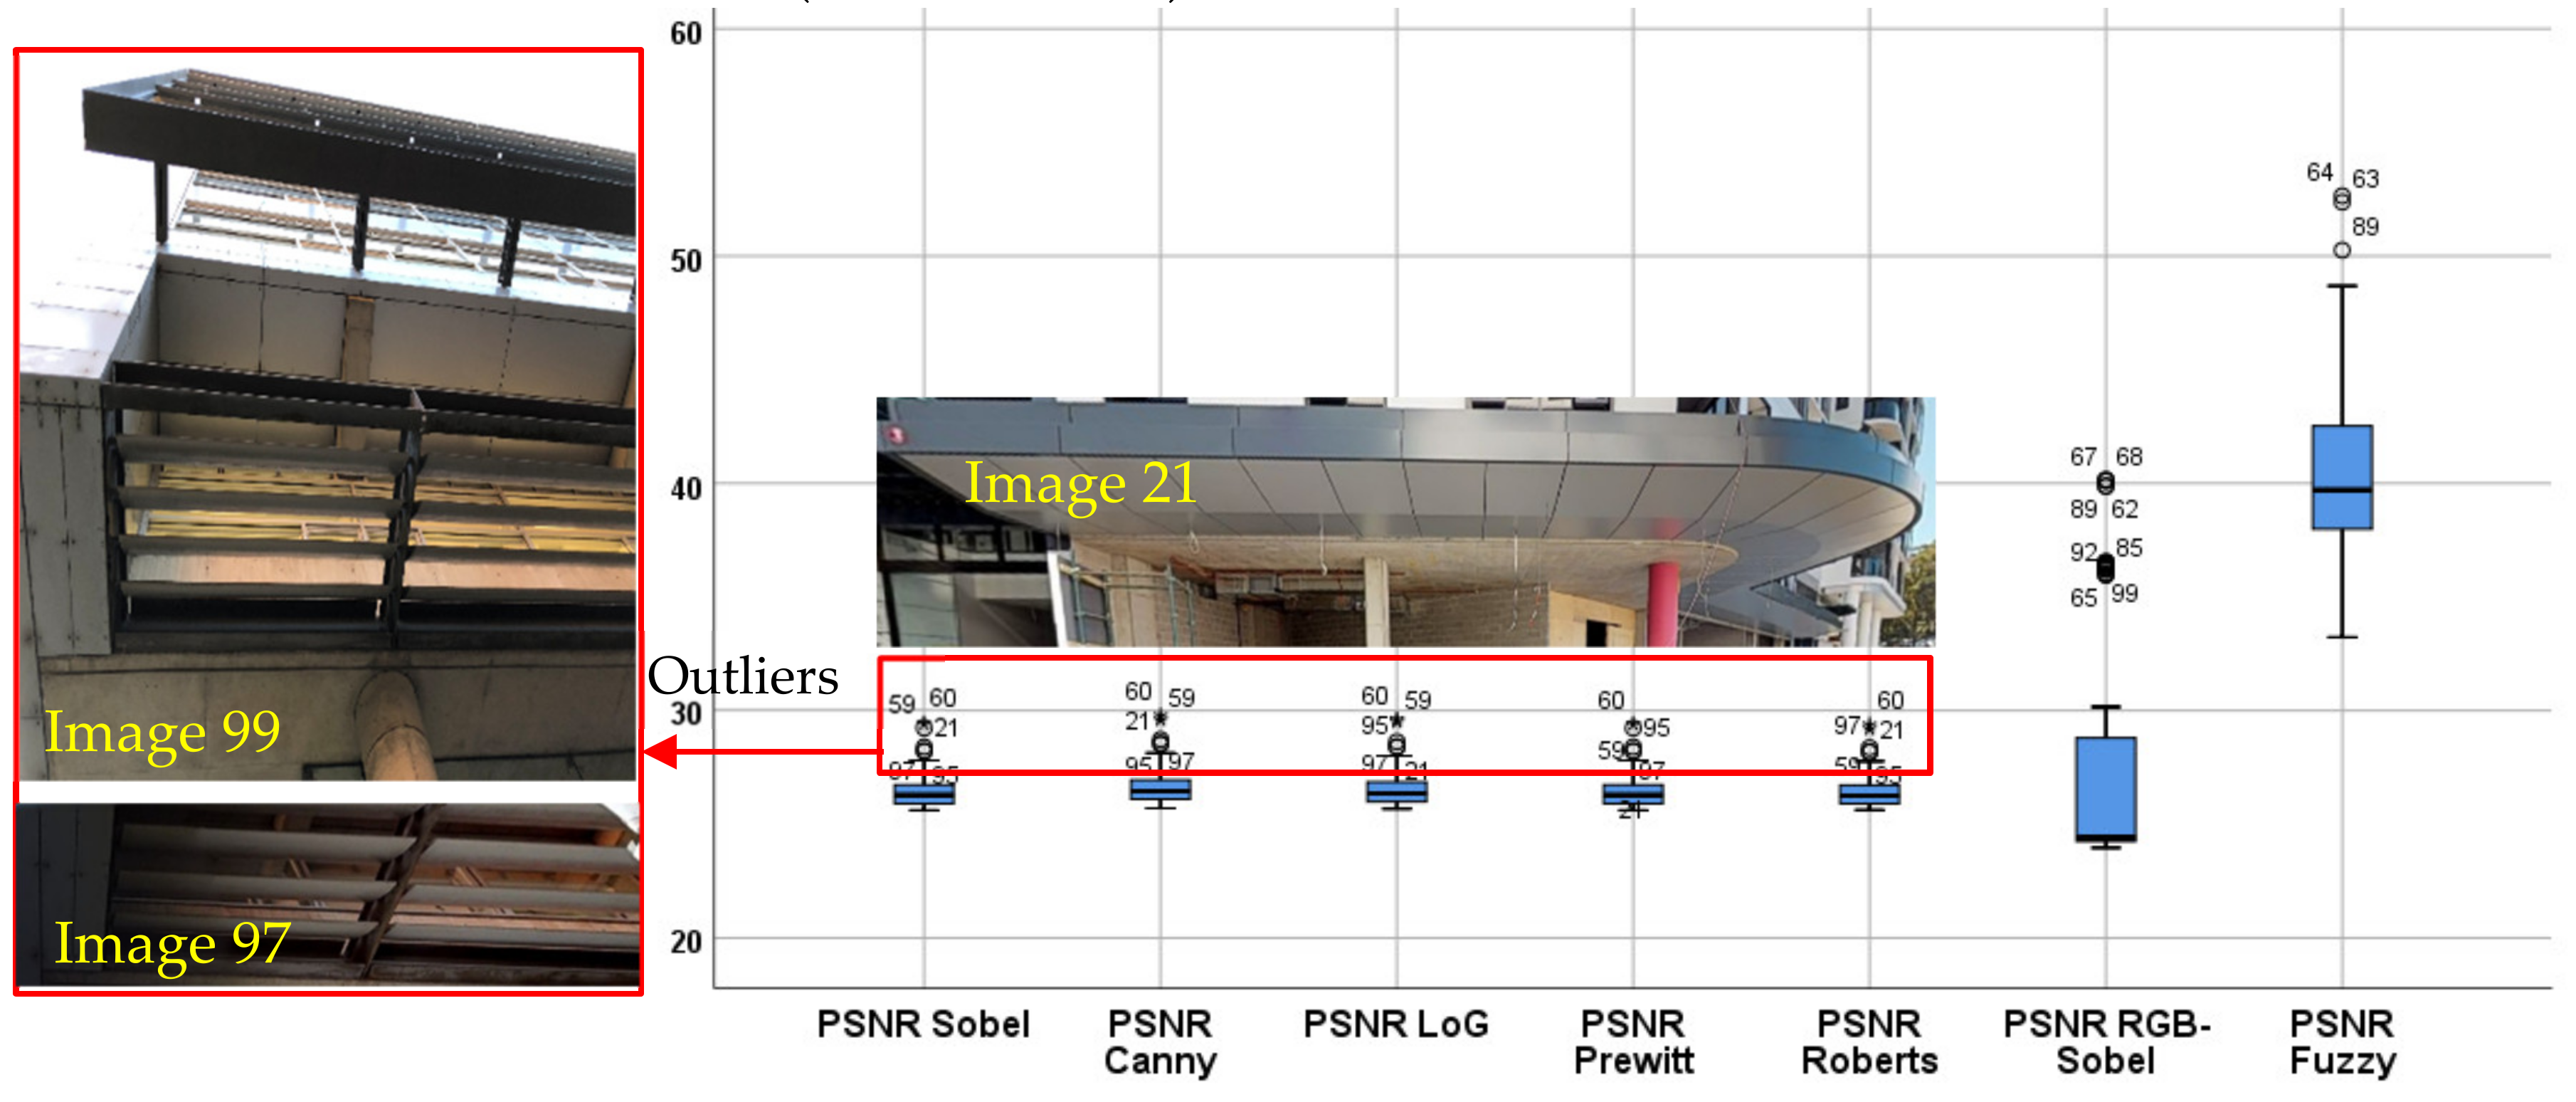
The fifth test of the evaluation is to estimate PSNR for the results of all seven algorithms. The mean results of PSNR for the first five algorithms Sobel, Canny, LoG, Prewitt and Roberts are very close to each other varying from 26.454 to 26. 686.
Figure 8 also shows there are the same outliers for these five algorithms such as images 21, 59, 60, 95 and 97.
Figure 8 shows totally different results for RGB-Sobel and Fuzzy. There is a statistical difference between scenarios one and two for the results of PSNR using the RGB-Sobel algorithm. The significant difference is confirmed by the lower PSNR (24.639 ± 1.323) of the first scenario compared to the PSNR of RGB-Sobel results for the second scenario (31.103 ± 6.445) with the values of
t(98) = −7.551 and
p = 0.000. The statistical difference between PSNR of Fuzzy Logic for the two scenarios, is also proved by values of
t(98) = −3.821 and
p = 0.000 for the lower PSNR (39.295 ± 2.852) in scenario one compared to the PSNR of Fuzzy Logic results for the second scenario (42.132 ± 4.575).
The sixth test examined is to compare the average of the SSIM of different algorithms. The SSIM of Fuzzy logic algorithm is by far higher than all other algorithms. While the SSIM of LoG show the highest value among the non-fuzzy algorithms, overall the SSIM of these algorithms are very close.
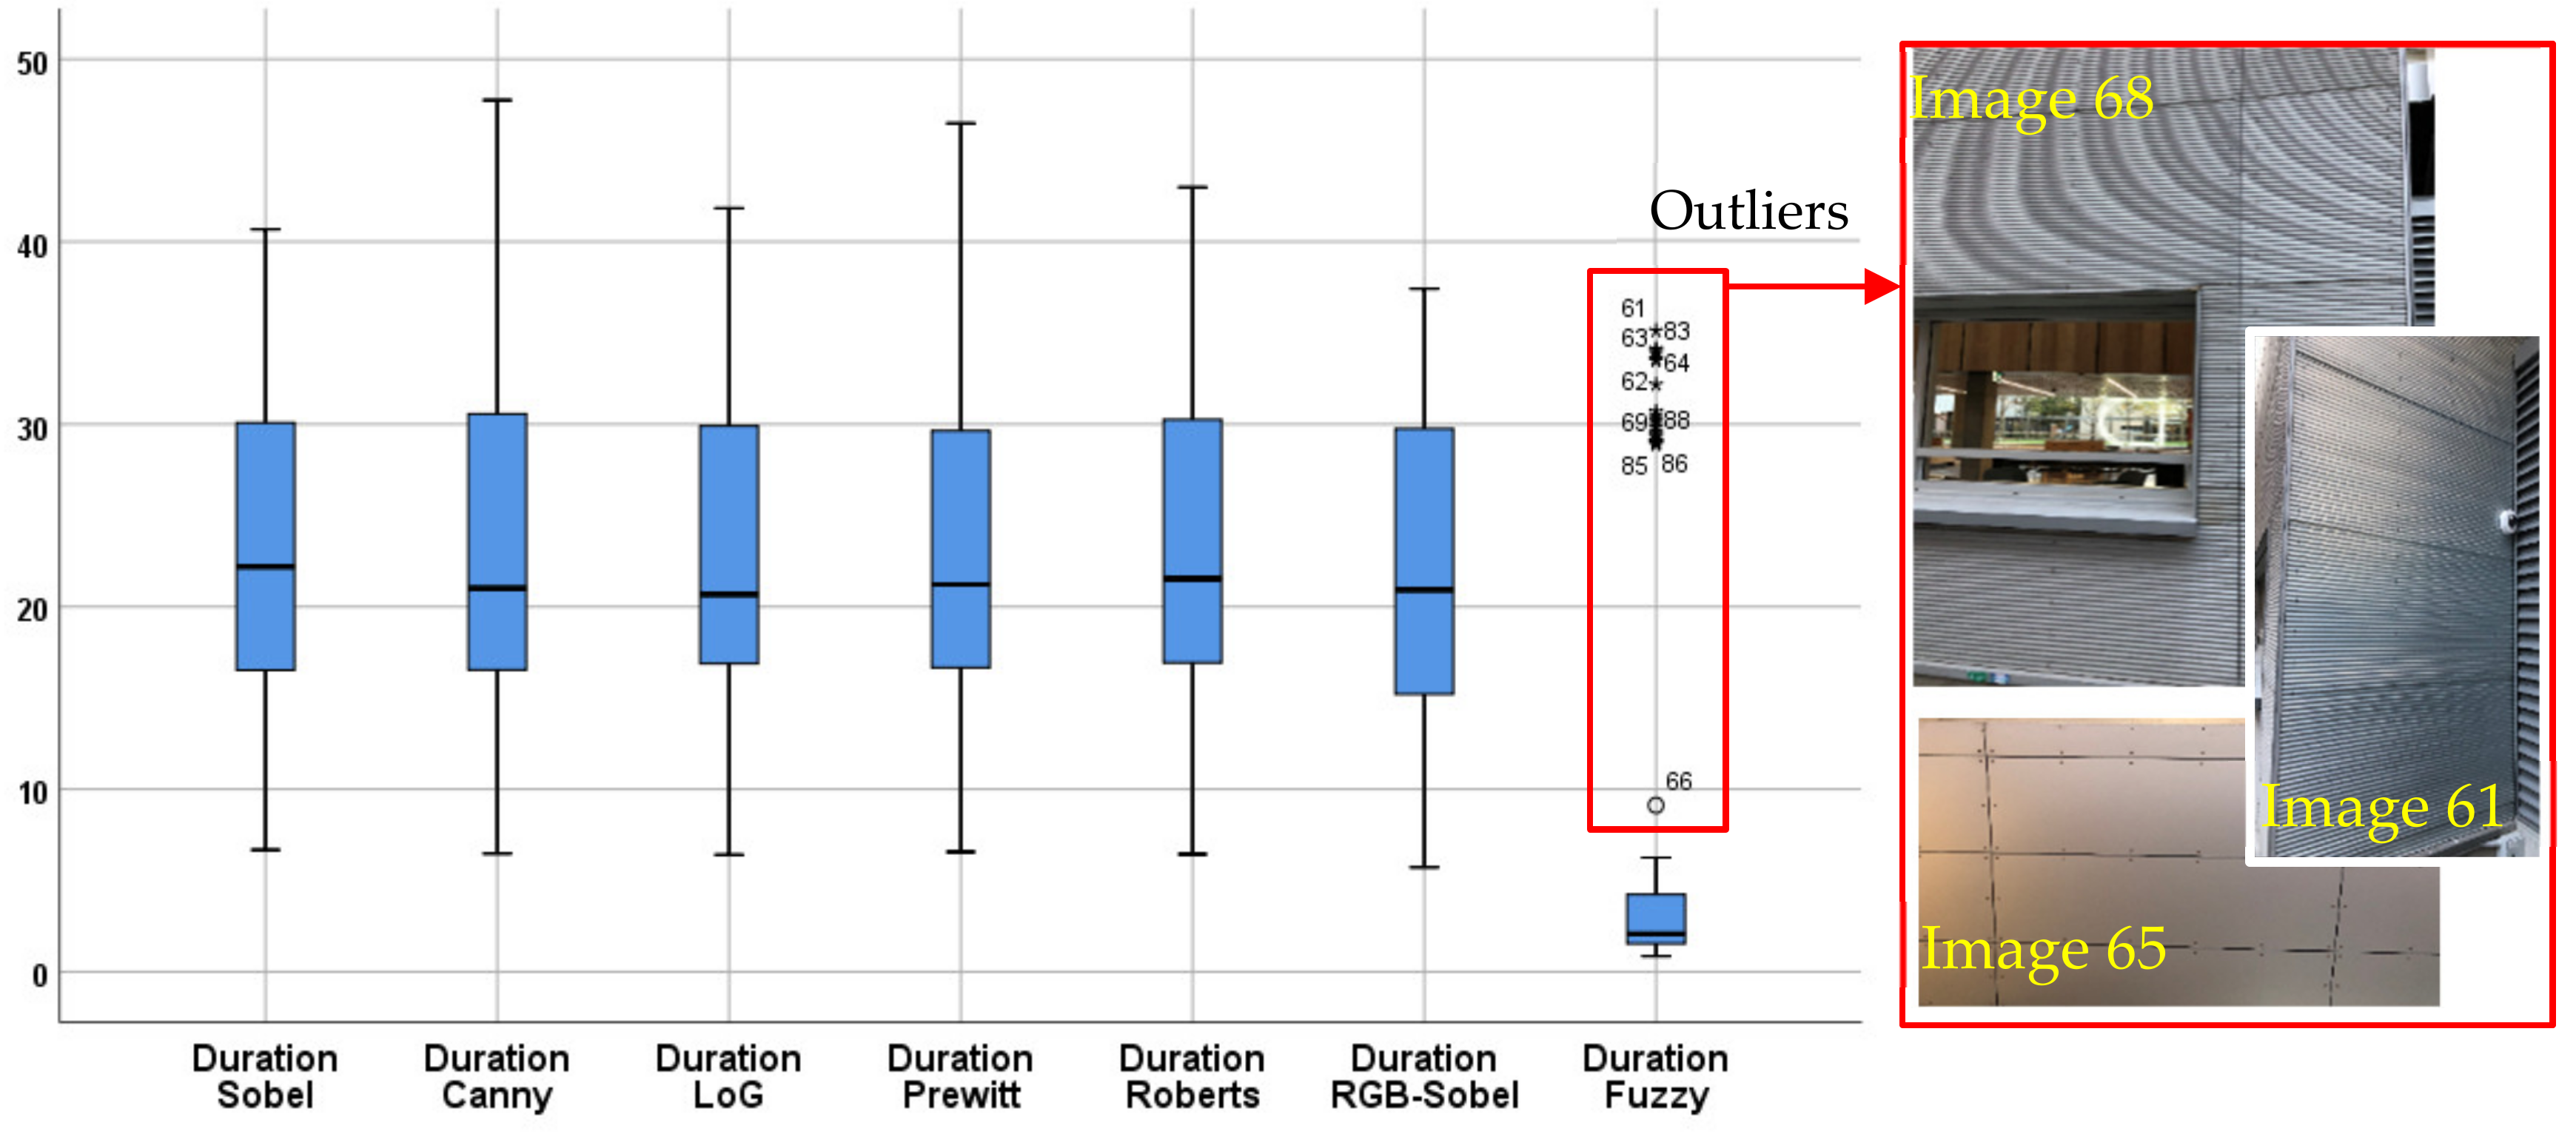
The seventh factor examined is to compare the duration processing images using all seven algorithms. The computer for running these algorithms is a laptop. Its processor is Intel(R) Core
TM i7-7600U CPU@2.80GHz 2.90 GHz, and its RAM is 16.0 GB.
Figure 9 shows that the average of the first six algorithms Sobel, Canny, LoG, Prewitt, Roberts and RGB-Sobel are very close to each other varying from 20.91 to 23.38 Seconds, and the Fuzzy method spends the least average running time.
Figure 6 shows totally different results for the Fuzzy logic processing.
Figure 9 shows that there are several outliers only for the fuzzy logic algorithm including images 61, 62, 63, 69, 85, 86 and 88. Images 65 and 66 are different from other wall panels, since the image shows the full size of rectangle ceiling panels. Images 61 to 64 contain corrugated wall panels which include many parallel lines to be processed and distinguished.
During the experimentation of the duration evaluation, we found that there is no statistical difference between duration of RGB-Sobel in the first scenario with the duration range of (20.192 ± 7.535) and the second scenario with duration range of (23.383 ± 10.246) for the results of t(98) = −1.389 and p = 0.168. In contrast, there is significant statistical difference for Fuzzy Logic between the first and second scenario with range of durations of (2.153 ± 0.908) and (16.555 ± 14.826) for the values of −7.522 and 0.000. for t(98) and p, respectively.
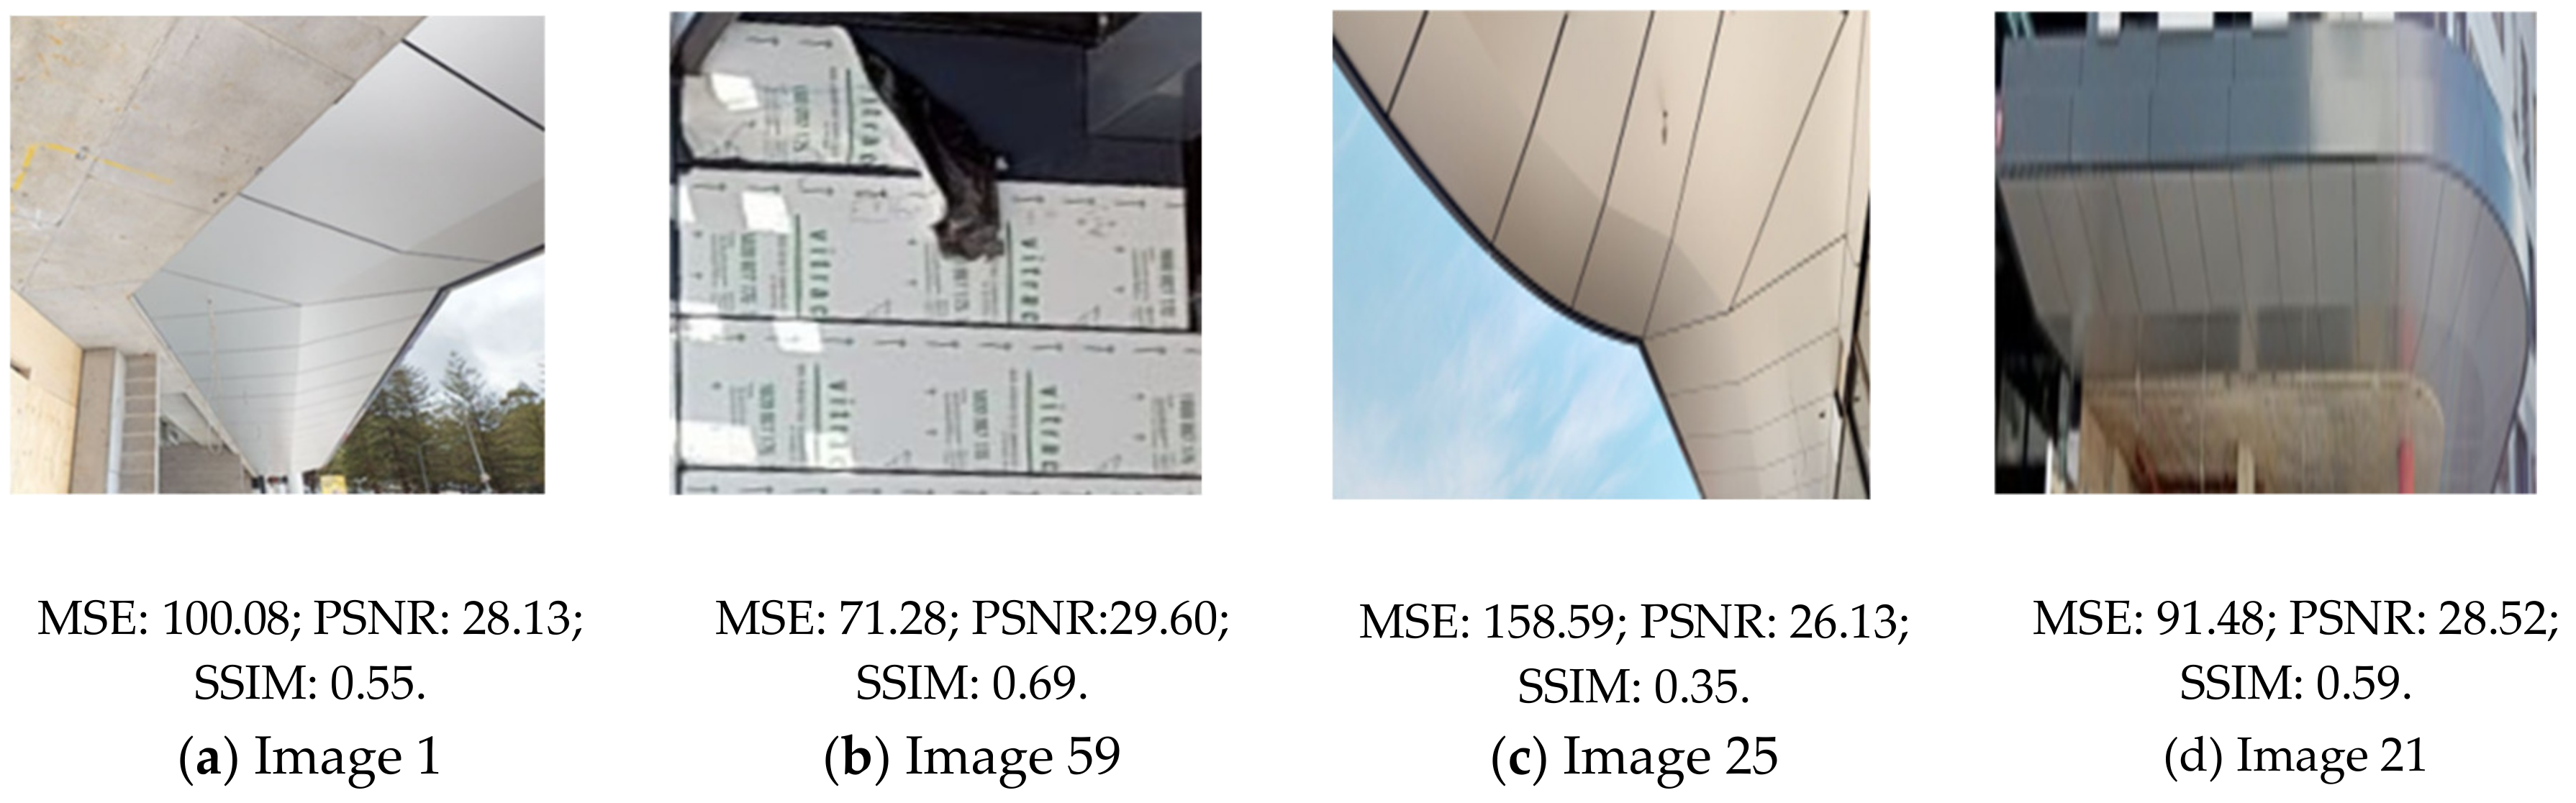
After analysing the seven tests and factors that have different influences on different algorithms, this paper lists two phenomena that results of all algorithms display. First, the results show that unwanted items such as vegetation and cloudy sky produce a lot of unexpected curved lines. This may decrease the accuracy of an edge detection algorithm. This can be one of the reasons resulting in some errors in our experimentations (refer to
Figure 6 to
Figure 9). It implies that the method of photography (e.g., view angle) affects the photo quality for including unwanted items. If only simple edges such as straight lines exist in one figure, accuracy will be higher compared to the images including curved, straight and angled lines and vegetation. For example,
Figure 10a image 1 presents an example of lower accuracy edge detection, since the trees, as unwanted items, will affect the image analysis. In contrast, almost all lines in
Figure 10b image 59 are straight and there are no unwanted items beside the panels. To be specific, images 1 and 59 contain different materials such as aluminum sheet, aluminum composite and CFC panels which could be used as external cladding. The length and width of the raw sheets vary between 1m to 1.5 m, and 2.5 m to 4 m respectively. However, the length and width of panels depend on the panel layout provided by the architect.
Figure 10c shows another example of unwanted items (i.e., cloudy sky) in an image that gives results of lower accuracy. By contrast,
Figure 10d includes a photo with a lower number of unwanted items that already achieved a higher rate of accuracy. Another important point for discussion could be the view angle in photography that helps exclude unwanted items such as the way that
Figure 10d was taken. It was found that the amount of cloud may affect the brightness of an image that leads to changes in the accuracy of the algorithms. We recommend performing a further study to confirm this effect. Moreover, analysis results show that edge detection algorithms can be used for panel detection and the Canny operator shows the best performance for panel construction, because the Canny operator shows best performance in every photo evaluated by using MSE, PSNR and SSIM methods.
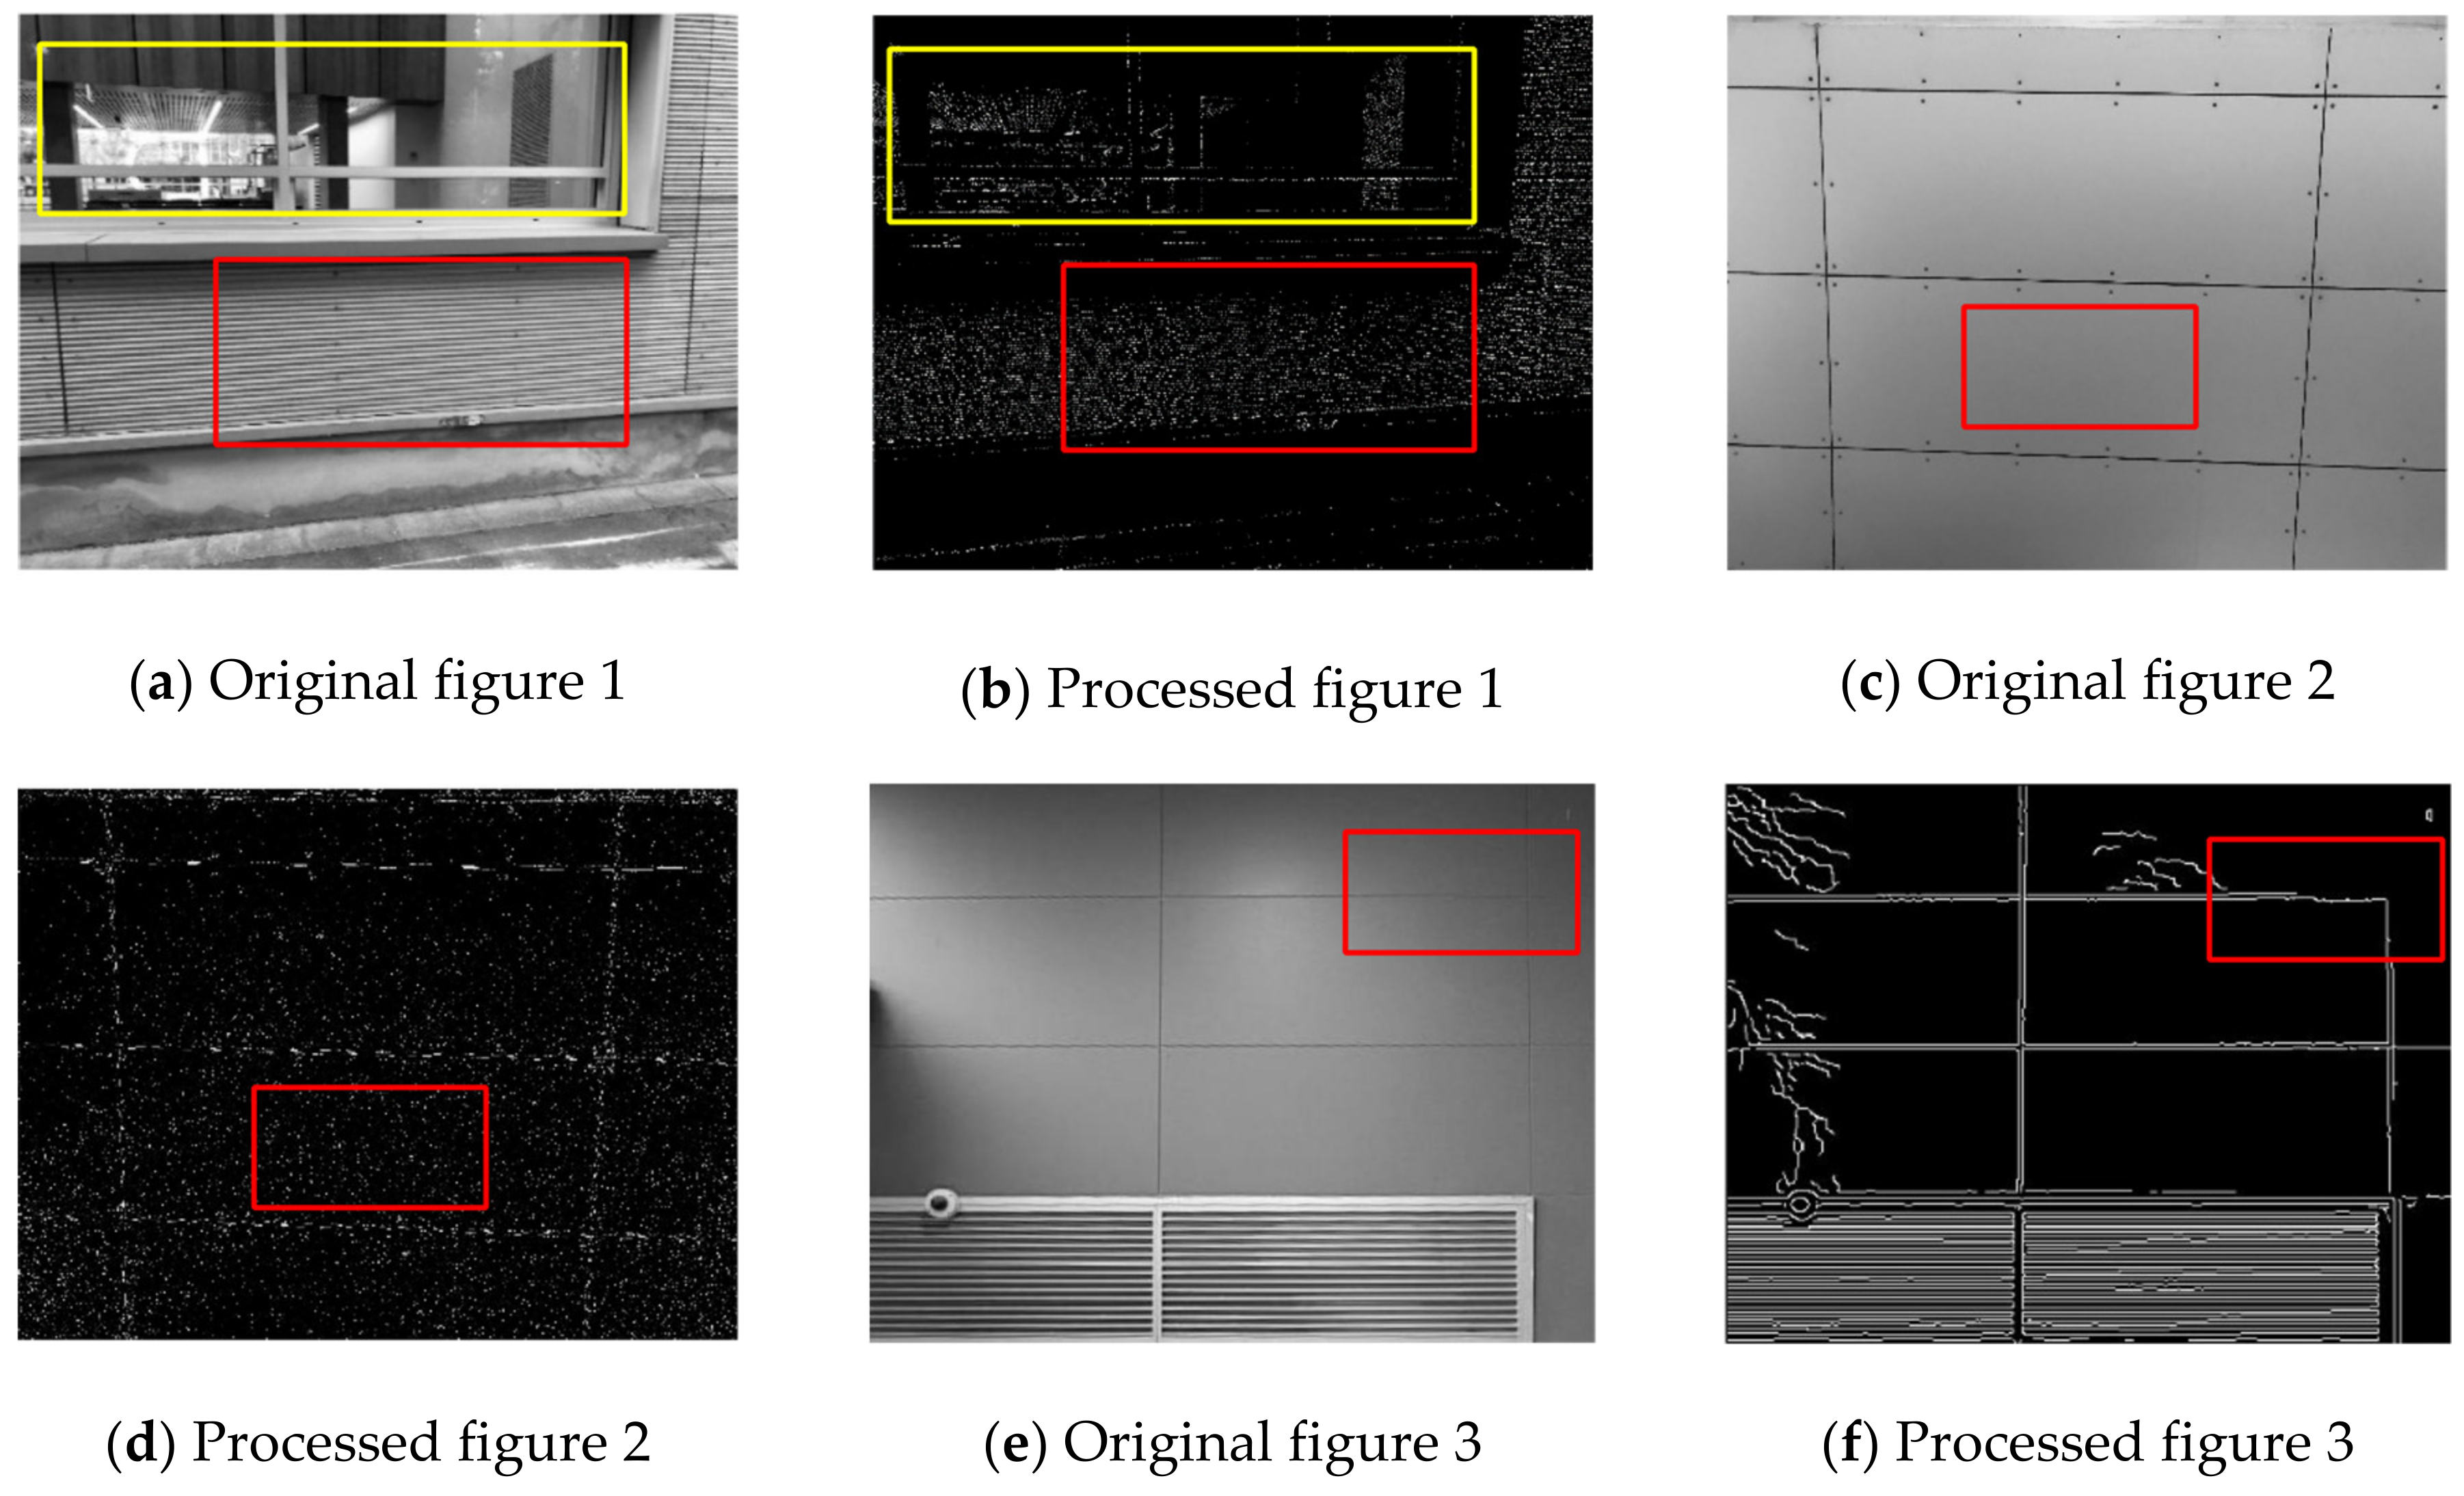
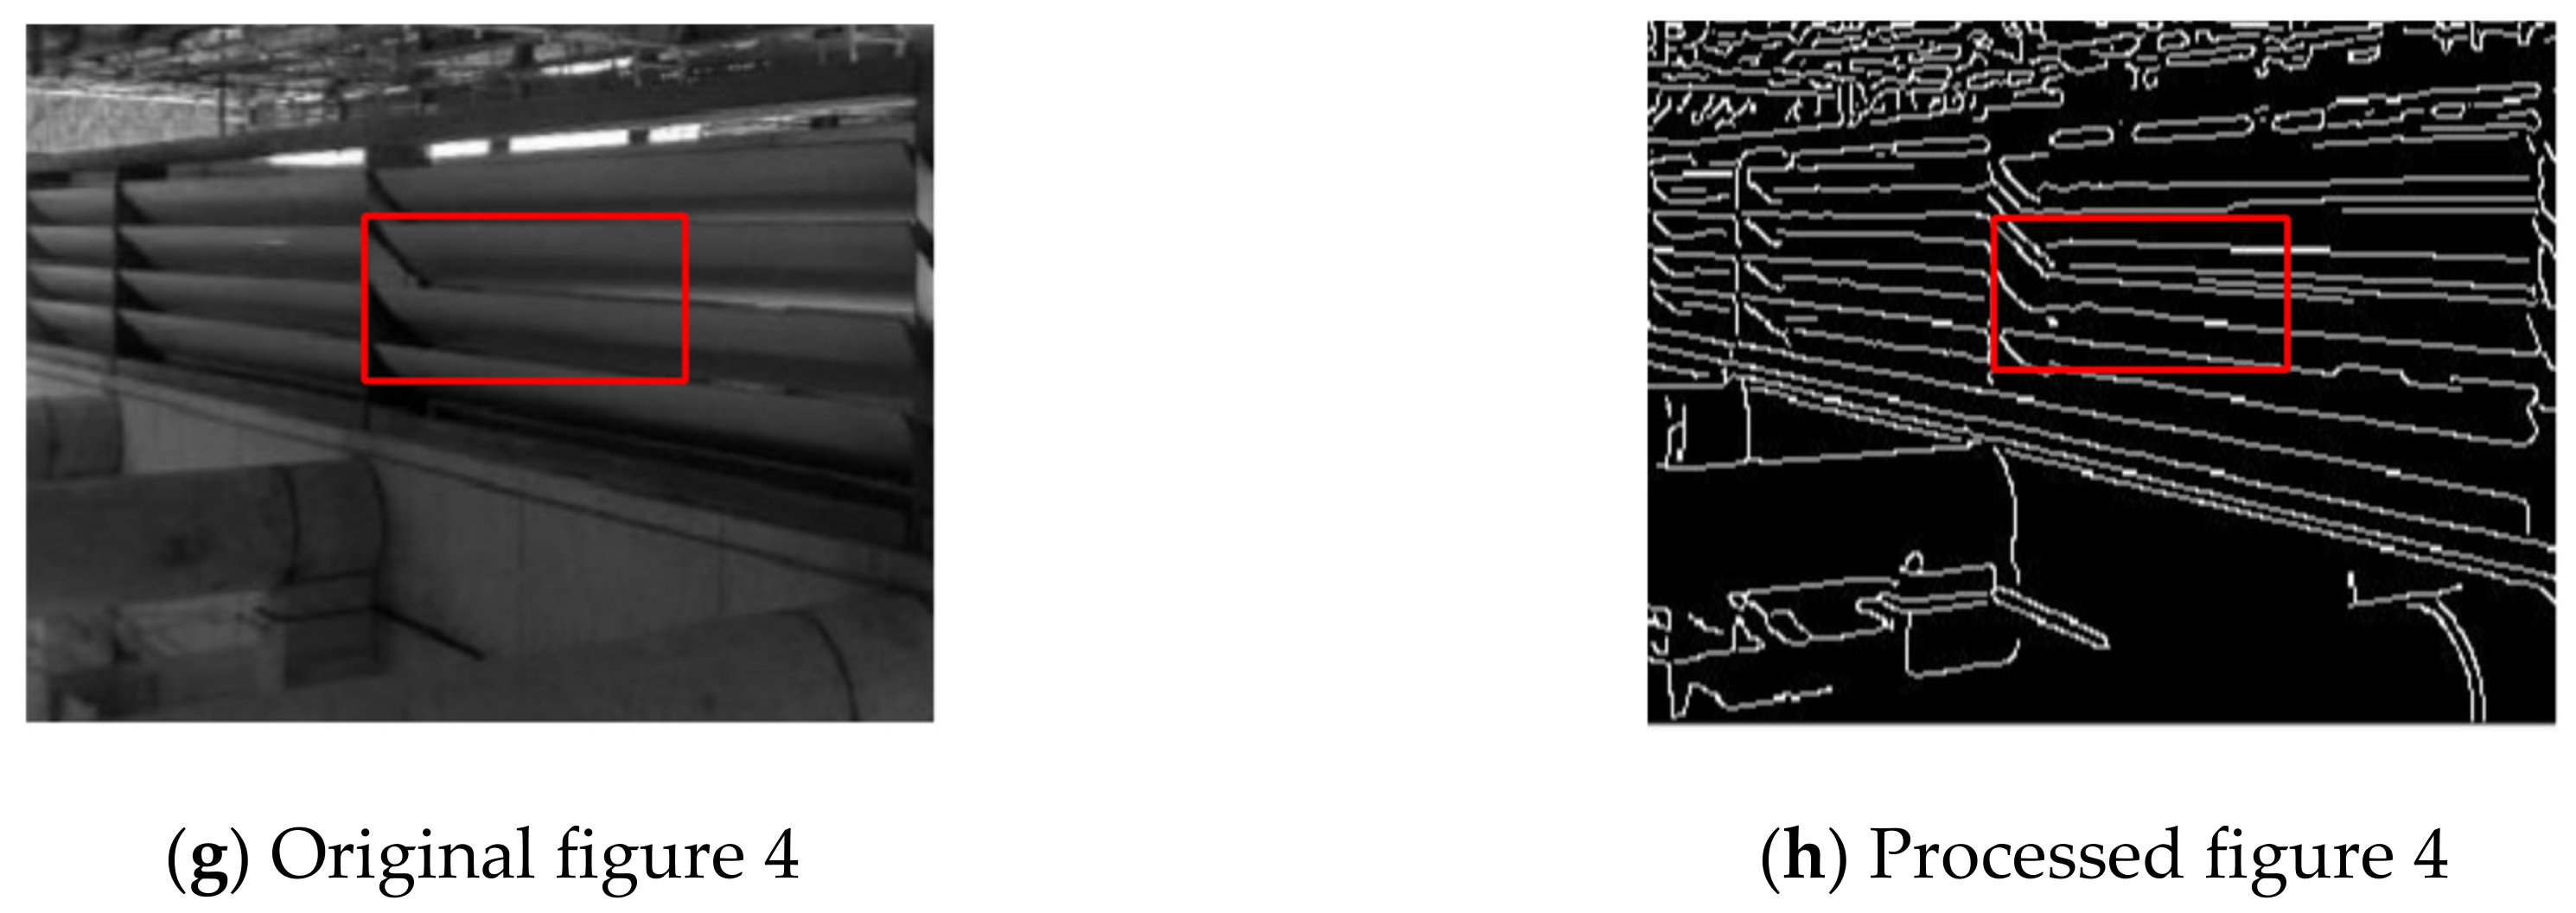
Second, results of some figures are undesirable, and this may be due to too many reflective surfaces or too many dense lines as shown in
Figure 11. For example, many dense lines in the red rectangle areas can be seen in
Figure 11a.
Figure 11b also shows several ceiling panels with different level of lights in each panel resulting in many points (see
Figure 11d). That is why in both cases
Figure 11a,c, the processed image can only show many points instead of edge lines (see
Figure 11b,d).
5. Discussion
This paper aimed to employ different cameras including a new 3D camera to investigate different ways of examining the quality of exterior cladding and monitor modular construction. The theoretical contribution of this work is to collect information of exterior cladding and detecting edges automatically. Exterior cladding is an important part of building construction since safety monitoring is required at high levels and the quality of cladding should be controlled to satisfy clients. However, there is not any reliable data source for engineers and construction workers to check the quality at a high exterior level of buildings. Compared with traditional quality control methods related to exterior cladding, the contribution of this paper lies in evaluating a variety of edge detection algorithms to analyse images of construction objects including wall and ceiling exterior cladding panels. The purpose of the analysis is to use photogrammetry for computational analysis of quality control, particularly in modular buildings. Our experimentation revealed that a combination of algorithms can help to provide fairly accurate information about the quality of panels during construction. Our experimentation also assists draftsmen for as-built modelling and updating Building Information Modeling [
69,
70,
71], based on the final panel layout and joint sizes. The construction industry has been known to be laggard in adopting new technologies, and there is a large effort to facilitate the process of technology adoption by exploring new applications and addressing barriers of technology implementation [
72,
73]. Exploring new algorithms for enabling drones and robots to recognise objects, defects and edges may facilitate and increase the adoption of new drones and robots in construction [
74,
75,
76,
77].
Seven analysis methods were applied in the experimentations as discussed in
Section 4. The first three validation methods including false positive and negative errors, the degree of discontinuity and ease of use for non-experts show that all these seven algorithms need to be improved and developed. First, it is necessary to decrease false positive and negative errors for increasing the accuracy of algorithms. The degree of discontinuity is also a problem existing in all algorithms though RGB-Sobel and Fuzzy perform better. Thus, further work may include development of these algorithms with fewer errors. From the findings of “ease of use for non-experts” factor [
78], the authors can conclude that more accurate algorithms require higher skills for operation. How to simplify formula can be an issue to be solved in the future.
The fourth to sixth factors refer to the most common statistical methods MSE, PSNR and SSIM.
Table 3 presents the results of these three methods by ranking the algorithms based on their level of performance from the best to the lowest. As we obtain a lower value of MSE and higher values of PSNR and SSIM for better performing algorithms, we ordered the ranks from minimum (min) to maximum (max) for MSE and the reverse order (i.e., max to min) for PSNR and SSIM. As seen in
Figure 6,
Figure 8 and
Figure 9, fuzzy logic outperforms all other algorithms.
Table 3 shows that edge detection algorithms can be used for panel detection and the Fuzzy operator shows the best performance for panel construction, because the Fuzzy operator shows best performance in every photo judged by achieving a lower level of MSE and a higher value of PSNR and SSIM. Comparatively, the Roberts algorithm will offer the lowest level of accuracy. However, the performance of RGB-Sobel based on MSE, PSNR and SSIM are totally different. Although RGB-Sobel shows better results than Sobel, Canny, LoG, Prewitt and Roberts in human eyes (
Figure 5), the analyses from MSE and SSIM show a different result.
Using all tests, we investigated the differences between the computational analysis with the human eye’s observation [
79]. For example, Human eyes may consider edges in the left corner of the seven results in
Figure 5 as noises, but in fact they are known as real edges in the computer language. Thus, the difference between them needs to be discussed. Previous studies reported that there are optical illusions when human eyes interpret an image including edges and lines that evoke a feeling that totally deviates from the computational image recognition or reality [
31]. The seventh factor is running time. Fuzzy spends less average running time than the other six algorithms. Besides, based on analysis of other factors, it is better to apply the Fuzzy algorithm in future panel edge detection practices.
The use of multiple edge detection methods is needed to find appropriate detection methods. However, due to the influence of unwanted objects and shape of panel surfaces, the detection has some limitations. Based on findings, unwanted objects can increase unrelated edges and positive errors. The shape of panel surfaces can influence the reflection of sunlight and lines on the panel. Strong reflection of sunlight or too dense lines on a panel will decrease the accuracy of edge detection because it increases the difficulty of recognising edges.
Another unique aspect of this paper is that it compares the seven algorithms, six operator related methods and one Fuzzy method, with three statistical methods for edge detection of exterior cladding panels. Some papers have done related research, but they only compared some of these edge detection algorithms or only one or two statistical methods. None of them compare these seven algorithms with three statistical methods. Also, the literature review section in this paper reflects that most analysis of edge detection is not in the construction industry, so the related research is limited. In contexts other than construction, several papers have analysed edge detection algorithms using evaluation methods. For example, Heath, et al. [
80] compared the edge detection algorithms of Sobel, Canny, Nalwa–Binford and Sarkar–Boyer for the application in computer vision using a rating task with intraclass correlation coefficient method. In addition, Sharifi, et al. [
81] applied seven non-fuzzy edge detection operators including Sobel and Canny algorithms and compared their performance using Signal to Noise Ratio and Average Risk. They found a better performance from the Canny algorithm. We also found better performance of Canny for non-fuzzy algorithms using only MSE for the evaluation method. The advantage of using more than one evaluation method is provision of a better insight towards the algorithms’ performances. Katoch and Bhogal [
42] compared three Fuzzy logic methods. One of them combined Fuzzy with Sobel. The other two were Fuzzy template and Fuzzy inference system. The evaluation of the three methods was counting the total number of edges with different thresholds. Fuzzy Inference System method showed the best result. While there is research on comparison among non-fuzzy edge detection algorithms, research on evaluation of fuzzy and non-fuzzy algorithms is rare. Indeed, the main novelty of this paper is to evaluate a fuzzy algorithm in comparison with non-fuzzy algorithms for edge detection in application to panel defect detection in construction. Besides, few of them combine the three methods MSE, PSNR and SSIM together to judge errors of edge detection. Most only apply one or two of the three methods. This paper provides an attempt to combine them together to analyse, which can be considered as a reference for future related research.
The practical implication of this study is that less skilled labourers can collect digital images from construction sites before, during and after panel installation and send it to the head office for remotely analysing the quality by experts. Another application of this study is assistance during preparation of the as-built drawings based on the final panel layout and joint sizes. This is common to apply all the changes to the approved shop-drawing and submit it as the as-built drawing at the end of the project. However, it is possible to miss some of those changes resulting in an imprecise as-built drawing, while using the proposed method in this paper we can prepare an accurate as-built drawing.
7. Limitations and Future Work
The 3D camera chosen in this paper has some limitations. First, it can only work in certain times for outdoor scans. It uses infra-red (IR) light to capture depth data about the environment. The infrared from the direct sunlight can interfere with the infrared scan and wash it out. Hence, sunlight, reflective surfaces and reflected sunlight can affect the quality of scanned 3D models. Side effects could be black spots in the dollhouse view and the integrity of the mesh which could cause jumping from one room to another randomly. The 3D mesh can have problems mapping to non-geometric shapes, for example, if the shapes are very thin or reflective. As a result, it is advised to close blinds, drapes and shades and use internal lighting. If outside scans are needed, it should be at dusk or dawn when the sun is below the horizon. This is a smaller window of time, so, depending on how much outdoor scanning the researchers are planning, they may need to plan a second visit to finish the outdoor segment. Second, small and thin objects cannot be recorded in the 3D camera. Most of the objects are far enough away from the camera, but the reason that accurate 3D data cannot be captured in the authors’ cases is because the object is simply too thin. Windows and their frames are a great example, also banisters, bars (or black columns in this paper’s case) and all the rods in front in the scanned space. With narrow objects, the 3D resolution of some scanned space is not high enough to properly render their surfaces. Other limitations should also be listed. All the chosen edge detection algorithms can only show results in greyscale and only detect 2D edges.
Future studies should examine the hybrid solution of using both camera and laser scanners to take advantage of both technologies [
82,
83]. In addition, further studies are required to investigate different images based on the content of images. For example, images 97, 59 and 60 are known as outliers when applying algorithms Sobel, Canny, LoG, Prewitt and Roberts. In addition, images 50, 59, 60, 91 and 98 were found as outliers when applying the fuzzy logic algorithm. The capability of algorithms for different types of construction objects have not been examined and should be investigated on a larger data set at different times of the day with different levels of light available in a construction site. Besides, thresholds of edge detection algorithms are the default based on MATLAB software. The discussion of choice of threshold can be a direction of future work.
Our future work will concentrate on colour edge detection using different tools including depth camera for automatic defect identification, not only grey-scale images changed from RGB image. Another direction of the future study would focus on automatic categorisation of different types of panel defects. Doing so will assist managers to conduct a safe, and cost- and time-saving approach in panel defect detection. Based on the edges shown in results, contractors can judge if there is a defect or not of a panel. There would be no need to go to the construction site which can save a great deal of time.
Our future work will also consider the edge detection for defect identification of different scenarios including slab edges (to find if it is sitting in or out) before starting the installation of the cladding and advise the builder about that. It is the responsibility of the formwork contractor to finish the concrete works within the permitted tolerance, otherwise the cladding contractor might have to use additional sub-framing to provide a neat and plumb cladding.
As for the technology of data collection, we intend to use acquired 3D data instead of 2D images by the 3D camera and 3D scanners in future work examining different methods of deep learning and voxel-automata for point cloud analysis [
84]. The major advantage of a 3D camera is achievement of both RGB and depth data. Hence, a 3D camera is an ideal choice for saving time and operation times.
It will be valuable to carry out object detection platforms for panel recognition purposes. Different types of panel defects can be detected and shown.


