A Numerical Study on the Effect of Position and Number of Openings on the Performance of Composite Steel Shear Walls


Abstract
1. Introduction
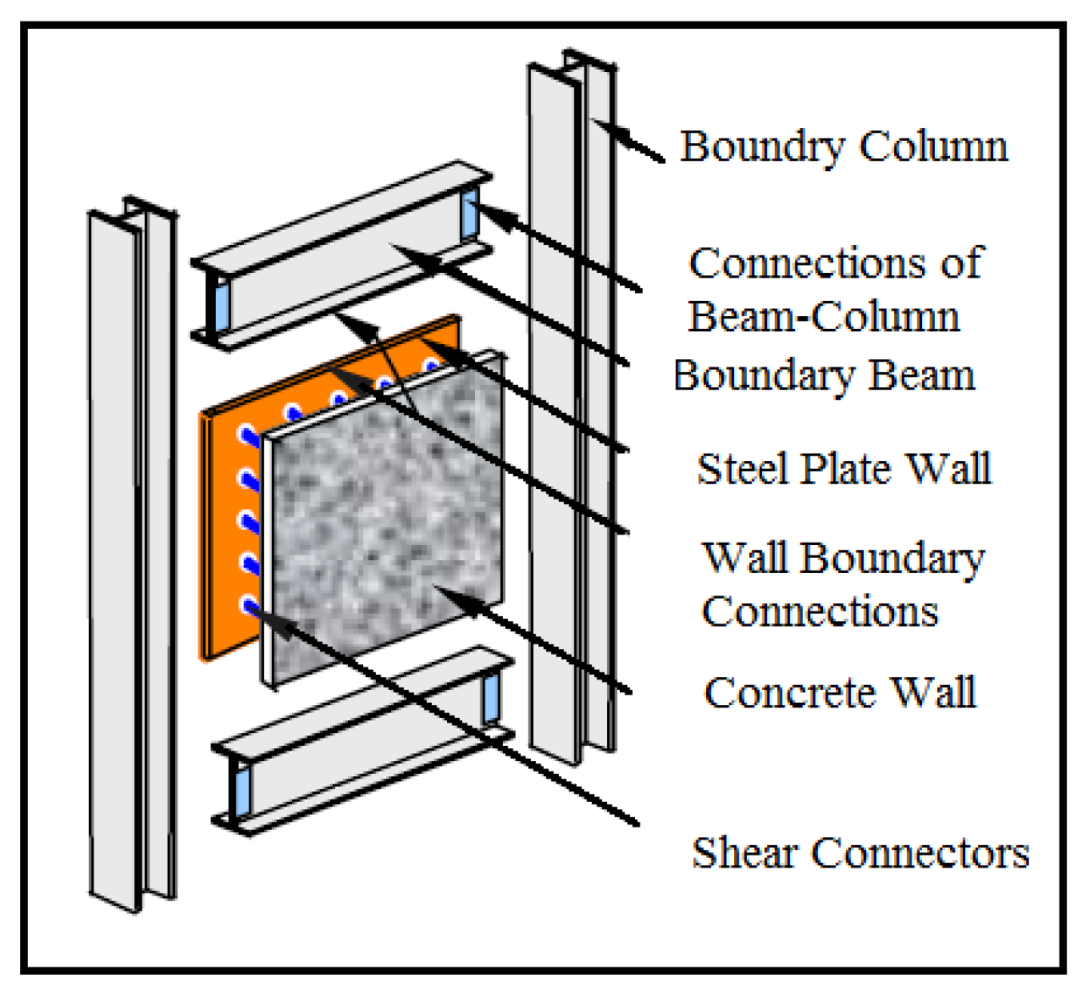
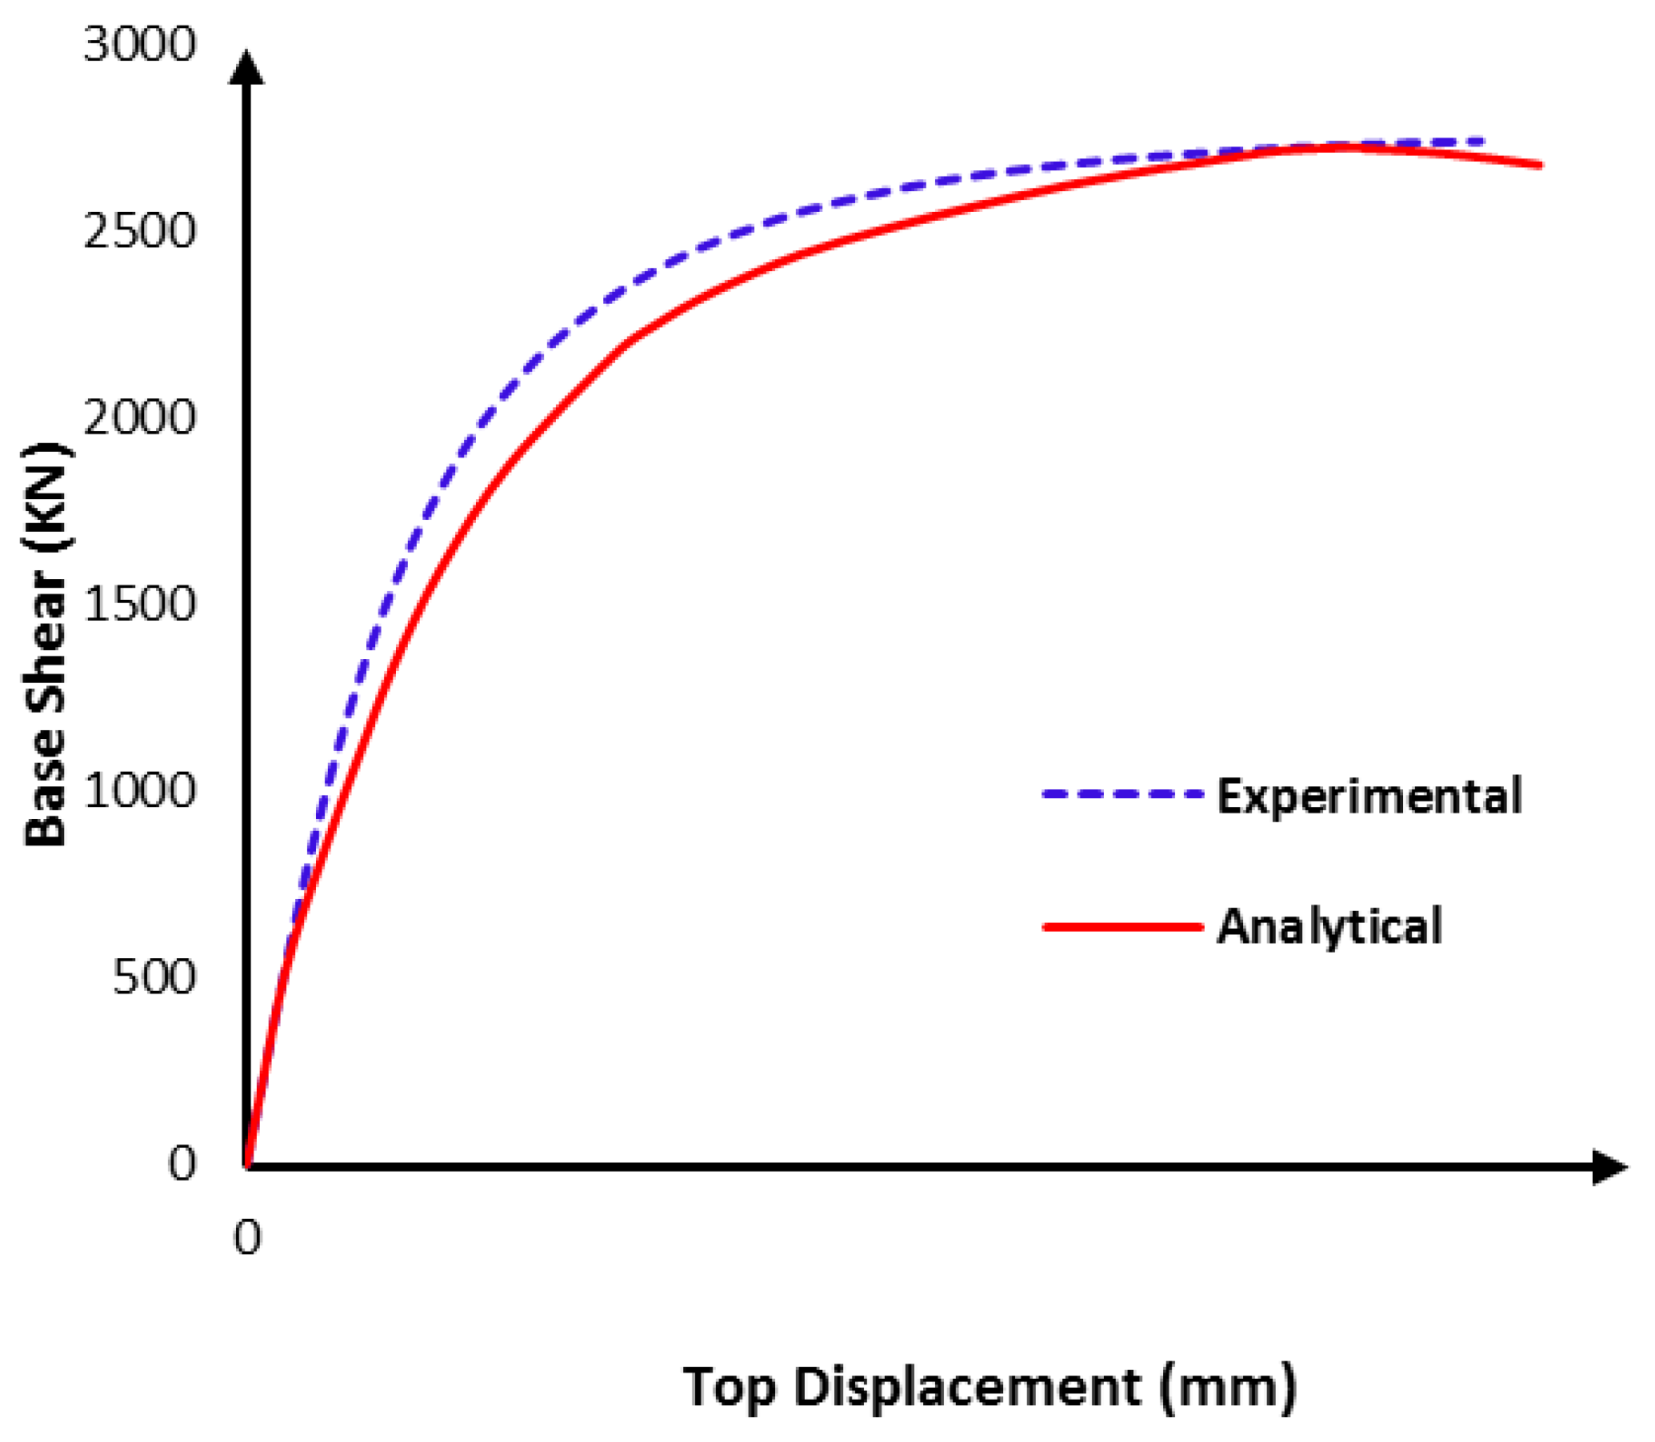
2. Validation
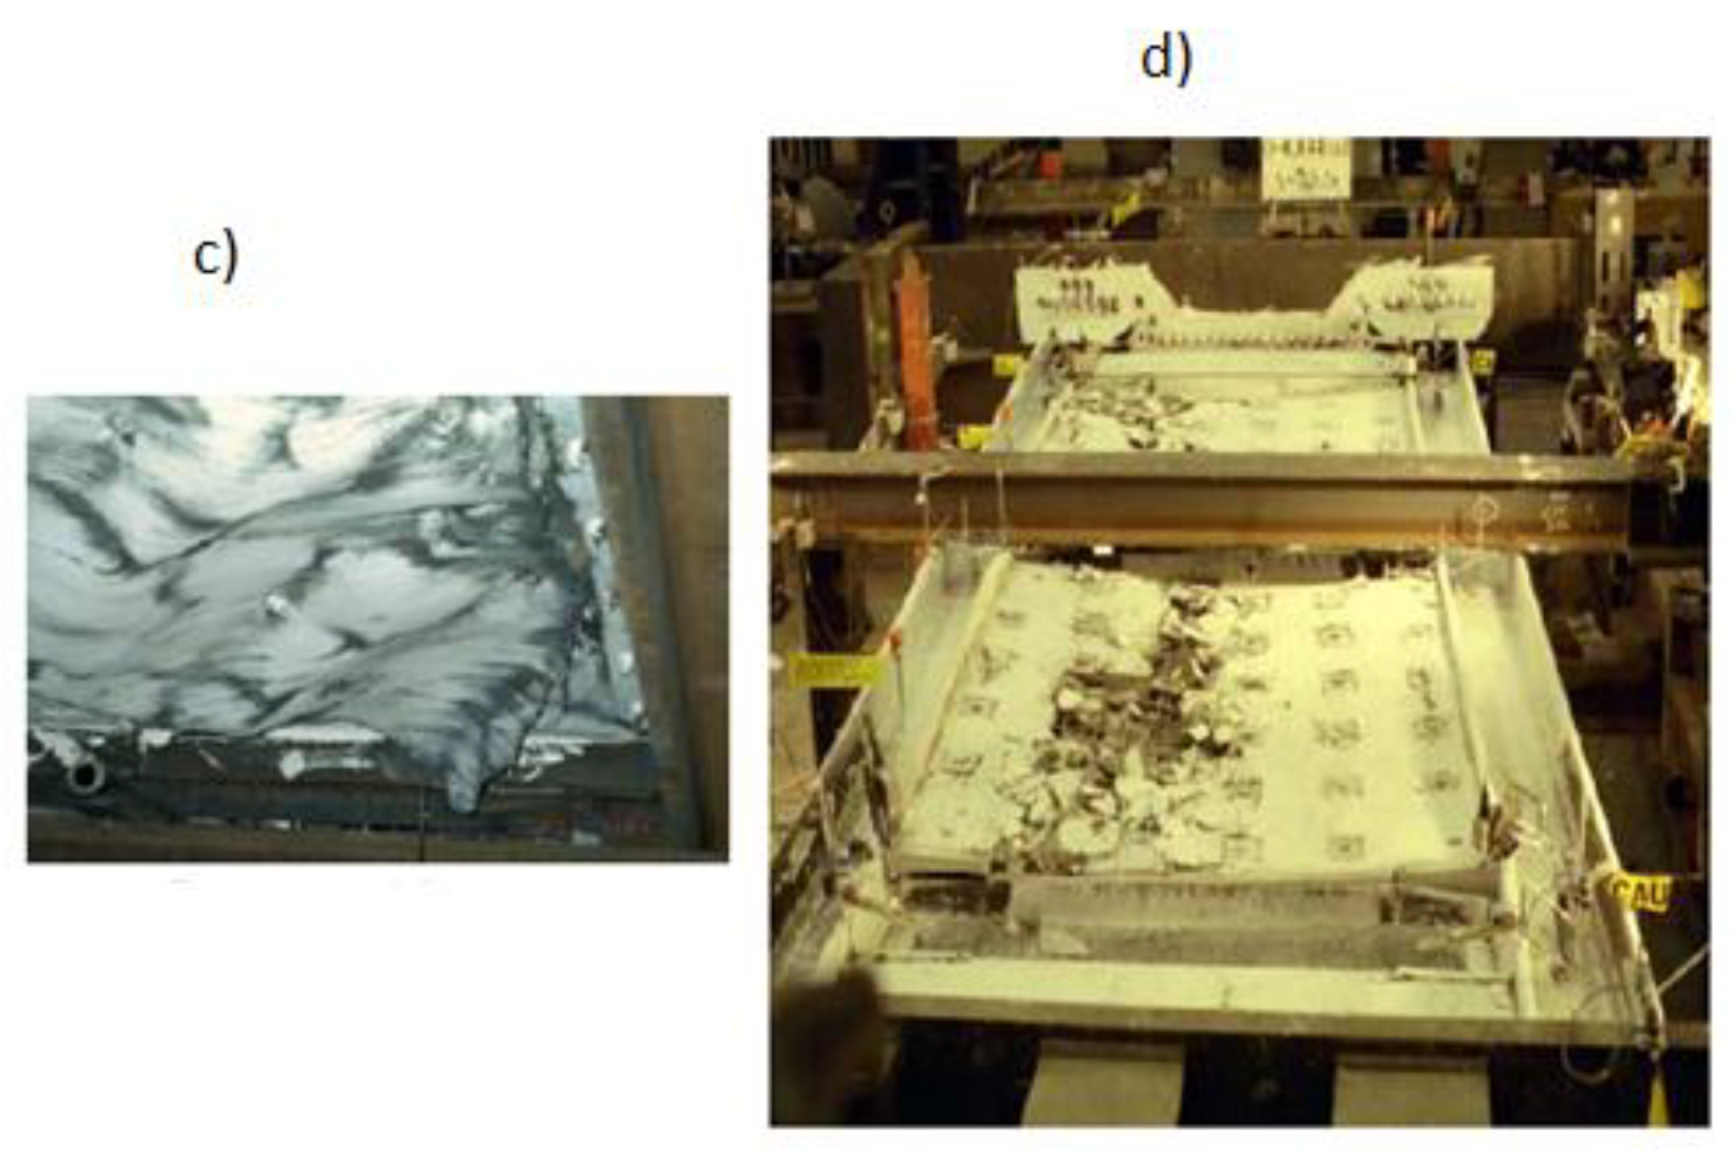
Experimental Study and Modeling with ABAQUS
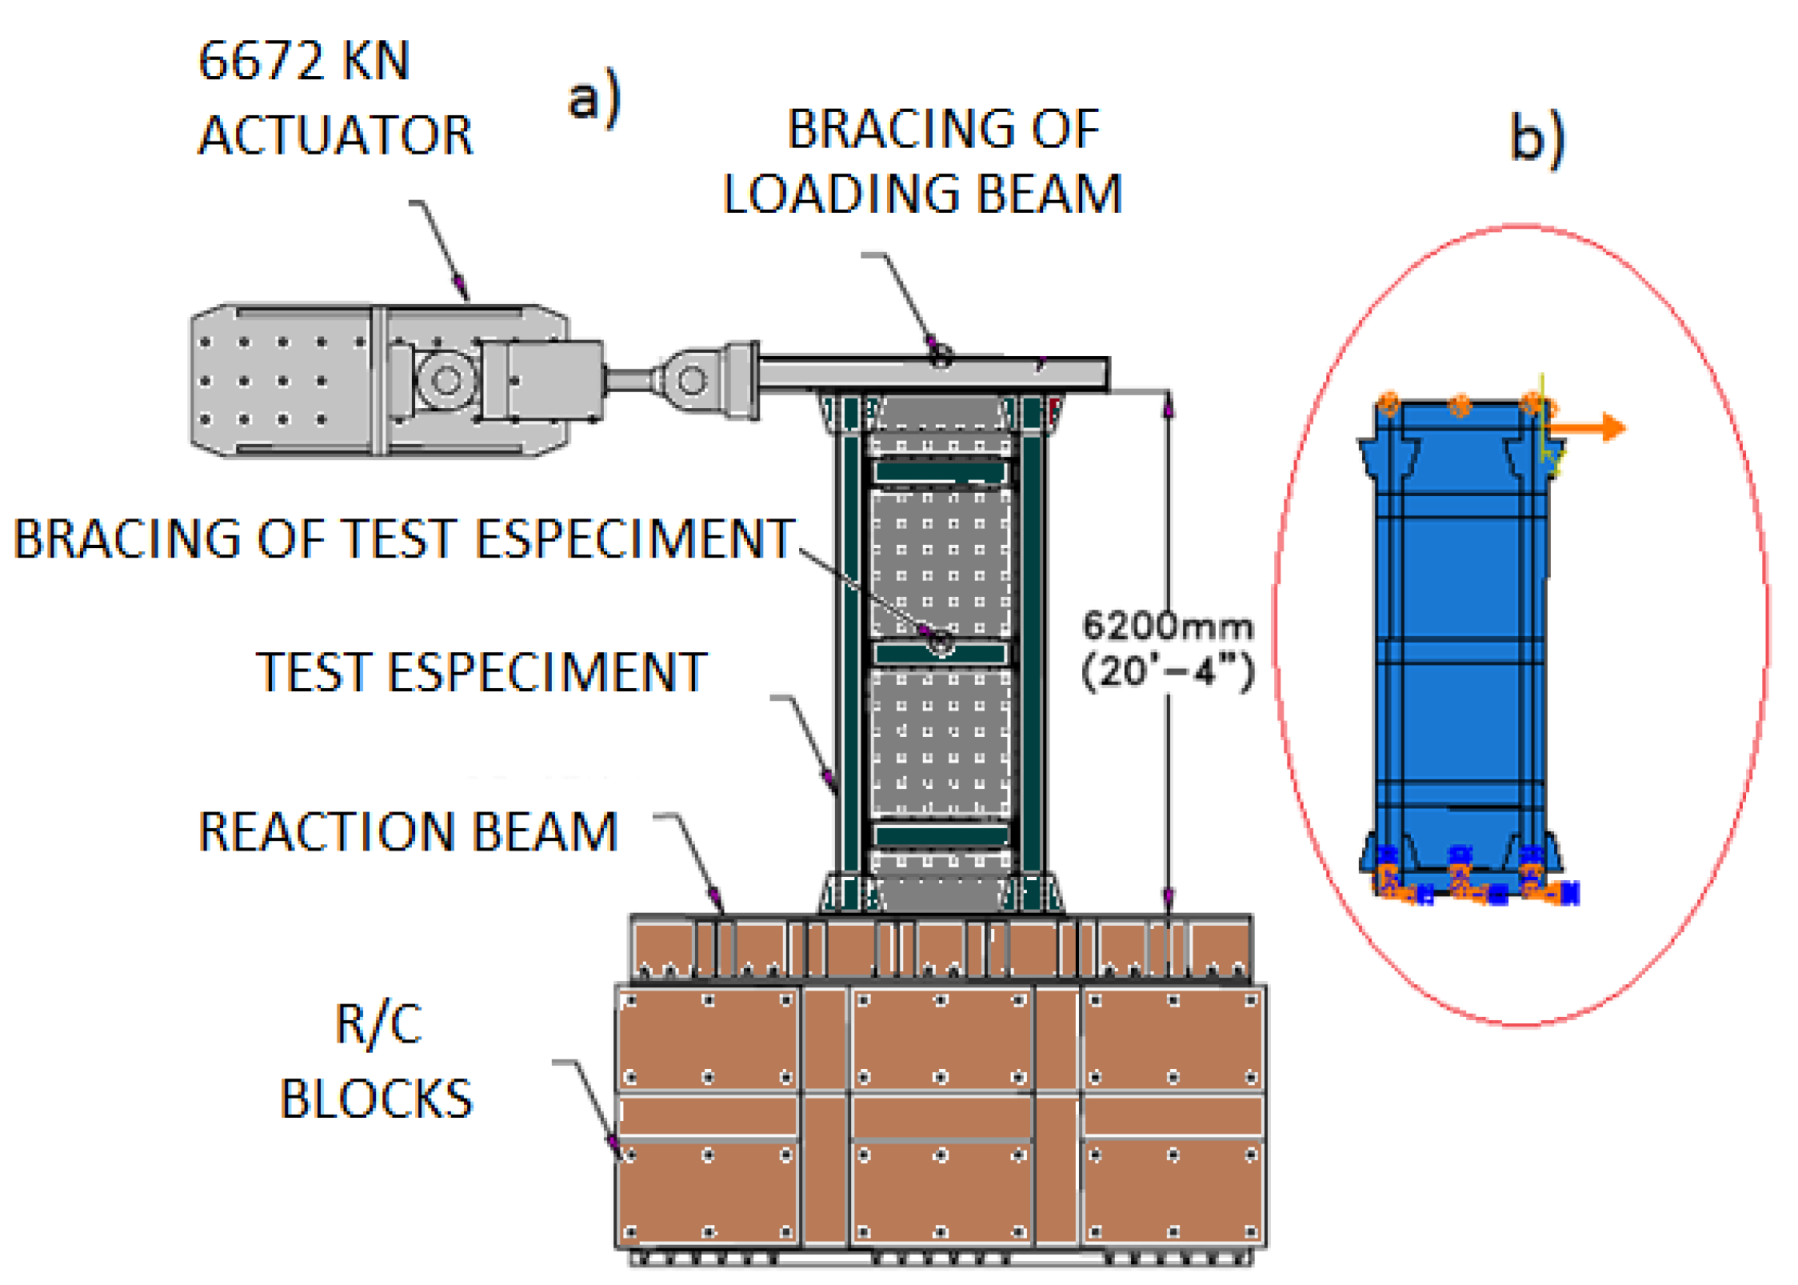
Test Set-Up in Experimental Test
3. Introducing Models and Research Methodology
4. Results
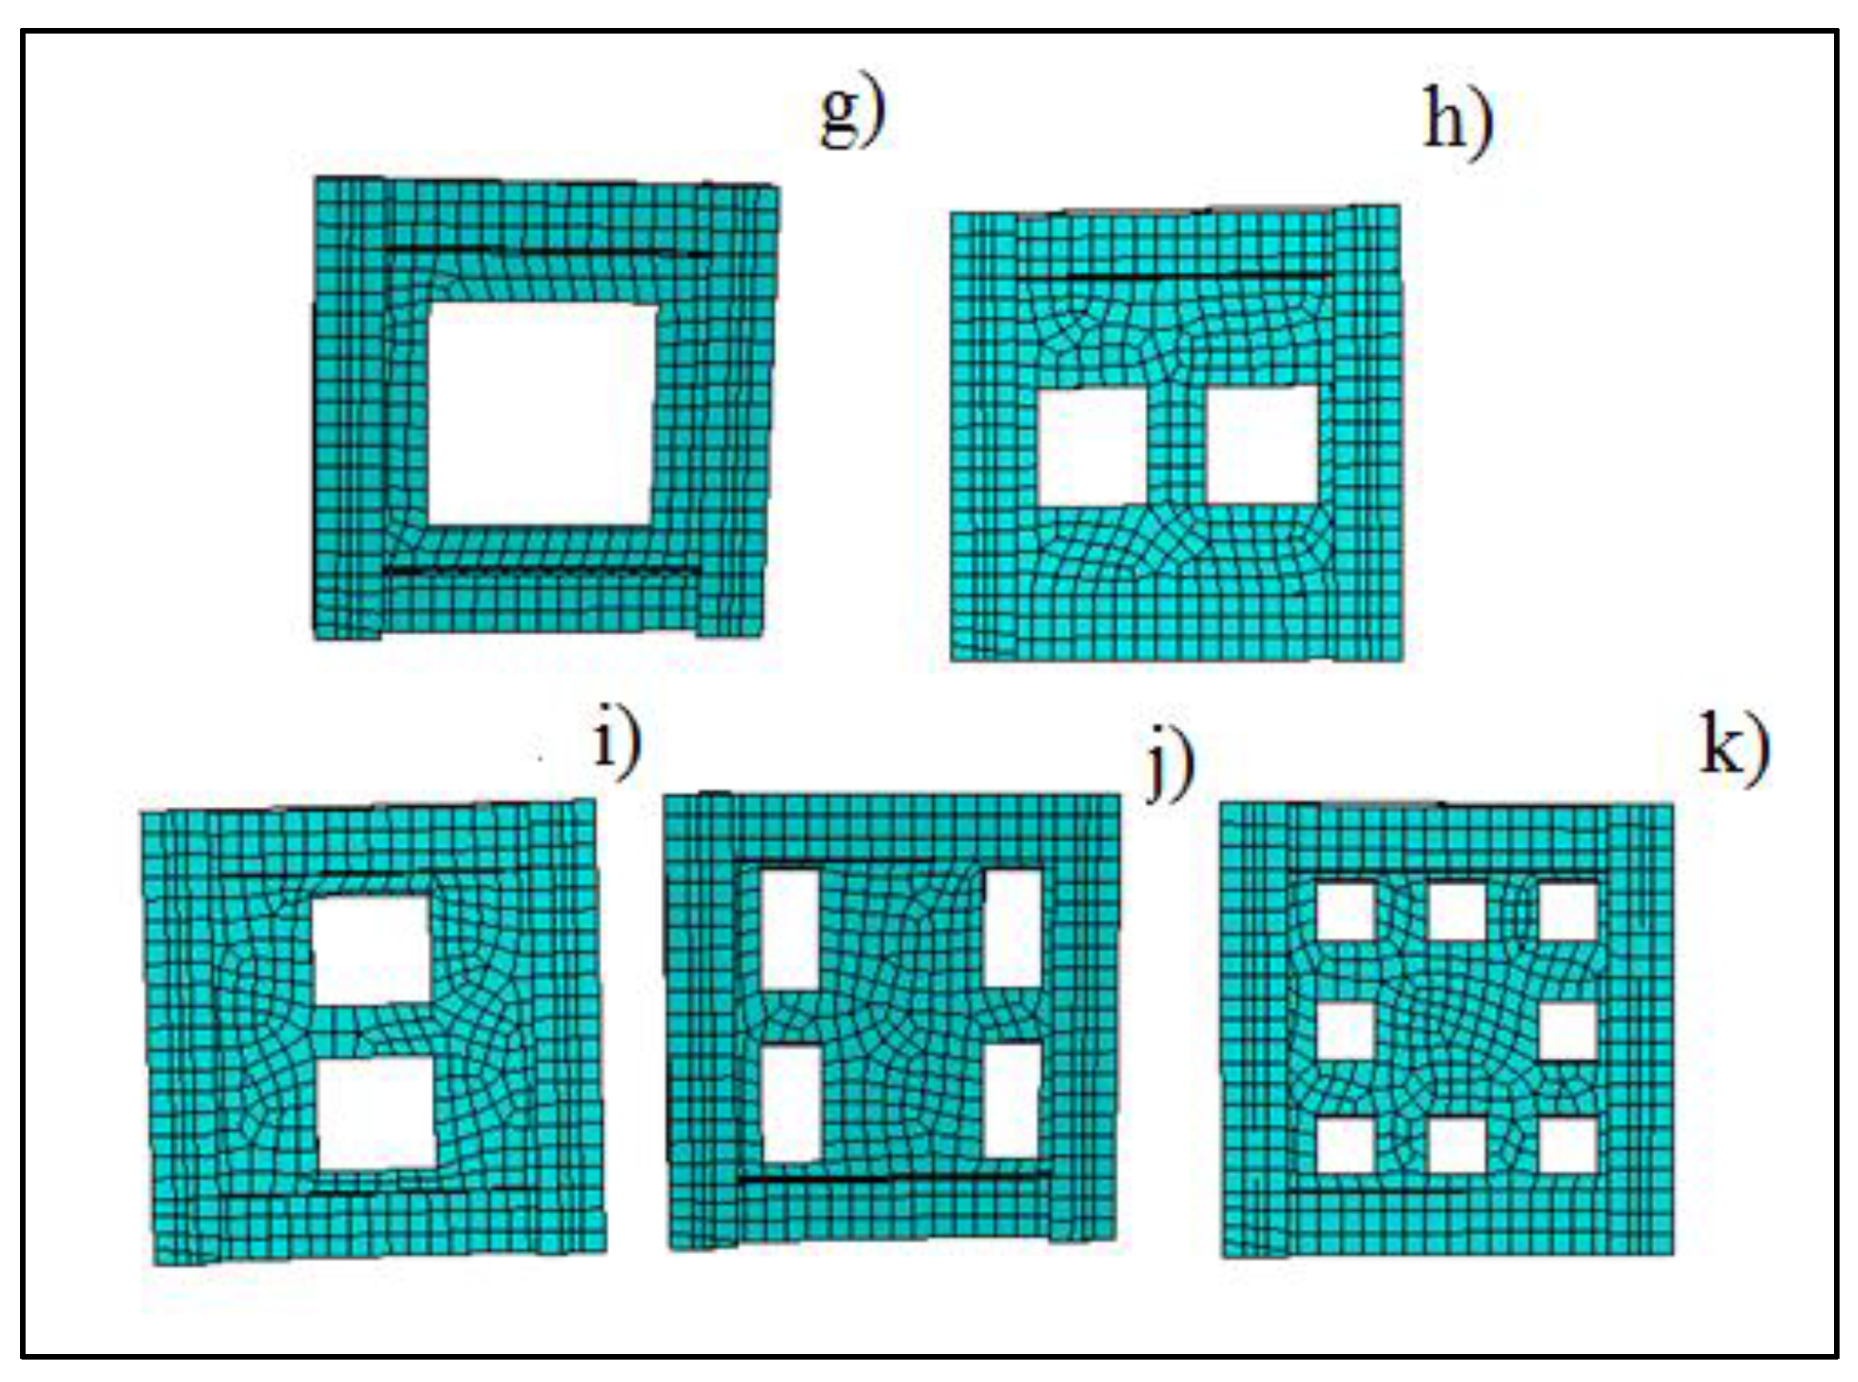
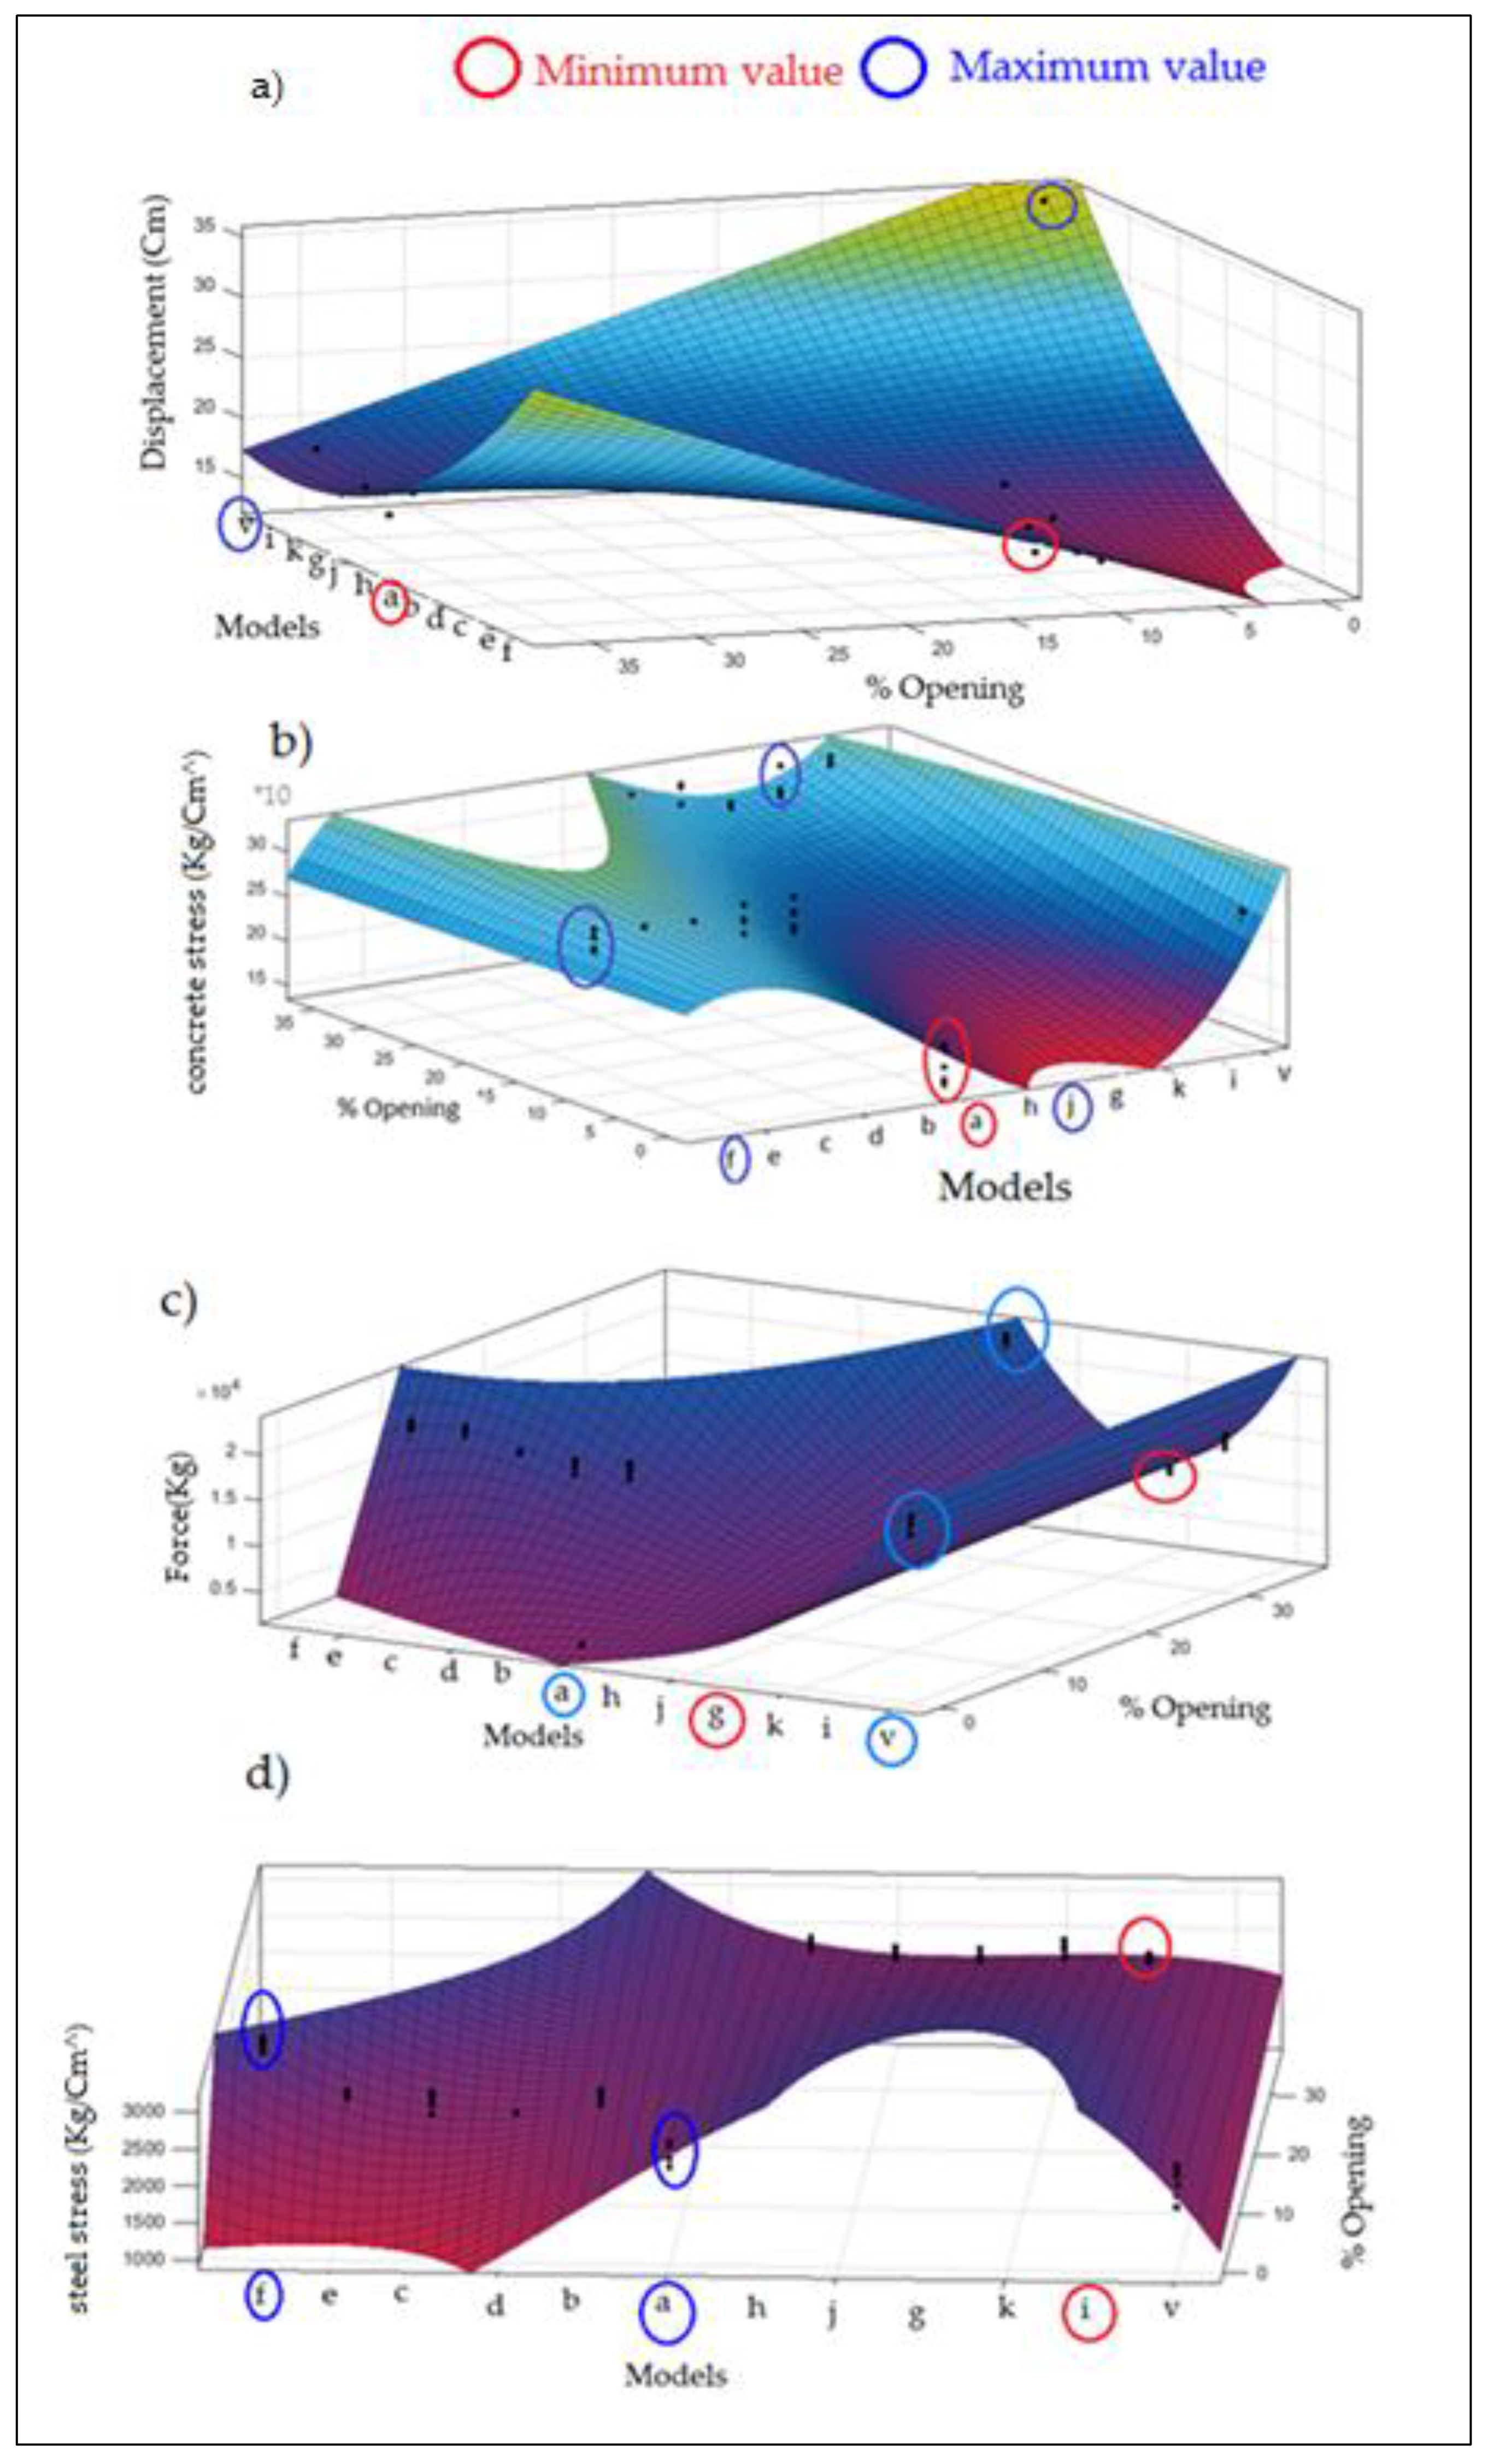
4.1. The Effect of Opening Position and Number of Opening for Model g–k (Group A)
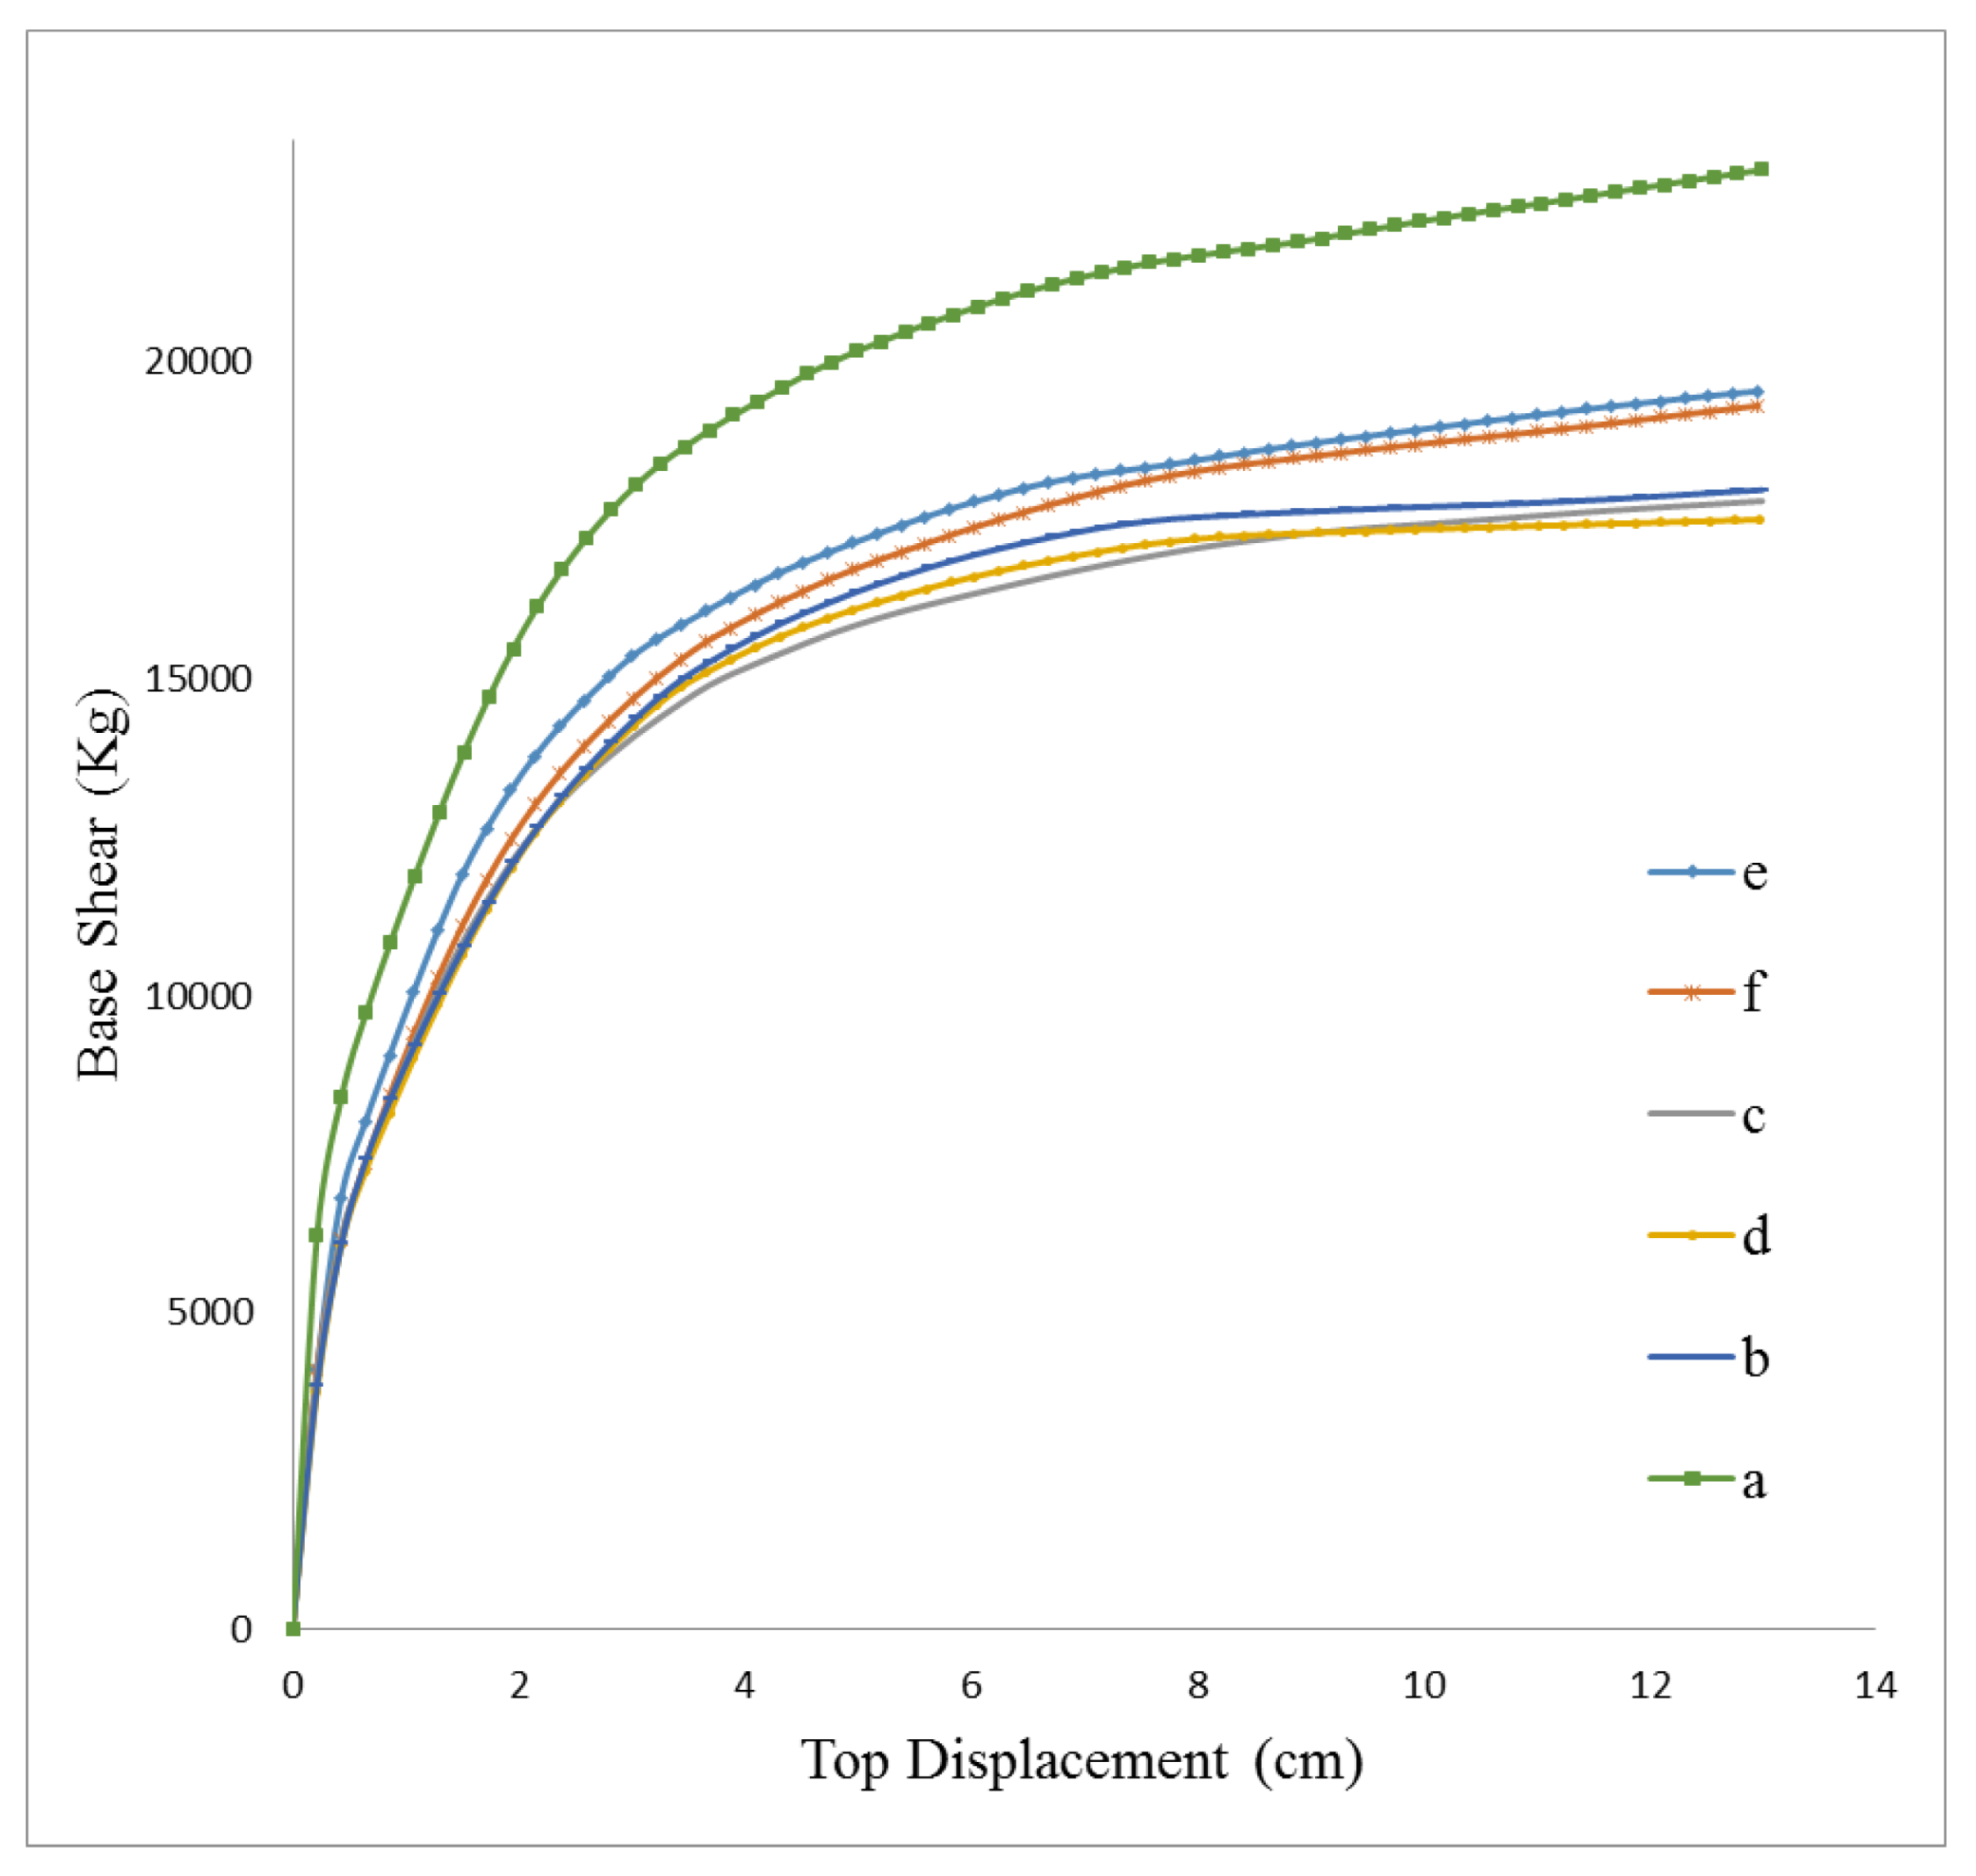
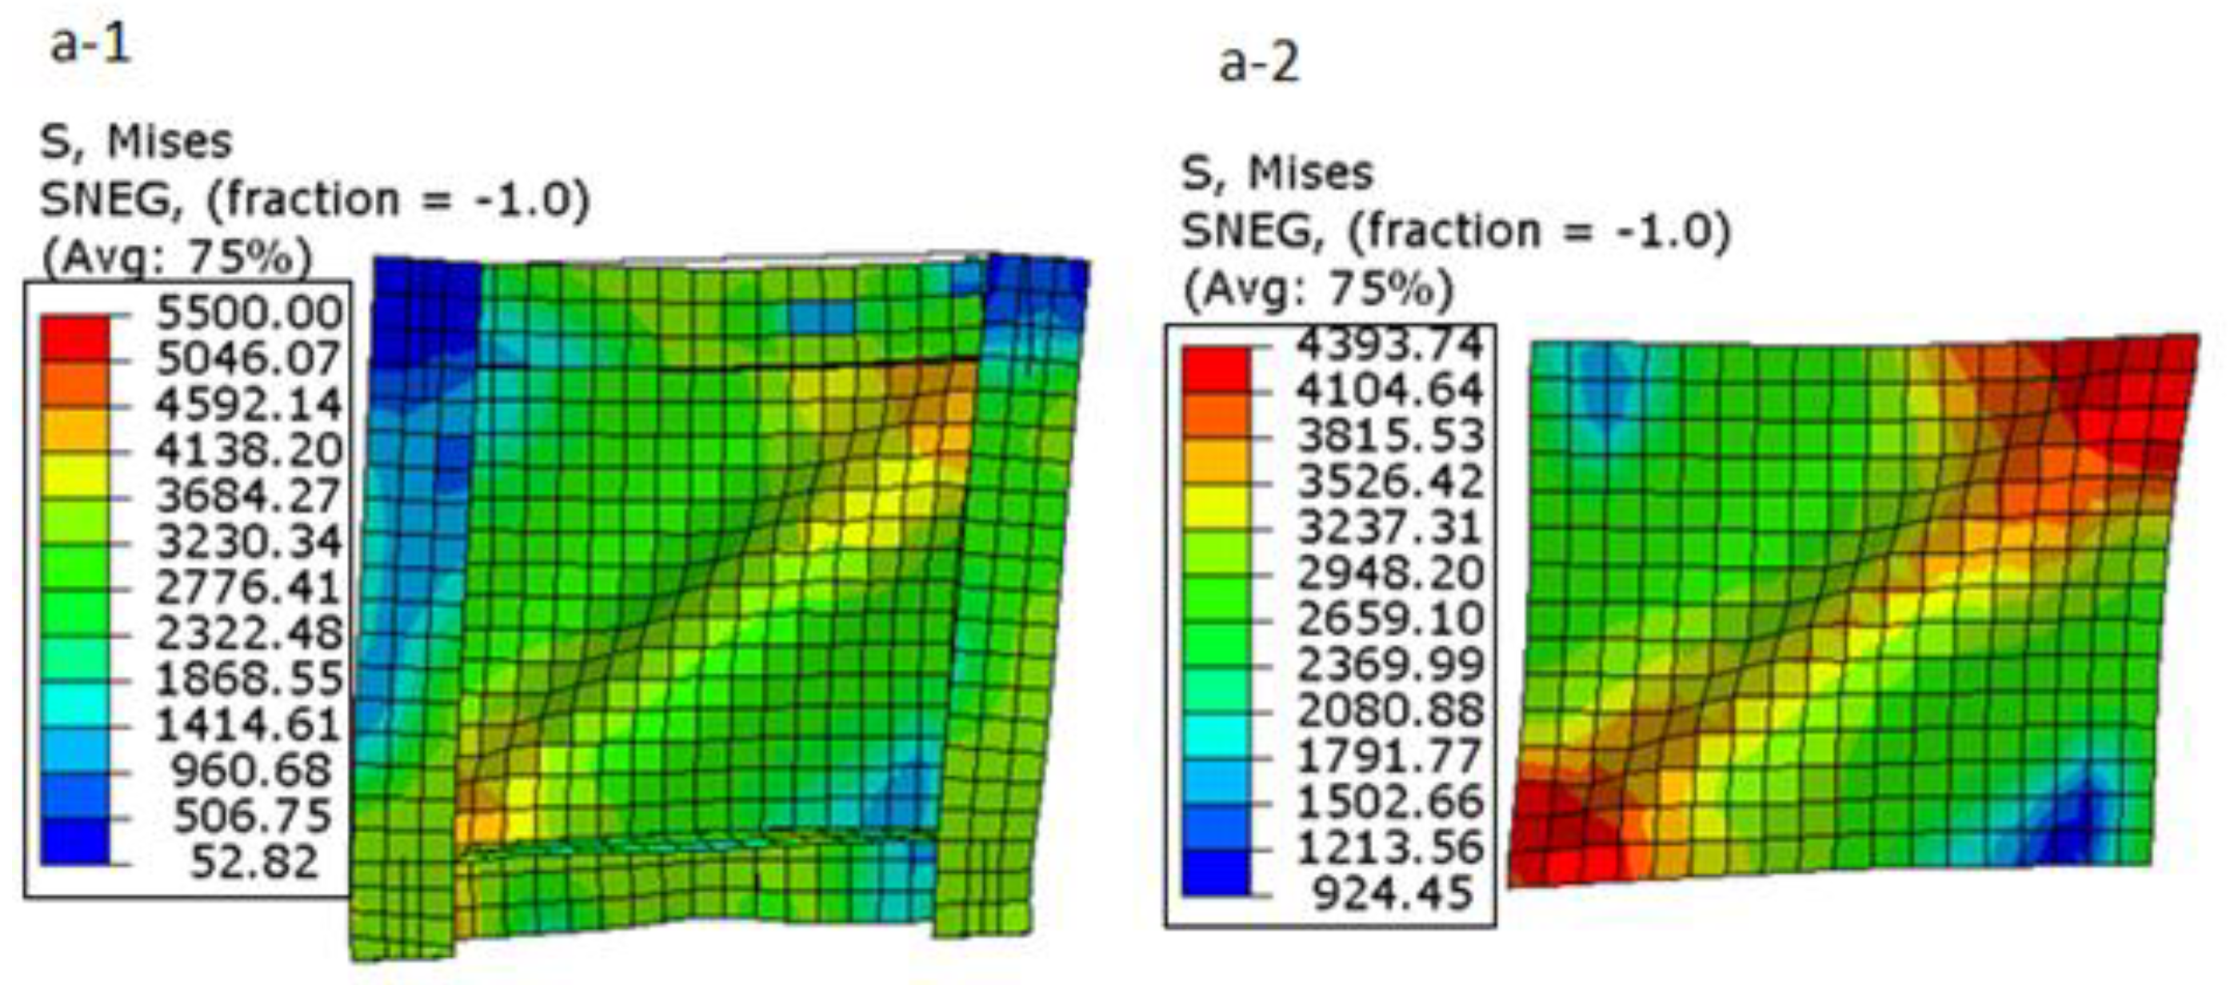
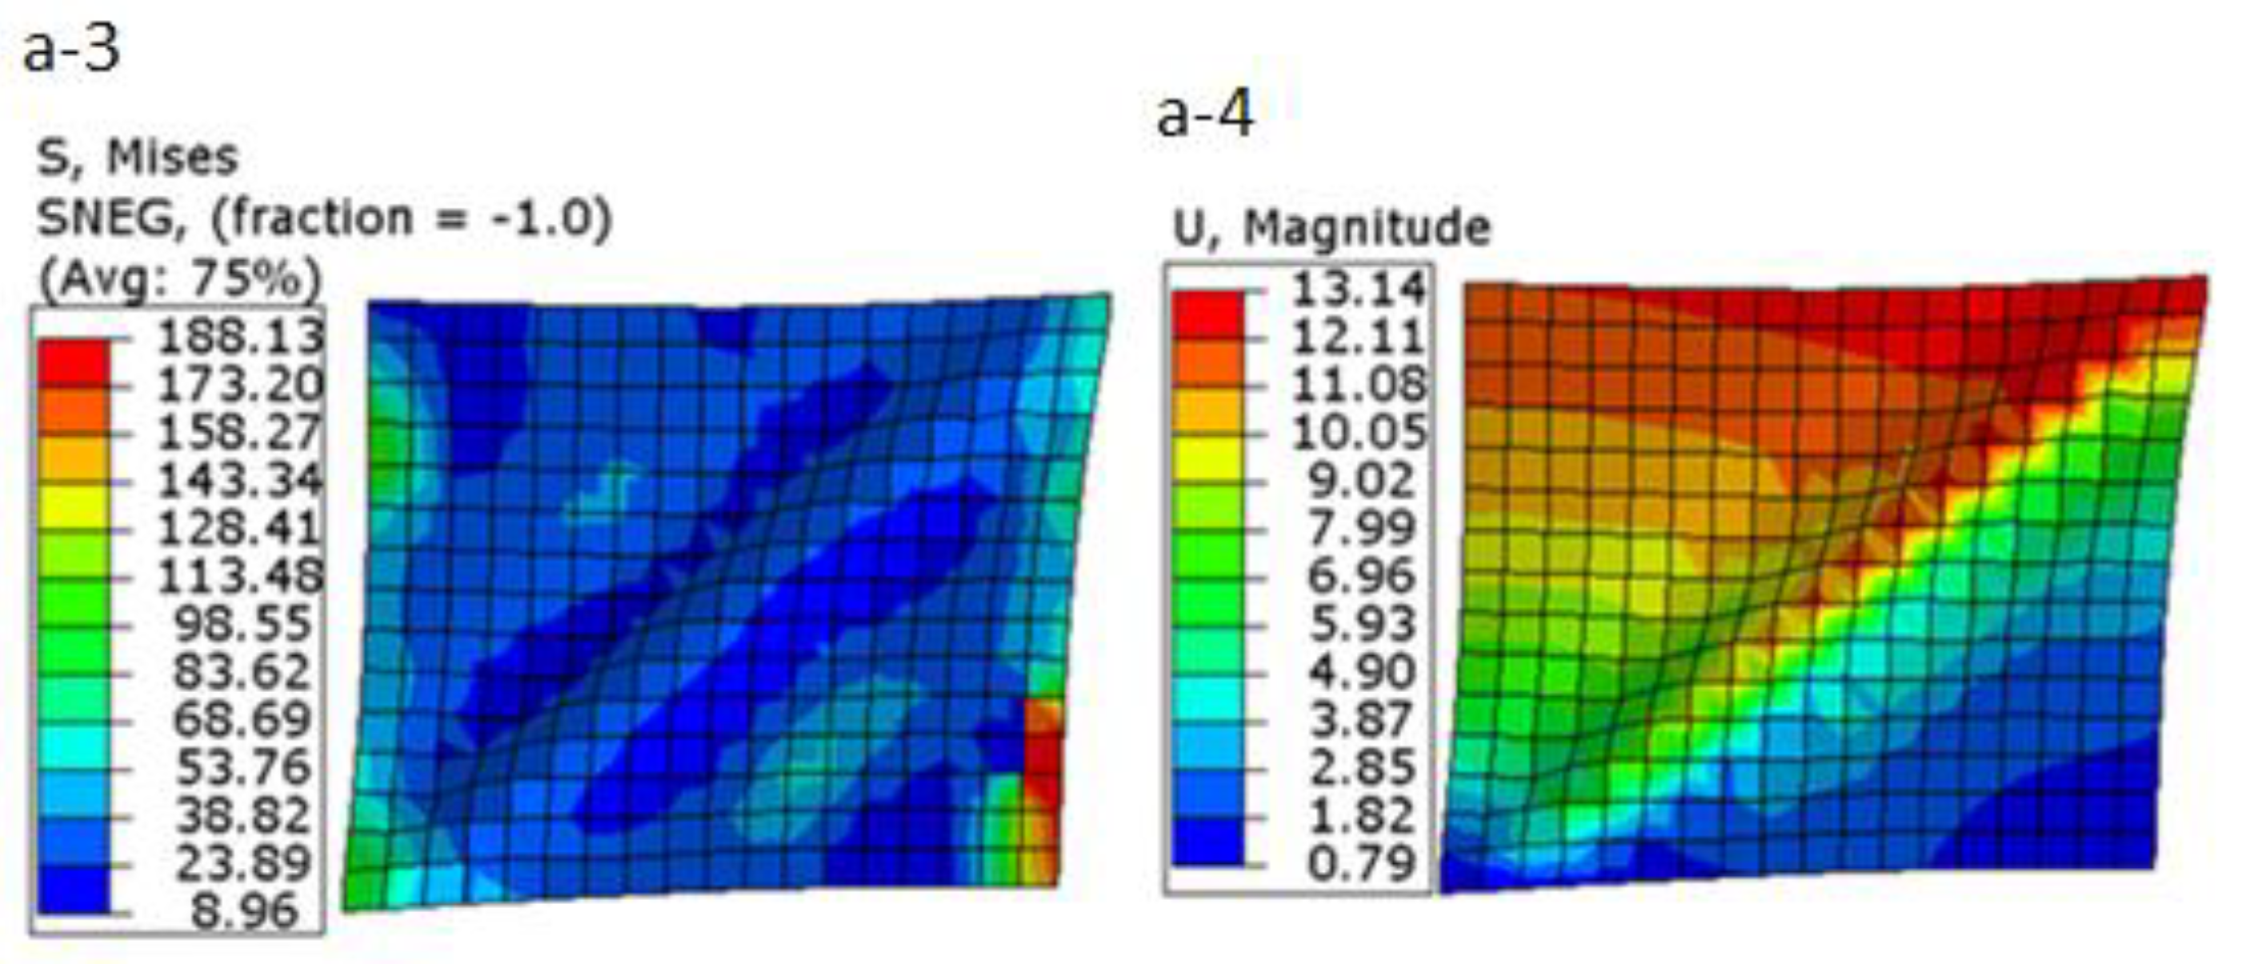
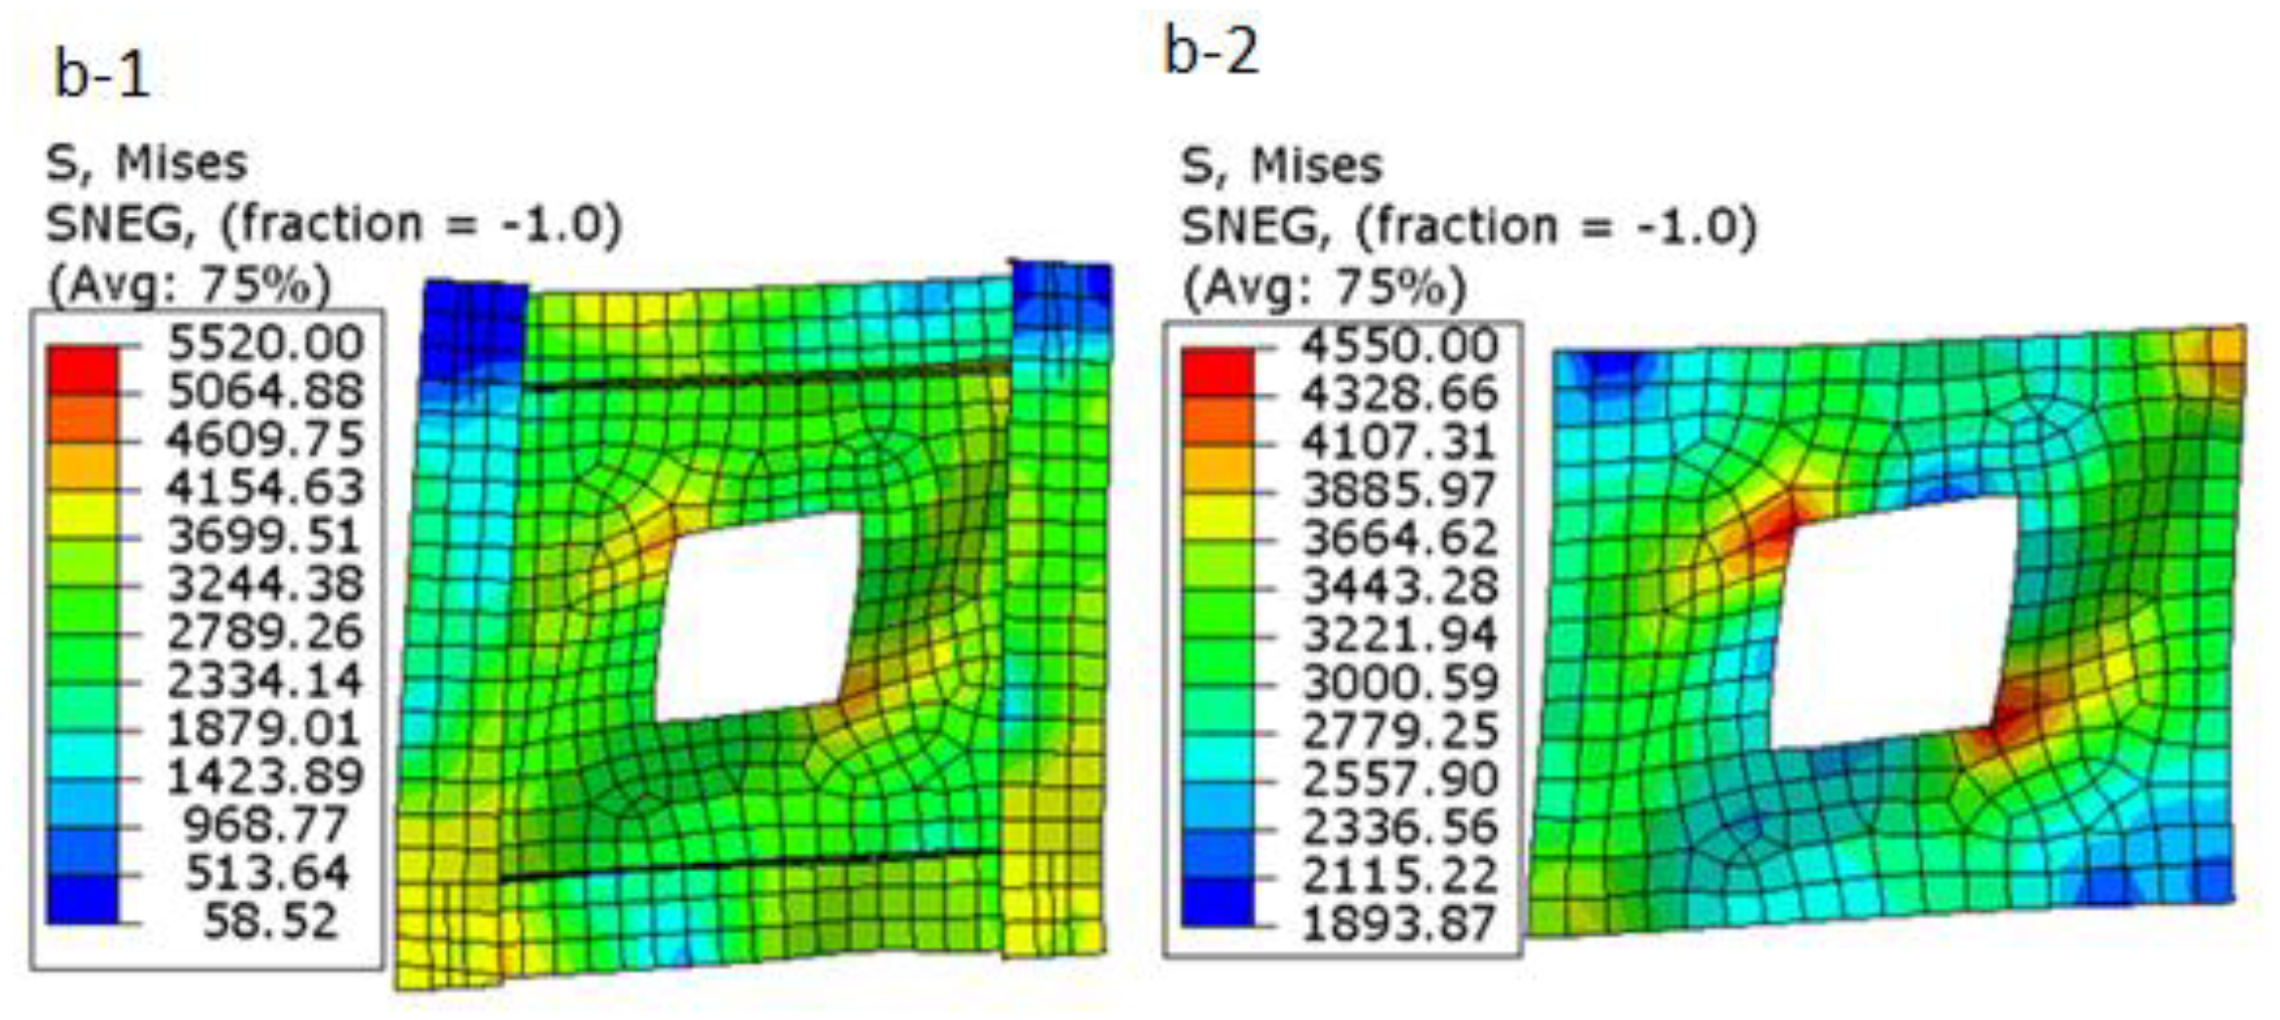
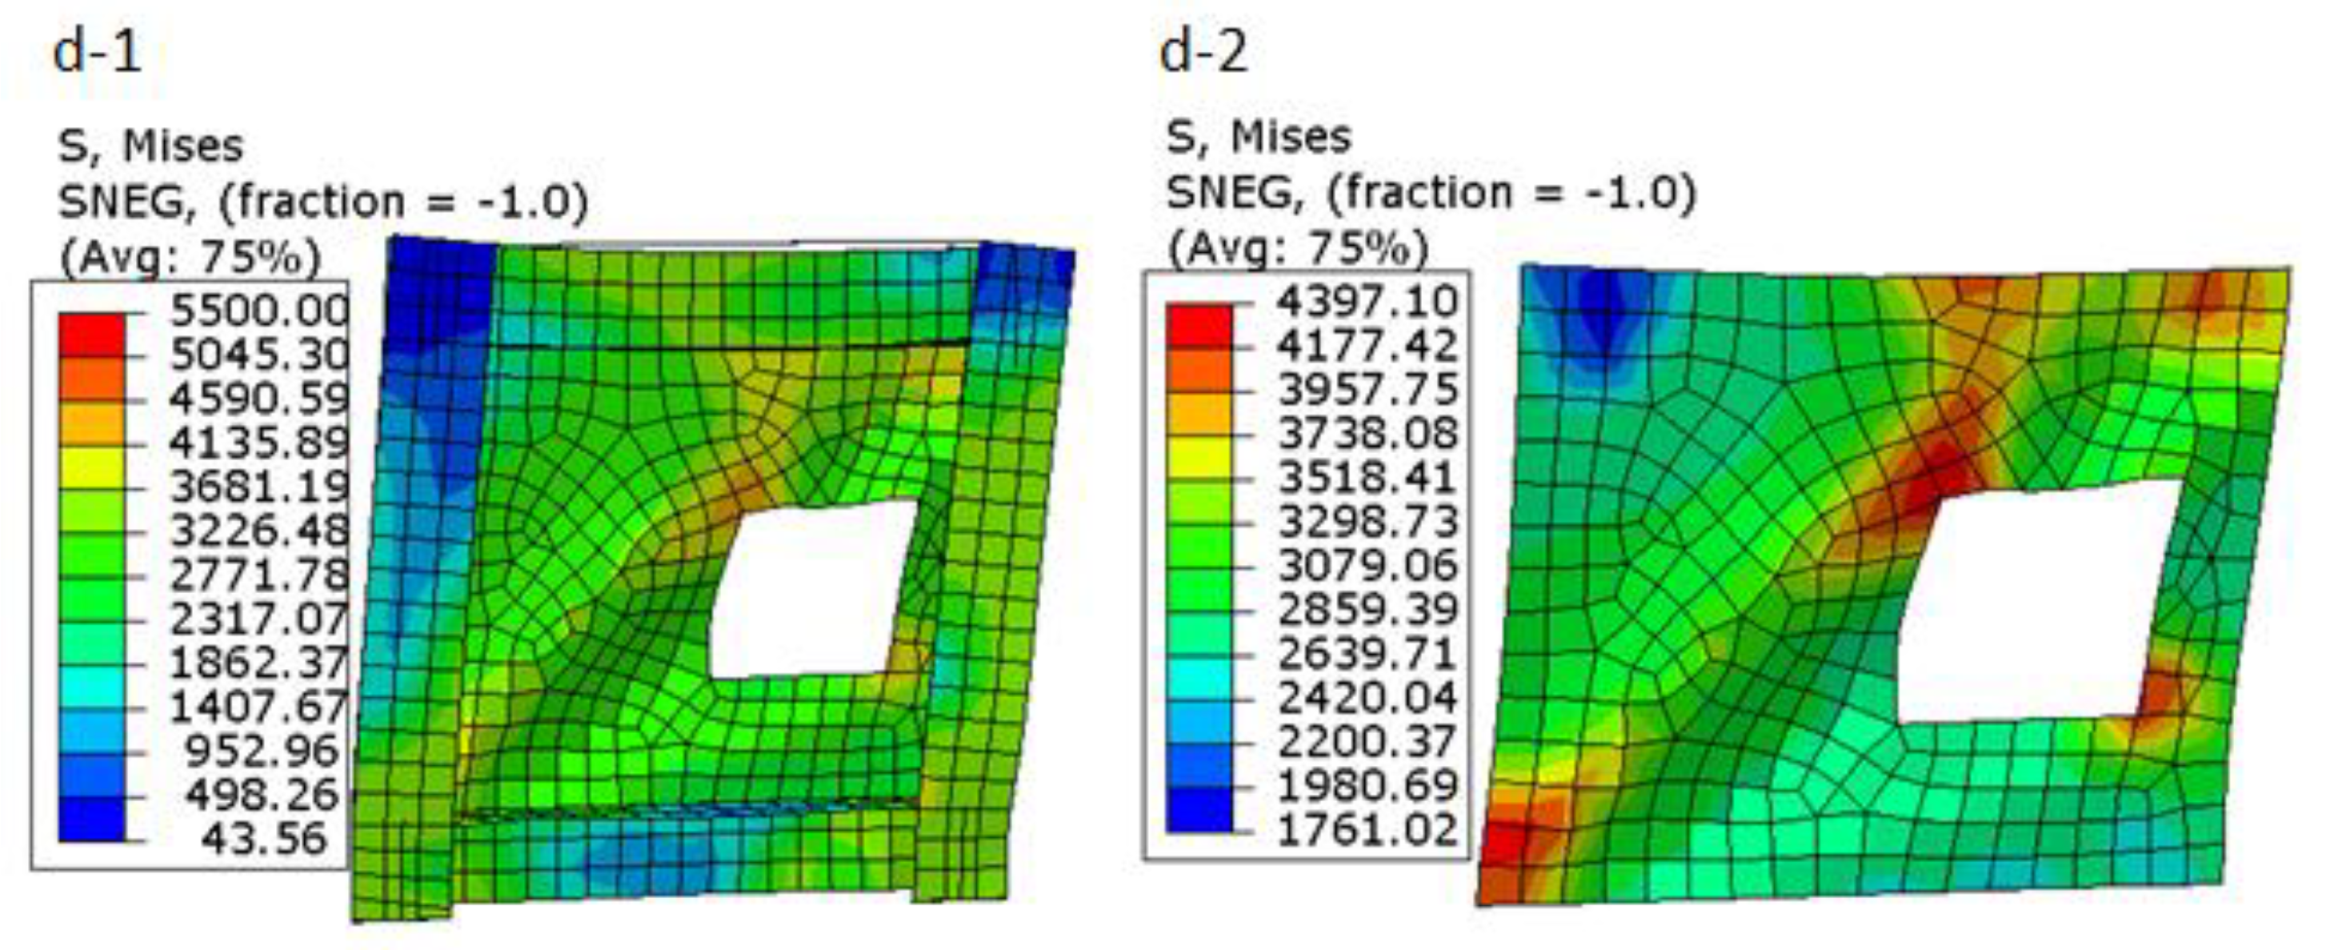
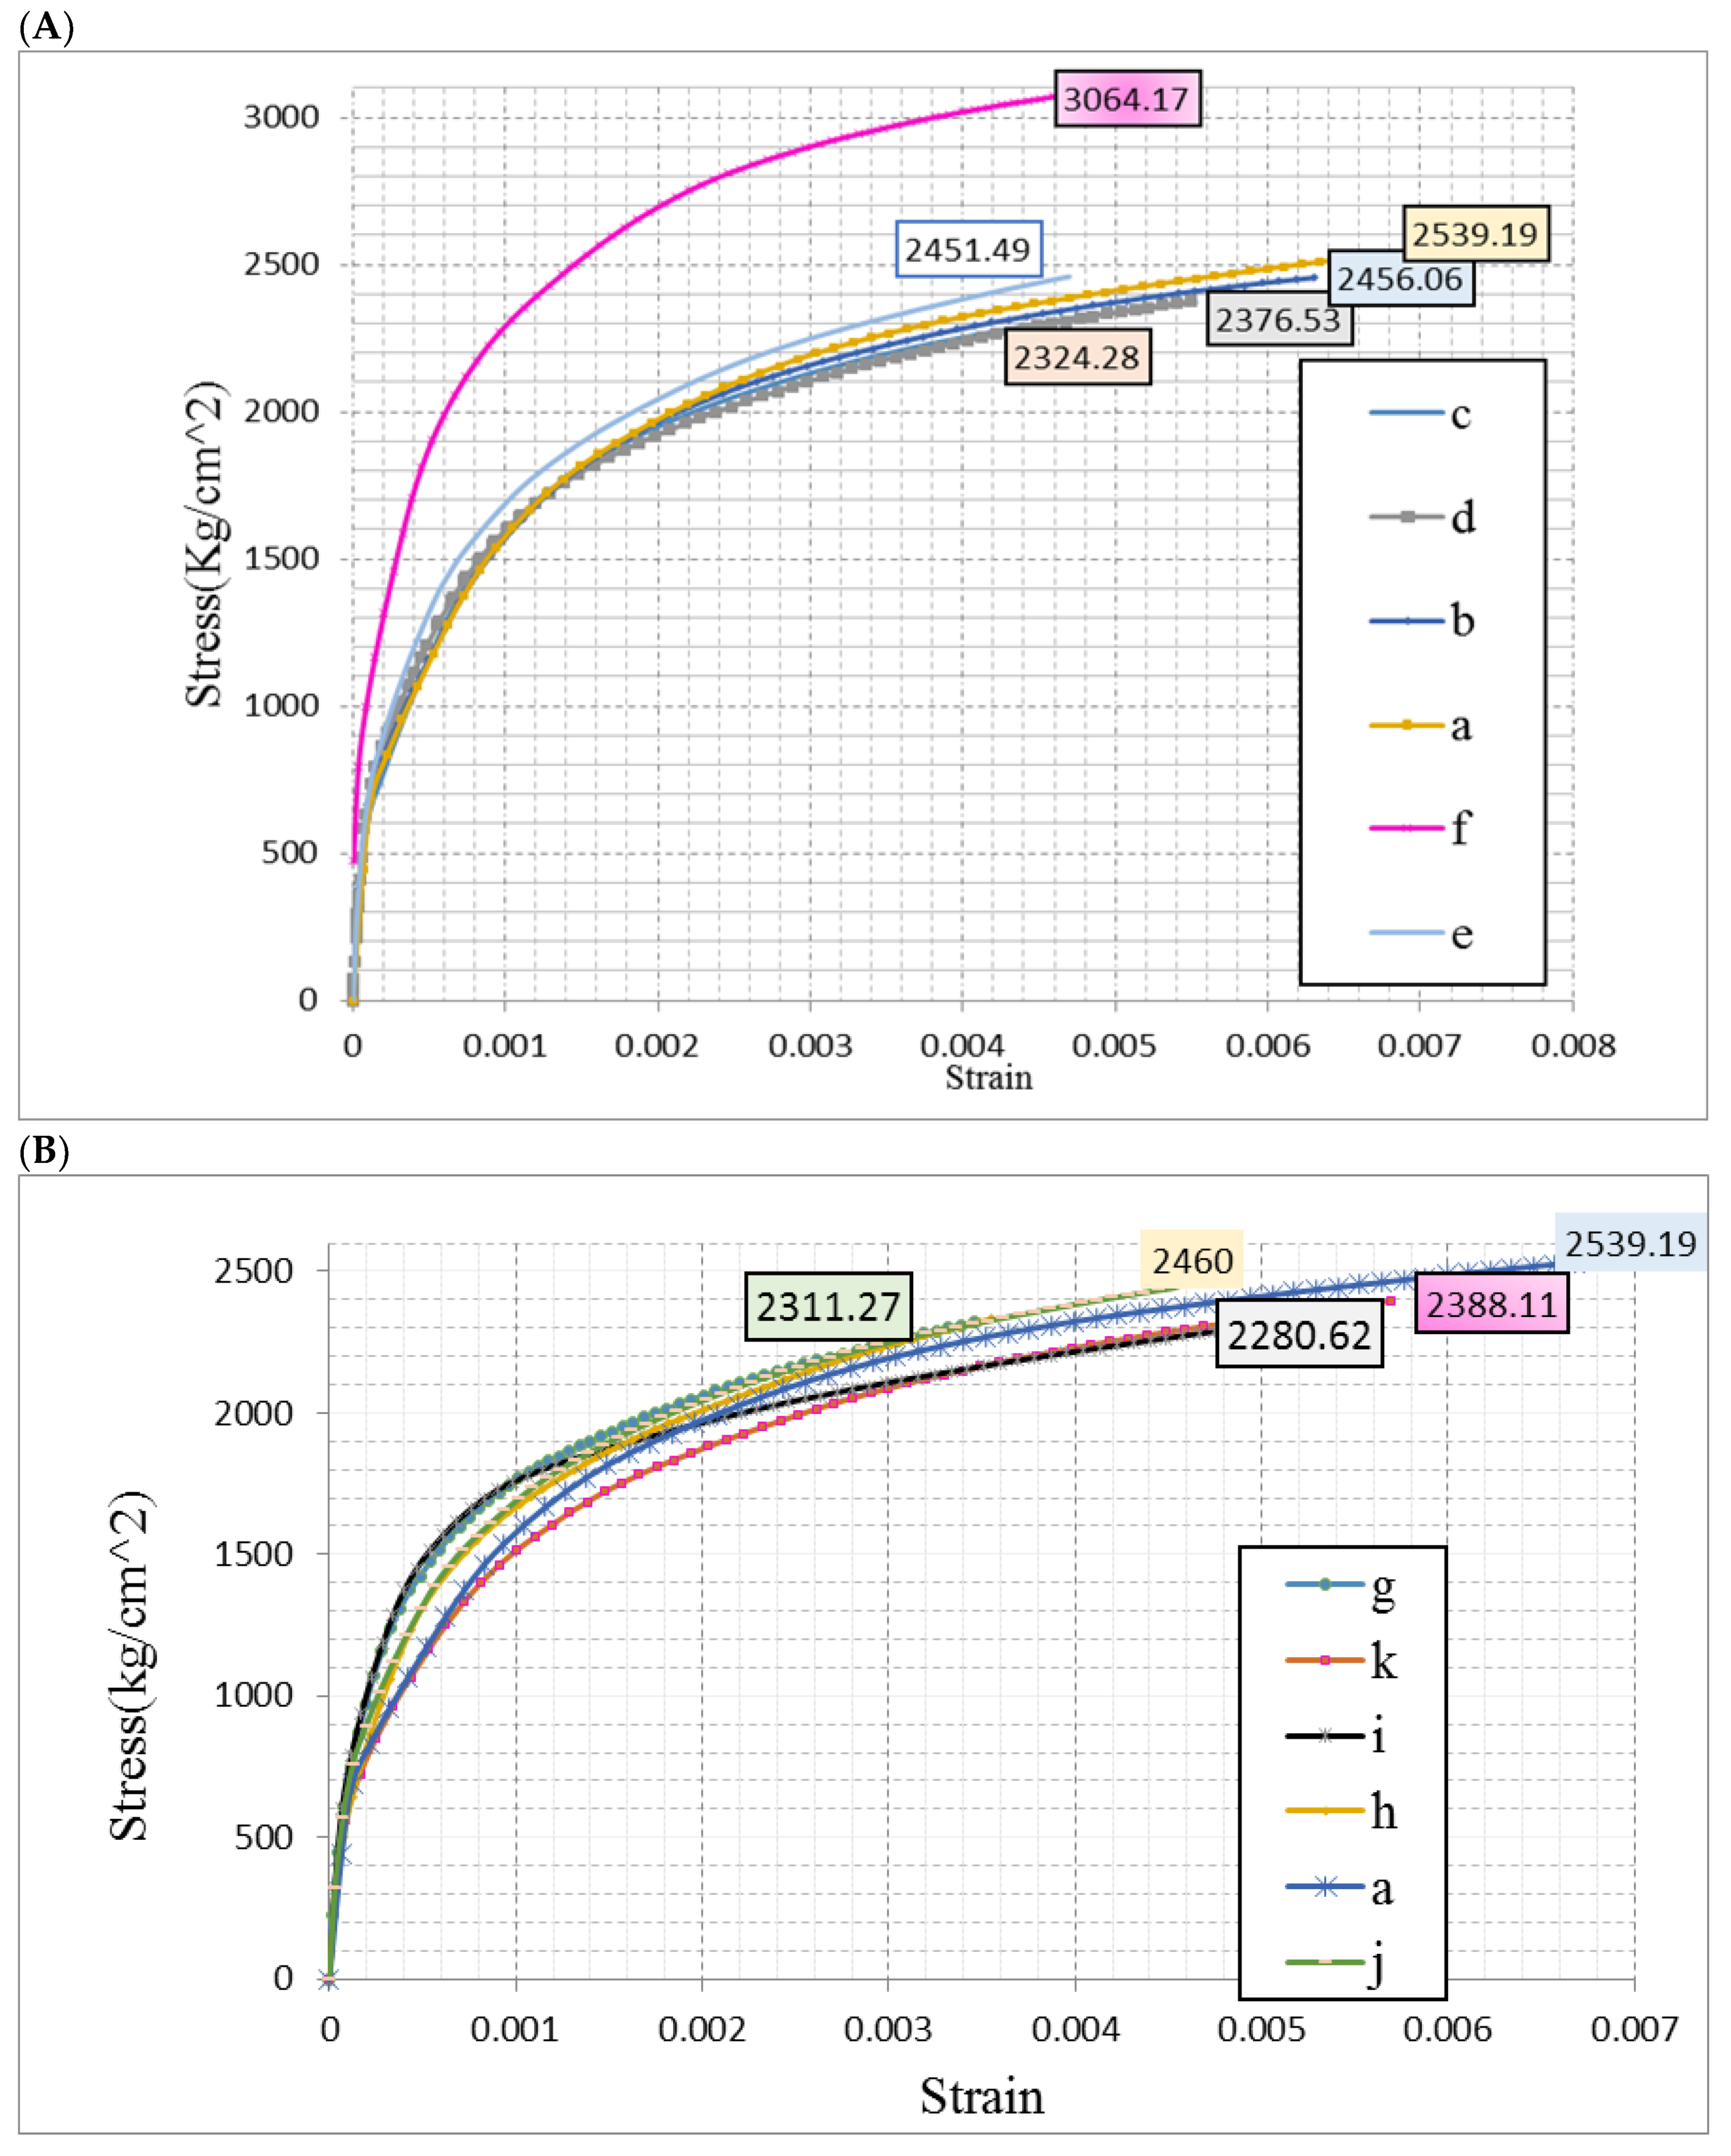
- In all models, some elements in the steel plate shear wall almost reached the near ultimate stress (4550 kg/cm3), however, the number of elements that reached the critical stress is different in different models. Figure 8 and Figure 9 show model a (shear wall without opening) has lower maximum stress and this stress is greater among elements; however, creating an opening increases stress and displacement in the concrete and steel plate. Moreover, the shear wall stiffness and stress uniformity decrease in all models with opening, especially for models with an opening near a column or beam.
- Compared to the two other specimens, maximum displacement in specimen with an opening near the column was lower than the others, while the stiffness of wall decreases as compared to other models (model b and model c).
- In all the models, the elements located near the opening along the diagonal of the shear wall reached the ultimate strength and these elements have more displacement.
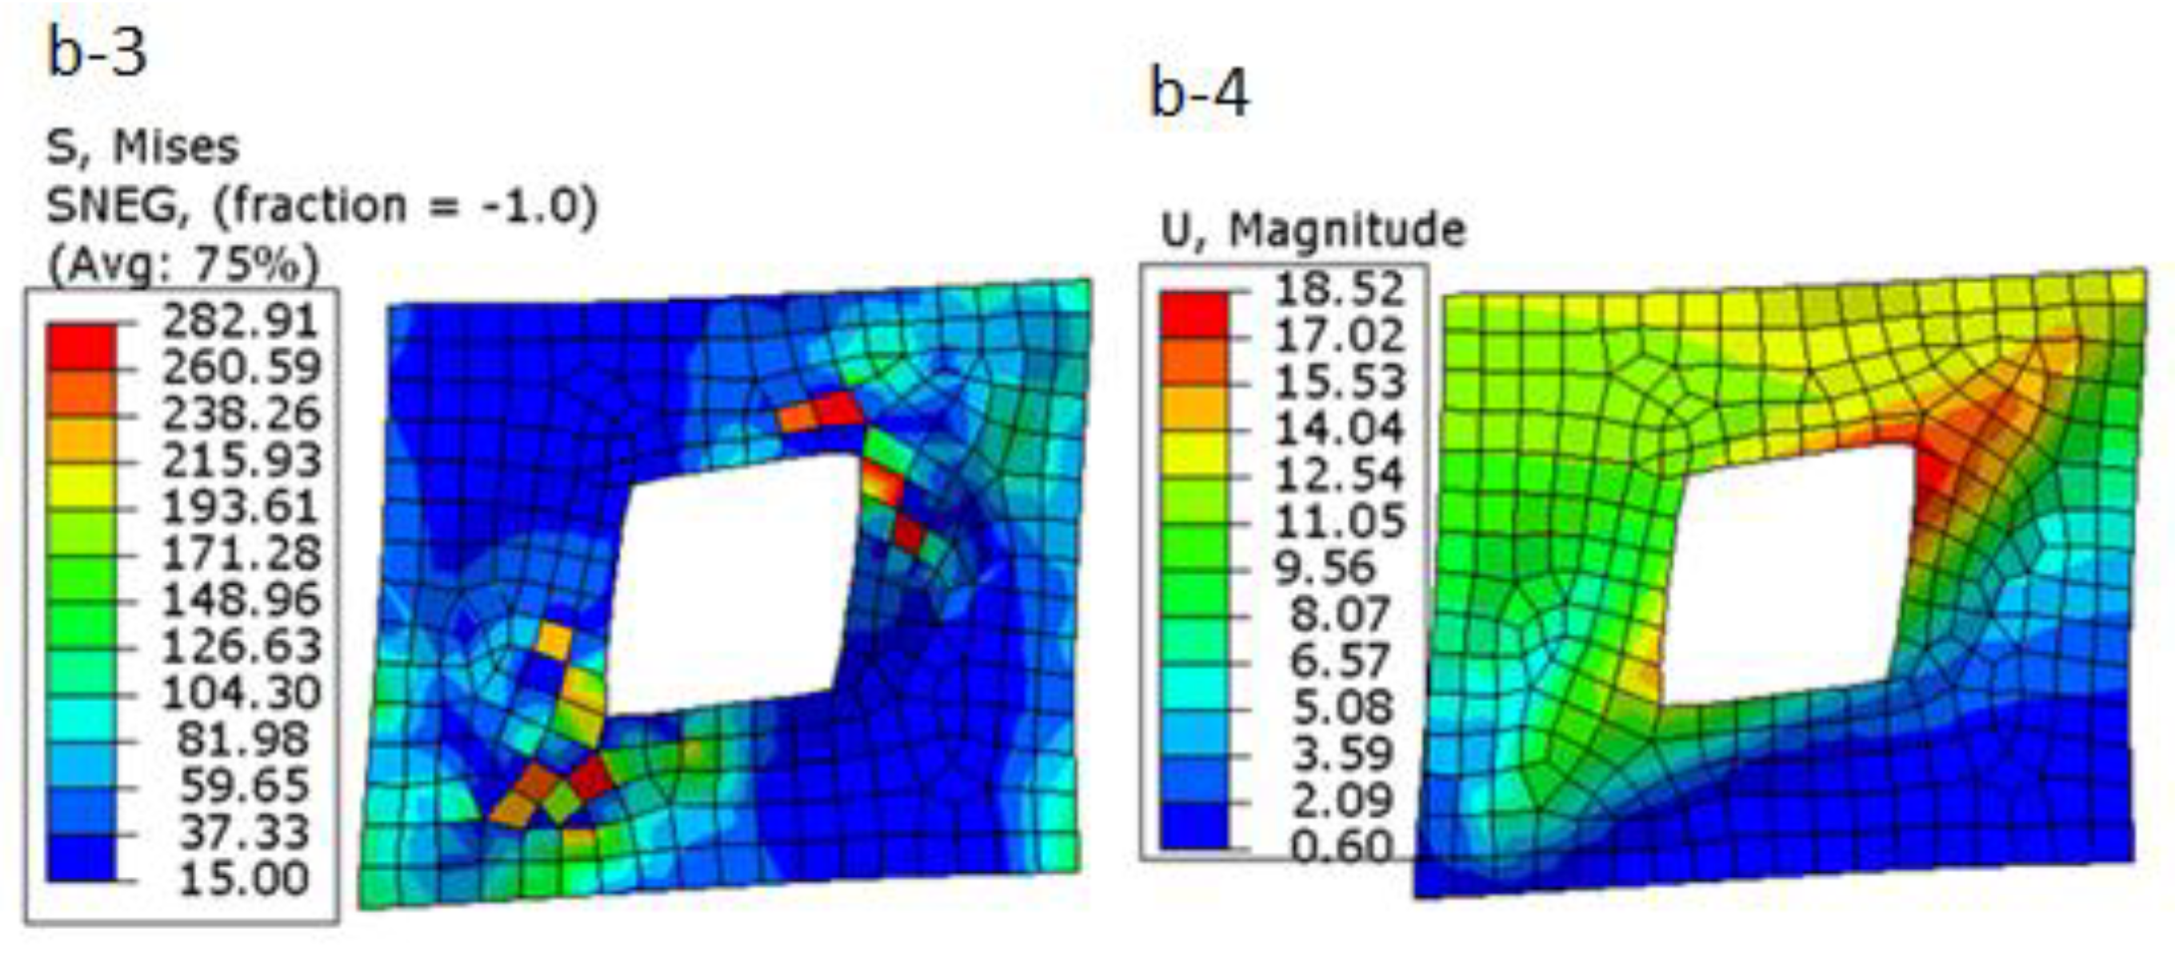
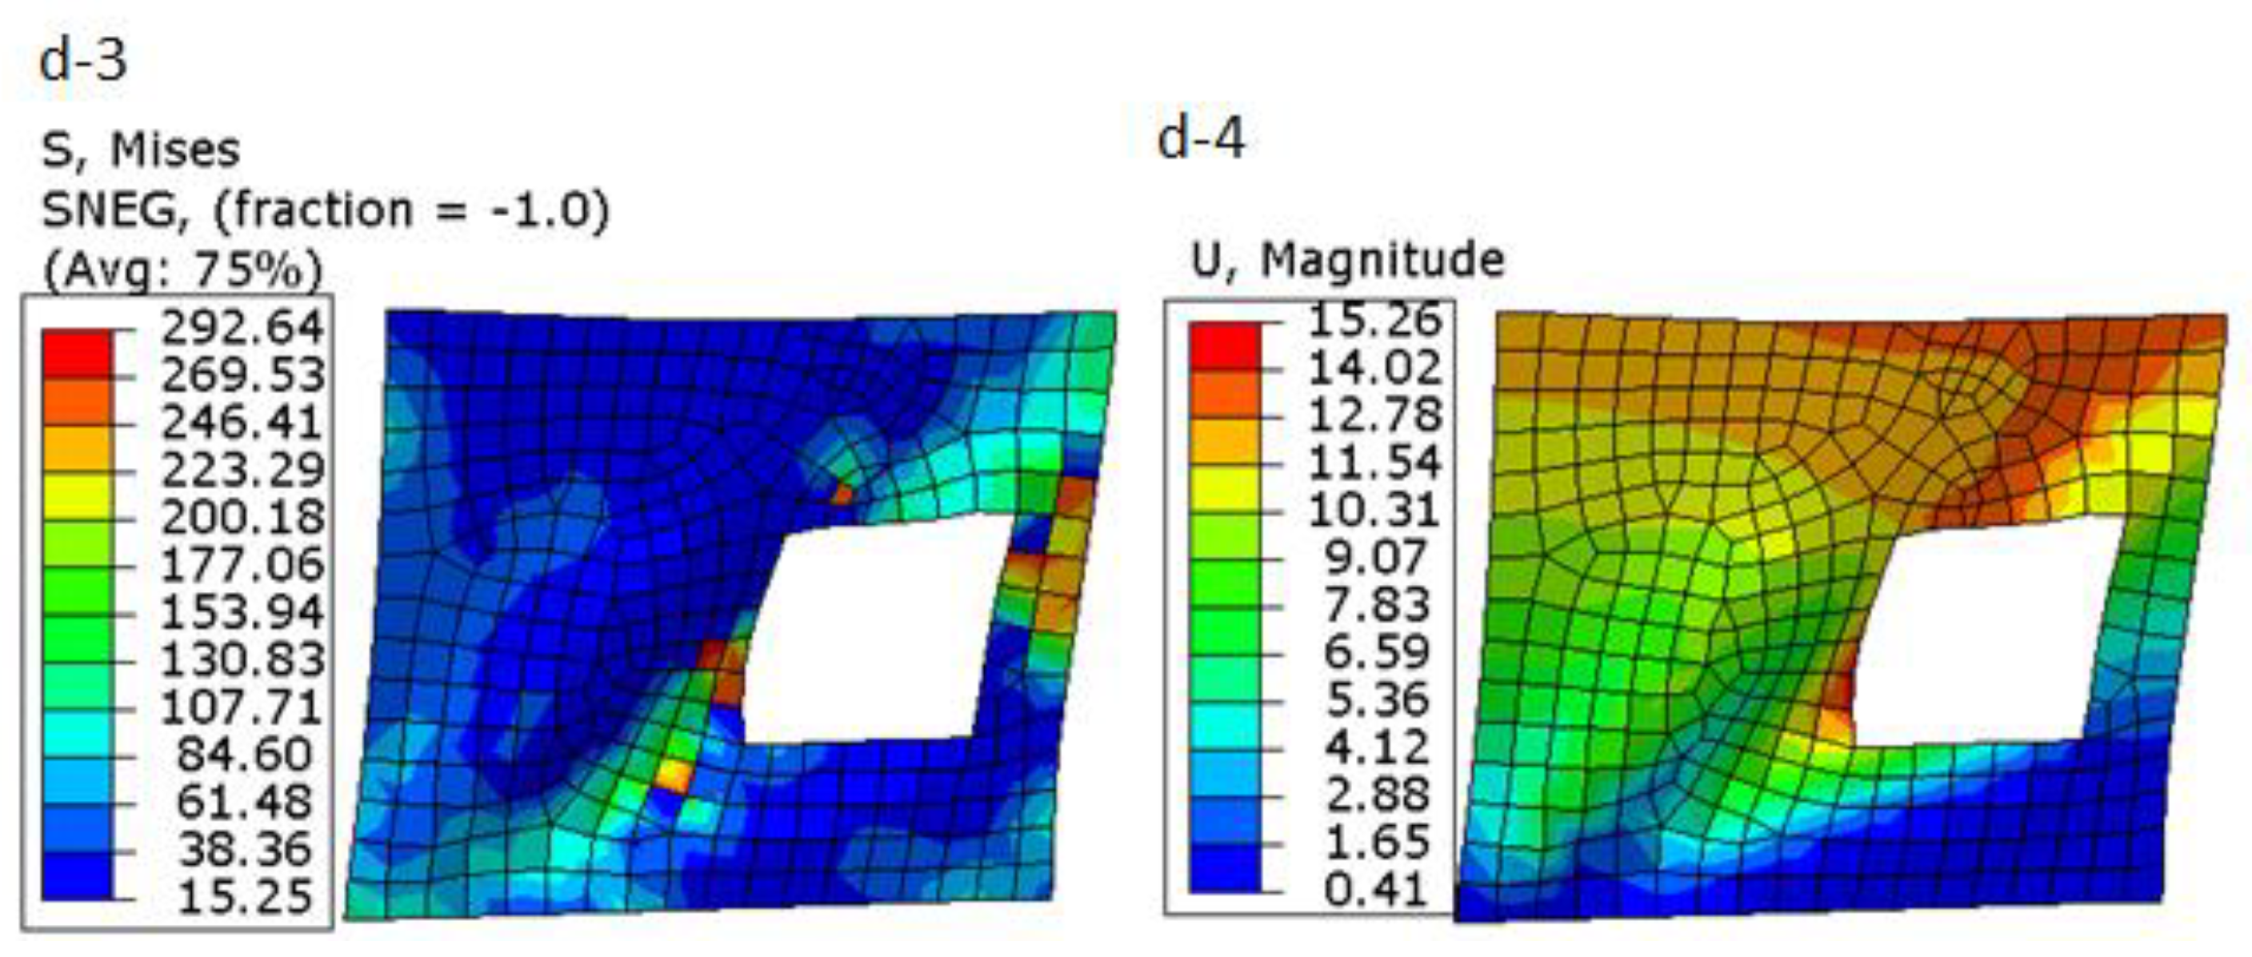
- In total, the performance of models (c) and (d) is similar to each other, but the number of elements reaching the ultimate stress in model (c) is higher than in model (b), so model (b) has the worst performance among all models in this group due to maximum displacement. Moreover, the number of elements reaching the ultimate stress are higher than others. In the following, Figure 9, Figure 10, Figure 11, Figure 12, Figure 13, Figure 14 and Figure 15 show the stress and displacement for models 4 to 6.
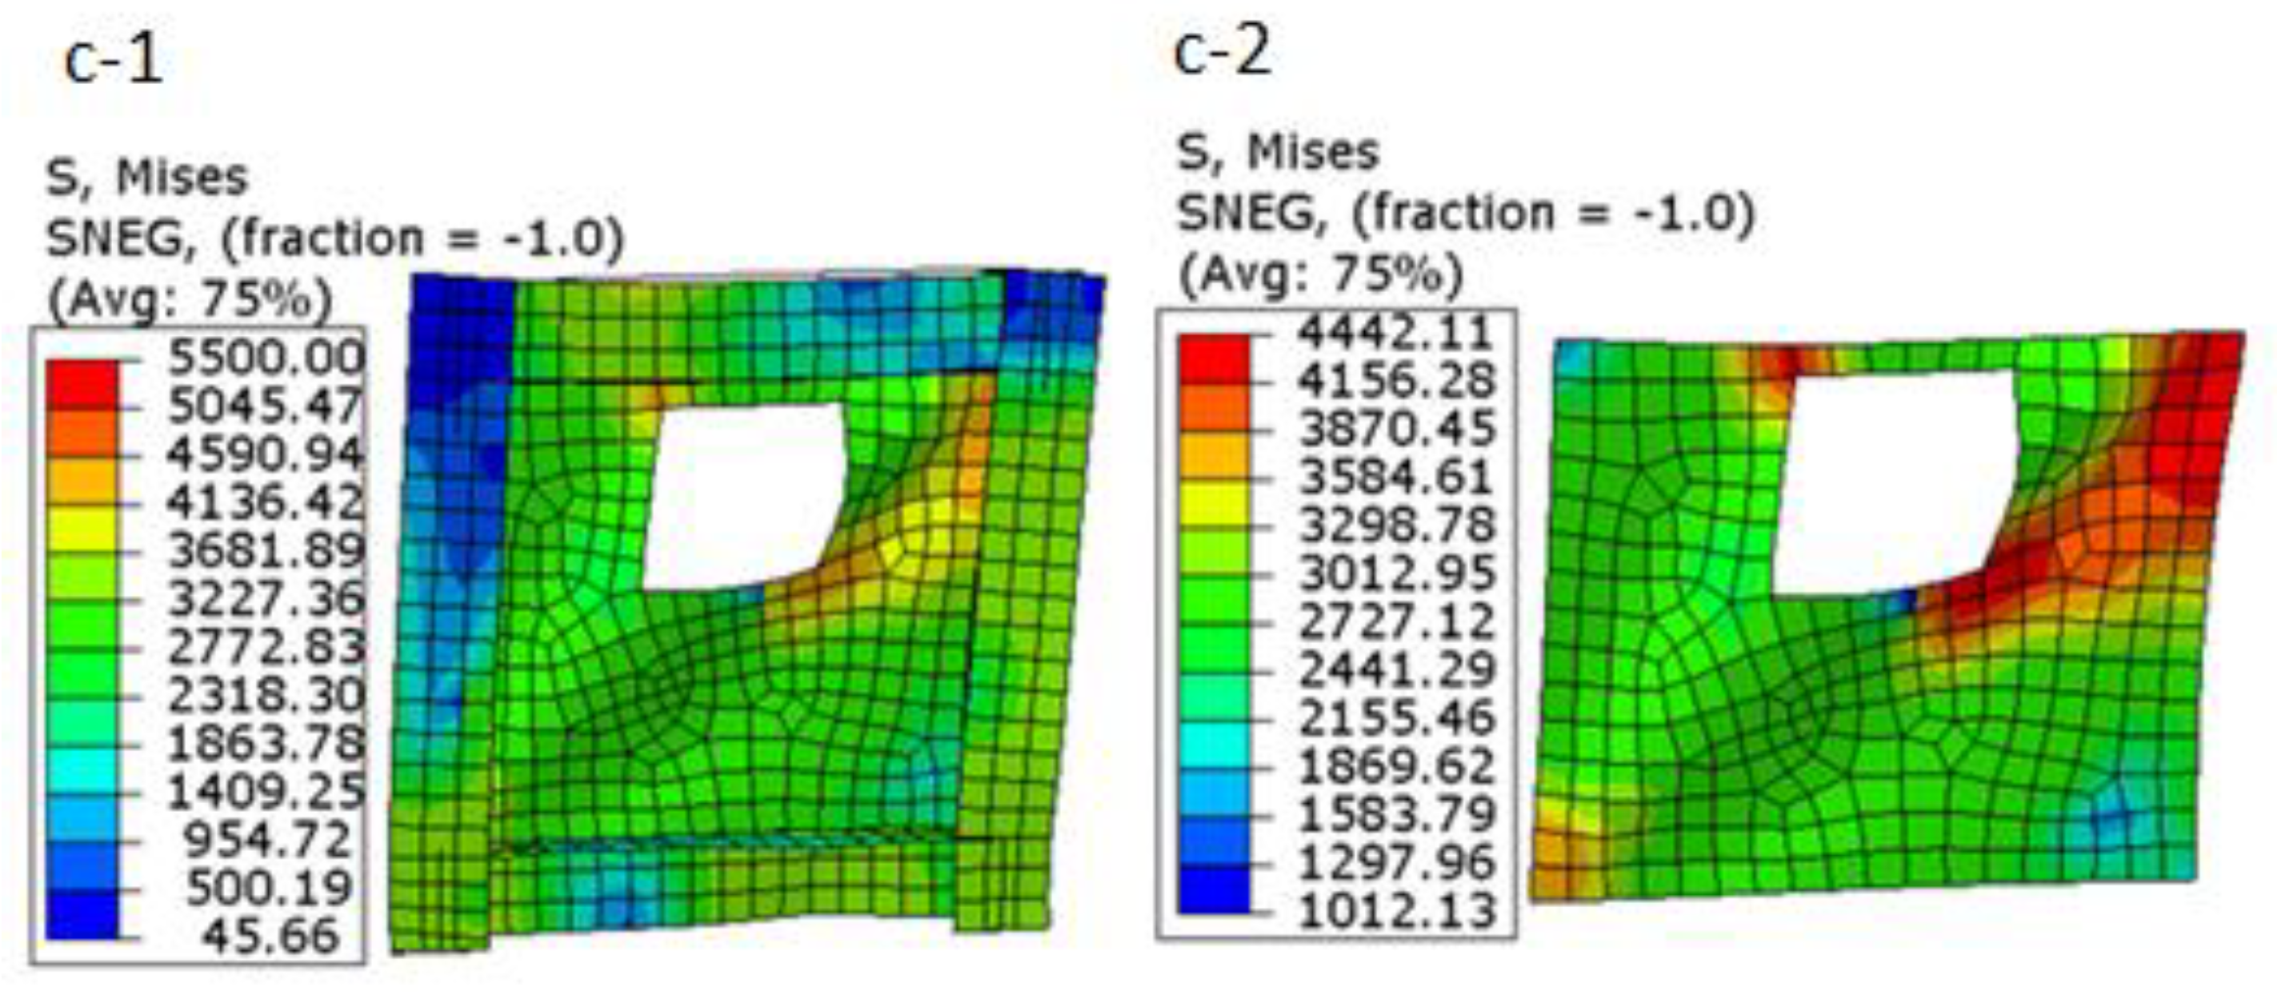
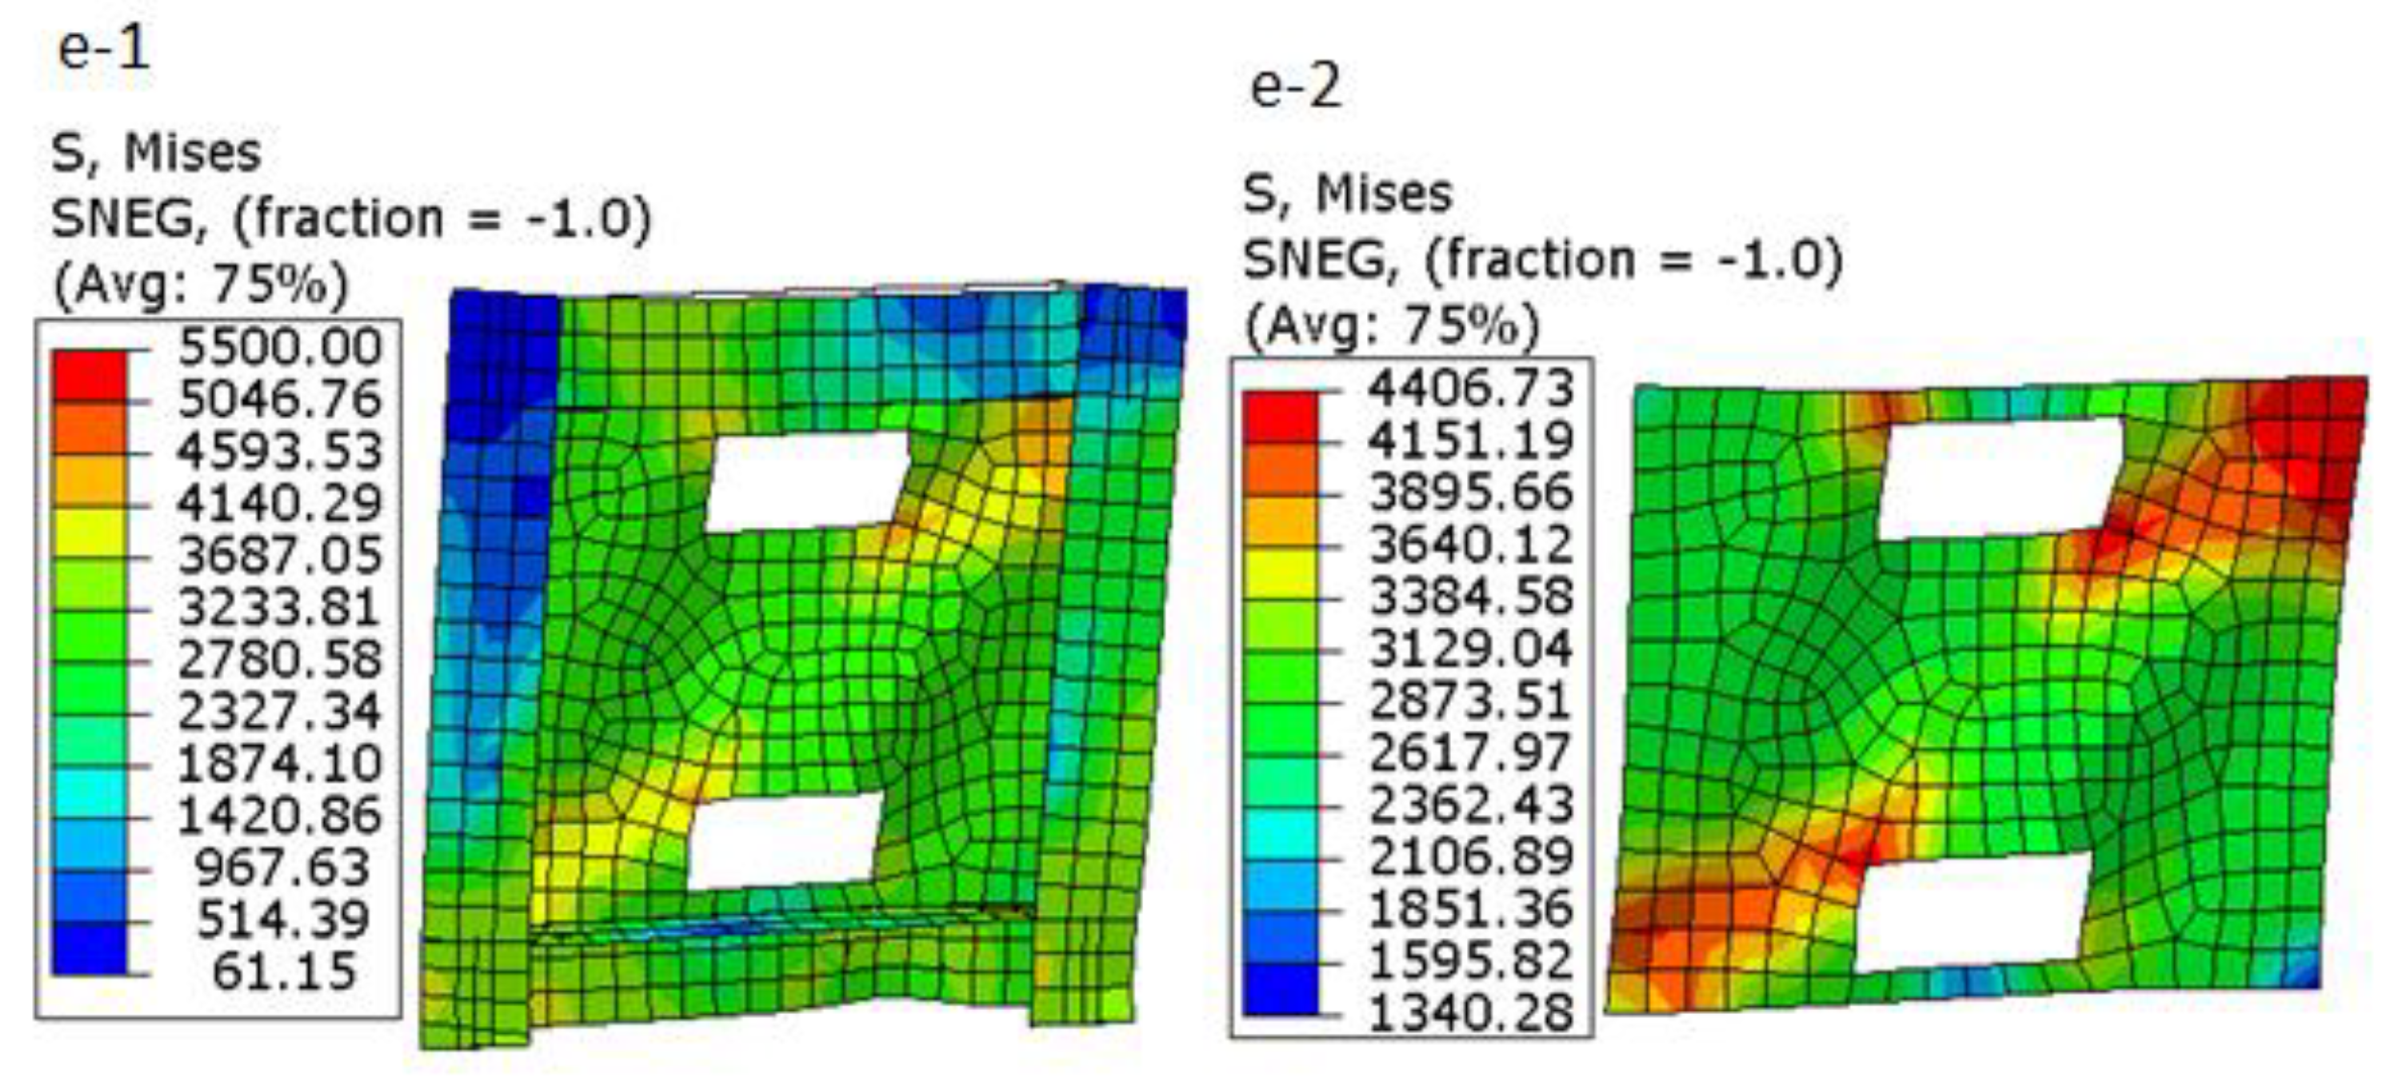
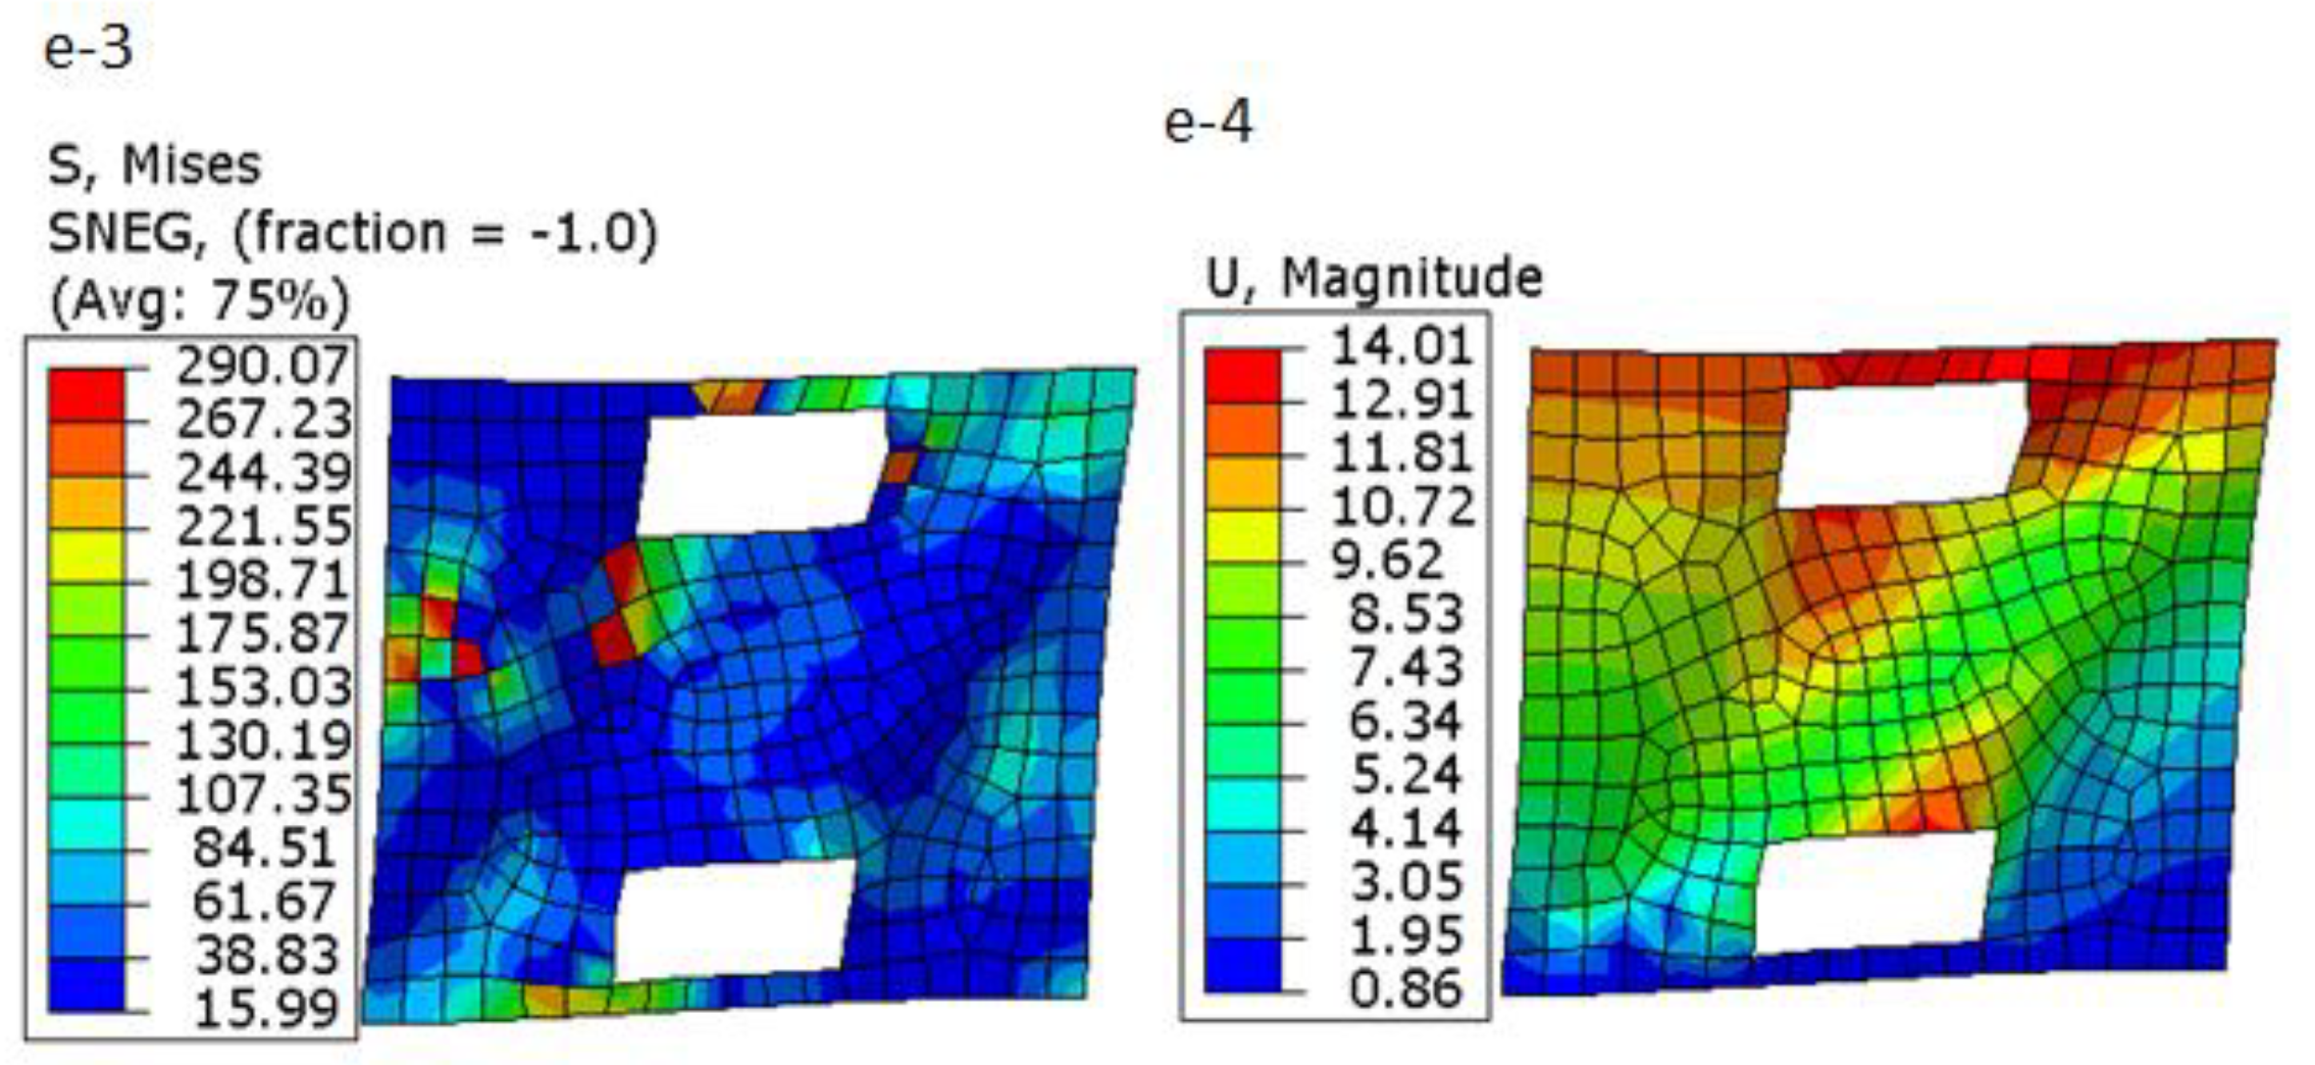
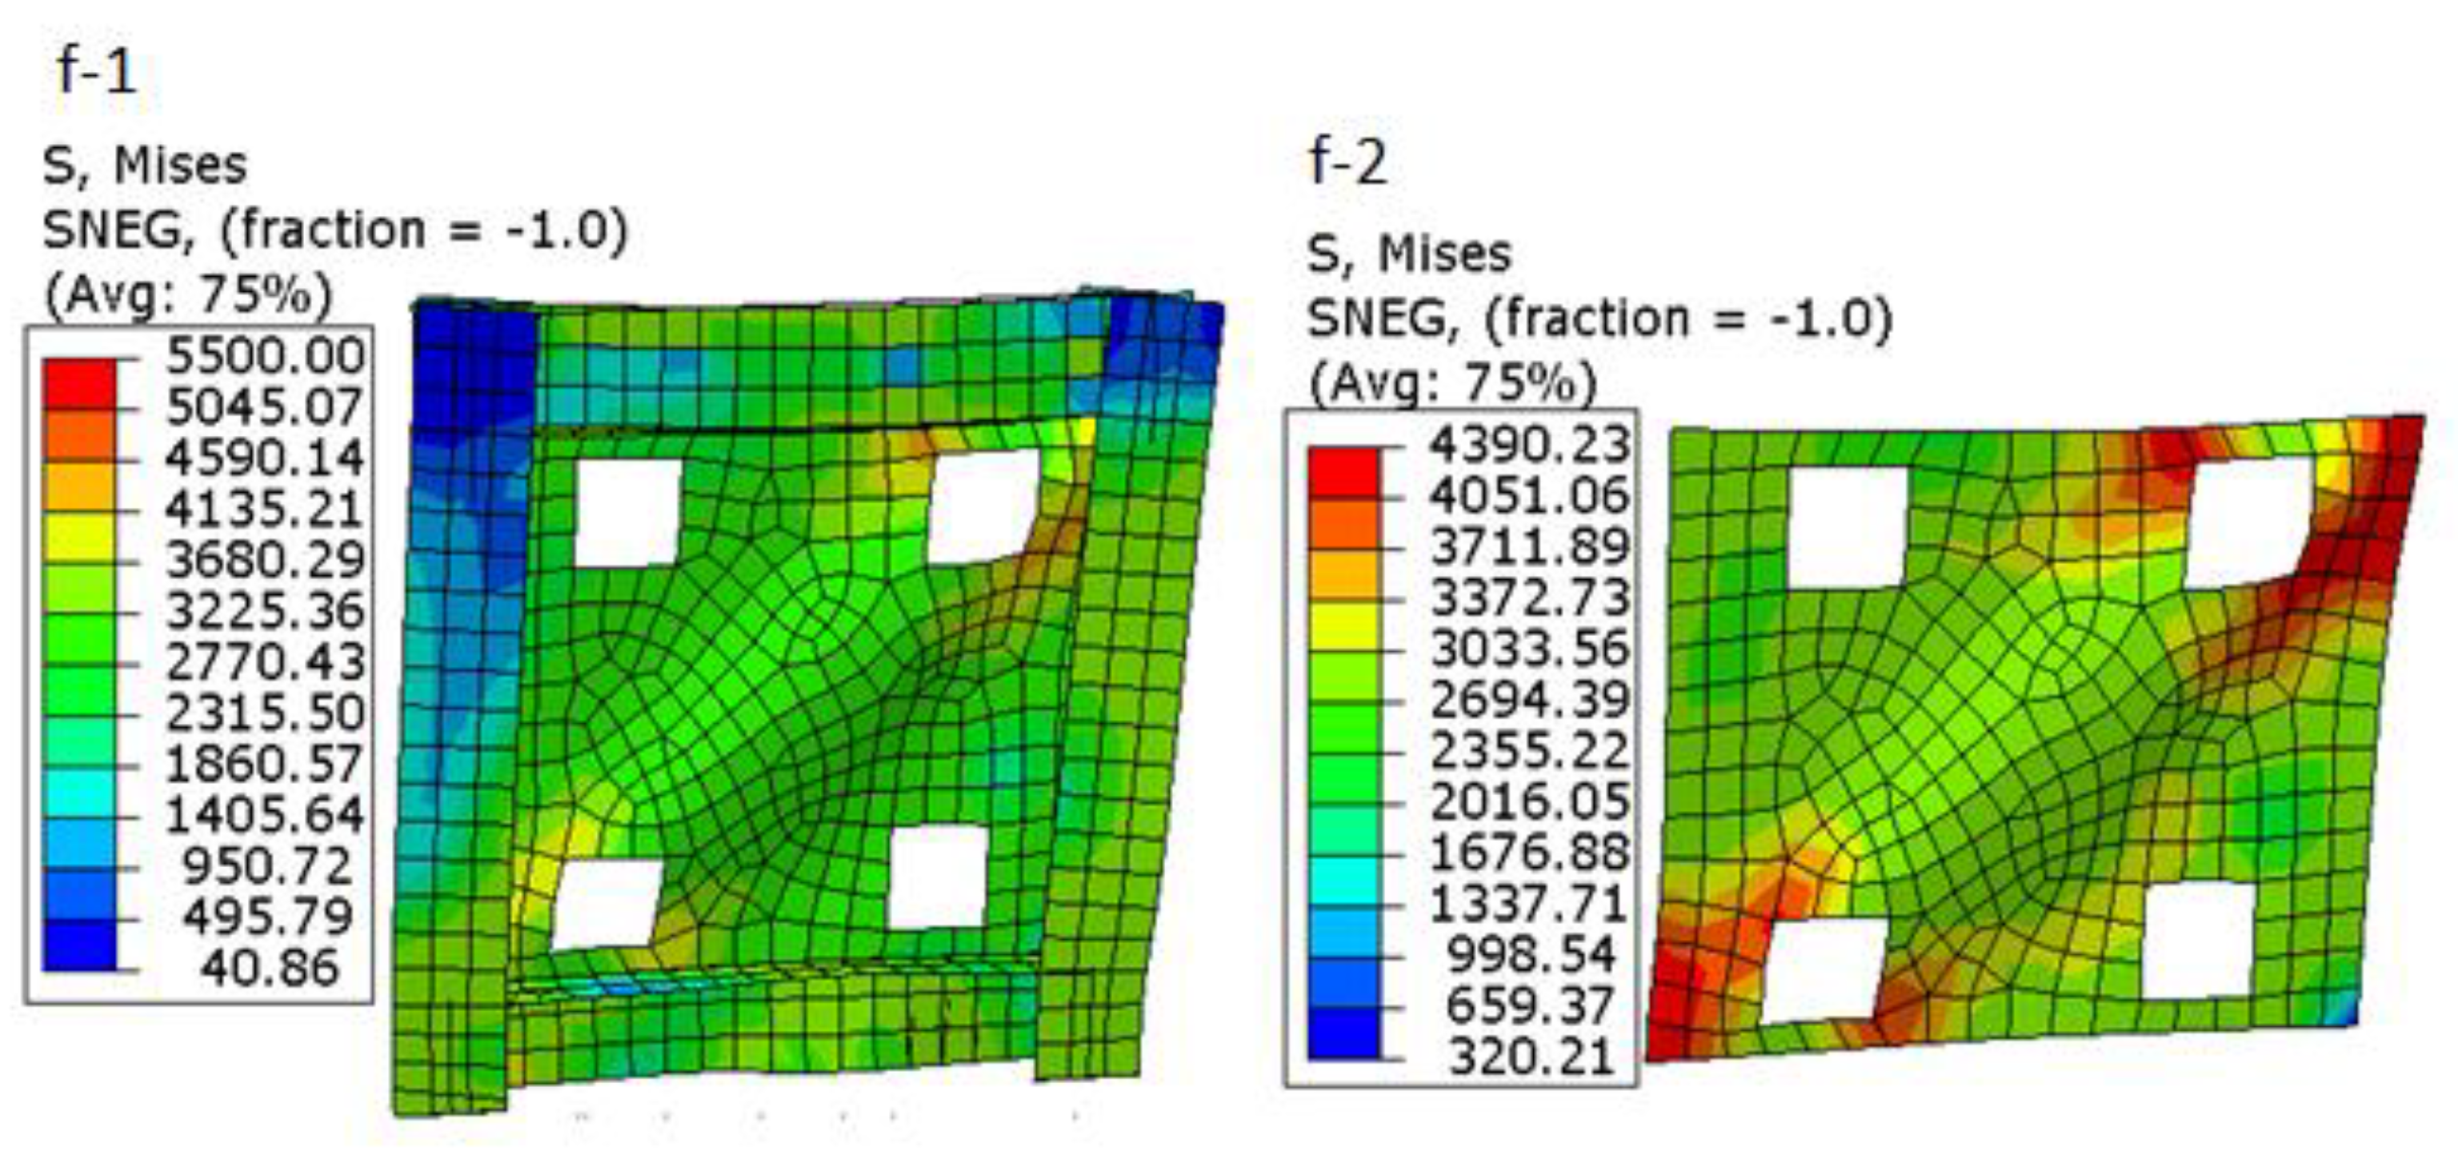
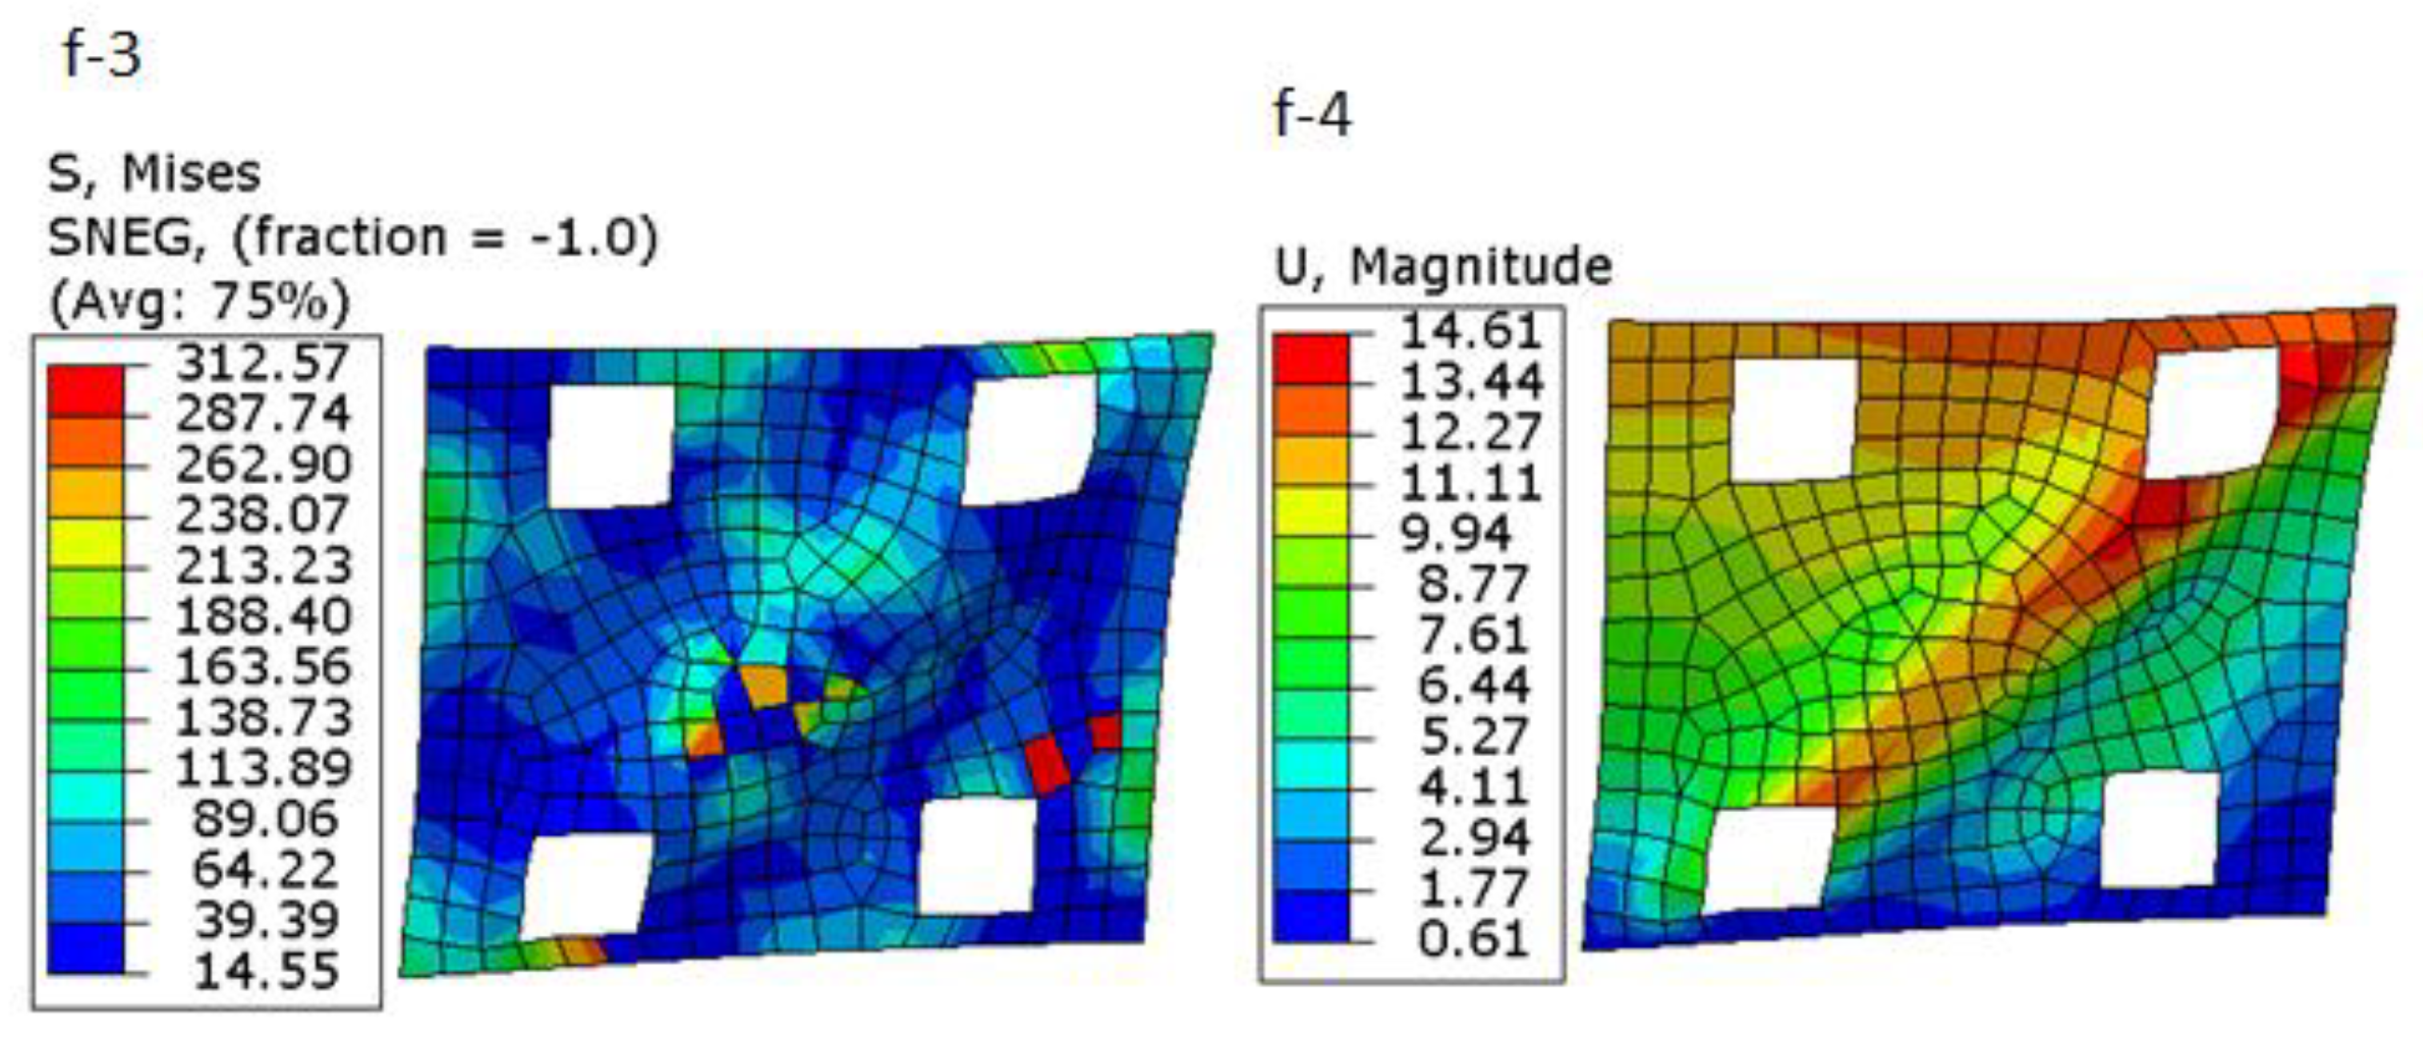
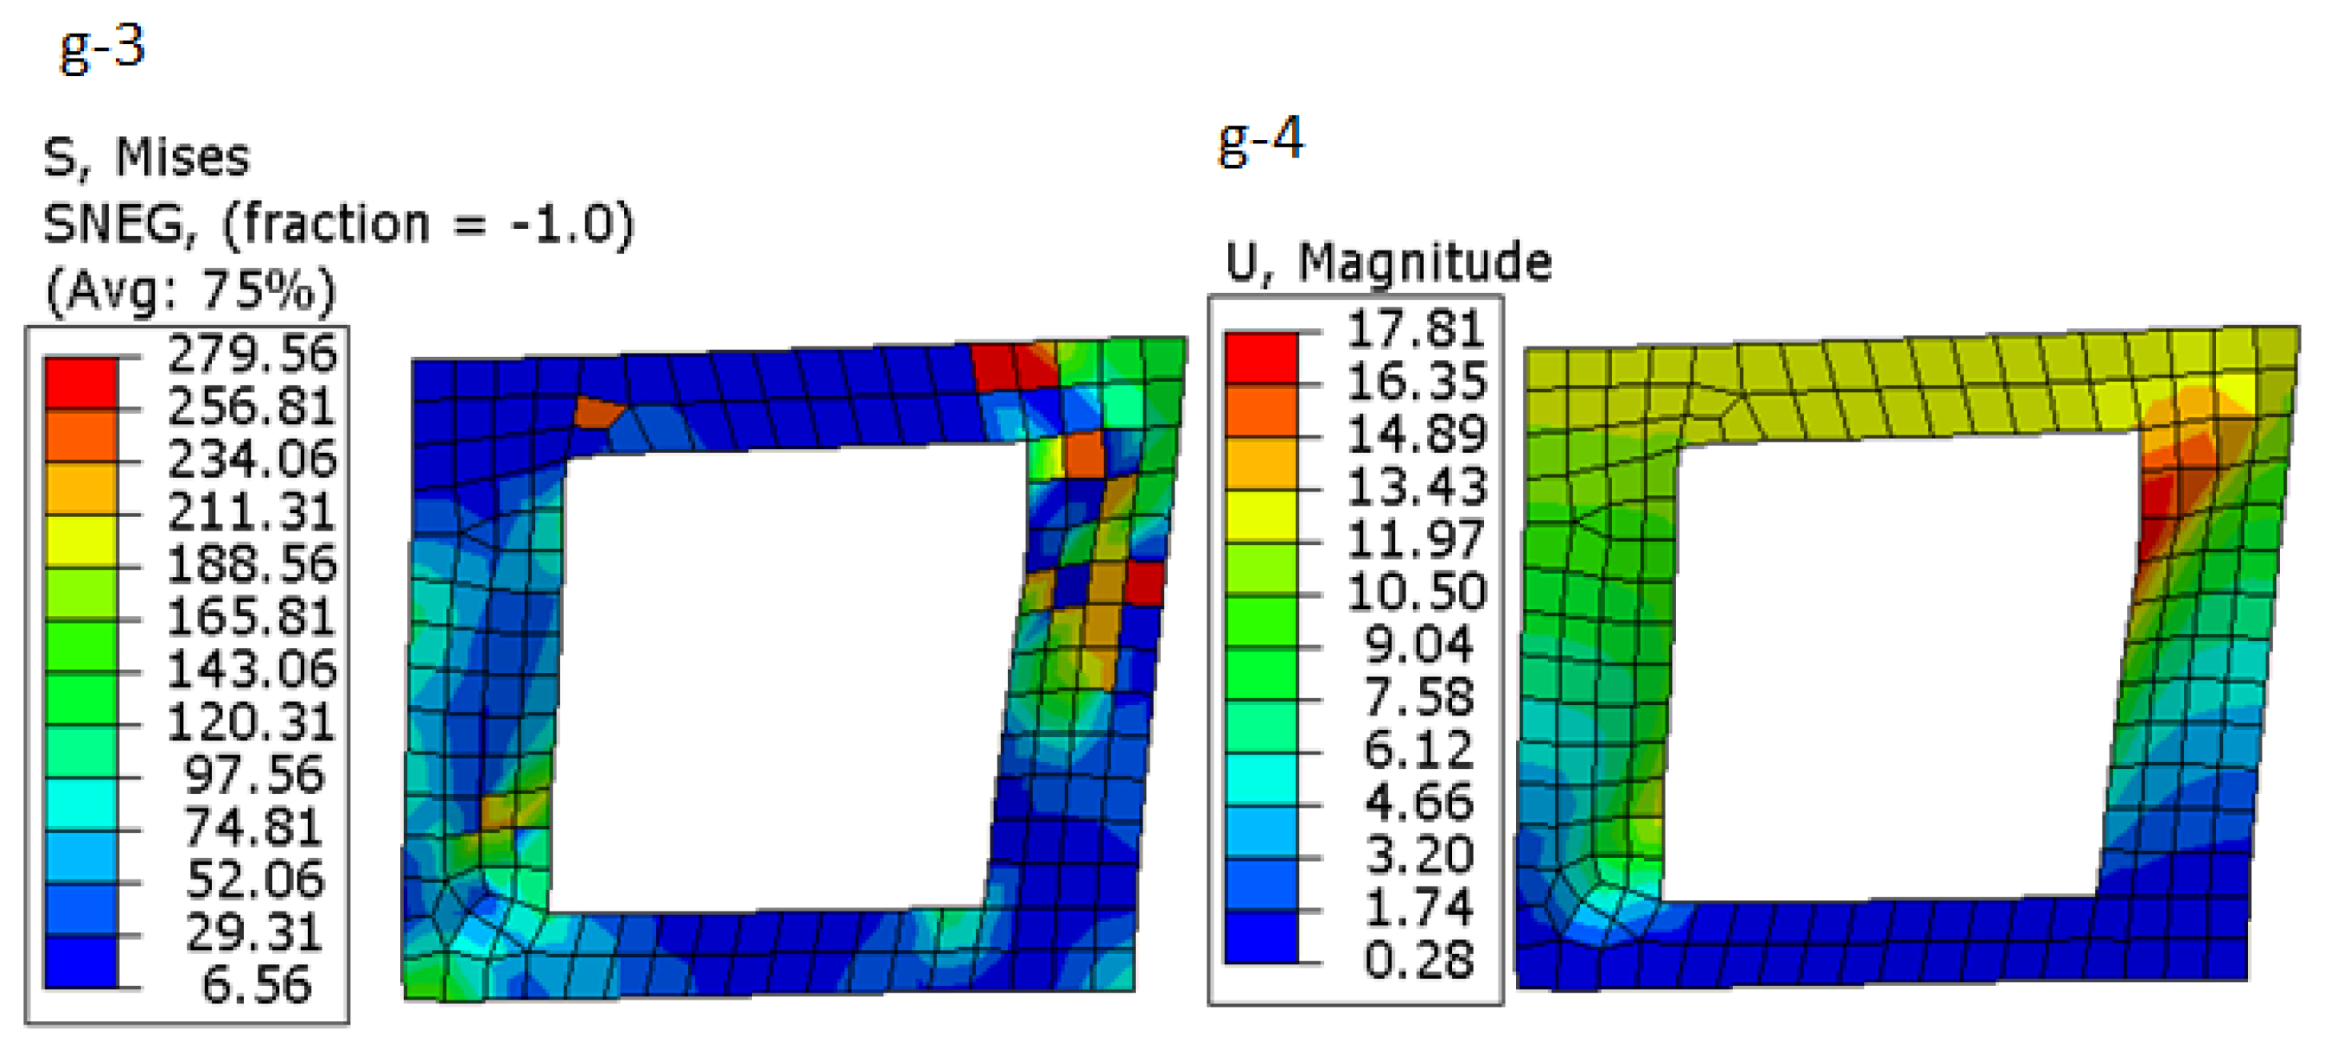
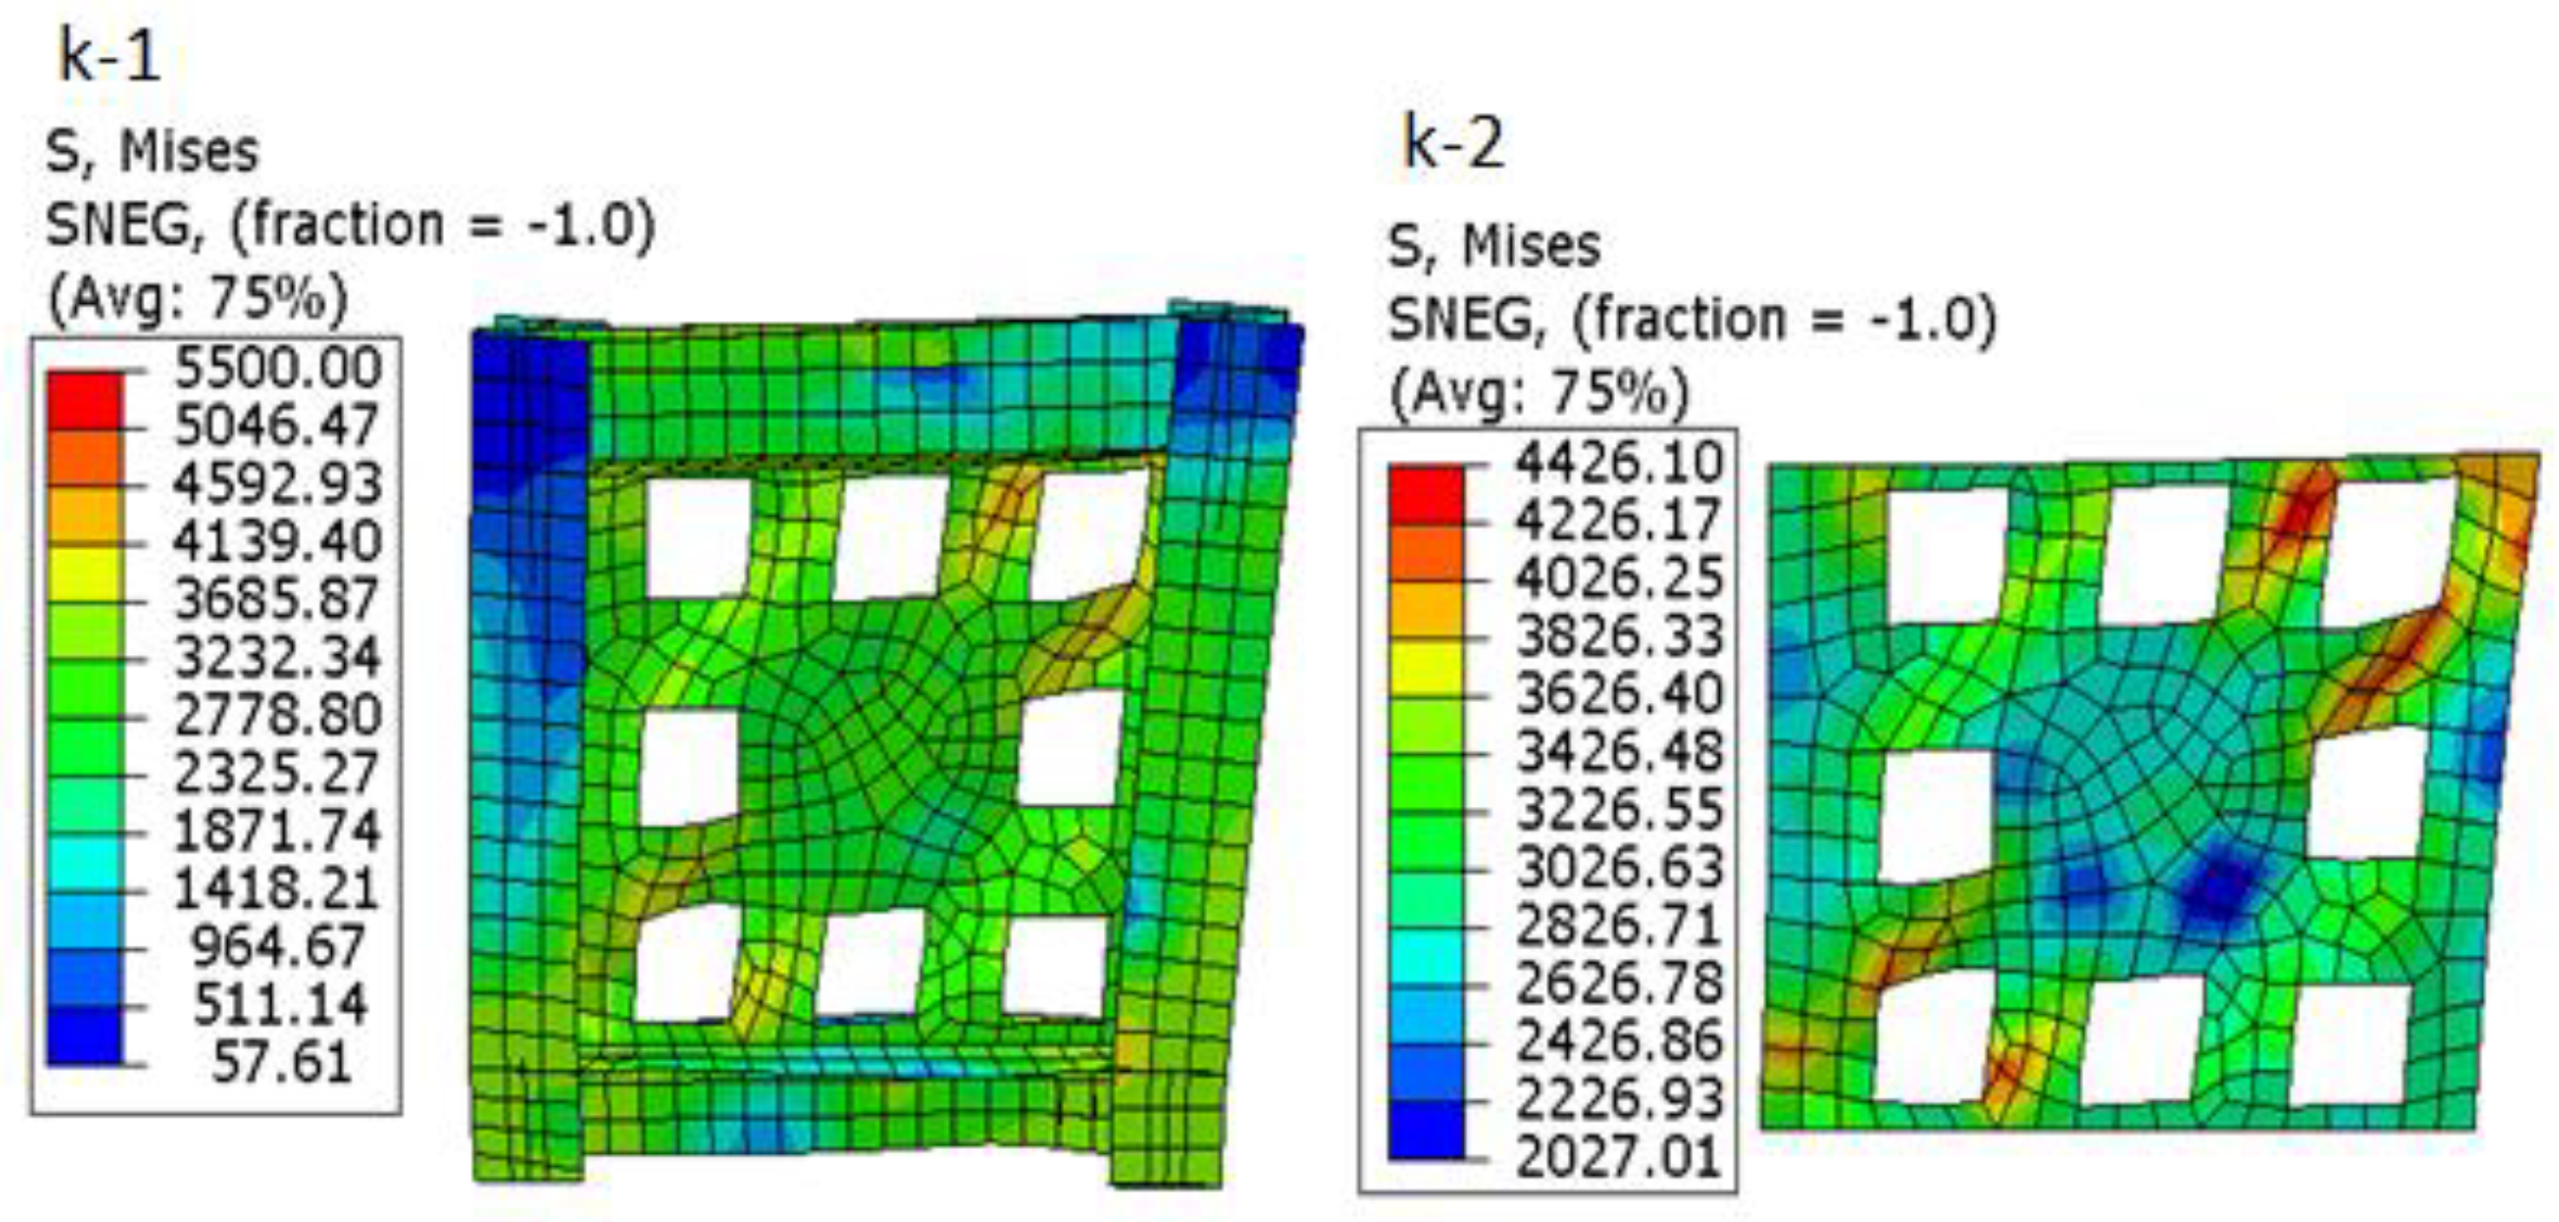
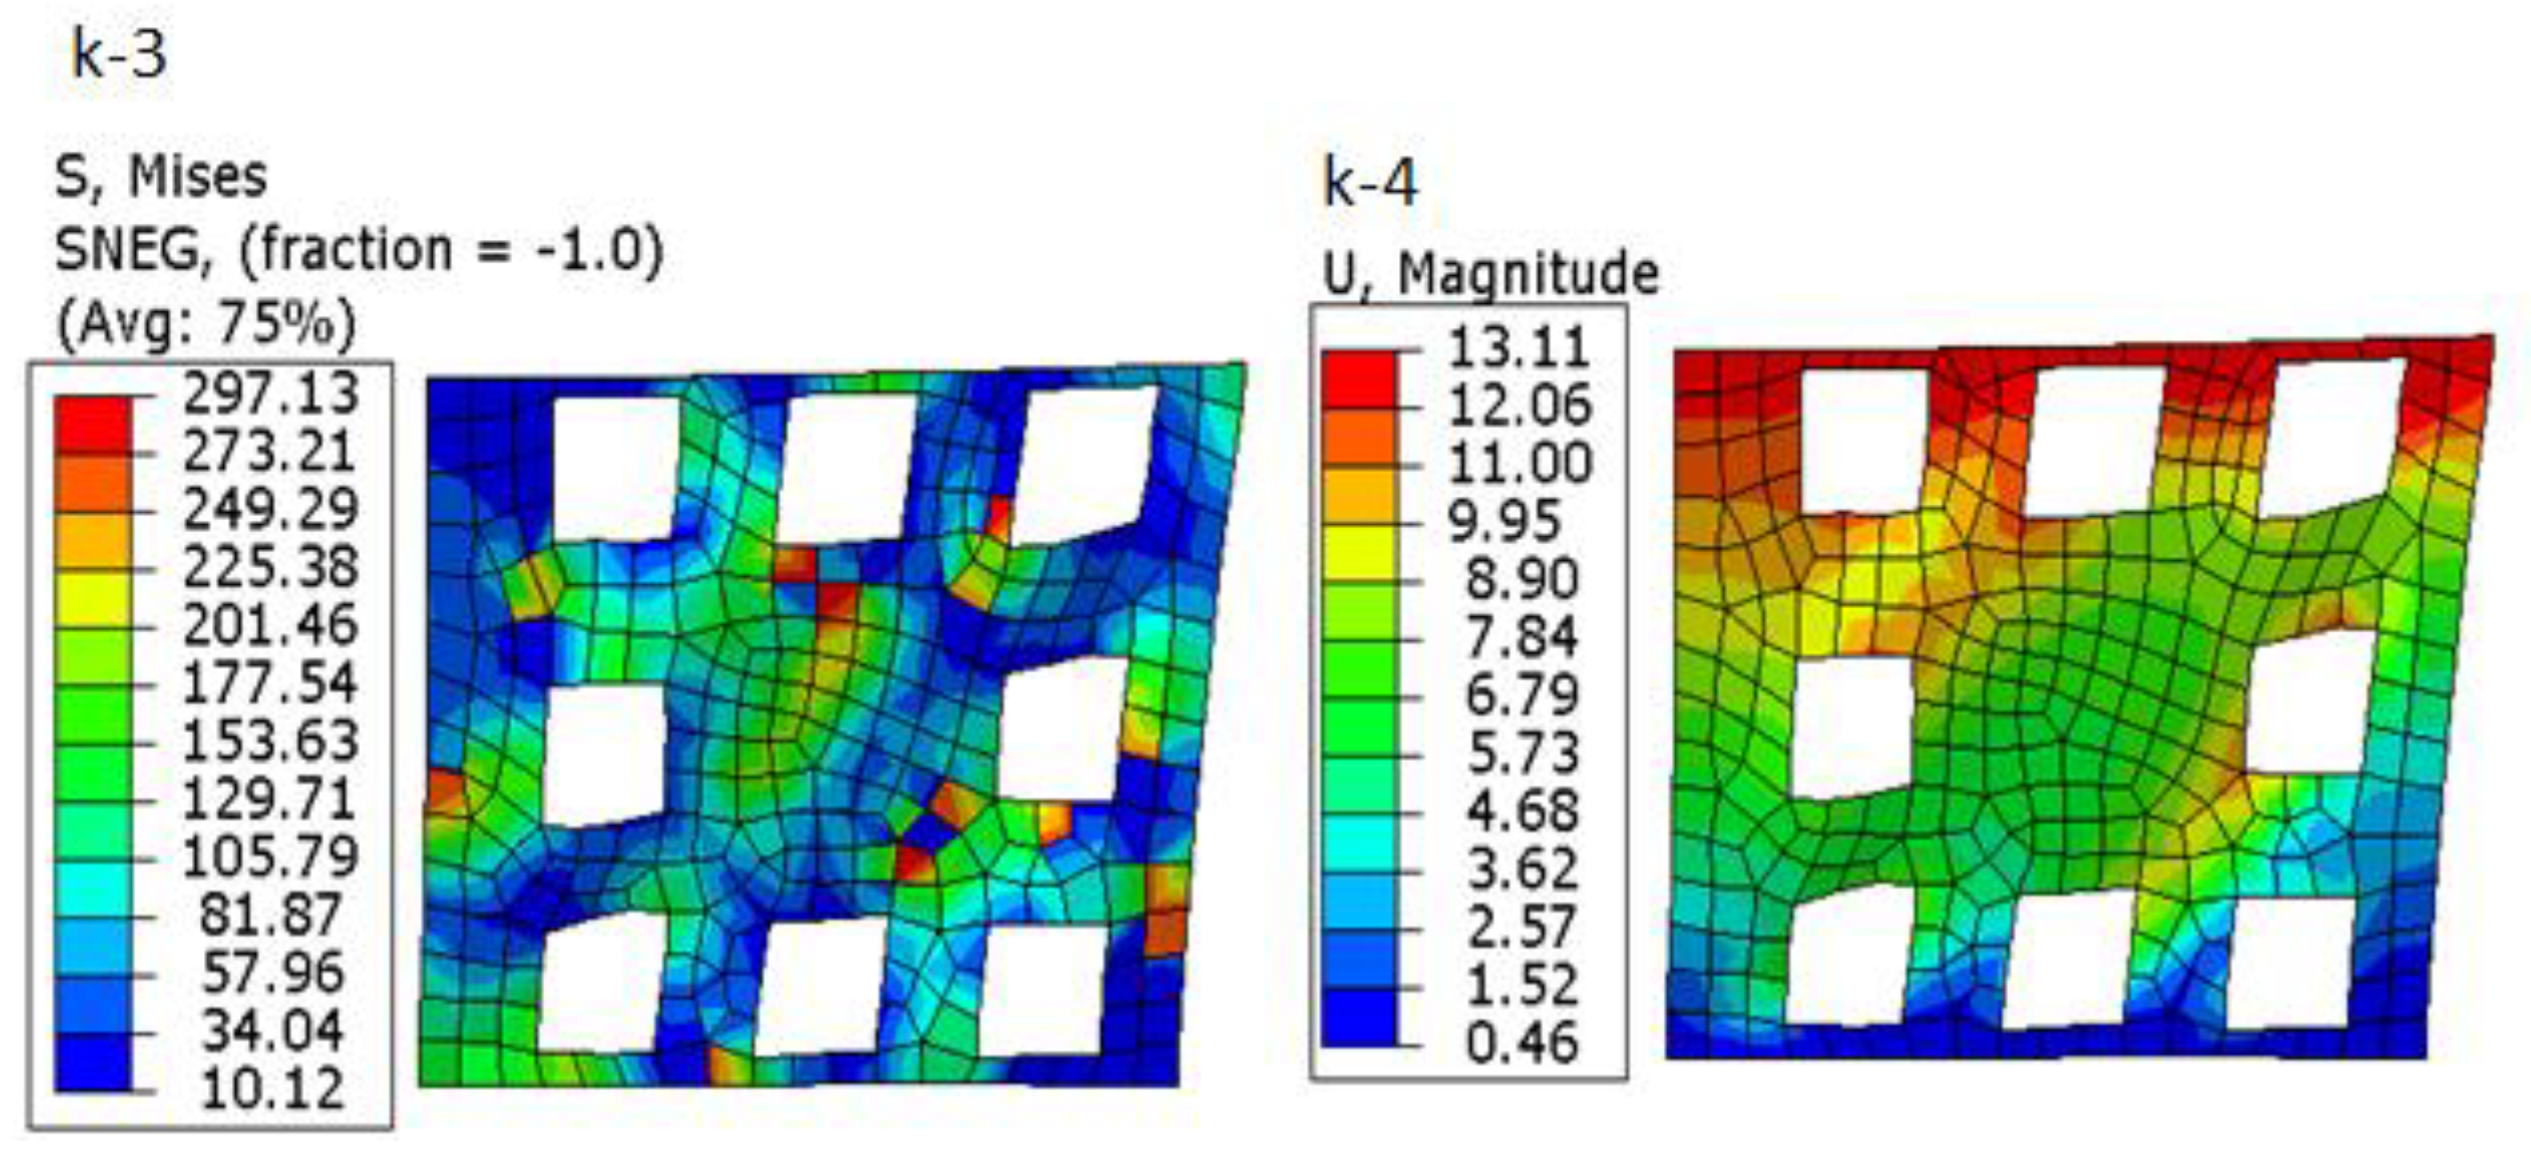
- Figure 16, Figure 17, Figure 18 and Figure 19 show displacement, concrete and steel stress for models e and f. Figure 16 and Figure 18 show that the maximum stress in the steel plate in specimens with 4 openings is 439 MPa, which depicts the stress decrease as compared to model (e). Moreover, the stiffness of the shear wall increases with distributing opening.
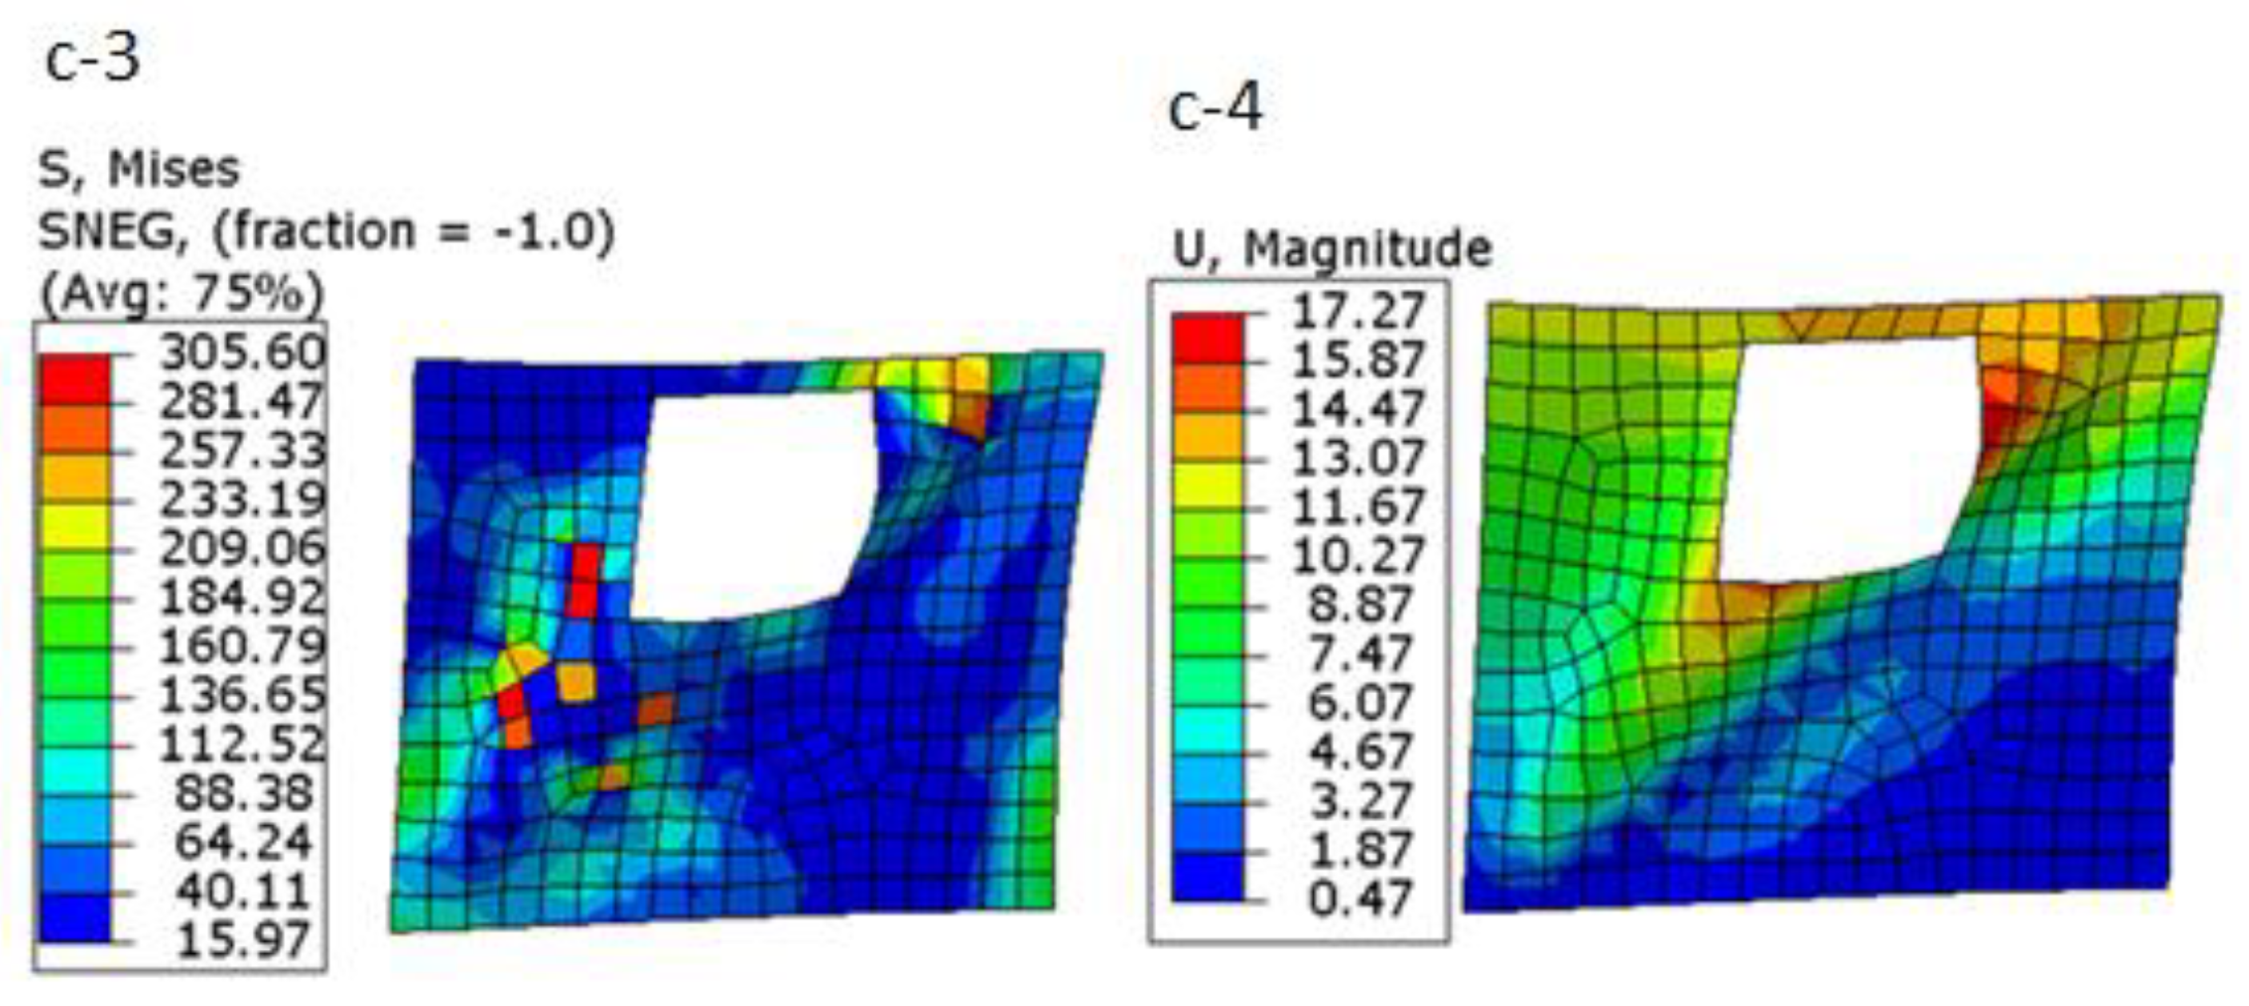
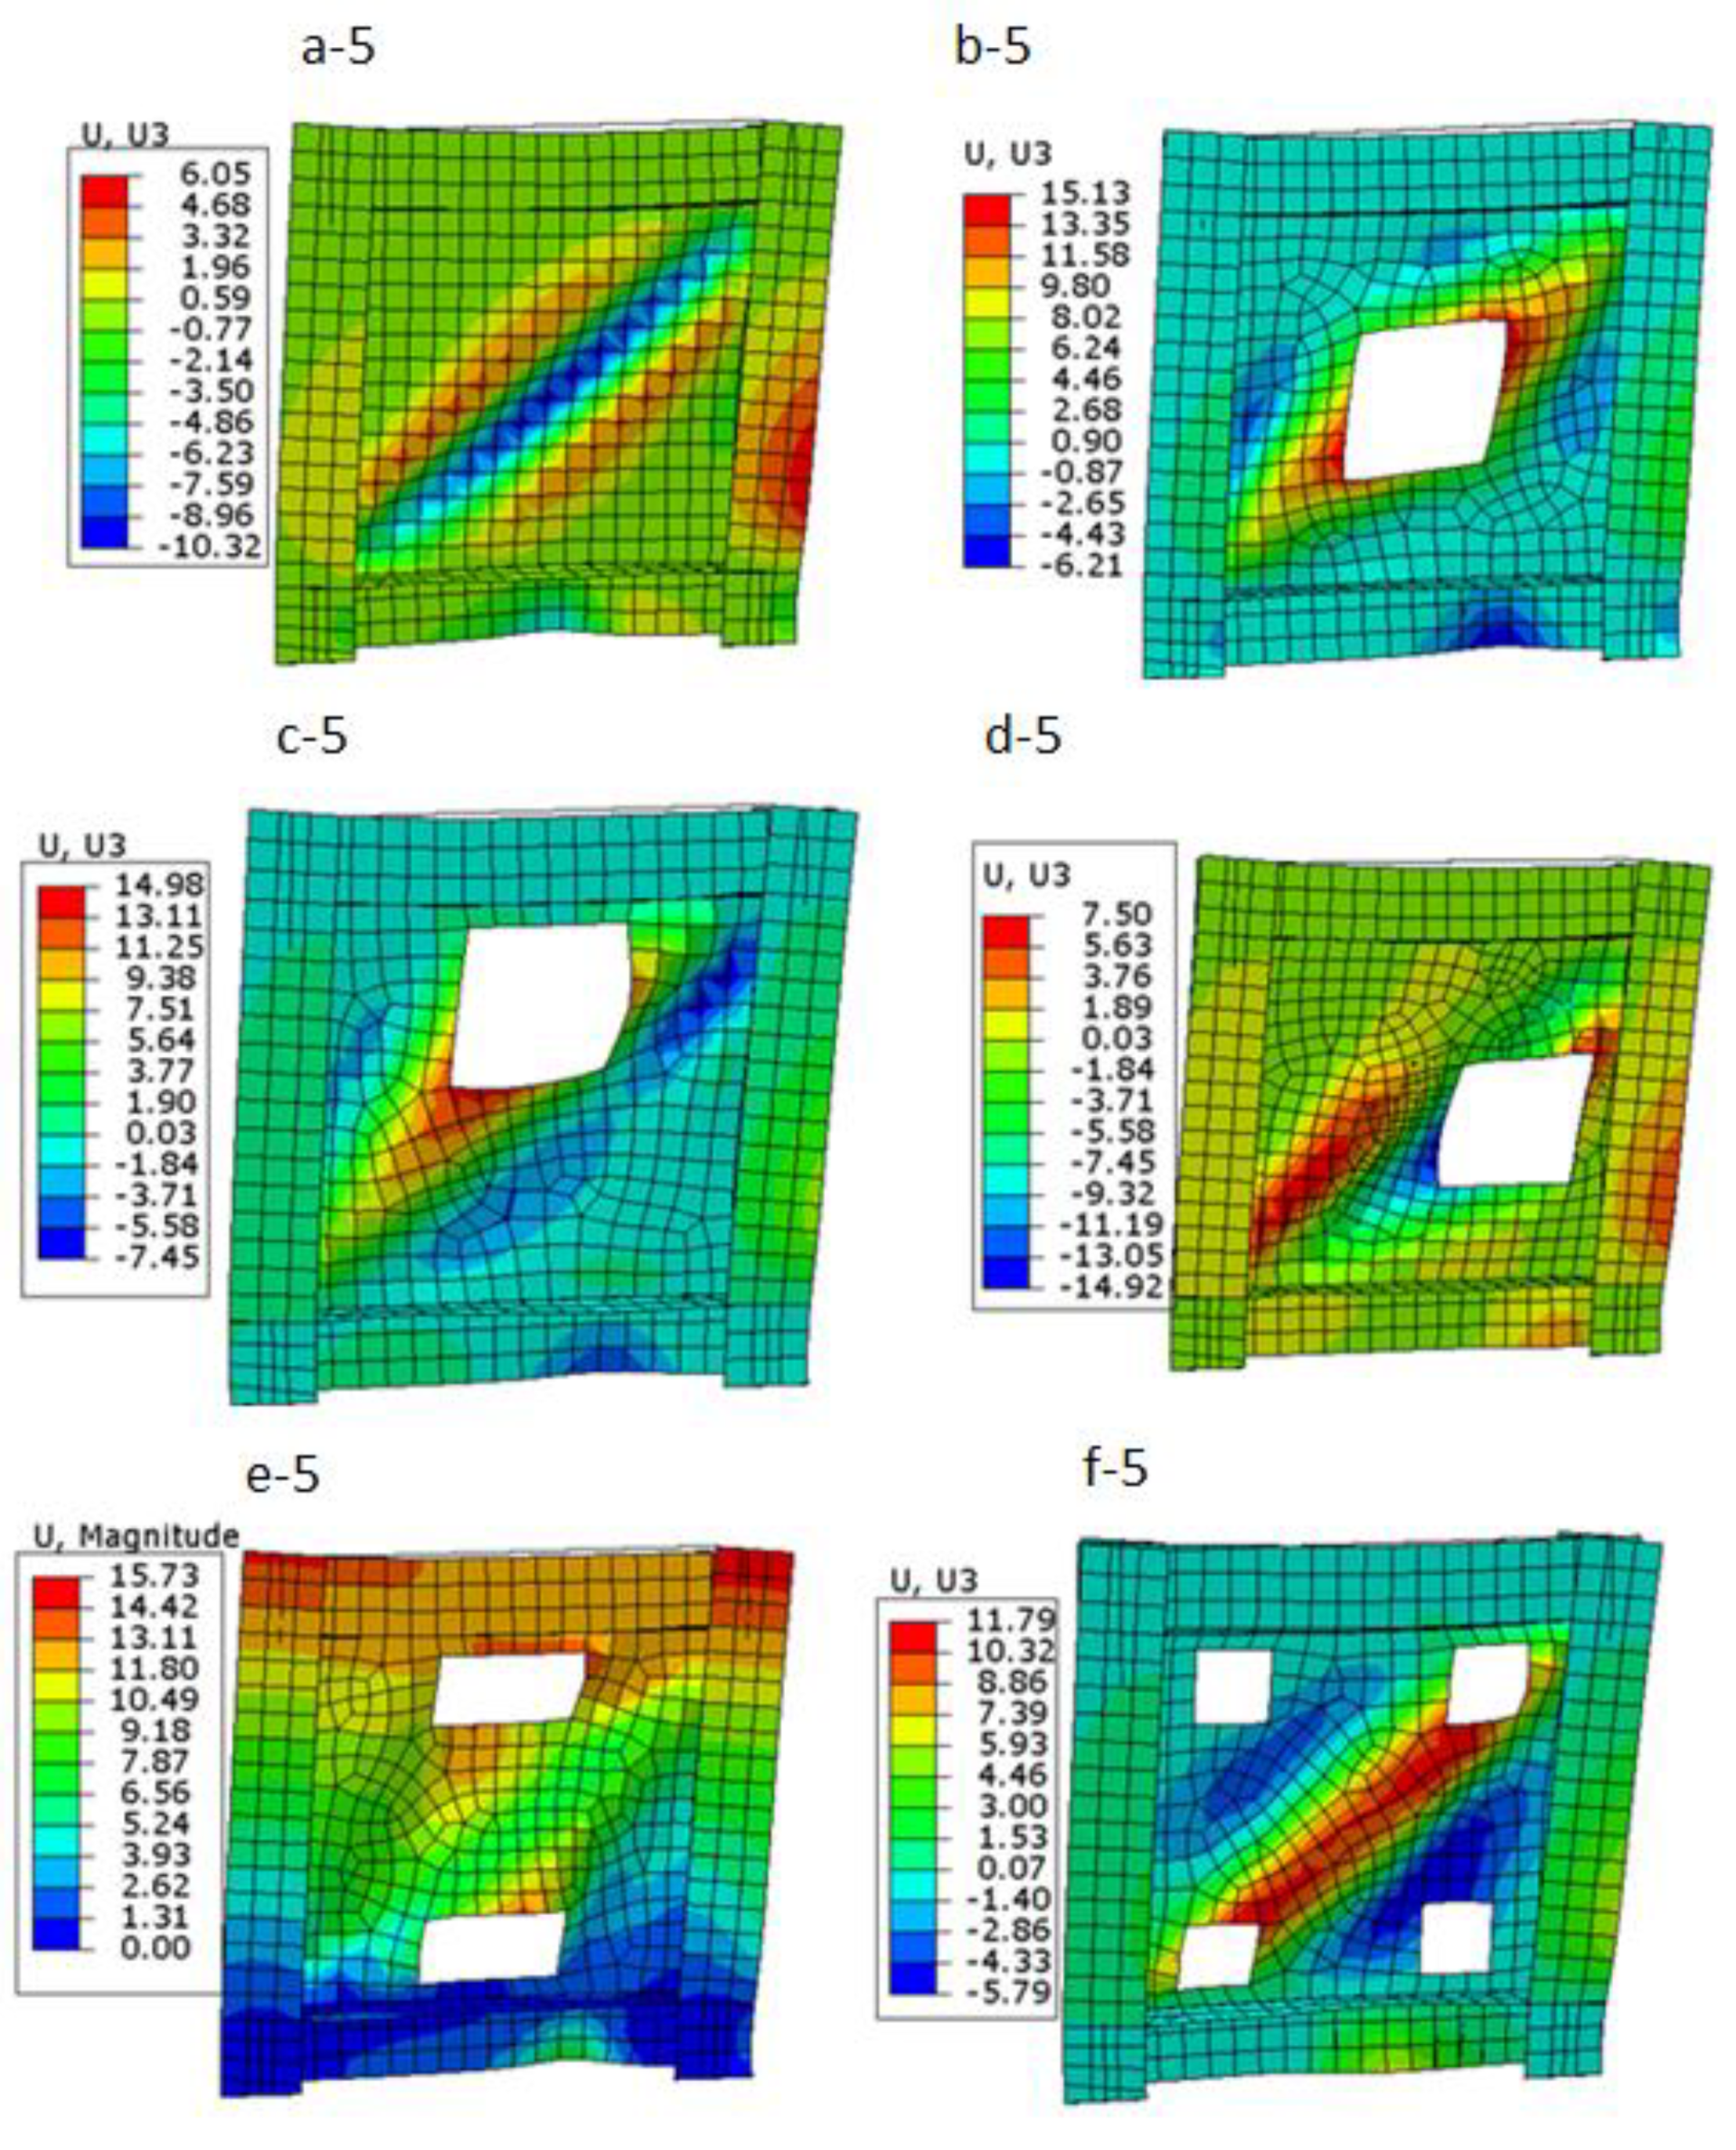
- The number of elements reaching maximum stresses around the opening near the beam was more than specimen with an opening near to column. The reason for the larger stress around the opening near beam as compared to the opening near column or central opening can be related to the out-of-plane displacement. When comparing the displacements in the two specimens, as shown in Figure 20, the displacement around the opening near the beam is larger than the opening near the column.
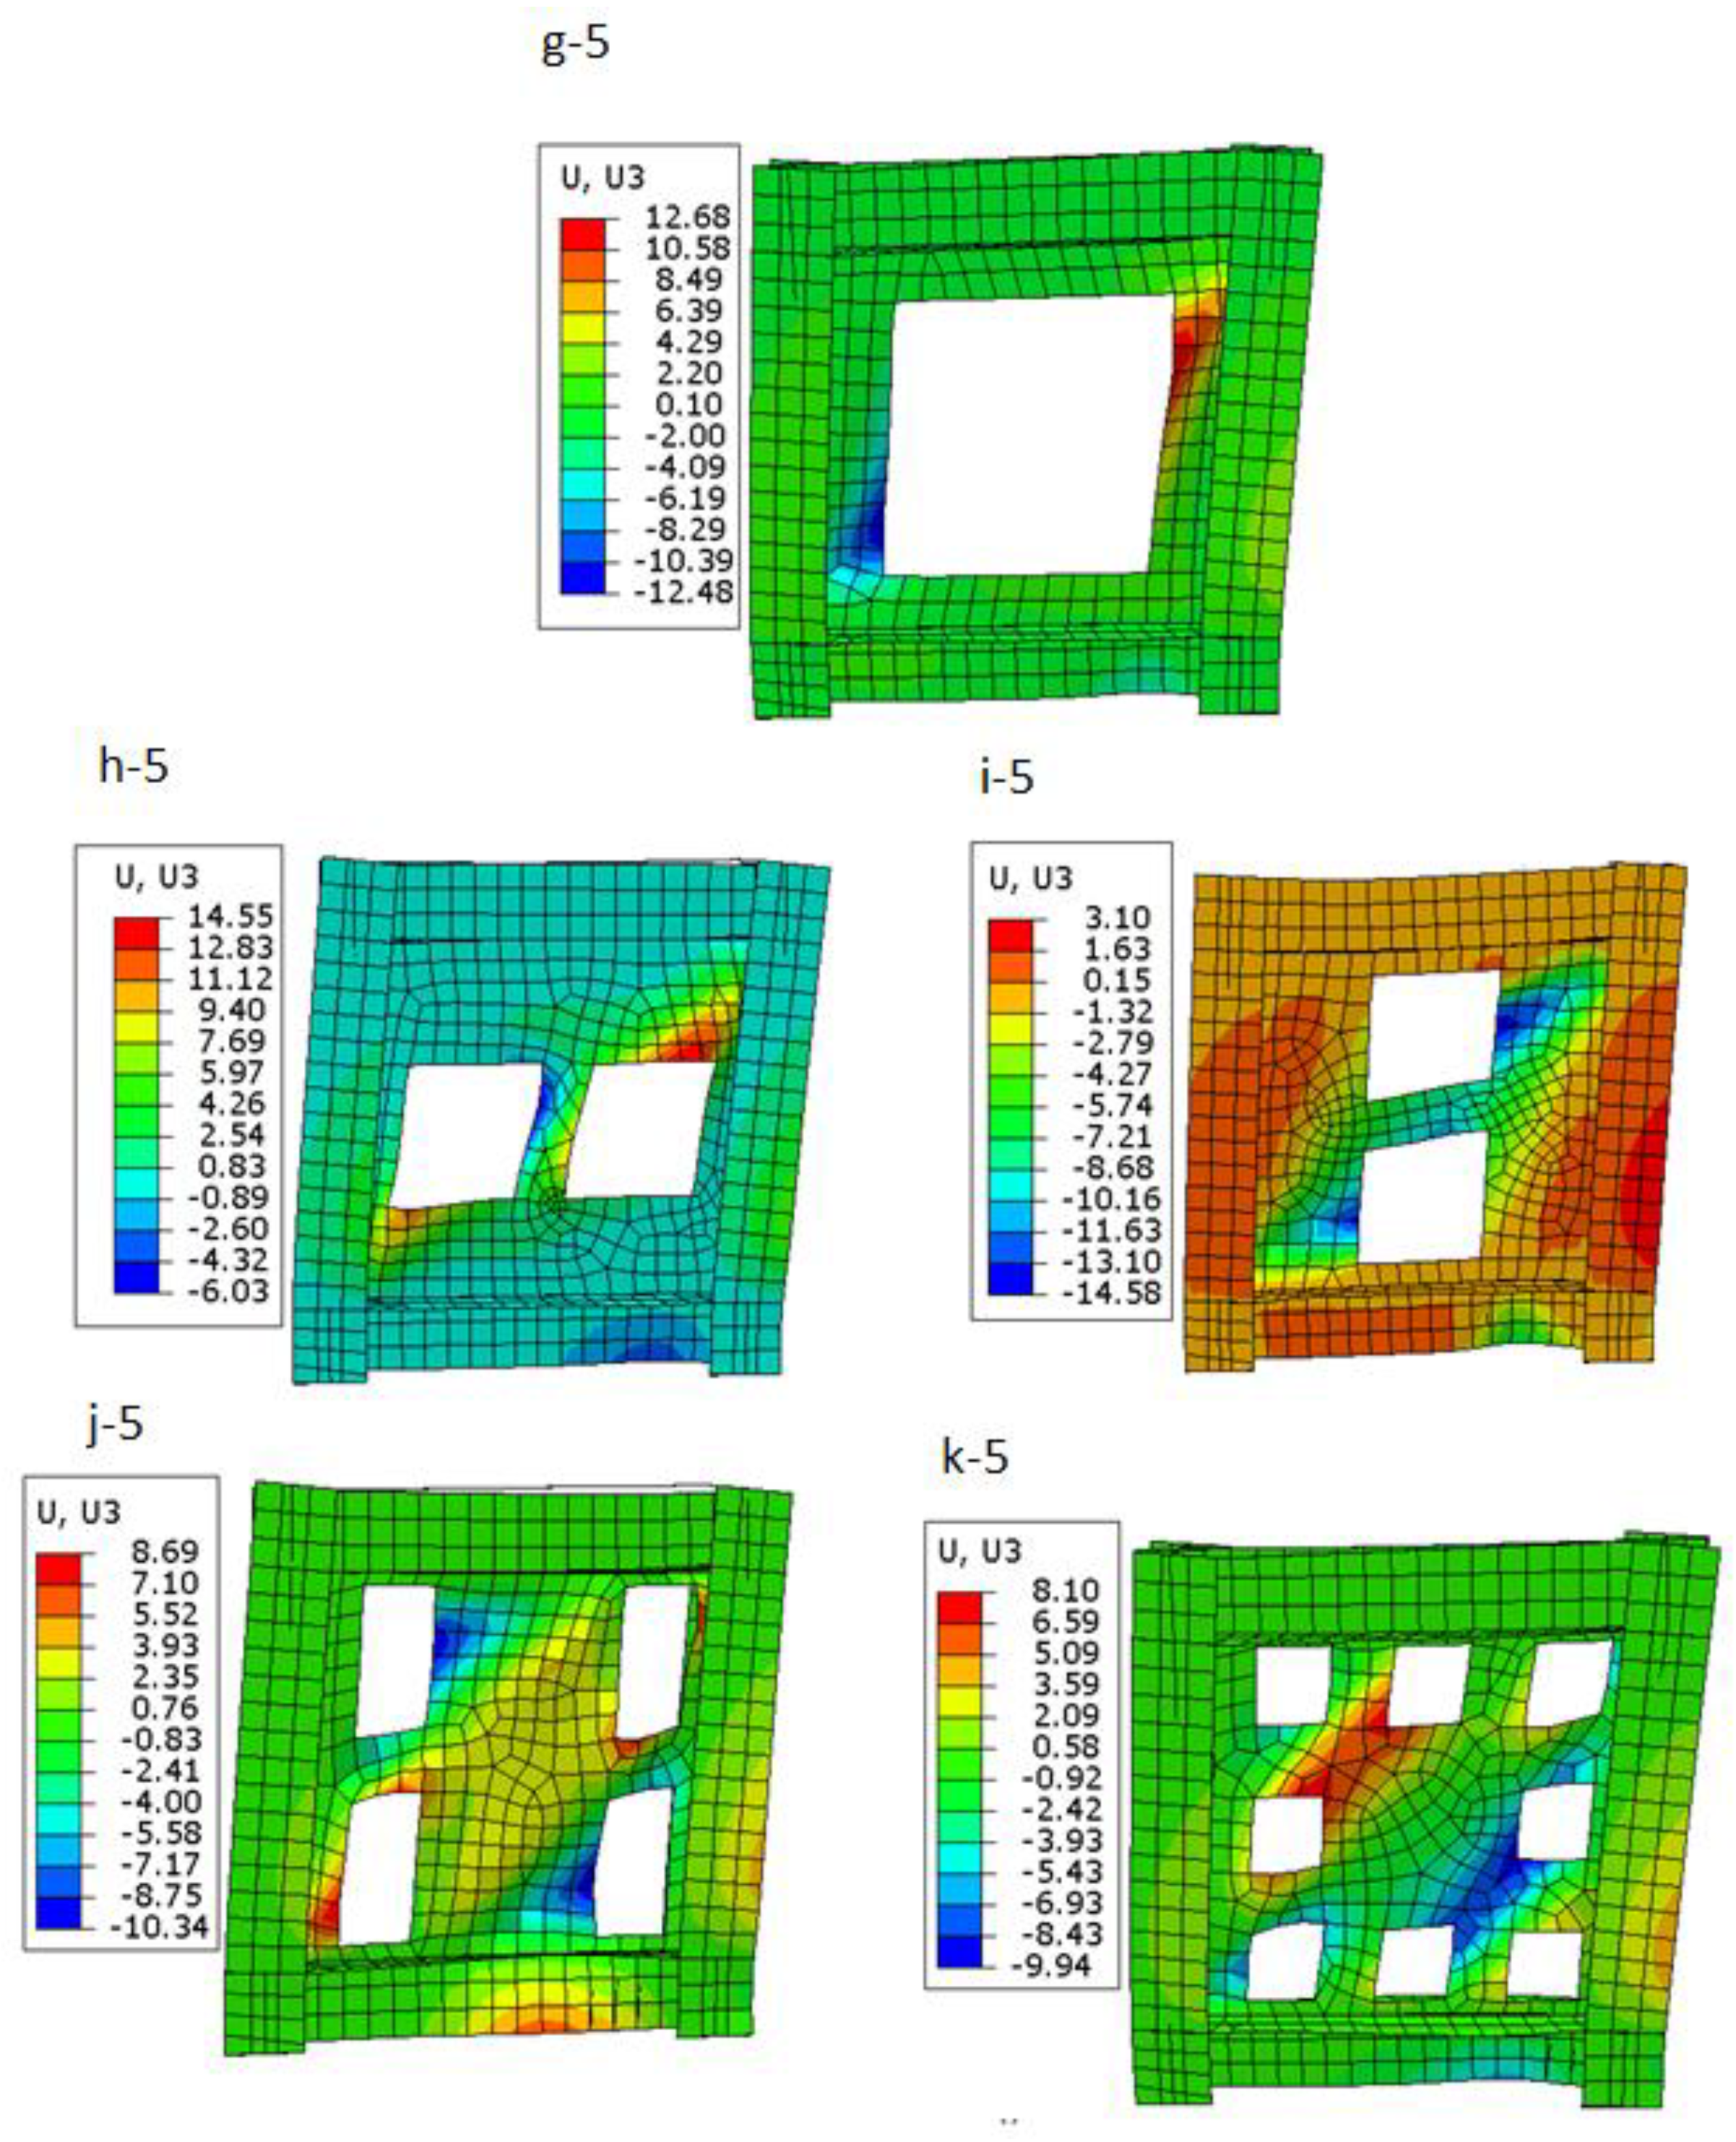
4.2. The Effect of Number of Openings (Group B)
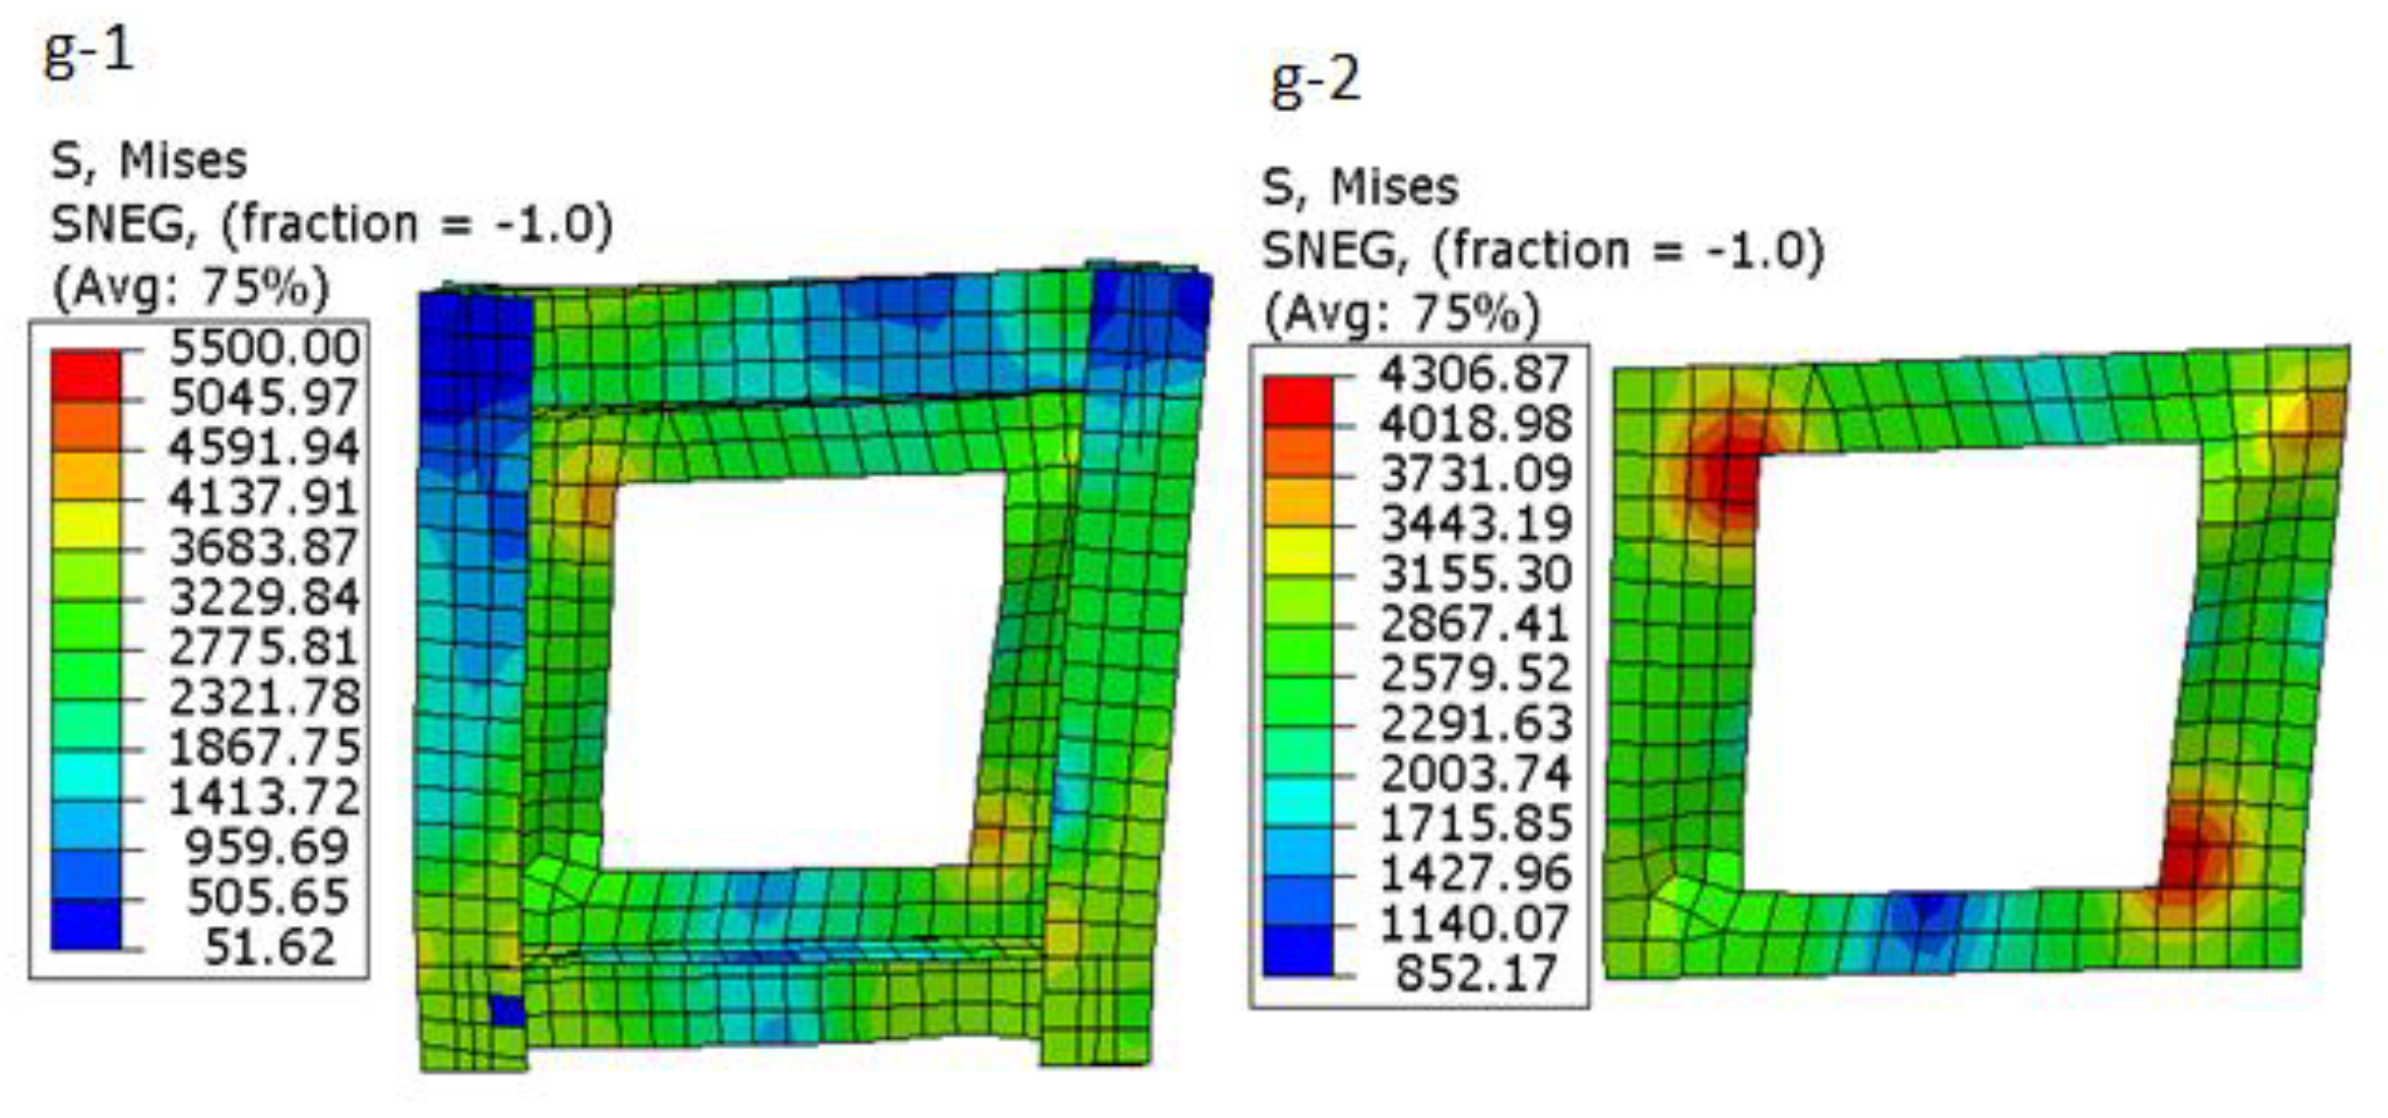
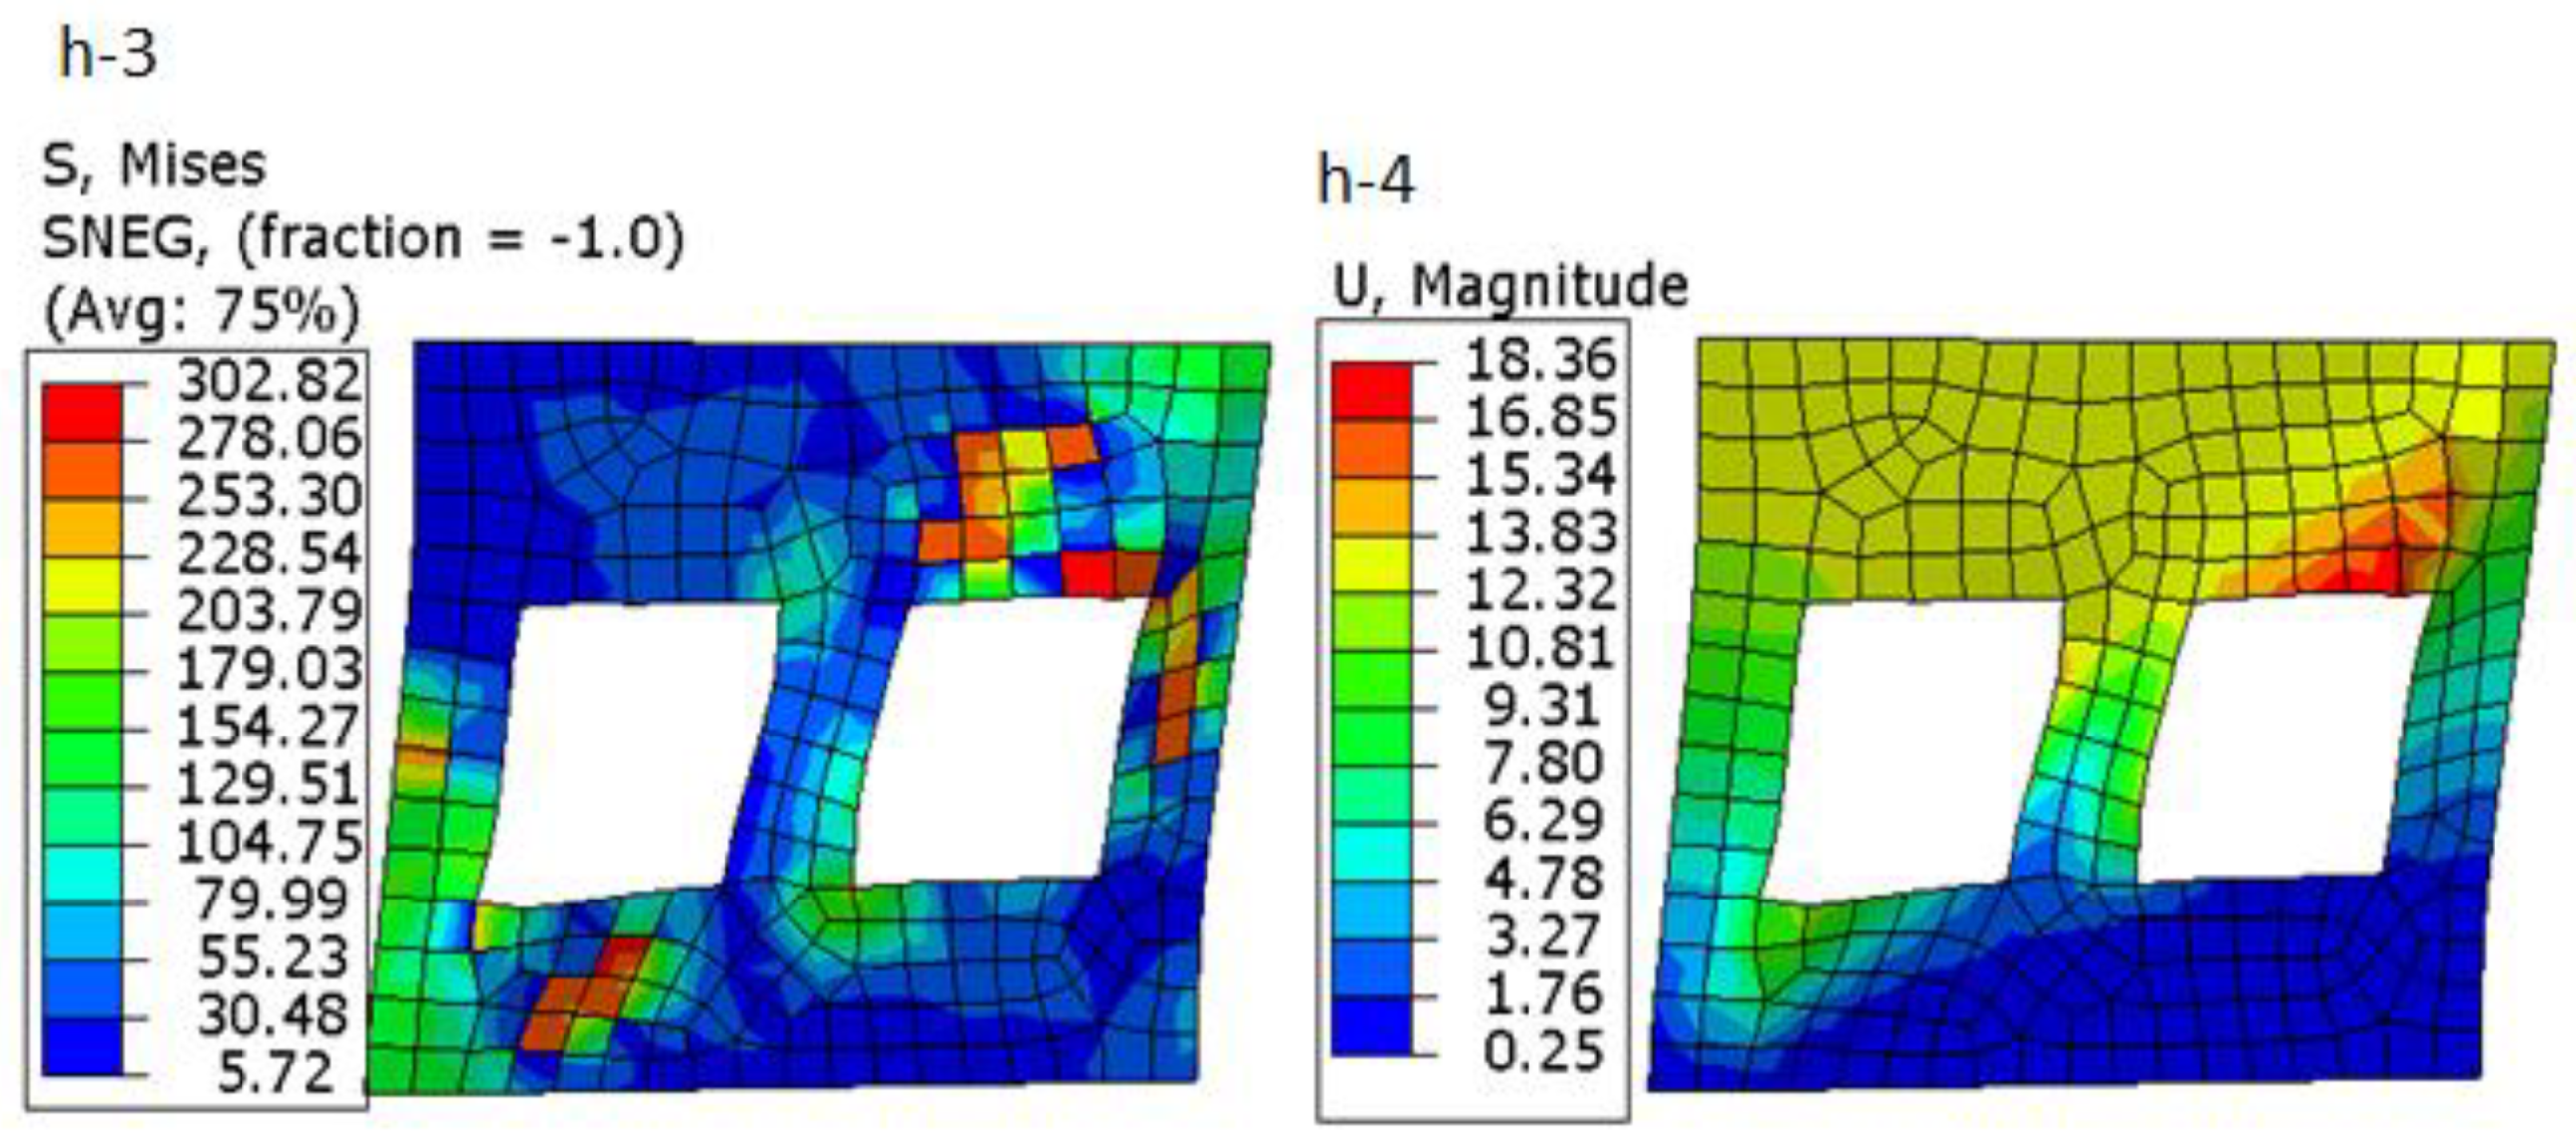
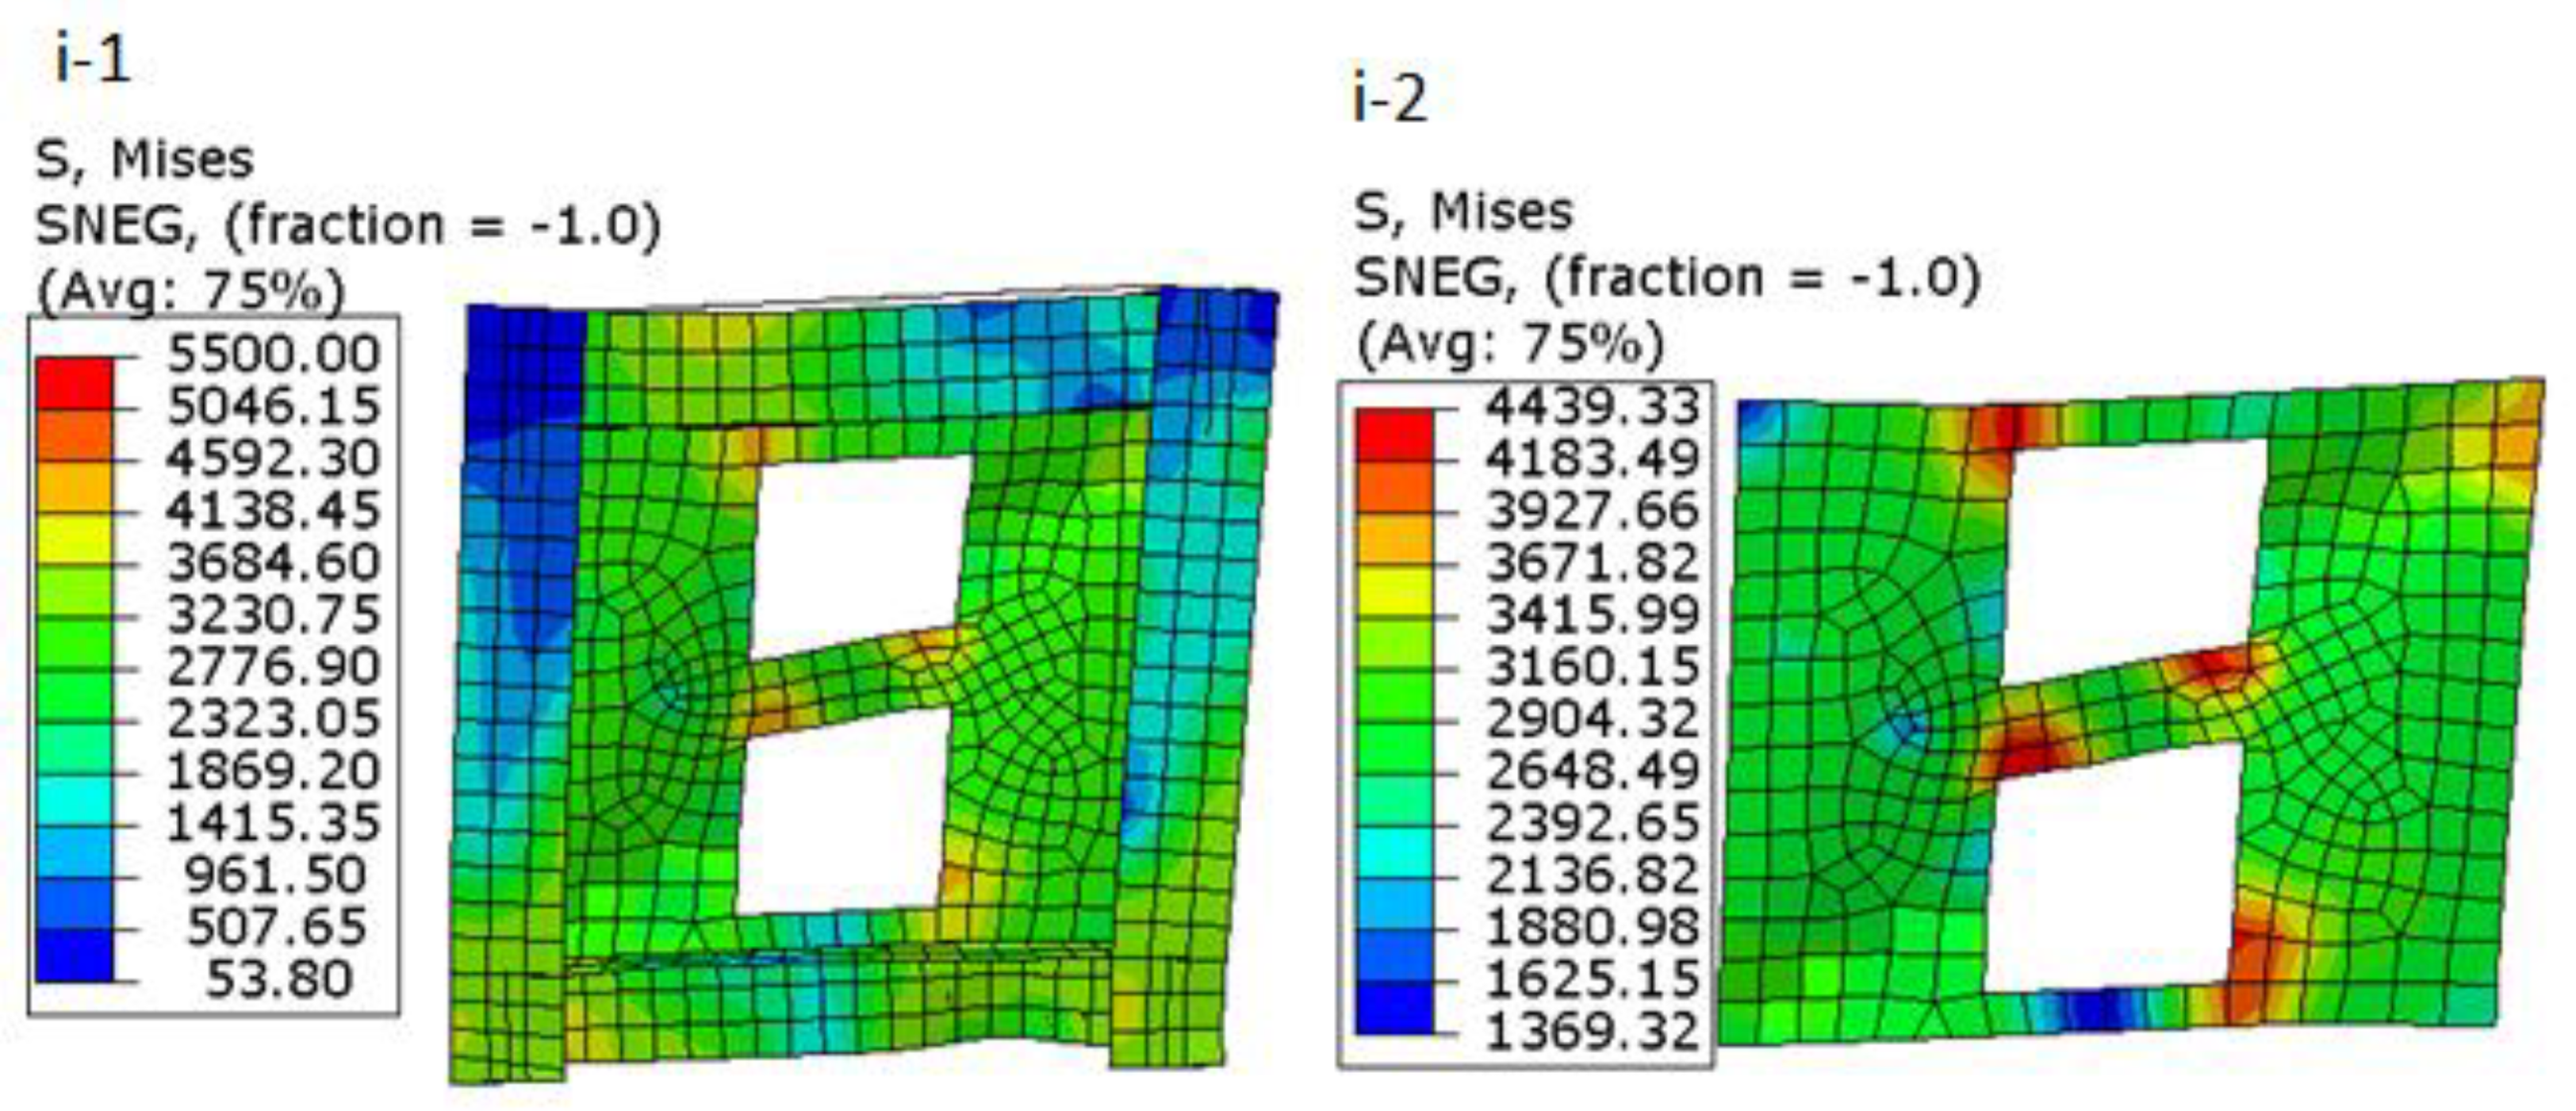
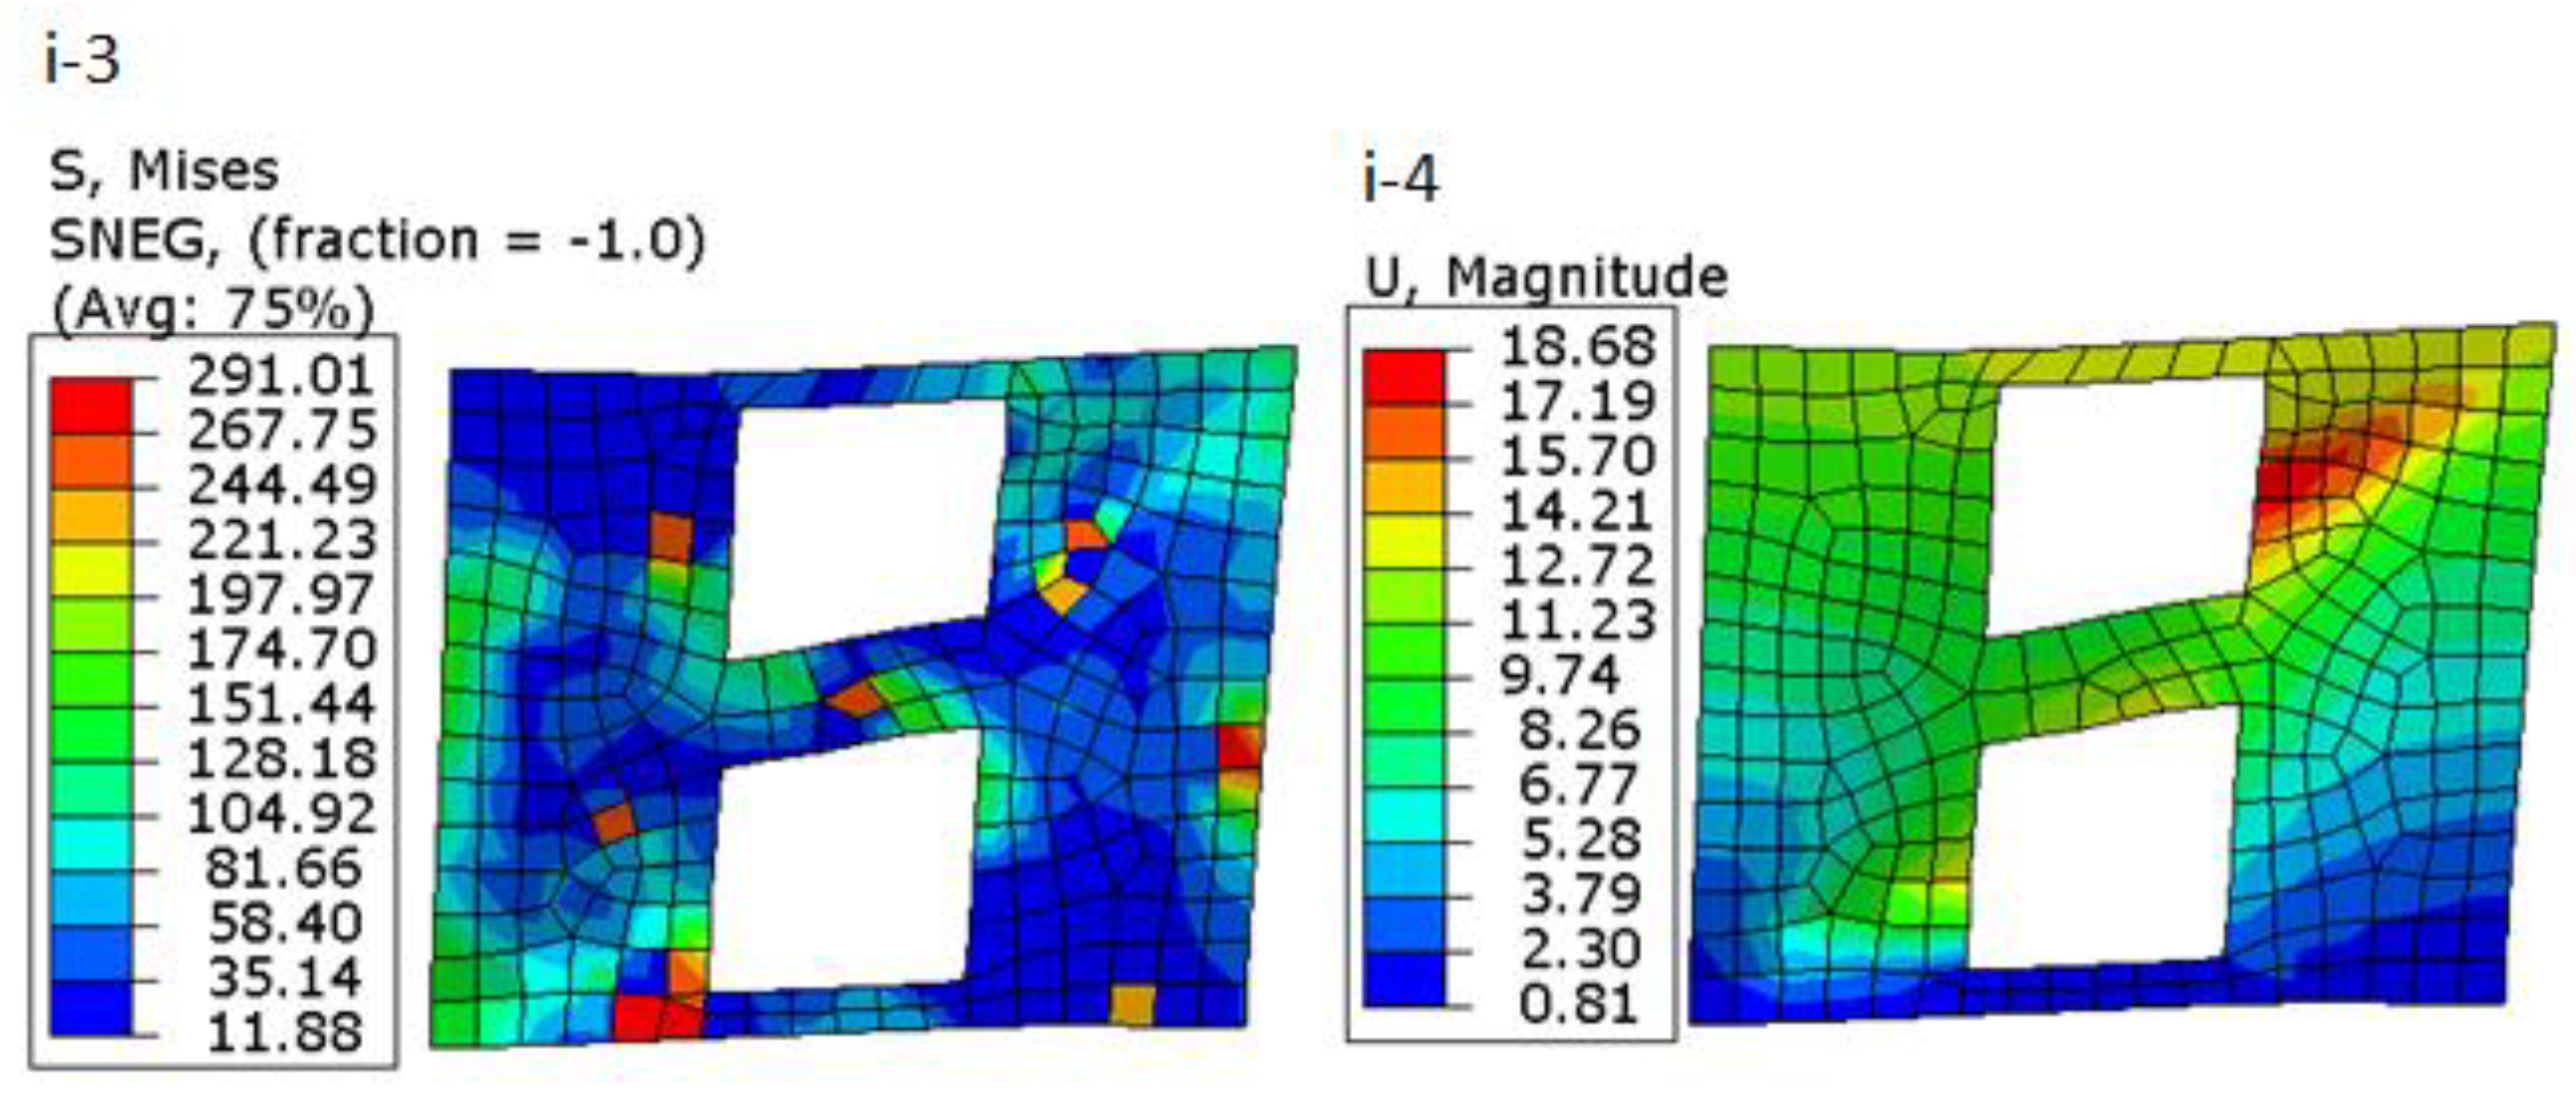
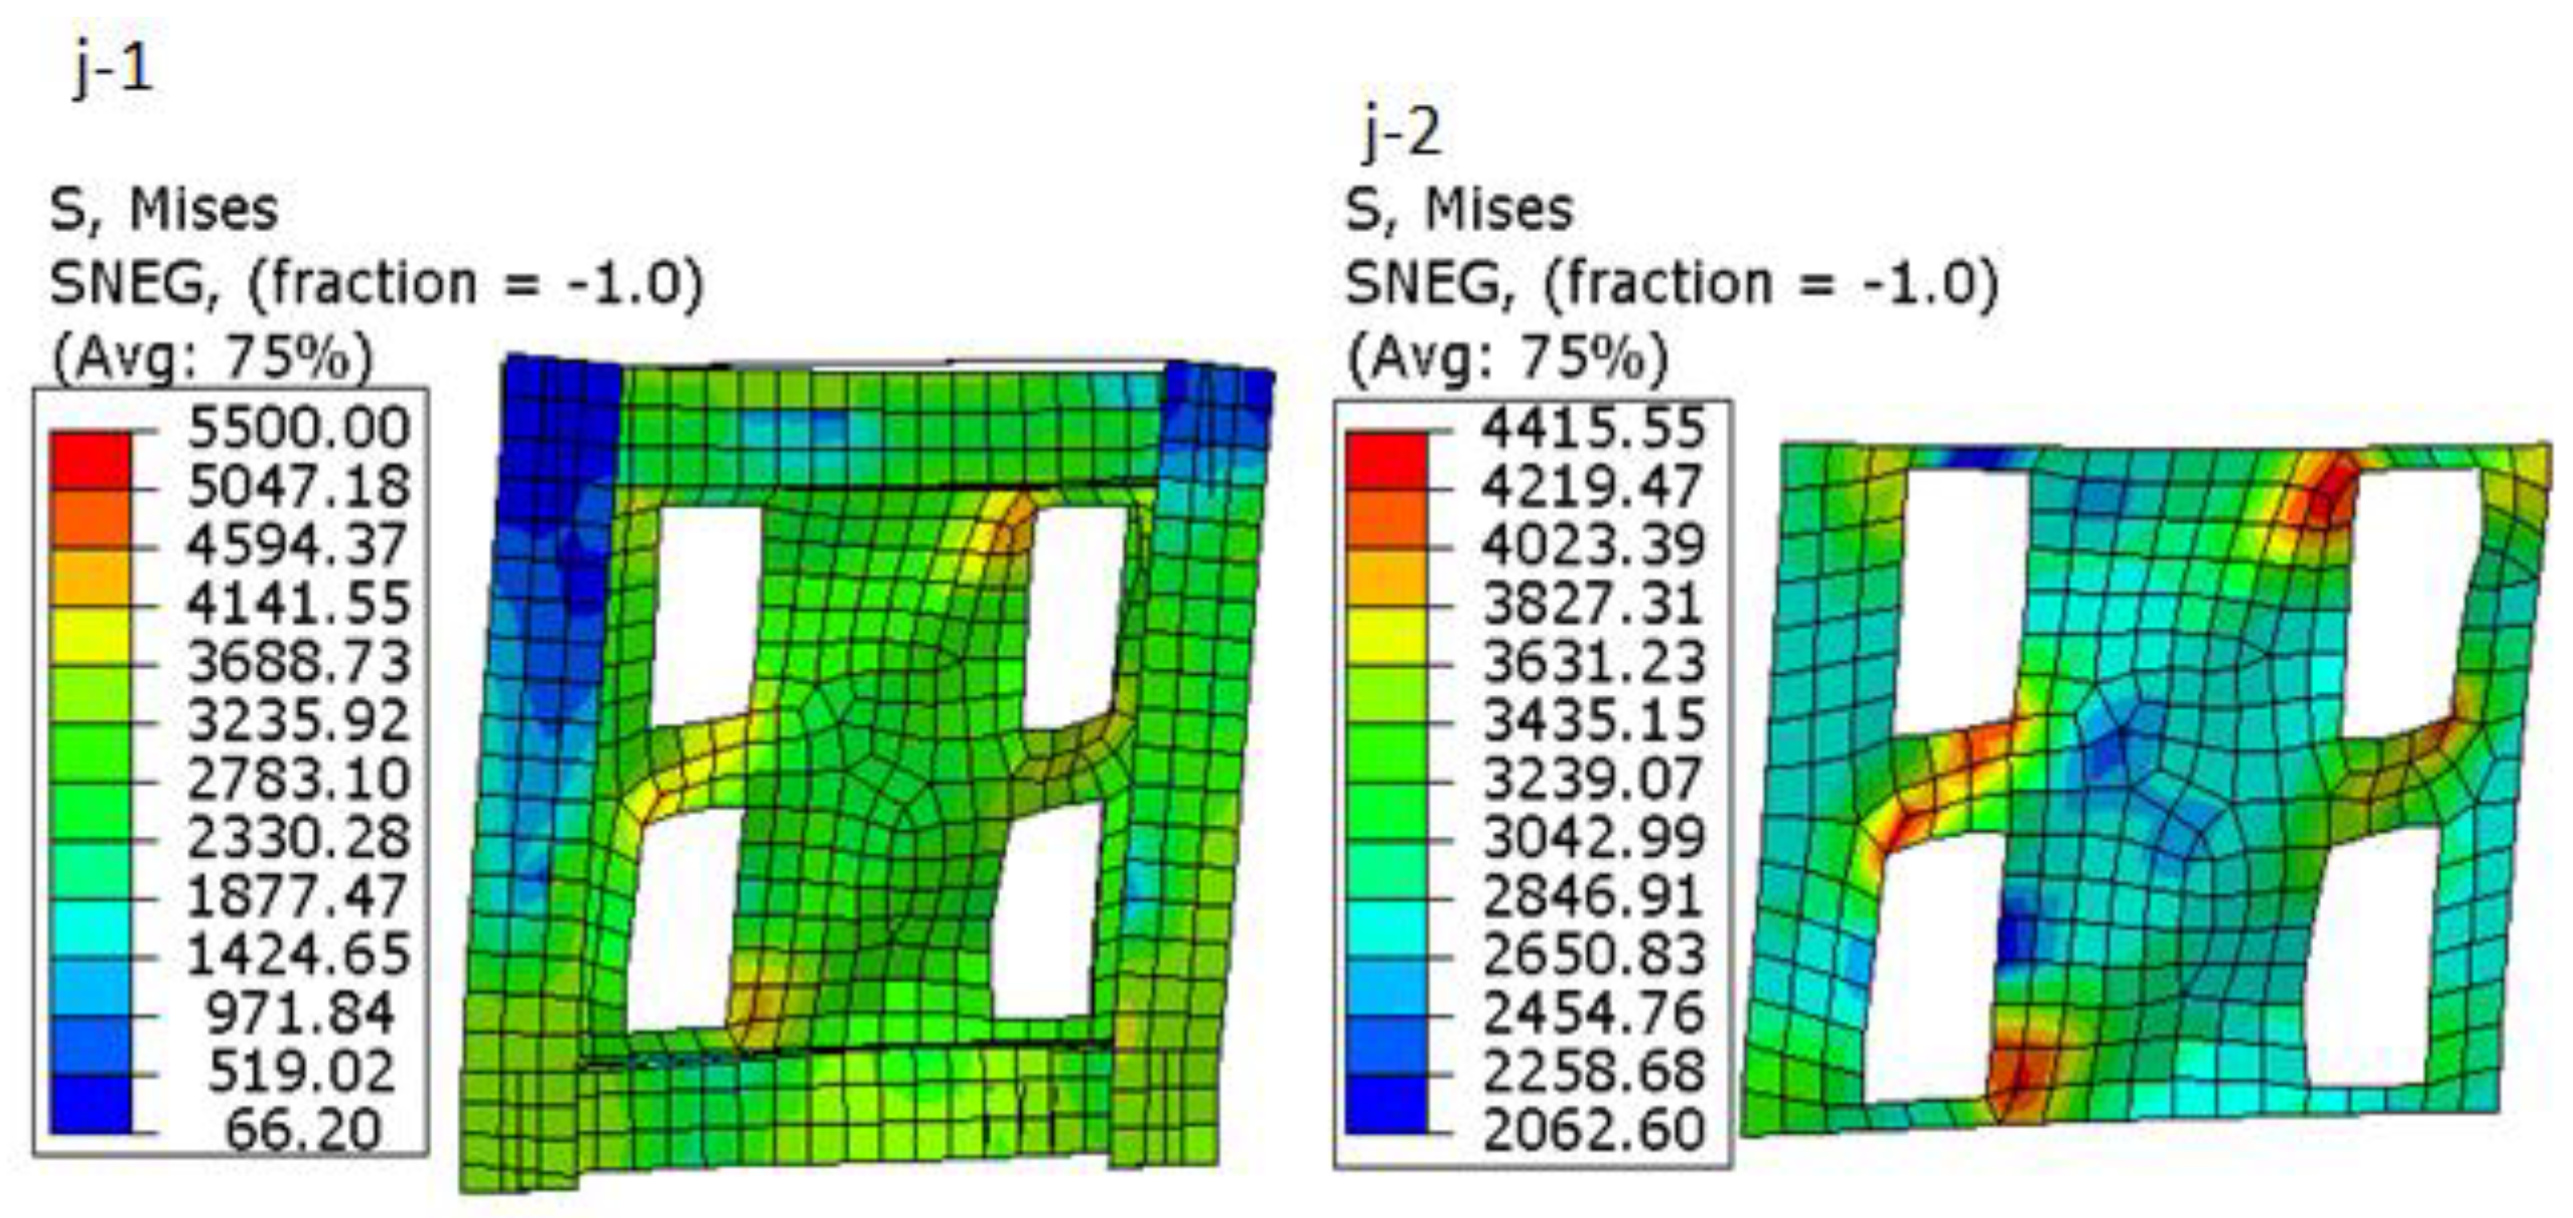
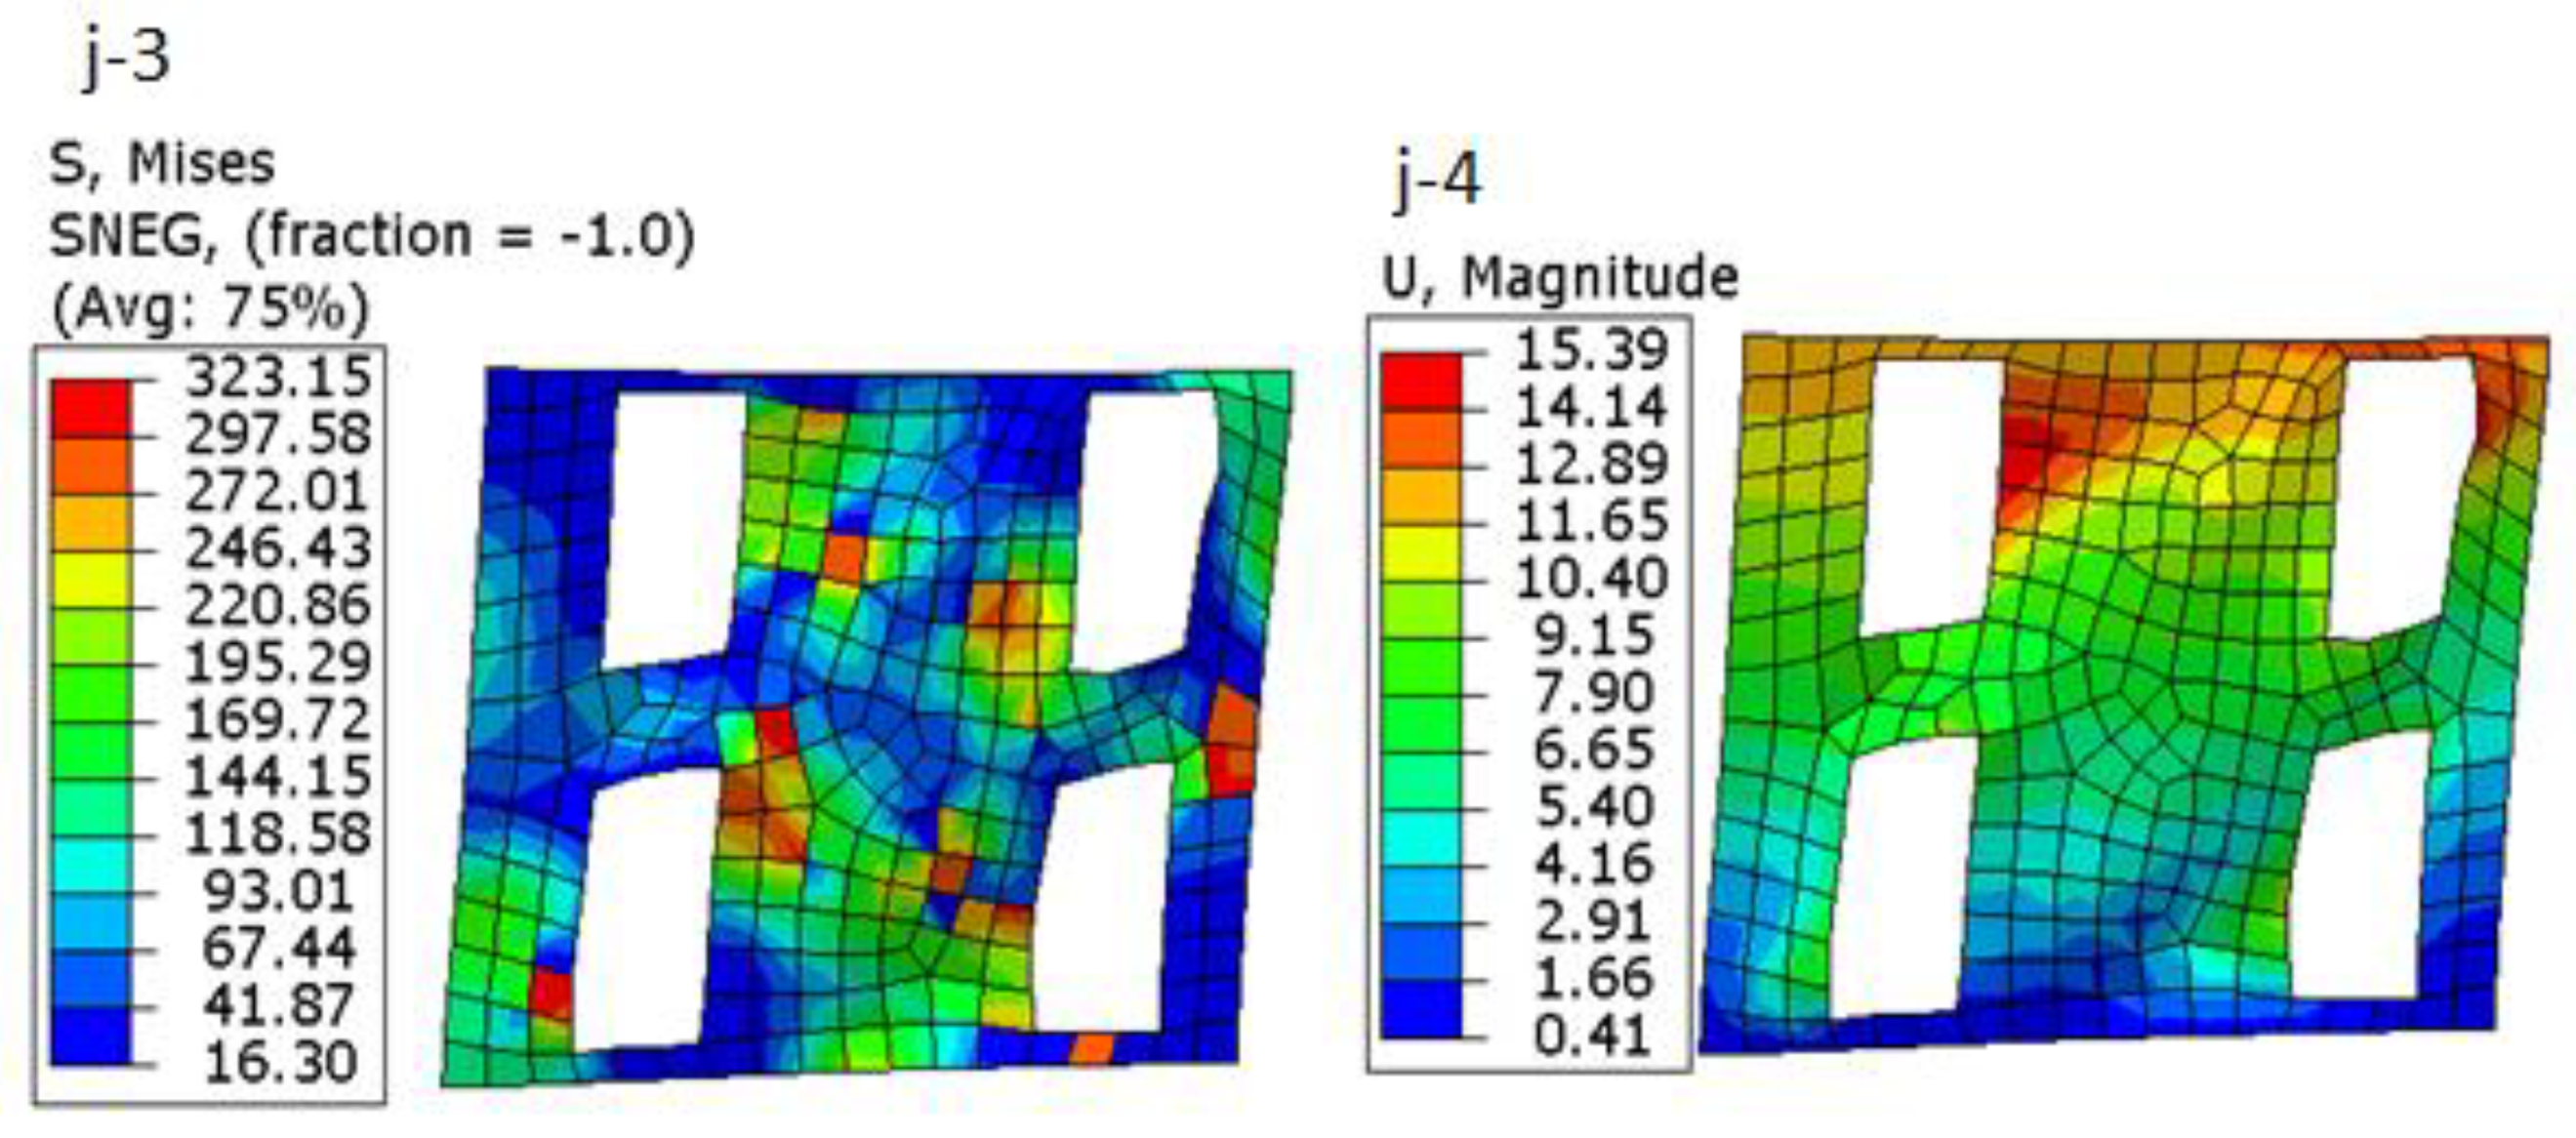
- Figure 26 and Figure 27 illustrates the maximum stress around the opening in specimens with horizontal openings (model i) and vertical openings was 443 MPa and 445 MPa, respectively, while this value was 430 MPa for specimen with a single opening, showing differences of 3% and 4% with the specimen with a single opening.
- The ratios of the maximum stress around the openings to the minimum stress for horizontal and vertical openings were 9.26% and 6.74%, respectively, signifying more uniform stress distribution around vertical openings.
- In both specimens, the formation of the diagonal field has been subject to interference.
- Figure 23, Figure 25, Figure 27, Figure 29 and Figure 31 show that the average of maximum stress in the concrete plate in specimens is 29.4 MPa, which shows the maximum stress decrease in model (g) as compared to other models in this group because the stiffness of the shear wall decreases with a large single opening and the concrete panel cannot use its maximum capacity.
4.3. Average of Steel Stress
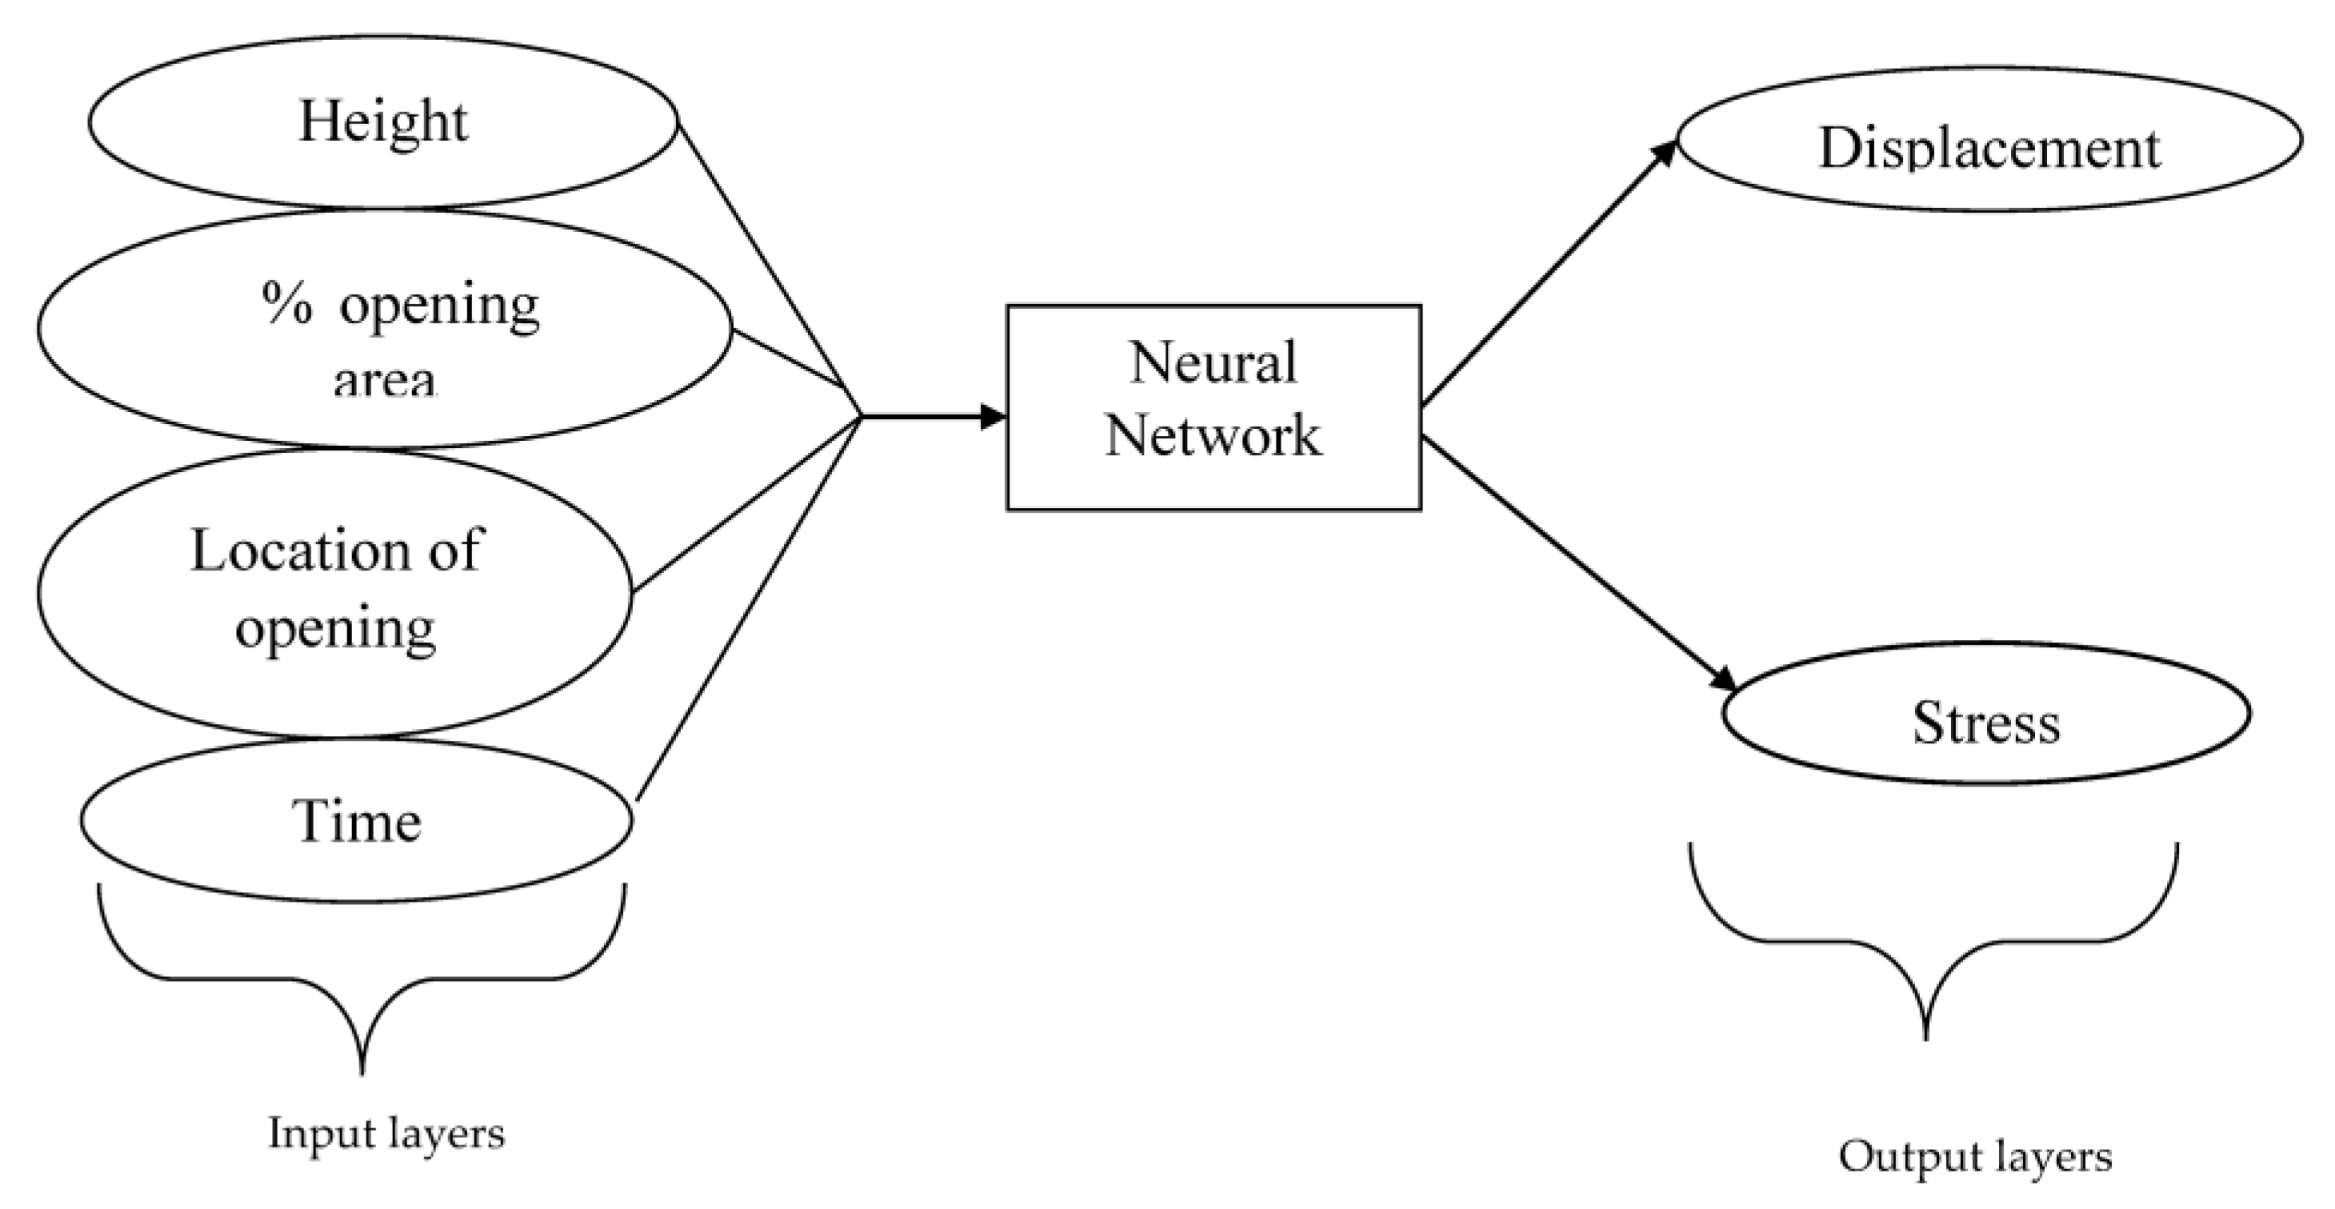
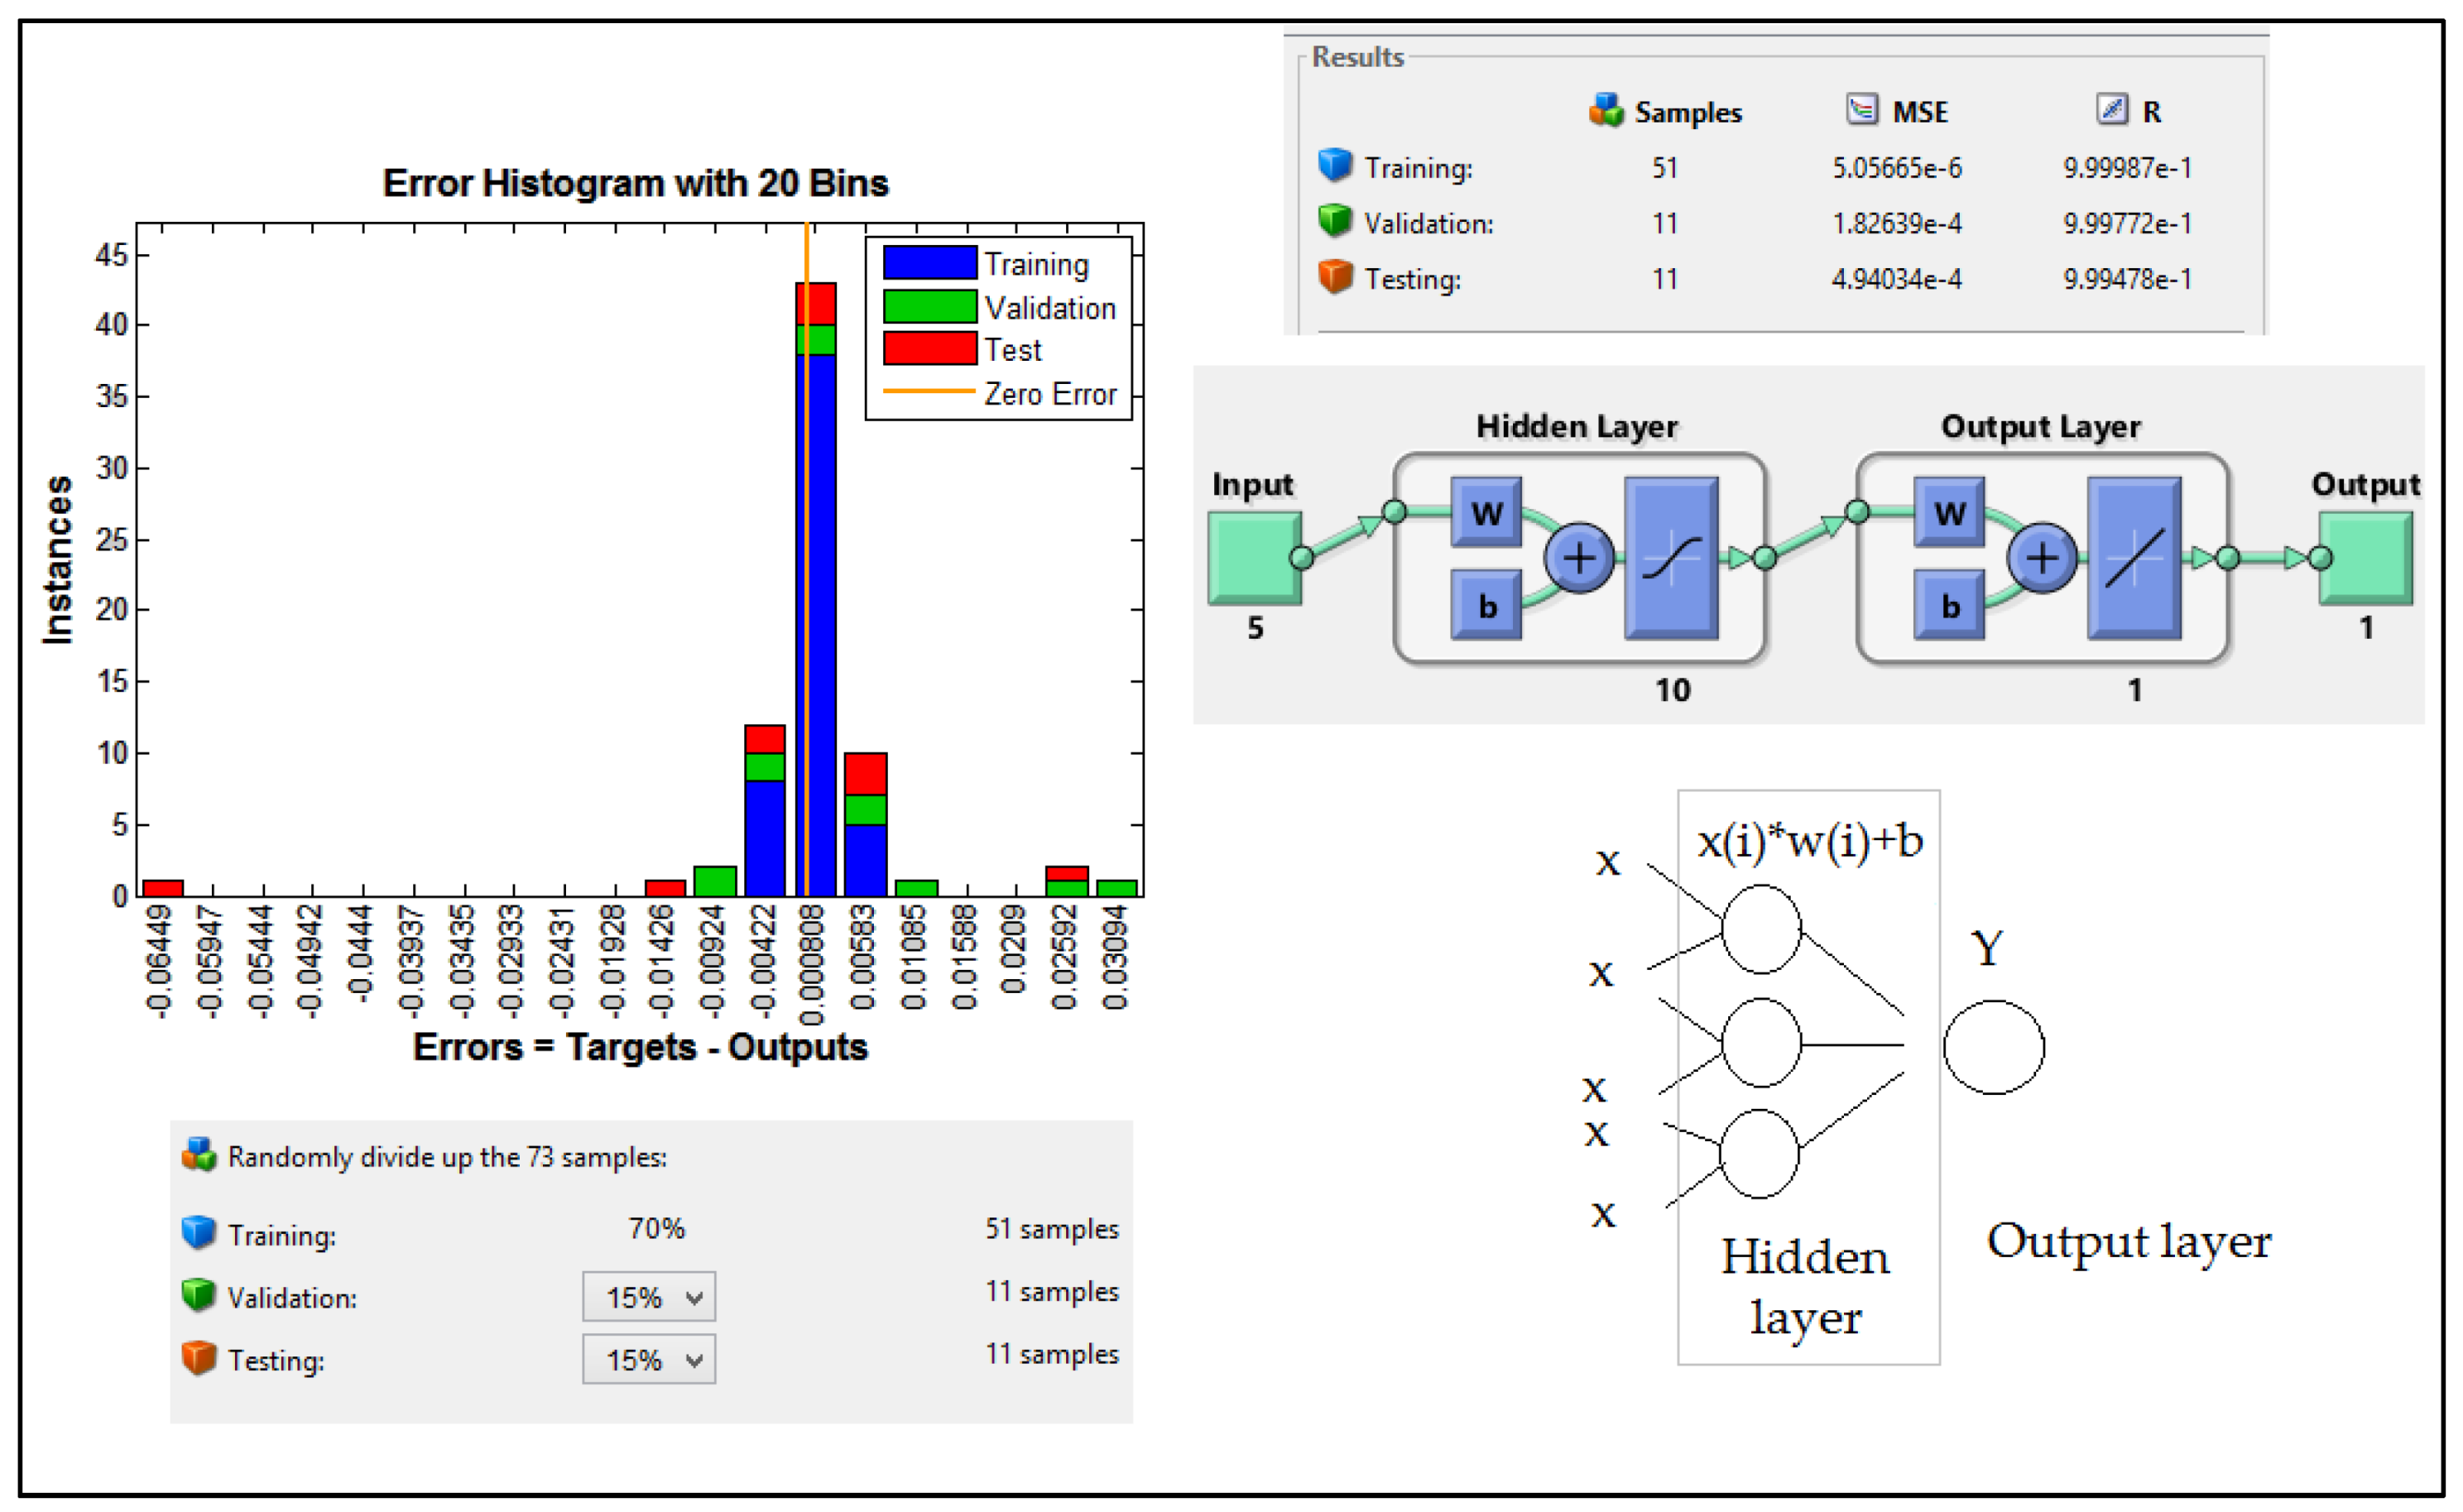
4.4. Modelling with Artificial Neural Networks
4.4.1. Accuracy of Predicted Methods
4.4.2. Prediction of the Surface of Stress and Displacement
5. Discussion and Conclusions
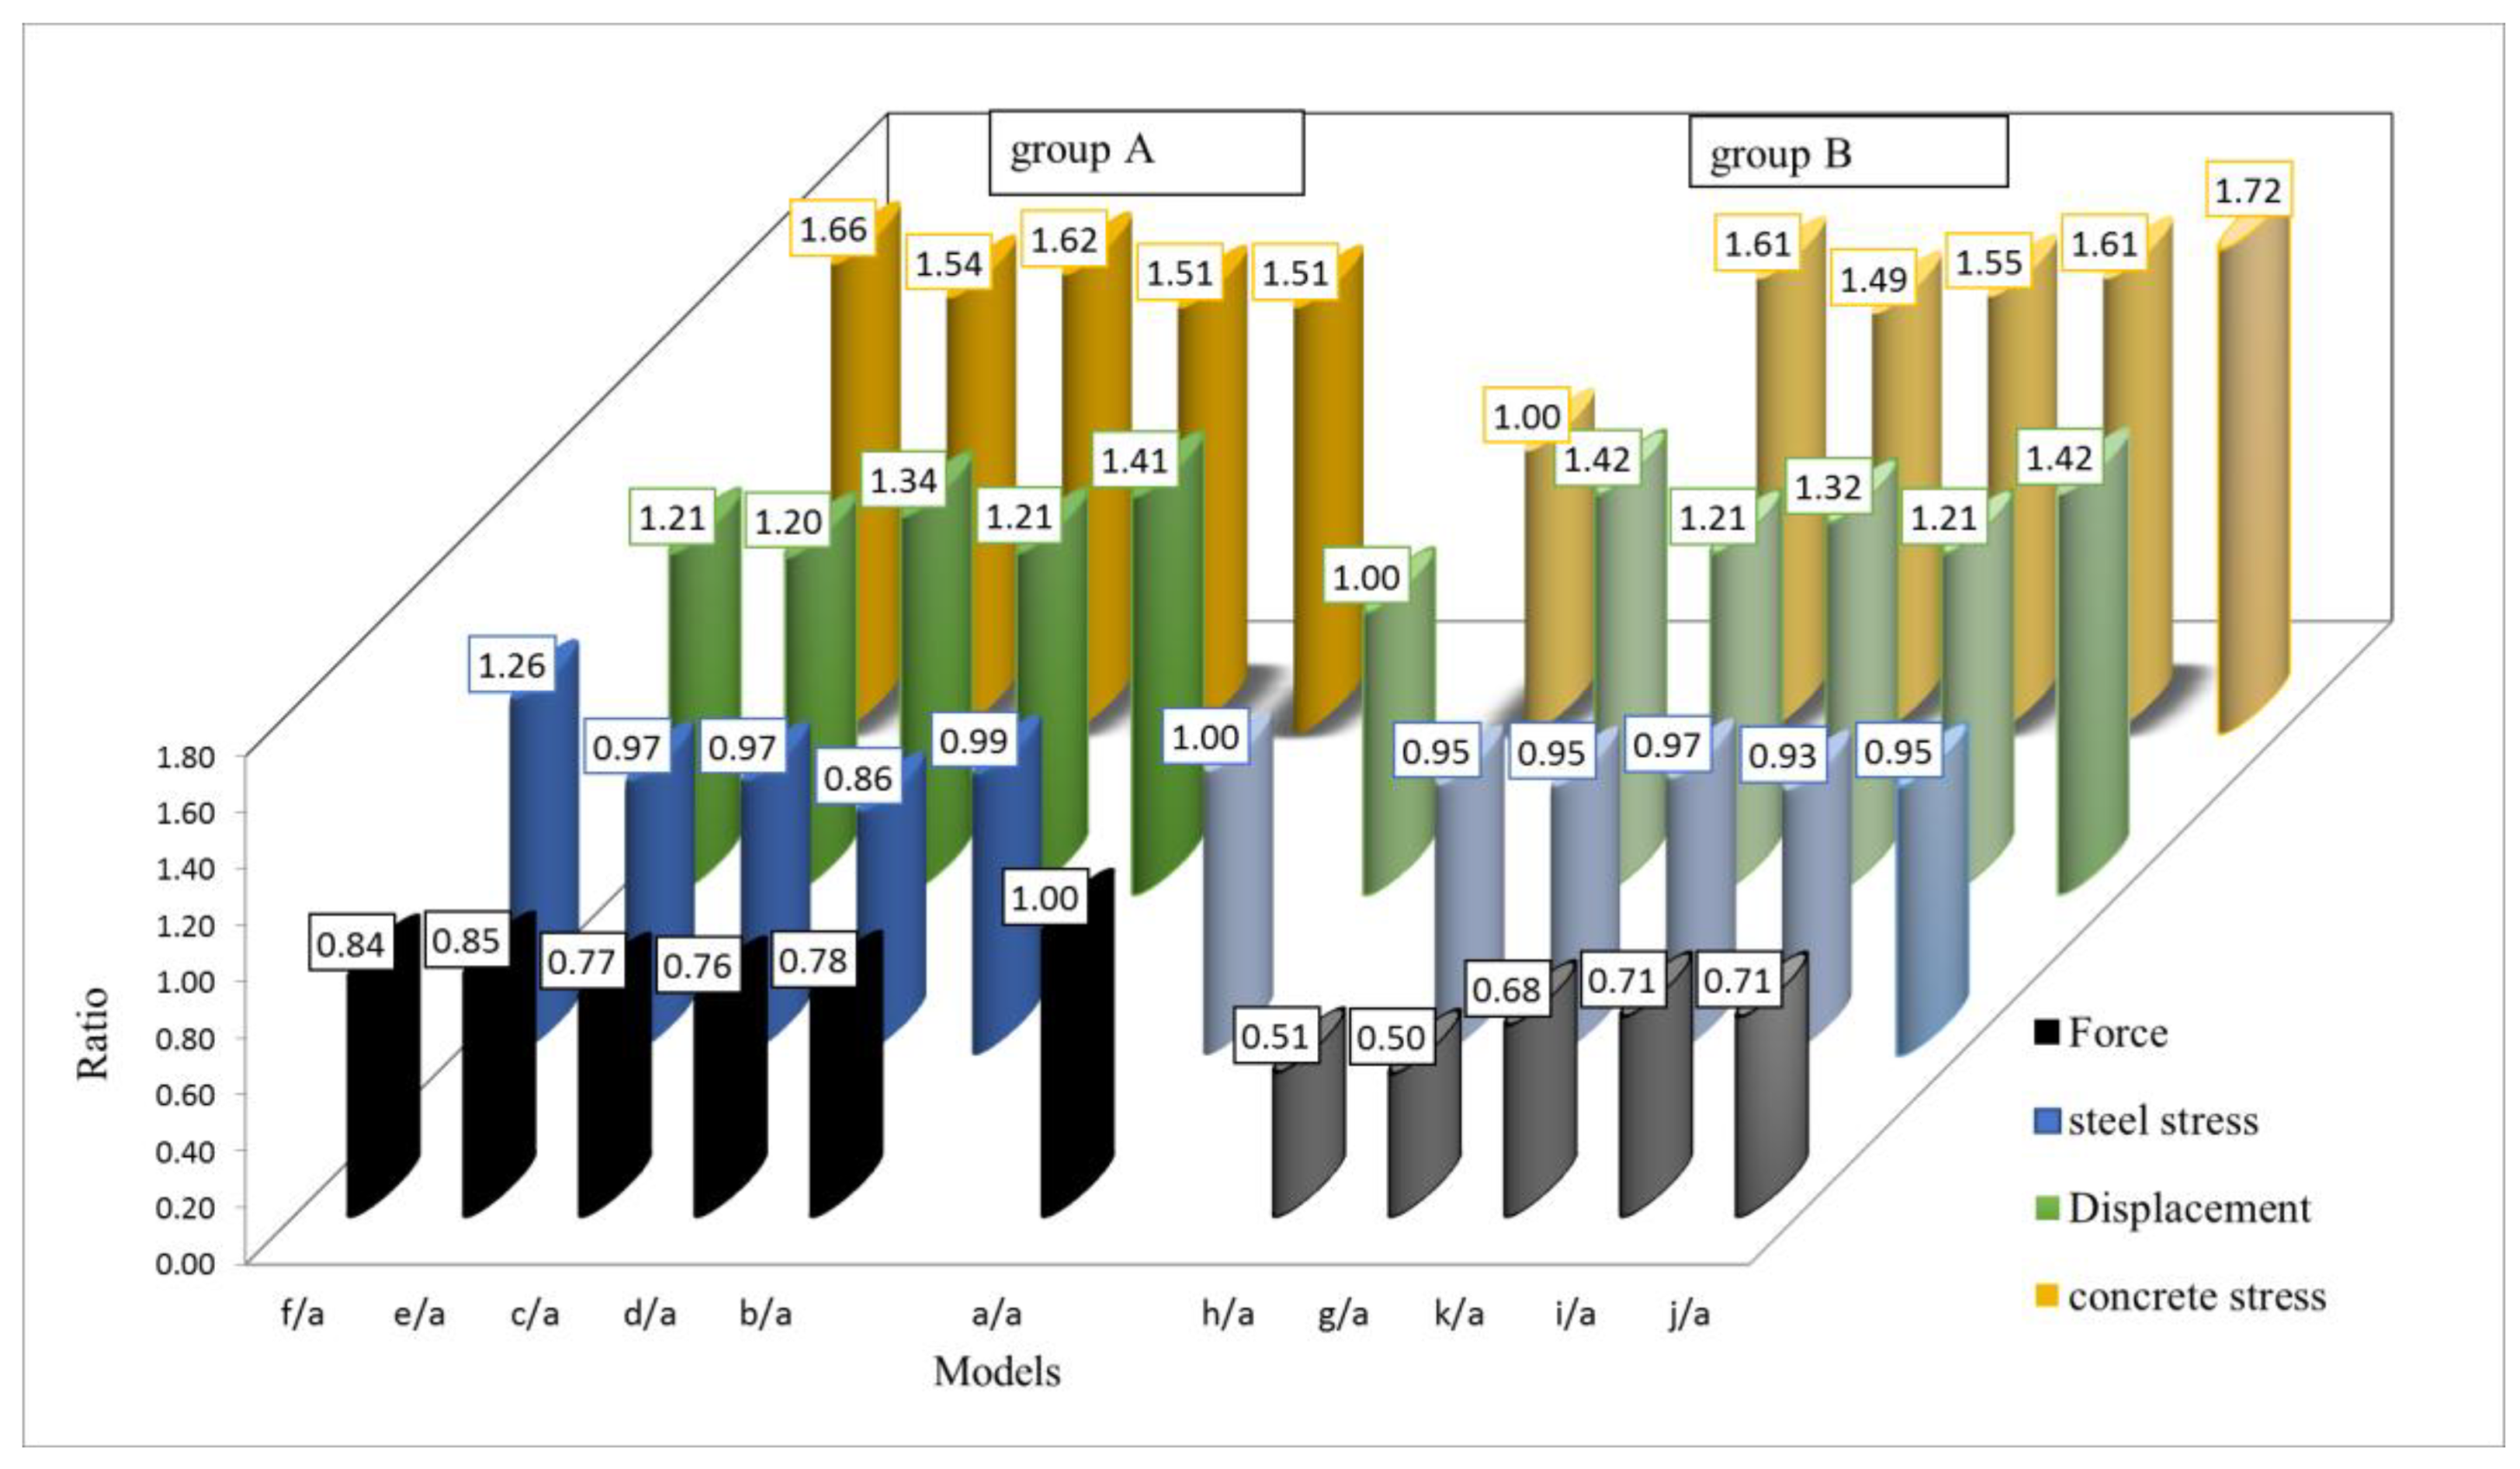
- By creating openings, the strength and stiffness of the composite shear wall decrease and the opening position affects the reduction level in the wall stiffness, such that the stiffness reduction is larger than 20% when the openings move nearer to the boundary beams as compared to the case where openings are placed near the columns. Moreover, out of displacement is 25% lower when the openings move near to the boundary beam as compared to the state where openings are placed near the column. Compared to these two cases (c and d), the performance of central opening is near to the case b (opening near to the beam), but the maximum stress in concrete panels in case (c) is more than others.
- In group A, by transforming a single opening to four equivalent openings with an overall area equal to the initial one, the strength and stiffness of the wall increase by 7% and steel stress increases by 36%. However, as compared to these two cases (c and b), the overall displacement decreases by 11%.
- Compared to specimens with openings near the beams or columns, stress distribution was more favorable in specimen with central opening.
- Stress concentration is intensified as the opening position approaches the beam or column.
- In summary, changing the location of openings has strong influence on the steel shear wall performance, steel stress, concrete panel, and displacement.
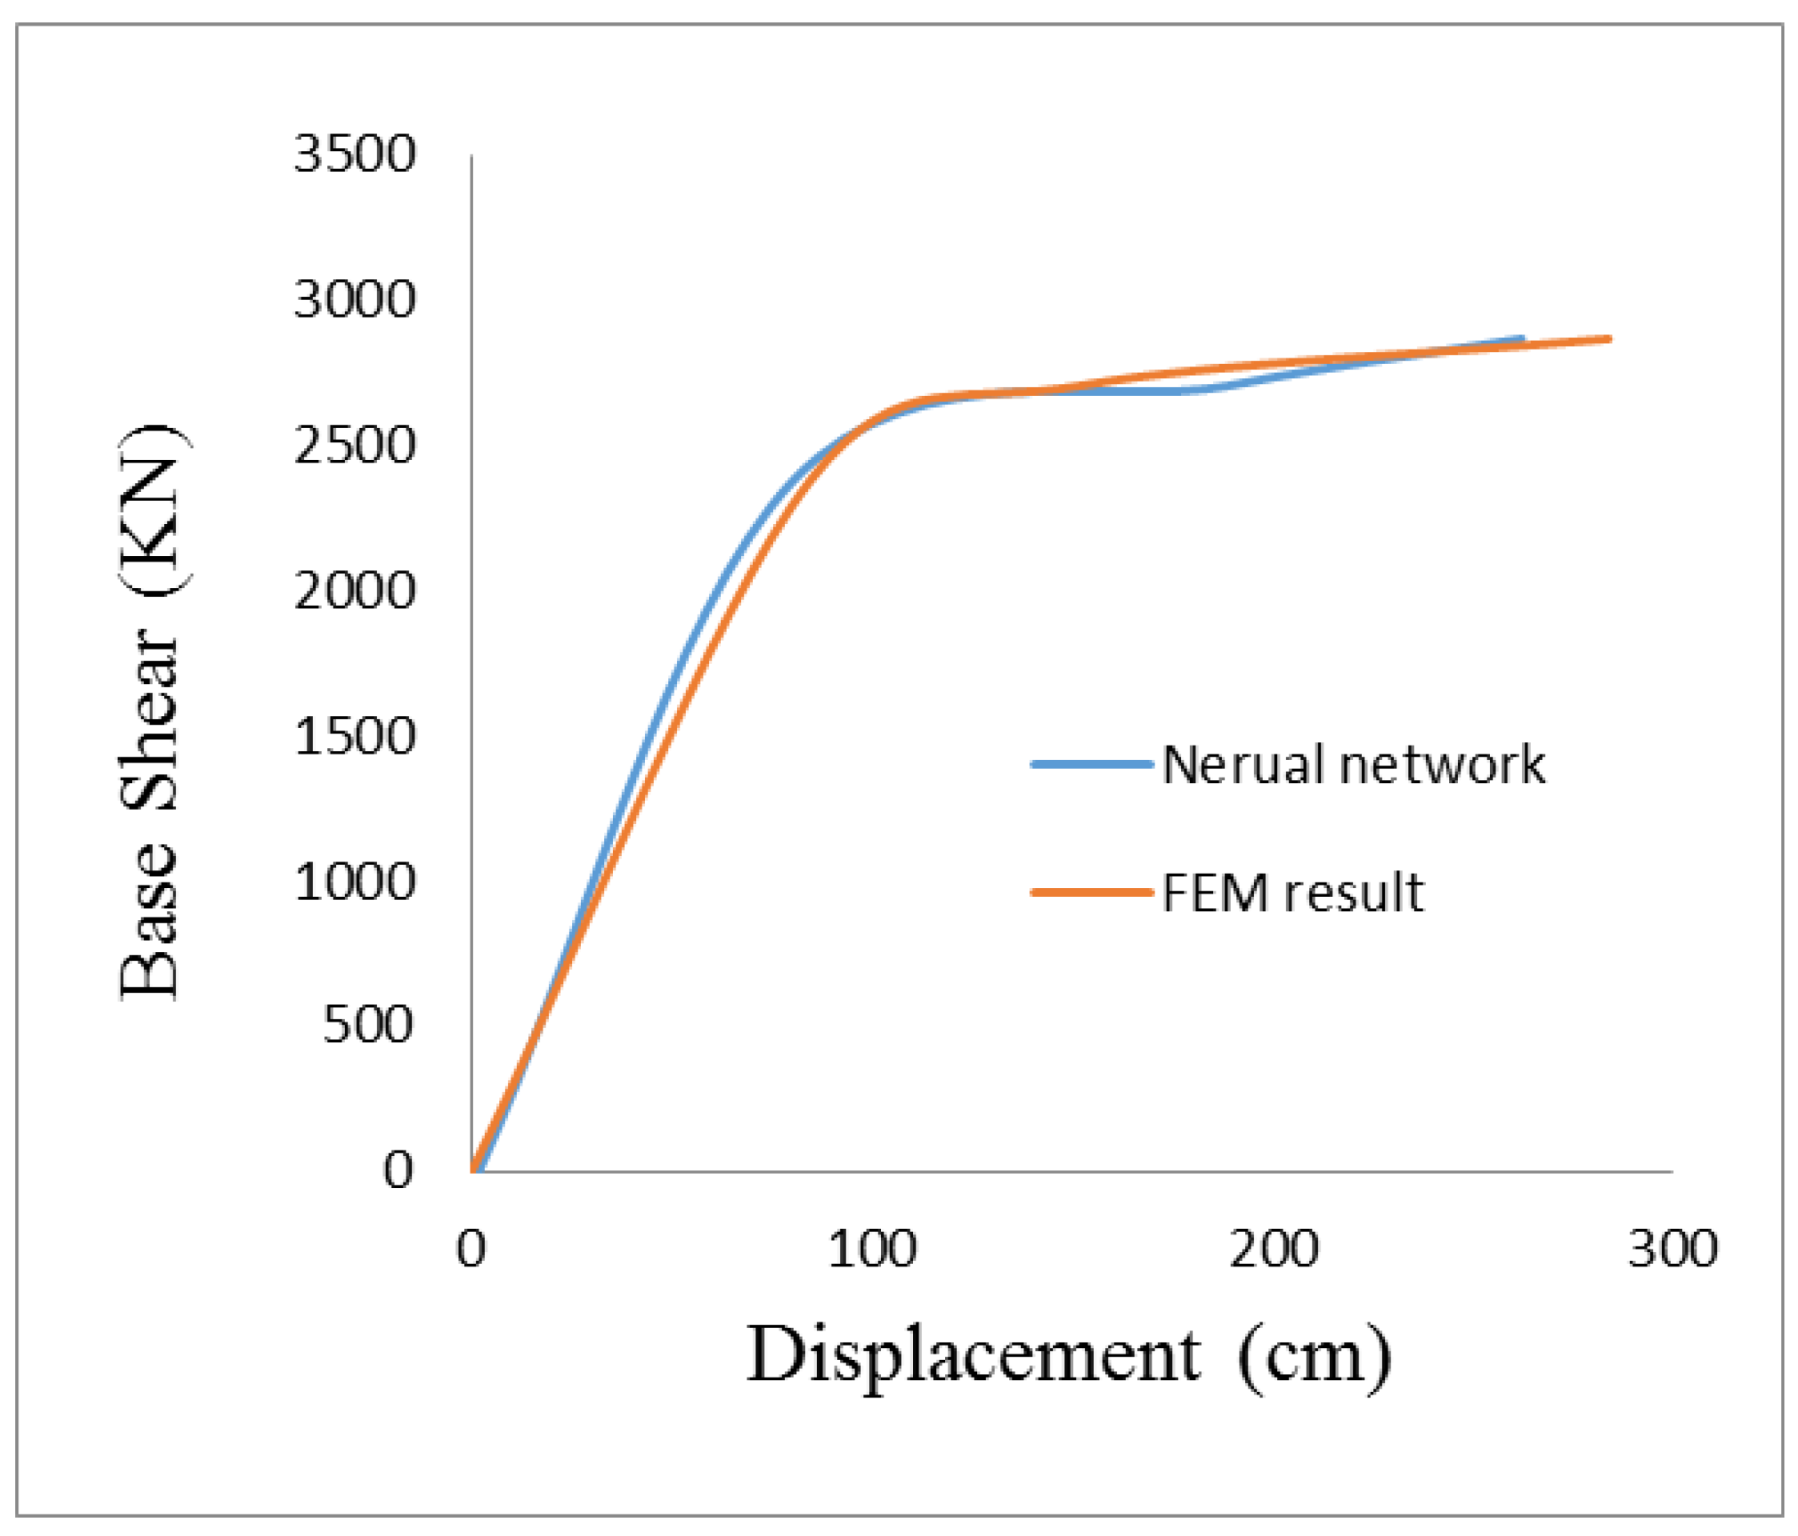
- By increasing opening’s size, the strength and stiffness of the composite shear wall decrease, and the opening position affects the reduction level in the wall stiffness, such that the average of stiffness reduction is 60% for group B, however this value is 80% for group A. Steel stress, displacement and concrete stress are similar to the state where the opening size is 10%. As clearly shown in the neural network result (Figure 23, Figure 24, Figure 25, Figure 26 and Figure 27) and FEM result, the variation of strength and stiffness are 0.39% for the case where opening size is 36%; however, this value is 11% for the case where opening size is 10%. Therefore, as compared to specimens in group A, strength and stiffness variation is more intense for models in group B and changing opening place and opening size has strong influence on the composite shear wall stiffness.
- A strength and stiffness reduction is more intense for the case where horizontal openings are created instead of vertical openings.
- In group B, by moving openings near to the beam, the strength and stiffness of the wall increase 39% as compared to the central opening and this action does not have any fundamental impact on the steel and concrete stress. Therefore, this model has the best performance in this group, because the opening is near to the diagonal pattern and model g has the worst performance as compared to others due to its opening location.
- Displacement is lower in the case where openings are distributed in the plate (models f, e, g, and k) as compared to other models.
- Strength and stiffness increment is more intense in the case where openings are distributed in the plate (models f, e, g, and k).
- Compared to specimens with two openings (model i), stress was more conveniently distributed in specimens with a single opening (model g). This distribution is more uniform in the case of vertical openings (model i) as compared to horizontal cases (model h).
- The factors responsible for changing the wall stiffness, which are also observed in the load-displacement diagram, include the change in the stress distribution pattern in the wall, the commence of plastic yielding in some points in the wall, or the extreme increase in their numbers, which ultimately extend to the critical area such as the column base and/or the connection of the beams and columns, buckling, and corrugation in the steel plate.
- The results show that the neural network was successful in learning the relationship between the different input parameters and outputs. R value obtained for each output was higher than 90% and the ANN model was able to predict the properties of composite shear wall.
Author Contributions
Conflicts of Interest
References
- Astaneh-Asl, A. Seismic Behavior and Design of Composite Steel Plate Shear Walls; Structural Steel Educational Council: California, CA, USA, 2002. [Google Scholar]
- Armaghani, A.; Nalousi, J. The stiffness and ductility of composite shear wall with concrete layer in comparison with steel shear wall. In Proceedings of the 2nd National Conference of Iran on Concrete, Bandar Abbas, Iran, 15–16 February 2018. [Google Scholar]
- Rahai, A.; Hatami, F. Evaluation of composite shear wall behavior under cyclic loadings. J. Constr. Steel Res. 2009, 65, 1528–1537. [Google Scholar] [CrossRef]
- Arabzadeh, A.; Ahmadi, H. Evaluating the effects of distance between bolts on the behavior of composite steel shear wall. Civ. Eng. 2012, 14, 145–159. [Google Scholar]
- Sabouri-Ghomi, S.; Ahouri, E.; Sajadi, R.; Alavi, M.; Roufegarinejad, A.; Bradford, M.A. Stiffness and strength degradation of steel shear walls having an arbitrarily-located opening. J. Constr. Steel Res. 2012, 79, 91–100. [Google Scholar] [CrossRef]
- Hosseinzadeh, S.; Tehranizadeh, M. Introduction of stiffened large rectangular openings in steel plate shear walls. J. Constr. Steel Res. 2012, 77, 180–192. [Google Scholar] [CrossRef]
- Mosoarca, M. Failure analysis of RC shear walls with staggered openings under seismic loads. Eng. Fail. Anal. 2014, 41, 48–64. [Google Scholar] [CrossRef]
- Bhowmick, A.K.; Grondin, G.; Driver, R.G. Nonlinear Seismic Analysis of Perforated Steel Plate Shear Walls. J. Constr. Steel Res. 2014, 94, 103–113. [Google Scholar] [CrossRef]
- Bahrebar, M.; Kabir, M.Z.; Zirakian, T.; Hajsadeghi, M.; Lim, J.B.P. Structural performance assessment of trapezoidally-corrugated and centrally-perforated steel plate shear walls. J. Constr. Steel Res. 2016, 122, 584–594. [Google Scholar] [CrossRef]
- Naseri, F.; Jafari, F.; Mohseni, E.; Tang, W.; Feizbakhsh, A.; Khatibinia, M. Experimental observations and SVM-based prediction of properties of polypropylene fibres reinforced self-compacting composites incorporating nano-CuO. Constr. Build. Mater. 2017, 143, 589–598. [Google Scholar] [CrossRef]
- Ghanei, A.; Jafari, F.; Khotbehsara, M.M.; Mohseni, E.; Tang, W.; Cui, H. Effect of nano-CuO on engineering and microstructure properties of fibre-reinforced mortars incorporating metakaolin: Experimental and numerical studies. Materials 2017, 10, 1215. [Google Scholar] [CrossRef] [PubMed]
- Johari, A.; Javadi, A.A.; Najafi, H. A genetic-based model to predict maximum lateral displacement of retaining wall in granular soil. Sci. Iranica Trans. A Civ. Eng. 2016, 23, 54. [Google Scholar] [CrossRef]
- Tohidi, S.; Sharifi, Y. Inelastic lateral-torsional buckling capacity of corroded web opening steel beams using artificial neural networks. IES J. Part A Civ. Struct. Eng. 2015, 8, 24–40. [Google Scholar] [CrossRef]
- Koç, M.A.; Esen, İ.; Çay, Y. Tip Deflection Determination of a Barrel for the Effect of an Accelerating Projectile Before Firing Using Finite Element and Artificial Neural Network Combined Algorithm. Lat. Am. J. Solids Struct. 2016, 13, 1968–1995. [Google Scholar] [CrossRef]
- Lai, J.; Qiu, J.; Feng, Z.; Chen, J.; Fan, H. Prediction of soil deformation in tunnelling using artificial neural networks. Comput. Intell. Neurosci. 2016, 2016, 33. [Google Scholar] [CrossRef] [PubMed]
- The Mathworks Inc. Guide, MUS; The Mathworks Inc.: Natick, MA, USA, 1998; Volume 5, p. 333. [Google Scholar]
- Zhao, Q.; Astaneh-Asl, A. Cyclic behavior of traditional and innovative composite shear walls. J. Struct. Eng. 2004, 130, 271–284. [Google Scholar] [CrossRef]
- Khosravi, H.; Mousavi, S.; Tadayonfar, G. Numerical study of seismic behavior of Composite Steel Plate Shear Walls with flat and corrugated plates. Rev. Constr. 2017, 16, 249–260. [Google Scholar] [CrossRef]
- Hibbitt, Karlsson, & Sorensen, Inc. Abaqus/Explicit: User’s Manual; Hibbitt, Karlsson & Sorensen: Farmington Hills, MI, USA, 1998; Volume 1. [Google Scholar]
- Tavakoli, H.R.; Omran, O.L.; Kutanaei, S.S. Prediction of energy absorption capability in fiber reinforced self-compacting concrete containing nano-silica particles using artificial neural network. Lat. Am. J. Solids Struct. 2014, 11, 966–979. [Google Scholar] [CrossRef]
- Rosenblatt, F. The perceptron: A probabilistic model for information storage and organization in the brain. Psychol. Rev. 1958, 65, 386. [Google Scholar] [CrossRef] [PubMed]
- Khotbehsara, M.M.; Miyandehi, B.M.; Naseri, F.; Ozbakkaloglu, T.; Jafari, F.; Mohseni, E. Effect of SnO2, ZrO2, and CaCO3 nanoparticles on water transport and durability properties of self-compacting mortar containing fly ash: Experimental observations and ANFIS predictions. Constr. Build. Mater. 2018, 158, 823–834. [Google Scholar] [CrossRef]
- ASM International. ASM Metals Reference Book, 3rd ed.; Michael, B., Ed.; ASM International: Materials Park, OH, USA, 1993. [Google Scholar]


| Plate Thickness | Thickness | Rebar Diameter | Rebar Spacing | Reinforcement Ratio | Beam Section | Column Section |
|---|---|---|---|---|---|---|
| 4.8 mm | 76 mm | 10 mm | 102 mm | 0.92% | W12*26 | W12*120 |
| Data Set | Accuracy Parameters | Relationship | |
|---|---|---|---|
| Displacement | 0.99 | Y = 1.0019x − 0.063 | |
| RRMSE | 0.003 | ||
| Concrete stress | 0.98 | Y = 0.99x − 0.0348 | |
| RRMSE | 0.0024 | ||
| Steel stress | 0.99 | Y = 0.99x + 110.24 | |
| RRMSE | 0.0058 | ||
| Force | 0.90 | Y = 0.85x + 328.54 | |
| RRMSE | 0.0048 | ||
© 2018 by the authors. Licensee MDPI, Basel, Switzerland. This article is an open access article distributed under the terms and conditions of the Creative Commons Attribution (CC BY) license (http://creativecommons.org/licenses/by/4.0/).
Share and Cite
Badarloo, B.; Jafari, F. A Numerical Study on the Effect of Position and Number of Openings on the Performance of Composite Steel Shear Walls. Buildings 2018, 8, 121. https://doi.org/10.3390/buildings8090121
Badarloo B, Jafari F. A Numerical Study on the Effect of Position and Number of Openings on the Performance of Composite Steel Shear Walls. Buildings. 2018; 8(9):121. https://doi.org/10.3390/buildings8090121
Chicago/Turabian StyleBadarloo, Baitollah, and Faezeh Jafari. 2018. "A Numerical Study on the Effect of Position and Number of Openings on the Performance of Composite Steel Shear Walls" Buildings 8, no. 9: 121. https://doi.org/10.3390/buildings8090121
APA StyleBadarloo, B., & Jafari, F. (2018). A Numerical Study on the Effect of Position and Number of Openings on the Performance of Composite Steel Shear Walls. Buildings, 8(9), 121. https://doi.org/10.3390/buildings8090121