A Review of Performance Specifications and Studies of Trickle Vents


Abstract
1. Introduction
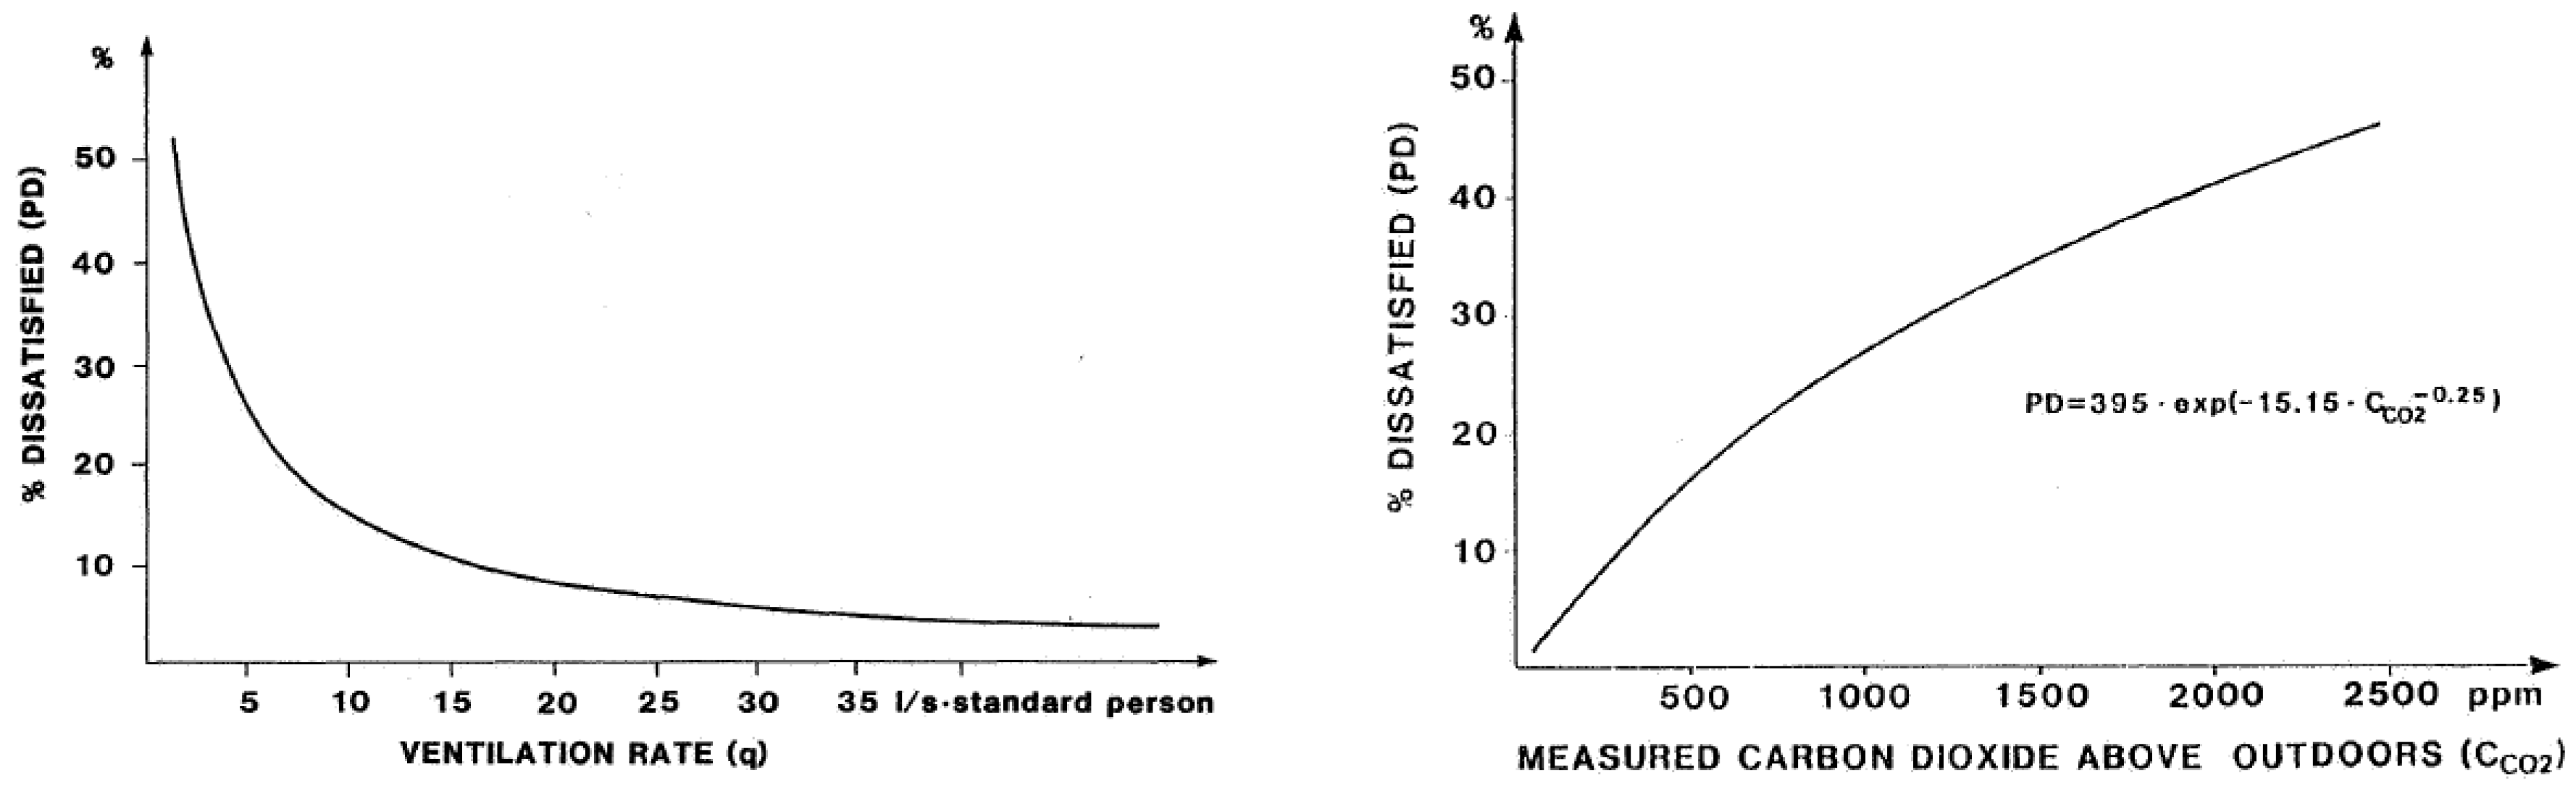
2. Ventilation Requirement
3. Natural Ventilation
3.1. Driving Forces in Natural Ventilation
3.1.1. Wind-Driven Ventilation
- ΔP: Pressure Difference Due to Wind (Pa);
- Cp: Pressure Coefficient;
- ρ: Air Density (kg/m3);
- ν: Wind Speed (m/s).
- Q: Air Flow Rate (m3/s);
- CD: Discharge Coefficient;
- A: Flow Area (m2);
- ΔP: Pressure Difference across the Opening;
- ρ: Air Density (kg/m3).
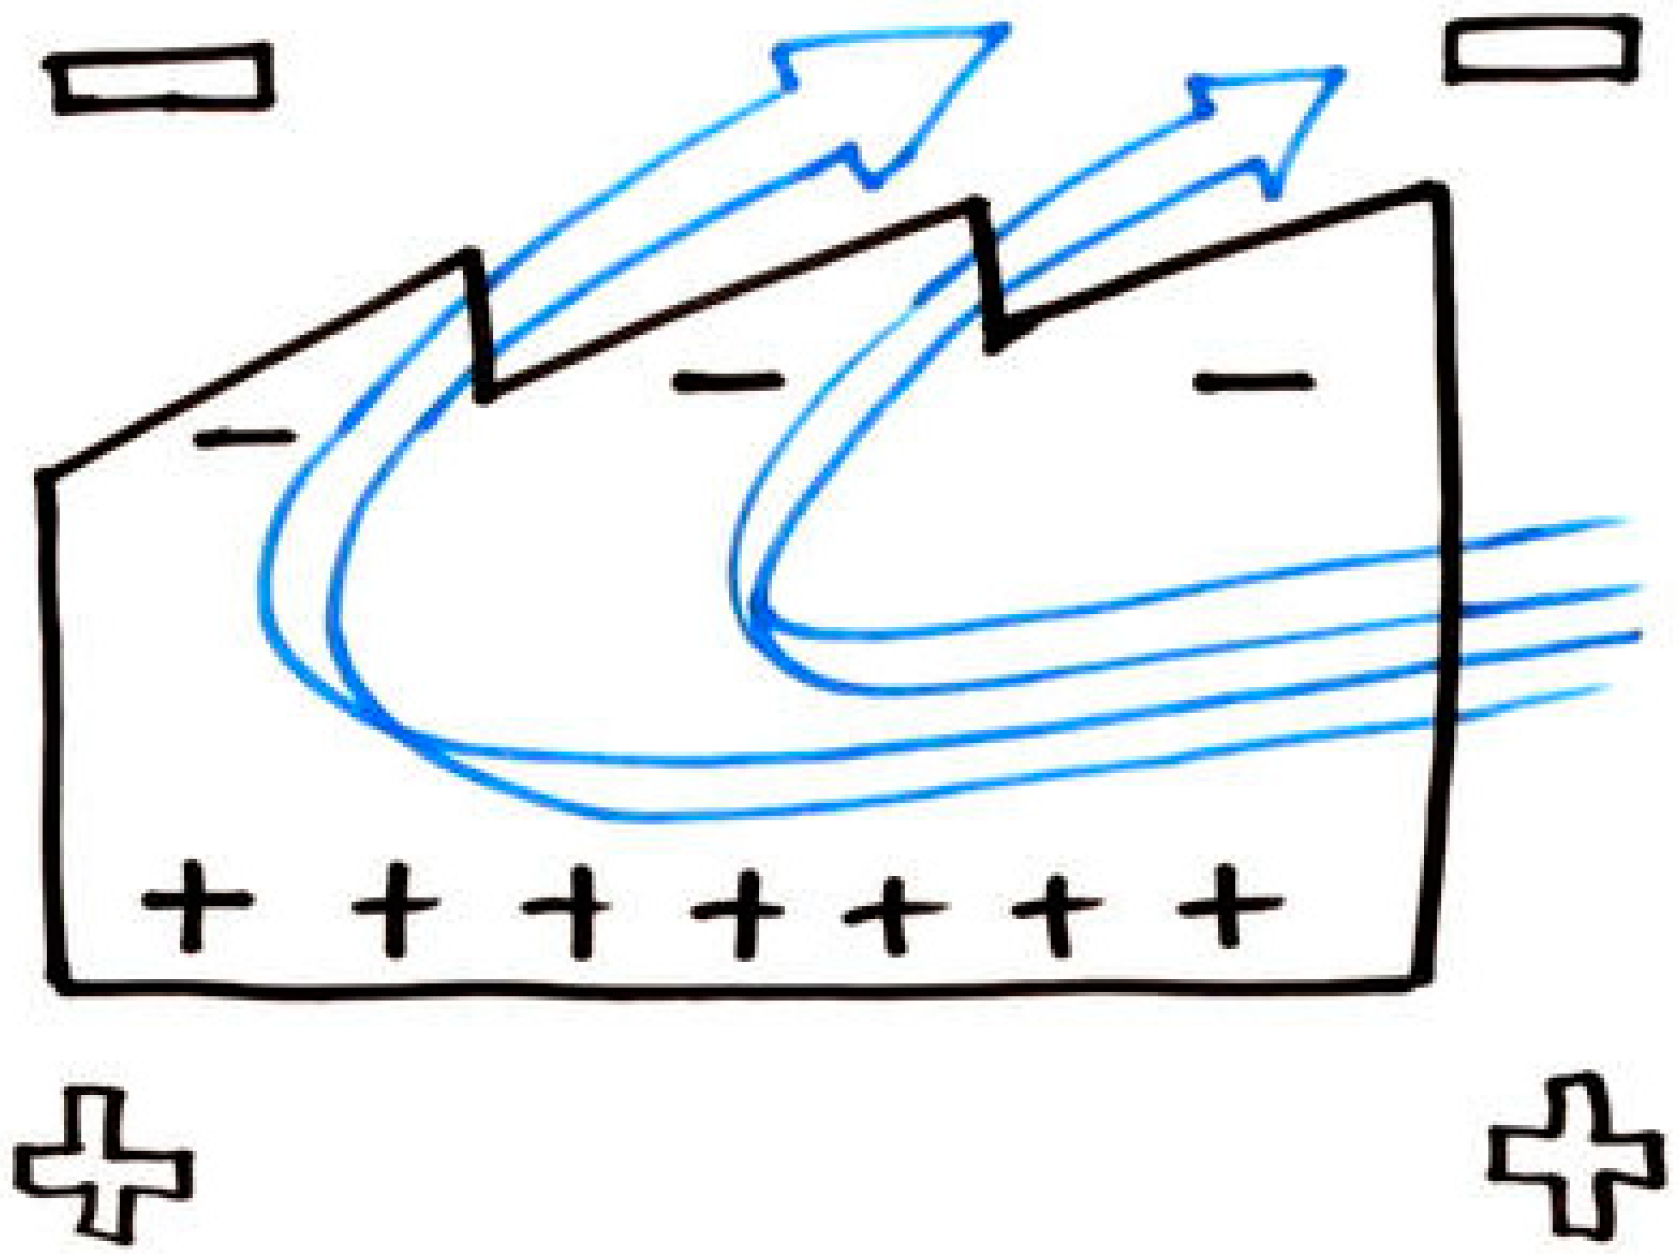
3.1.2. Buoyancy-Driven Ventilation
- ΔP: Pressure Difference due to Stack Effect (Pa);
- ρo: Outside air density (kg/m3);
- z: Height between two openings (m);
- g: gravity (m/s2).
3.2. Designs and Operation of Natural Ventilation
3.2.1. Single-Sided Ventilation
3.2.2. Cross-Flow Ventilation
3.2.3. Purge Ventilation
Shock Ventilation
Trickle Ventilation
3.2.4. Trickle Vents (Background Ventilators)
Classification according to Control Methods
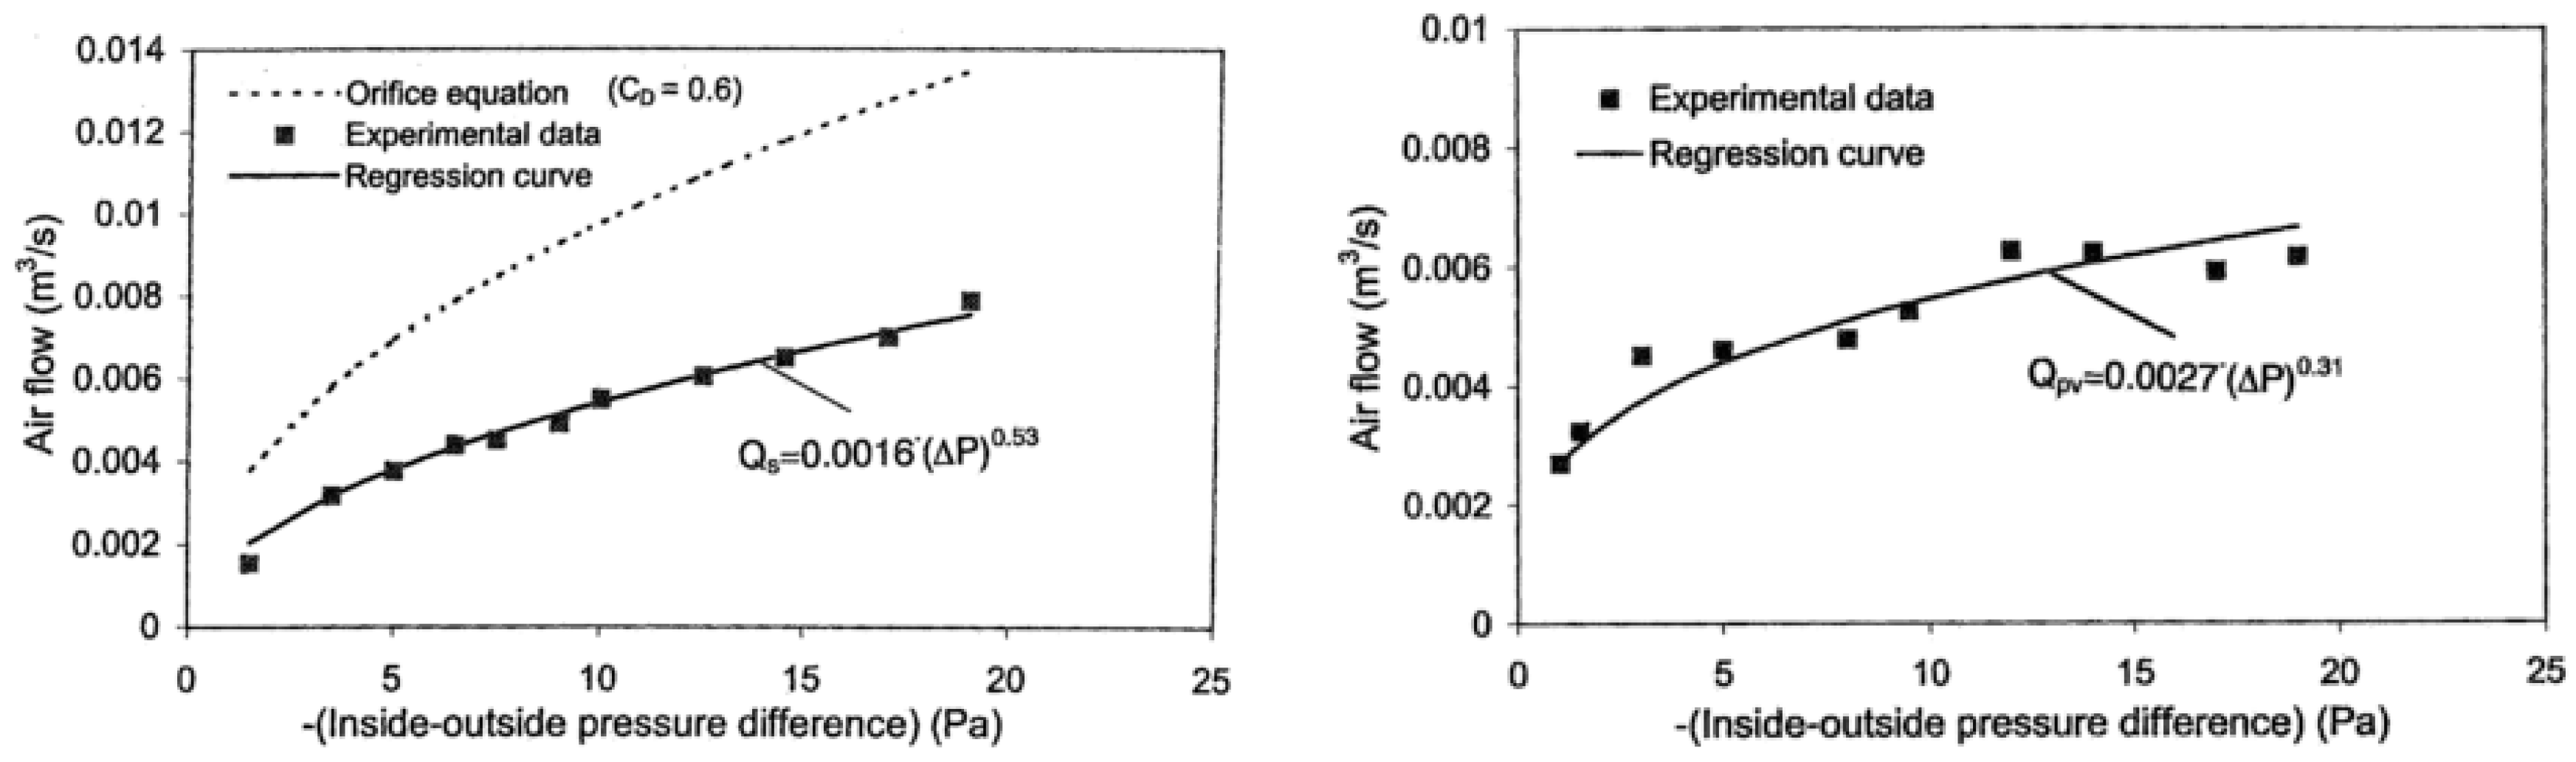
Pressure-Controlled Trickle Vents
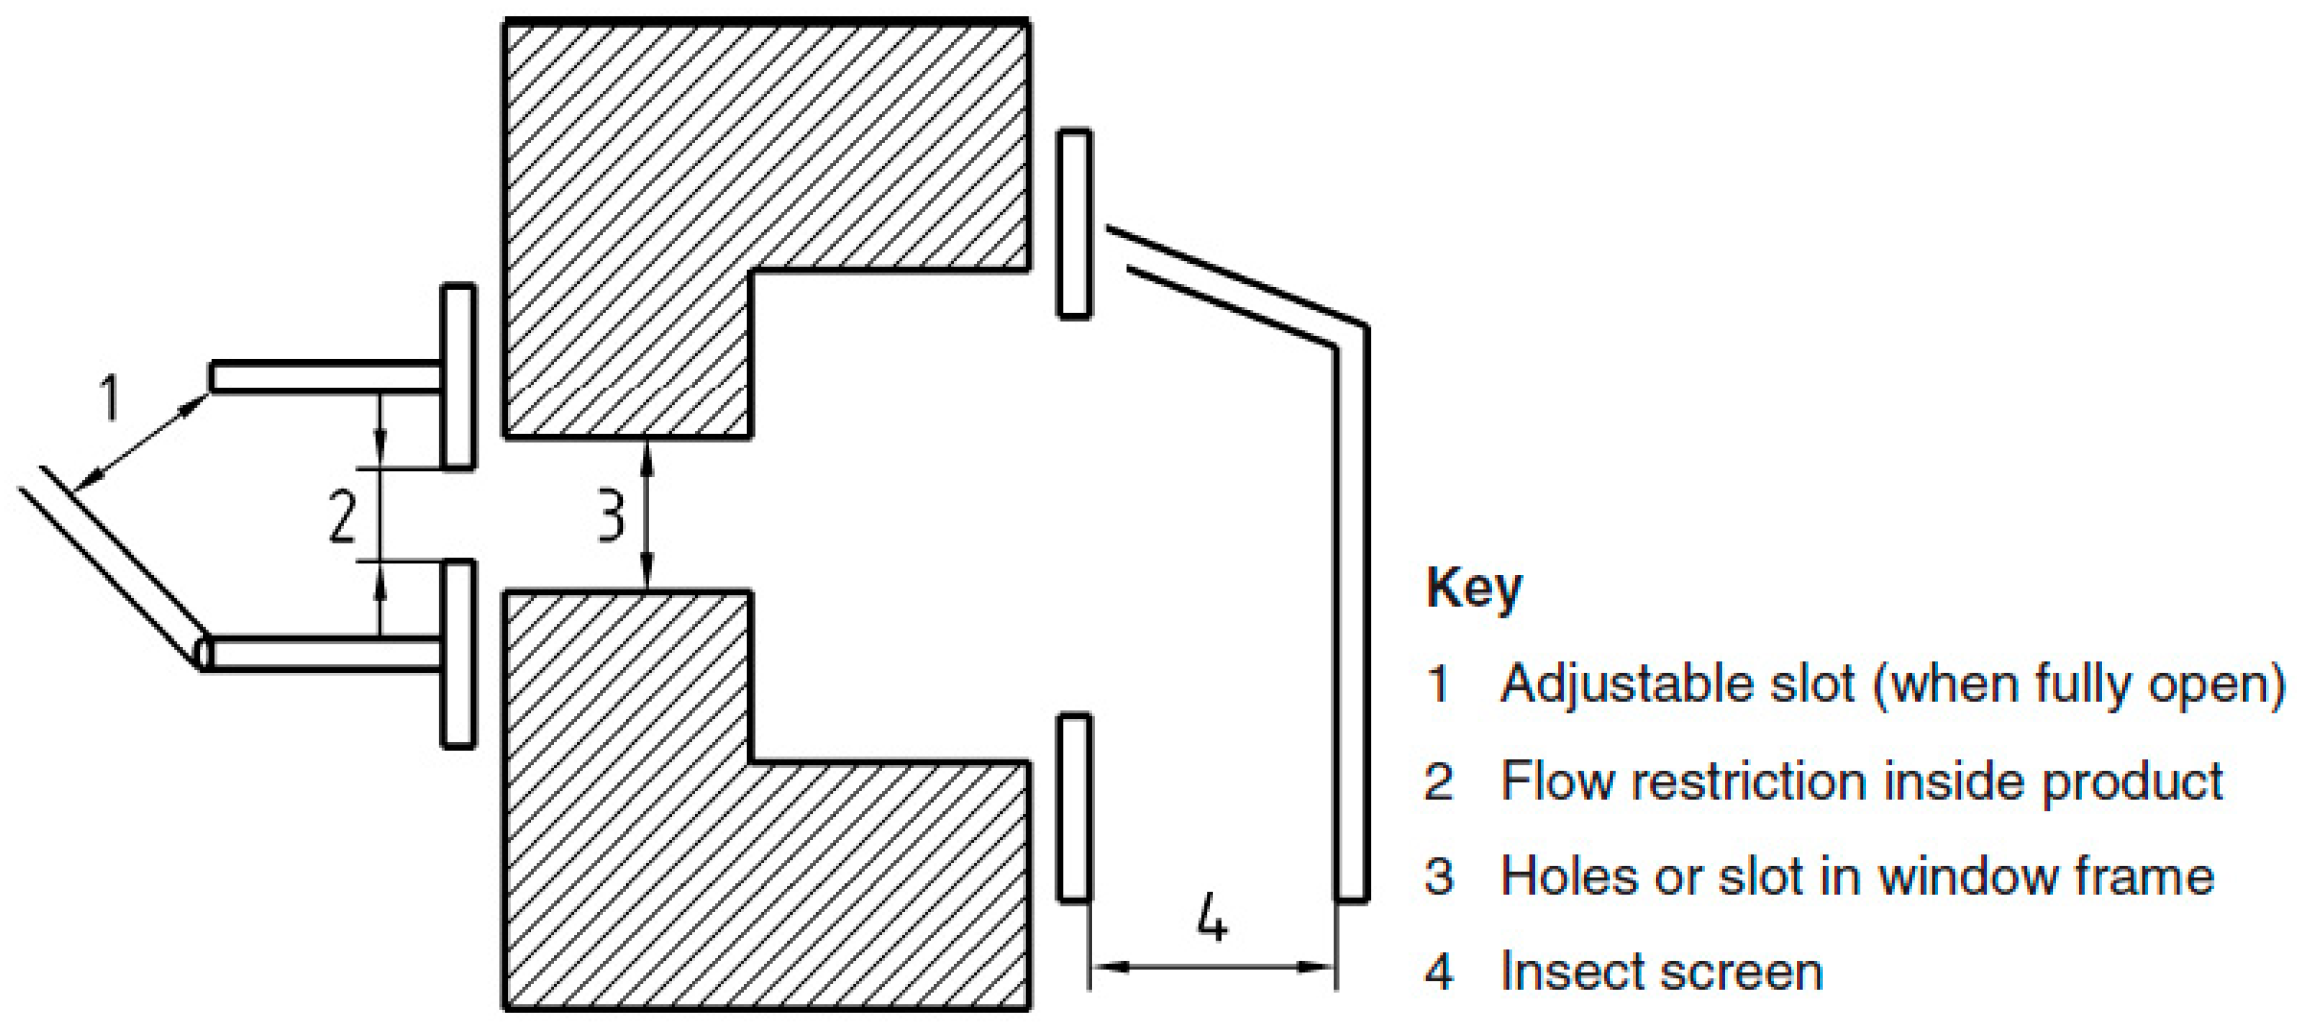
Slot-Controlled Trickle Vents
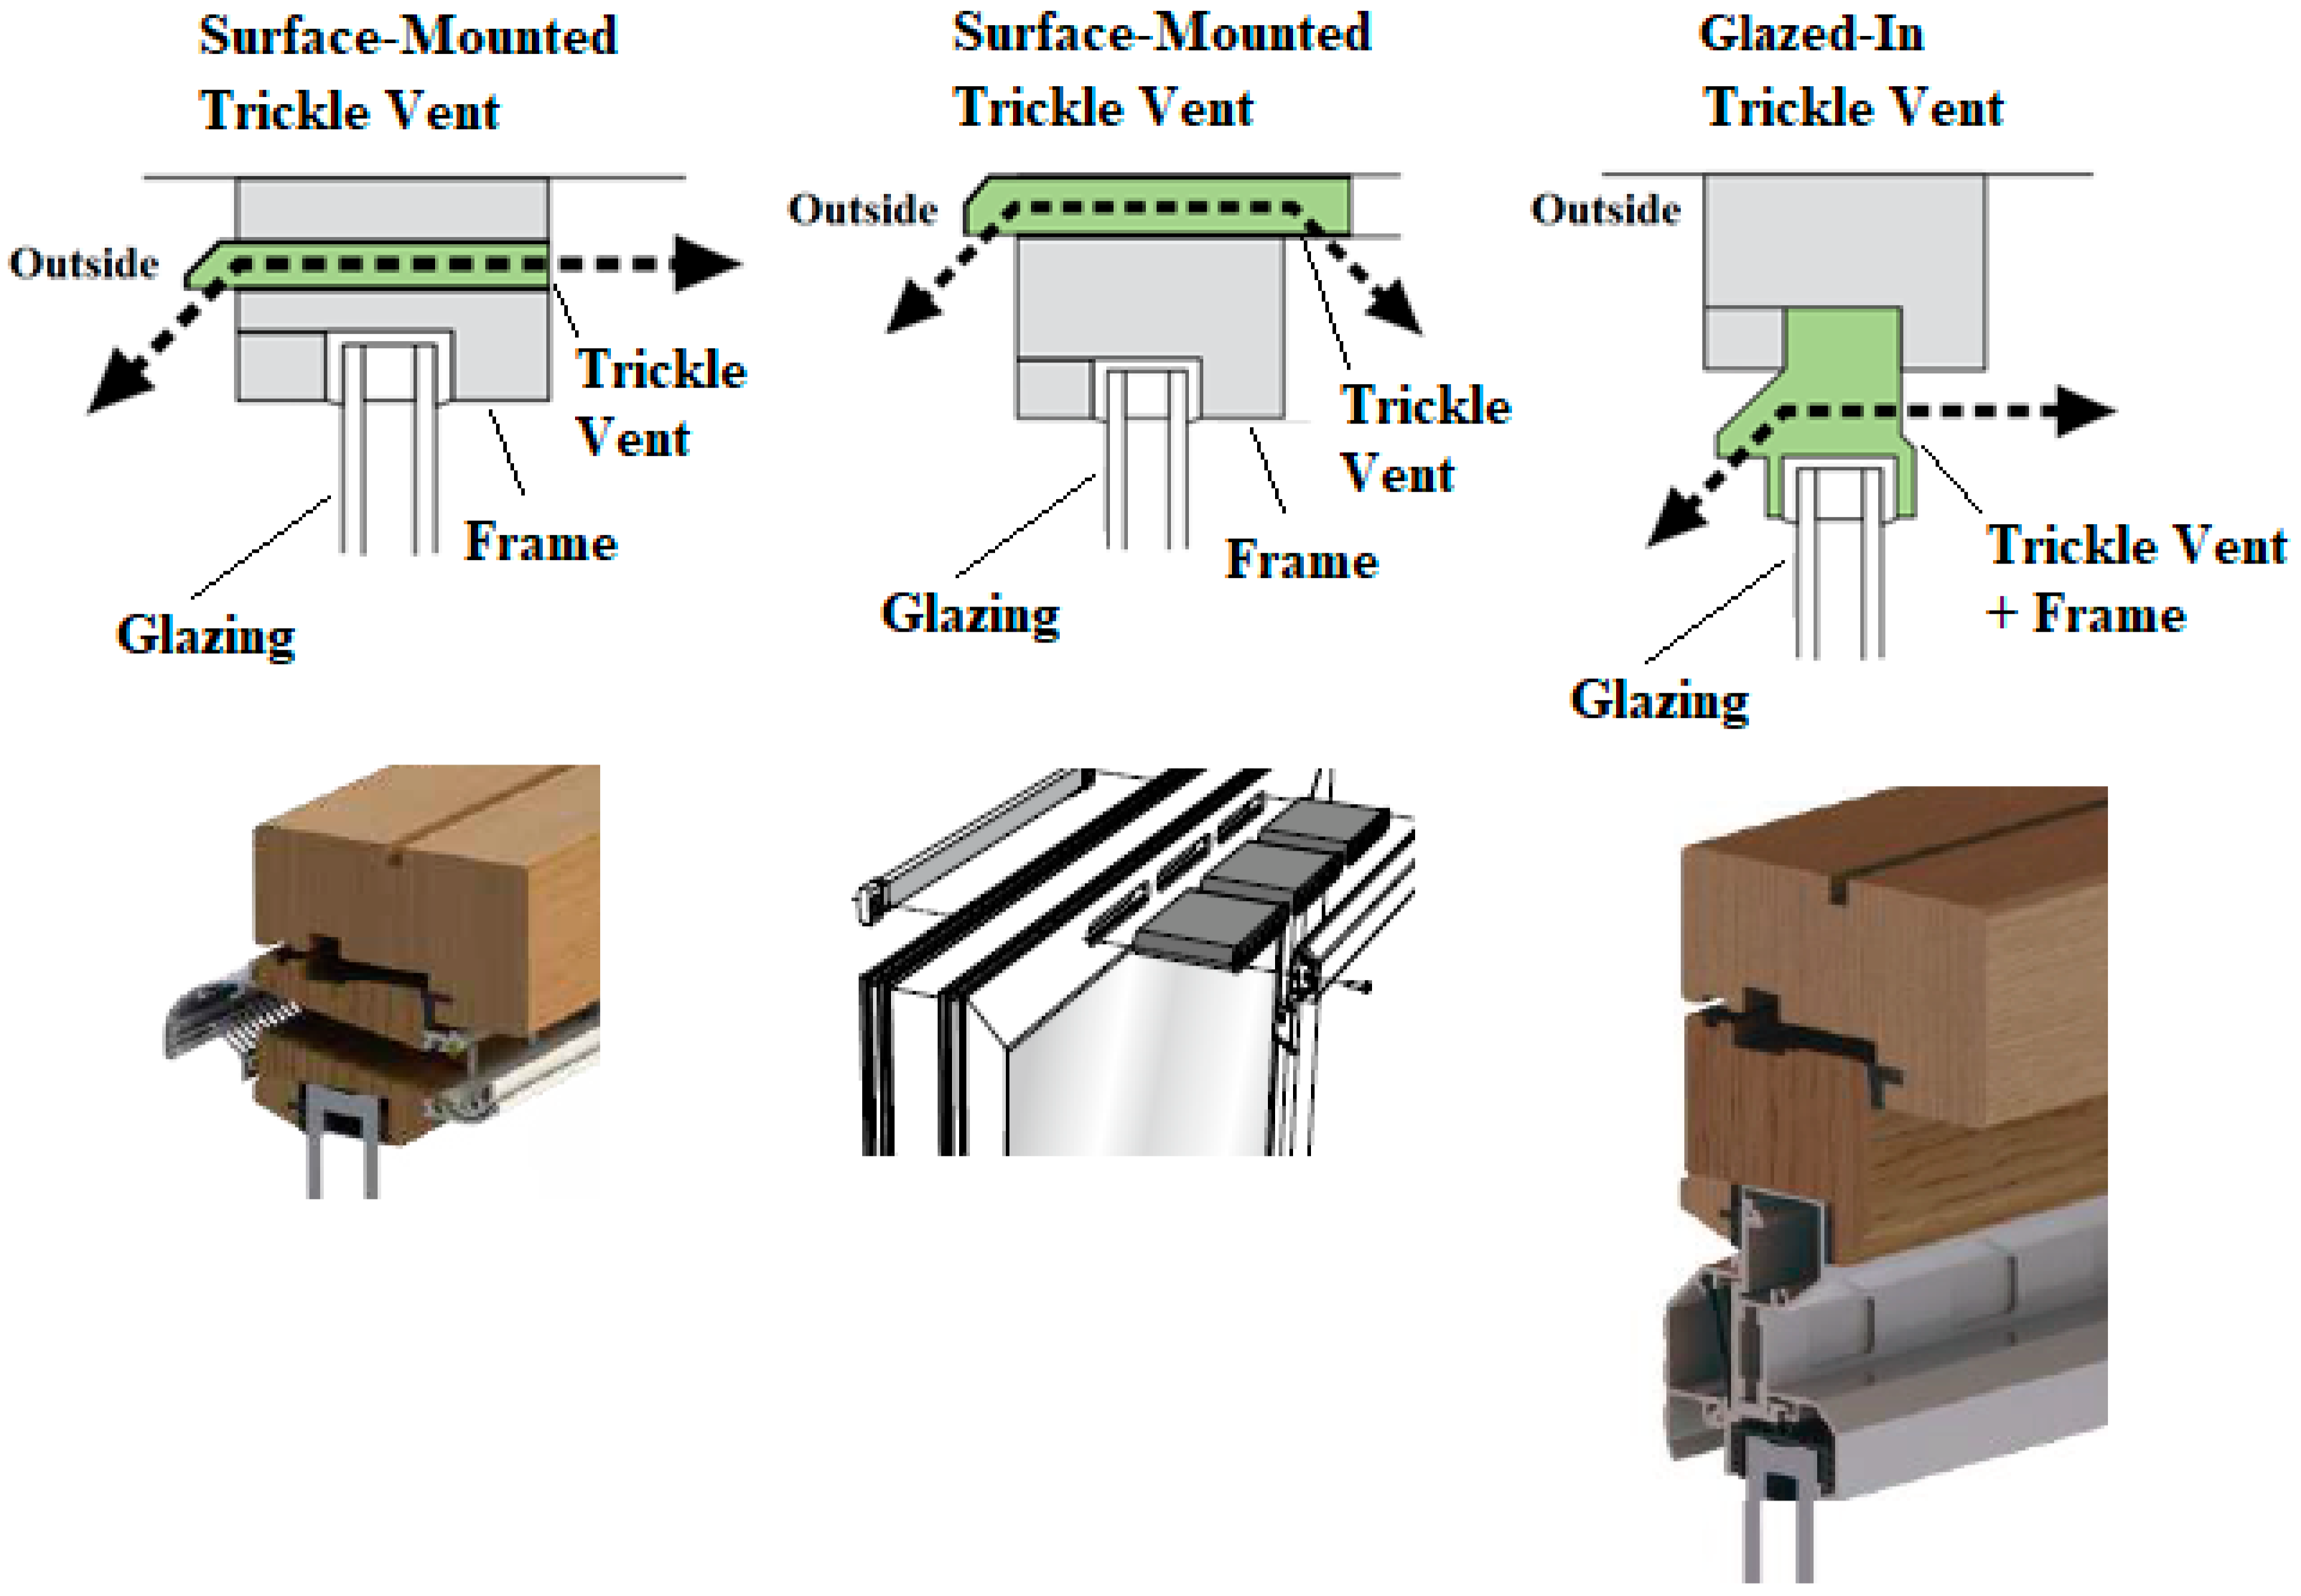
Classification according to Mounting Types
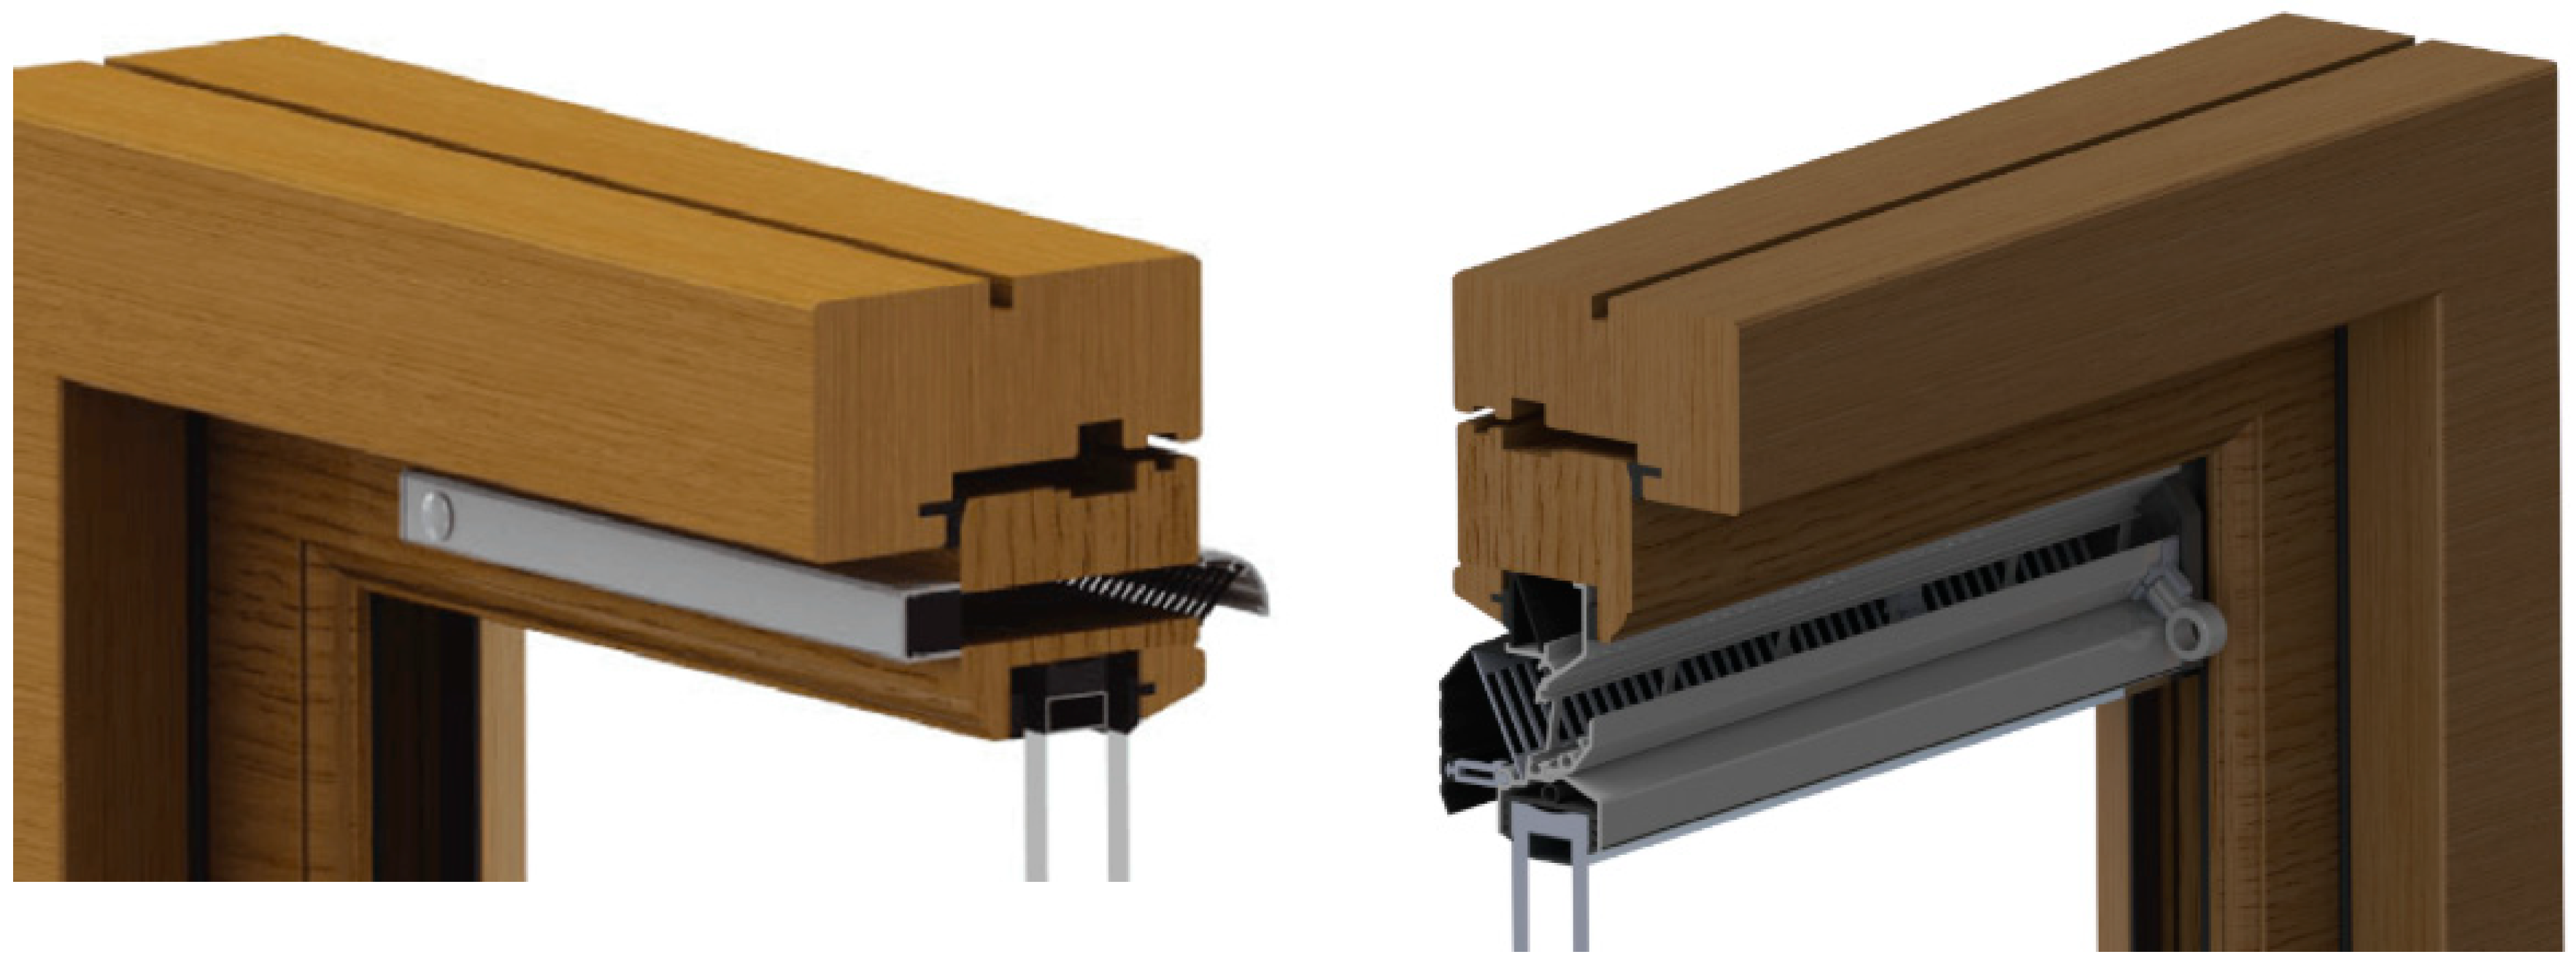
Over-Frame Flap Ventilators (Surface-Mounted Trickle Vents)
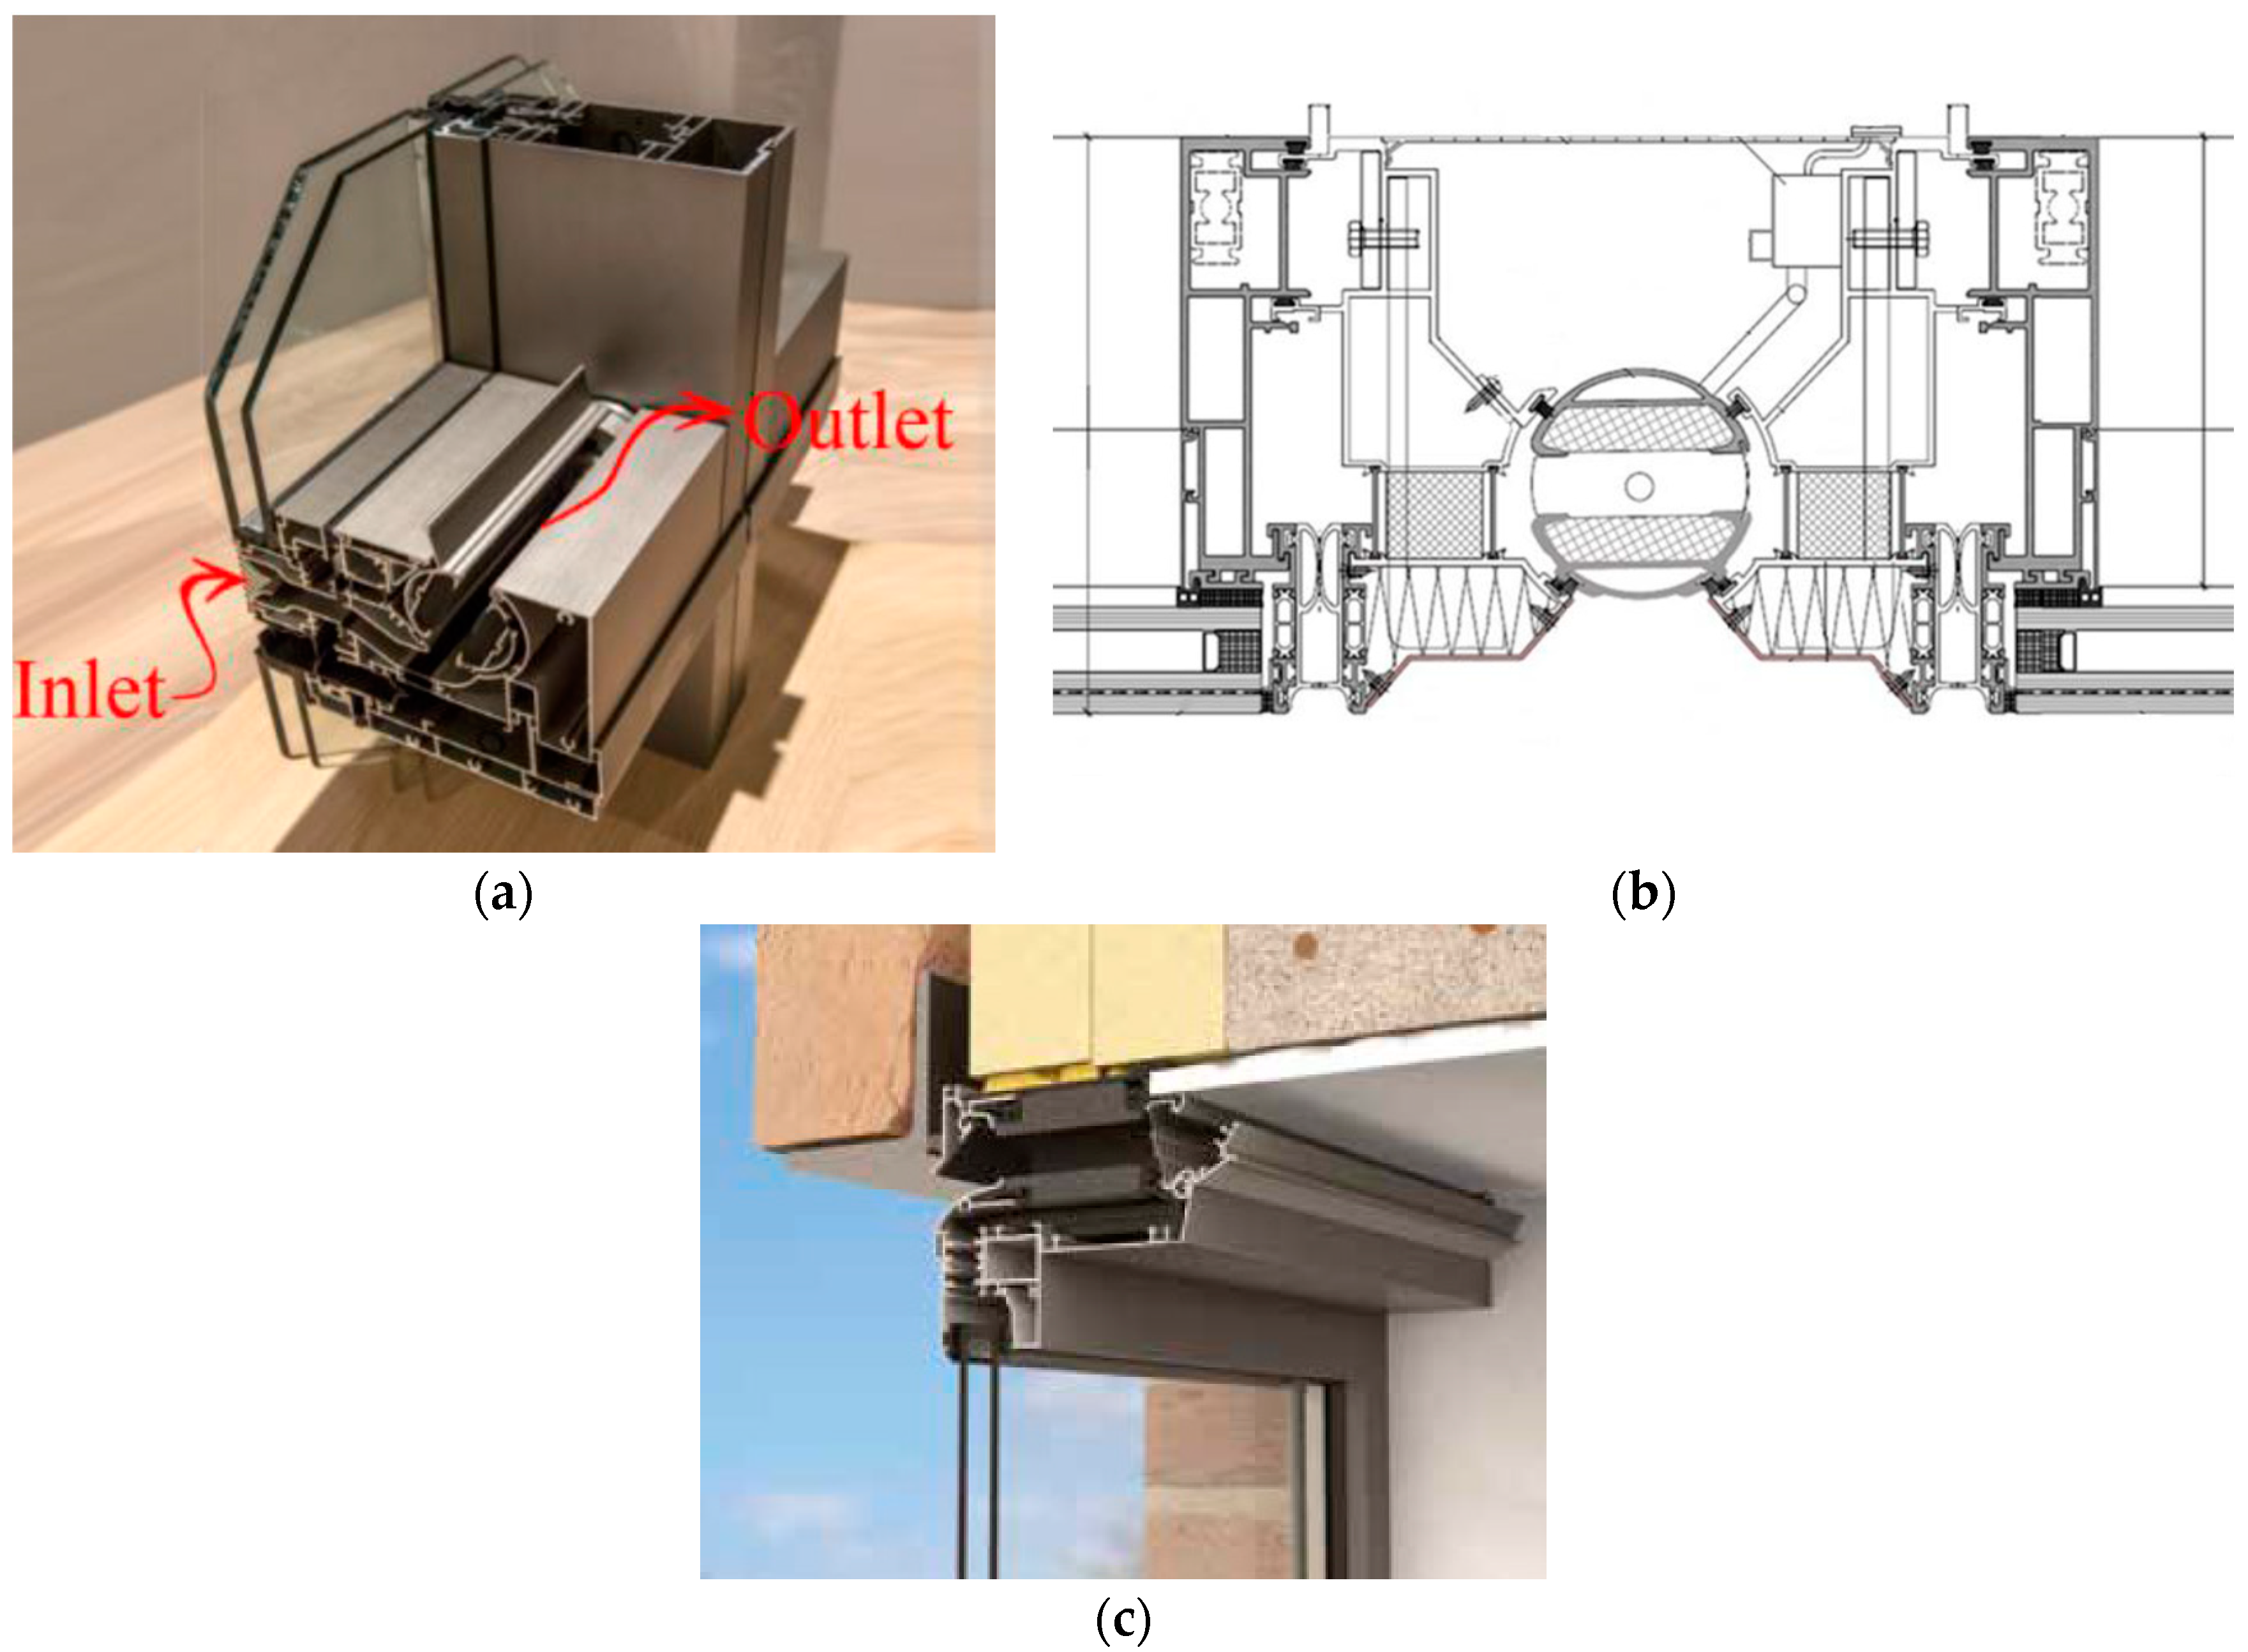
Flap Ventilators Glazed in Transom/Mullion (Glazed-In Trickle Vents)
4. Trickle Vent Design and Performance Requirements
4.1. Performance Test Methods
- qv cor: Corrected air flow rate (L·s−1);
- θa: Ambient temperature (°C);
- Pa: Atmospheric pressure (Pa).
4.2. Positioning on the Wall
4.3. Opening Area
- A: Equivalent area (mm2);
- C: Table 4;
- qv: Volume flow rate under certain pressure difference.
- A: Equivalent area of background ventilator (mm2);
- Q: Air supply rate (L/s);
- Cd: Discharge coefficient (assumed as 0.61);
- ρ: Air density (kg/m3) assumed as 1.2 kg/m3;
- ΔP: Pressure difference (1 Pa for multistory buildings, 0.6 Pa for single-story buildings).
4.4. Climatic Adaptation
4.5. Control Strategy
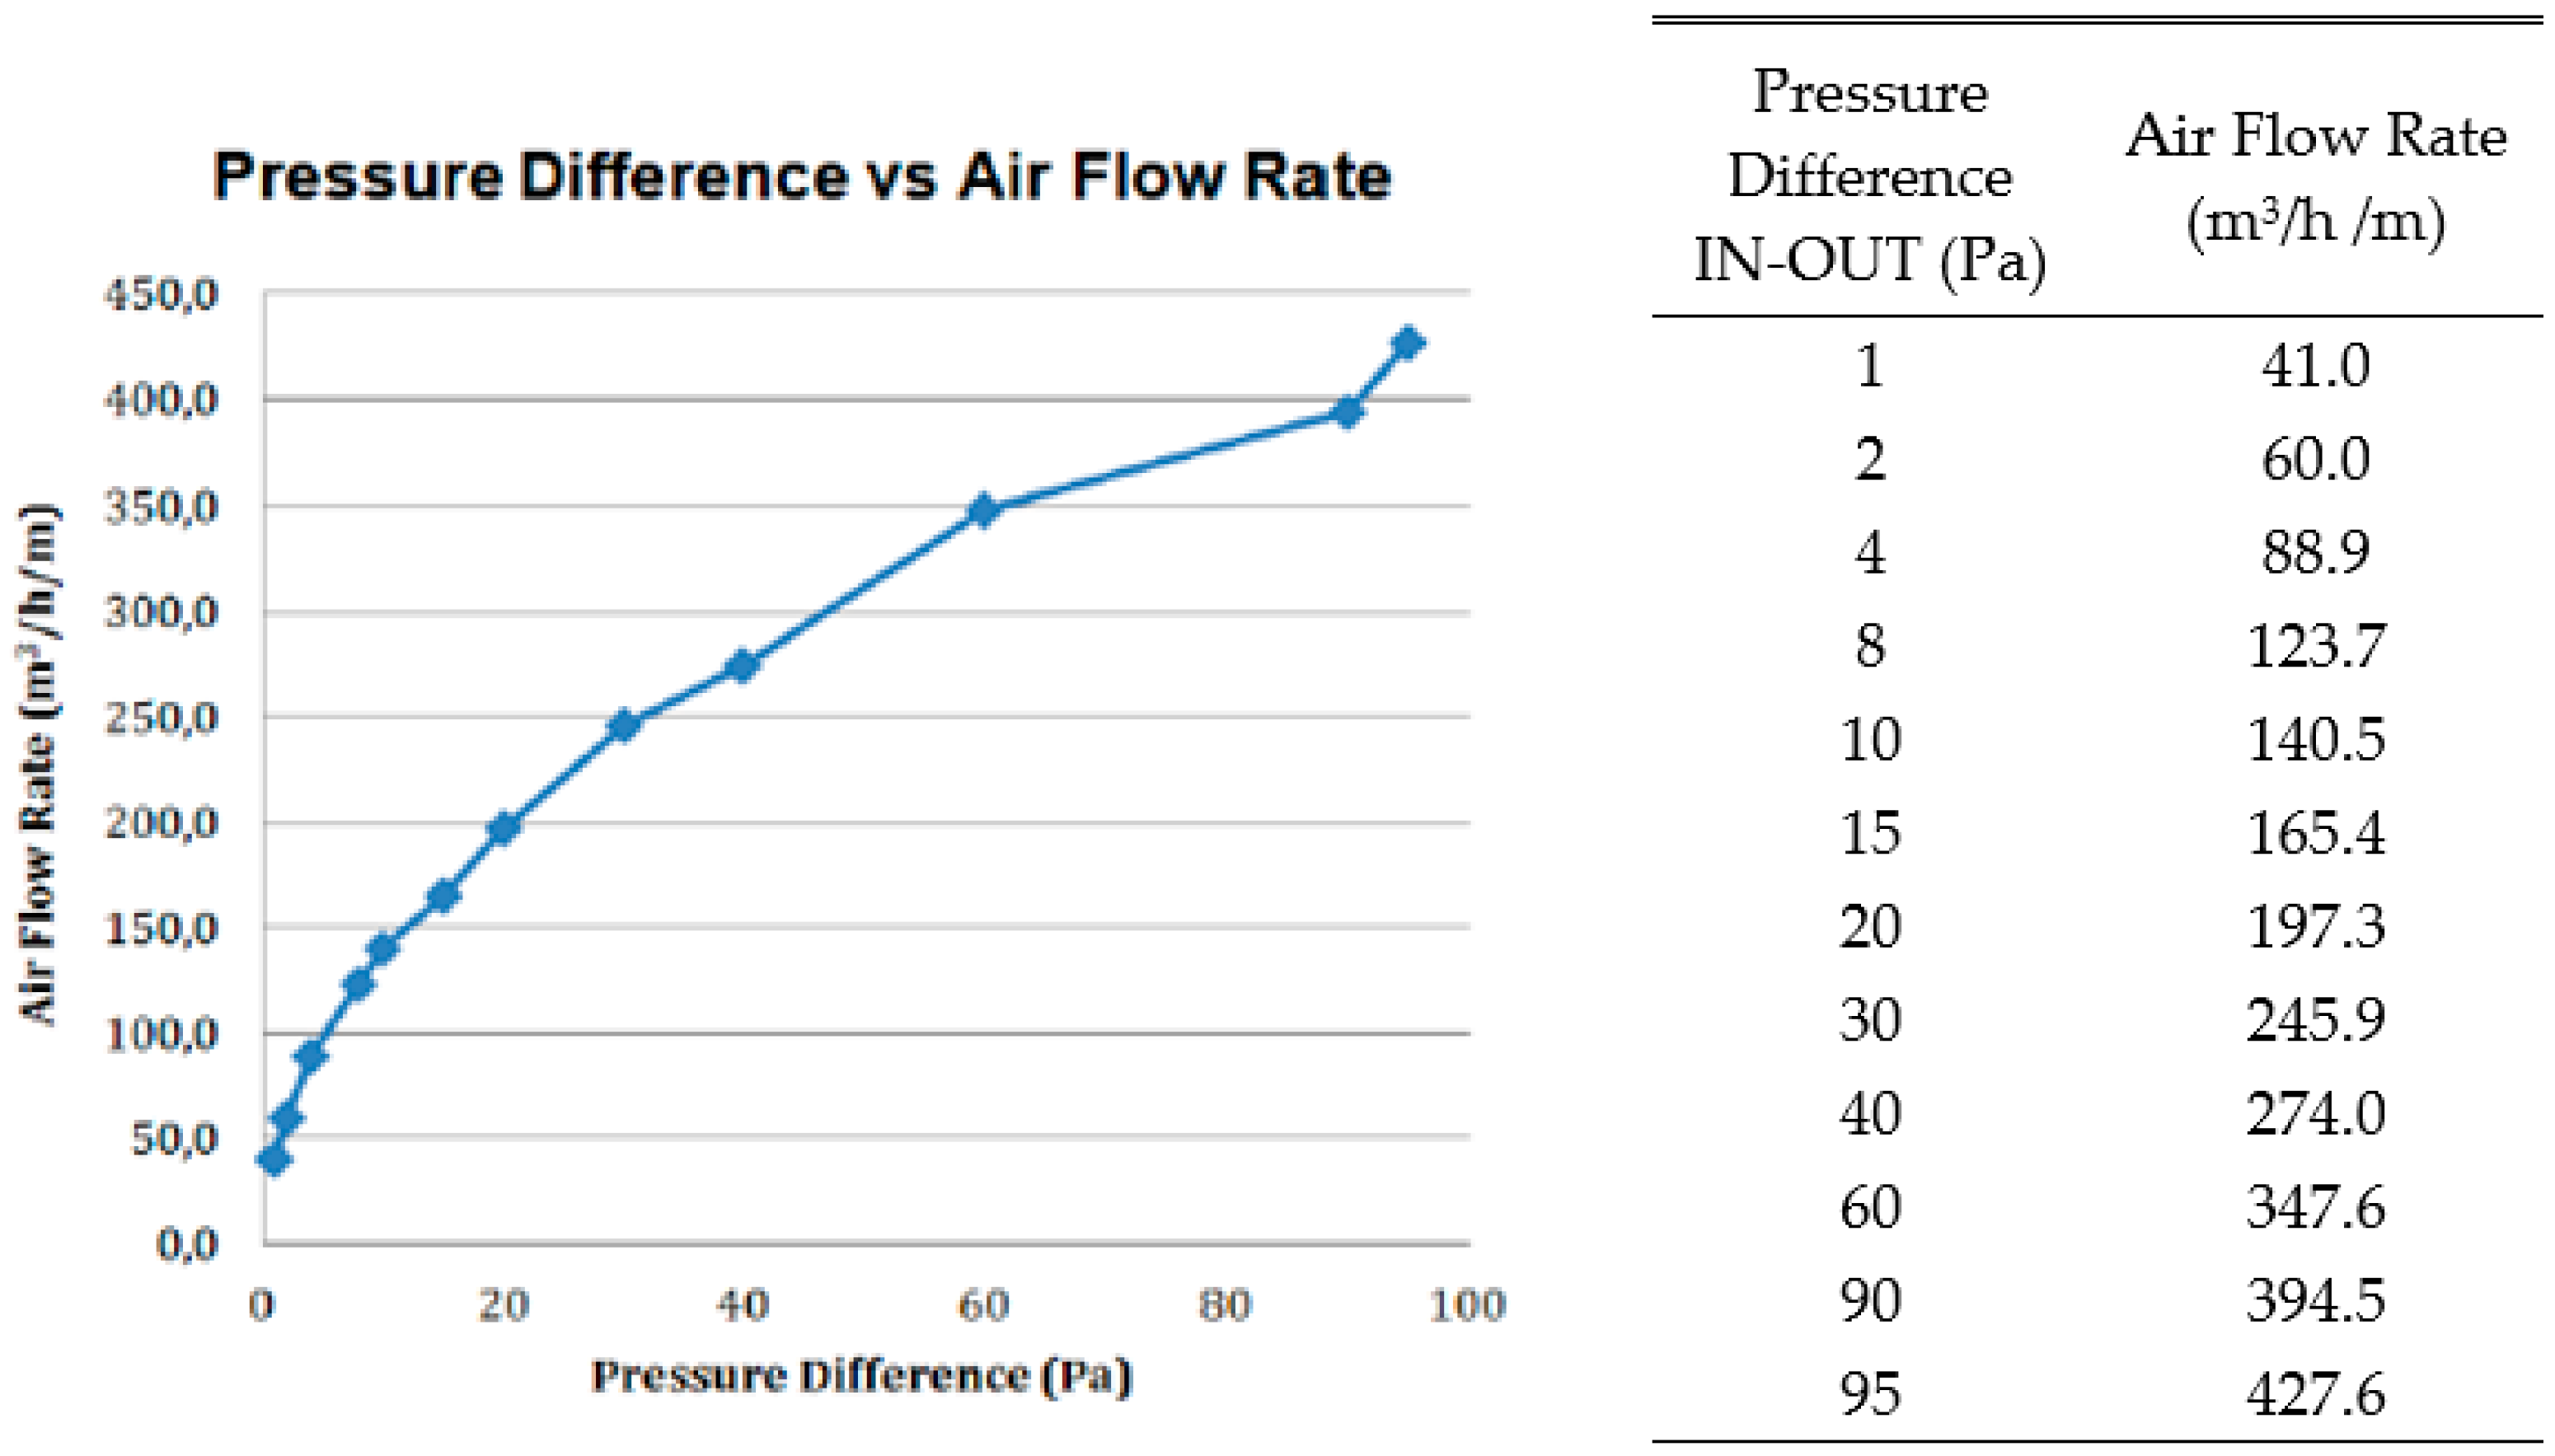
4.6. Ventilation Performance
4.7. Thermal Bridging
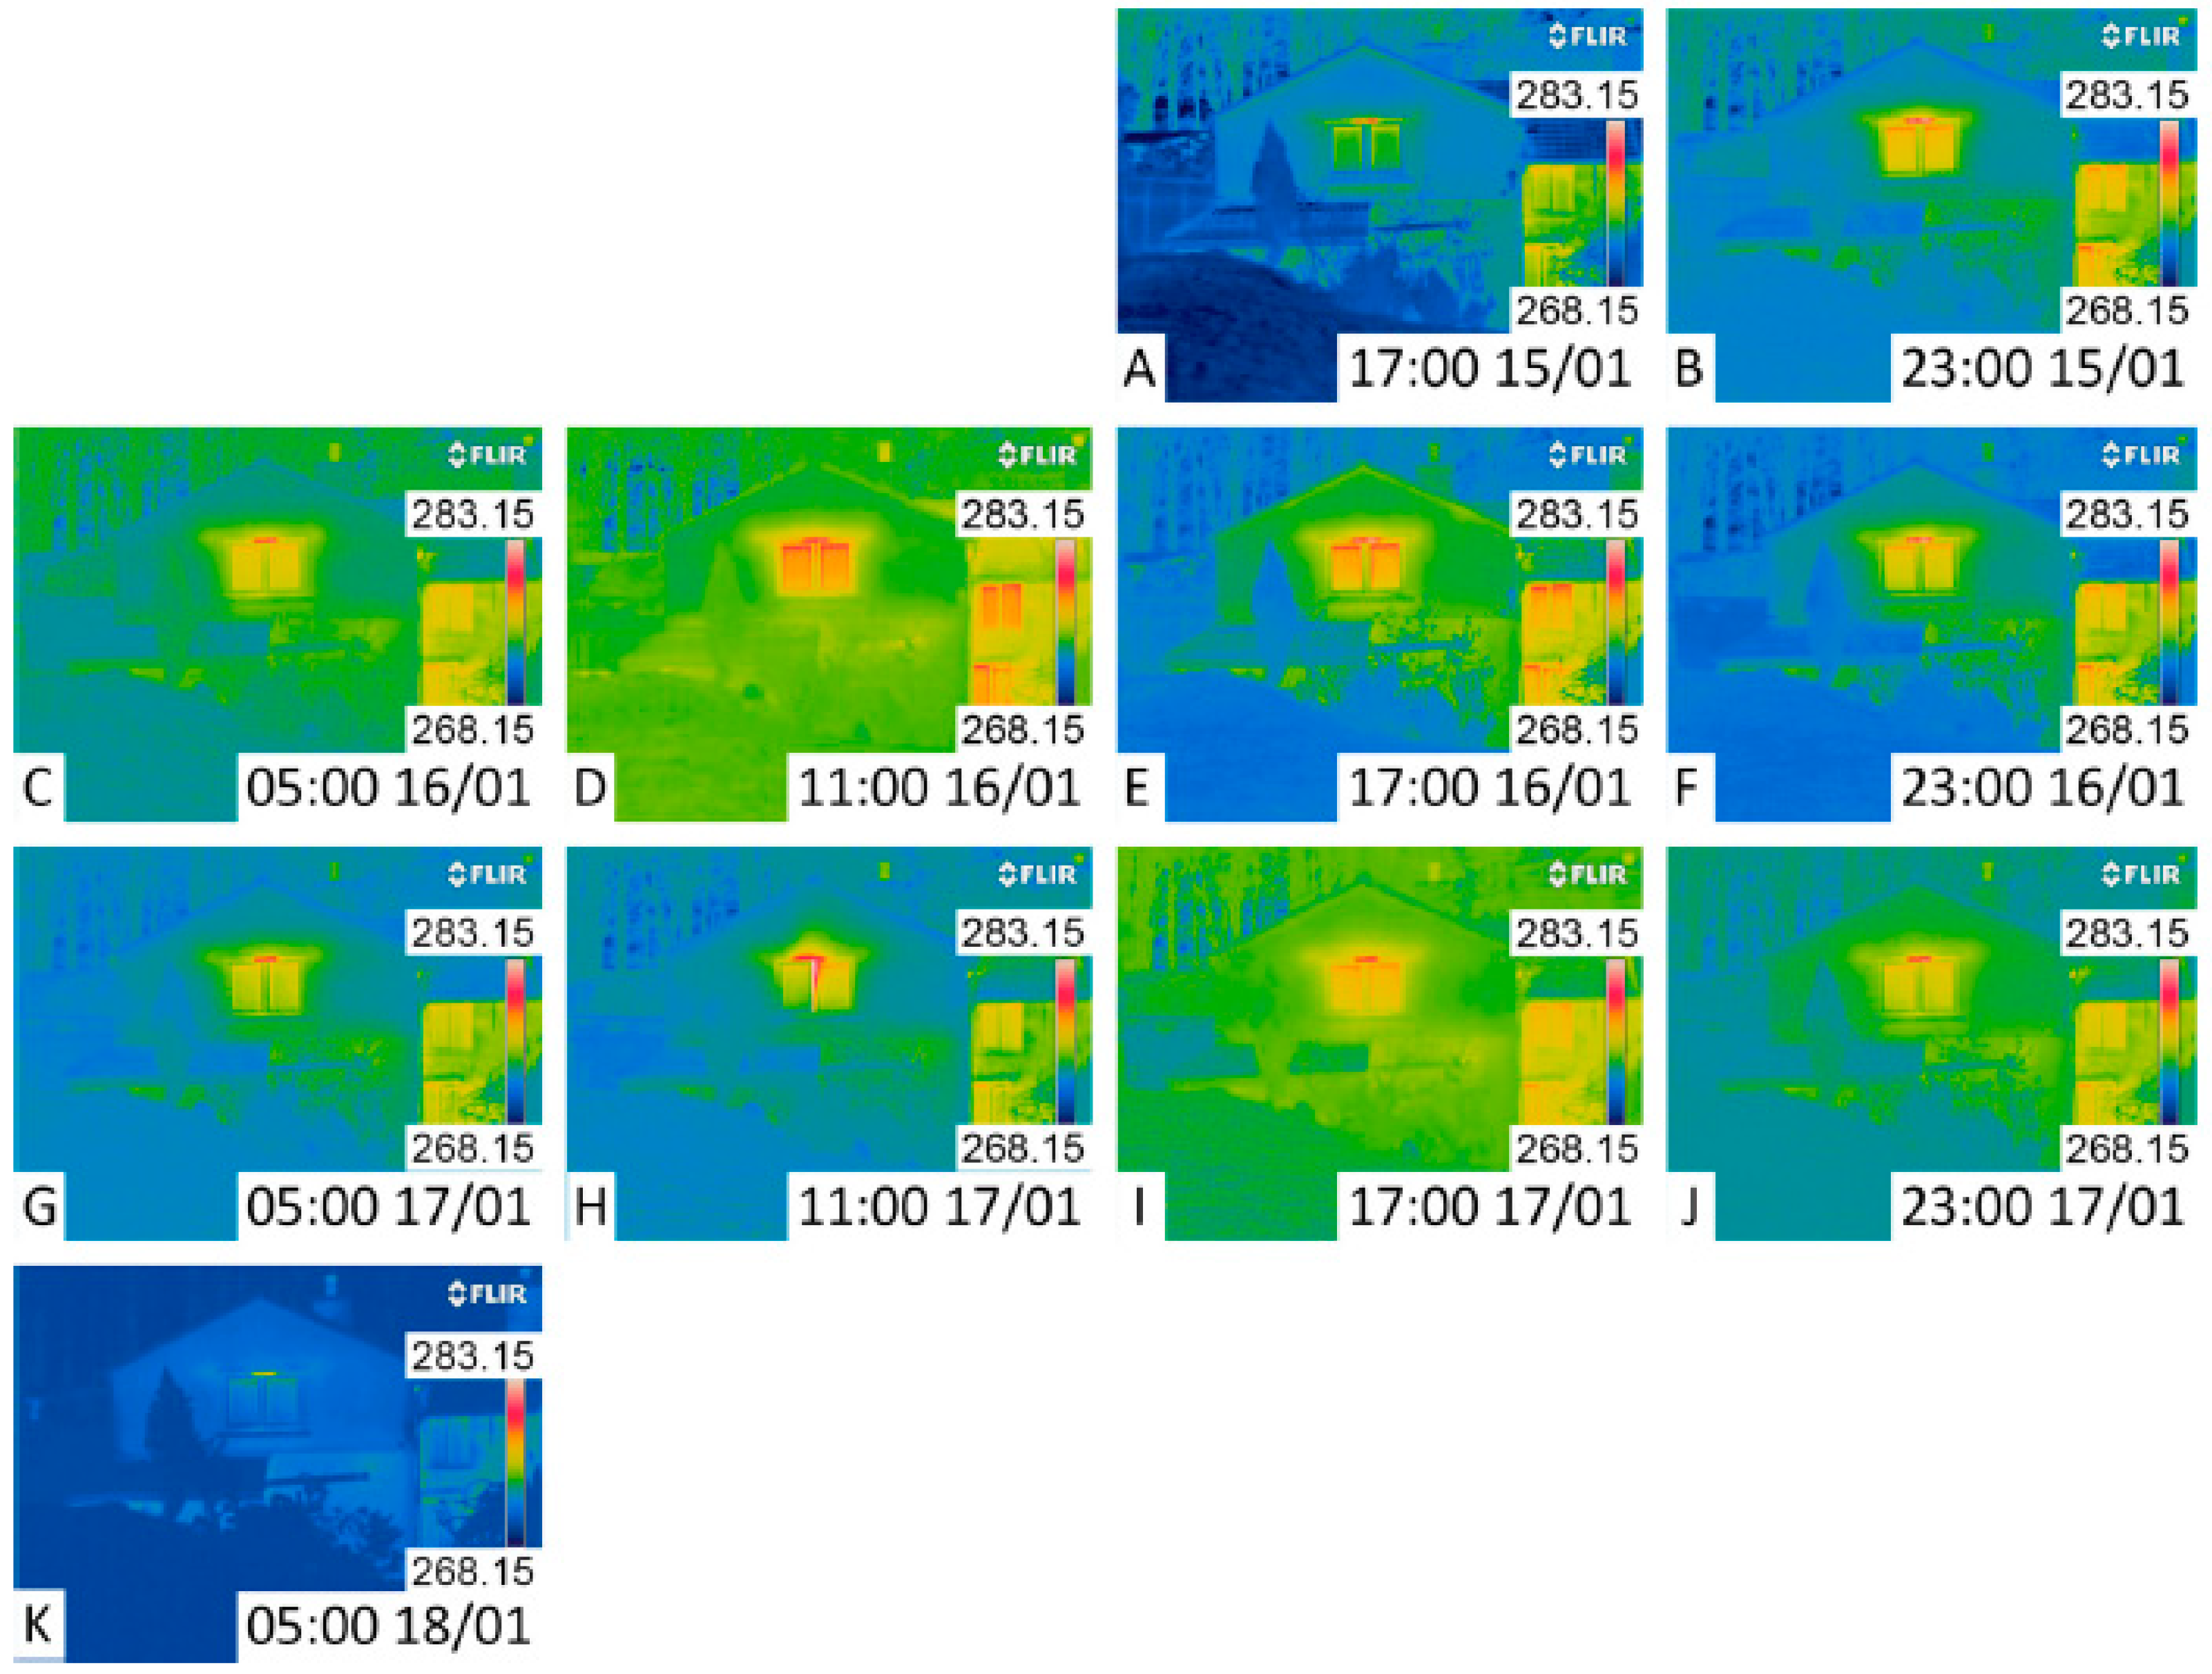
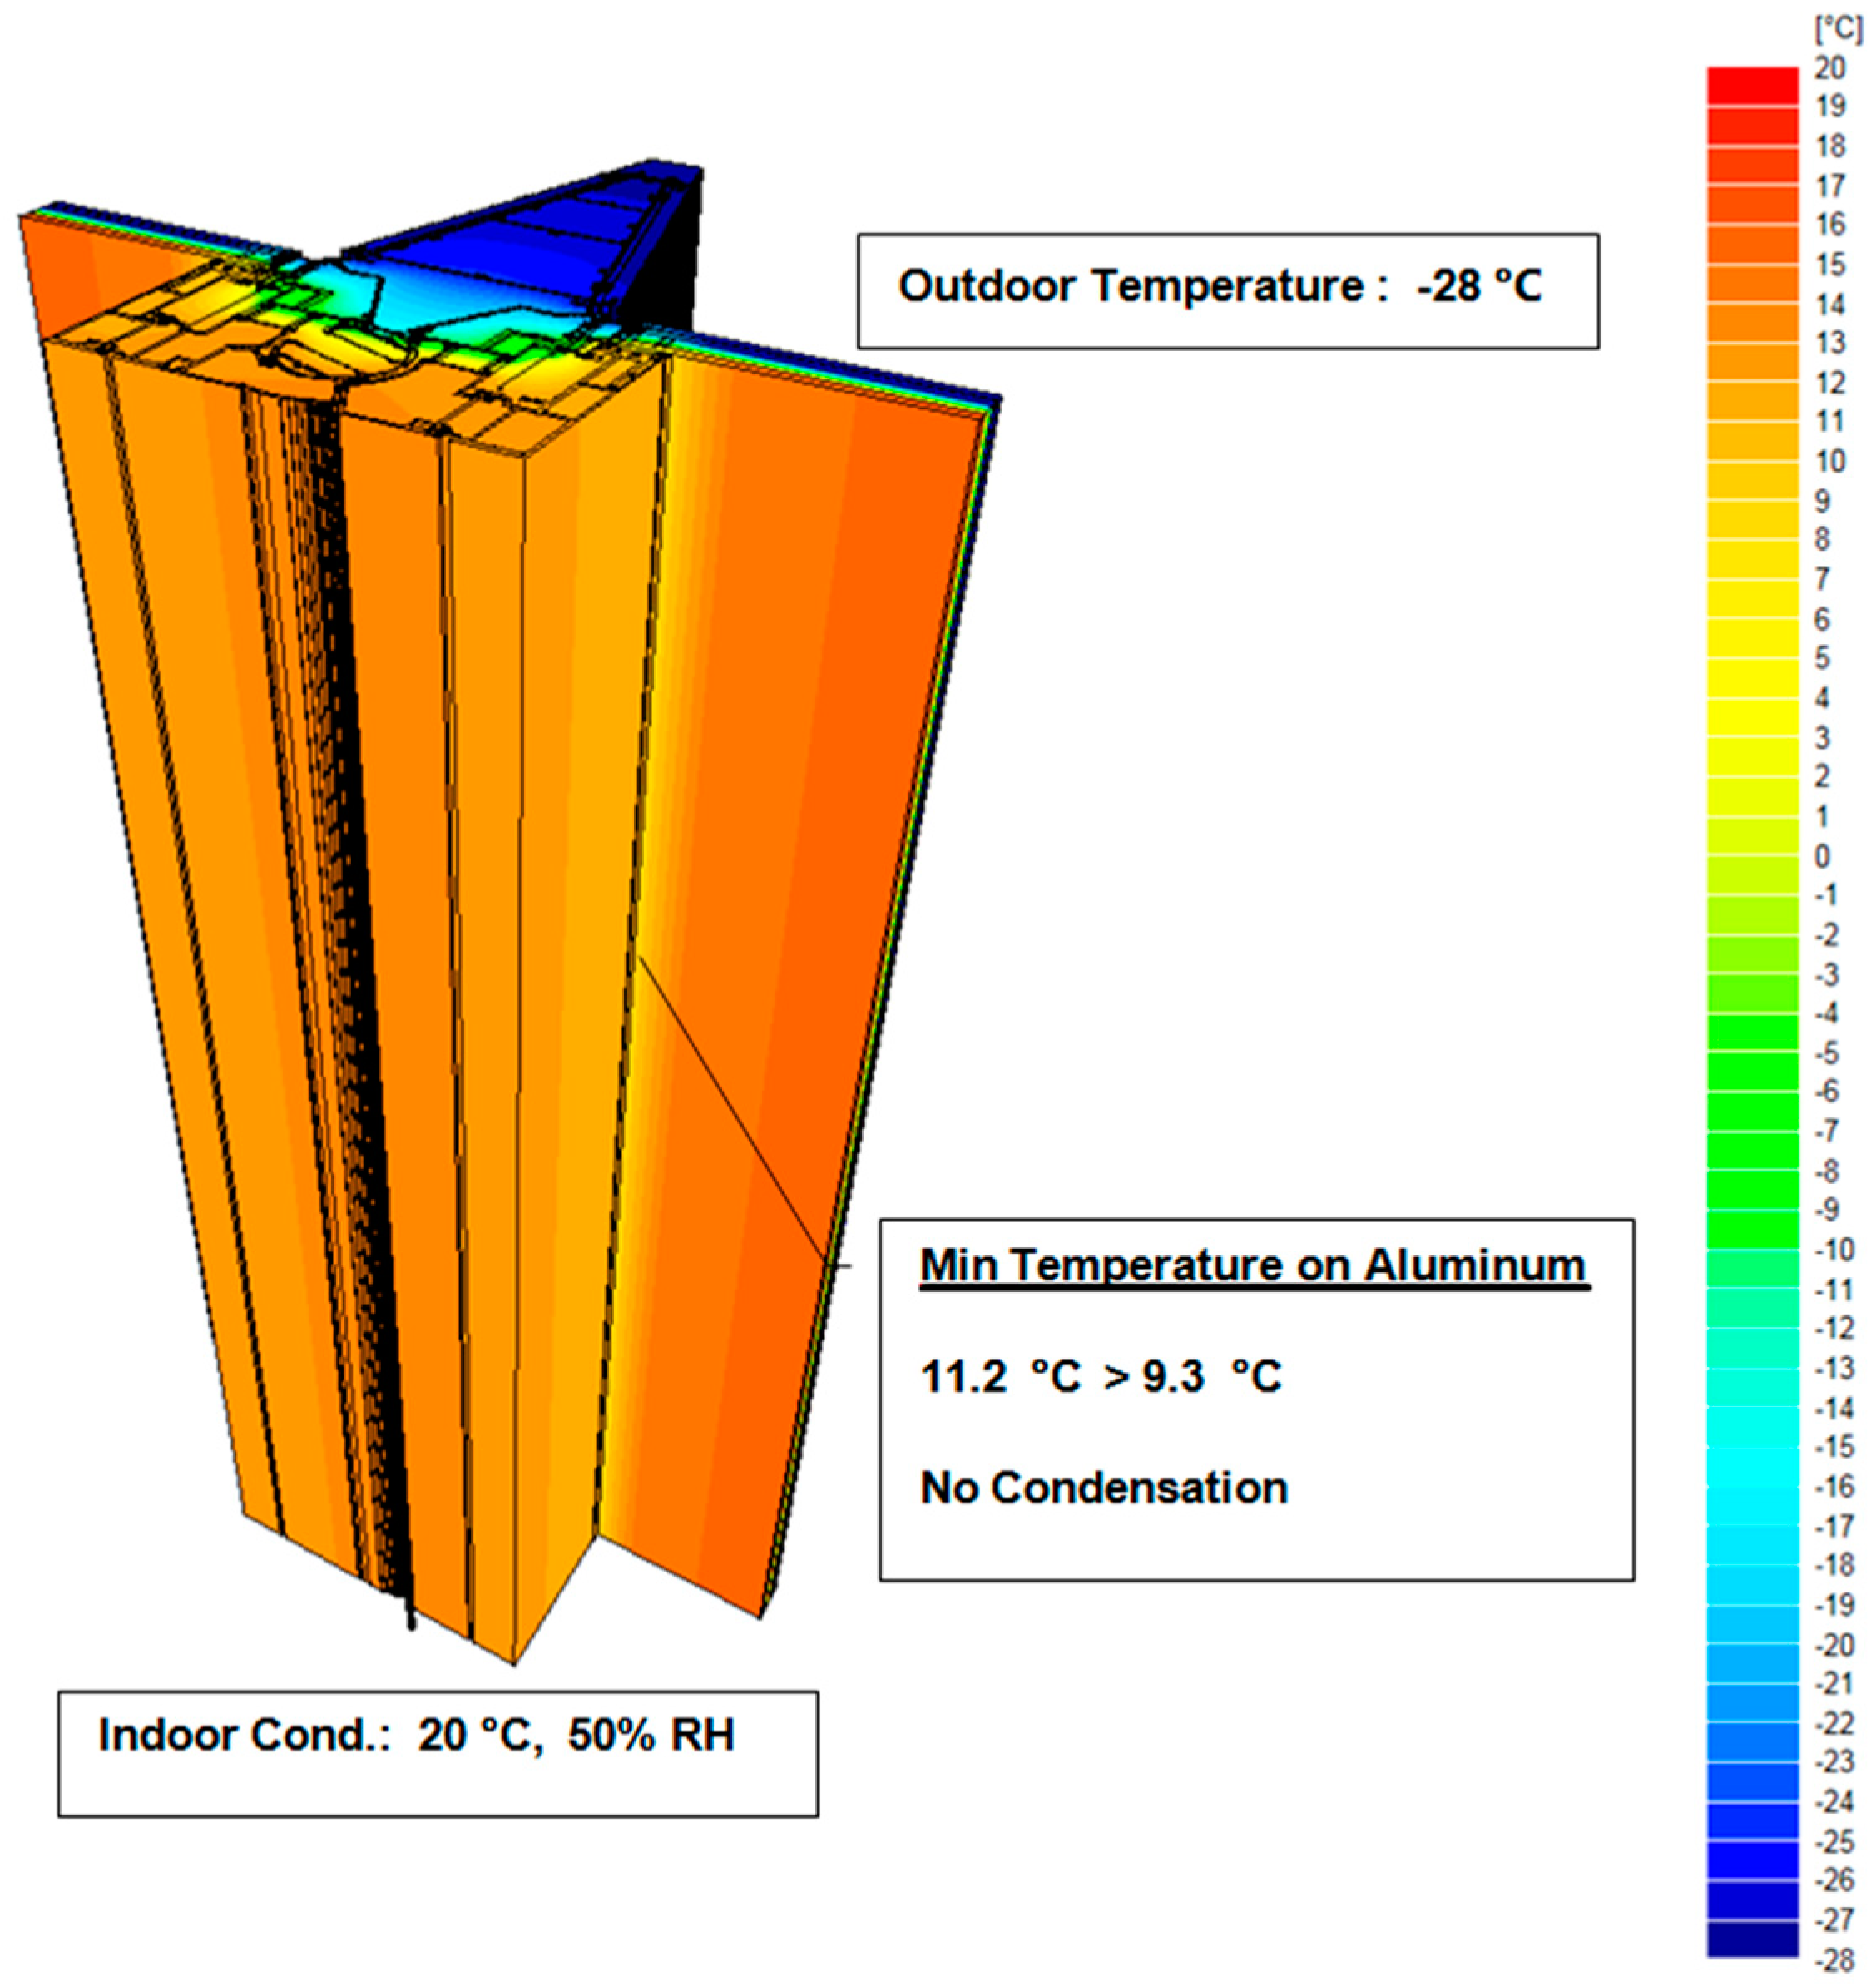
4.7.1. Risk of Condensation
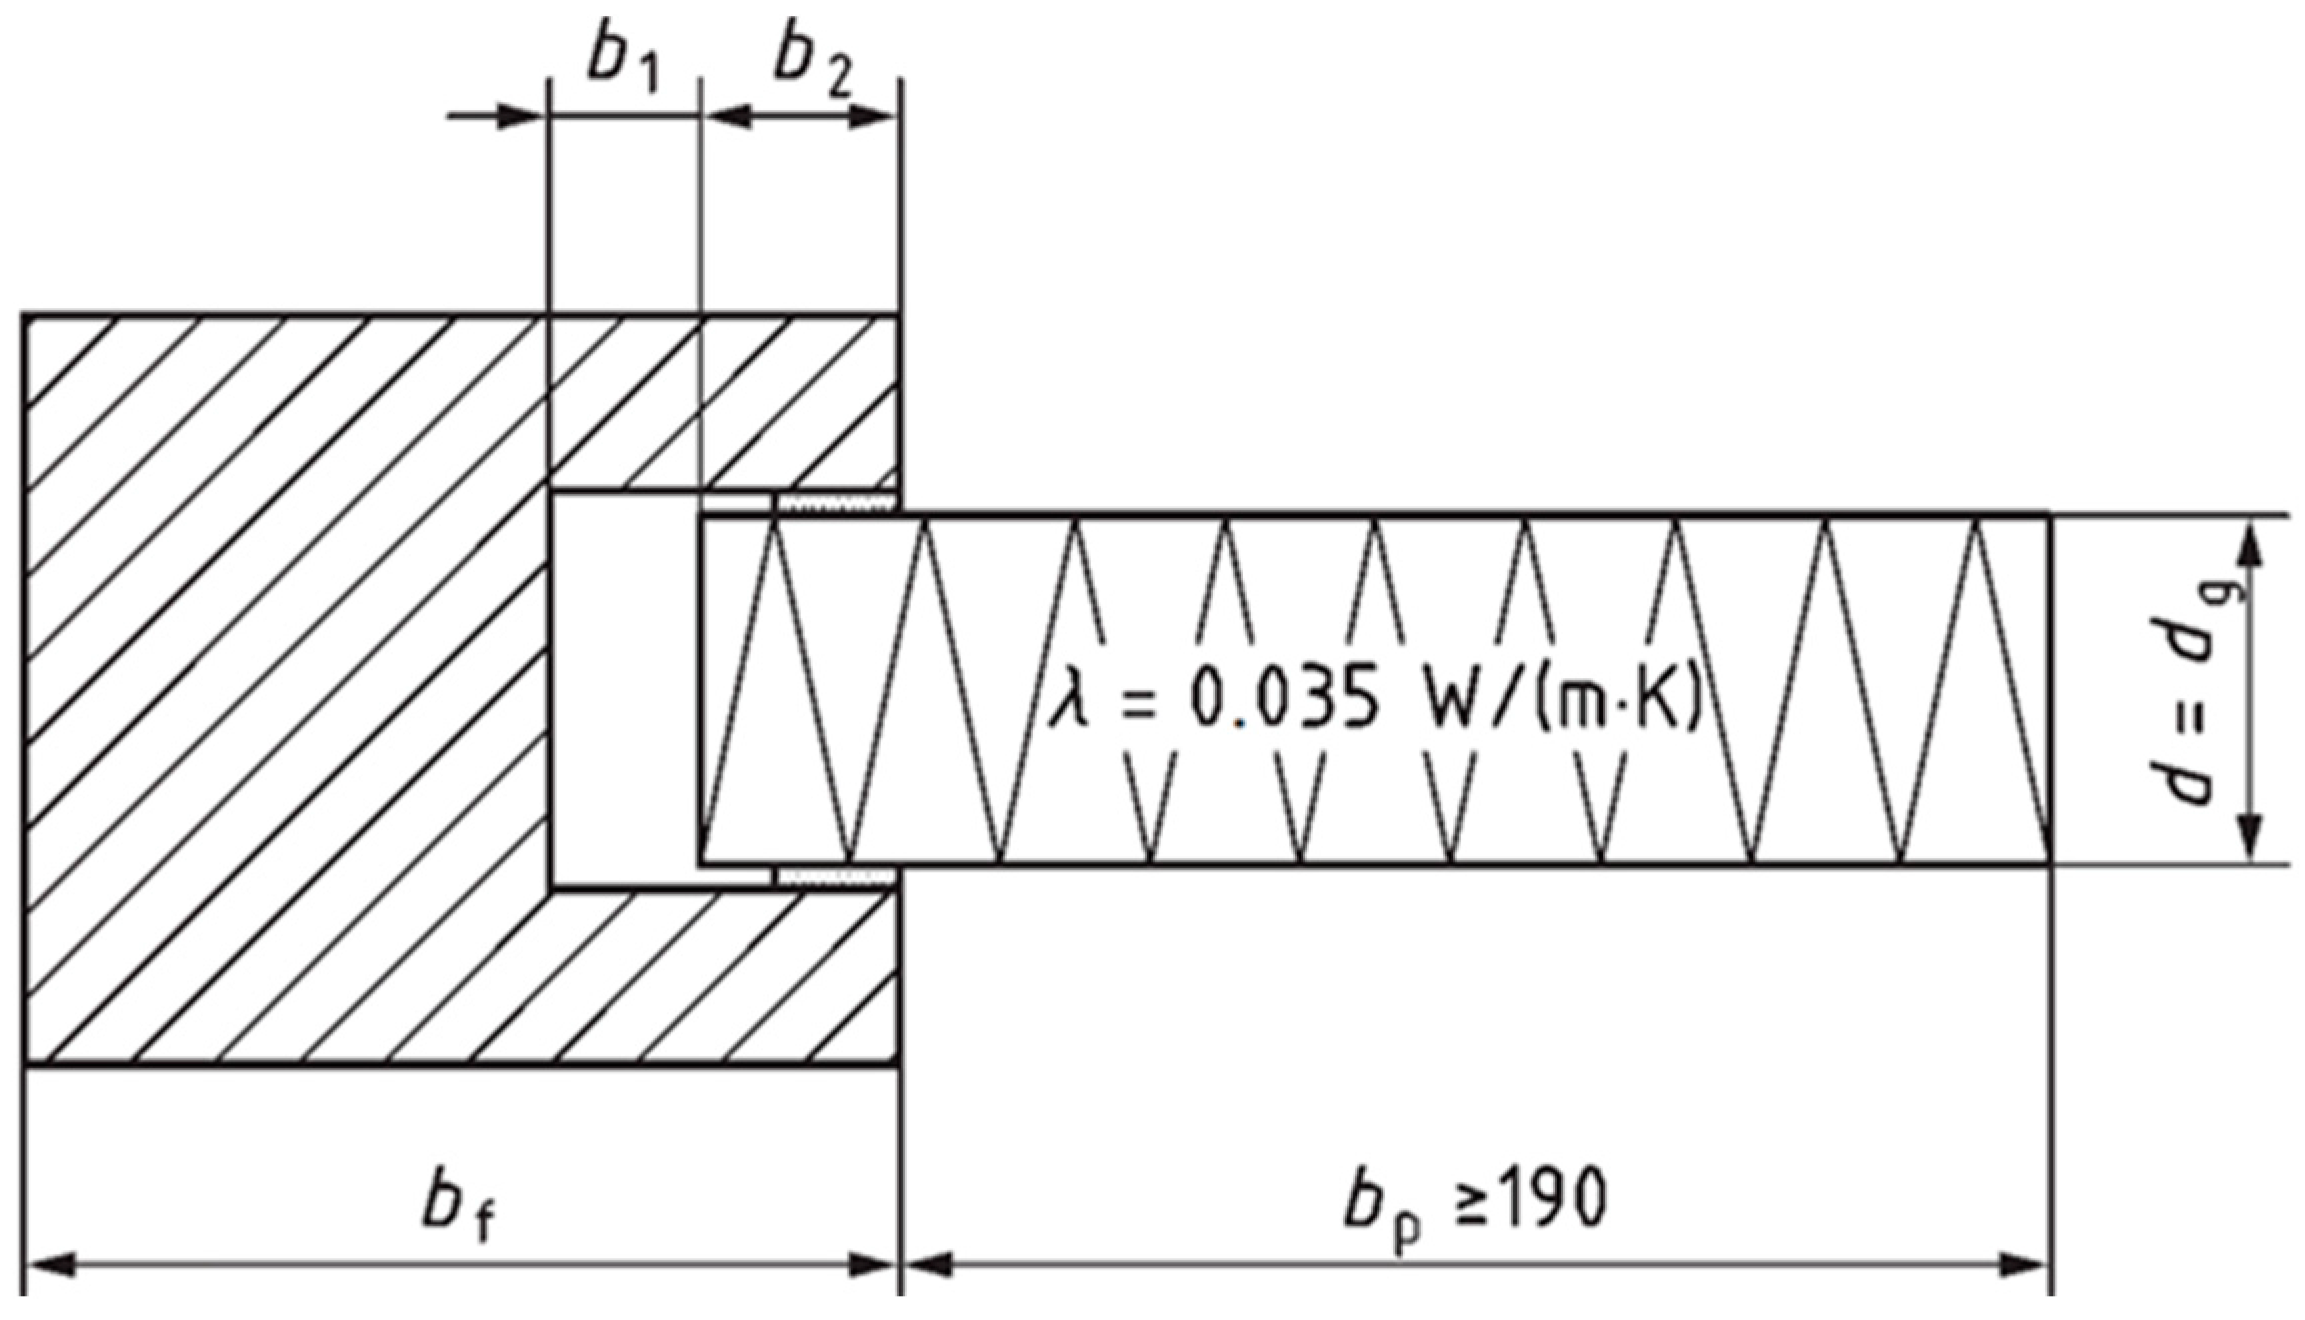
4.7.2. U Value
- Uf: Thermal transmittance of the frame section, in (W/m2 K);
- Lf2D: Thermal conductance of the section (W/mK);
- Up: Thermal transmittance of the center of the panel (W/m2 K);
- bp: Visible width of the panel (m);
- bf: Projected width of the frame section (m).
4.8. Acoustic Performance
- L1: Average sound pressure level—Source room (dB);
- L2: Average sound pressure level—Receiving room (dB);
- A0: Reference area (m2) (for the lab, A0 = 10);
- A: Equivalent absorption area in the receiving room (m2).
- L1: Energy average sound pressure level—Source room (dB);
- L2: Energy average sound pressure level—Receiving room (dB);
- S: Free test opening area where the test element is installed (m2);
- A is the area of equivalent sound absorption in the receiving room, in m2 [91].
4.9. Air Permeability
4.10. Water Tightness
5. Modeling and Monitoring Techniques
5.1. Modeling Techniques
5.2. Monitoring Techniques
5.2.1. Calculation of Ventilation Rate by Using Measurements
- V: Ventilation rate (m3/h);
- Cgen: CO2 generation by a person (cm3/(h·person));
- n: Number of persons;
- Cest: CO2 concentration outdoors (cm3/m3);
- Cint: CO2 concentration indoors (cm3/m3).
- C(o): Indoor CO2 concentration at t = 0 (cm3/m3);
- C(t): Indoor CO2 concentration at t = t (cm3/m3);
- Cout: Outdoor CO2 concentration (cm3/m3);
- at: Air change rate (h−1).
6. Studies of Trickle Vent Performance and Their Results
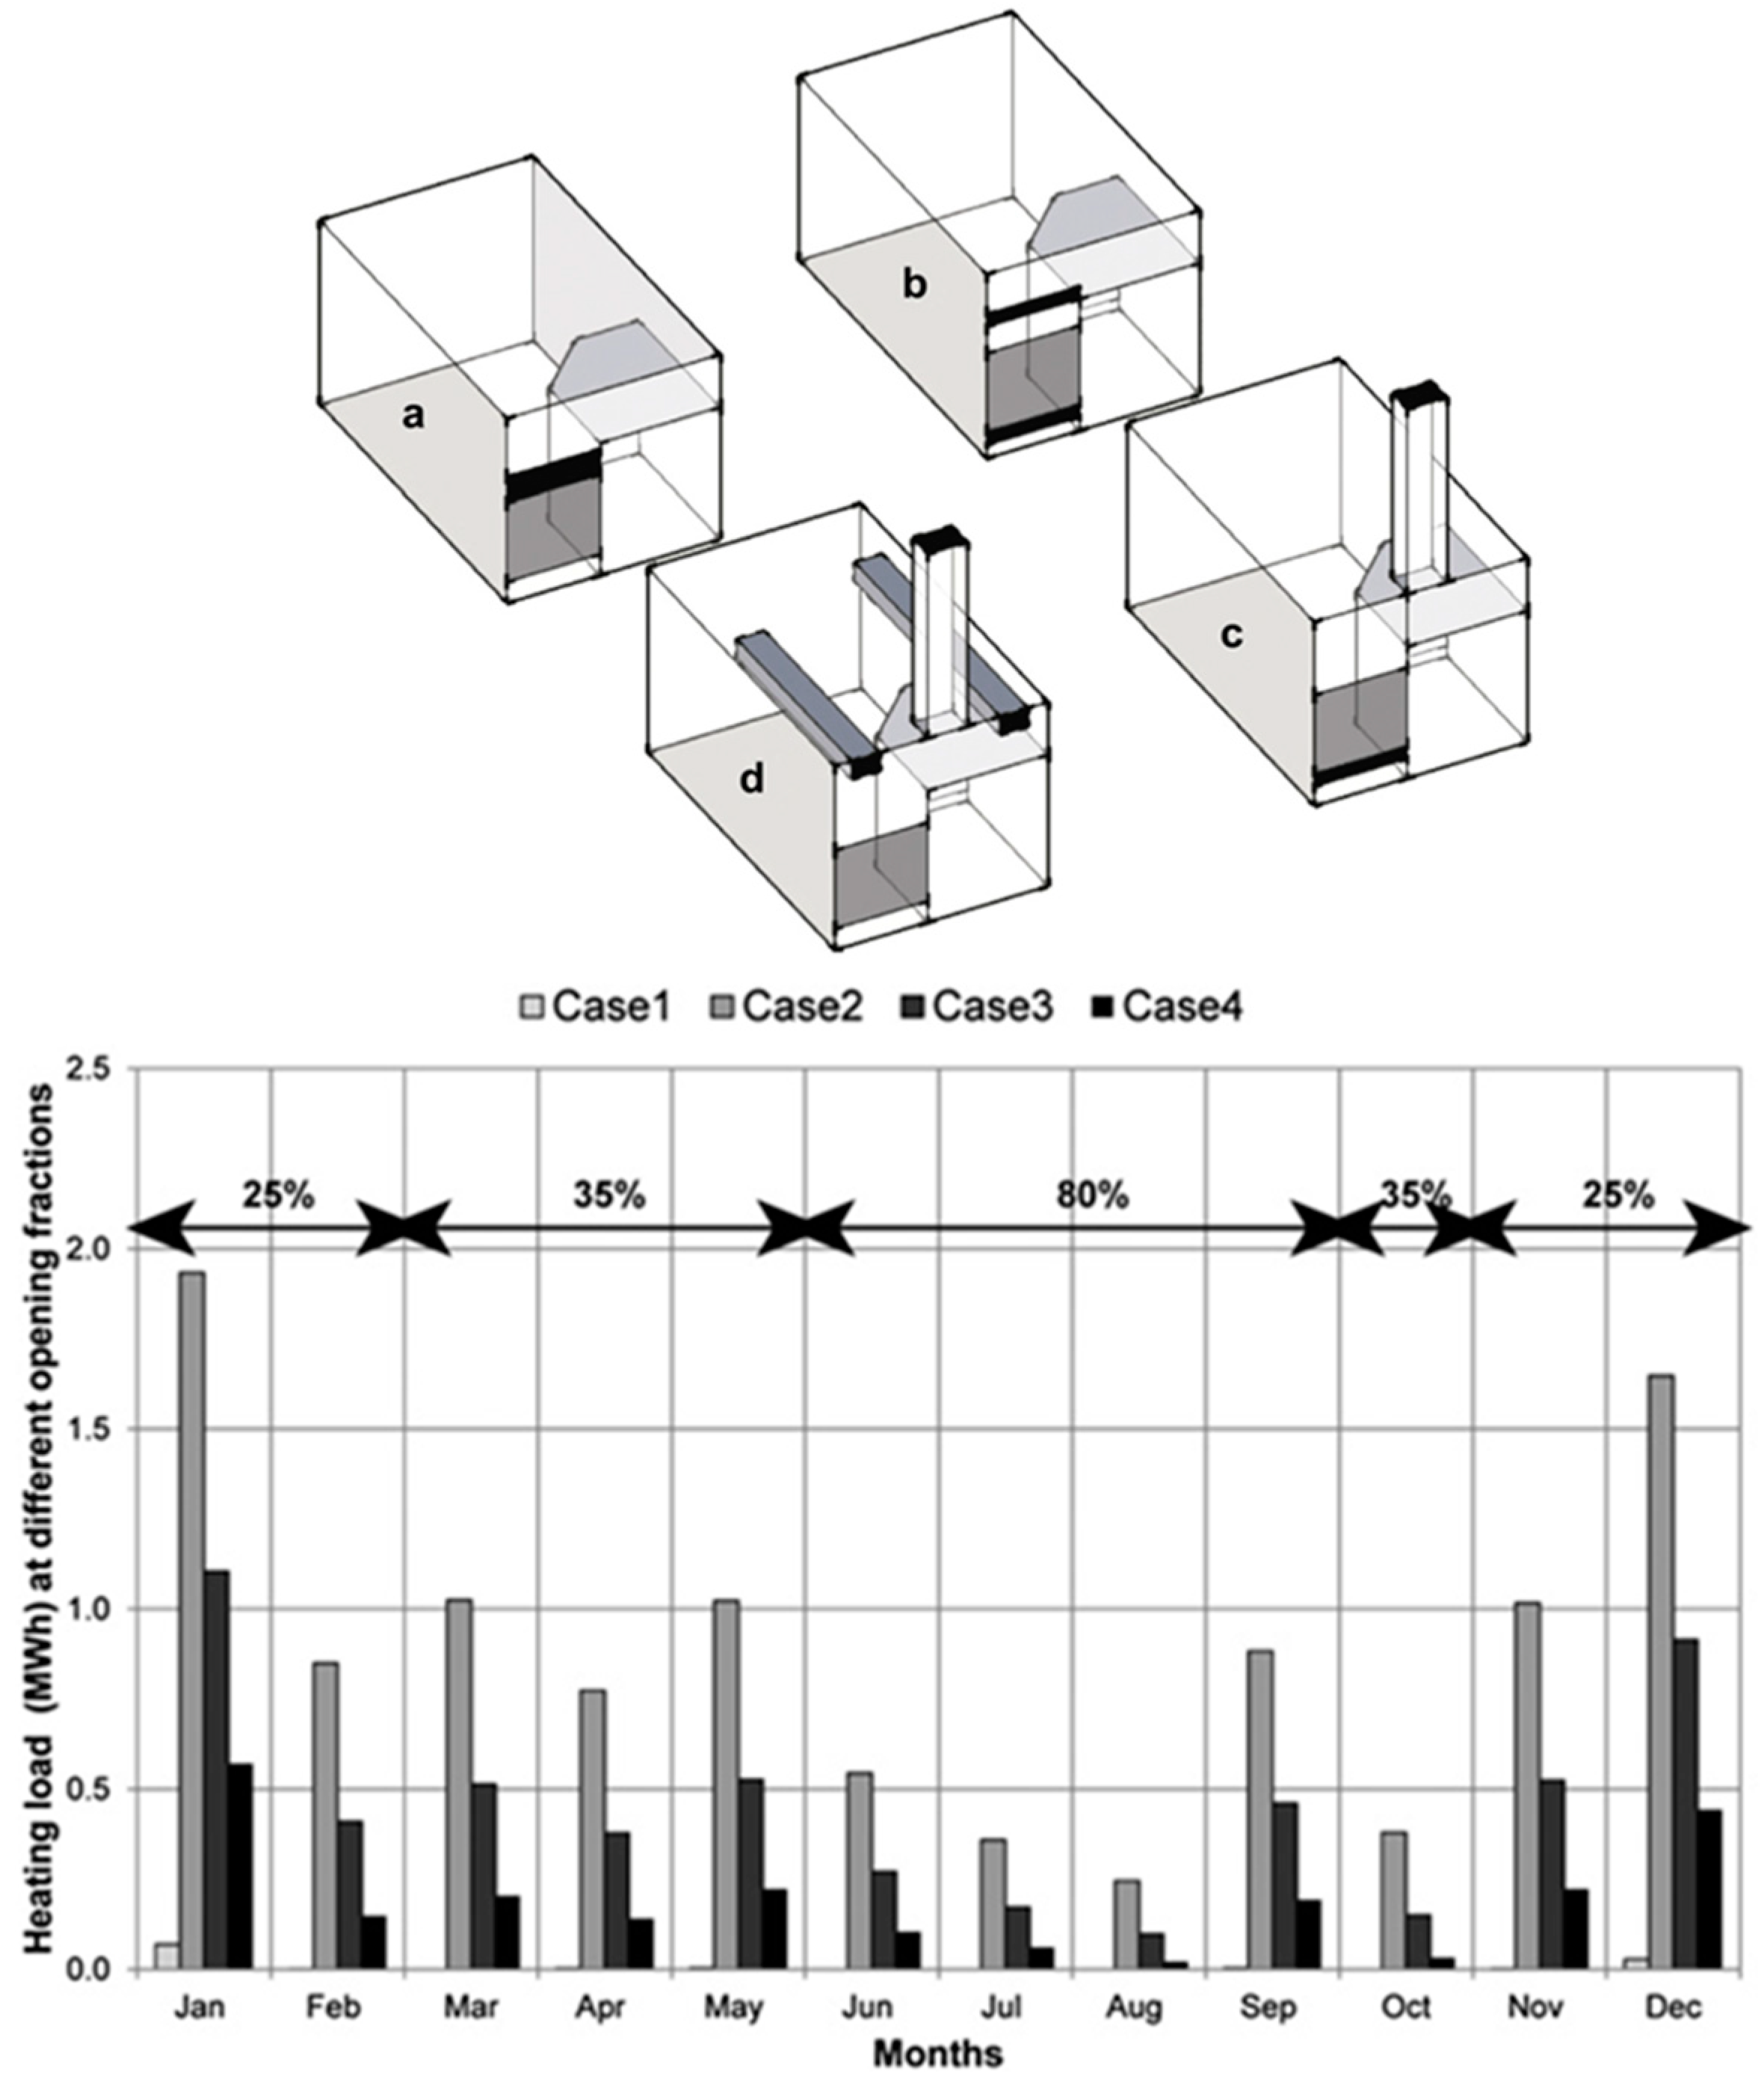
6.1. Simulation Studies about the Effect of Trickle Vents and Their Control
6.1.1. EnergyPlus
6.1.2. CFD
6.1.3. CONTAM
6.2. Experimental Studies about the Effect of Trickle Vents
6.3. Survey Studies about the Draught Risk of Trickle Vents
6.4. Costing
7. Summary and Conclusions
- -
- A heating load decrease between 40% and 95% in DCPV in comparison with PSV in Plymouth conditions.
- -
- DCV results in energy savings of 27% in comparison with an air-tight standard Belgian dwelling.
- -
- Night cooling in the heating period leads to additional heat loss.
Funding
Acknowledgments
Conflicts of Interest
References
- Guyot, G.; Sherman, M.H.; Walker, I.S. Smart ventilation energy and indoor air quality performance in residential buildings: A review. Energy Build. 2018, 165, 416–430. [Google Scholar] [CrossRef]
- World Health Organizatıon. Burden of Disease from Household Air Pollution for 2012. 2014. Available online: http://www.who.int/phe/health_topics/outdoorair/databases/FINAL_HAP_AAP_BoD_24March2014.pdf (accessed on 2 July 2018).
- Sick Building Syndrome. Hon Kong Lung Foundation. Available online: http://www.hklf.org/index/education-information/sick-building-syndrome (accessed on 5 June 2018).
- Biler, A.; Ozgul, Z.; Burch, P. New Generation Ventilation System: Trickle Vent. In Proceedings of the Facade Tectonics World Congress Conference, Los Angeles, CA, USA, 10–11 October 2016; pp. 417–427. [Google Scholar]
- European Committe for Standardization (CEN). CEN/TR 14788:2006 Ventilation for Buildings—Design and Dimensioning of Residential Ventilation Systems; CEN: Brussels, Belgium, 2006. [Google Scholar]
- European Collaborative Action (ECA). Indoor Air Quality & Its Impact on Man—Report No. 11—Guidelines for Ventilation Requirements in Buildings; ECA: Luxembourg, 1992. [Google Scholar]
- World Meteorological Organization. Green House Gas Bulletin; WHO: Geneva, Switzerland, 2017. [Google Scholar]
- CEN. PD CR 1752-1999: Ventilation for Buildings-Design Criteria for Indoor Environment; CEN: Brussels, Belgium, 1999. [Google Scholar]
- United Nations. Carbon Dioxide Levels Surge to New High in 2016, UN Weather Agency Reports. 2017. Available online: http://www.un.org/en/sections/issues-depth/climate-change/%0Ahttp://www.un.org/en/sections/issues-depth/climate-change/index.html (accessed on 21 October 2018).
- Laverge, J.; van den Bossche, N.; Heijmans, N.; Janssens, A. Energy saving potential and repercussions on indoor air quality of demand controlled residential ventilation strategies. Build. Environ. 2011, 46, 1497–1503. [Google Scholar] [CrossRef]
- British Standards Institution. BS EN 13779:2007 Ventilation for Non-Residential Buildings—Performance Requirements for Ventilation and Room-Conditioning Systems; British Standards Institution: London, UK, 2007. [Google Scholar]
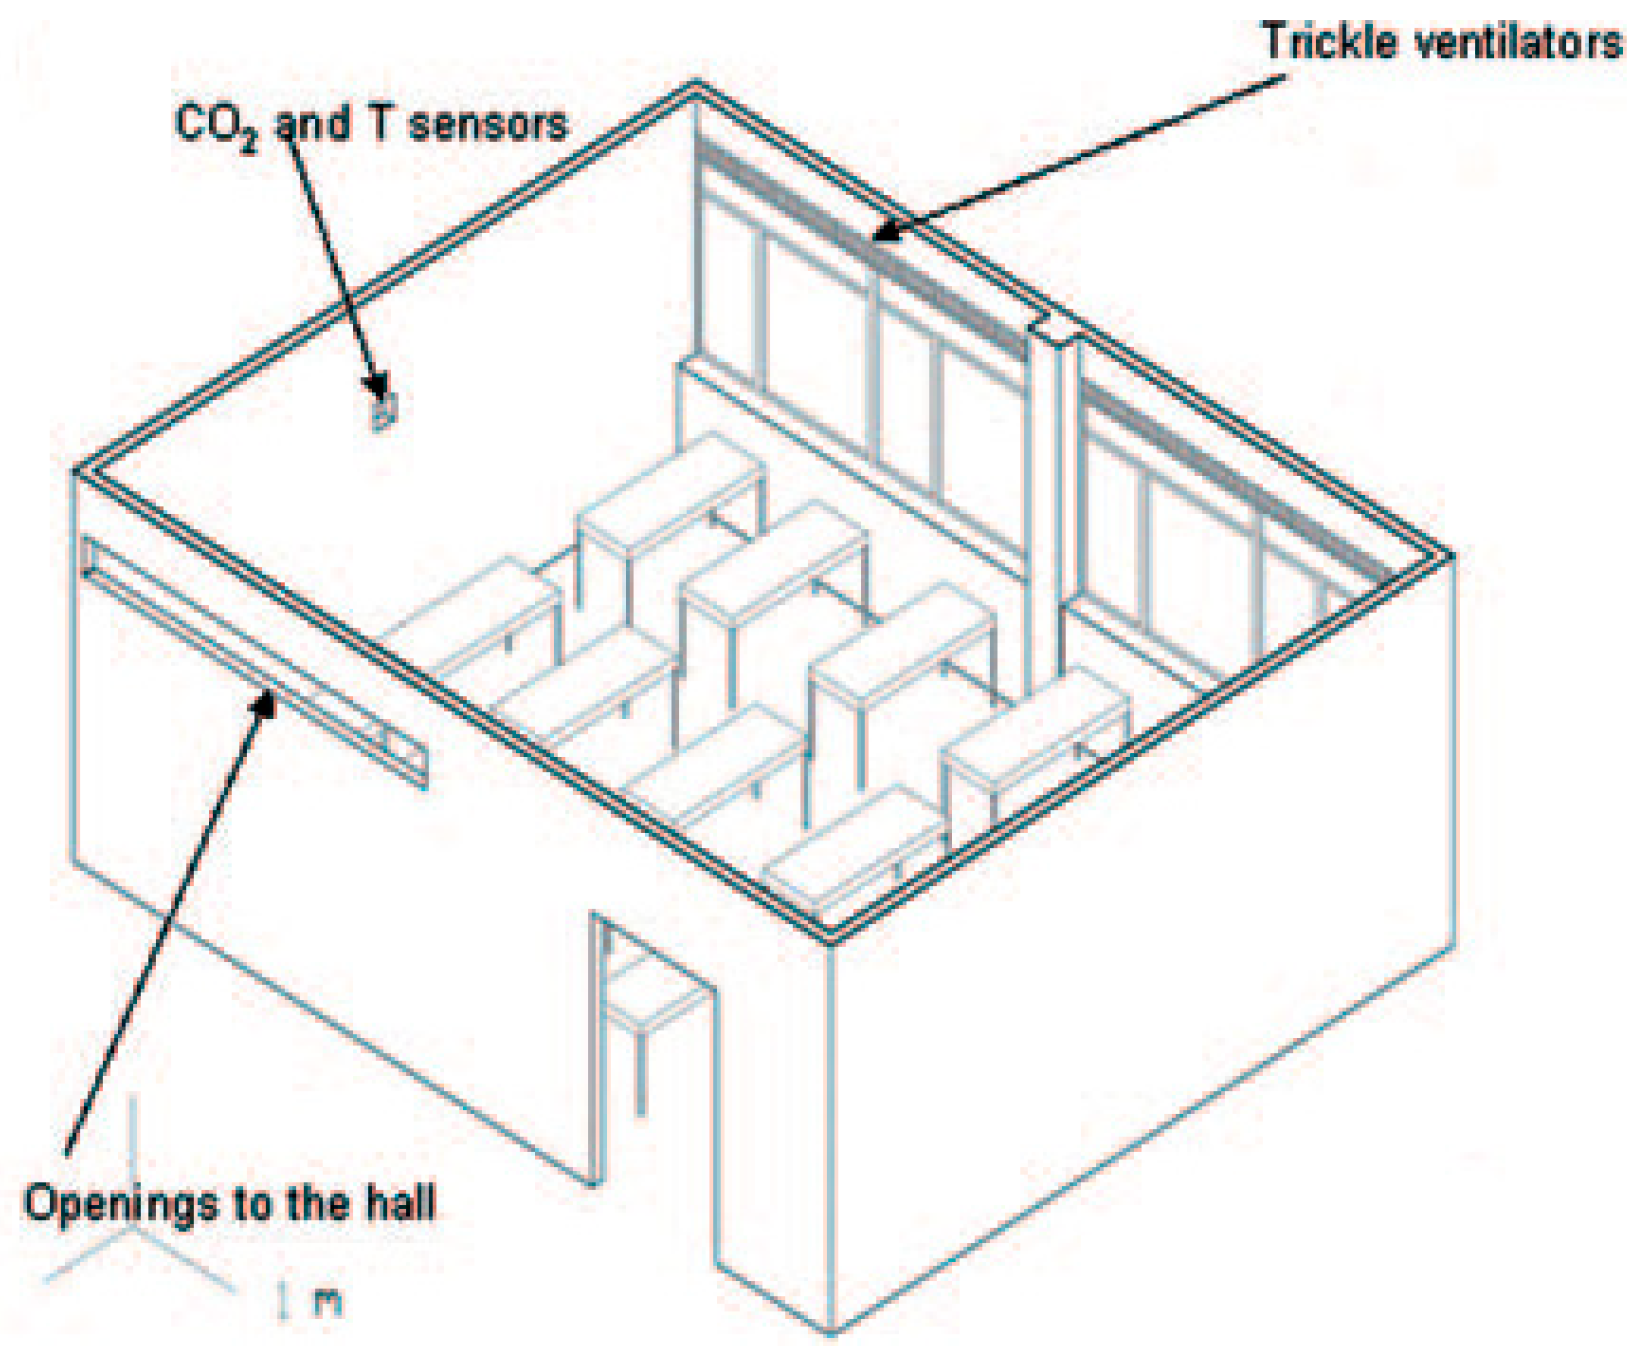
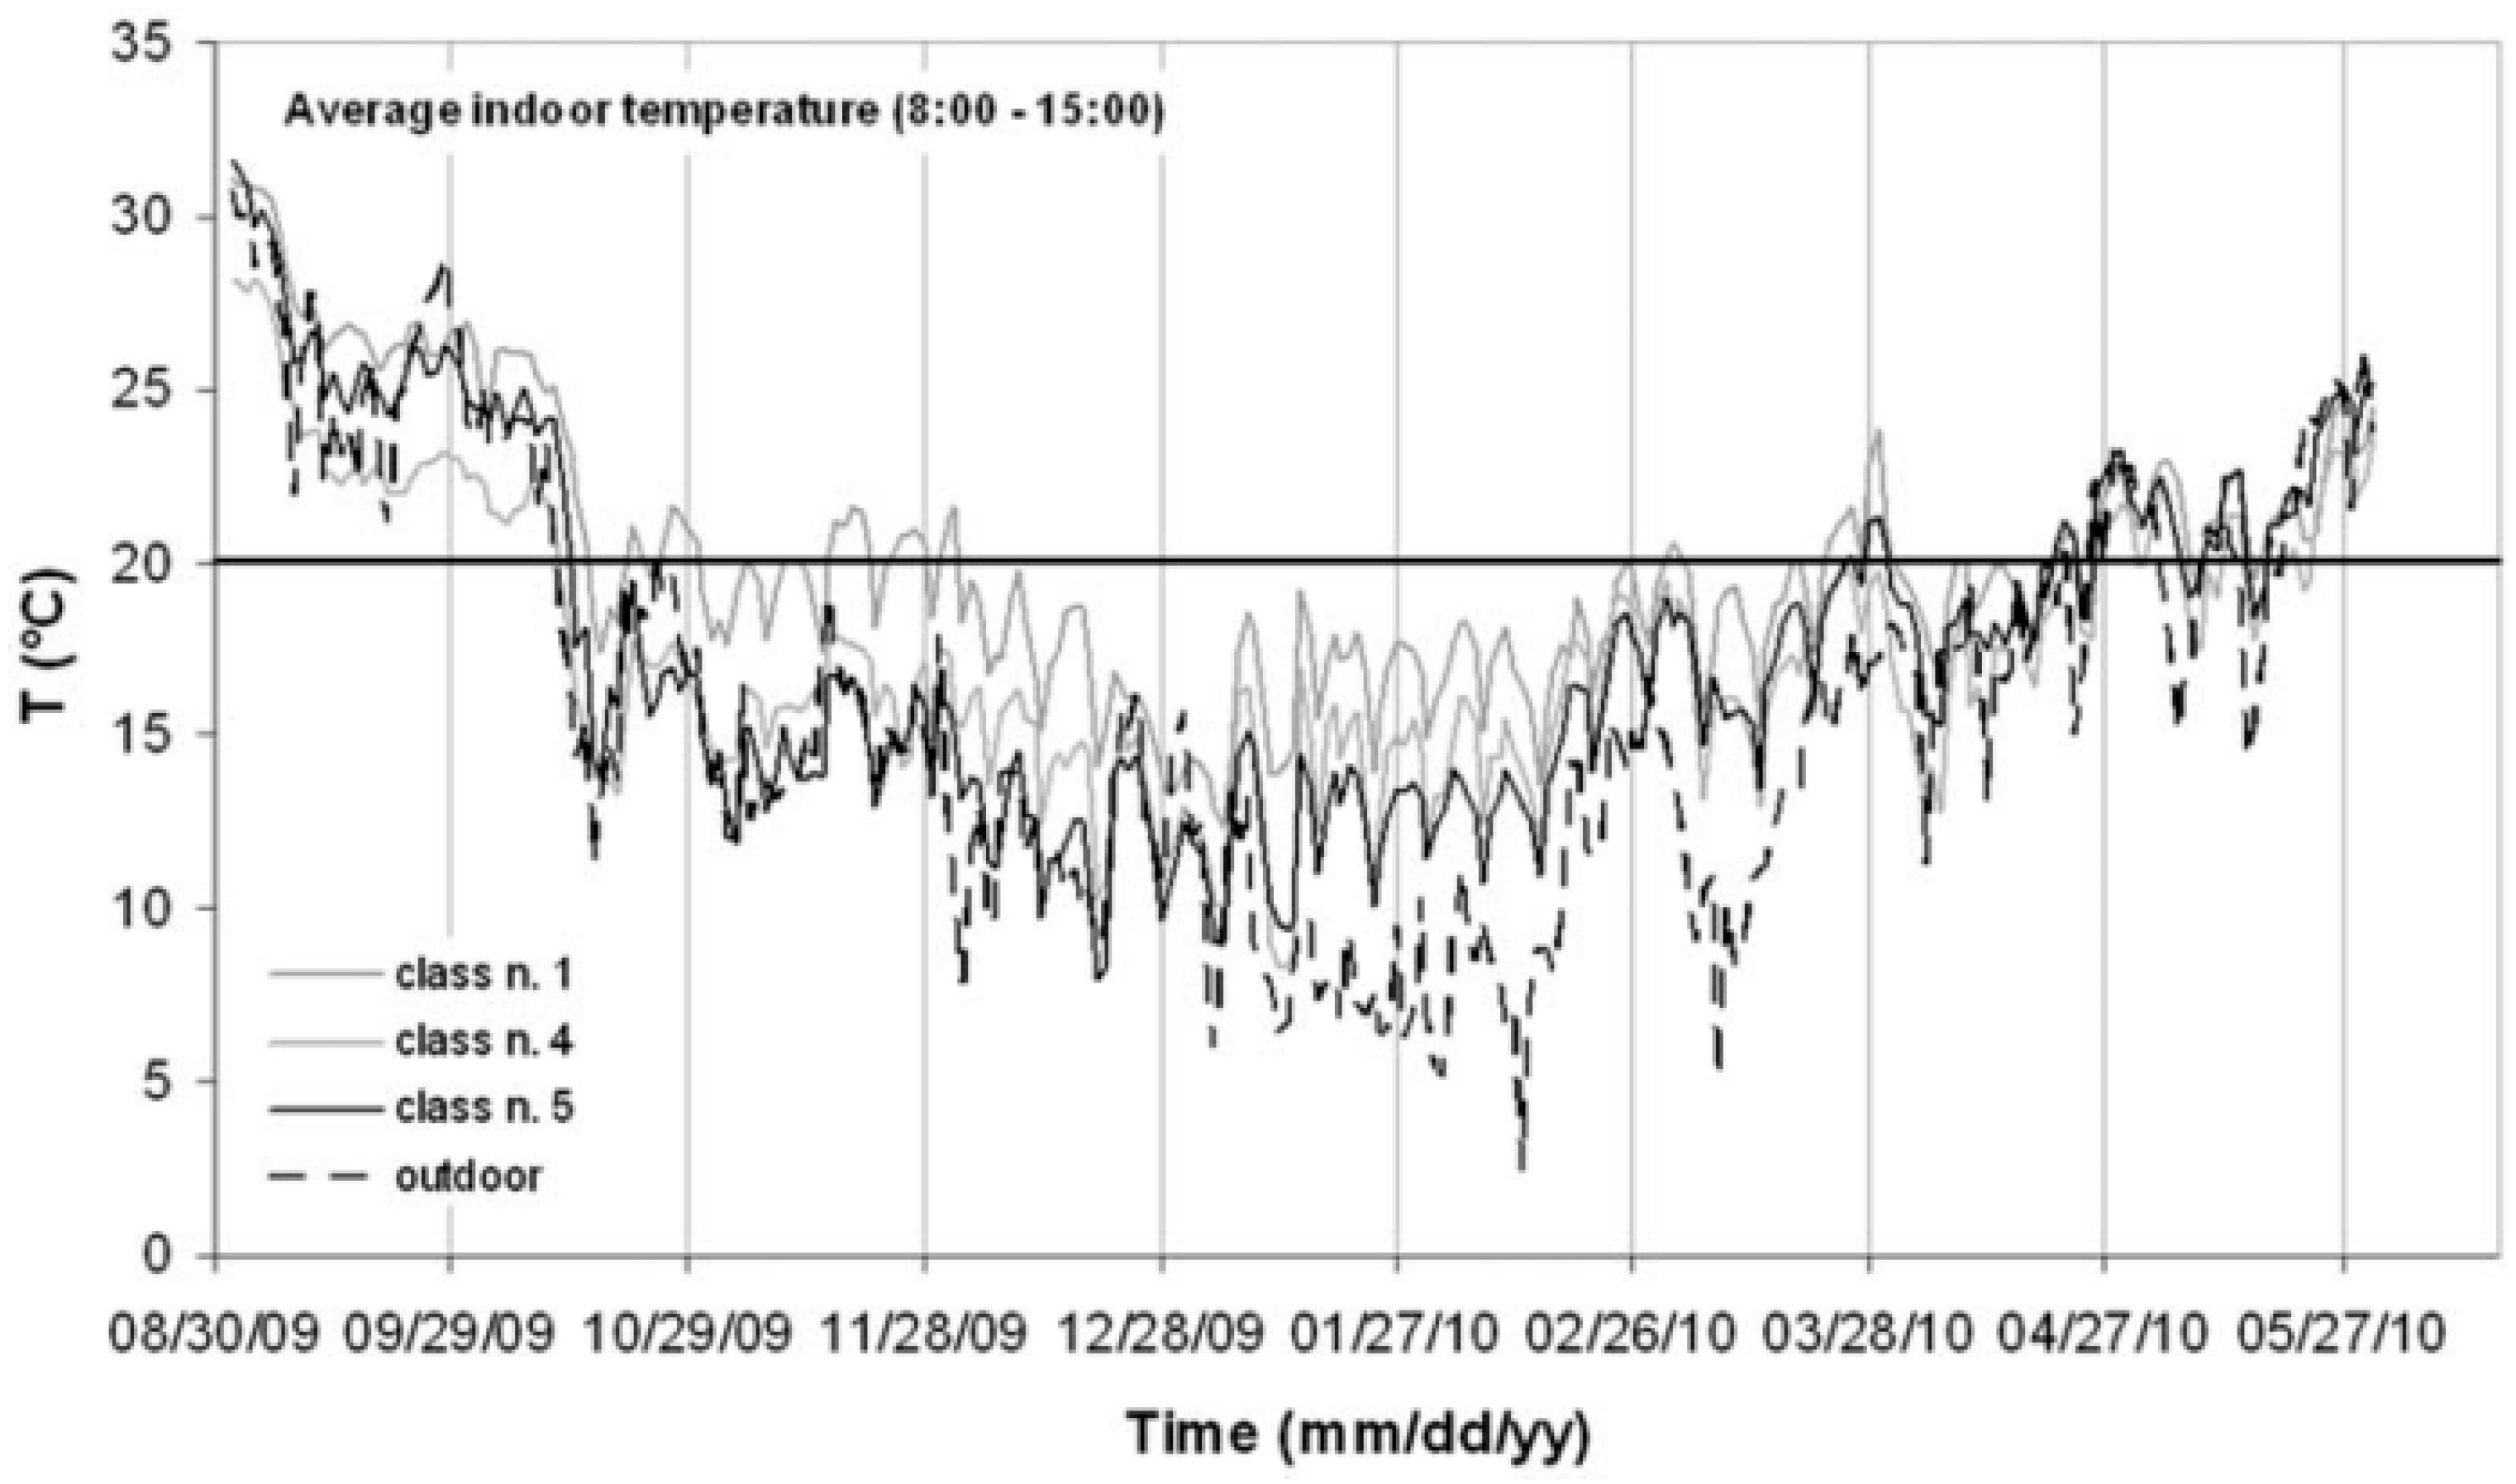
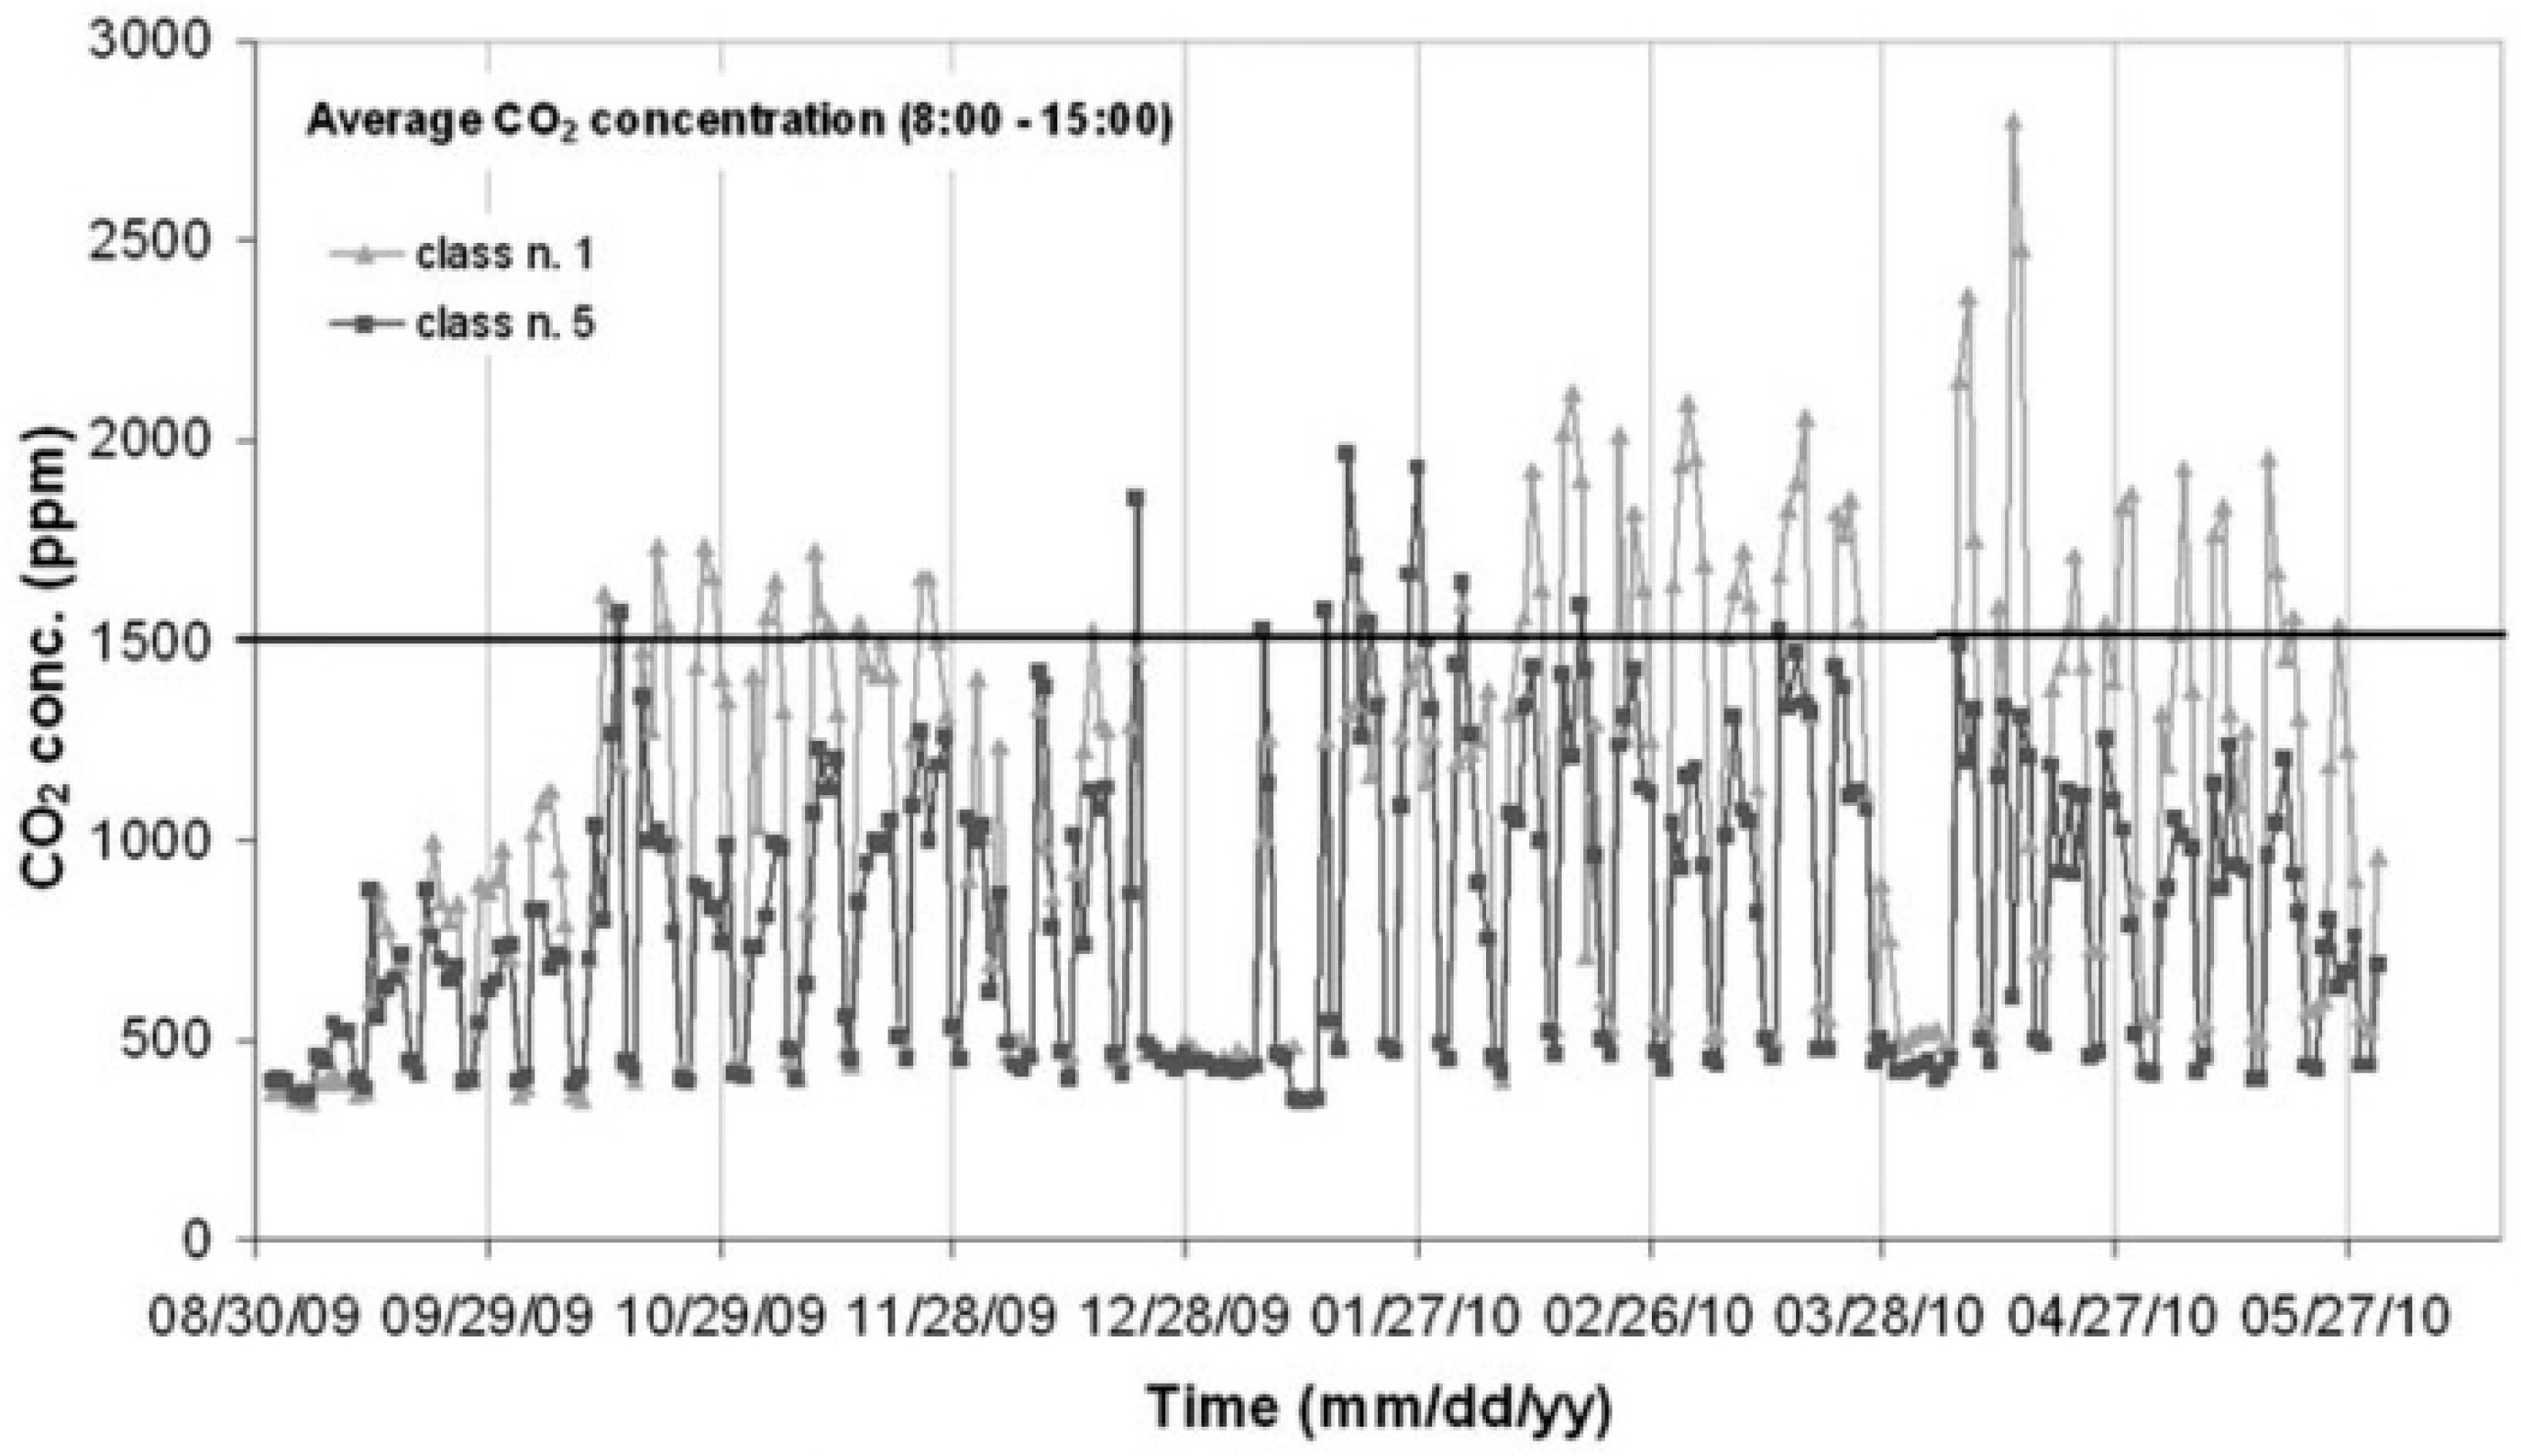
- Cornaro, C.; Paravicini, A.; Cimini, A. Monitoring indoor carbon dioxide concentration and effectiveness of natural trickle ventilation in a middle school in rome. Indoor Built Environ. 2013, 22, 445–455. [Google Scholar] [CrossRef]
- American Society of Heating, Refrigerating and Air-Conditioning Engineers (ASHRAE). ASHRAE 62.1 Ventilation for Acceptable Indoor Air Quality; ASHRAE: Atlanta, GA, USA, 2016. [Google Scholar]
- Biler, A. The ICBEST Conference, Istanbul, Turkey, 15–18 May 2017. Available online: http://www.itu.edu.tr/en/search/events/2017/05/15/itu-etkinlik/-icbest-istanbul-2017- (accessed on 5 November 2018).
- Southall, R.G. An assessment of the potential of supply-side ventilation demand control to regulate natural ventilation flow patterns and reduce domestic space heating consumption. Energy Build. 2018, 168, 201–214. [Google Scholar] [CrossRef]
- Autodesk Sustainability Workshops. Natural Ventilation. Available online: https://sustainabilityworkshop.autodesk.com/buildings/natural-ventilation (accessed on 21 May 2018).
- Kuismanen, K. Climate and Ventilation. ECONO. 2007. Available online: http://www.kuismanen.fi/VentEn.pdf (accessed on 10 September 2018).
- Adamu, Z.A.; Price, A.D.F.; Cook, M.J. Performance evaluation of natural ventilation strategies for hospital wards—A case study of Great Ormond Street Hospital. Build. Environ. 2012, 56, 211–222. [Google Scholar] [CrossRef]
- Price Industries Ltd. Engineering Guide Natural Ventilation; Section K; Price Industries Ltd.: London, UK, 2011. [Google Scholar]
- Concepts and Types of Ventilation. Available online: https://www.ncbi.nlm.nih.gov/books/NBK143277 (accessed on 31 August 2018).
- Passivent, Night Cooling. Available online: http://www.passivent.com/night-cooling (accessed on 5 July 2018).
- Autodesk Sustainablility Workshops. Night-Purge Ventilation. 2015. Available online: https://sustainabilityworkshop.autodesk.com/buildings/night-purge-ventilation (accessed on 24 April 2018).
- Dogbeh, A.; Jomaas, G.; Bjarløv, S.P.; Toftum, J. Field study of the indoor environment in a Danish prison. Build. Environ. 2014, 88, 20–26. [Google Scholar] [CrossRef]
- Evola, G.; Gagliano, A.; Marletta, L.; Nocera, F. Controlled mechanical ventilation systems in residential buildings: Primary energy balances and financial issues. J. Build. Eng. 2017, 11, 96–107. [Google Scholar] [CrossRef]
- Andersen, R.; Fabi, V.; Toftum, J.; Corgnati, S.P.; Olesen, B.W. Window opening behaviour modelled from measurements in Danish dwellings. Build. Environ. 2013, 69, 101–113. [Google Scholar] [CrossRef]
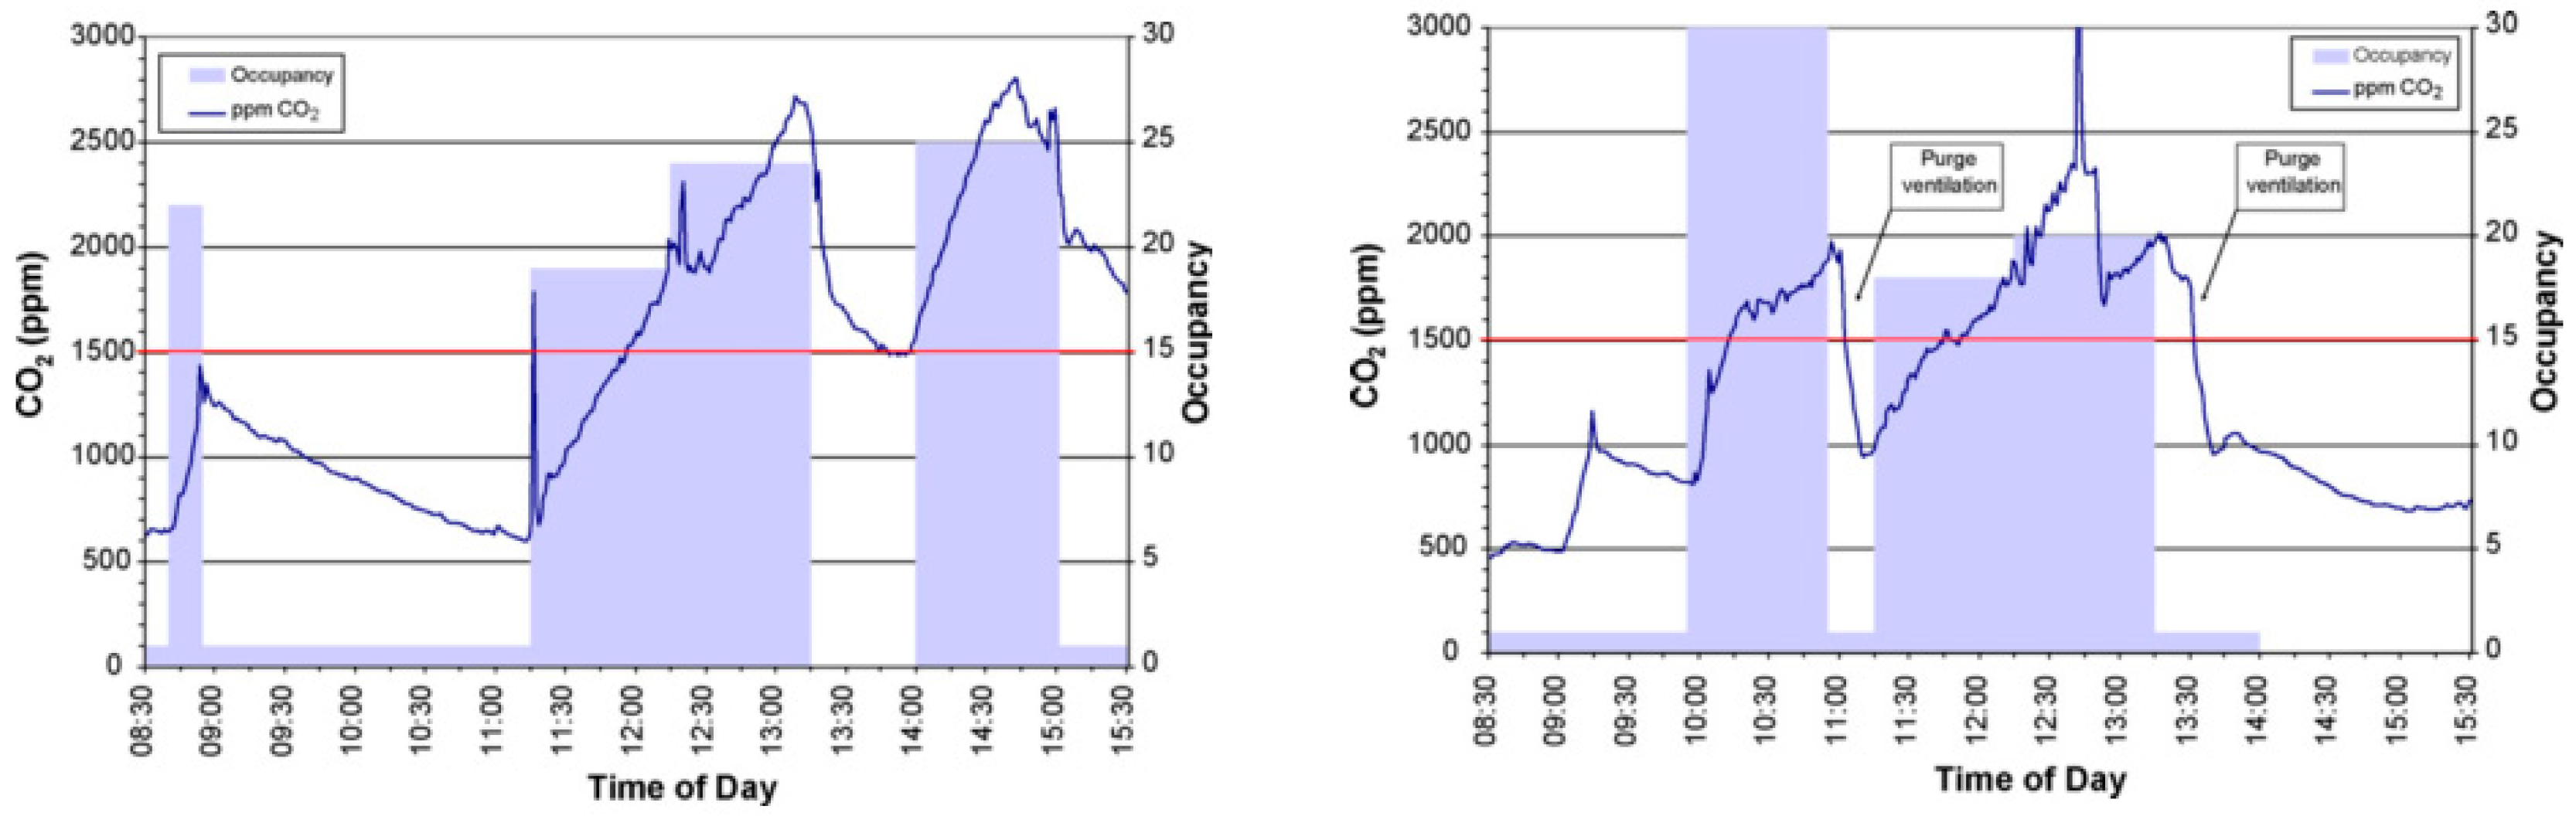
- Griffiths, M.; Eftekhari, M. Control of CO2 in a naturally ventilated classroom. Energy Build. 2008, 40, 556–560. [Google Scholar] [CrossRef]
- Autodesk Sustainablility Workshops. Wind Ventilation. Available online: https://sustainabilityworkshop.autodesk.com/buildings/wind-ventilation (accessed on 14 May 2018).
- Liddament, M.W. A Guide to Energy Efficient Ventilation; Air Infilteration and Ventilation Center (AIVC), 1996; Available online: http://www.aivc.org/sites/default/files/members_area/medias/pdf/Guides/GU03 GUIDE TO ENERGY EFFICIENT VENTILATION.pdf (accessed on 25 April 2018).
- Autodesk Sustainablility Workshops. Stack Ventilation and Bernoulli’s Principle. Available online: https://sustainabilityworkshop.autodesk.com/buildings/stack-ventilation-and-bernoullis-principle (accessed on 14 May 2018).
- Green Building Advisor. The Stack Effect: When Buildings Act Like Chimneys Welcome to Green Building Advisor. Available online: http://www.greenbuildingadvisor.com/stack-effect-when-buildings-act-chimneys (accessed on 14 May 2018).
- Awbi, H.B. Design Considerations For Naturally Ventilated Buildings. Renew. Energy 1994, 5, 1081–1090. [Google Scholar] [CrossRef]
- Department for Edcuation. Building Bulletin 101—Ventilation of School Buildings; Department for Edcuation: London, UK, 2006; pp. 1–62.
- Khan, N.; Su, Y.; Riffat, S.B. A review on wind driven ventilation techniques. Energy Build. 2008, 40, 1586–1604. [Google Scholar] [CrossRef]
- Mochida, A.; Yoshino, H.; Takeda, T.; Kakegawa, T.; Miyauchi, S. Methods for controlling airflow in and around a building under cross-ventilation to improve indoor thermal comfort. J. Wind Eng. Ind. Aerodyn. 2005, 93, 437–449. [Google Scholar] [CrossRef]
- The Basics of Home Ventilation. Available online: https://www.myglazing.com/be-informed/trickle-vents-and-types-of-ventilation/ (accessed on 16 April 2018).
- Galvin, R. Impediments to energy-efficient ventilation of German dwellings: A case study in Aachen. Energy Build. 2013, 56, 32–40. [Google Scholar] [CrossRef]
- Department of Health/Estates and Facilities Division. Health Technical Memorandum 03-01: Specialised Ventilation for Healthcare Premises. Part A—Design and Installation; Department of Health and Social Care: London, UK, 2007.
- Atkinson, J.; Chartier, Y.; Pessoa-Silva, C.L.; Jensen, P.; Li, Y.; Seto, W.-H. Natural Ventilation for Infection Control in Health-Care Settings. World Heal. Organ. 2009, 1, 133. [Google Scholar]
- CIBSE. Natural Ventilation in Non-Domestic Buildings, CIBSE Application Manual AM010; CIBSE: London, UK, 2005; p. 64. [Google Scholar]
- HM Government. NBS 2010b The Building Regulations 2010 For England and Wales, Part F; HM Government: London, UK, 2013.
- Kolokotroni, M.; Marshall, S.G.; Perera, M.D. Trickle Ventilators: Effective Natural Background Ventilation for Offices. In Proceedings of the AIVC Conference, Palm Springs, CA, USA, 19–22 September 1995. [Google Scholar]
- Wiki, D.B. Trickle Ventilation in Buildings. Available online: https://www.designingbuildings.co.uk/wiki/Convection_in_buildings (accessed on 16 April 2018).
- Renson, Sonoslot Range. Available online: dam.renson.eu/Sites/A/Public_Publications/2034?encoding=UTF-8 (accessed on 27 July 2018).
- Brookvent, Window Ventilation Product Technical Data Sheet. 2016. Available online: https://brookvent.co.uk/wp-content/uploads/2018/04/Window-Ventilation-Brochure.pdf (accessed on 29 August 2018).
- Karava, P.; Stathopoulos, T.; Athienitis, A.K. Investigation of the performance of trickle ventilators. Build. Environ. 2003, 38, 981–993. [Google Scholar] [CrossRef]
- Brookvent, Surface Mounted Window Vents. Available online: https://brookvent.co.uk/surface-mount-window-vents/ (accessed on 18 April 2018).
- Brookvent, Glazed-in Window Vents. Available online: https://brookvent.co.uk/glazed-in-window-vents/ (accessed on 18 April 2018).
- RENSON. Window Ventilators. 2007. Available online: http://www.rensonuk.net/documentation-united-kingdom_2.html (accessed on 19 April 2018).
- CIBSE. CIBSE Guide B2—Ventilation and Ductwork; CIBSE: London, UK, 2016. [Google Scholar]
- Brookvent—SM 1000 Trickle Vent. Available online: https://brookvent.co.uk/product/airvent-sm-1000-trickle-vent/ (accessed on 24 July 2018).
- Brookvent Ventilation Systems. Available online: https://brookvent.co.uk/product/dg-1500-window-vent/ (accessed on 23 July 2018).
- Erguner, B. Partial Natural Ventilation System Developed for Curtain Walls. TR 2013/08326, 10 July 2013. [Google Scholar]
- Biler, A.; Erguner, B. Vertical Natural Ventilation Device. TR 2016/17175, 24 November 2016. [Google Scholar]
- Renson, L.L. Ventilation Device with Internal Heating System. EP 2 639 519 A1, 6 February 2013. [Google Scholar]
- Meinster, J.P.; de Neve, A.D.M.A. Ventilation Grille. EP 2995879A1, 16 March 2016. [Google Scholar]
- Dewachter, R.J.P. Ventilation Device. EP2141424A2, 1 July 2009. [Google Scholar]
- Anderson, J.N.; Stoney, A. Slot Ventilator. U.S. Patent 005702297A, 30 December 1997. [Google Scholar]
- Peak, R.A.; Anderson, J.N. Slot Ventilator Mounted on a Window or Door to Be Ventilated. GB 2432656 A, 30 May 2007. [Google Scholar]
- British Standards Institution. BS EN 13141-1:2004 Ventilation for Buildings—Components/Products for Residential Ventilation; British Standards Institution: London, UK, 2004. [Google Scholar]
- British Standard Institution. BS EN 20140:10:1992 Acoustics—Measurement of Sound Insulation in Buildings and of Building Elements; British Standard Institution: London, UK, 1992. [Google Scholar]
- Comittee European de Normalisation. EN ISO 140-10 Acoustics—Measurement of Sound Insulation in Buildings and of Building Elements; CEN: Brussels, Belgium, 2009. [Google Scholar]
- British Standard Institution. BS EN ISO 717-2 Acoustics—Rating of Sound Insulation in Buildings and of Building Elements Part 1: Airborne Sound Insulation; British Standard Institution: London, UK, 2013. [Google Scholar]
- British Standard Institution. BS EN 1027: 2016 Windows and Doors—Water Tightness—Test Method; British Standard Institution: London, UK, 2016. [Google Scholar]
- British Standard Institution. BS EN 1026: 2016 Windows and Doors—Air Permeability—Test Method; British Standard Institution: London, UK, 2016. [Google Scholar]
- British Standard Institution. BS EN ISO 10077-2: 2017 Thermal Performance of Windows, Doors and Shutters—Calculation of Thermal Transmittance; British Standard Institution: London, UK, 2017. [Google Scholar]
- Comittee European de Normalisation. EN 1627:2011 Pedestrian Doorsets, Windows, Curtain Walling, Grilles and Shutters—Burglar Resistance—Requirements and Classification; CEN: Brussels, Belgium, 2011. [Google Scholar]
- Comittee European de Normalisation. EN 1628: 2011 Windows, Curtain Walling, Grilles and Shutters—Burglar Resistance—Test Method for the Determination of Resistance under Static Loading; CEN: Brussels, Belgium, Brussels, 2011. [Google Scholar]
- Comittee European de Normalisation. EN 1629: 2011 Pedestrian Doorsets, Windows, Curtain Walling, Grilles and Shutters—Burglar Resistance—Test Method for the Determination of Resistance under Dynamic Loading; CEN: Brussels, Belgium, 2015. [Google Scholar]
- Comittee European de Normalisation. EN 1630: 2011 Pedestrian Doorsets, Windows, Curtain Walling, Grilles and Shutters—Burglar Resistance—Test Method for the Determination of Resistance to Manual Burglary Attempt; CEN: Brussels, Belgium, 2011. [Google Scholar]
- Wood, A.; Ruba, S. Natural Ventilation in High-Rise Office Buildings; CTBUH: Chicago, IL, USA, 2013. [Google Scholar]
- British Standard Institution. BS EN 12792-3 Ventilation for Buildings—Symbols, Terminology and Graphical Symbols; British Standard Institution: London, UK, 2003. [Google Scholar]
- British Standard Institution. BS 5925: 1991 Ventilation Principles and Designing for Natural Ventilation; British Standard Institution: London, UK, 1991. [Google Scholar]
- Nielsen, T.R.; Drivsholm, C. Energy efficient demand controlled ventilation in single family houses. Energy Build. 2010, 42, 1995–1998. [Google Scholar] [CrossRef]
- British Standards Institution. BS EN 15251: 2007 Indoor Environmental Input Parameters for Design and Assessment of Energy Performance of Buildings Addressing Indoor Air Quality, Thermal Environment, Lighting and Acoustics; British Standard: London, UK, 2008. [Google Scholar]
- Caillou, S.; Heijmans, N.; Laverge, J.; Janssens, A. Méthode de calcul PER: Facteurs de Réduction Pour la Ventilation à la Demande; Ghent University: Ghent, Belgium, 22 April 2014. [Google Scholar]
- Savin, J.; Berthin, S.; Jardinier, M. Demand-controlled ventilation 20 years of in-situ monitoring in the residential field. In Proceedings of the 35th AIVC Conference “Ventilation and airtightness in transforming the building stock to high performance”, Poznań, Poland, 24–25 September 2014. [Google Scholar]
- Arendt, K.; Krzaczek, M. Co-simulation strategy of transient CFD and heat transfer in building thermal envelope based on calibrated heat transfer coefficients. Int. J. Therm. Sci. 2014, 85, 1–11. [Google Scholar] [CrossRef]
- Van den Bossche, N.; Janssens, A.; Heijmans, N.; Wouters, P. Performance Evaluation of Humidity-Controlled Ventilation Strategies in Residential Buildings. In Proceedings of the Thermal Performance of the Exterior Envelopes of Whole Buildings X, Clearwater Beach, FL, USA, 2–7 December 2007; pp. 1–7. [Google Scholar]
- Rennie, D.; Parand, F. Environmental Design Guide For Naturally Ventilated Daylit Offices; BRE Rep. No. BR 345; Construction Research Communications: London, UK, 1998. [Google Scholar]
- Renson, Oxyvent Product Catalogue. Available online: http://www.rensonuk.net/products/downloads.aspx?productgroep=Ventilatie&product=Window+vent+Oxyvent%3A+Flap+ventilator+for+conservatories (accessed on 28 June 2018).
- American Society for Testing and Materials. Standard Test Method for Field Measurement of Air Leakage through Installed Exterior Windows and Doors; ASTM: West Conshohocken, PA, USA, 2010. [Google Scholar]
- R.W. Simon Ltd. Airstrip 19000 Product Technical Data Sheet. Available online: https://www.rwsimon.co.uk/wp-content/uploads/2018/07/Airstrip-19000.pdf (accessed on 28 June 2018).
- R.W. Simon Ltd. Airstrip 200 Product Technical Data Sheet. Available online: https://www.rwsimon.co.uk/wp-content/uploads/2015/02/Simon-Airstrip200-NEW-STYLE-red.pdf (accessed on 28 June 2018).
- Renson Ventilation, AK80 Product Evo Technical Data Sheet. Available online: http://rensonuk.net/documentation-united-kingdom_2.html (accessed on 28 June 2018).
- Biler, A. Trickle Vent—Integrated Curtain Wall Natural Ventilation System. In Proceedings of the ICBEST Conference, Istanbul, Turkey, 15–18 May 2017. [Google Scholar]
- Fox, M.; Coley, D.; Goodhew, S.; de Wilde, P. Time-lapse thermography for building defect detection. Energy Build. 2015, 92, 95–106. [Google Scholar] [CrossRef]
- Biler, A. Identification of Closed Cavity Façades in Terms of Condensation Risk and Energy Performance; Istanbul Technical University: Istanbul, Turkey, 2015. [Google Scholar]
- Alduchov, O.A.; Eskridge, R.E. Improved Magnus Form Approximation of Saturation Vapor Pressure. J. Appl. Meteorol. 1996, 35, 601–609. [Google Scholar] [CrossRef]
- Ozgul, Z.; Biler, A.; Burch, P. Slide and Push: Integrated Curtain Wall Sliding System. In Proceedings of the Facade Tectonics World Congress Conference, Los Angeles, CA, USA, 10–11 October 2016; pp. 429–438. [Google Scholar]
- Renson Ventilation, Invisivent Evo. Available online: http://www.rensonuk.net/documentation-united-kingdom_2.html (accessed on 29 June 2018).
- British Standards Institution. BS EN ISO 10140-2:2010 Acoustics—Laboratory Measurement of Sound Insulation of Building Elements Part 2: Measurement of Airborne Sound Insulation; British Standard Institution: London, UK, 2010. [Google Scholar]
- Brookvent, Airvent DG 1500 Technical Data Sheet. Available online: https://brookvent.co.uk/wp-content/uploads/2017/06/airvent-DG-1500-Brookvent-Brochure-2017.pdf (accessed on 29 June 2018).
- AmesburyTruth, Trickle Vent Product Comparison Table. Available online: http://www.amesburytruth.com/downloads/products/Comparison Table 1200.pdf (accessed on 29 June 2018).
- Greenwood, HD Vent Technical Data Sheet. Available online: http://www.greenwood.co.uk/uploads/docs/313.pdf (accessed on 29 June 2018).
- Simon, R.W. Airvent. Available online: https://www.rwsimon.co.uk/wp-content/uploads/2018/07/Simon-Acoustic-Range.pdf (accessed on 29 June 2018).
- Brookvent, Airvent SM1400 Technical Data Sheet. Available online: https://brookvent.co.uk/product/airvent-sm-1400/ (accessed on 29 June 2018).
- Brookvent, Airvent SM Acoustic. Available online: https://brookvent.co.uk/product/airvent-sm-acoustic/ (accessed on 29 June 2018).
- Titon, Trimvent Select S13 Technical Data Sheet. Available online: http://www.titon.co.uk/pages/window-door-hardware/ventilators/slot-vents/trimvent-select-xtra-xs13.php (accessed on 29 June 2018).
- AWS, Passive Ventilation Solutions. Available online: https://www.awsaustralia.com.au/Content/cms/awscdn/files/AWS_VENTIENT_BROCHURE.pdf (accessed on 29 June 2018).
- Greenwood, 5000EA Slotvent Technical Data Sheet. 2016. Available online: http://www.dmtf.org/standards/cim/cim_schema_v2480 (accessed on 29 August 2018).
- Simon, R.W. TFF Slimline Trickle Vent Product. Available online: https://www.rwsimon.co.uk/wp-content/uploads/2018/07/Slimline.pdf (accessed on 29 June 2018).
- Computational Modeling|National Institute of Biomedical Imaging and Bioengineering. Available online: https://www.nibib.nih.gov/science-education/science-topics/computational-modeling (accessed on 10 September 2018).
- EnergyPlus. 1996. Available online: https://energyplus.net/ (accessed on 10 September 2018).
- Rallapalli, H.S. A Comparison of EnergyPlus and eQUEST Whole Building Energy Simulation Results for a Medium Sized Office Building; Arizona State University: Tempe, AZ, USA, 2013. [Google Scholar]
- Bakker, A. Lecture 1—Introduction to CFD Applied Computational Fluid Dynamics; Fluent Inc.: Queens, NY, USA, 2002. [Google Scholar]
- Dols, W.S.; Polidoro, B.J. CONTAM User Guide and Program Documentation—Version 3.2 (NIST Technical Note 1887); NIST: Gaithersburg, MD, USA, 2015; p. 1. [Google Scholar]
- Das, P.; Shrubsole, C.; Jones, B.; Hamilton, I.; Chalabi, Z.; Davies, M.; Mavrogianni, A.; Taylor, J. Using Probabilistic Sampling-based Sensitivity Analyses for Indoor Air Quality Modelling. Build. Environ. 2014, 78, 171–182. [Google Scholar] [CrossRef]
- Dols, W.S.; Emmerich, S.J.; Polidoro, B.J. Coupling the multizone airflow and contaminant transport software CONTAM with EnergyPlus using co-simulation. Build. Simul. 2016, 9, 469–479. [Google Scholar] [CrossRef] [PubMed]
- Phil, B. What Monitoring Is; Definition and Purpose. The Nature of Monitoring and Evaluation. 2011. Available online: http://cec.vcn.bc.ca/cmp/modules/mon-wht.htm (accessed on 17 September 2018).
- Etheridge, D. A perspective on Fifty Years of Natural Ventilation Research. Build. Environ. 2015, 91, 51–60. [Google Scholar] [CrossRef]
- Salcidoa, J.C.; Raheem, A.A. From simulation to monitoring: Evaluating the potential of mixed-mode ventilation (MMV) systems for integrating natural ventilation in office buildings through a comprehensive literature review. Energy Build. 2016, 127, 1008–1018. [Google Scholar] [CrossRef]
- British Standards Institution. BS EN ISO 12569: 2017 Thermal Performance of Buildings and Materials—Determination of Specific Airflow Rate in Buildings—Tracer Gas Dilution Method; British Standards Institution: London, UK, 2017. [Google Scholar]
- Cotterell, J.; Dadeby, A. The Passivhaus Designer’ s Manual: A Technical Guide to Low and Zero Energy Buildings; Routledge: Abingdon, UK, 2012. [Google Scholar]
- Li, Y.; Nielsen, P.V. Commemorating 20 years of Indoor Air: CFD and ventilation research. Indoor Air 2011, 21, 442–453. [Google Scholar] [CrossRef] [PubMed]
- British Standard Institution. BS EN ISO 6946—Building Components and Building Elements—Thermal Resistance and Thermal Transmittance—Calculation Method; British Standards Institution: London, UK, 2017. [Google Scholar]
- CONTAM. Available online: https://www.nist.gov/services-resources/software/contam (accessed on 21 May 2018).


| Occupancy Category | Outdoor Air Rate | |
|---|---|---|
| per Person (L/s·Person) | per Area (L/s·m2) | |
| Lecture Classroom | 3.8 | 0.3 |
| Computer Lab | 5 | 0.12 |
| Restaurant | 3.8 | 0.9 |
| Conference/Meeting | 2.5 | 0.3 |
| Bedroom/Living Room | 2.5 | 0.3 |
| Office Space | 2.5 | 0.3 |
| Health Club | 10 | 0.3 |
| Image |  |  |  |  |
| Applicant | Metal Yapi | Metal Yapi | Renson | Renson |
| Name of Patent | Partial Natural Ventilation System Developed for Unitized Curtain Wall | Vertical Natural Ventilation Device | Ventilation Device with Internal Heating System | Ventilation Grille |
| Application Number | TR 2013/08326 [52] | TR 2016/17175 [53] | EP 2 639 519 A1 [54] | EP 2 995 879 A1 [55] |
| Image |  |  |  | |
| Applicant | Renson | Titon | Titon | |
| Name of Patent | Ventilation Device | Slot Ventilator | Slot ventilator mounted on a window or door to be ventilated | |
| Application Number | EP 2 141 424 A3 [56] | US005702297A [57] | GB 2432656 A [58] |
| Performance | Standard | The Name of Standard |
|---|---|---|
| Ventilation Capacity | EN 13141-1 [59] | Ventilation for Buildings—Components/Products for Residential Ventilation—Part 1: Externally and internally mounted air transfer devices |
| Acoustics | BS EN 20140:10:1992 [60] | Acoustics—Measurement of sound insulation in buildings and of building elements |
| Acoustics | BS EN 140:10 [61] | Acoustics—Measurement of sound insulation in buildings and of building elements |
| Acoustics | BS EN ISO 717-2 [62] | Acoustics—Rating of sound insulation in buildings and of building elements Part 1: Airborne sound insulation |
| Water Tightness | BS EN 1027: 2016 [63] | Windows and doors—Water tightness—Test method |
| Air Permeability | BS EN 1026: 2016 [64] | Windows and doors—Air permeability—Test method |
| Thermal | BS EN ISO 10077-2: 2017 [65] | Thermal performance of windows, doors and shutters—Calculation of thermal transmittance |
| Burglar Proof | EN 1627:2011 to EN 1630:2011 [66,67,68,69] | Pedestrian doorsets, windows, curtain walling, grilles and shutters—Burglar resistance |
| ΔP Pa | C mm−1 s |
|---|---|
| 1 | 1272.5 |
| 2 | 899.7 |
| 4 | 636.2 |
| 8 | 449.9 |
| 10 | 402.4 |
| 20 | 284.5 |
| A—Total Equivalent Ventilator Area a (mm2) for a Dwelling with Any Design Air Permeability | |||||
|---|---|---|---|---|---|
| Total Floor Area (m2) | Number of Bedrooms | ||||
| 1 | 2 | 3 | 4 | 5 | |
| ≤50 | 35,000 | 40,000 | 50,000 | 60,000 | 65,000 |
| 51–60 | 35,000 | 40,000 | 50,000 | 60,000 | 65,000 |
| 61–70 | 45,000 | 45,000 | 50,000 | 60,000 | 65,000 |
| 71–80 | 50,000 | 50,000 | 50,000 | 60,000 | 65,000 |
| 81–90 | 55,000 | 55,000 | 60,000 | 60,000 | 65,000 |
| 91–100 | 65,000 | 65,000 | 65,000 | 65,000 | 65,000 |
| >100 | Add 7000 mm2 for every additional 10 m2 floor area 5 | ||||
| Number of Bedrooms | |||||
|---|---|---|---|---|---|
| 1 | 2 | 3 | 4 | 5 | |
| All building ventilation rate (L/s) | 13 | 17 | 21 | 25 | 29 |
| Geometry |  | n.a. |  |  |
| Product | P. Karava et al. Pressure Controlled [45] | P. Karava et al. Slot Controlled [45] | RW Simon Airstrip 19000 [82] | RW Simon Airstrip 200 [83] |
| Air Flow Rate | 27.0 m3/h (20 Pa) | 21.6 m3/h (20 Pa) | 168.5 m3/h (20 Pa) | 96.3 m3/h (20 Pa) |
| Geometry |  |  |  |  |
| Product | Renson Oxyvent (20 Pa) [80] | Renson AK80evo [84] | Metal Yapi Horizontal Trickle Vents [14] | Metal Yapi Vertical Trickle Vents [85] |
| Air Flow Rate | 190.4 m3/h (20 Pa) | 70.6 m3/h (20 Pa) | 197.3 m3/h (20 Pa) | 241.9 m3/h (10 Pa) |
| Geometry |  |  |  |
| Product | Metal Yapi Horizontal Trickle Vent [85] | Metal Yapi Vertical Trickle Vent [85] | Renson InvisiventEVO [90] |
| U Value | 2.1 W/m2 K | 2.7 W/m2 K | 2.8 W/m2 K |
| Geometry |  |  | |
| Product | Renson Oxyvent [80] | Renson AK80EVO/4 [84] | |
| U Value | 2.8 W/m2 K | 2.1 W/m2 K |
| Geometry |  |  |  |  |
| Product | Renson AK80EVO/4 [84] | Renson Oxyvent [80] | Renson InvisiventEVO [90] | Brookvent Airvent DG1500 [92] |
| Dn,e (dB)—Open | 33 (−1;−2) | 27 (−1;−2) | 27 (−1;−1) | 28 |
| Dn,e (dB)—Closed | n.p.d. | 40 (0;−2) | 49 (−1;−1) | 33 |
| Geometry |  |  |  |  |
| Product | Brookvent Airvent SM 1000 [44] | AmesburyTruth SM1200 [93] | Greenwood 8000HD [94] | R.W. Simon Acoustic F V [95] |
| Dn,e (dB)—Open | 29 | 30 | 31 | 33 |
| Dn,e (dB)—Closed | 47 | 47 | 33 | 40 |
| Geometry |  |  |  | |
| Product | Brookvent Airvent SM 1400 [96] | Brookvent SM Acoustic [97] | Titon Select S13 [98] | |
| Dn,e (dB)—Open | 32 | 40 | 33 (−1;0) | |
| Dn,e (dB)—Closed | 39 | 44 | 45 (−1;−2) |
| Geometry |  |  |
| Product | Metal Yapi—Horizontal Trickle Vent | AWS Ventient Series fixed window 10.38 mm lam glass |
| Rw (dB)—Open | 25.8 | 30 |
| Rw (dB)—Closed | 40.1 | n.a |
| Geometry |  |  |  |  |
| Product | Metal Yapi—Horizontal Trickle Vents | Brookvent Airvent DG1500 [92] | Brookvent Airvent SM 1000 [44] | Greenwood 8000HD [94] |
| ΔP | 600 Pa | 50 Pa | 50 Pa | 50 Pa |
| Air Flow Rate | 1.5 m3/h | 1.5 m3/h | 0.5 m3/h | 2.6 m3/h |
| Geometry |  |  |  | |
| Product | Greenwood 5000EA [100] | Brookvent Airvent SM 1400 [96] | Brookvent Airvent SM Acoustic [97] | |
| ΔP | 50 Pa | 50 Pa | 50 Pa | |
| Air Flow Rate | 0.6 m3/h | 1.1 m3/h | 15.5 m3/h |
| Pressure Difference between the Chamber and Exterior (Pa) | Duration of Water Spraying (s) |
|---|---|
| 10 | 120 |
| 20 | |
| 50 | |
| 100 | |
| 150 |
| Geometry |  |  |  |  |
| Product | Renson AK80EVO [84] | Renson Oxyvent [80] | Renson InvisiventEVO [90] | Metal Yapi Horizontal Trickle Vent [14] |
| Open (Pa) | 50 Pa | 50 Pa | 50 Pa | n.a. |
| Closed (Pa) | 650 Pa | 650 Pa | 650 Pa | 600 Pa |
| Geometry |  |  |  |  |
| Product | RW Simon Airstrip 19000 [82] | AWS Ventient Series with Soundout [99] | Brookvent Airvent SM 1000 [44] | Greenwood 8000HD [94] |
| Open (Pa) | n.a. | 450 Pa | n.a. | n.a. |
| Closed (Pa) | 600 Pa | n.a. | 600 Pa | 300 Pa |
| Geometry |  |  |  |  |
| Product | Greenwood 5000EA [100] | RW Simon TFF Slimline [101] | Brookvent Airvent SM 1400 [96] | Brookvent Airvent SM Acoustic [97] |
| Open (Pa) | n.a. | 450 Pa | n.a. | n.a. |
| Closed (Pa) | 600 Pa | n.a. | 600 Pa | 300 Pa |
| Geometry |  | |||
| Product | Titon Select S13 [98] | |||
| Open (Pa) | n.a. | |||
| Closed (Pa) | 600 Pa |
© 2018 by the authors. Licensee MDPI, Basel, Switzerland. This article is an open access article distributed under the terms and conditions of the Creative Commons Attribution (CC BY) license (http://creativecommons.org/licenses/by/4.0/).
Share and Cite
Biler, A.; Unlu Tavil, A.; Su, Y.; Khan, N. A Review of Performance Specifications and Studies of Trickle Vents. Buildings 2018, 8, 152. https://doi.org/10.3390/buildings8110152
Biler A, Unlu Tavil A, Su Y, Khan N. A Review of Performance Specifications and Studies of Trickle Vents. Buildings. 2018; 8(11):152. https://doi.org/10.3390/buildings8110152
Chicago/Turabian StyleBiler, Ahmet, Aslihan Unlu Tavil, Yuehong Su, and Naghman Khan. 2018. "A Review of Performance Specifications and Studies of Trickle Vents" Buildings 8, no. 11: 152. https://doi.org/10.3390/buildings8110152
APA StyleBiler, A., Unlu Tavil, A., Su, Y., & Khan, N. (2018). A Review of Performance Specifications and Studies of Trickle Vents. Buildings, 8(11), 152. https://doi.org/10.3390/buildings8110152