1. Introduction
The construction and operation of buildings accounts for over 70% of global greenhouse gas emissions [
1]. A significant portion of the end-use energy in buildings is dedicated to maintaining thermal comfort [
2]. In tropical climates, buildings are exposed to high solar radiation throughout the whole year; therefore, these buildings are greatly dependent on air-conditioning to provide occupants with comfortable thermal environments [
3,
4]. Singapore’s buildings are responsible for 37% of the country’s total electricity consumption; among all consumptions, air conditioning systems are responsible for 40–50% of this total energy consumption [
5]. Singapore’s continuous efforts on the adoption of green building design and technologies had resulted in an improvement of their energy utilization index (EUI) by 7% from 2008 to 2014 [
5]. This has been attributed to energy-efficient improvements in buildings. The Building Construction Authority (BCA) of Singapore advocates natural ventilation as a priority in green and sustainable design [
6].
Thermal comfort is the condition of mind that expresses satisfaction with the thermal environment [
7]. The thermal comfort depends on many factors beyond air temperature, such as air velocity, relative humidity, season, clothing insulation, activity level and others. Generally, the American Society of Heating, Refrigerating and Air-Conditioning Engineers (ASHRAE) recommends an indoor air temperature range of 19–28 degrees Celsius for thermal comfort purposes [
7]. The upper relative humidity level recommended by the standard is 80% [
7]. The climate of Singapore is characterized by a high ambient temperature range of 26–33 degrees Celsius and relative humidity of 70–90% throughout the year (
Table 1) [
8]. According to ASHRAE Standard 55, “Thermal Environmental Conditions for Human Occupancy” [
9], cooling and dehumidification is required for 76.6% of the hours from January to December for thermal comfort in Singapore [
10]. Under such circumstances, the application of natural ventilation for indoor comfort is uncertain.
Most Singaporeans (86% of the population) live in Housing Developments (HDB) residential buildings which are designed for natural ventilation. The statistical data for energy usage in Singapore show that the domestic energy consumption has doubled since the year 1991 [
11]. The air-conditioning system saturation rate (the percentage of households that had air-conditioners) in the residential building sector was 19.4% in 1988 [
12]; whereas the figure raised to 88% in the year of 2015 [
13]. As a leading research institute and a testbed for green initiatives, the National University of Singapore (NUS) announced their commitment to reduce carbon emissions by 23% by the year 2020 [
14]. Reduction of emissions related to electricity consumption is a key initiative to decrease NUS carbon emissions. Air conditioning accounts for 60% of the overall building energy consumption at NUS [
14]. To reduce the excessive use of air conditioning, NUS has taken measures to increase indoor temperature setting-point to 25 degrees Celsius. Furthermore, a large portion of student dormitories are designed for natural ventilation without air-conditioning. The NUS dormitories without air-conditioning represent unique opportunities for the study of thermal comfort and adaptive behaviors in tropical climates.
2. Natural Ventilation and Thermal Adaption
A naturally-ventilated residential building aims to provide comfortable indoor thermal environments for residents without using air-conditioning. It is well known that the acclimatization to tropical climates is different from that to cold or temperate climates [
15,
16]. Many studies indicated that people living or working in naturally ventilated buildings in warm climates accepted high temperature and humidity [
17,
18,
19,
20,
21]. Field studies on thermal comfort conducted in naturally ventilated buildings in Singapore indicated that ASHRAE standards might not be suitable to predict thermal comfort in free-running buildings in the local climate [
22,
23]. Thermal perceptions and tolerance in naturally ventilated buildings are likely to make occupants accept a wider range of temperatures as a result of thermal adaptation. Thermal adaptation to relatively moderate fluctuations within free running buildings can be mainly attributed to behavioral adjustments and psychological adaptation [
24]. Behavioral adjustments due to a person’s conscious or unconscious modifications result in changes to the heat and mass fluxes governing the body’s thermal balance [
25]. Behavioral adjustments include modification made to one self (clothing, activity, eating or drinking) and modifications to the surrounding (opening a window, turning fans on etc.). Behavioral adjustment of the body’s heat balance offers the greatest opportunity for people to actively maintain their comfort. Behavioral adjustments such as changes to clothing insulation may even lead to a 3 degrees Celsius offset in preferred temperatures [
26]. Psychological adaptation accounts for the cognitive and cultural variables which affect one’s habituation and expectation. The adaptive model to thermal comfort acknowledges a potential feedback loop where past and present thermal experiences with the indoor and outdoor environment directly affect thermal response and cognitive assessment [
24].
The adaptive approach to thermal comfort allows for the moderation of the narrow thermal environments specified by the static heat balance model [
27]. The adaptive thermal comfort standard is generally applied to naturally conditioned spaces where no mechanical cooling system is installed and the mean outdoor temperatures vary between 10–33 degrees Celsius [
7]. Adaptive thermal comfort can be expected for 5882 h annually (67.1%) in tropical climates such as Singapore through natural ventilation [
10]. A significant reduction of energy required for indoor comfort can be achieved by understanding the comfort expectations and behavior of occupants. In residential buildings, occupants have greater opportunities to adapt to the thermal environment, which indicates an opportunity to reduce energy consumption. The adaptive behaviors haven been studied in temperate climates, where Andersen et al. [
28] conducted repeated surveys of occupant control of the indoor environment in Danish dwellings. They carried out multiple logistic regression to quantify factors influencing occupants’ behaviors regarding the factors of windows open/closed, heating on/off, lighting on/off and solar shading in/not in use. It was found that window opening behavior was strongly related to the outdoor temperature. Window opening behavior was also affected by the perception of the environment and factors concerning the dwelling. Kim et al. [
29] examined the pattern of adaptive comfort behavior in residential units with both natural ventilation and air-conditioning in Sydney which belongs to subtropical climates. They derived statistical models to predict the percentage of adaptive behaviors such as operation of air-conditioners, heaters, fans and windows, as a function of outdoor temperature. The adaptive behaviors and related thermal environments can also be found in office buildings with different climates [
30,
31,
32].
According to the theory of adaptive thermal comfort, building occupants play an active role to achieve comfort by adjusting their behaviors. It is unnecessary to maintain a narrow range of temperature using mechanical solutions, especially considering the large amount of energy used to maintain the narrow comfort zone. The adaptive approach of understanding thermal comfort can help to design buildings with passive strategies while reduce the reliance on mechanical solutions, which in turn help to reduce the energy consumption due to cooling and heating. This is extremely important for sustainable building design in tropical climates, where cooling accounts for a large portion of building energy use. There is strong research need to understand occupants’ behaviors in naturally ventilated buildings in tropical climates. Focusing on naturally ventilated residential buildings in tropical climates, the aim of this research is to investigate occupants’ perceptions and adaptation to heat stresses in these buildings, based on which passive design strategies can be explored.
3. Methodology
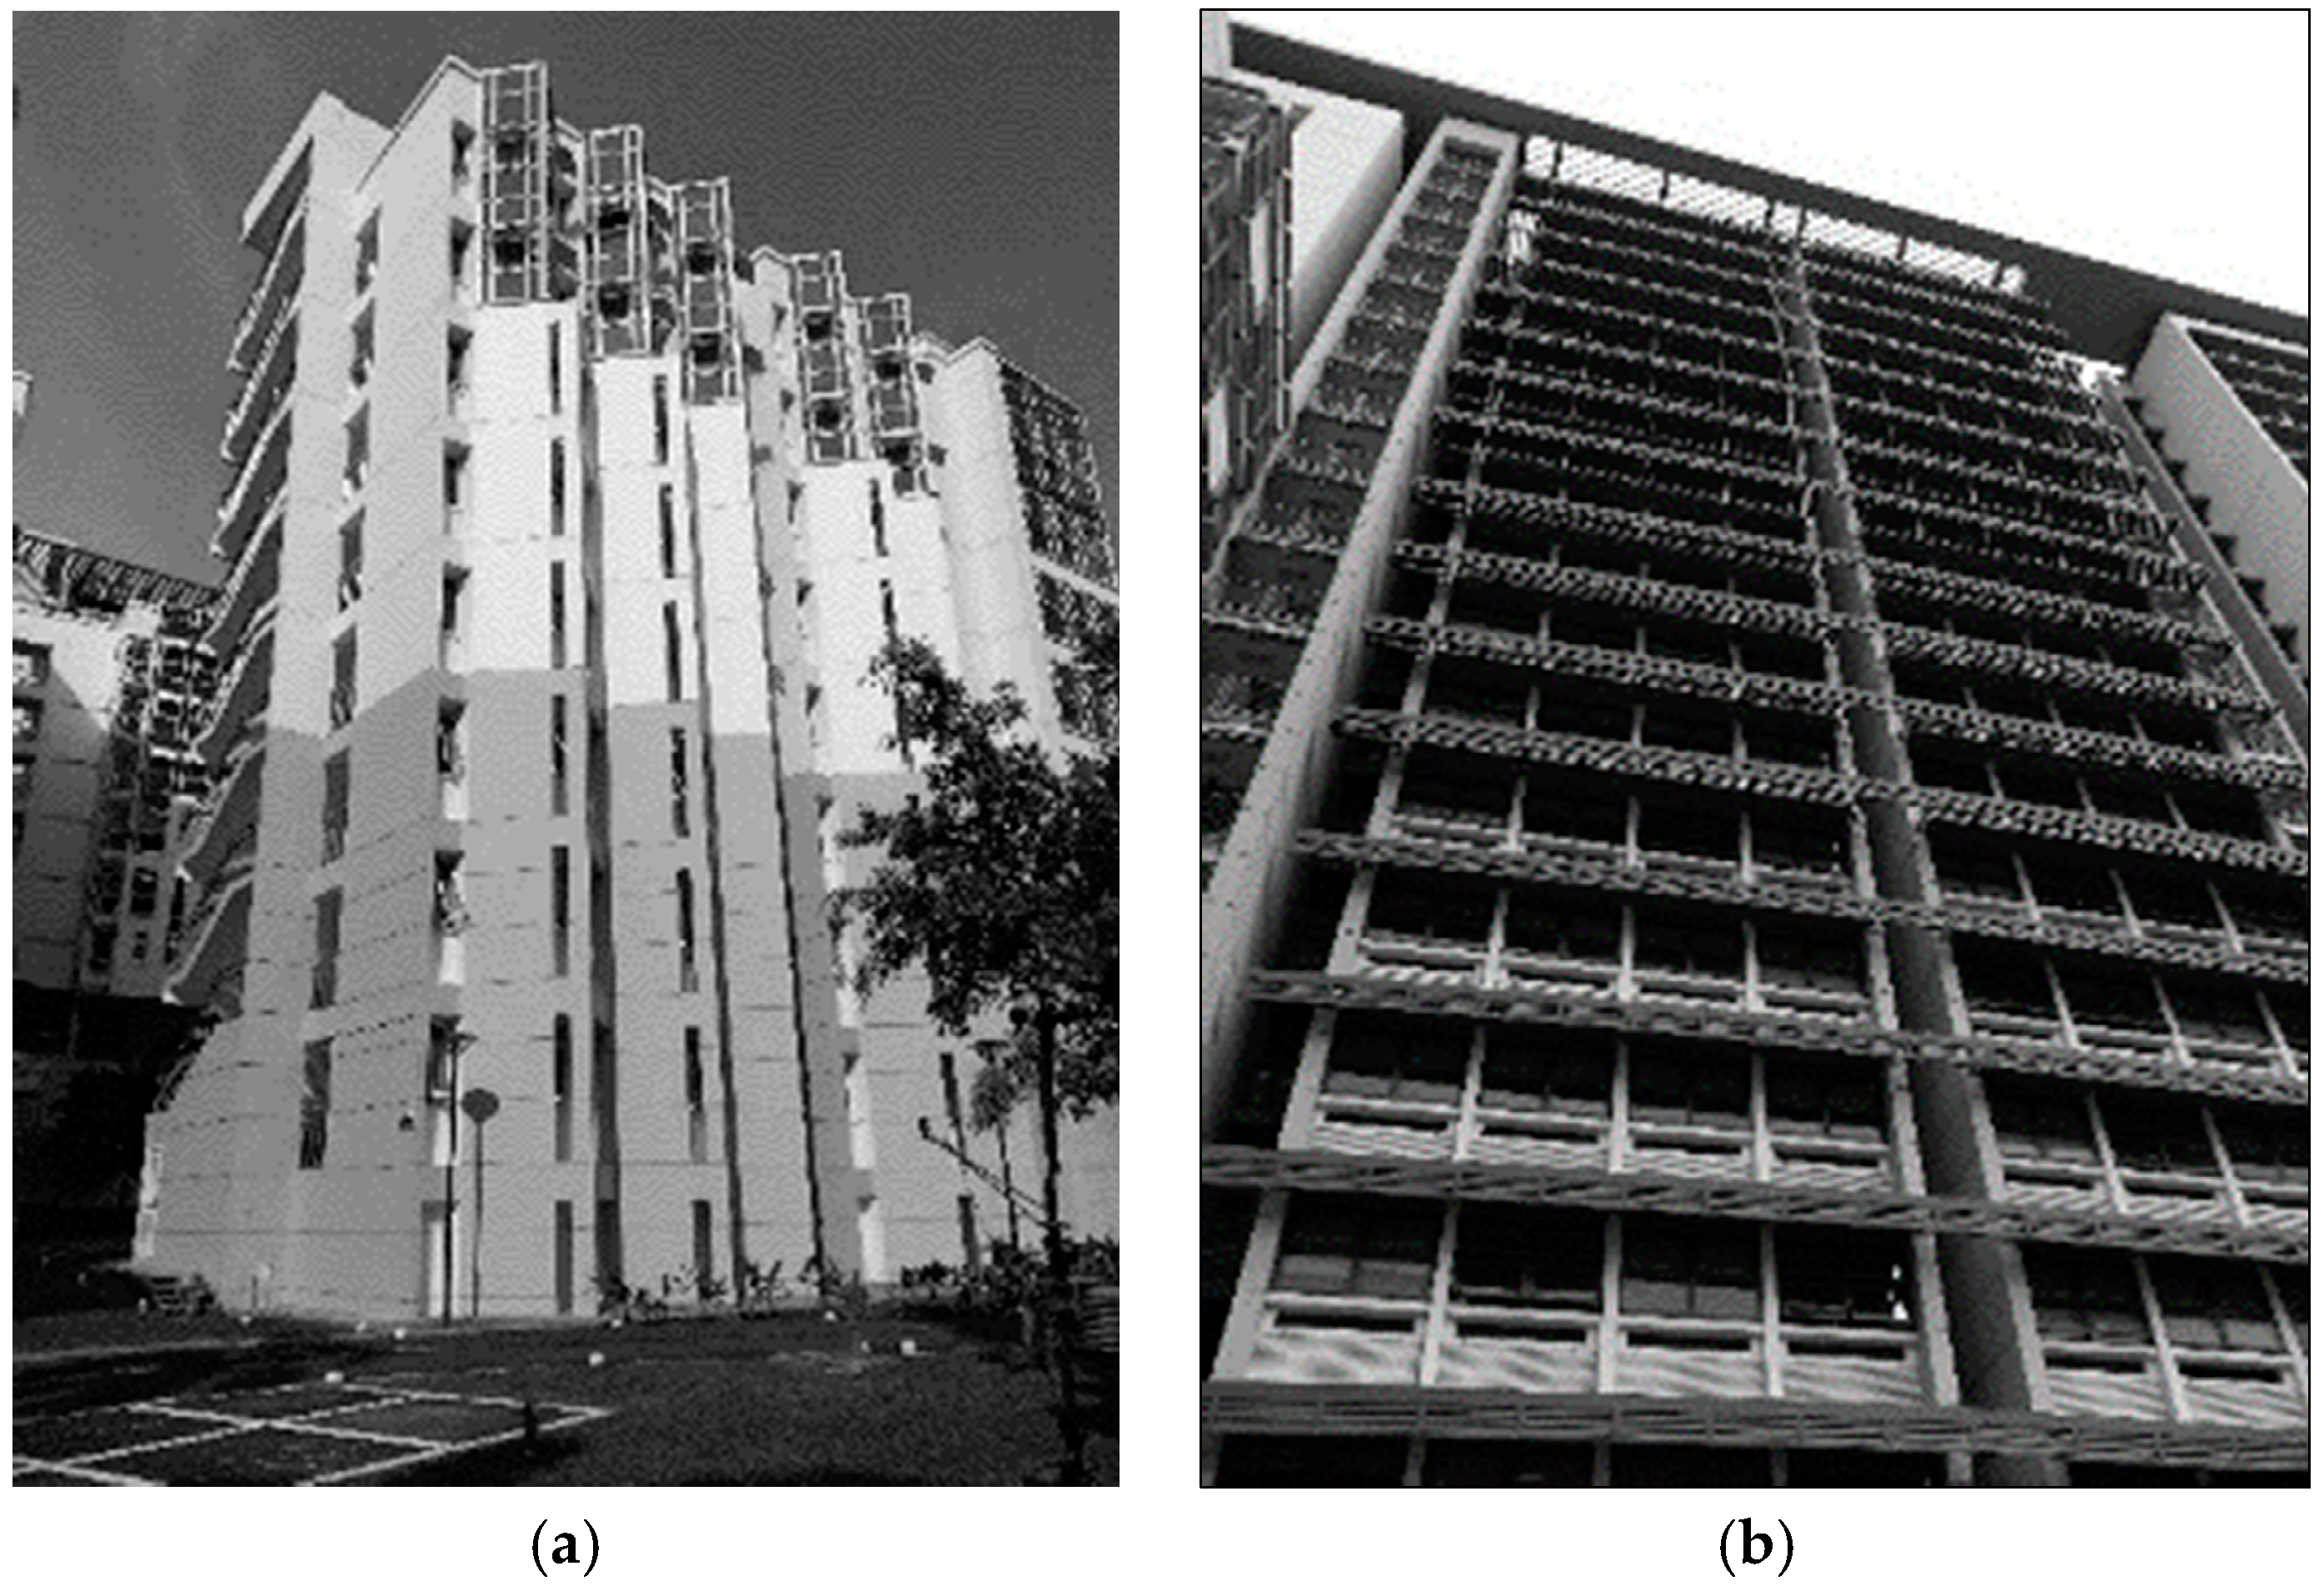
A field survey was conducted within two university dormitory buildings: A & B, located at the National University of Singapore, as shown in
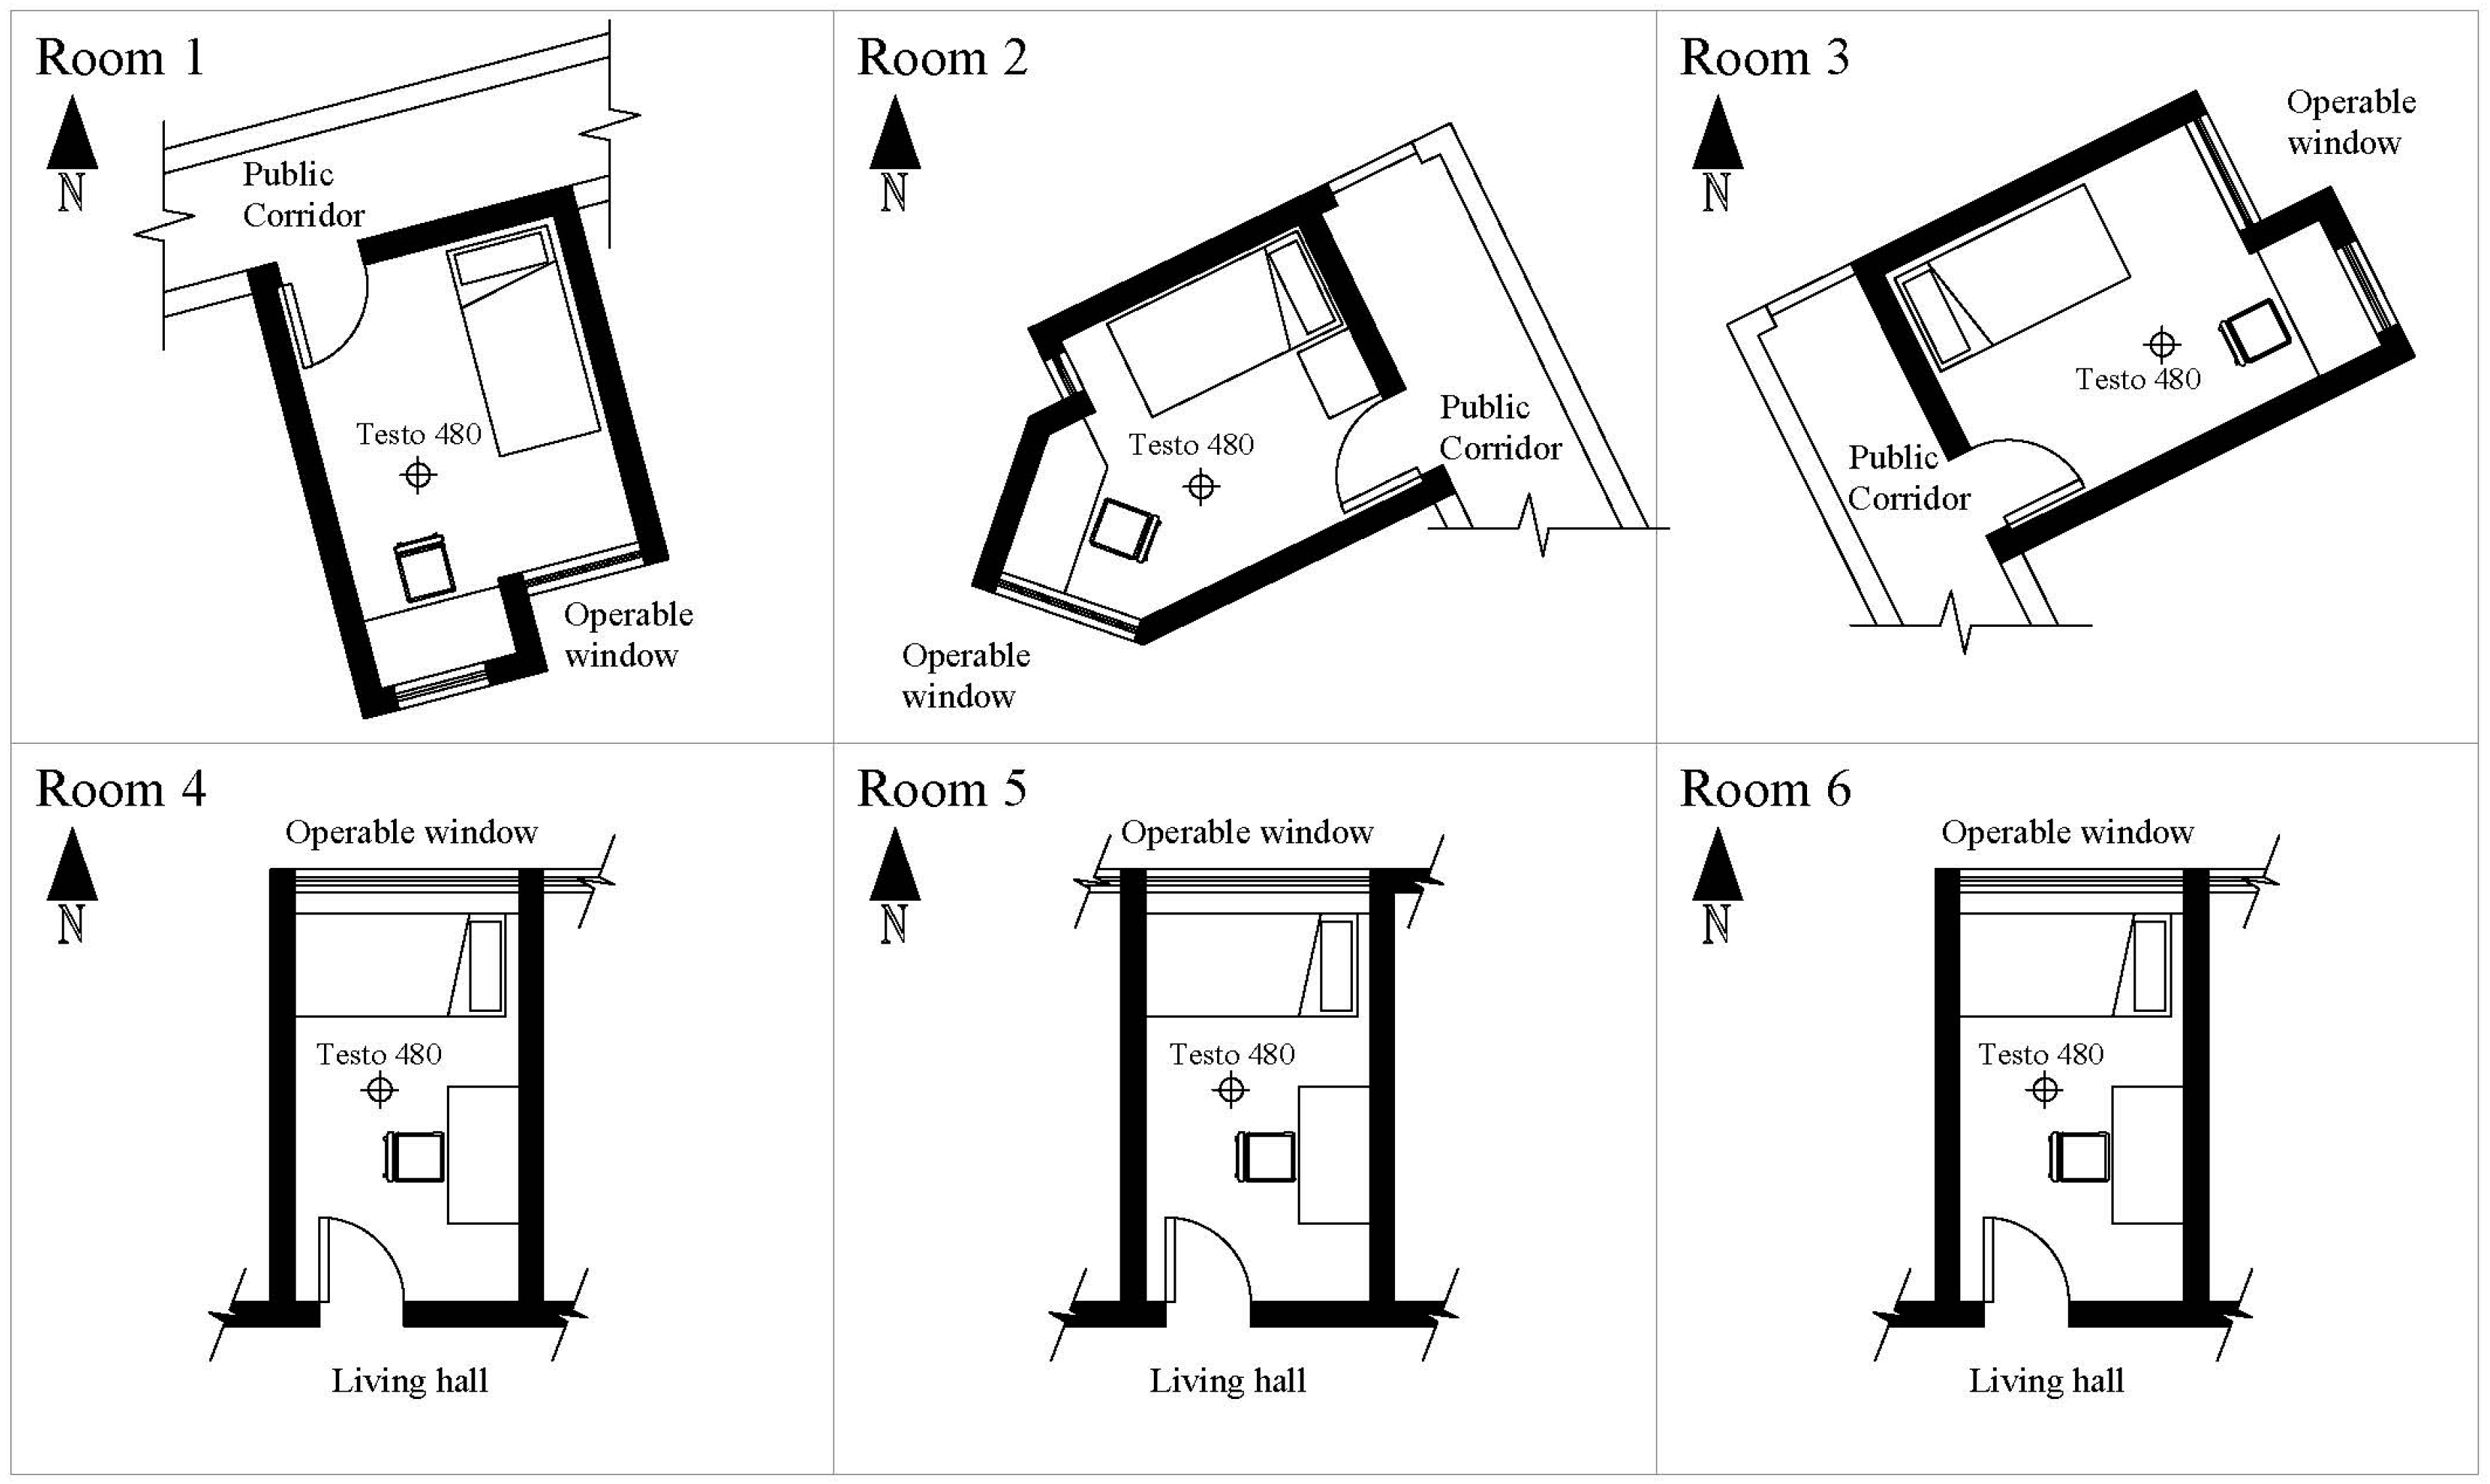
Figure 1. As a pilot study, the survey took place in six student rooms. All participants were university students with ages between 20 and 30. The layout plan, orientation and location of indoor environmental quality monitoring equipment in each room are shown in
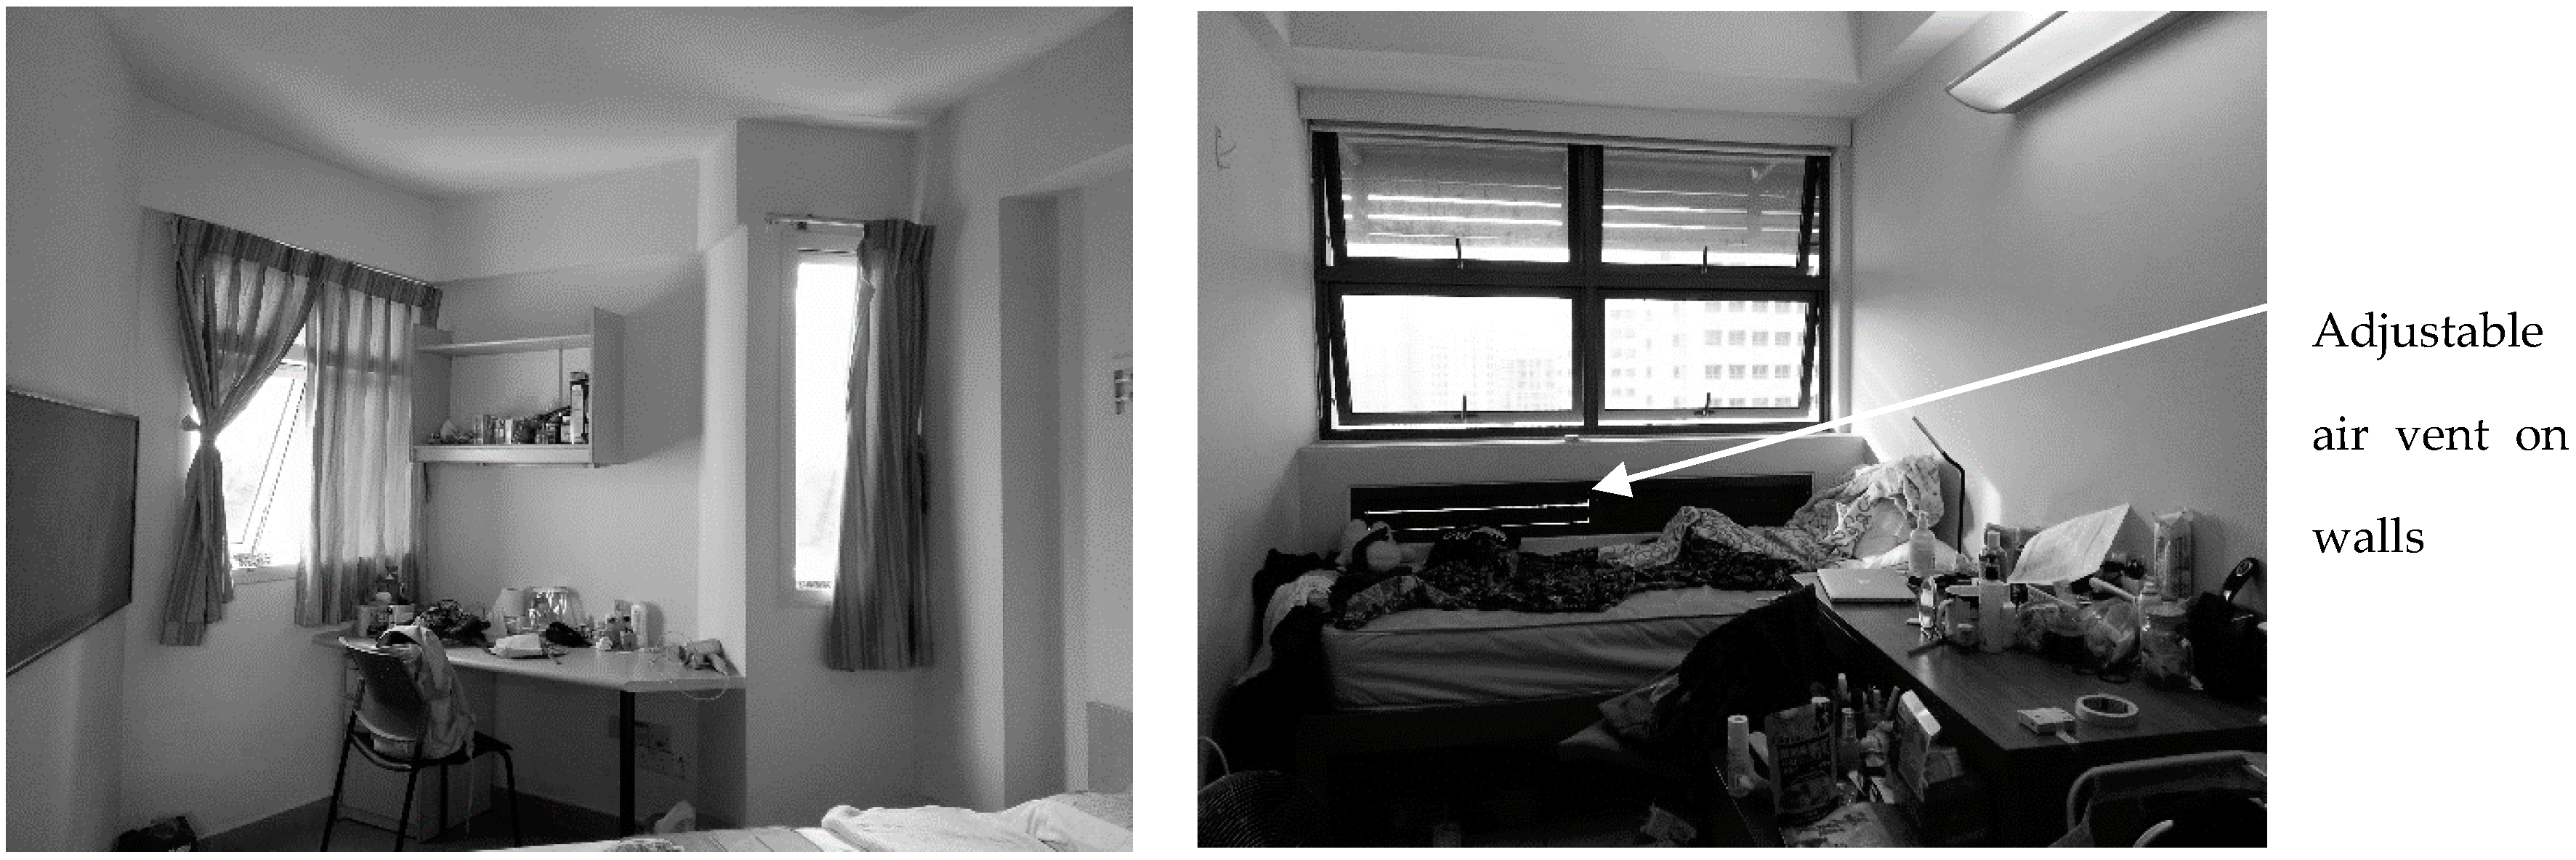
Figure 2. Room 1, 2 and 3 are located on the 4th floor of Building A; Room 4 and 5 are located on the 20th floor of Building B; and Room 6 is located on the 18th floor of Building B. All the surveyed rooms were equipped with ceiling fans, operable windows, and window blinds. In some rooms, the occupants had bought their own portable electrical fans. The rooms in Building A are directly connected to a common corridor which is naturally ventilated. The rooms in Building B are connected to the common living area which is naturally ventilated. Furthermore, these rooms have an adjustable air vent on the wall (
Figure 3).
A longitudinal thermal comfort survey was carried out in two phases which spanned from 24 May to 2 August 2016. In both phases, the occupants filled out an online questionnaire on indoor environment qualities, adaptive behaviors and the state of indoor environment controls. Phase 1 spanned for two weeks, where the occupant filled in an online questionnaire three times per day (morning, afternoon and evening). The air temperature (Ta) and relative humidly (RH) inside the rooms were measured using HOBO data loggers U12-012 (Onset, Bourne, MA, USA) at 30 s intervals for two consecutive weeks. All measurements were taken at 0.75 m height above floor. Phase 2 spanned Phase 1’s daily survey for nine consecutive hours from 10:00 a.m. to 06:00 p.m., where the occupant filled in the online questionnaire every hour. The air temperature (Ta), relative humidity (RH), globe temperature (Tg) and air speed (Va) inside the rooms were measured within 1 m distance from the occupant at a height of 1.1 m above the floor. The data was logged using TESTO 480 (Testo, Lenzkirch, Germany) digital indoor environment quality meter at 1 minute intervals. Both mean radiant temperature (Tmrt) and operative temperature (Top) were calculated in reference to ASHRAE Standard 55 [
7].
The online questionnaire was adapted from the following surveys: CBE (The Center for Built Environment) Occupant IEQ Survey [
33] and Building Use Studies (BUS) Occupant Survey [
34,
35]. The questionnaire was prepared in English and was distributed to the occupants via email; the response of each occupant was monitored online through the online platform Google Forms. As shown in
Table 2, the questionnaire consisted of six main sections: thermal comfort, air quality, lighting quality, noise, behavioral adjustments and the state of indoor environment controls (i.e., ceiling fans, position of door, windows and blinds). Thermal comfort was measured using the standard seven-point ASHRAE thermal sensation scale, thermal acceptability scale and thermal preferences [
7]. Occupant’s acceptance and perceptions towards different aspects of the air quality, lighting quality and acoustics were measured on a seven-point scale. The occupants were also asked to choose adaptive behaviors from a list of typical behaviors such as consumption of drinks, adjustments to clothing and operation of ventilation systems controls. They listed all adaptive behaviors and the most frequently performed adaptive behaviors one hour prior to each response. The occupants further rated the accessibility, usability and responsiveness of their most frequent adaptive behaviors on a seven-point scale. The questionnaire also recorded clothing insulation and activity at the time of response. A total of 225 valid responses were received during Phase 1, and 54 valid responses were received during Phase 2. The data from the questionnaire survey were analyzed using statistical software IBM SPSS Statistics 23.0 provided by the National University of Singapore.
4. Results
4.1. Thermal Comfort Measurement
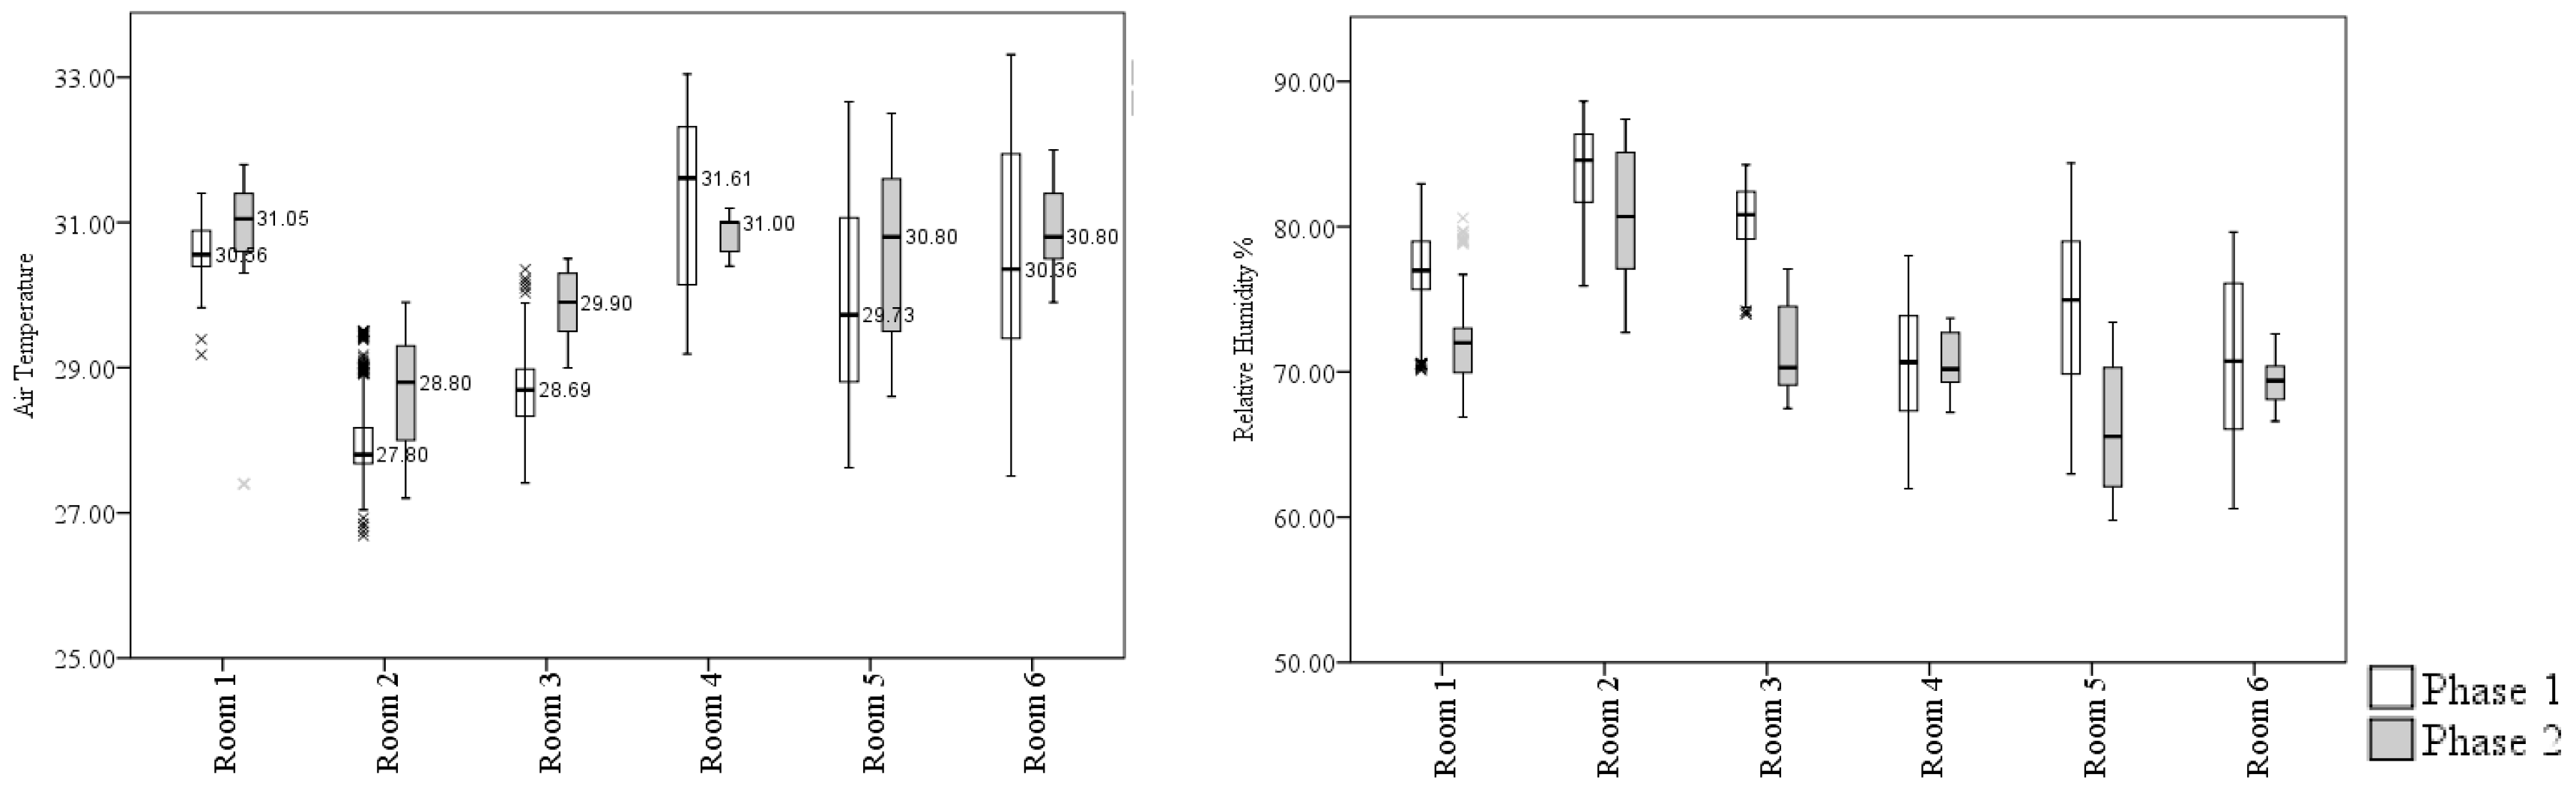
Table 3 and
Figure 4 show the statistical summary of measured environmental parameters in Phase 1 and 2. In both phases, the mean of air temperature was lowest in Room 2 (Phase 1: Mean Ta = 27.95, SD = 0.38 and Phase 2: Mean Ta = 28.68, SD = 1.05). Air temperature in Rooms 2 and 3 was significantly lower than in other rooms. As seen in
Figure 4, the first quartile (Q1) for air temperature in Rooms 1, 4, 5 and 6 was above what ASHRAE standard 55 recommended for thermal comfort. In both phases, relative humidity in Rooms 4, 5 and 6 was significantly lower than in other rooms, and the highest was reported in Room 2.
The ASHRAE adaptive thermal comfort model was used to determine the acceptability of the thermal conditions in the surveyed spaces during measurement of Phase 2.
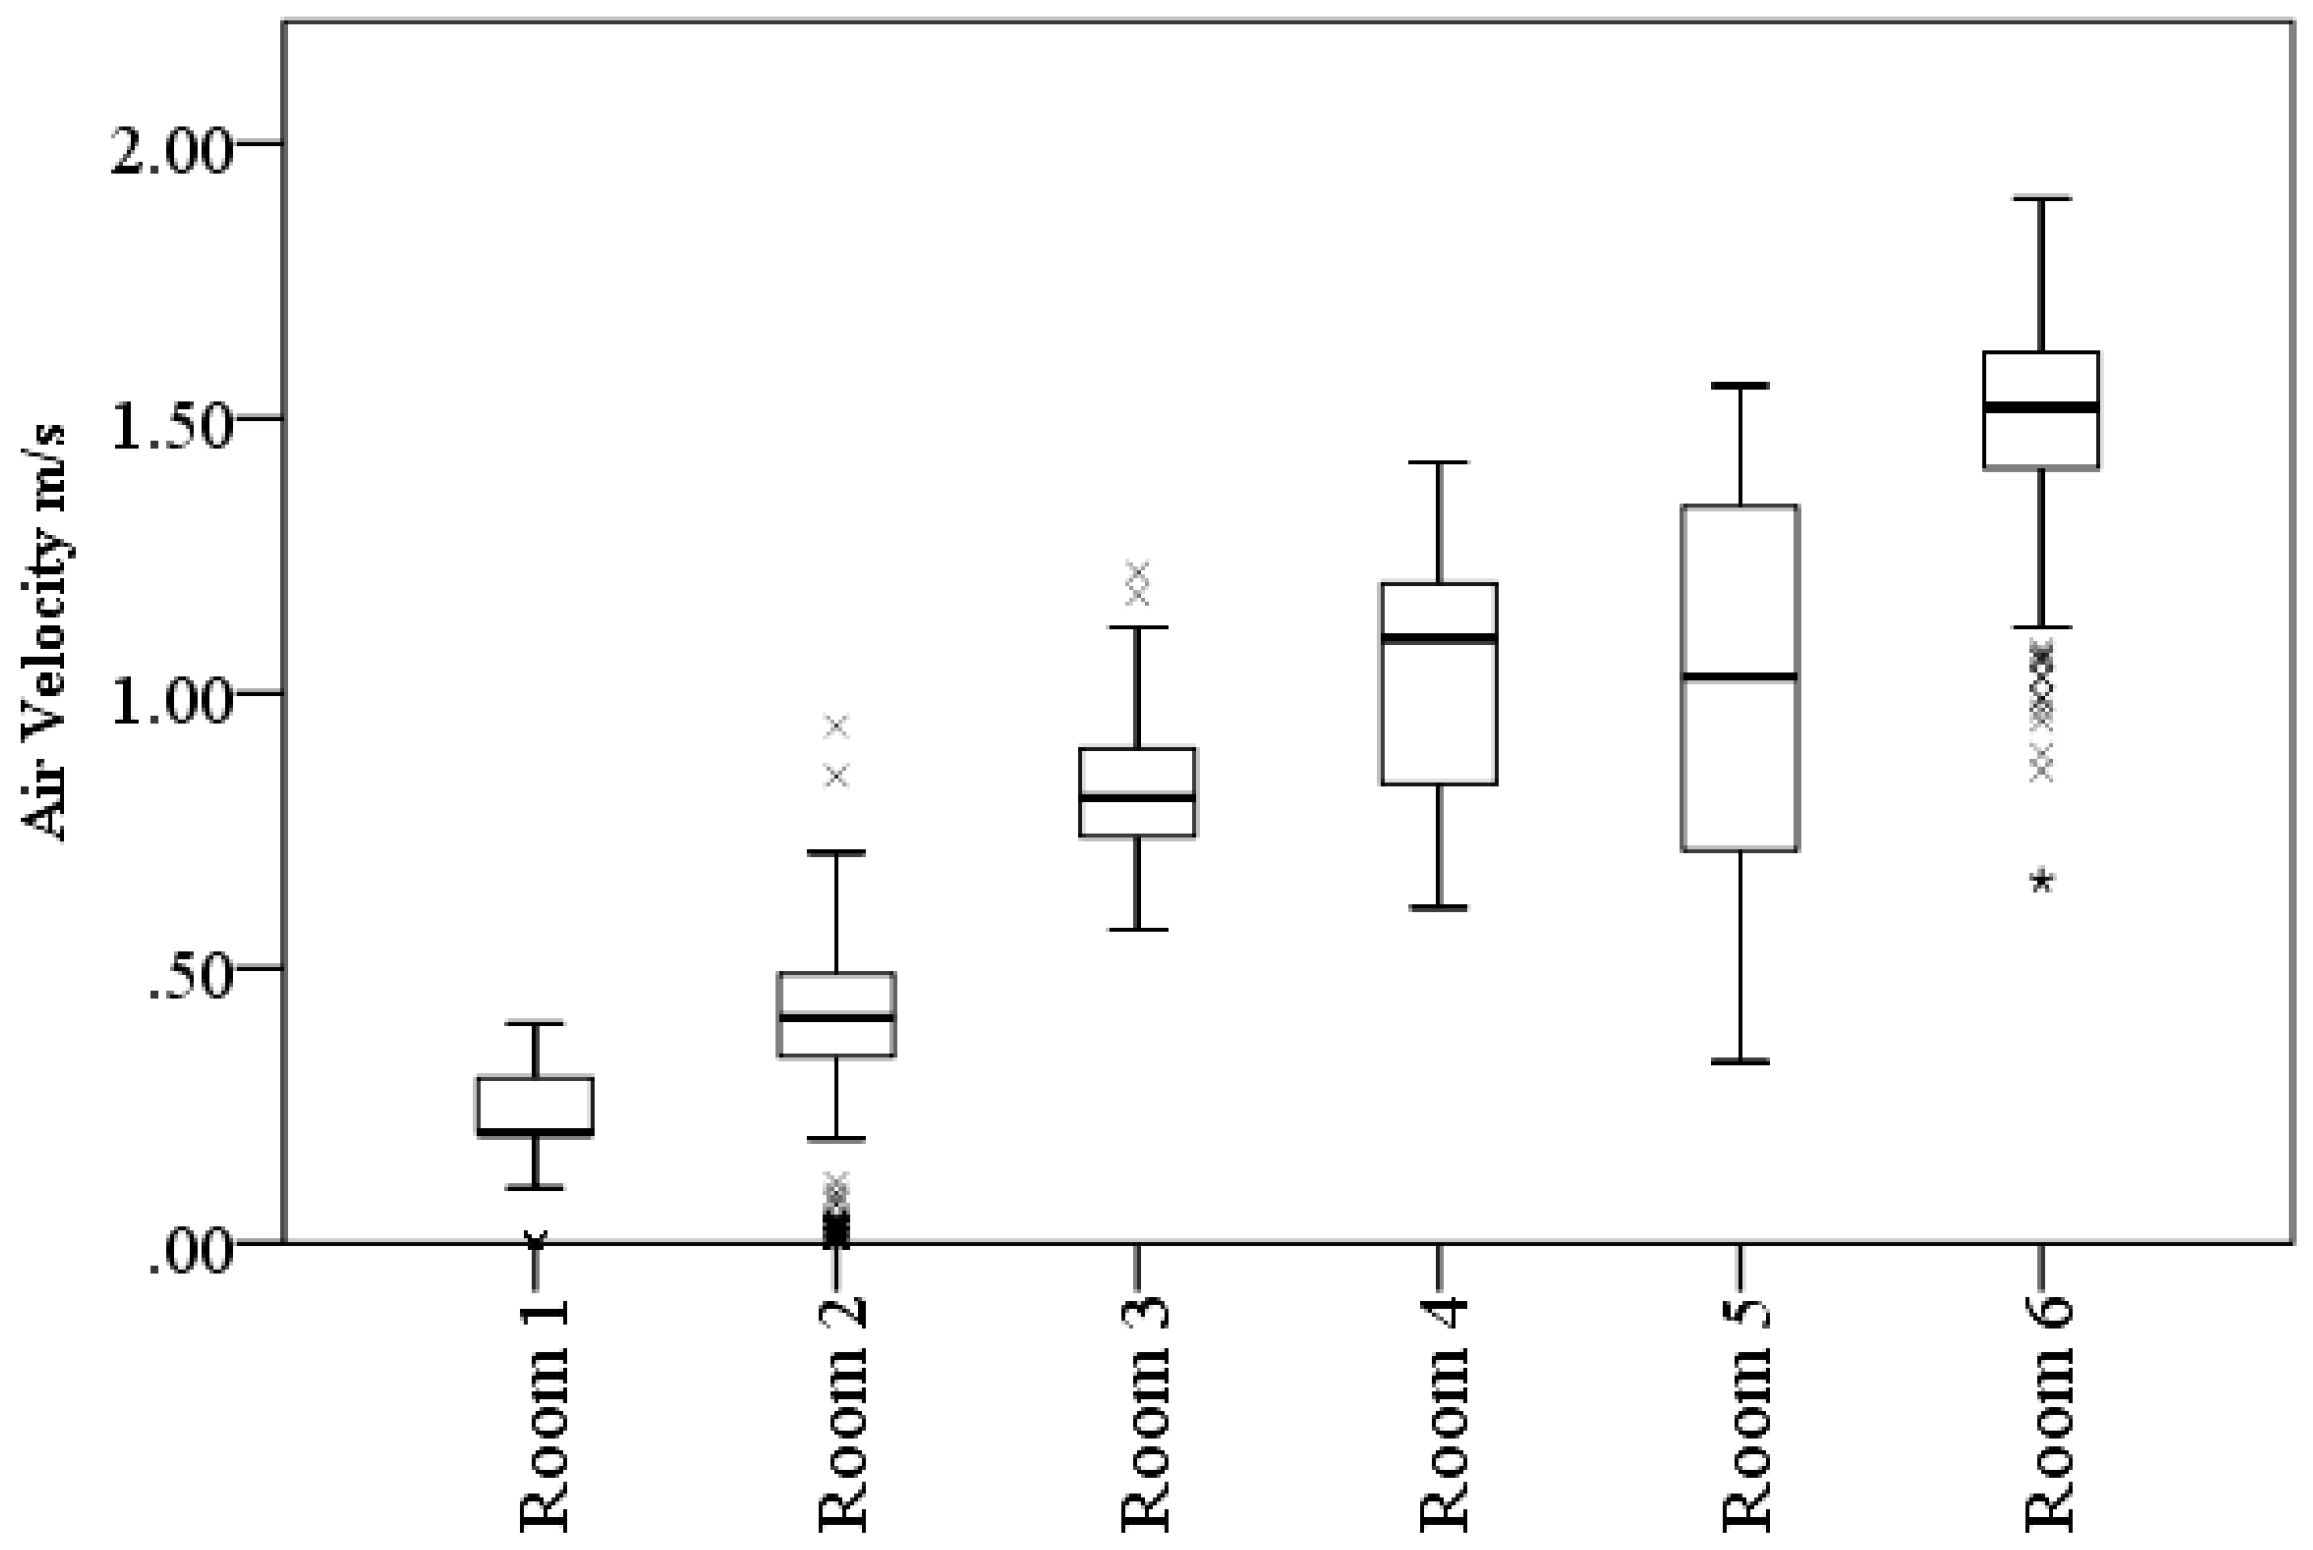
Table 4 reports the calculated operative temperature for each room and the period (percentage) within 80% and 90% acceptability limits specified by the ASHREA adaptive thermal comfort standard. The best measured thermal environment was found in Room 2, which was within an 80% acceptability limit for 93.3% of the surveyed period. The worst measured thermal environment was found in Rooms 1, 4 and 6, within an 80% acceptability limit for less than 5% of the measured period. Rooms 4, 5 and 6 had significantly higher indoor air velocities (
Figure 5). The lowest indoor air velocity was reported in Room 1.
4.2. Thermal Comfort Perception
The mean scores for the occupant’s perception of thermal acceptability (TC), thermal sensation vote (TSV) and air movement acceptability (AM) were compared using one-way ANOVA and followed up with post hoc testing to determine which specific subjects evaluated the thermal environment differently. The Levene’s test for equality of variances was statistically significant (
p < 0.05), therefore equal variance was not assumed and results were interpreted using Welch ANOVA and Games–Howell post hoc. The results are summarized in
Table 5. In both phases of this survey, the mean scores for TC, TSV and AM were statistically significantly different among the participants.
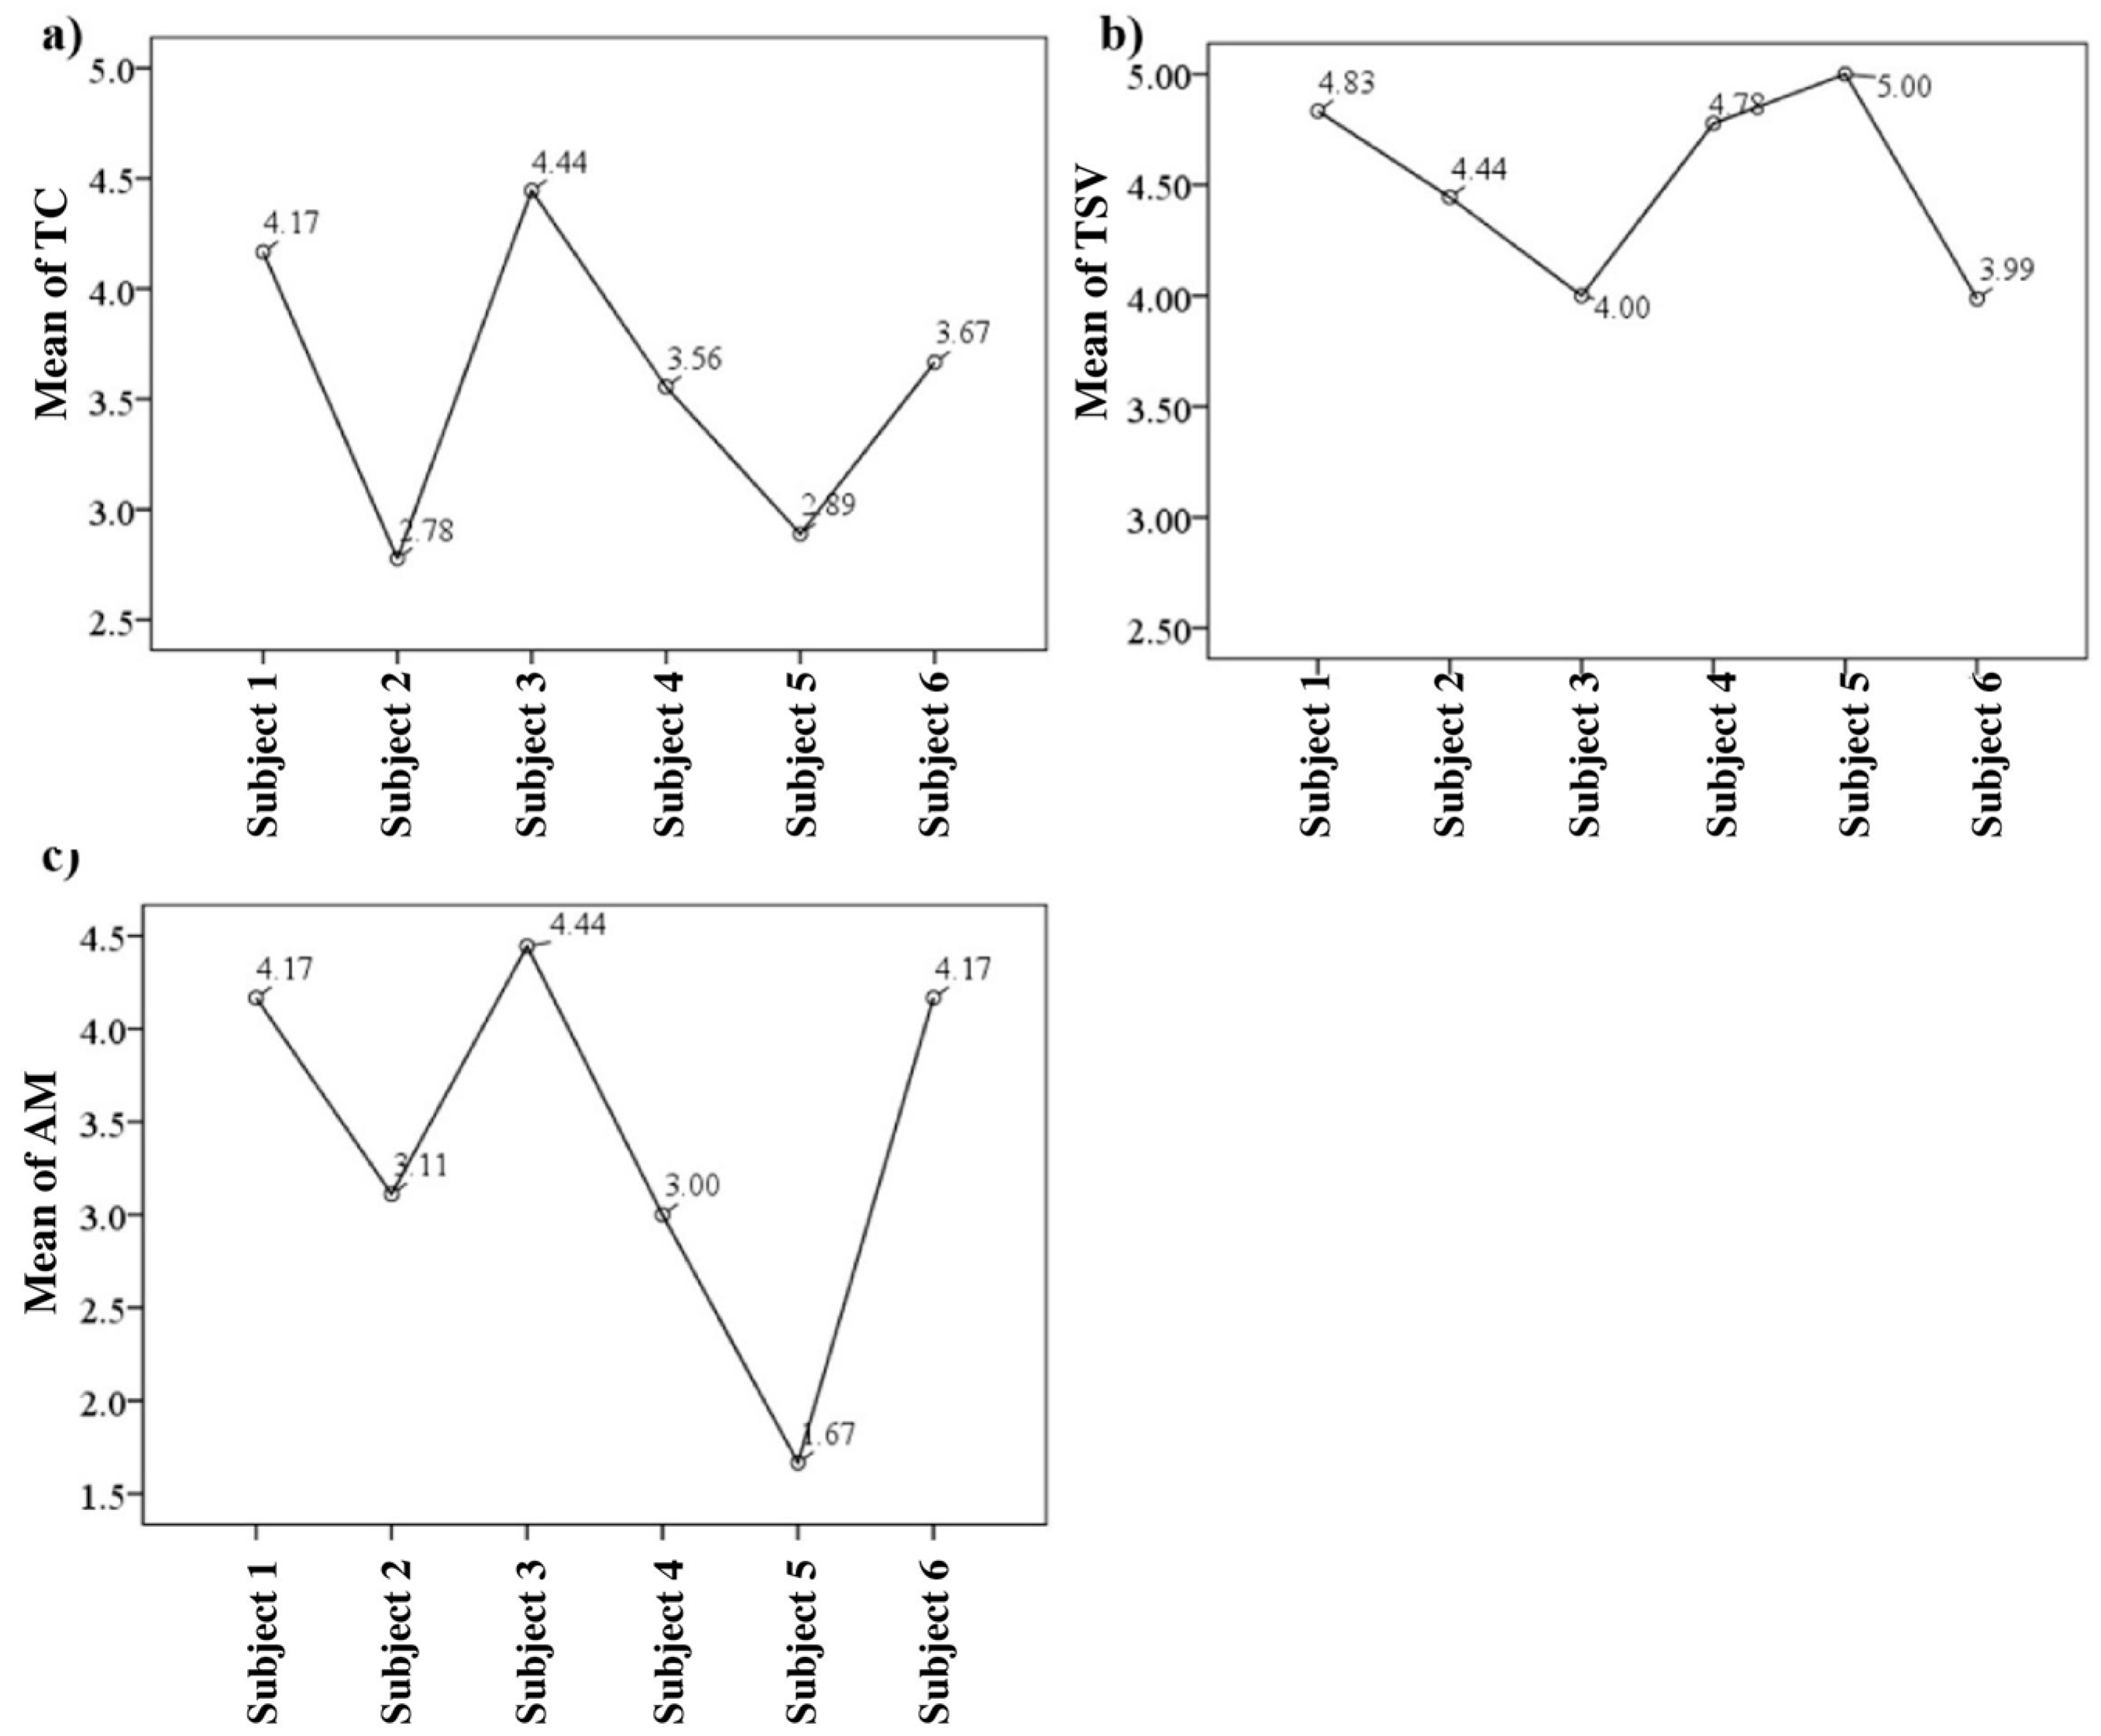
Figure 6 shows the means plot for TC, TSV and AM. Games–Howell post hoc analysis revealed the following: in both phases, Subject 2 was the most satisfied of TC (M = 1.67, SD = 1.12); Subjects 1 and 3 were the least satisfied with TC. In Phase 1, Subjects 1 and 3 were significantly more dissatisfied with TC than the others. In Phase 2, Subject 2 was significantly more satisfied with the thermal environment than Subject 1 (1.39, 95% CI [0.3 to 2.47],
p = 0.01) and Subject 3 (1.67, 95% CI [0.48 to 2.86],
p = 0.004). During Phase 1, mean scores for TSV reported by Subjects 2 and 3 were significantly lower than those for Subjects 1, 4 and 6. In Phase 2, mean scores for TSV reported by Subject 6 were significantly lower than those for Subject 4 (0.79, 95% CI [0.25 to 1.33],
p = 0.01) and Subject 1 (0.85, 95% CI [0.14 to 1.56],
p = 0.025). In both phases, Subject 5 was most satisfied with air movement; while Subjects 1 and 3 were significantly more dissatisfied than the others.
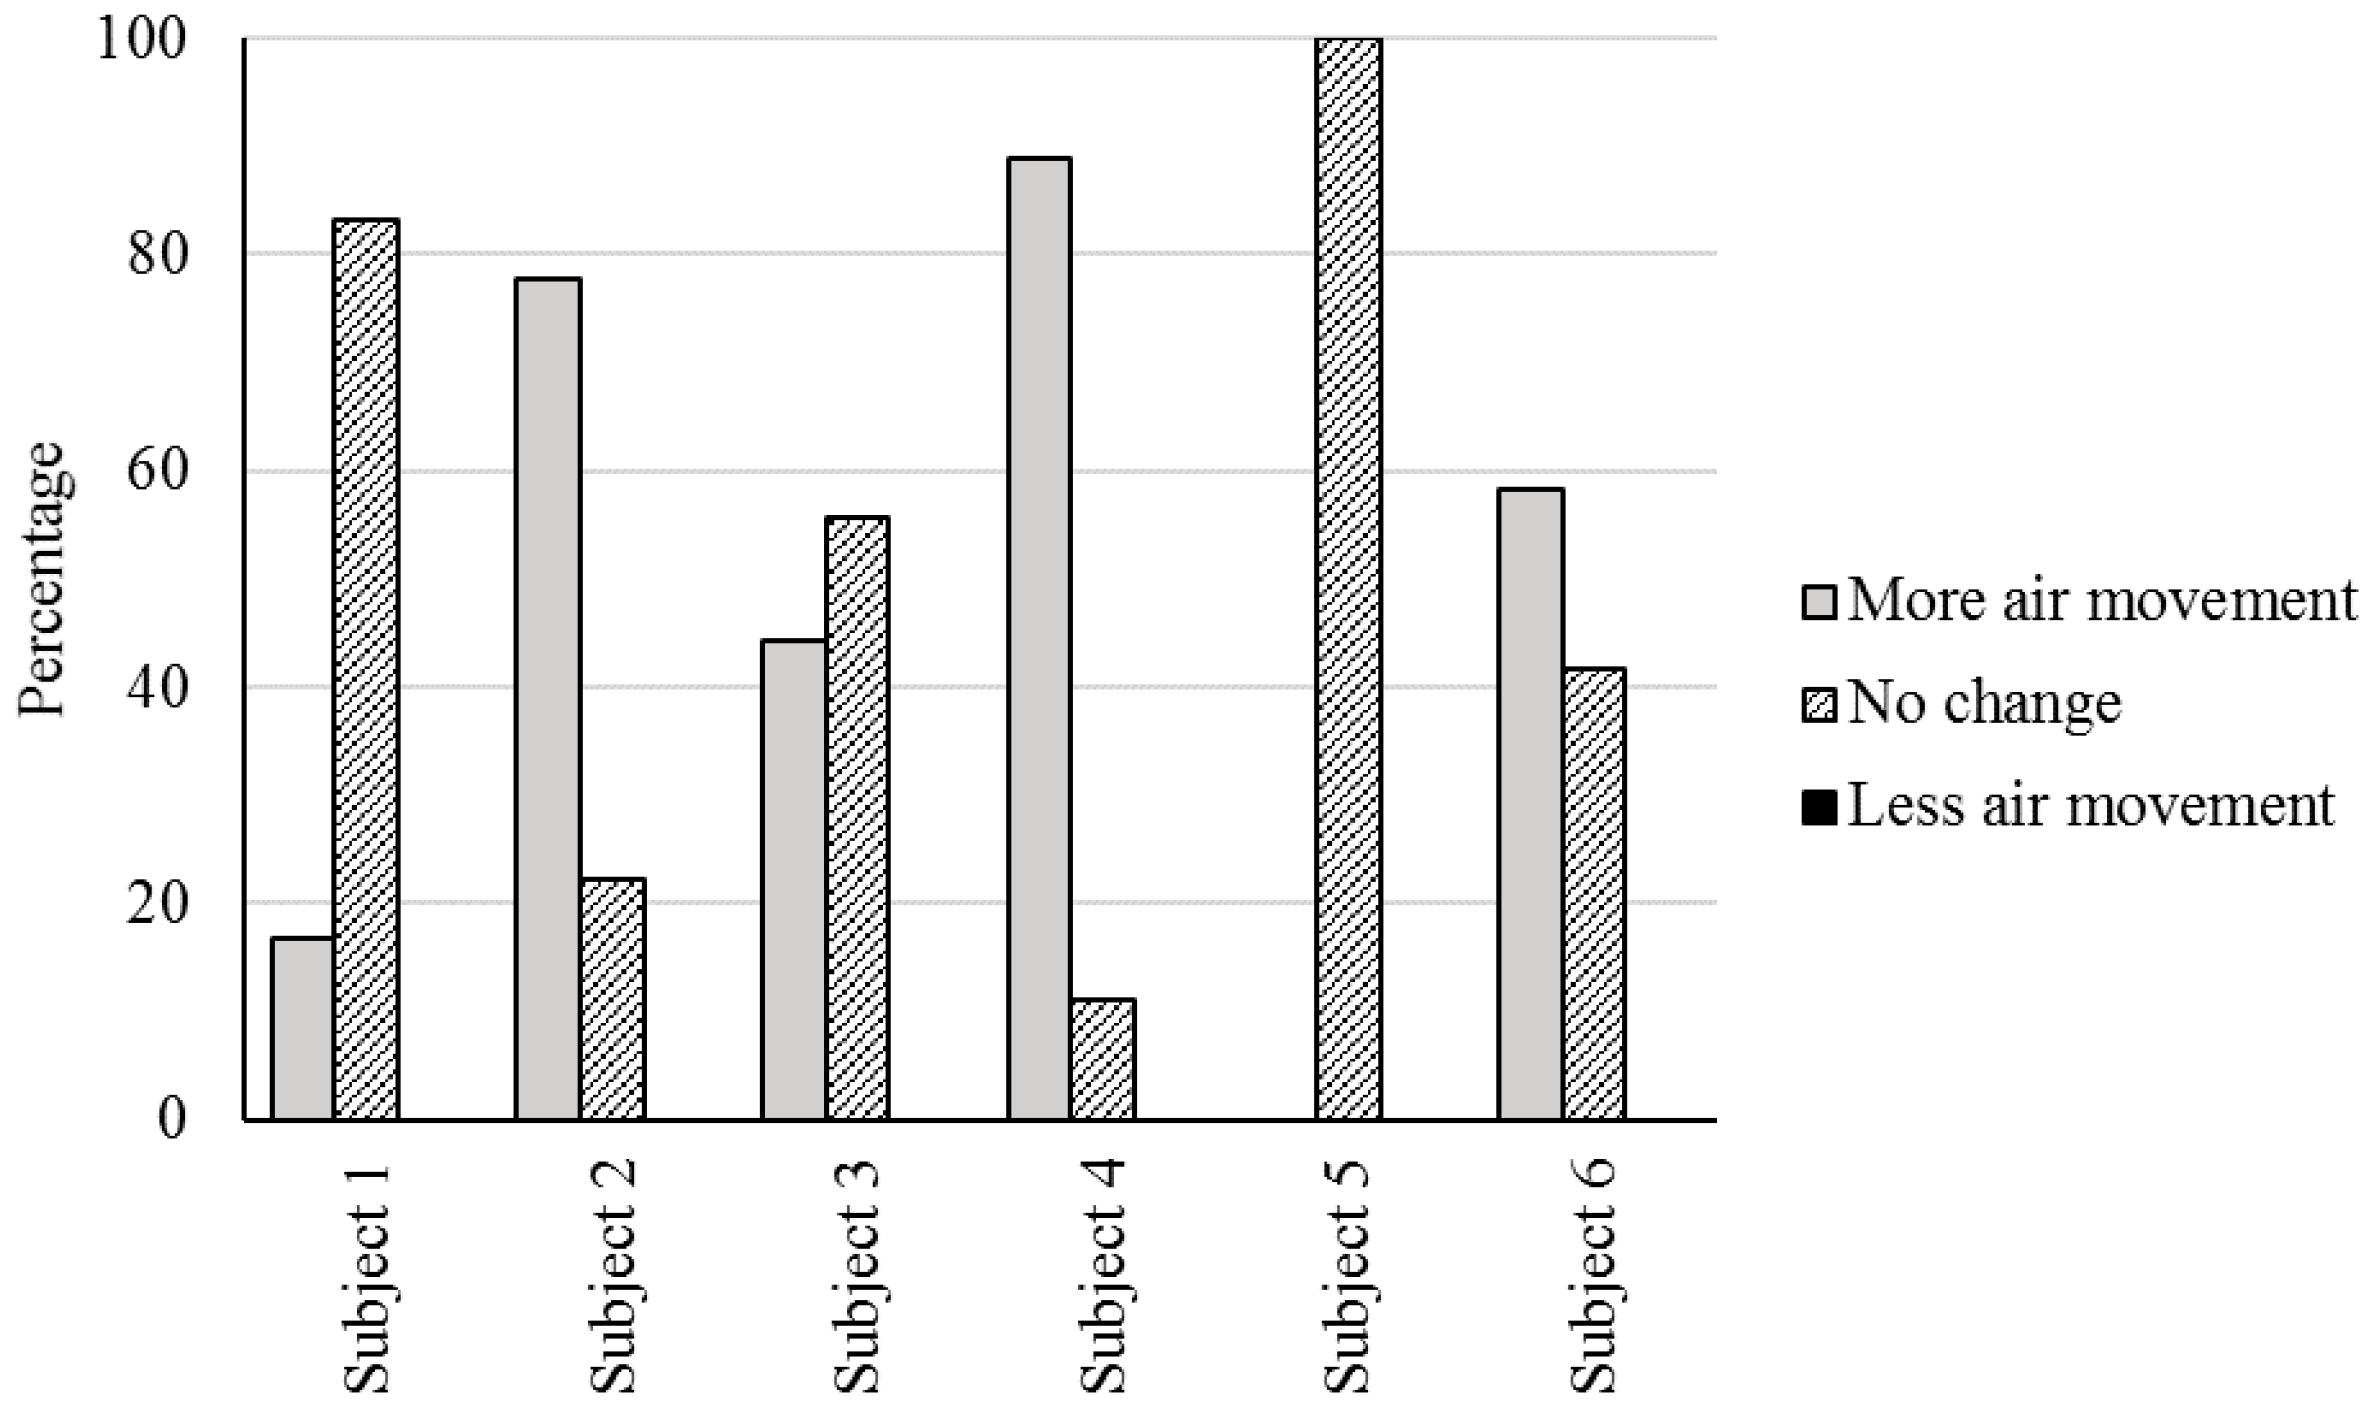
Figure 7 summarizes occupants’ preferences for indoor air movements in Phase 1 and 2. The subjects rarely requested to reduce indoor air speeds and mostly preferred an increase in indoor air velocities. In Phase 2, Subject 5 was the most satisfied with indoor air movement and did not request any change. In Phase 2, Subjects 2, 3, 4 and 6 requested an increase in indoor air movement in more than 40% of their responses.
4.3. Adaptive Behaviors
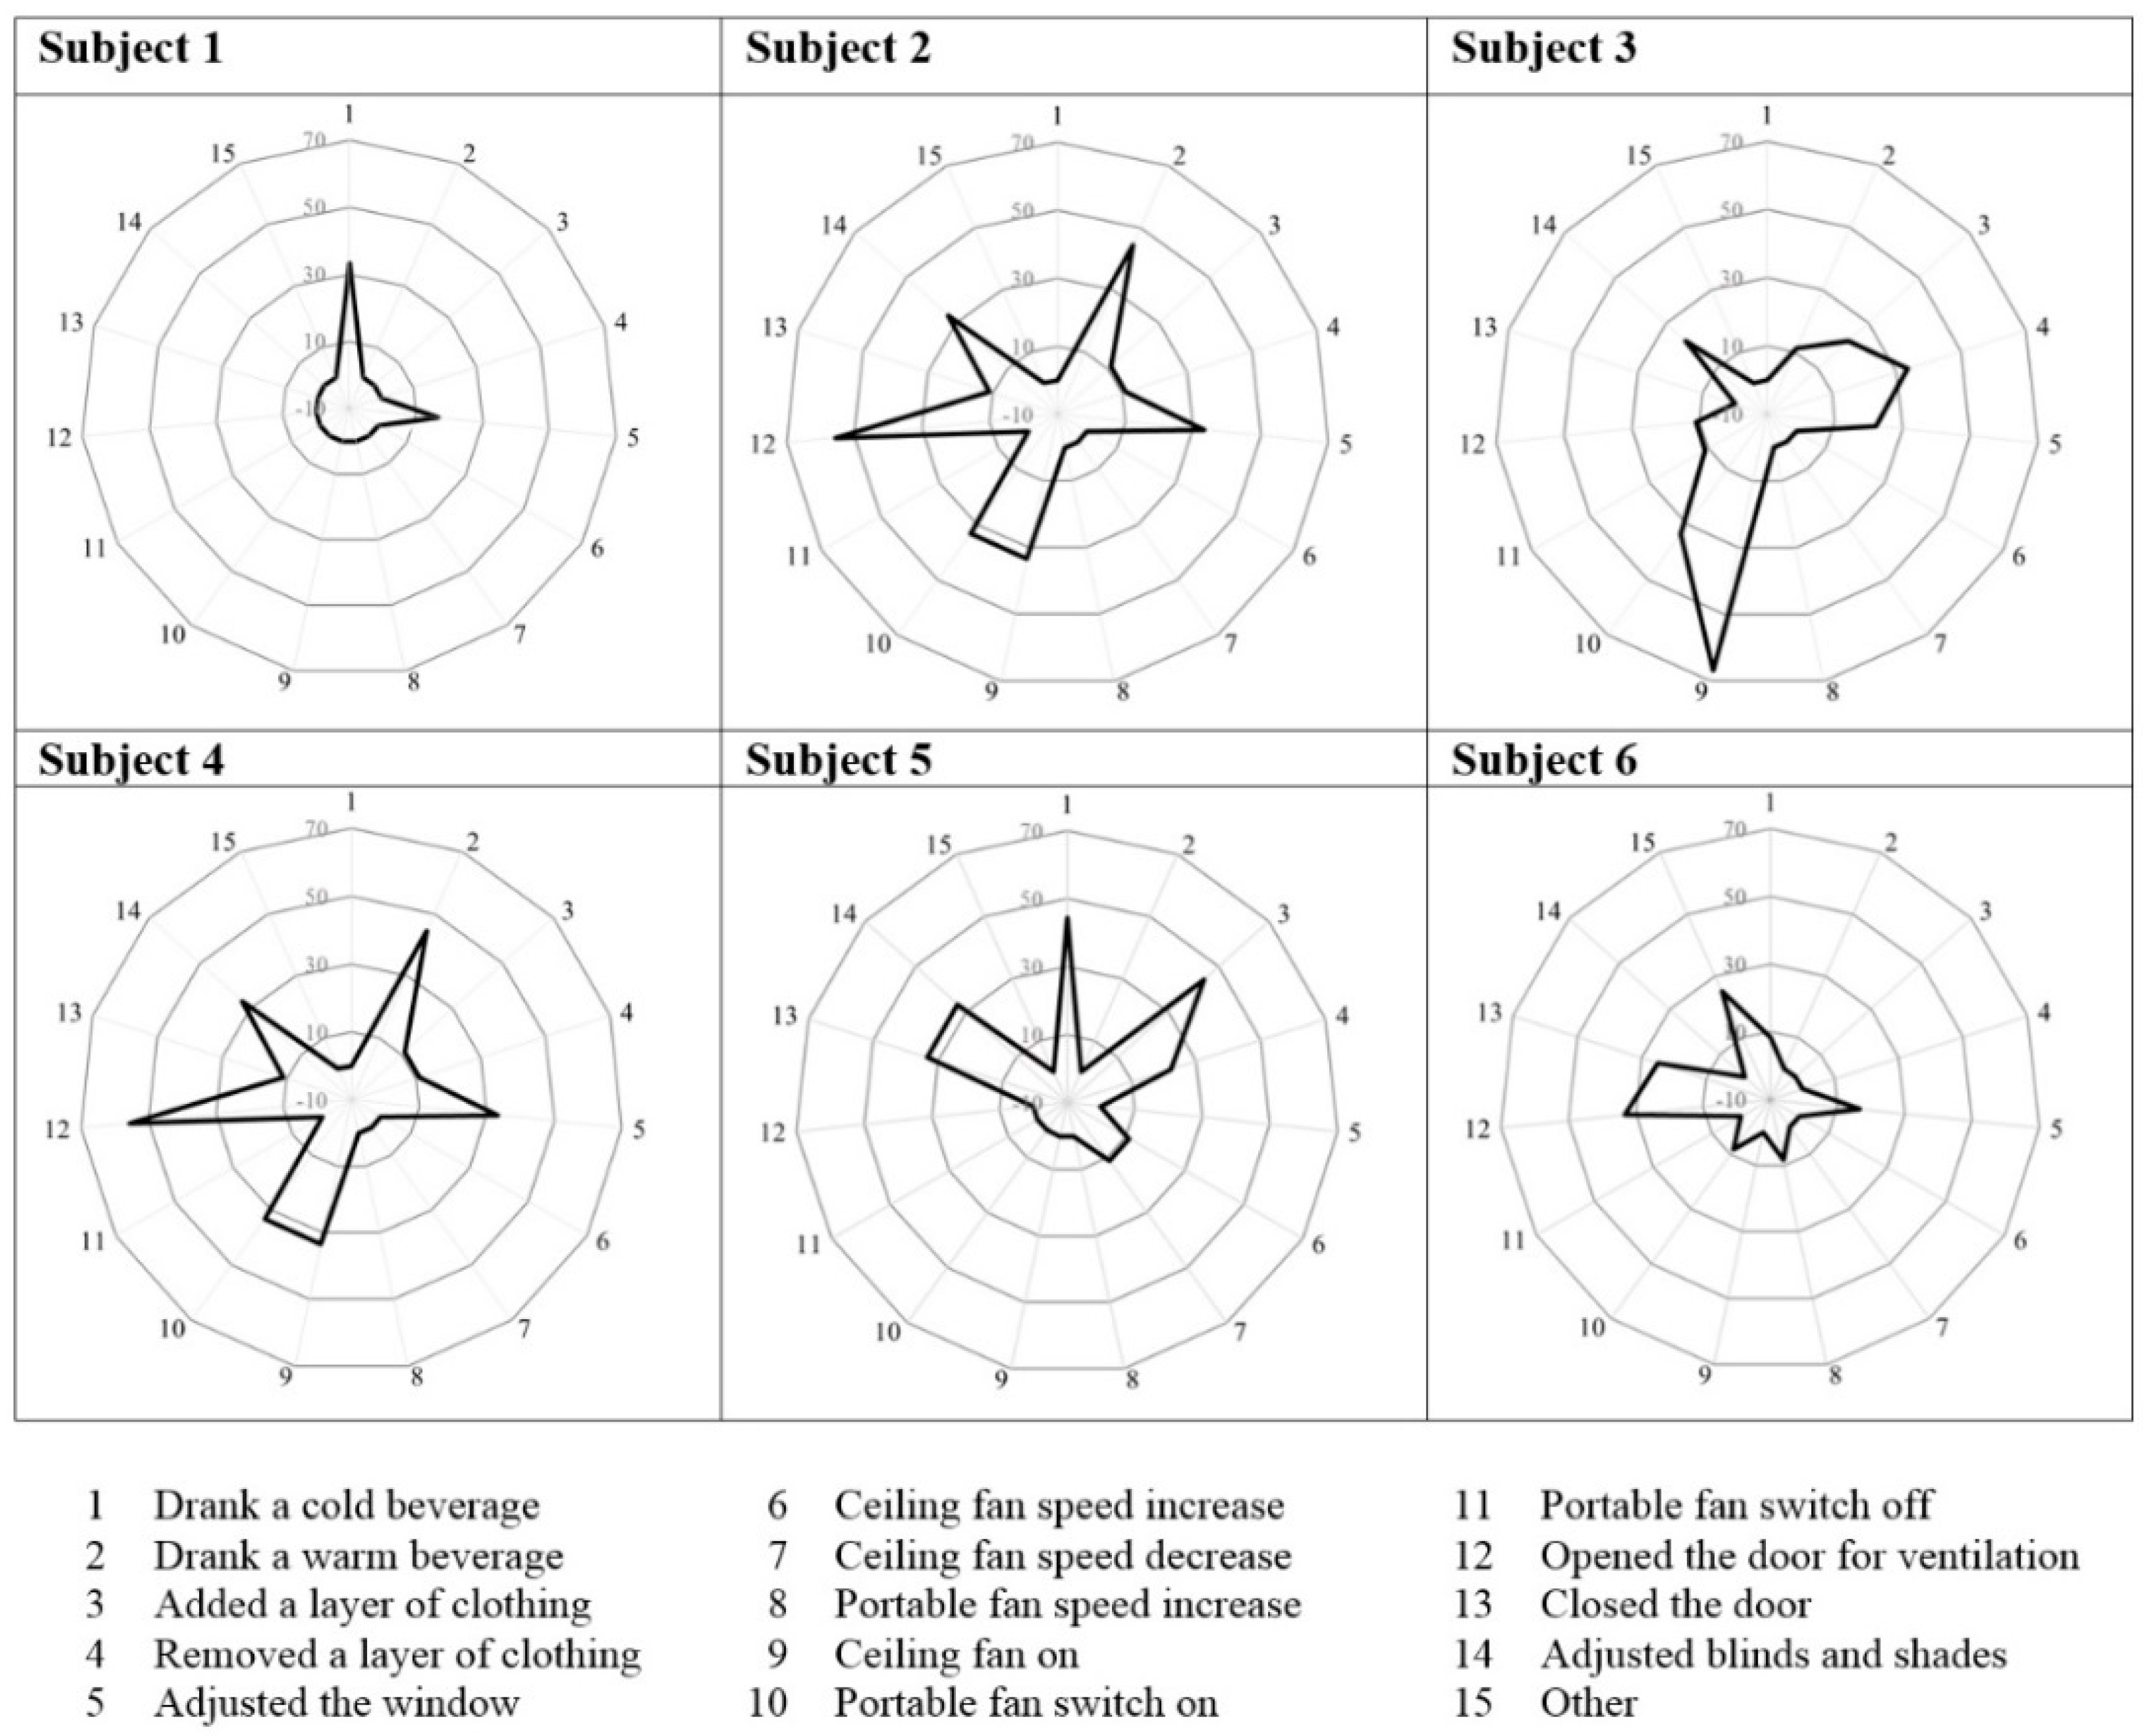
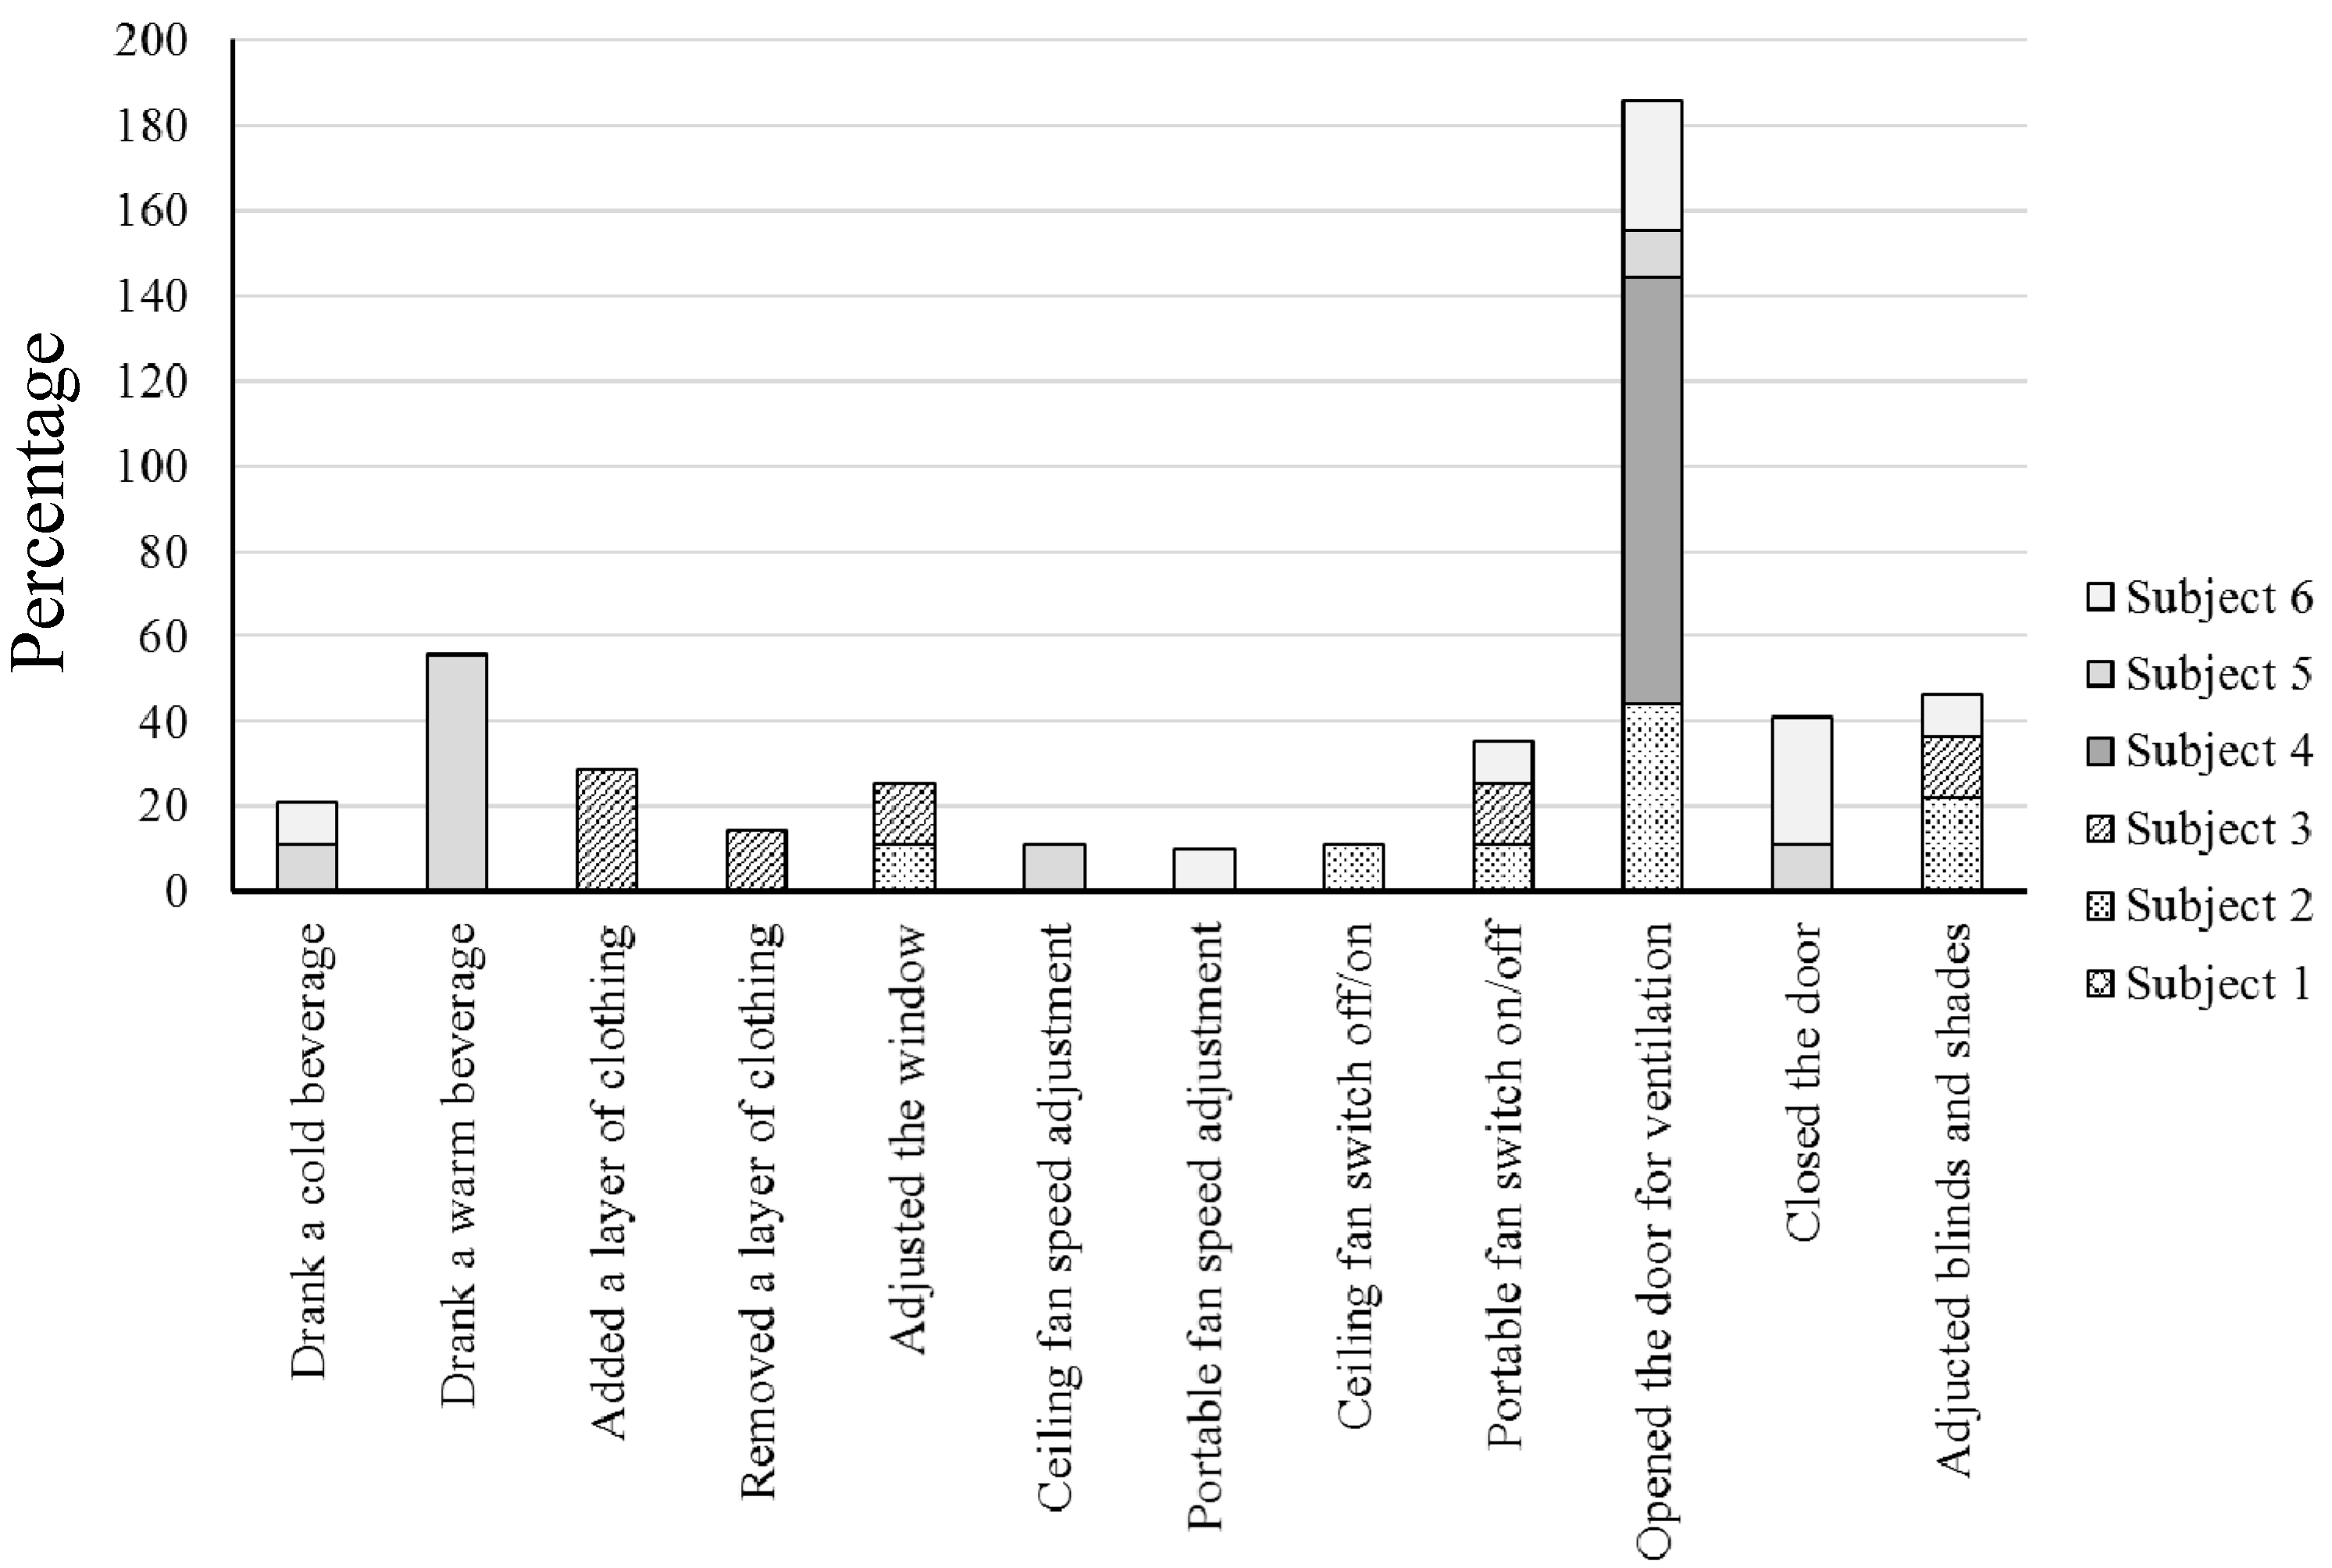
Figure 8 summarizes the percentage of various adaptive behaviors performed by each participant during Phase 1 and 2. Consumption of drinks, clothing adjustment, adjustments to windows, blinds, electric fans and doors were among the most preferred adaptive behaviors reported by the subjects.
Figure 9 summarizes the frequency of the most intermittent adaptive actions within the last hour prior to filling the survey. Adjustment to the room door (opening or closing) was the most frequently performed behavioral adjustment reported by most of the participants (Subjects 2, 4 and 6). Opening the room door was intended to increase ventilation in the room. Other frequent adaptive behavior includes clothing adjustments reported by Subject 3 and consumption of drinks reported by Subject 5. The participants rated the accessibility (FAA), usability (FAU) and responsiveness (FAR) of their most frequently performed adaptive behavior on a seven-point scale. The mean scores for these three items together with mean of clothing insulation (clo) and metabolic rate (met) were compared using one-way ANOVA and followed up with post hoc testing to determine significant differences between the means. The mean score of metabolic rate was the only statistically non-significant factor among the participants (F [18.67] = 1.73,
p = 0.187).
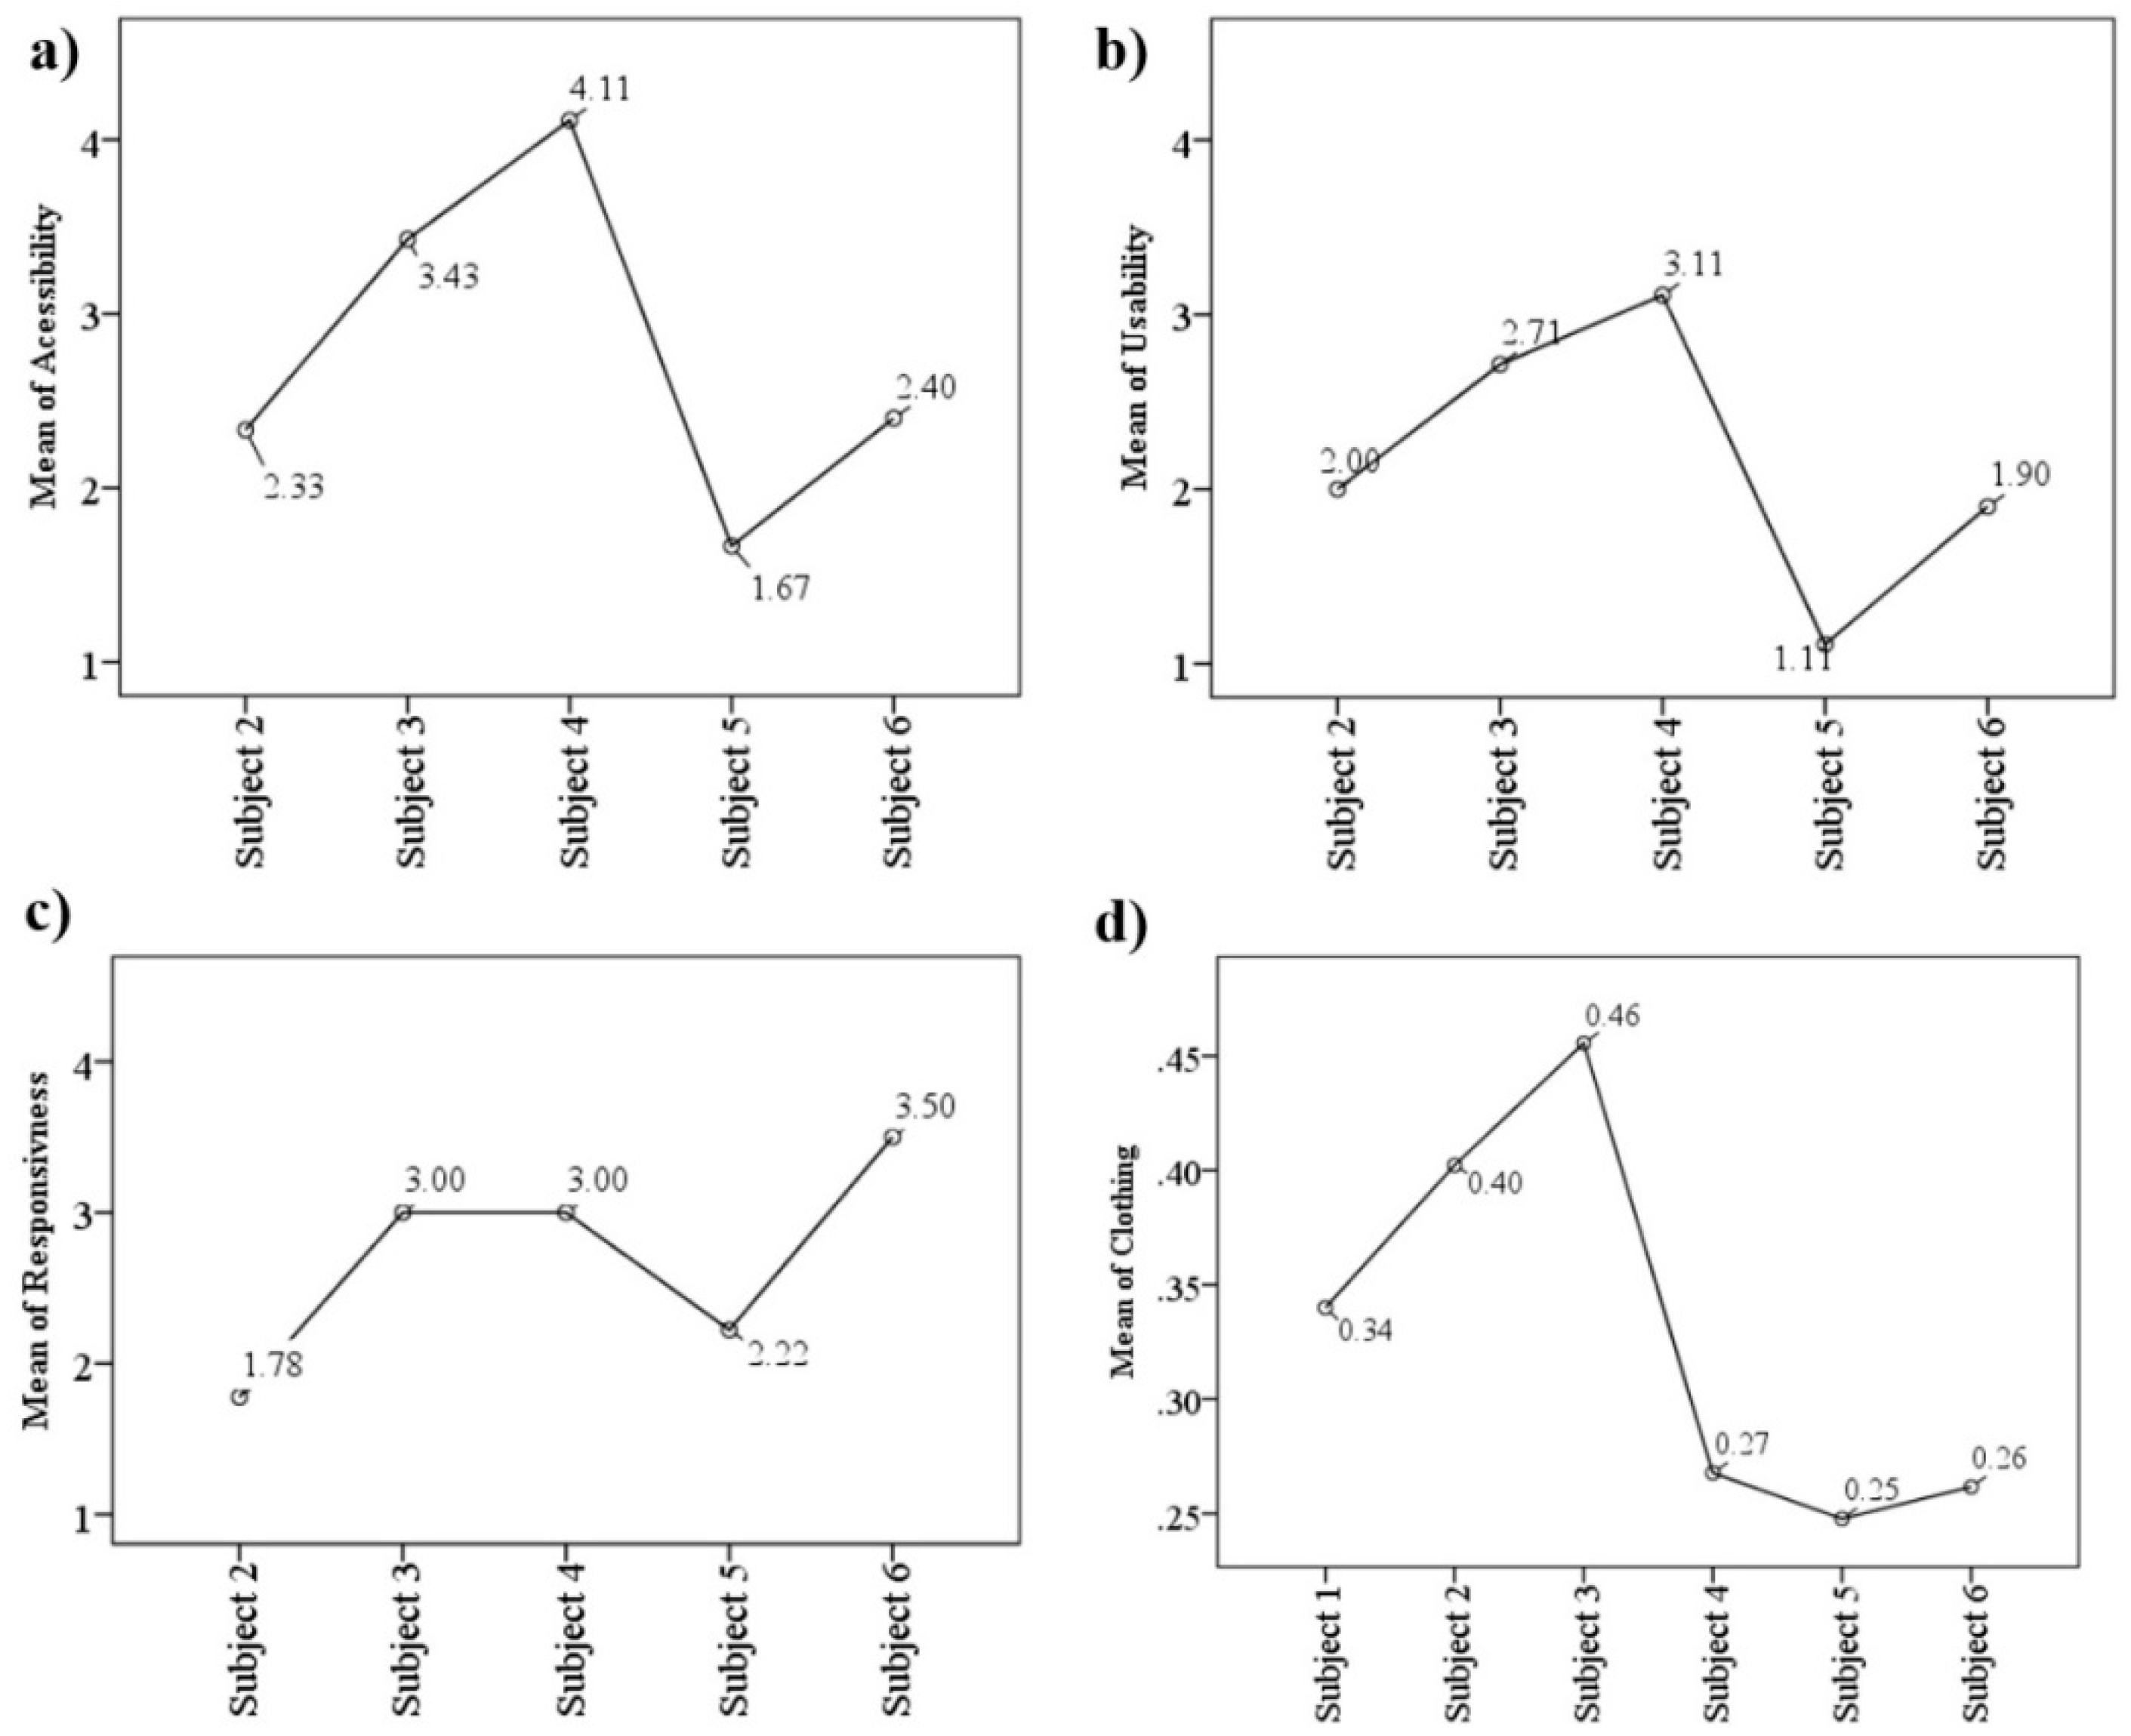
Figure 10 shows the means plot for accessibility, usability, responsiveness and clothing insulation. Subject 1 did not report a response for FAA, FAU and FAR. Subject 5 was most satisfied with accessibility and usability of the most frequent adaptive actions. Subjects 2, 5 and 6 were significantly more satisfied with accessibility and usability than Subject 4, who was the least satisfied for both. The highest mean difference for accessibility is between Subject 4 and 5 (2.44, 95% CI [1.37 to 3.52],
p = 0.0005) and the lowest mean difference is between Subject 4 and 6 (0.78, 95% CI [0.70 to 2.86],
p = 0.0005). The highest mean difference for usability is between Subject 4 and 5 (2.0, 95% CI [1.39 to 2.61],
p = 0.0005) and lowest mean difference is between Subject 4 and 2 (1.11, 95% CI [0.49 to 1.74],
p = 0.006). Subject 2 was significantly more satisfied with the responsiveness of her most frequent adaptive actions than the others. The highest mean difference for responsiveness is between Subject 6 and 2 (1.72, 95% CI [0.66 to 2.79],
p = 0.001). The highest clothing insulation was reported for Subject 3 (M = 0.45, SD = 0.04). The highest mean difference for clothing insulation is between Subject 3 and 5 (0.21, 95% CI [0.16 to 0.25],
p = 0.0005).
4.4. Environmental Controls
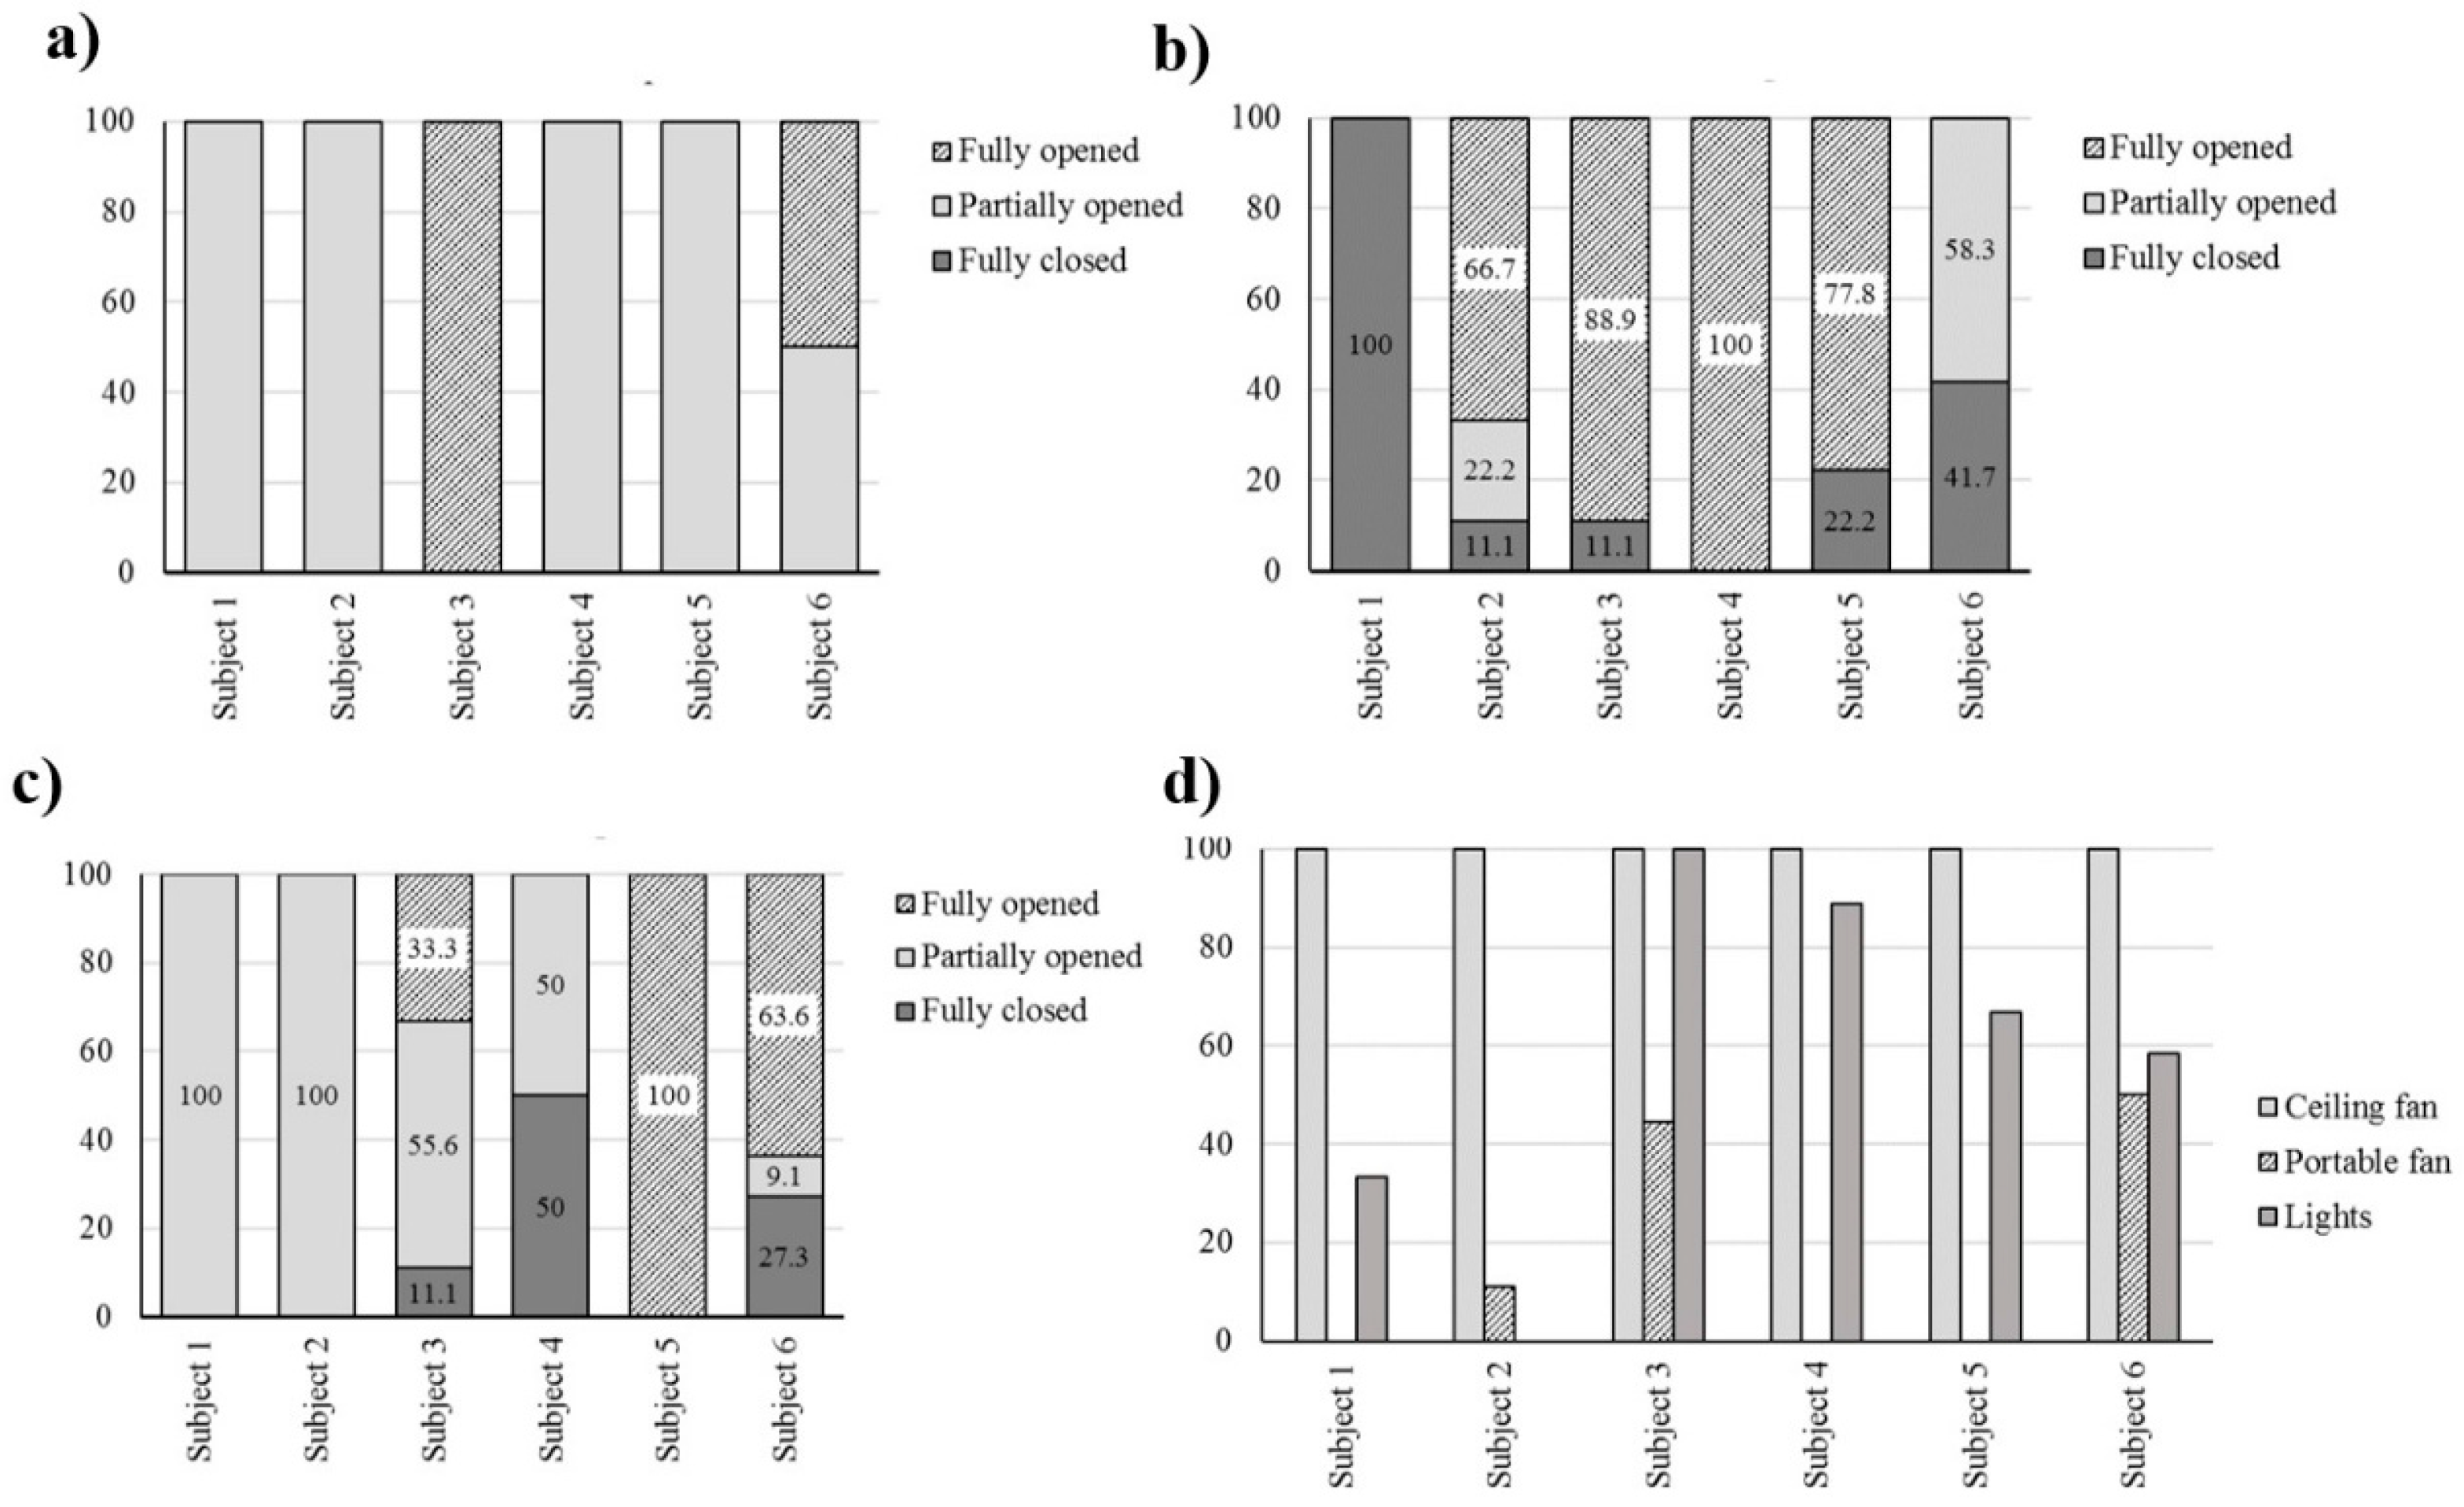
Figure 11 summarizes the state of environmental controls such as windows, blinds and doors in the surveyed rooms. The window position was consistent throughout the survey for all subjects except Subject 6. The window was kept either partially opened or fully opened by all participants. The participants mainly interacted with the room door and blinds. Subject 1, who had the lowest indoor air velocity, also had the room door closed throughout the survey. Subject 4 and 6 in Building-B had window blinds fully closed for 27–50% of the survey duration. In Building B, the adjustable air vent on the wall allows ventilation from the building envelope even when the window blinds are closed. This may have allowed Subjects 4 and 6 to maintain cross ventilation in the room when the windows blinds were fully closed. Those in Building B also used electric lights for over 50% of the surrey duration.
4.5. Indoor Environment Quality
The state of the thermal environment indoors may significantly influence an occupant’s perception of other indoor environment quality factors. Further behavioral adjustments aimed at thermal comfort alleviation in naturally ventilated buildings may also result in modifications to these indoor environment quality factors such as air quality, lighting and acoustics. In this survey, eleven questionnaire items were used to evaluate the occupant’s perception towards air quality, lighting and acoustics. Spearman’s rank-order correlation was used to identify significant correlations between occupants’ perceptions of measured indoor environment quality variables.
Table 6 summarizes the results of Spearman’s rank-order correlation for occupant’s perception of various indoor environment quality factors. Occupant’s acceptance of the thermal environment was significantly and positivity correlated with air movement acceptance (Spearman’s correlation coefficient ρ = 0.558,
n = 54,
p = 0.0005), air quality acceptance (ρ = 0.468,
n = 54,
p = 0.0005) and air freshness (ρ = 0.649,
n = 54,
p = 0.0005). Further occupants associated higher draft with greater acceptability of the air quality (ρ = 0.391,
n = 54,
p = 0.003) and air movements (ρ = 613,
n = 54,
p = 0.0005), which indicated that higher indoor air velocities might be preferred by the participants and higher air velocities might also increase occupant’s satisfaction towards the indoor air quality. Spearman’s correlation indicates that acceptance of lighting quality was significantly and positively correlated to amount of glare from to daylight (ρ = 0.501,
n = 53,
p = 0.0005) and electric lights (ρ = 0.491,
n = 53,
p = 0.0005).
Further analysis was conducted to identify significant differences in mean score for occupant perception of glare from daylight (NLG), glare from electric lights (AGL) and noise. The mean scores for NGL, AGL and noise were compared using one-way ANOVA and followed up with post hoc testing to determine significant differences between the means. The results are summarized in
Table 7. Mean scores for NGL, AGL and noise were statistically significantly different.
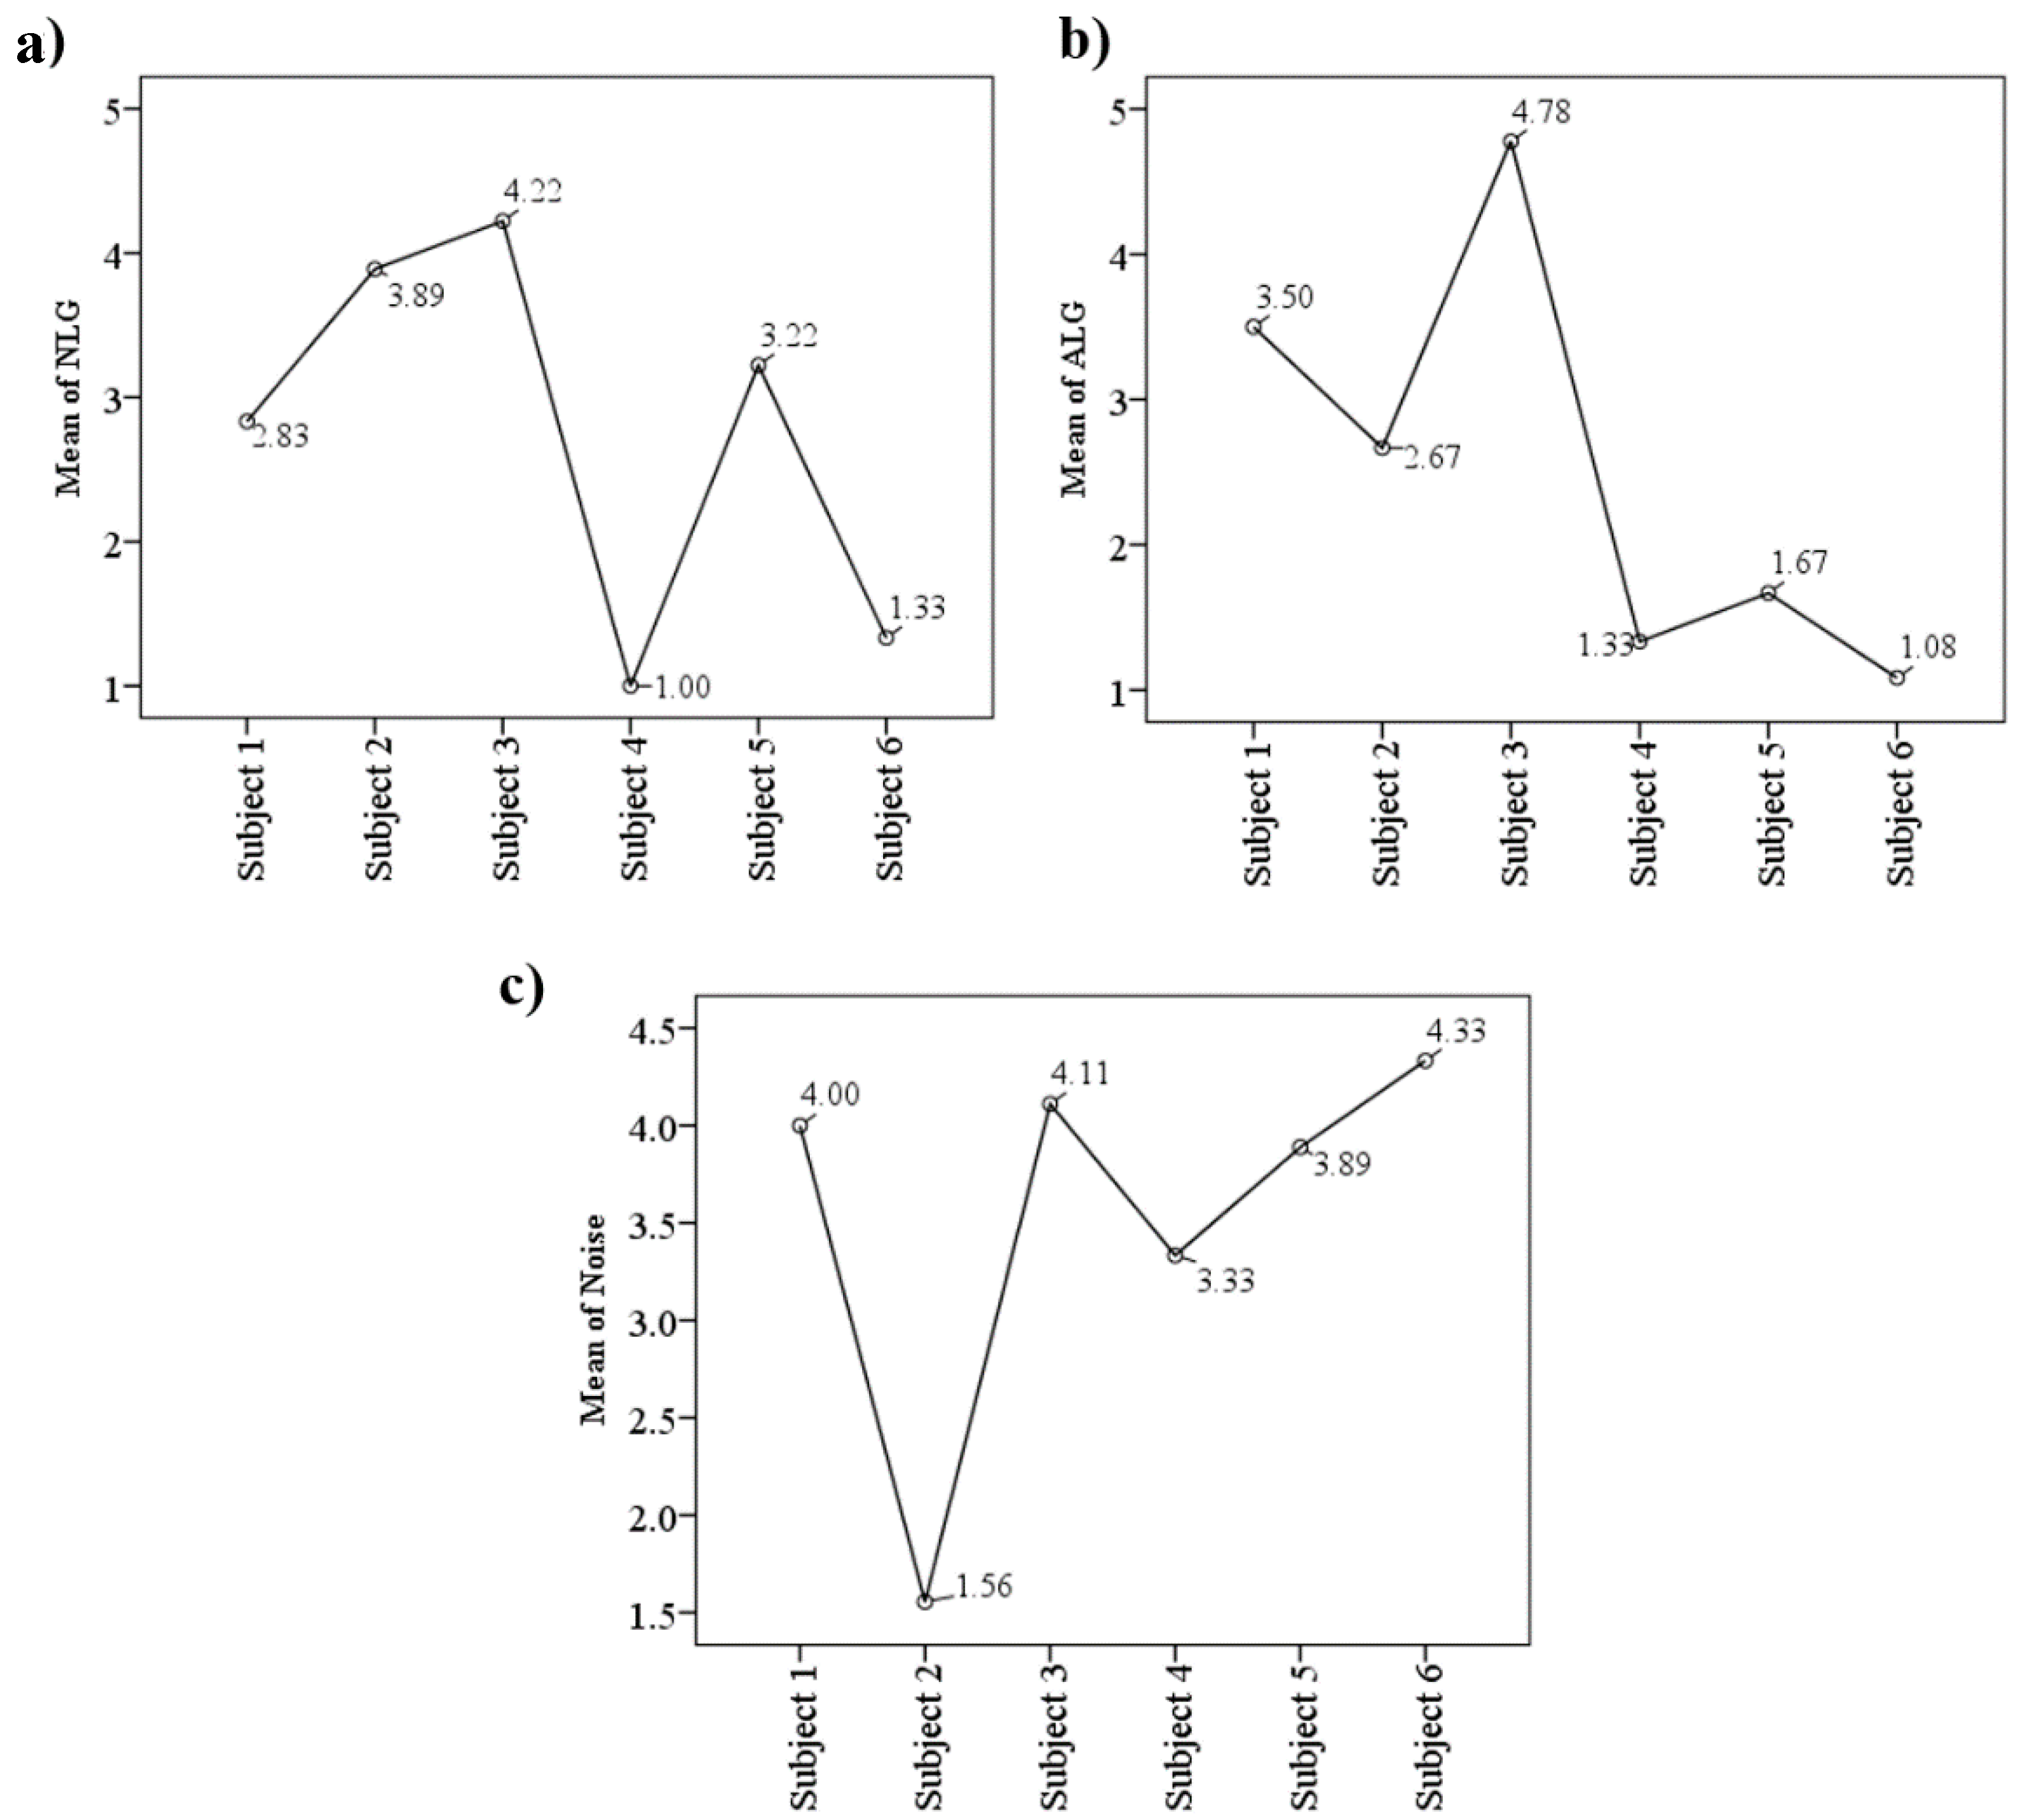
Figure 12 shows the means plot for NGL, AGL and noise. Subjects 4 and 6 who had the window blind closed during part of the survey, reported significantly less glare from day lighting. The highest mean difference for NGL is between Subjects 3 and 4 (3.0, 95% CI [1.67 to 4.33],
p = 0.0005) and lowest mean difference is between Subjects 1 and 6 (1.5, 95% CI [0.09 to 2.91],
p = 0.03). The highest mean difference for AGL is between Subjects 3 and 6 (3.69, 95% CI [2.85 to 4.54],
p = 0.0005) and lowest mean difference is between Subjects 2 and 5 (1.0, 95% CI [0.1 to 1.90],
p = 0.022). Subject 2 was significantly more satisfied with indoor noise than all others. The highest mean difference for noise is between Subjects 6 and 2 (2.78, 95% CI [1.38 to 4.17],
p = 0.0005).
5. Summary of Findings
Firstly, occupants in Building B were more likely to accept the thermal environments which were not within those specified by the ASHRAE thermal comfort standard for naturally conditioned spaces. A significant influence came from indoor air velocity, which was linked to the occupant’s acceptance of these imposing heat stresses. Those who were either exposed to higher air velocities (Subject 6) or those who were significantly more satisfied with indoor air moment (Subjects 4 and 5) showed greater tolerance to the heat stress.
Secondly, all occupants made a considerable attempt to increase air velocity in their rooms. The ceiling fans in all the surveyed rooms were switched on during the whole survey period. Some occupants also used a portable fan (Subjects 2, 3 and 6). The occupants regarded cross ventilation as an effective mechanism to increase indoor air velocity. All surveyed rooms could only be cross-ventilated by opening both windows and room doors. The occupants frequently changed the position of the door (open/closed) while the window was kept in a constant position, either fully opened or partially opened. However, opening the door for cross ventilation was regarded as highly responsive for heat alleviation only when the thermal environment was within the acceptable condition specified by the ASHRAE comfort standard for naturally conditioned spaces.
Thirdly, personal adjustments such as lower clothing insulation and consumption of drinks were linked to a significant improvement in their perceptions of the thermal environment. Significantly lower clothing insulation value was reported by those who were more likely to accept a less than preferred thermal environment (Subjects 4, 5 and 6). Furthermore, those who performed personal adjustments such as consumption of drinks were also significantly more satisfied with the accessibility, usability and responsiveness of this action.
Last but not least, the occupants’ perception of the thermal environments was significantly associated with other indoor environmental factors such as indoor air quality. Higher satisfaction with the thermal environment and air movement acceptance were associated with greater satisfaction of air quality and air freshness. However, the cause of this association cannot be determined. High association between occupants’ acceptance of air movement, higher draft and greater acceptance of air quality indicated the positive contribution of higher air velocities in naturally ventilated buildings to increase occupants’ perception of air quality. This finding adds to the positive attribute of higher indoor air velocity to improve psychological cooling effect of occupants in naturally ventilated buildings.
In summary, adaptive behaviors such as window and door opening, changing clothing conditions and consumptions of cold drinks have an important role in helping occupants accept thermal environments beyond the comfort zone. The window opening behavior was also found effective in temperate climates such as Denmark where residents opened windows according to outdoor climates [
28]. Research in other climates showed that these adaptive behaviors in naturally ventilated or mixed-mode conditions were closely linked to and can be predicted by outdoor temperature [
29,
36]. These precedent studies support the present study that adaptive behaviors can help occupants in naturally ventilated buildings in tropical climates adapt to thermal environments beyond the comfort zone.
6. Conclusions
This study revealed that occupants living in naturally ventilated buildings in tropics were exposed to higher operative temperatures than the ASHRAE comfort standard for naturally conditioned spaces. However, they were more likely to accept such conditions. Two behavioral adjustments were found to have a profound impact on occupants’ acceptance of the imposing heat stresses: (1) increasing the indoor air velocity by turning on mechanical fans and opening the door/windows for cross ventilation and (2) lowering clothing insulation values by changing clothes and dressing in fewer clothes. These behavioral adjustments successfully alleviated thermal stress as they directly impacted the body’s heat balance. The efficacy of available control as a form of adaption [
37,
38] beyond the body’s heat balance seemed to have little impact on improving the occupants’ acceptance of the thermal environment. In tropical climates, incorporating supplementary ventilation mechanisms such as adjustable air vents on the building envelope could positively contribute towards occupants’ satisfaction of the indoor environment, as occupants could lower window blinds to let outdoor air in while avoiding discomfort glare. Supplementary mechanical ventilation, such as fans, is instrumental in increasing indoor air velocities and improving thermal comfort. Higher air velocity also results in greater satisfaction of indoor air quality.
This study is a pilot study. It has two limitations: (1) the sample size is small; and (2) the outdoor climate is missing in this study. Future studies should enlarge the sample size. It should also correlate indoor and outdoor climates. The gender and ethnical backgrounds should be considered for an understanding of their comfort expectations. A future study will use sophisticated statistical methods to estimate the probability of a certain adaptive behavior happening as a function of temperature variations. The common statistical method used in similar studies is multiple logistic regression technique [
30,
31,
32,
36]. Usually, the adaptive behaviors should be analyzed separately: using each behavior as the dependent variable and the outdoor air temperature as the dependent variable [
28]. The logistic regression models can help to predict the probability of residents using a particular strategy to achieve comfort, as a function of the outdoor air temperature recorded from the nearest weather station [
29].


