1. Introduction
Italy, one of the cradles of Western Civilization, has over 100,000 monuments such as churches, cathedrals, archaeological sites, and historical palaces, and it has the most United Nations Educational, Scientific and Cultural Organization (UNESCO) designated world heritage sites [
1]. Among the 51 sites on the list there is the 18th-Century Royal Palace at Caserta with its park, the Aqueduct of Vanvitelli, and the San Leucio Complex. This large scale palace was created by the Bourbon King of Naples Charles III as the Italian response to the Palace of Versailles or the Royal Palace in Madrid [
2]. The building exemplifies the Italian way of bringing together a magnificent palace with its park and gardens, as well as natural woodland, hunting lodges, and a silk factory. In fact, the site expresses the beauty of the integration of the architectural masterpiece into the natural landscape. The Palace, designed and built by the architect Luigi Vanvitelli, was the Bourbon dynasty’s way to showcase the Kingdom of the Two Sicilies [
2].
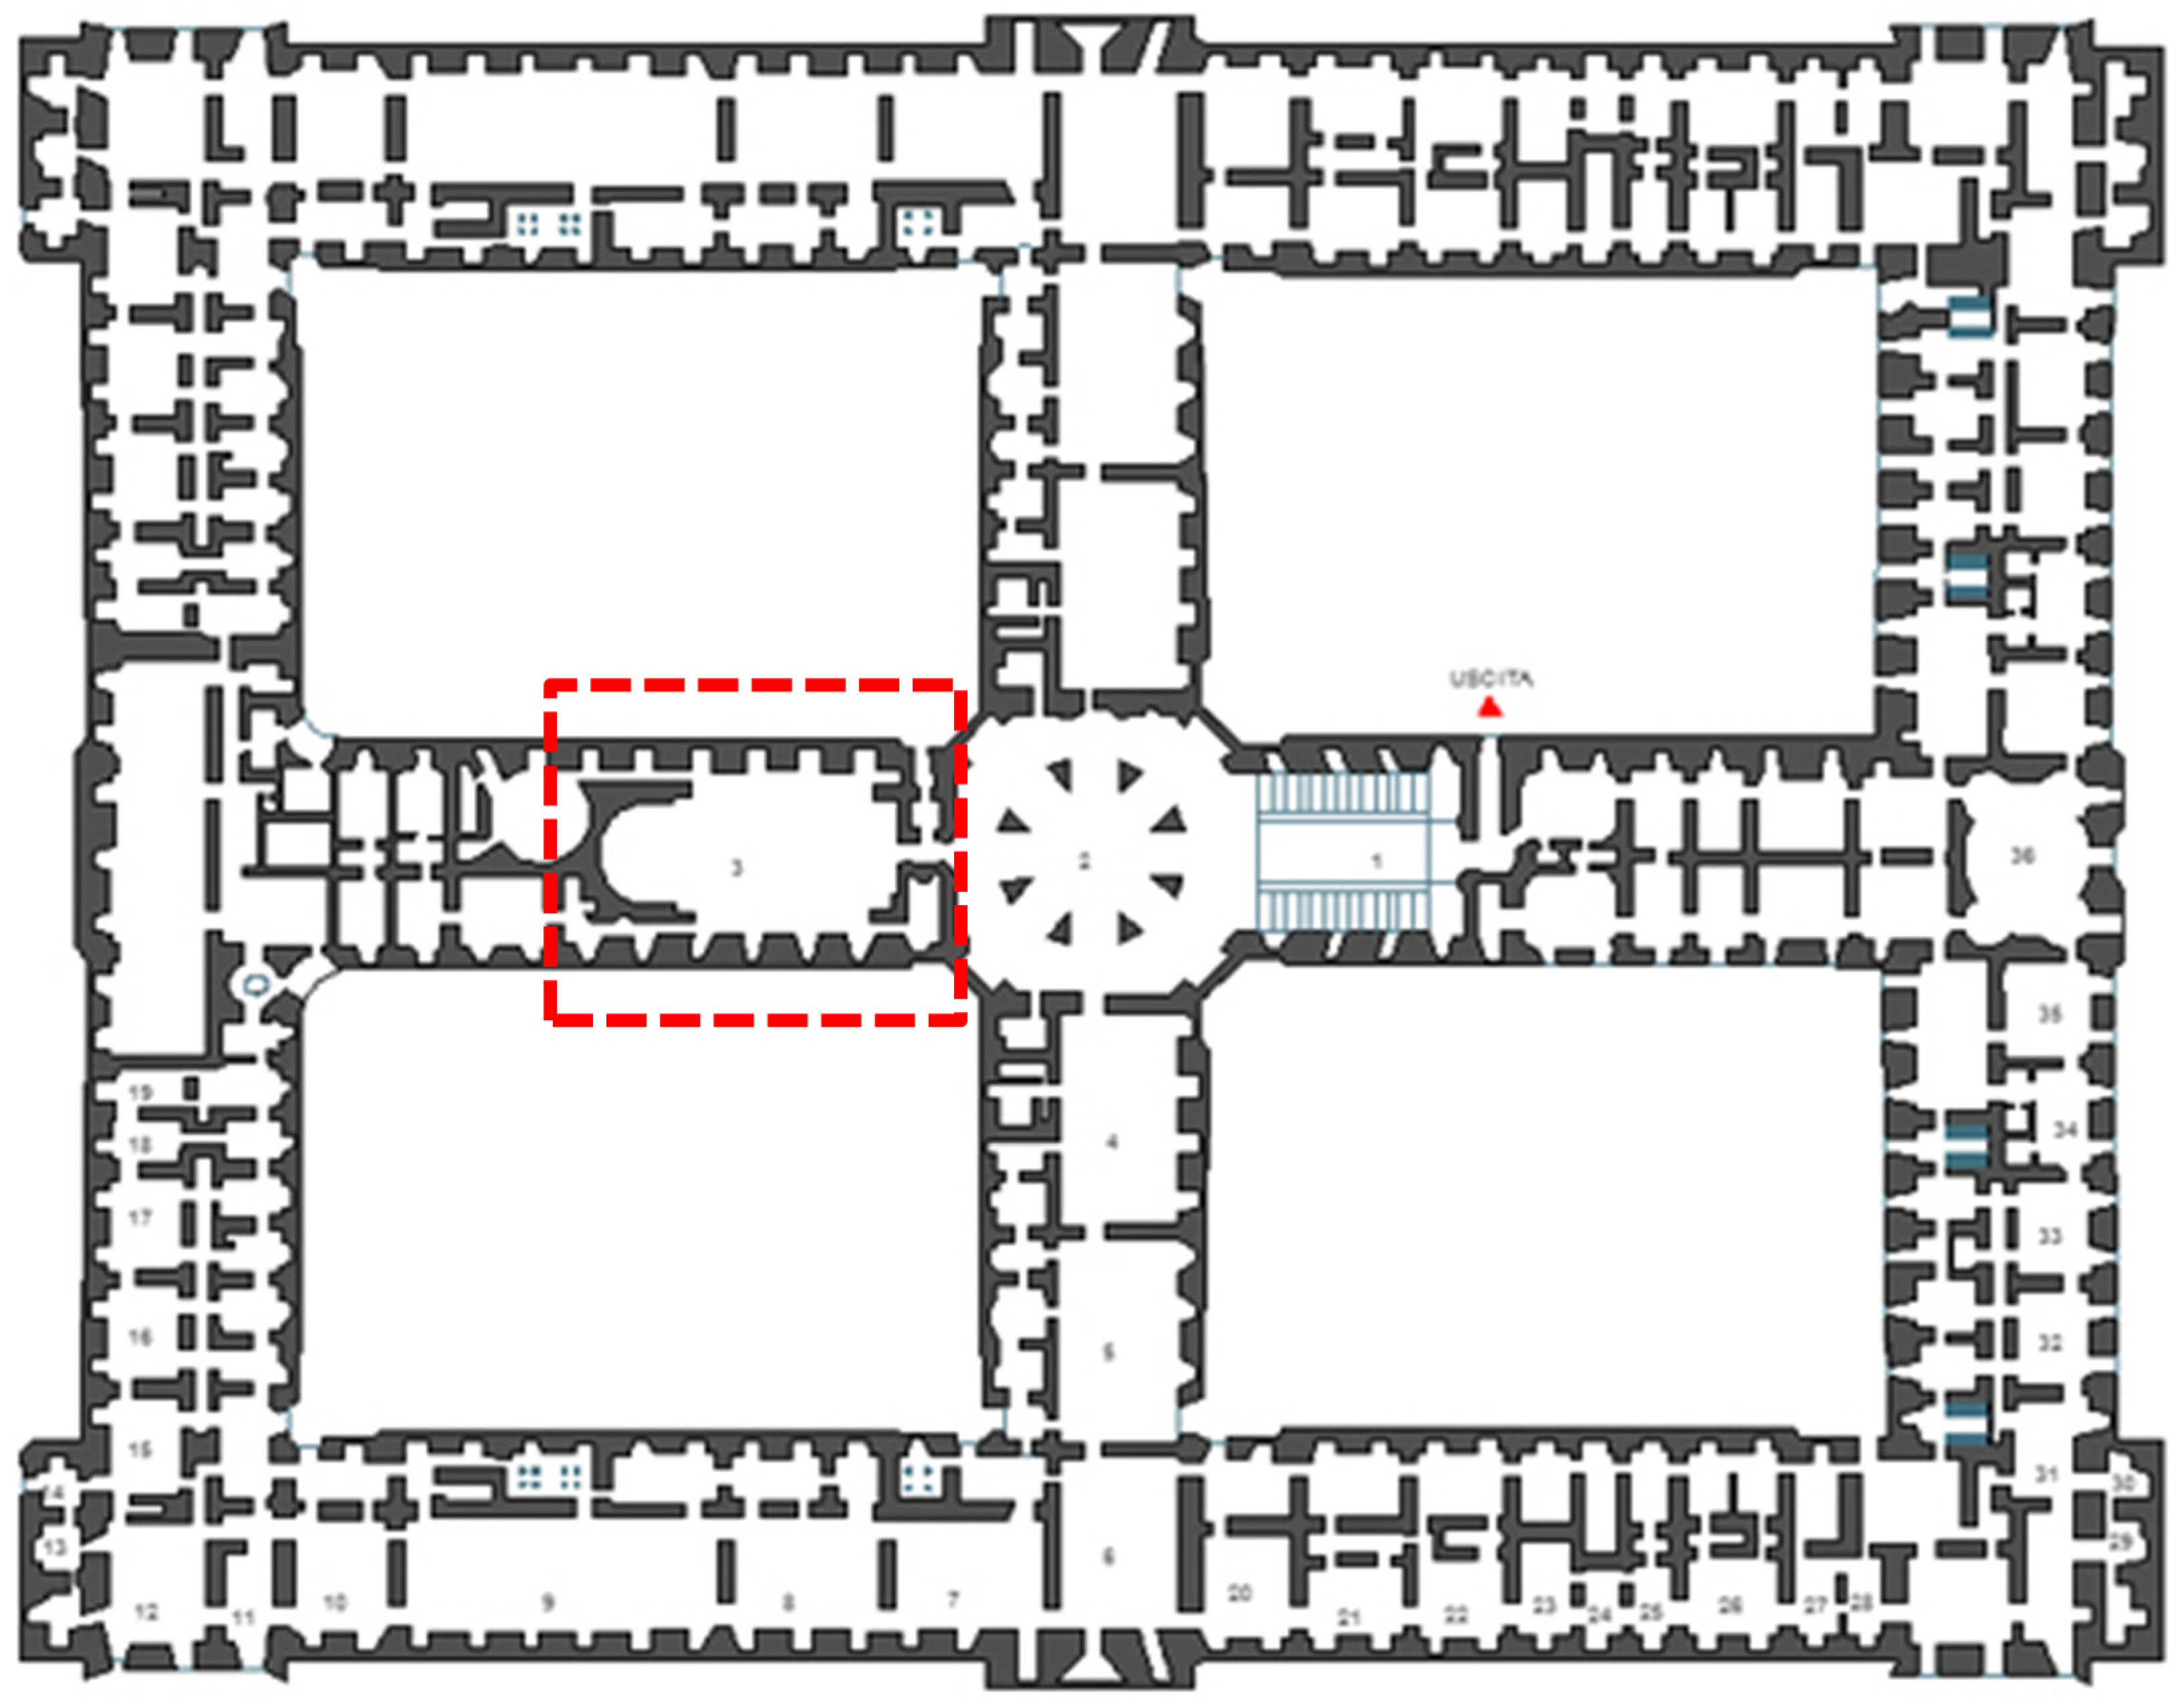
The Palatine Chapel, the focus of the current study, is located within the Royal Palace and was opened with a midnight mass on Christmas day, 1784 in the presence of King Ferdinand IV. The chapel emulates the analogous room of the Palace of Versailles. Originally dedicated to religious purposes, the magnificent chapel, located on the first floor of the Palace (
Figure 1), is currently used for public events such as meetings and chamber music concerts. The new functions have shown the inadequacy of the acoustics of this marbled and highly decorated room (
Figure 2).
Figure 1.
Plans of the Royal Palace in Caserta, showing the position of the Palatine Chapel.
Figure 1.
Plans of the Royal Palace in Caserta, showing the position of the Palatine Chapel.
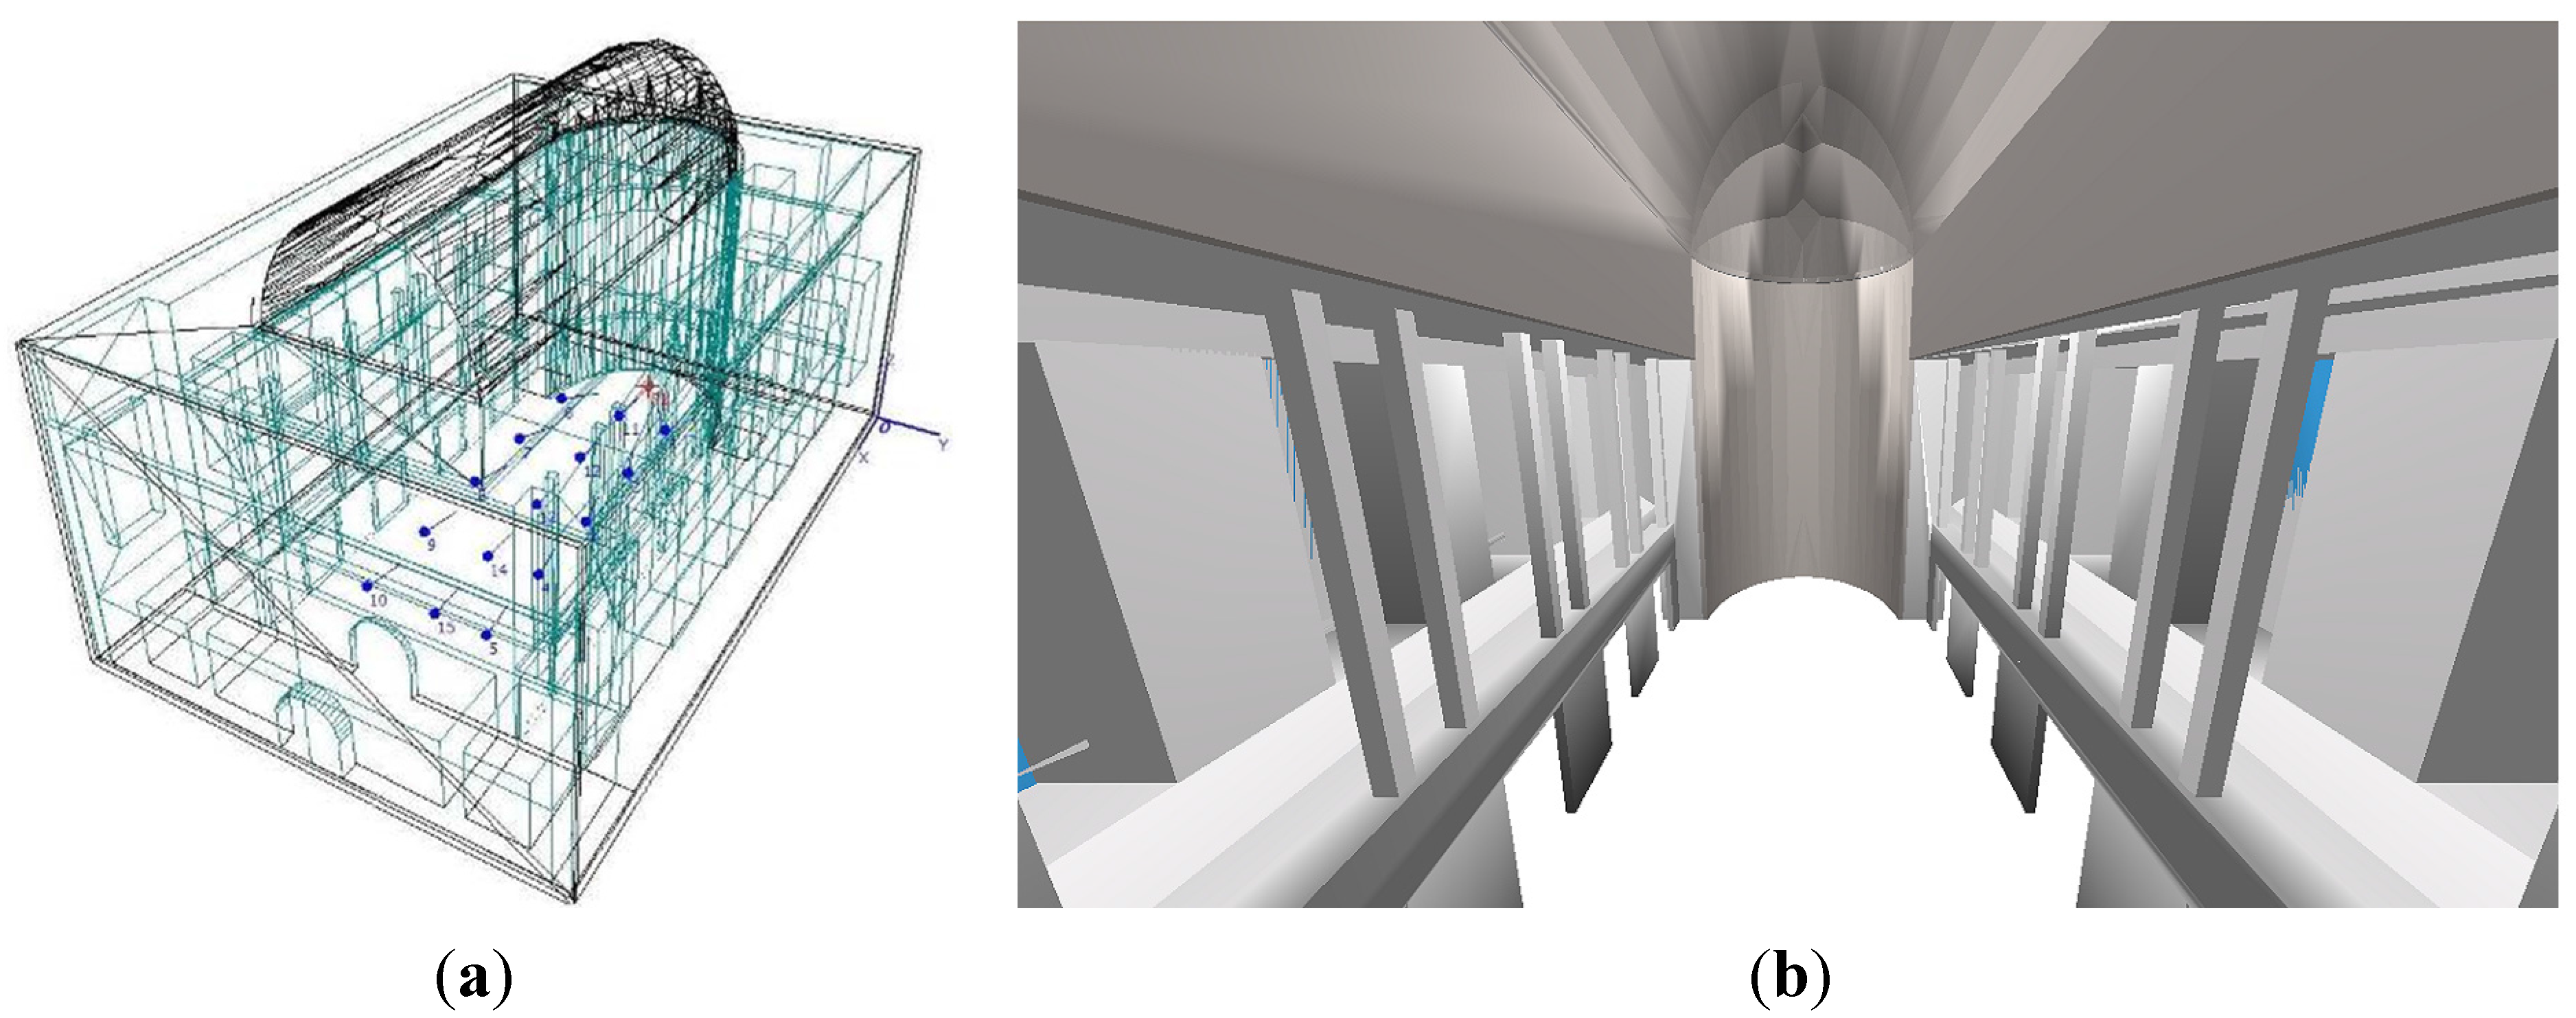
The chapel is rectangular with a semi-circular apse at one end. On the opposite side to the apse is the entrance portal, above which is the royal tribune used by high dignitaries and the court ladies during sacral functions. Two galleries run along the side walls with double Corinthian columns that rise in support of a barrel vault with a richly decorated coffered ceiling. An abundance of colored marble characterizes most of the surfaces of the chapel. A large icon painted by Giuseppe Bonito portraying the Immaculate Conception is suspended in the apse, while originally organ pipes are placed on the two side galleries. The Chapel suffered severe damages during World War II, and was then restored according to the original design.
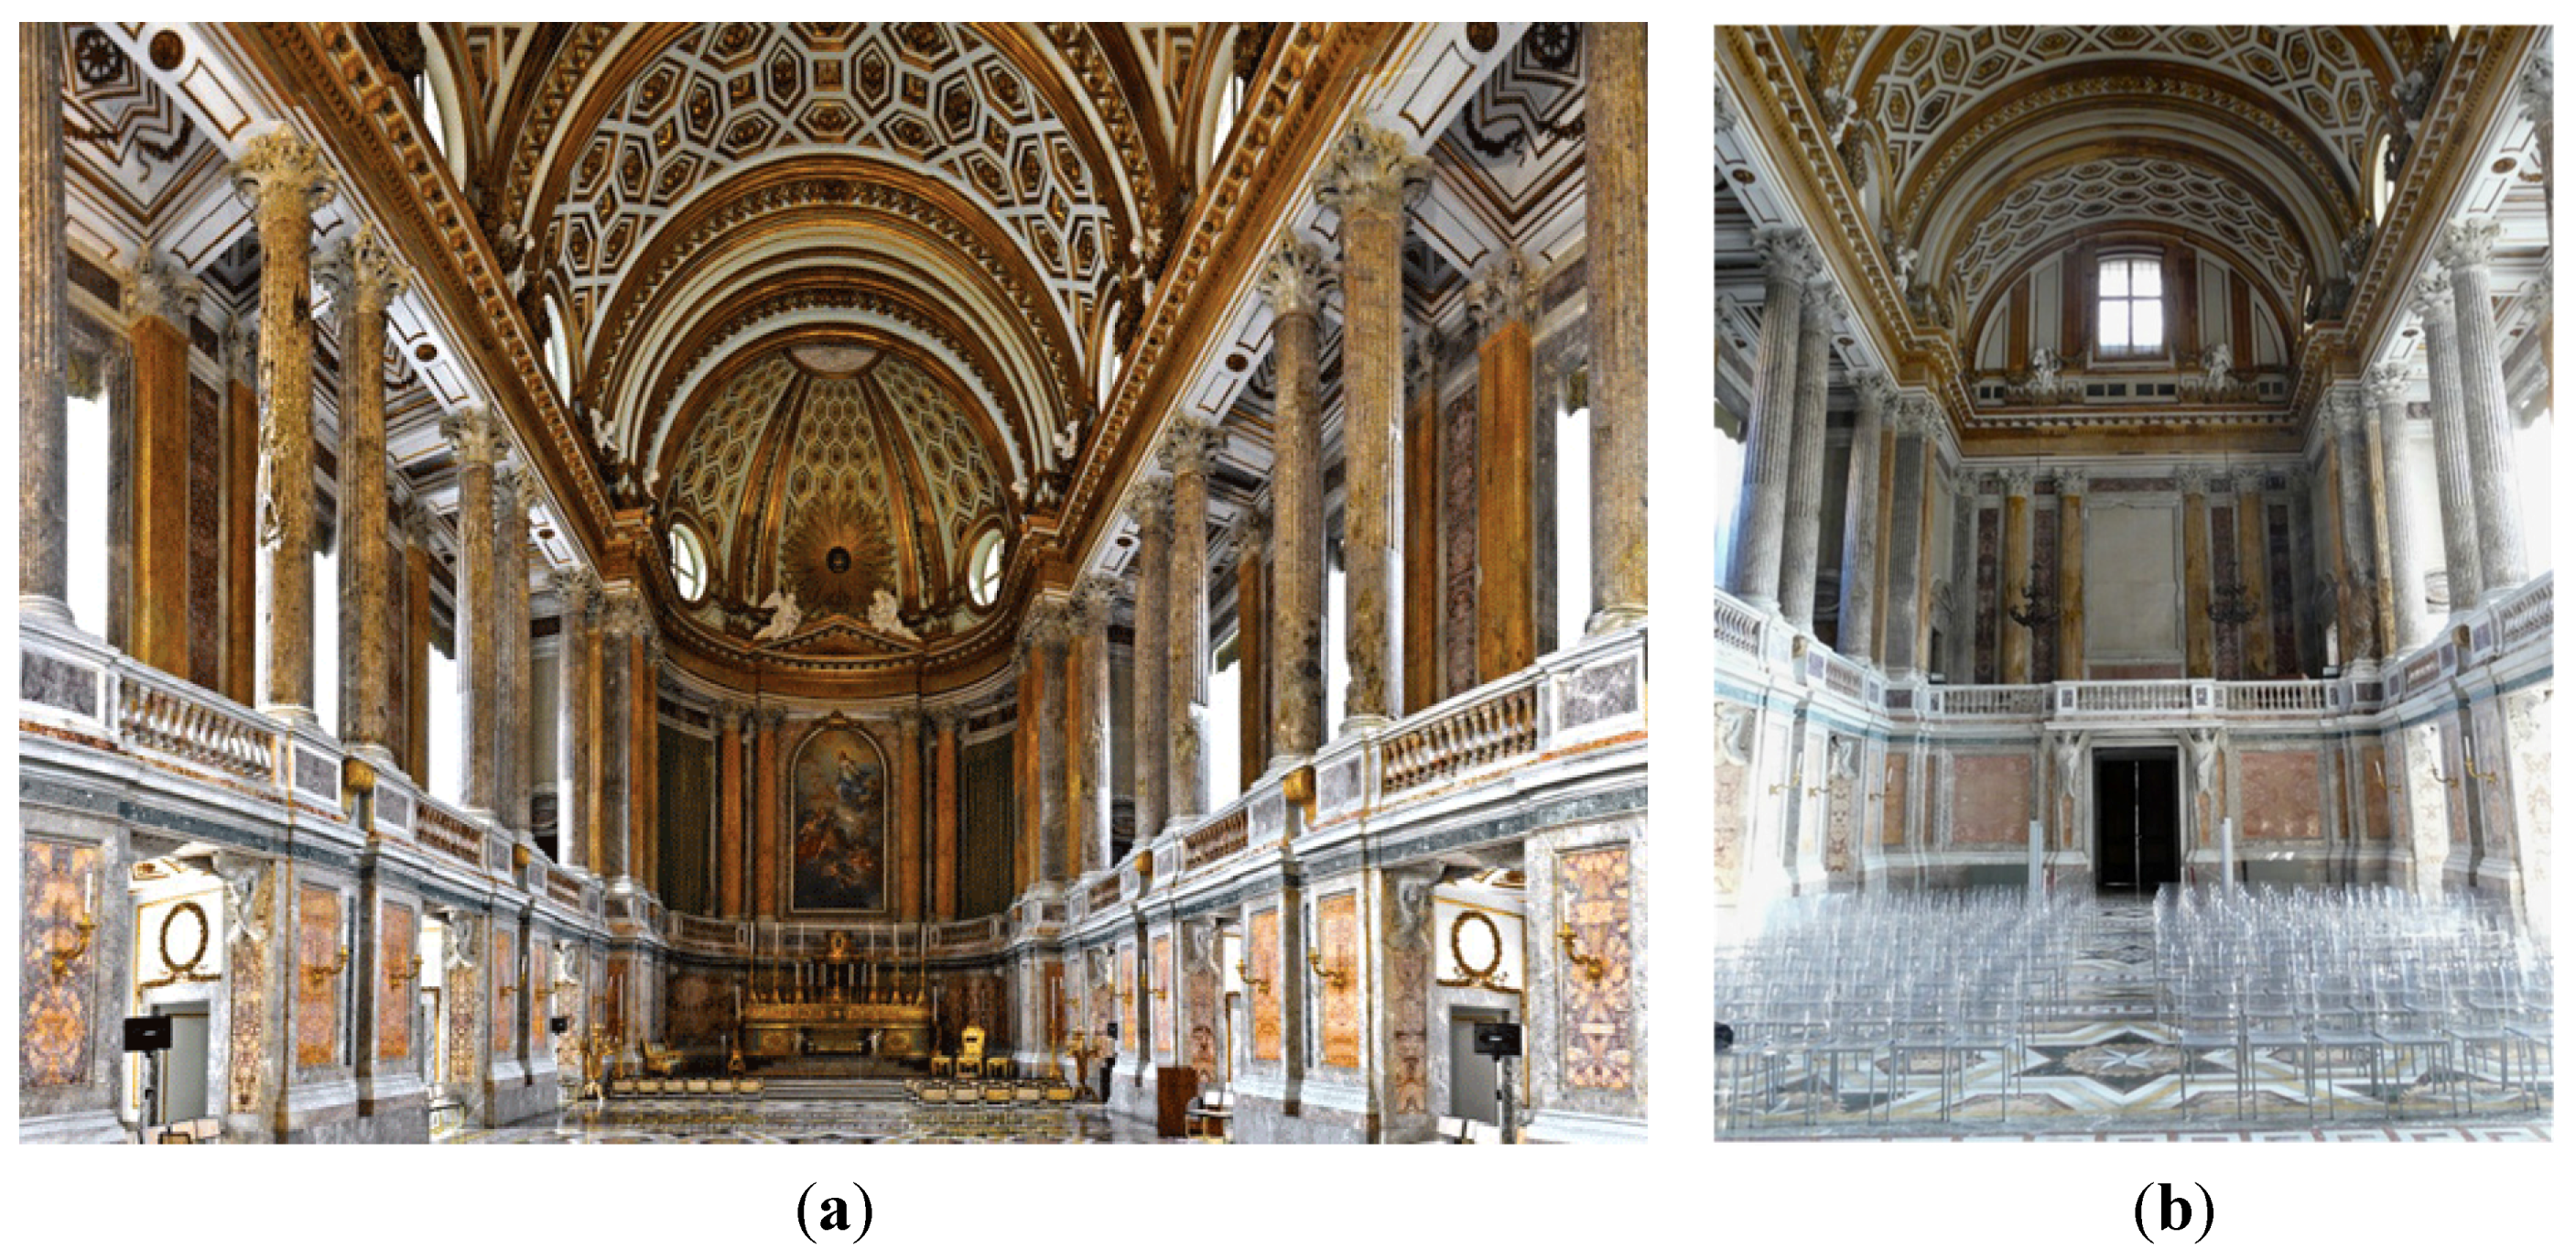
Figure 2.
Views of the Palatine Chapel toward the apse (a) and toward the royal tribune (b).
Figure 2.
Views of the Palatine Chapel toward the apse (a) and toward the royal tribune (b).
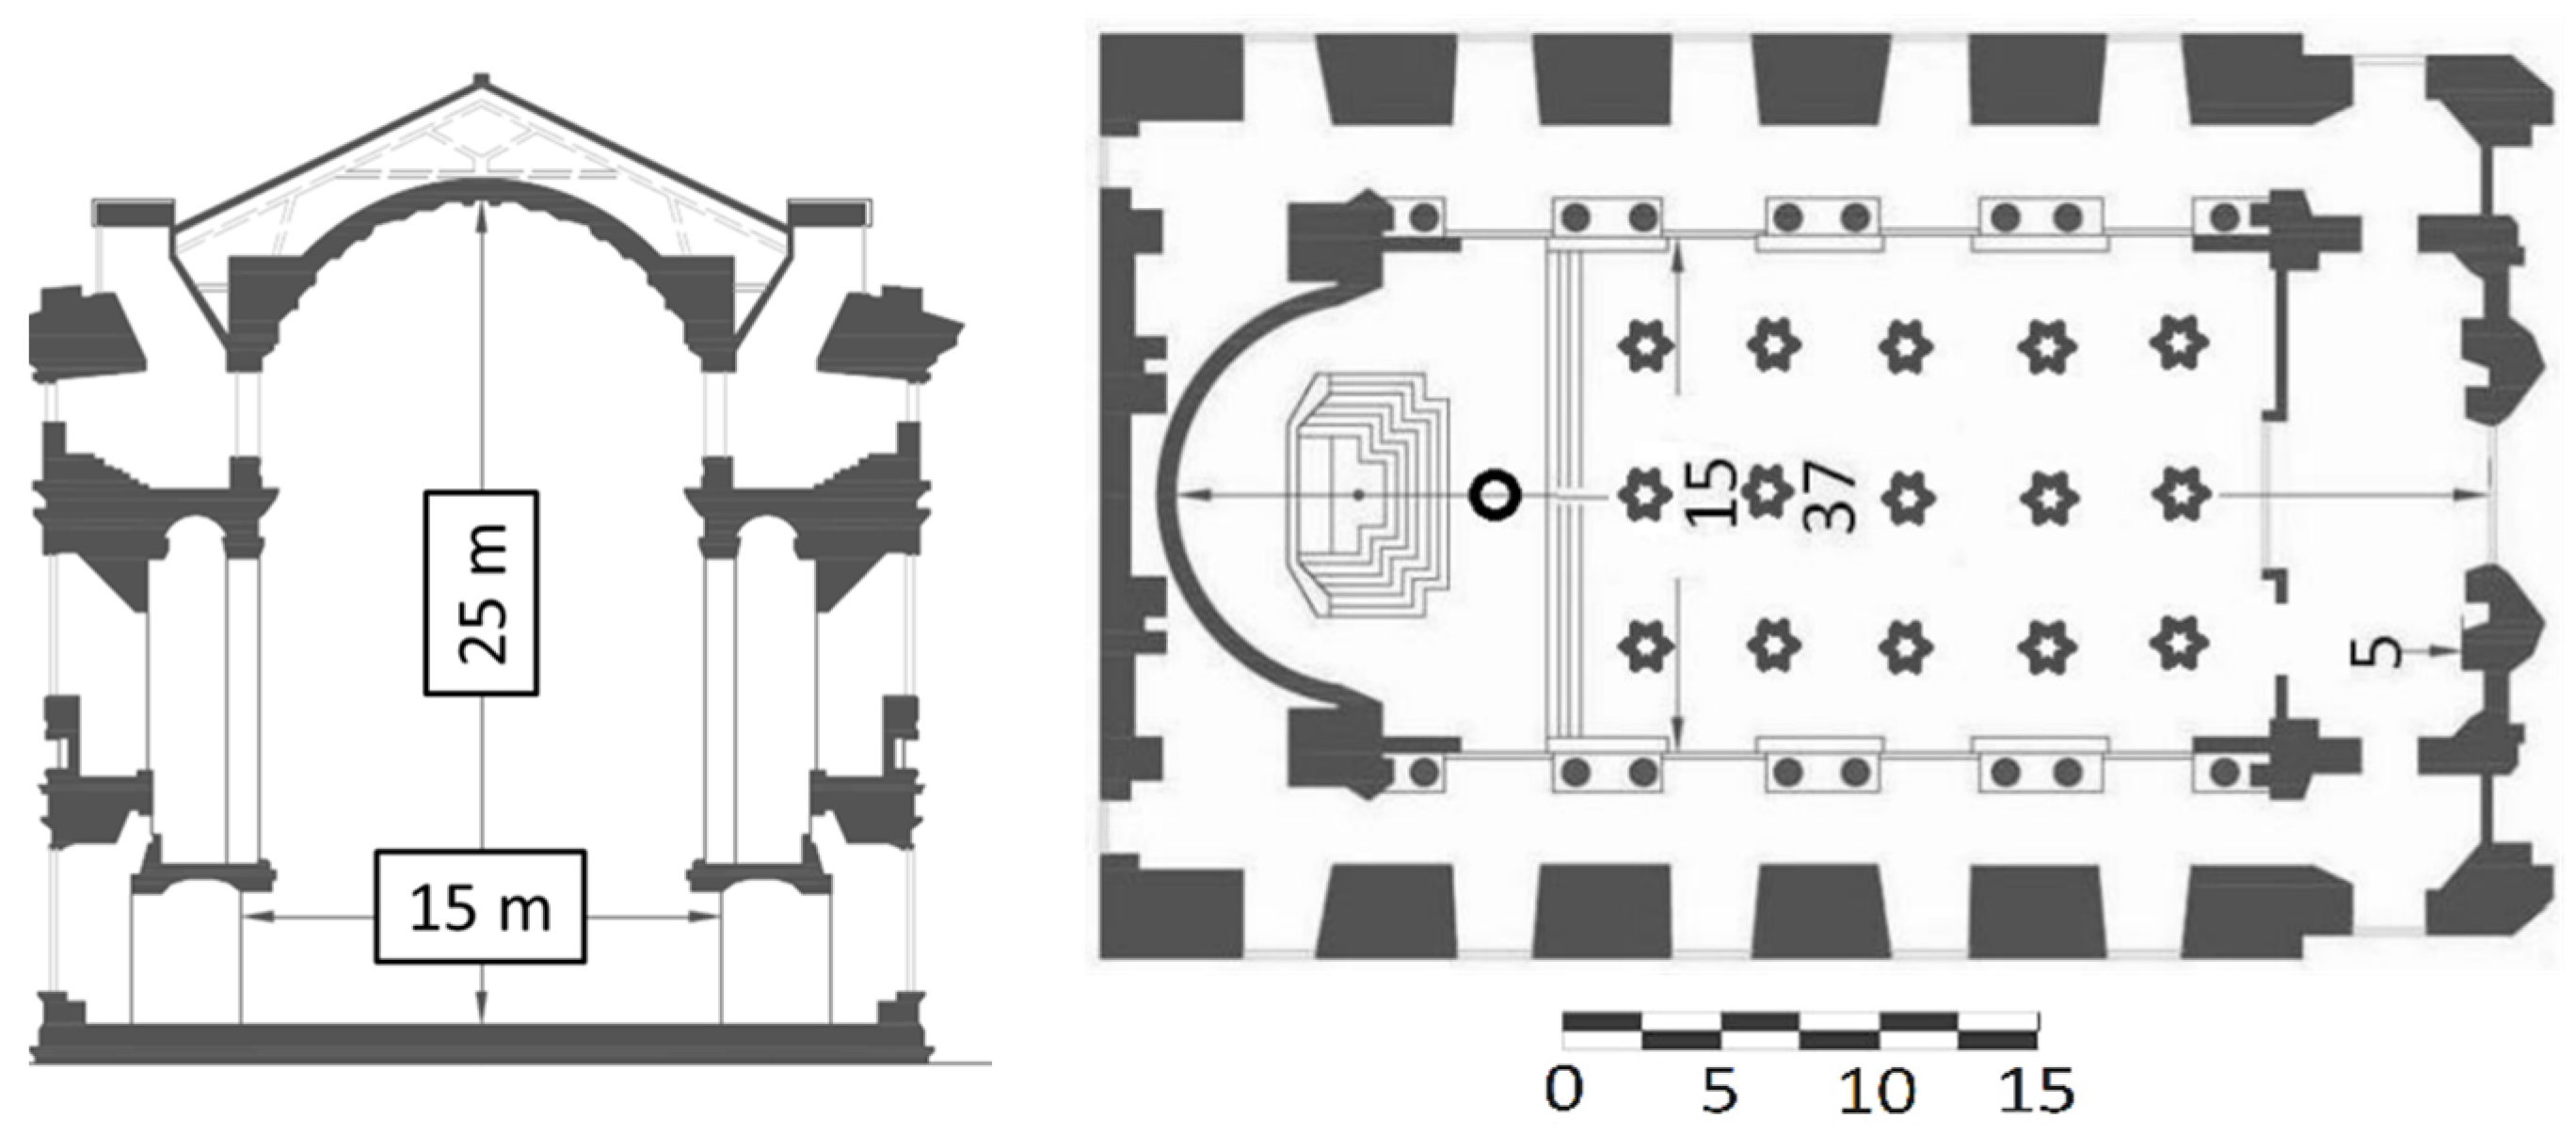
Figure 3 shows the floorplan and a cross section of the Palatine Chapel with its main geometrical dimensions. The total length of the chapel is 37 m, and the transversal width is 15 m, while the vault has a maximum height of 25 m. The inner volume is about 22,860 m
3. It can be seen from
Figure 2 that the chapel has highly decorated sound reflective surfaces. The instances of heritage preservation suggest the use of transparent plastic chairs for audience seating, as seen in
Figure 2, in order to show the aesthetic beauty of the marble floor.
Figure 3.
Cross section and plan of the Palatine Chapel, with location of the sound source (
![Buildings 06 00001 i001]()
) and of the receivers (
![Buildings 06 00001 i002]()
).
Figure 3.
Cross section and plan of the Palatine Chapel, with location of the sound source (
![Buildings 06 00001 i001]()
) and of the receivers (
![Buildings 06 00001 i002]()
).
The present study aims to explore feasible acoustical treatments to obtain better acoustic conditions for the events planned to be held in the chapel. Acoustical treatments had to consider the preservation of the heritage site. The study consisted of both field measurements inside the chapel and computer simulations of different intervention hypothesis with the aid of the software Odeon [
3].
2. Acoustic Survey
2.1. Acoustic Parameters of Analysis
In room acoustics, the reverberation time is the most common parameter and it can be described as the persistence of sound after a source has stopped. In particular, the reverberation time is the time needed to have a reduction of 60 dB in the sound pressure level. In sound diffuse rooms, the reverberation time has the advantage of being steady throughout the space and predictable using simple formulas. However, it requires the capability of creating an energy gain of more than 60 dB over the background noise, before being able to measure the 60 dB sound pressure decay. In this paper, the early decay time (EDT) which is the slope of the best-fit linear regression line of the initial 10 dB, between 0 and −10 dB, of the decay was evaluated as it is often shown to correlate better to the early reverberation effect in the room.
Several acoustic parameters defined in the ISO 3382-1 [
4] were analyzed. These parameters have been defined in order to better describe the perception of a sound field, even though their prediction depends on many factors, such as the relative position of sources and receivers. In particular, this study focused on the values assumed by the center time, the clarity, and the definition.
The center time (Ts) is defined as the time of the center of gravity of the squared impulse response of the sound energy, and it is related to the balance between early sound and delayed sound respect to the Ts value. In reverberant rooms such as churches, where late reflections reach listeners with a long delay, Ts can assume values up to several hundreds of milliseconds. Late sound contributes to have a long reverberation of the room and although it may improve the perception of the music, it is generally detrimental for listening to speeches.
The clarity measures the balance between the useful and detrimental sound for the listening perception. It represents the degree to which different reflections arrives and are perceived by the listener, and it is assessed as an early-to-late arriving sound energy ratio. This ratio can be calculated for either a 50 ms or an 80 ms early time limit, depending on whether it relates to conditions for speech or music respectively. In particular, the C80 is defined as the ratio, expressed in decibels, of the early energy (from 0 to 80 ms) over the late reverberant energy (from 80 ms to infinite).
The definition (D50) considers the early arriving sound energy over the total sound energy and it is calculated using 50 ms as the early time limit.
Finally, the parameter of sound strength (G) was assessed since this is representative of the subjective level of sound, and it is defined as the gain from the sound pressure level, which is produced by the same sound source with the same power level in a free field at a distance of 10 m from the sound source.
In order to establish suggested values of the different monaural acoustic parameters considered in this study different references were used. In this phase, it was important to select the most adequate function for this room. In order to guarantee a certain flexibility in the use, the room was supposed to host public meetings with speech comprehension (talks and receptions are common in this room), but also some baroque chamber music or small orchestra listening. The different requests of the several sound messages required some compromises in the acoustics goals. Using recent studies about the typical listening preference in sacred spaces [
5,
6,
7], the following criteria were finally established:
- -
The early decay time (EDT) should assume values between 1 s, a value adequate for a clearer perception of speeches, and 2.5 s, a value adequate for music listening preference. In churches reverberation time and early decay time values well above 3 s are common and may well fit for example with organ music. However, since this kind of music is not contemplated in the programming of the Palatine chapel anymore, a shorter reverberation was considered necessary;
- -
The center time (Ts) should assume values below 100 ms for a clearer perception of speeches, while it may assume greater values, up to 200 or 250 ms for music listening preference;
- -
The clarity (C80) expressing the balance between the early and late arriving energy, should have an higher value if the goal is to separate the initial sounds from the diffuse ones and making the discrete sounds stand apart from each other. For the purposes of good listening conditions of music, it is generally preferable that C80 should be in the range between −2 dB and 2 dB, while it is expected to be above 2 dB if speech perception is a priority;
- -
The definition (D50) which may assume values from 0 to 1, should be above 0.50 for a good speech comprehension.
Obviously, the preferred values for the different parameters refer to fully occupied conditions so in a room such as the Palatine chapel, were the audience would represent the main sound absorbing surfaces, it is important to analyze the effect of the presence of the audience.
2.2. Acoustic Measurements
The sound source used to perform acoustic measurements consisted of a dodecahedron loudspeaker Peeker Sound JA12 (Peeker Sound Corportation, Reggio Emilia, Italy). MLS signals of order 16 with a length of 5 s were generated by a 01 dB Symphonie system. The sound pressure was recorded with a ½″ microphone GRAS 40 connected with a preamplifier 01 dB PRE 12 H. The floor plan in
Figure 3 shows the location of the sound source and of the fifteen receivers. The sound source was placed at the height of 1.5 m over the floor at the center of the area in front of the altar where musicians are usually located during concerts. The measurement microphone was placed at the height of 1.5 m over the floor too. Measurements were done both in the empty conditions of the chapel or with transparent chairs that are generally used (
Figure 2).
The recorded impulse responses were then elaborated with the software Dirac 4.0 [
5], and several acoustic parameters defined in the ISO 3382-1 [
4], such as the early decay time (EDT), the center time (T
s), the clarity (C
80), and the definition (D
50) were analyzed.
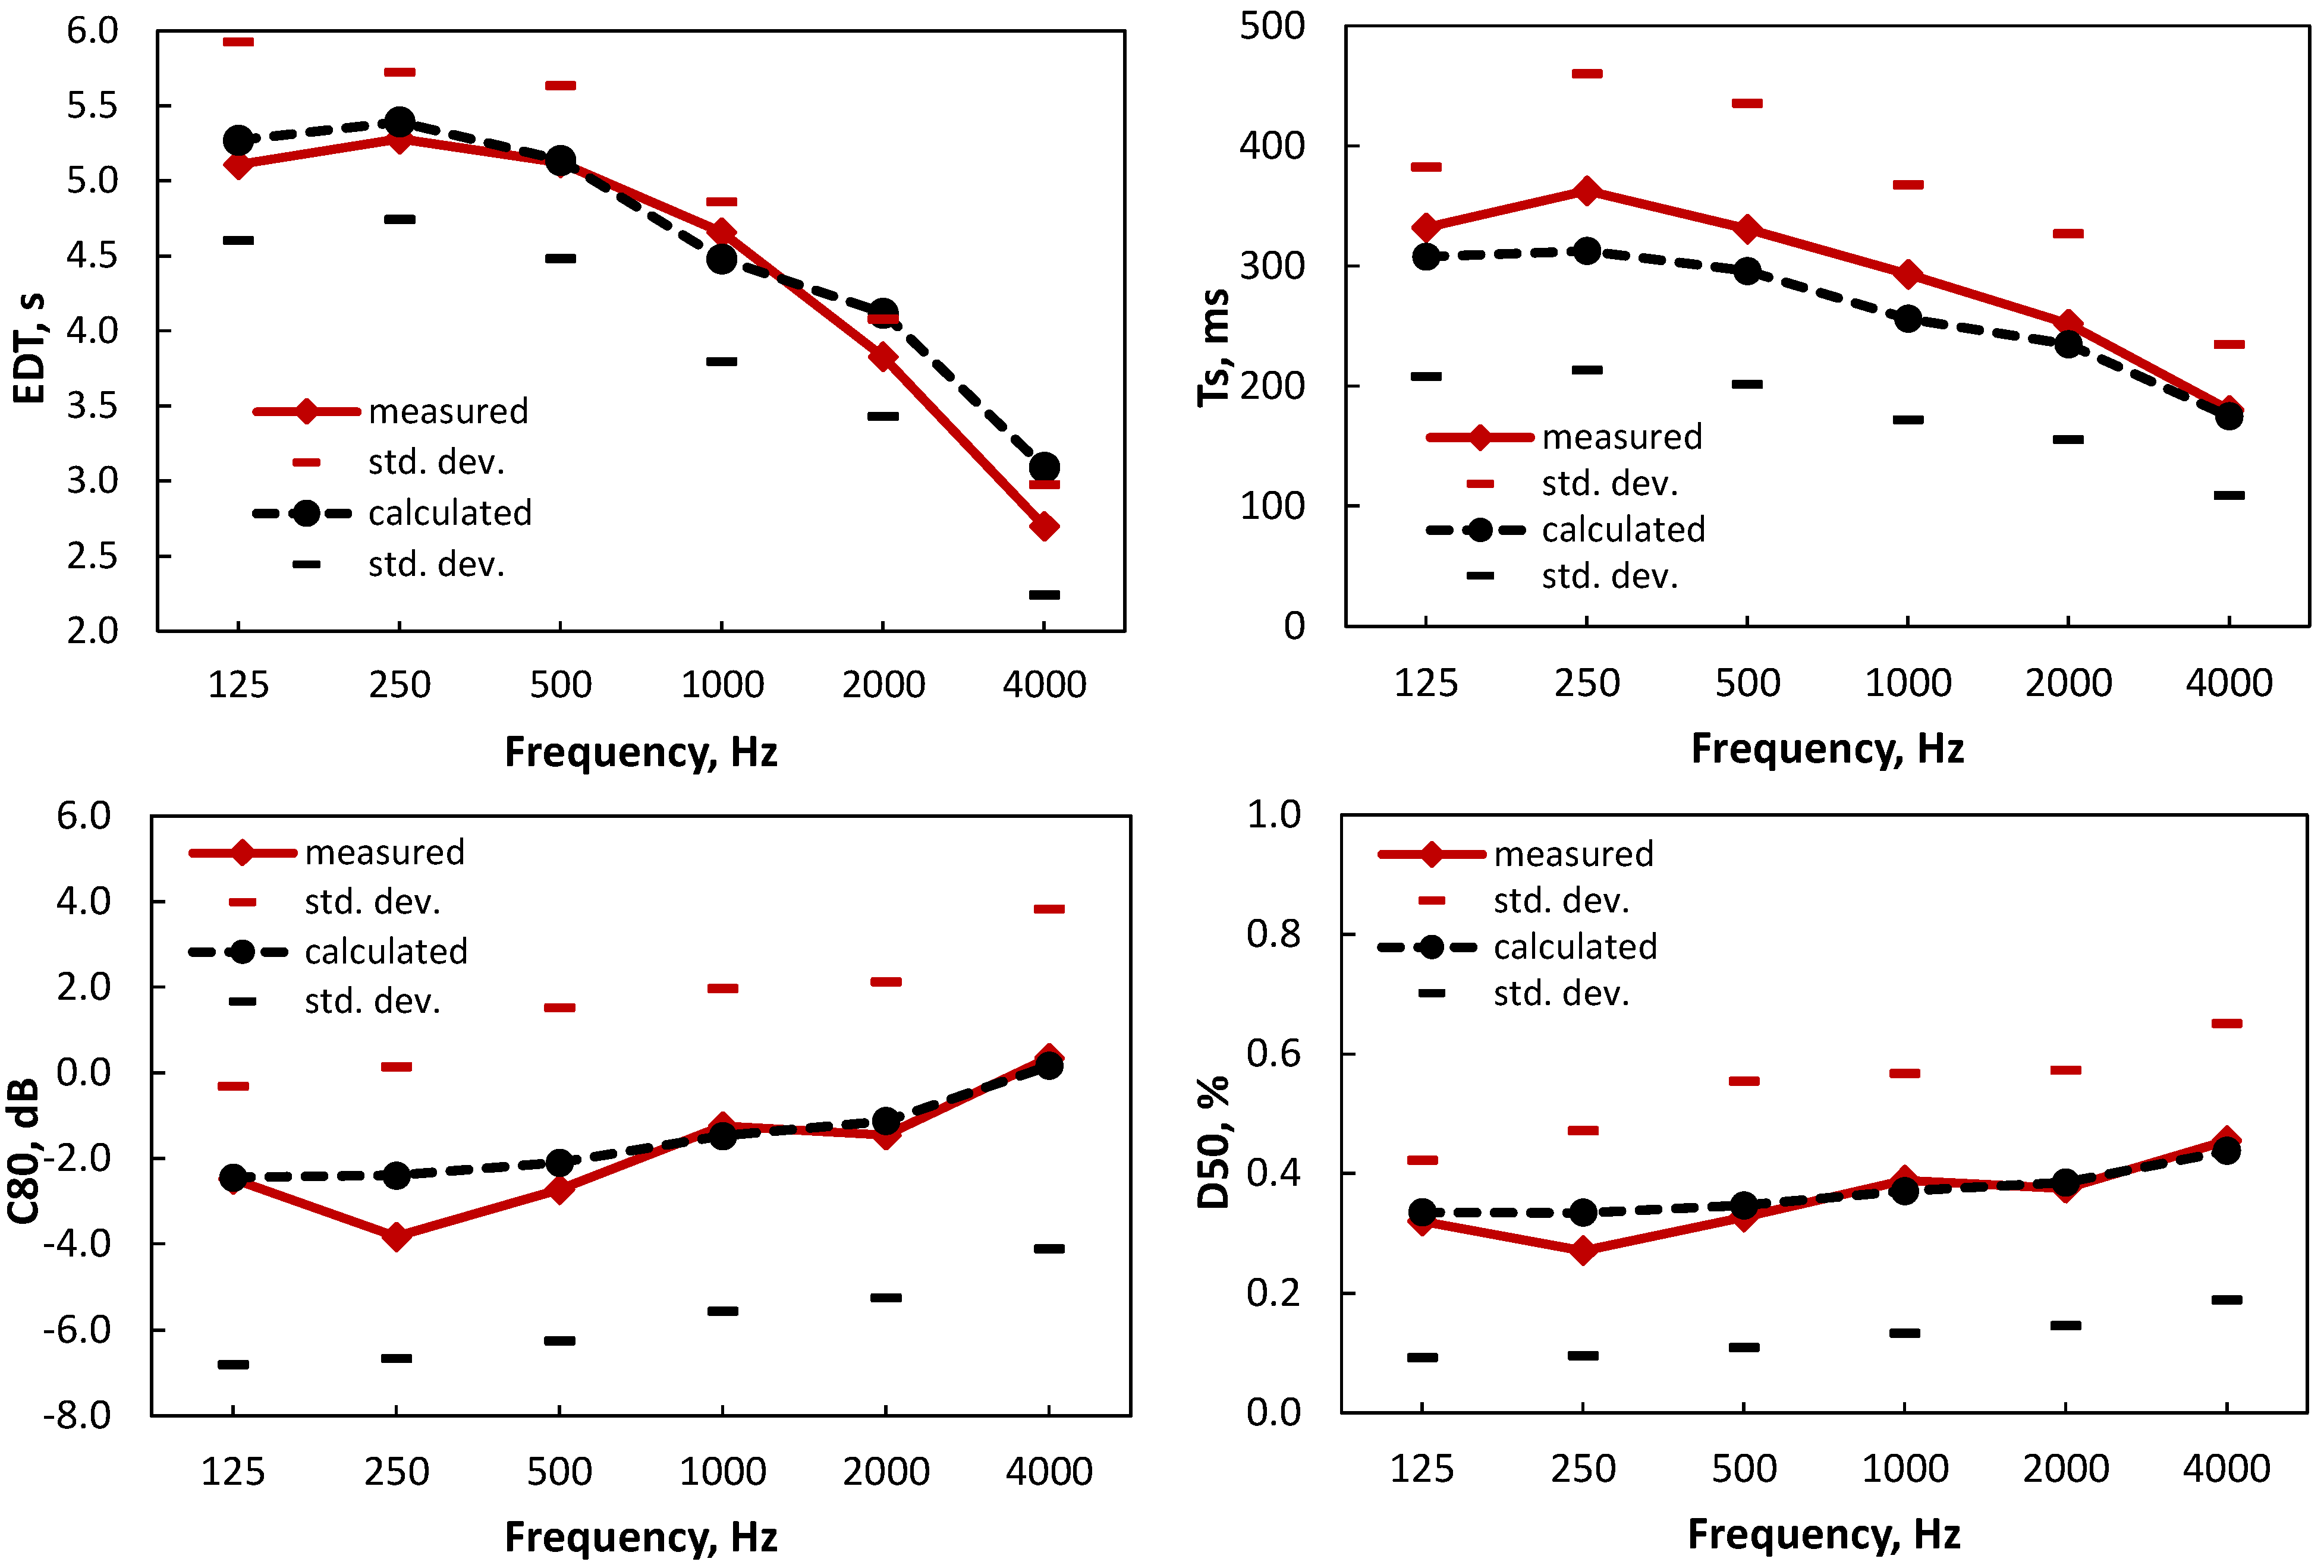
Figure 4 reports the measured values of EDT, T
s, C
80, and D
50, averaged among the fifteen receiver locations together with the intervals of the standard deviation for each octave band from 125 Hz to 4 kHz. All the measurements were done in unoccupied conditions. Obviously, the audience would have had an absorbing effect with a consequent reduction of the reverberation and hence of the EDT and T
s. However, the results of the measurements suggested that the hall in the observed state is clearly over reverberant and it is not well suited neither for chamber music nor for the intelligibility of speech. This led to study the possibility to introduce in this room some acoustic treatments.
Acoustic measurements with the presence of chairs were also realized using the same measurement equipment and setup described previously. The measurement with the chairs showed no significant difference in the reverberation parameter (EDT), while other parameters, such as C80 or Ts had more remarkable difference within the room. In fact, the sound scattering realized by the chairs reduced the clarity while increased the center time.
Figure 4.
Comparison between measured and simulated results averaged among the 15 receiver positions of four room acoustic parameters, EDT, Ts, C80, and D50, and their standard deviations.
Figure 4.
Comparison between measured and simulated results averaged among the 15 receiver positions of four room acoustic parameters, EDT, Ts, C80, and D50, and their standard deviations.
4. Acoustic Treatments
Historic buildings, such as the Palatine Chapel, are heritage buildings whose cultural value prevents invasive or irreversible interventions. In this case, given the completely marbled nature of all the surfaces, permanent acoustic treatments to the room surfaces were not allowed. The need to create acoustic conditions closer to the actual needs led to evaluate removable elements that could be mounted and dismounted easily for specific events. Among the different acoustic treatment options, it was considered the possibility to adopt transparent vibrating banners, eventually micro-perforated, as well as heavy curtains.
Vibrating panels and perforated (or micro-perforated) ones once mounted at a given distance from a back rigid wall provide significant absorption at low frequencies. According to the theory, the largest absorption of vibrating panels occur for a distance from the rear wall of a quarter of the wavelength [
21]. Micro-perforation in glazing or polycarbonate transparent panels were considered as a solution to get an absorber with a minimal visual presence. These panels being micro-perforated (with holes as small as 0.1 mm) behave as Helmholtz devices, but without the normal resistive material. The holes are drilled mechanically and provide absorption through high viscous losses as air passes through the holes. Micro-perforated transparent absorbers have reached an increasing attention since they are transparent when looked at from straight on, although at oblique angles the holes become more apparent although the surface is still translucent [
21]. Panels with holes dimeters ranging between 0.1 and 0.2 mm and with a percentage of holes in the range between 8% and 10% of the surface were considered. Panels with a surface density of 0.48 kg/m
2 and a thickness of 1.41 mm were then selected.
Another category of acoustics treatments that was considered is that of heavy textile materials. The absorption of these surfaces have received increasing attention in room acoustics application [
22]. Add curtains sustained by rigid frame next to the base of the lateral walls could guarantee high absorption especially at high frequency. Moreover, if the curtains were mounted at a given distance from the back wall, the sound absorption would also be higher at lower frequencies, as a consequence of the smaller impedance of the sound wave far from the wall.
Obviously, the specific effect of the absorption of curtains would depend on their distance from the back walls, but the typical drapes of curtains determine a significant variation of their distance from the rigid backing walls. This means that an exact determination of the sound absorption could not be defined. In order to simulate the effects of curtains, the literature values reported by Cox and D’Antonio for heavy curtains with a density of 610 g/m
2 were used [
22].
The absorption coefficient values of the different acoustic treatments considered for the acoustic intervention are reported in
Table 2. Overall, the acoustic treatments consisted of 250 square meter panels, mainly distributed along the lateral walls each one with a height of 3.5 m from the floor (
Figure 6). The treatments were considered as temporary elements to display in the room in occasion of specific events. In particular, the transparent vibrating panels, absorbing the low frequency could guarantee a more tonal balanced acoustics of the room, which would be highly beneficial for speech listening; reversely, the introduction of heavy curtains would represent an elegant way to reduce the reverberation of the room, although their acoustic effect would be more appreciable at higher frequencies.
Table 2.
Absorption coefficient of the acoustic treatments proposed in the Palatine chapel.
Table 2.
Absorption coefficient of the acoustic treatments proposed in the Palatine chapel.
| Acoustic Treatment | Frequency (Hz) |
|---|
| 125 | 250 | 500 | 1000 | 2000 | 4000 |
|---|
| Transparent micro-perforated panel | 0.15 | 0.70 | 0.40 | 0.30 | 0.20 | 0.15 |
| Heavy curtain banner | 0.10 | 0.20 | 0.40 | 0.50 | 0.60 | 0.70 |
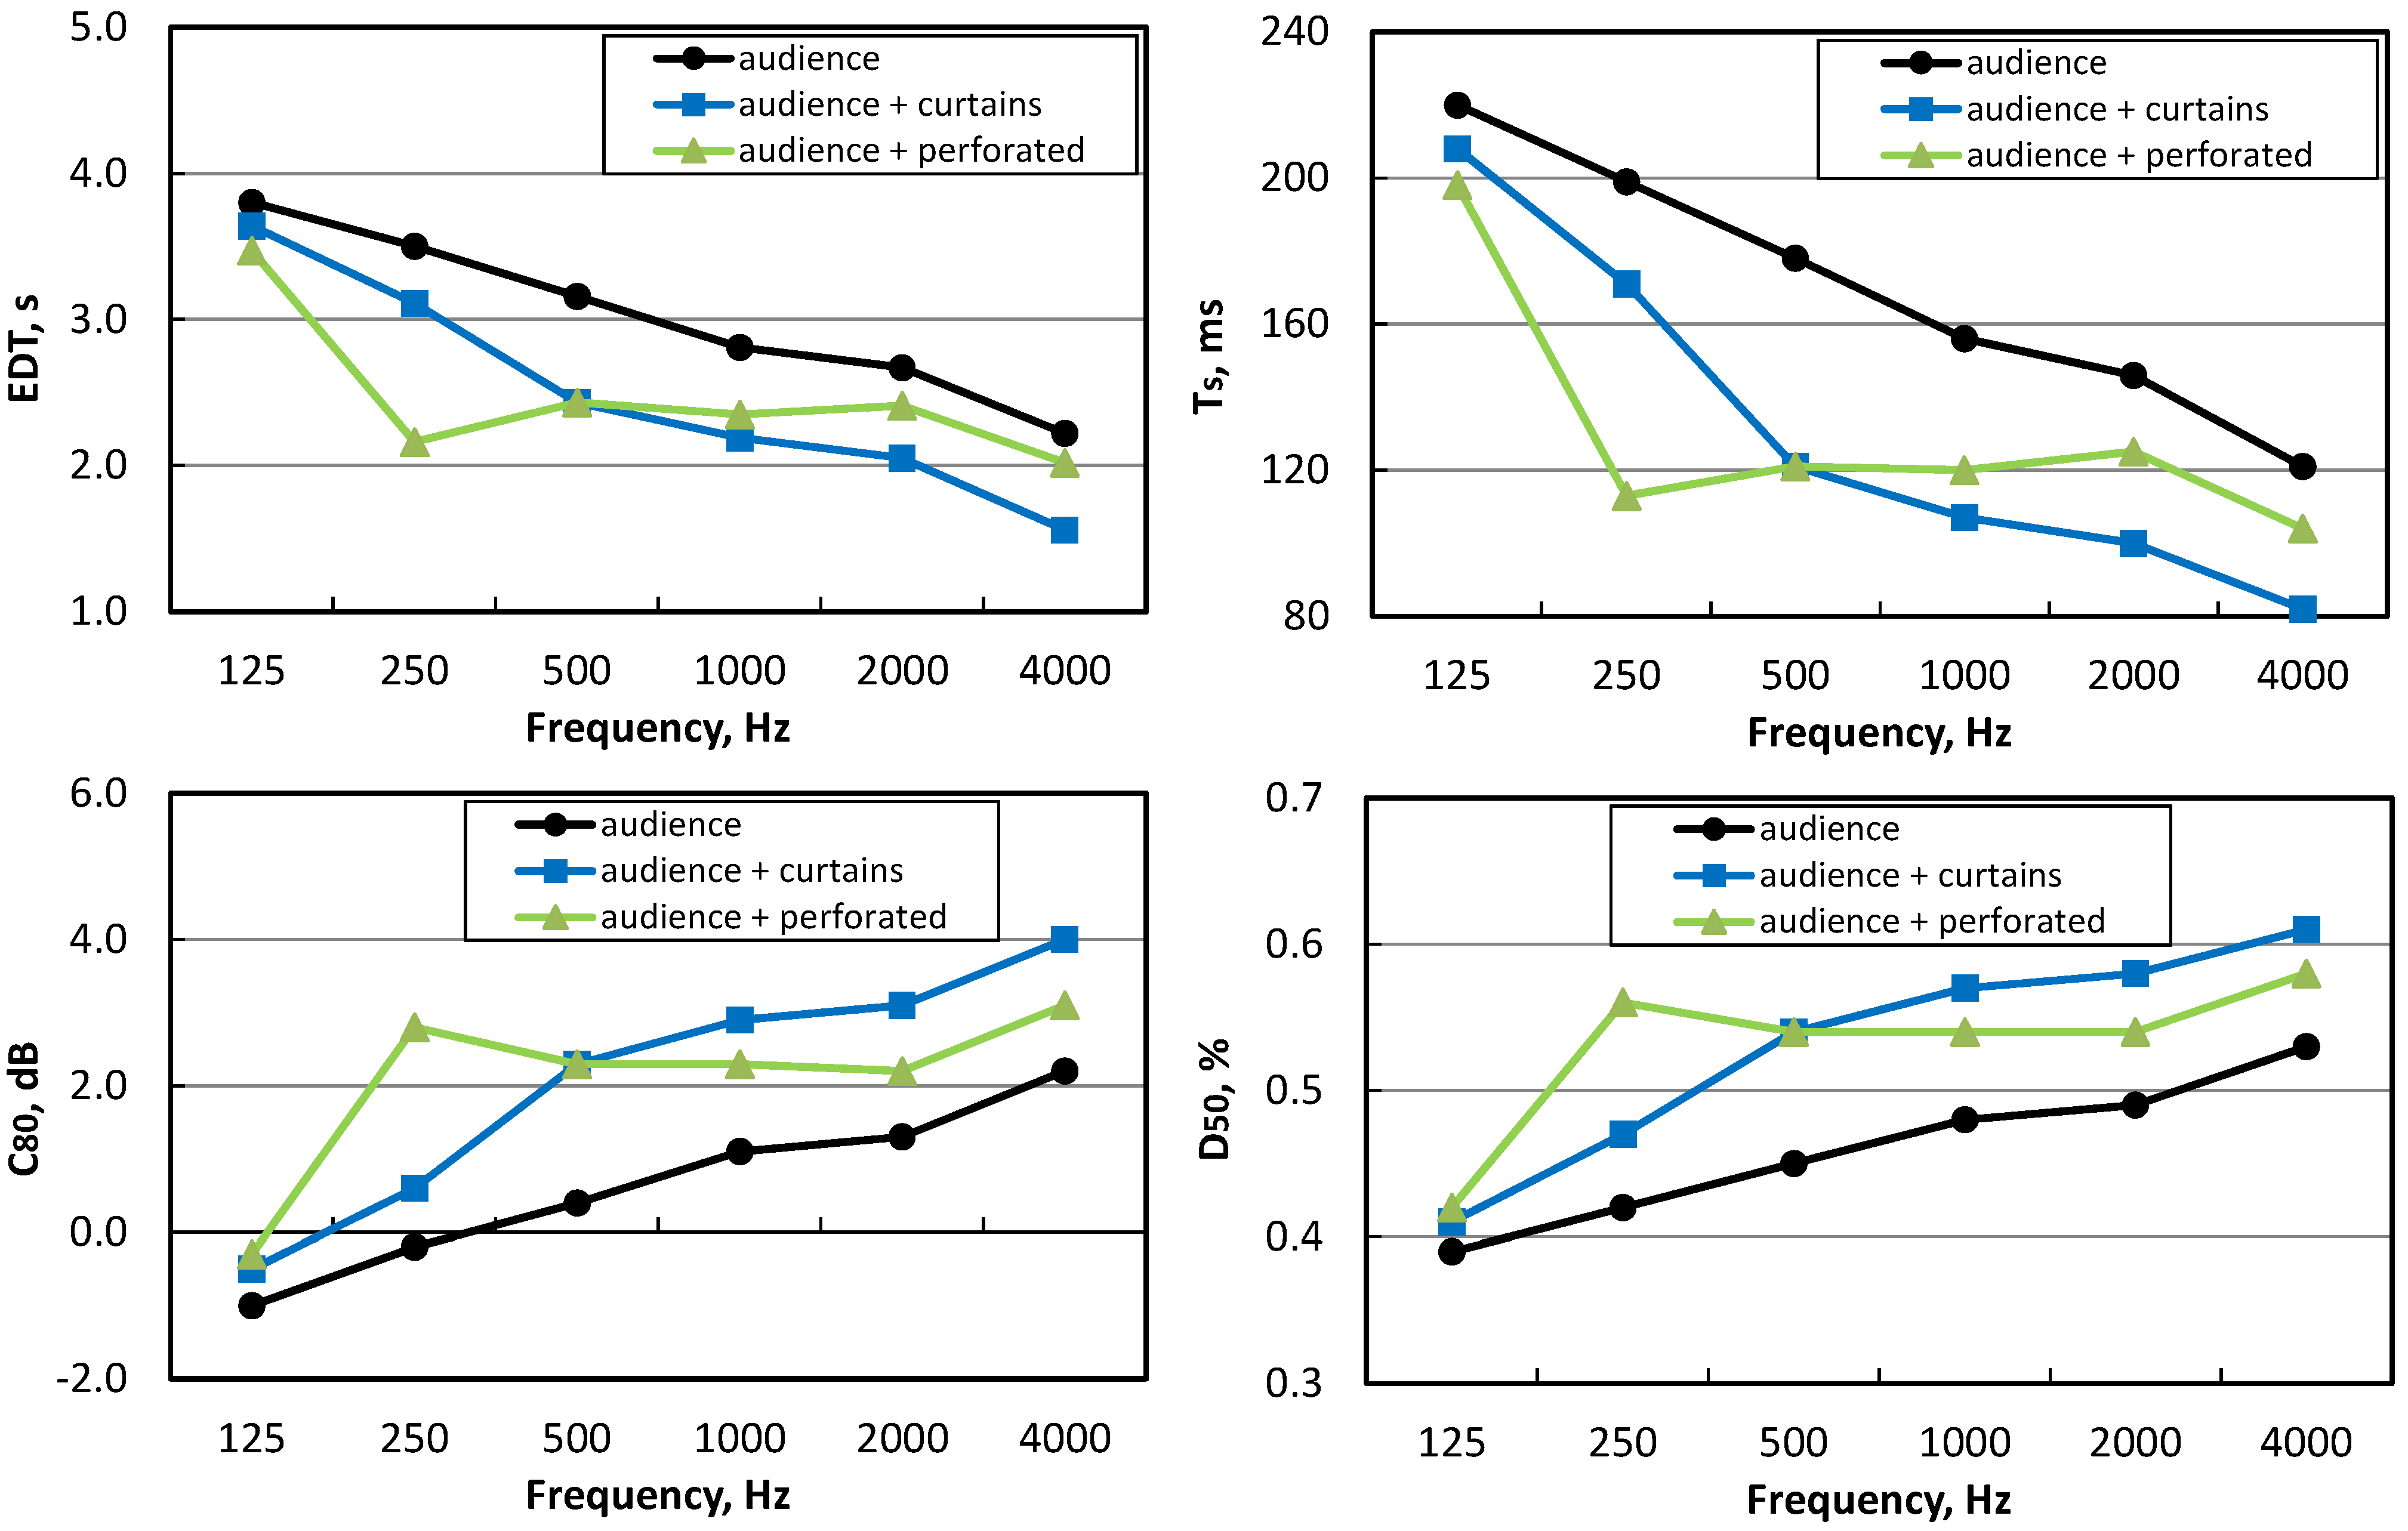
Figure 7 shows the acoustic parameters of the fully occupied room and the effects of the addition of banners placed on the side walls and in the apse. It can be noticed that the chapel still remains with an excess of reverberation showing the typical behavior of large churches influenced by air absorption at high frequencies [
23]. Overall, the simulated values showed that the investigated room with the proposed acoustic corrections has acoustical properties that could be considered adequate for musical performance.
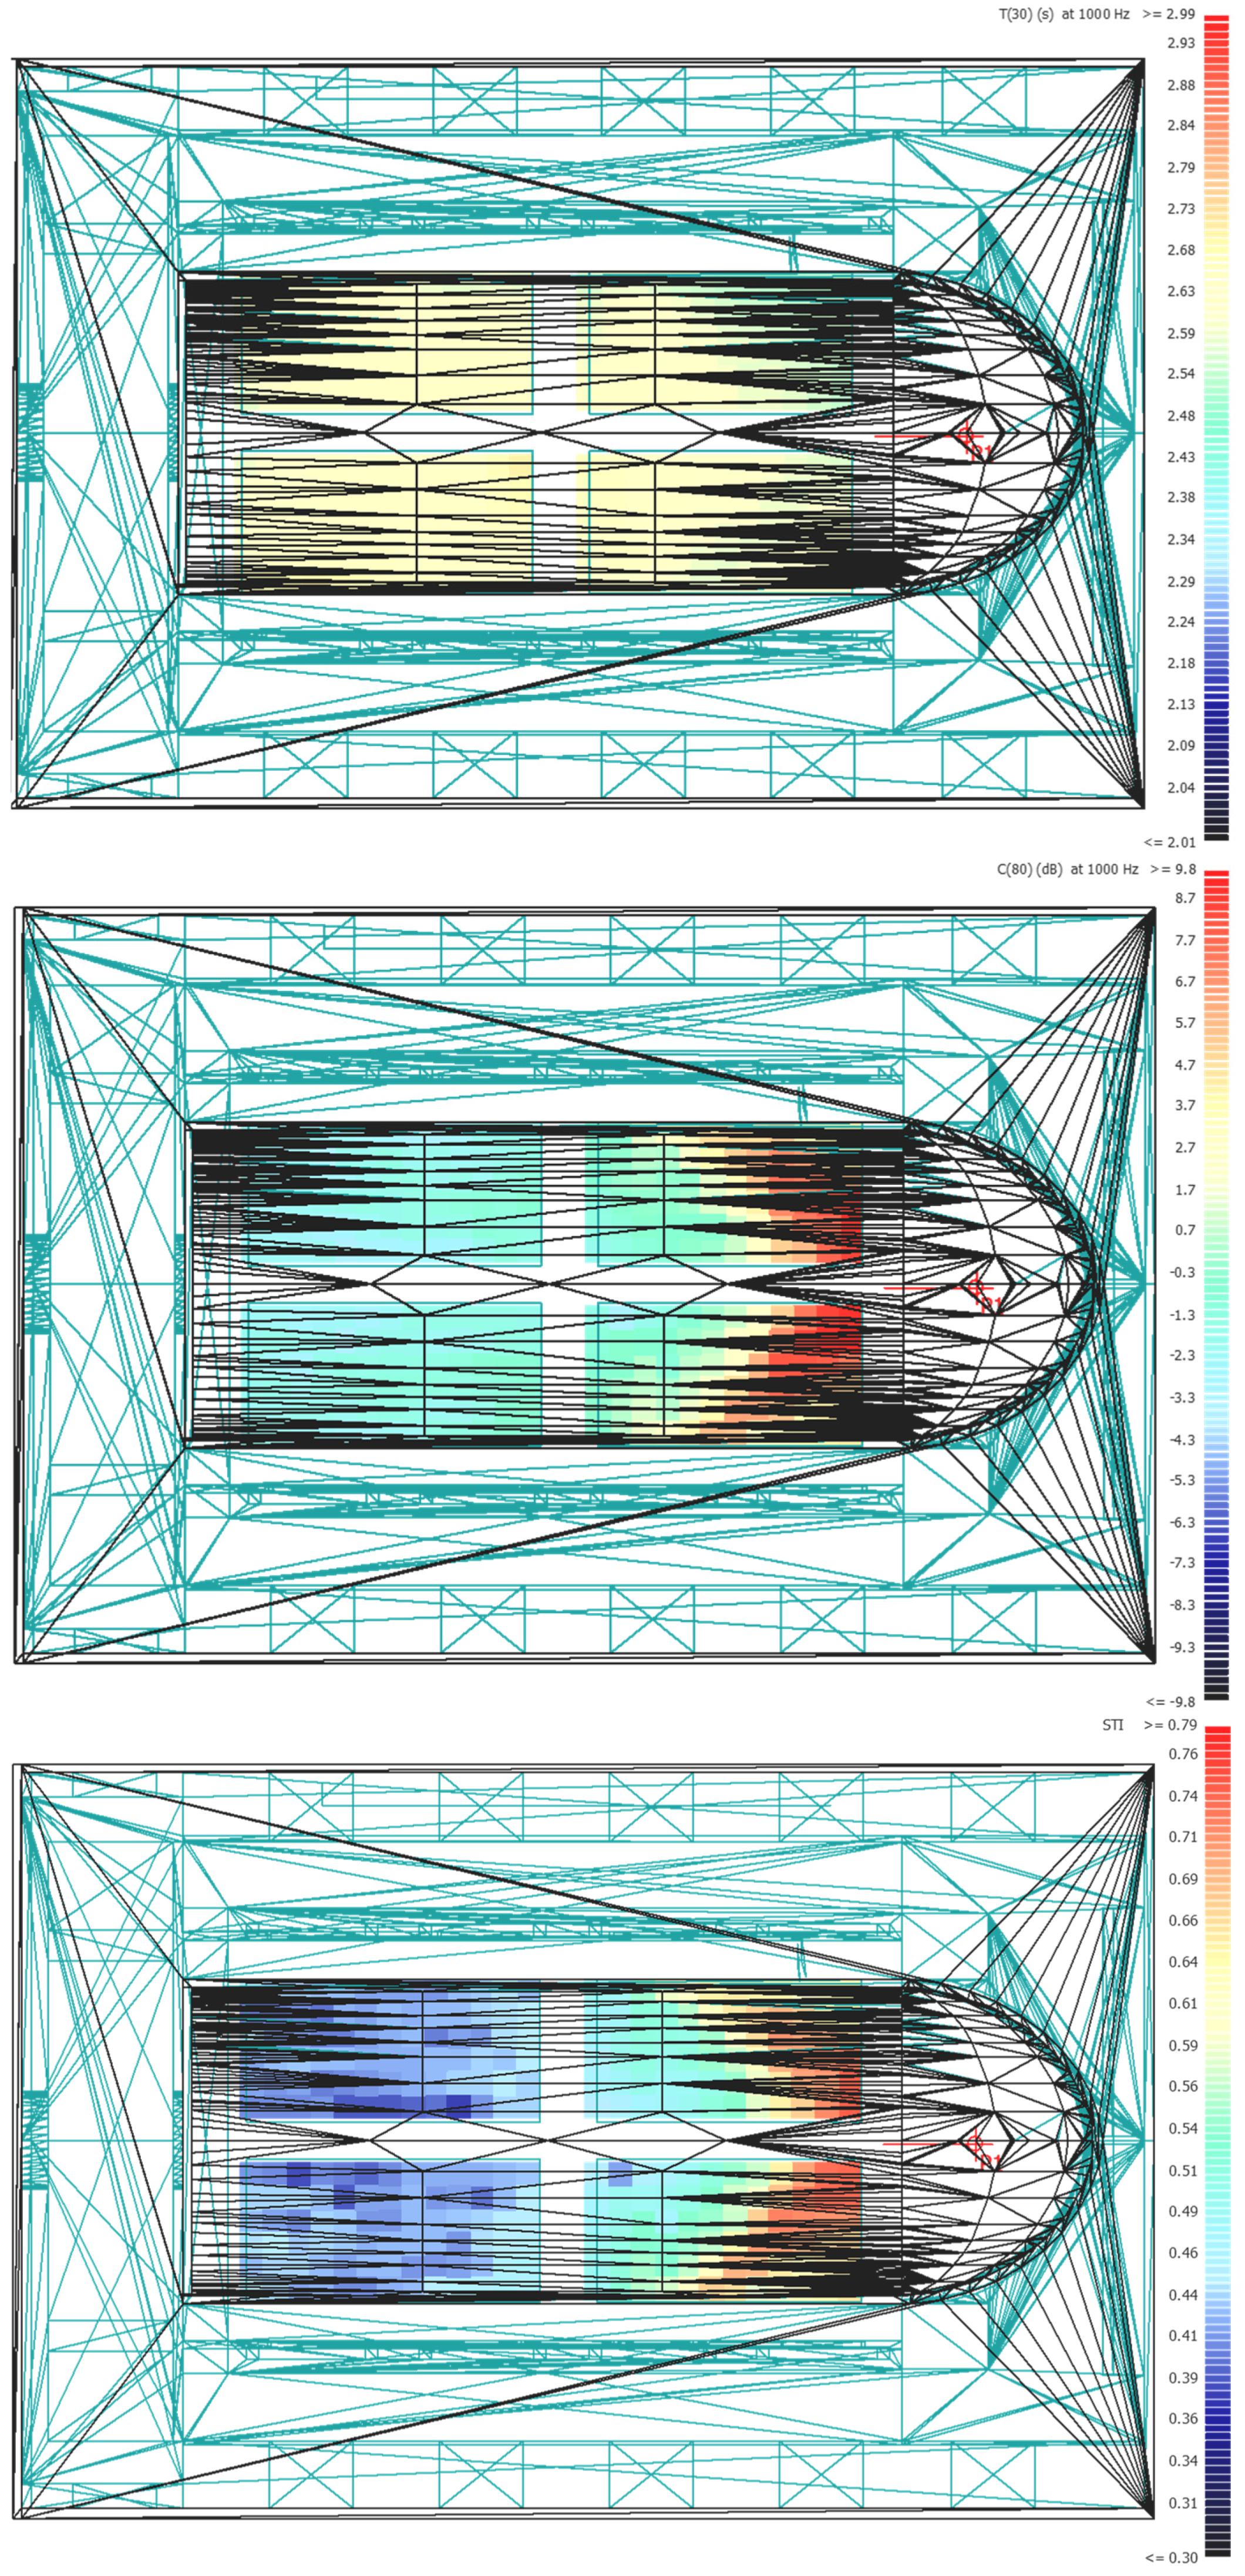
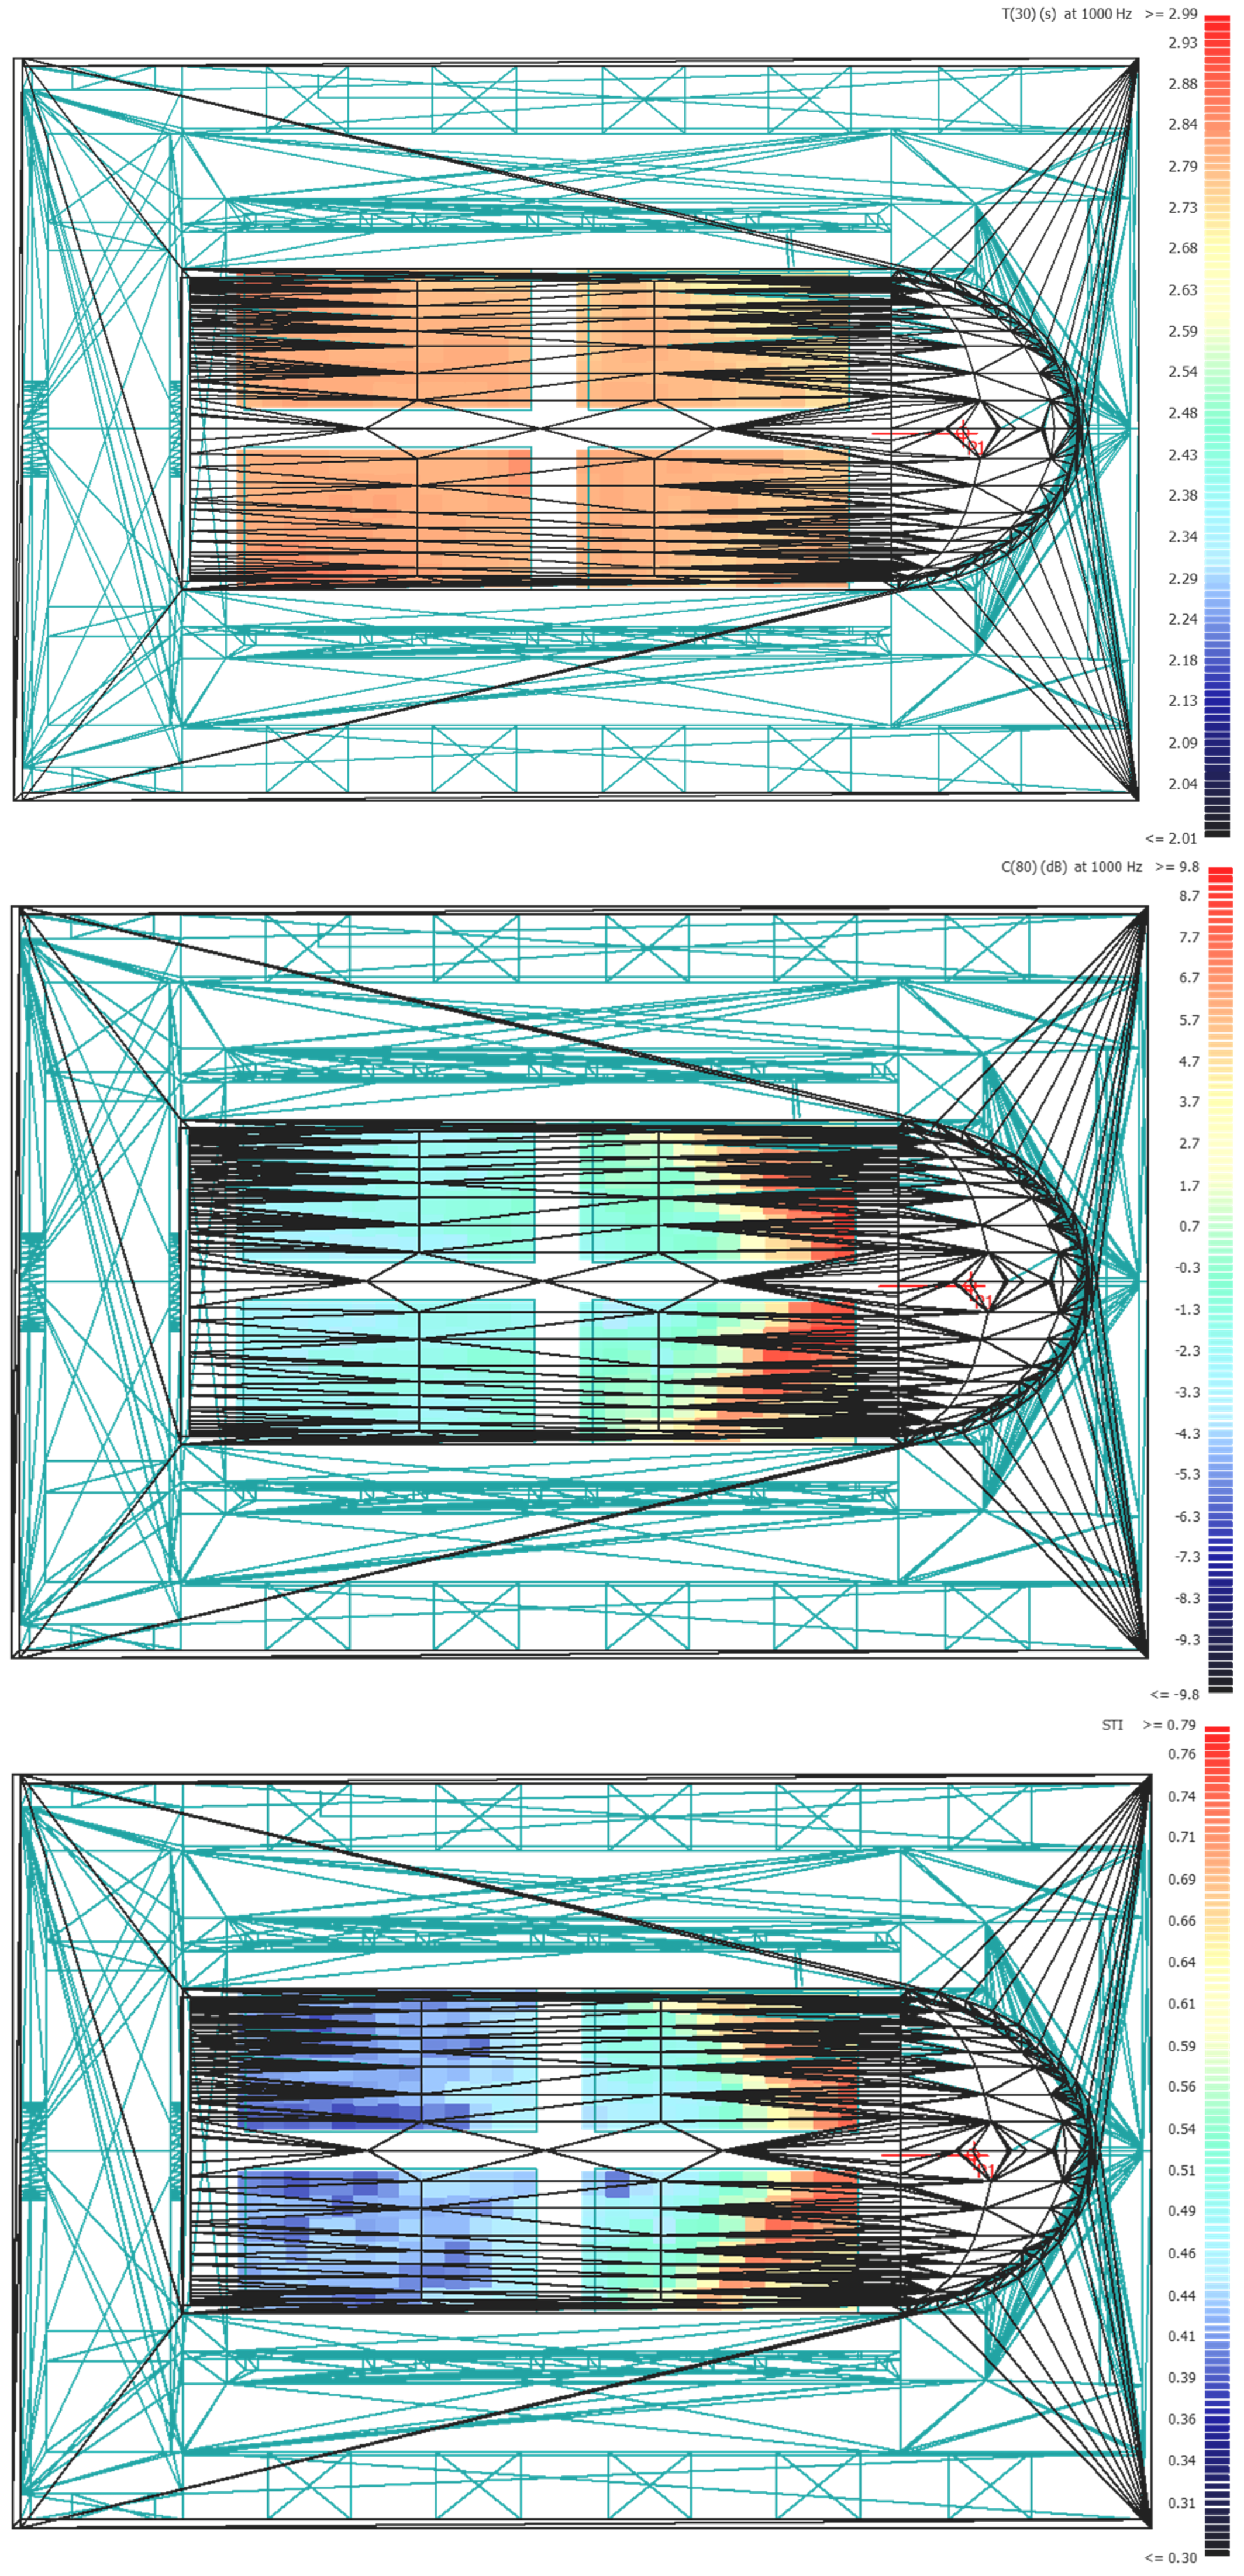
Figure 8 and
Figure 9 report the color maps at 1 kHz of the T
30, C
80, and STI in the configuration with the audience and with the heavy curtains and vibrating transparent micro-perforated panels respectively. The figures show that the homogeneity of the sound field through the room also with the introduction of sound absorbing treatments along the two sides. At middle frequencies, the area where the audience seats would have a reverberation time equal to 2.6 s with the treatments of the heavy curtain banners and to 2.8 s with the vibrating micro-perforated panels (
Figure 7).
The clarity reduces with the distance from the sound source, showing a remarkable behavior from values up to 8 dB closer to the sound source to values between −2 dB and ±2 dB in the rest of the chapel, both with the heavy curtains as well as with the vibrating panels.
Finally, in order to assess the possibility to use this room for meetings, which involve speech listening, the Speech Transmission Index (STI) was considered. This parameter represents the degree of amplitude modulation in a speech signal and refers to the distortion in speech signals caused by reverberation, echoes, and background noise. This index can assume values between 0 and 1, being greater than 0.5 for favorable speech conditions.
Results in
Figure 8 and
Figure 9 show that the STI would be acceptable in the first half of the audience area, while the area farther from the sound source (simulated in the apse) would have a STI value around 0.45. Such a value generally corresponds to a “poor” speech listening condition. However, it should be stated that these results were obtained with an omnidirectional sound source. This means that a sound reinforcement system consisting of directive loudspeakers should be used for a better speech listening in order to have improved STI values even in the back of the Chapel if this has to host events were highly speech intelligibility is required.
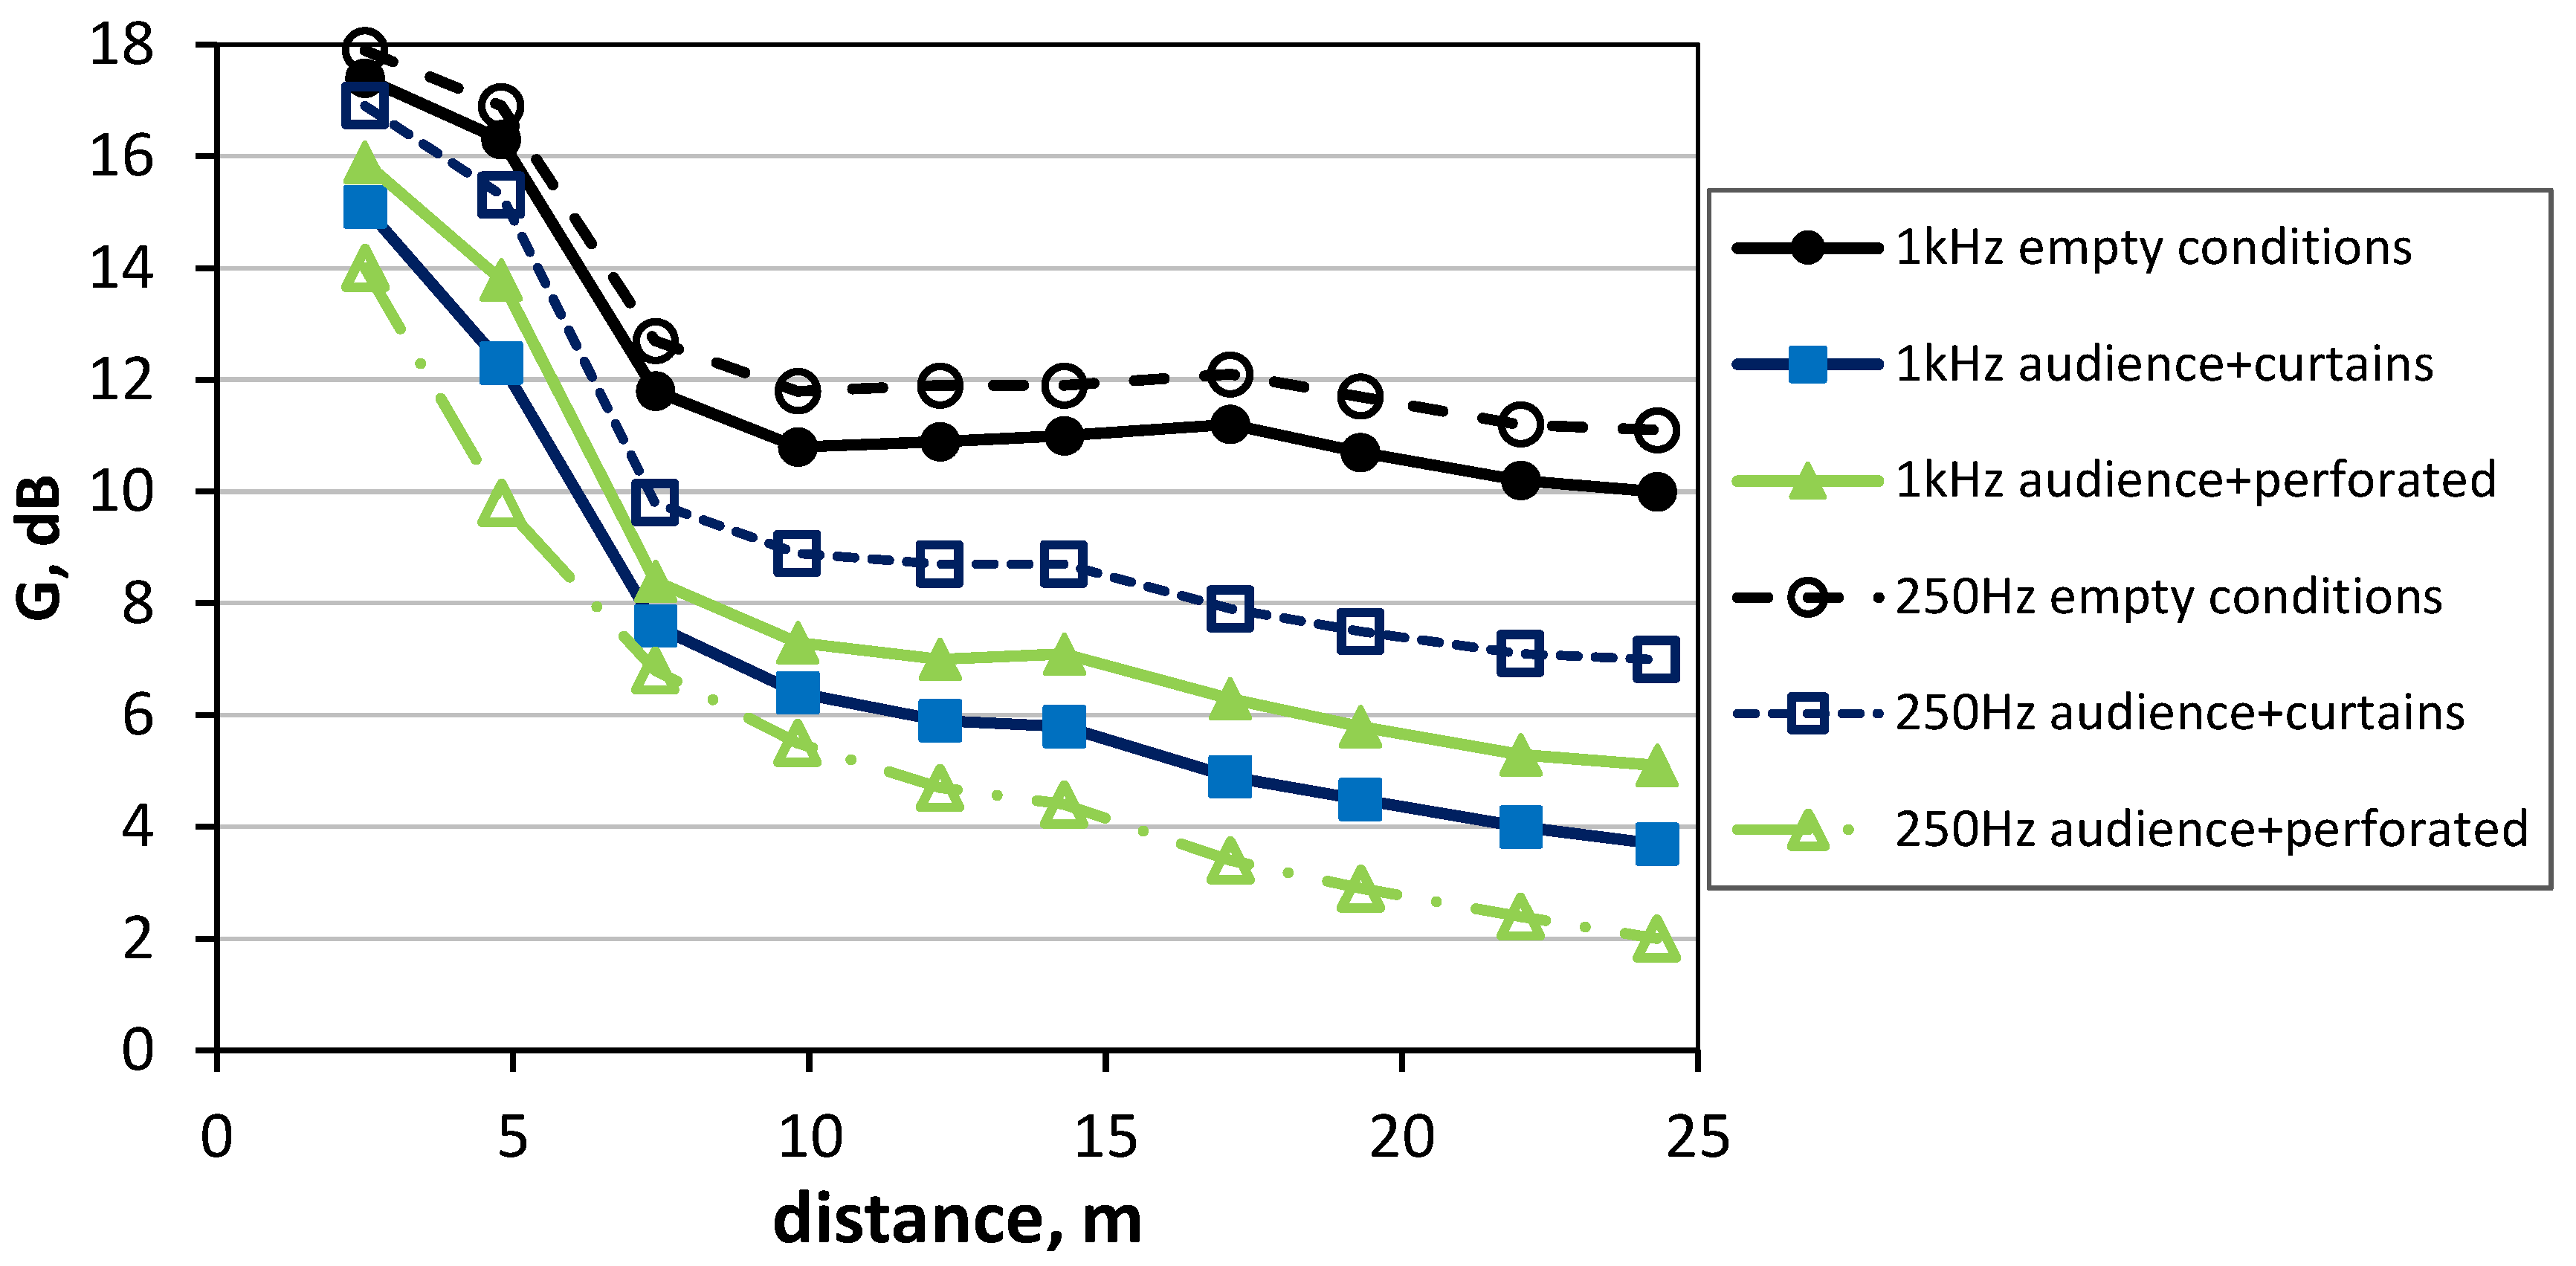
A final evaluation of the acoustic interventions presented in this paper regarded the impact of the sound absorption materials over the sound strength. The sound strength was evaluated along the central axes of the Royal Chapel room both at 250 Hz and 1 kHz (
Figure 10). The choice to check the sound absorption at both low and middle frequencies was due to the highly absorptive behavior of the vibrating panels at low frequencies. In fact, although the acoustics intervention with micro perforated vibrating panels aimed to absorb the low frequencies and hence to reduce the frequency unbalanced response of the rom, it was considered important to control the overall sound strength levels.
Figure 8.
Color maps at 1 kHz of the T30, C80, and STI in the configuration with the audience and the acoustic treatments heavy curtain banners (the maps only cover the area where the audience seats).
Figure 8.
Color maps at 1 kHz of the T30, C80, and STI in the configuration with the audience and the acoustic treatments heavy curtain banners (the maps only cover the area where the audience seats).
Figure 9.
Color maps at 1 kHz of the T30, C80, and STI in the configuration with the audience and the perforated transparent banners (the maps only cover the area where the audience seats).
Figure 9.
Color maps at 1 kHz of the T30, C80, and STI in the configuration with the audience and the perforated transparent banners (the maps only cover the area where the audience seats).
Figure 10.
Sound strength (G) at the frequency of 250 Hz and 1 kHz in different configurations.
Figure 10.
Sound strength (G) at the frequency of 250 Hz and 1 kHz in different configurations.
The sound strength (G) was simulated in different scenarios: in the actual condition, with and without the audience, and after the introduction of the acoustic treatments of the banners. As expected, in the empty condition of the hall, the parameter G has higher values than when the audience and the acoustic treatments are introduced. In particular, in the room before the introduction of the acoustic treatments, the G decreases almost linearly closer to the sound source, while at a larger distance the sound field becomes diffuse and the G assumes more stable values. Reversely, after the introduction of the acoustics treatments the sound field does not become diffuse quickly, while the sound strength reduces with the distance from the sound source.


 ) and of the receivers (
  ).
).

