Article

Multi-Dimensional Urban Waterfront Landscape Attributes and Recreational Vitality: Correlations and Strategies Based on the Beijing-Hangzhou Grand Canal


1
School of Spatial Planning and Design, Hangzhou City University, Hangzhou 310015, China
2
School of Art and Archaeology, Hangzhou City University, Hangzhou 310015, China
*
Author to whom correspondence should be addressed.
Buildings 2026, 16(9), 1774; https://doi.org/10.3390/buildings16091774
Submission received: 21 March 2026 / Revised: 22 April 2026 / Accepted: 27 April 2026 / Published: 29 April 2026
(This article belongs to the Special Issue Data-Driven Intelligence for Sustainable Urban Renewal)

Abstract

Recreational vitality is widely recognized as a core metric for assessing the quality of human settlements. Elucidating the relationship between recreational vitality and landscape characteristics is crucial for guiding the optimization and quality enhancement of urban waterfront spaces. This study takes the micro-scale waterfront space of the Beijing–Hangzhou Grand Canal (Hangzhou section) as its research object, systematically analyzes the correlation between waterfront landscape attributes and recreational vitality, and formulates specific optimization strategies for enhancing recreational vitality. A total of 310 representative sampling sites was established. The study integrates machine learning-driven semantic image segmentation to achieve refined quantification of waterfront landscape metrics and employs anonymized mobile phone signaling data to dynamically characterize the spatiotemporal distribution of recreational vitality. Through correlation analysis and regression modeling, it quantifies the effect size and functional mechanisms of key landscape metrics on recreational vitality, and further proposes adaptive strategies for recreational vitality enhancement tailored to different urban functional zones. The key findings are as follows: (1) Recreational vitality is significantly higher on holidays than on workdays. High-vitality areas are concentrated in commercial functional zones, with an overall spatial gradient of “low in the east and high in the west, low in the north and high in the south”. (2) High-level Green View Factor (HGVF) shows a stable positive correlation with vitality, whereas the Sky View Factor (SVF) and the Enclosure Interface View Factor (EIVF) correlate negatively. (3) The influence of landscape metrics is strongly moderated by functional zone type: in residential functional zones, HGVF has strong explanatory power; in commercial functional zones, it shows complex nonlinearity; in ecological conservation zones, its explanatory power is generally weaker. (4) Tailored enhancement strategies are proposed for each functional zone. This study clarifies the link between core waterfront landscape attributes and micro-scale recreational vitality, and provides a scientific basis for evidence-based design and sustainable enhancement of urban waterfront spaces.

1. Introduction

Recreational vitality acts as a core indicator for assessing human settlement quality, and directly reflects the capacity of urban spaces to attract public participation and promote social interaction. Amid worldwide urban stock renewal and high-quality urban development, enhancing recreational vitality in public spaces has become a pivotal strategy for optimizing urban functions and improving residents’ sense of gain and subjective well-being [1]. As linear public corridors integrating ecological, cultural, and social values, urban waterfront spaces serve as an irreplaceable role in boosting the overall vitality of urban systems. Nowadays, urban waterfront spaces are commonly faced with prominent challenges globally, including uneven spatiotemporal distribution of recreational vitality, inadequate spatial design quality, and sustained low spatial utilization efficiency. Against the context of urban transformation, identifying and regulating key landscape characteristics attributes of waterfront spaces represents a fundamental prerequisite for effectively enhancing recreational vitality [2].
The academic community has conducted extensive and systematic investigations into recreational vitality in urban public spaces and has established a robust, well-validated theoretical and empirical research framework. The existing body of scholarship can be broadly categorized into three core research streams. The first stream focuses on the quantitative measurement of recreational vitality and the characterization of its dynamic spatiotemporal evolution patterns [3,4,5,6,7,8,9,10,11,12,13,14,15,16,17,18,19]. Building on core metrics including pedestrian flow and activity intensity, researchers have constructed multi-dimensional evaluation frameworks by integrating multi-source big data methodologies, encompassing mobile phone signaling data [6,7] and points of interest (POI) [8,9,10,11,12,13], to quantitatively characterize and map the spatiotemporal distribution patterns of recreational vitality in urban public spaces. Subsequent studies have further applied this quantitative analytical framework to assess recreational vitality and have quantitatively elucidated the impacts of heterogeneity in land-use types on the aforementioned spatiotemporal distribution characteristics.
The second research stream focuses on elucidating the driving mechanisms governing recreational vitality across macro- to meso-scale spatial contexts [3,4,5,7,8,18,20,21,22,23,24,25,26]. This body of work has extensively employed analytical methods such as Geographic Information System (GIS) [5,25] and space syntax [3,4,18,20,21,22,23,24,26] to systematically disentangle the relationships between urban public space attributes—including locational attributes, accessibility, and land use characteristics of adjacent areas—and recreational vitality. For instance, several studies have constructed context-specific evaluation frameworks for recreational vitality to identify and prioritize the core driving factors of this vitality [8]. Other studies within this stream have employed space syntax analysis to examine the effects of geospatial conditions, traffic connectivity, vegetation coverage, and other associated built environment attributes on recreational vitality in urban waterfront spaces, thereby providing empirical evidence and design implications for the landscape optimization of these waterfront spaces [22]. Furthermore, subsequent studies have applied optimally parameterized geographical detector models and multiscale geographically weighted regression (MGWR) models, in conjunction with real-time multi-source big data, to quantitatively unravel the core mechanisms by which urban public space attributes shape the spatiotemporal distribution patterns of recreational vitality, thus providing robust empirical support for formulating differentiated spatial planning and management strategies for urban public spaces in high-density urban contexts [25].
The third research stream focuses on the quantitative characterization of fine-grained landscape elements and the identification of their effects in micro-scale urban public spaces. In recent years, a growing body of scholarship has paired computer vision-driven deep learning models with street view imagery (SVI) techniques to enable high-accuracy automated extraction and quantitative characterization of visual landscape attributes in urban public spaces, and to further quantify their effects on recreational vitality [27,28,29,30,31,32,33,34,35]. For example, several studies have constructed a systematic evaluation framework for visual landscape attributes via deep learning-based image semantic segmentation techniques, and conducted a quantitative assessment of the visual perceptual quality of urban waterfront greenway landscapes. Complementary studies within this stream have developed context-specific semantic segmentation models, integrated with multi-source big data analytics, to enable automated identification of autumn-specific waterfront landscape characteristics and the quantitative measurement of recreational vitality in waterfront public spaces. Collectively, this body of scholarship has systematically characterized the spatiotemporal distribution patterns of recreational vitality and elucidated the driving mechanisms through which its core influencing factors operate [27,31,32,33,34,35], thereby providing robust empirical evidence and methodological frameworks for the optimization of autumn-specific waterfront landscapes and AI-driven scenario-adaptive strategies for vitality enhancement in waterfront public spaces [29]. In addition, further studies have employed semantic segmentation models to quantify the coefficient of variation in pedestrian flow extracted from time-series SVI, and to empirically verify the effects of fine-grained built environment elements on recreational vitality via multiple regression analysis [30]. To date, deep learning-based semantic segmentation techniques have been extensively applied not only to research on waterfront public spaces, but also across a diverse array of urban spatial typologies, including historic and cultural blocks and urban core areas [35].
Despite the substantial insights yielded by extant scholarship across the three core research streams detailed above—namely, the quantitative measurement of recreational vitality, macro- to meso-scale driving mechanism elucidation, and micro-scale landscape element characterization and effect analysis—two critical research gaps remain unaddressed, representing key knowledge blind spots that demand targeted scholarly attention: (1) The inherent relationship between micro-scale waterfront landscape attributes and recreational vitality has not yet been fully elucidated. Most existing studies have adopted cities, administrative districts, or large urban parks as their core analytical units, with only limited attention paid to micro-scale waterfront spatial units. While a small body of scholarship has carried out exploratory micro-scale analyses via semantic segmentation techniques, these studies have largely been limited to quantifying the independent effects of individual landscape elements. There is a notable lack of systematic, in-depth investigation and rigorous empirical verification regarding the interactive and synergistic effects of multi-dimensional landscape attributes on waterfront recreational vitality. (2) Existing evaluation frameworks for landscape characteristics have critical limitations in their metrics dimensions, which impede the comprehensive characterization of full-spectrum landscape attributes in waterfront spaces. Existing studies have largely relied on conventional two-dimensional morphological metrics, including site area and landscape shape index. While the effects of three-dimensional visual landscape metrics—including Green View Factor (GVF) [27,32,34,36,37,38] and Sky Vision Factor (SVF) [27,32,39]—on recreational vitality have been empirically verified, most of these studies have examined these metrics in isolation, and have failed to systematically construct and holistically investigate an integrated three-dimensional visual landscape metrics system. More critically, the driving mechanisms and effect magnitudes of three-dimensional visual metrics that specifically capture the vertical enclosure characteristics of waterfront spaces—exemplified by the Enclosure Interface View Factor (EIVF) [34]—on recreational vitality in waterfront public spaces remain largely underexplored, with no rigorous empirical verification available to date.
The case study methodology, rooted in representative, context-specific empirical cases, enables the systematic elucidation of the inherent patterns and functional mechanisms governing the target research subject through fine-grained, in-depth case analysis. It further facilitates the development of generalizable theoretical insights and practice-oriented optimization frameworks, conferring the dual core value of advancing theoretical development and enabling rigorous empirical validation on this methodology. In response to the aforementioned research gaps, this study adopts a case study research design, taking the waterfront space of the Beijing–Hangzhou Grand Canal (Hangzhou section) as the empirical research object, with the core goal of addressing the identified gaps through the following four research objectives: (1) To establish a systematic evaluation metrics system for the landscape attributes of urban waterfront spaces through a comprehensive review of existing domestic and international scholarship. (2) To obtain continuous landscape imagery datasets of the canal waterfront space through systematic field surveys, and to apply deep learning-based semantic segmentation models for the automated identification and accurate quantification of key waterfront landscape metrics, including Green View Factor (GVF), Water Body View Factor (WBVF), Sky Vision Factor (SVF), Enclosure Interface View Factor (EIVF), and Landscape Element Richness (LER). (3) To quantitatively decipher the correlations between the aforementioned landscape metrics and recreational vitality through bivariate correlation analysis and regression modeling, and to identify the core landscape metrics driving recreational vitality enhancement. (4) Building on the empirical findings, to systematically examine the regression relationships between core landscape metrics and recreational vitality across three distinct functional zones (commercial functional zones, residential functional zones, and ecological conservation zones), and to propose differentiated scenario-adaptive strategies for vitality enhancement tailored to each functional zone typology.
The empirical findings of this study not only provide a robust, evidence-based scientific basis for the targeted enhancement of recreational vitality in the waterfront space of the Beijing–Hangzhou Grand Canal (Hangzhou section), but also establish a methodologically rigorous, generalizable research paradigm for enhancing the spatial quality of urban public spaces, improving the livability of human settlements, and promoting the high-quality and sustainable development of urban systems.

2. Research Methods

2.1. Study Area

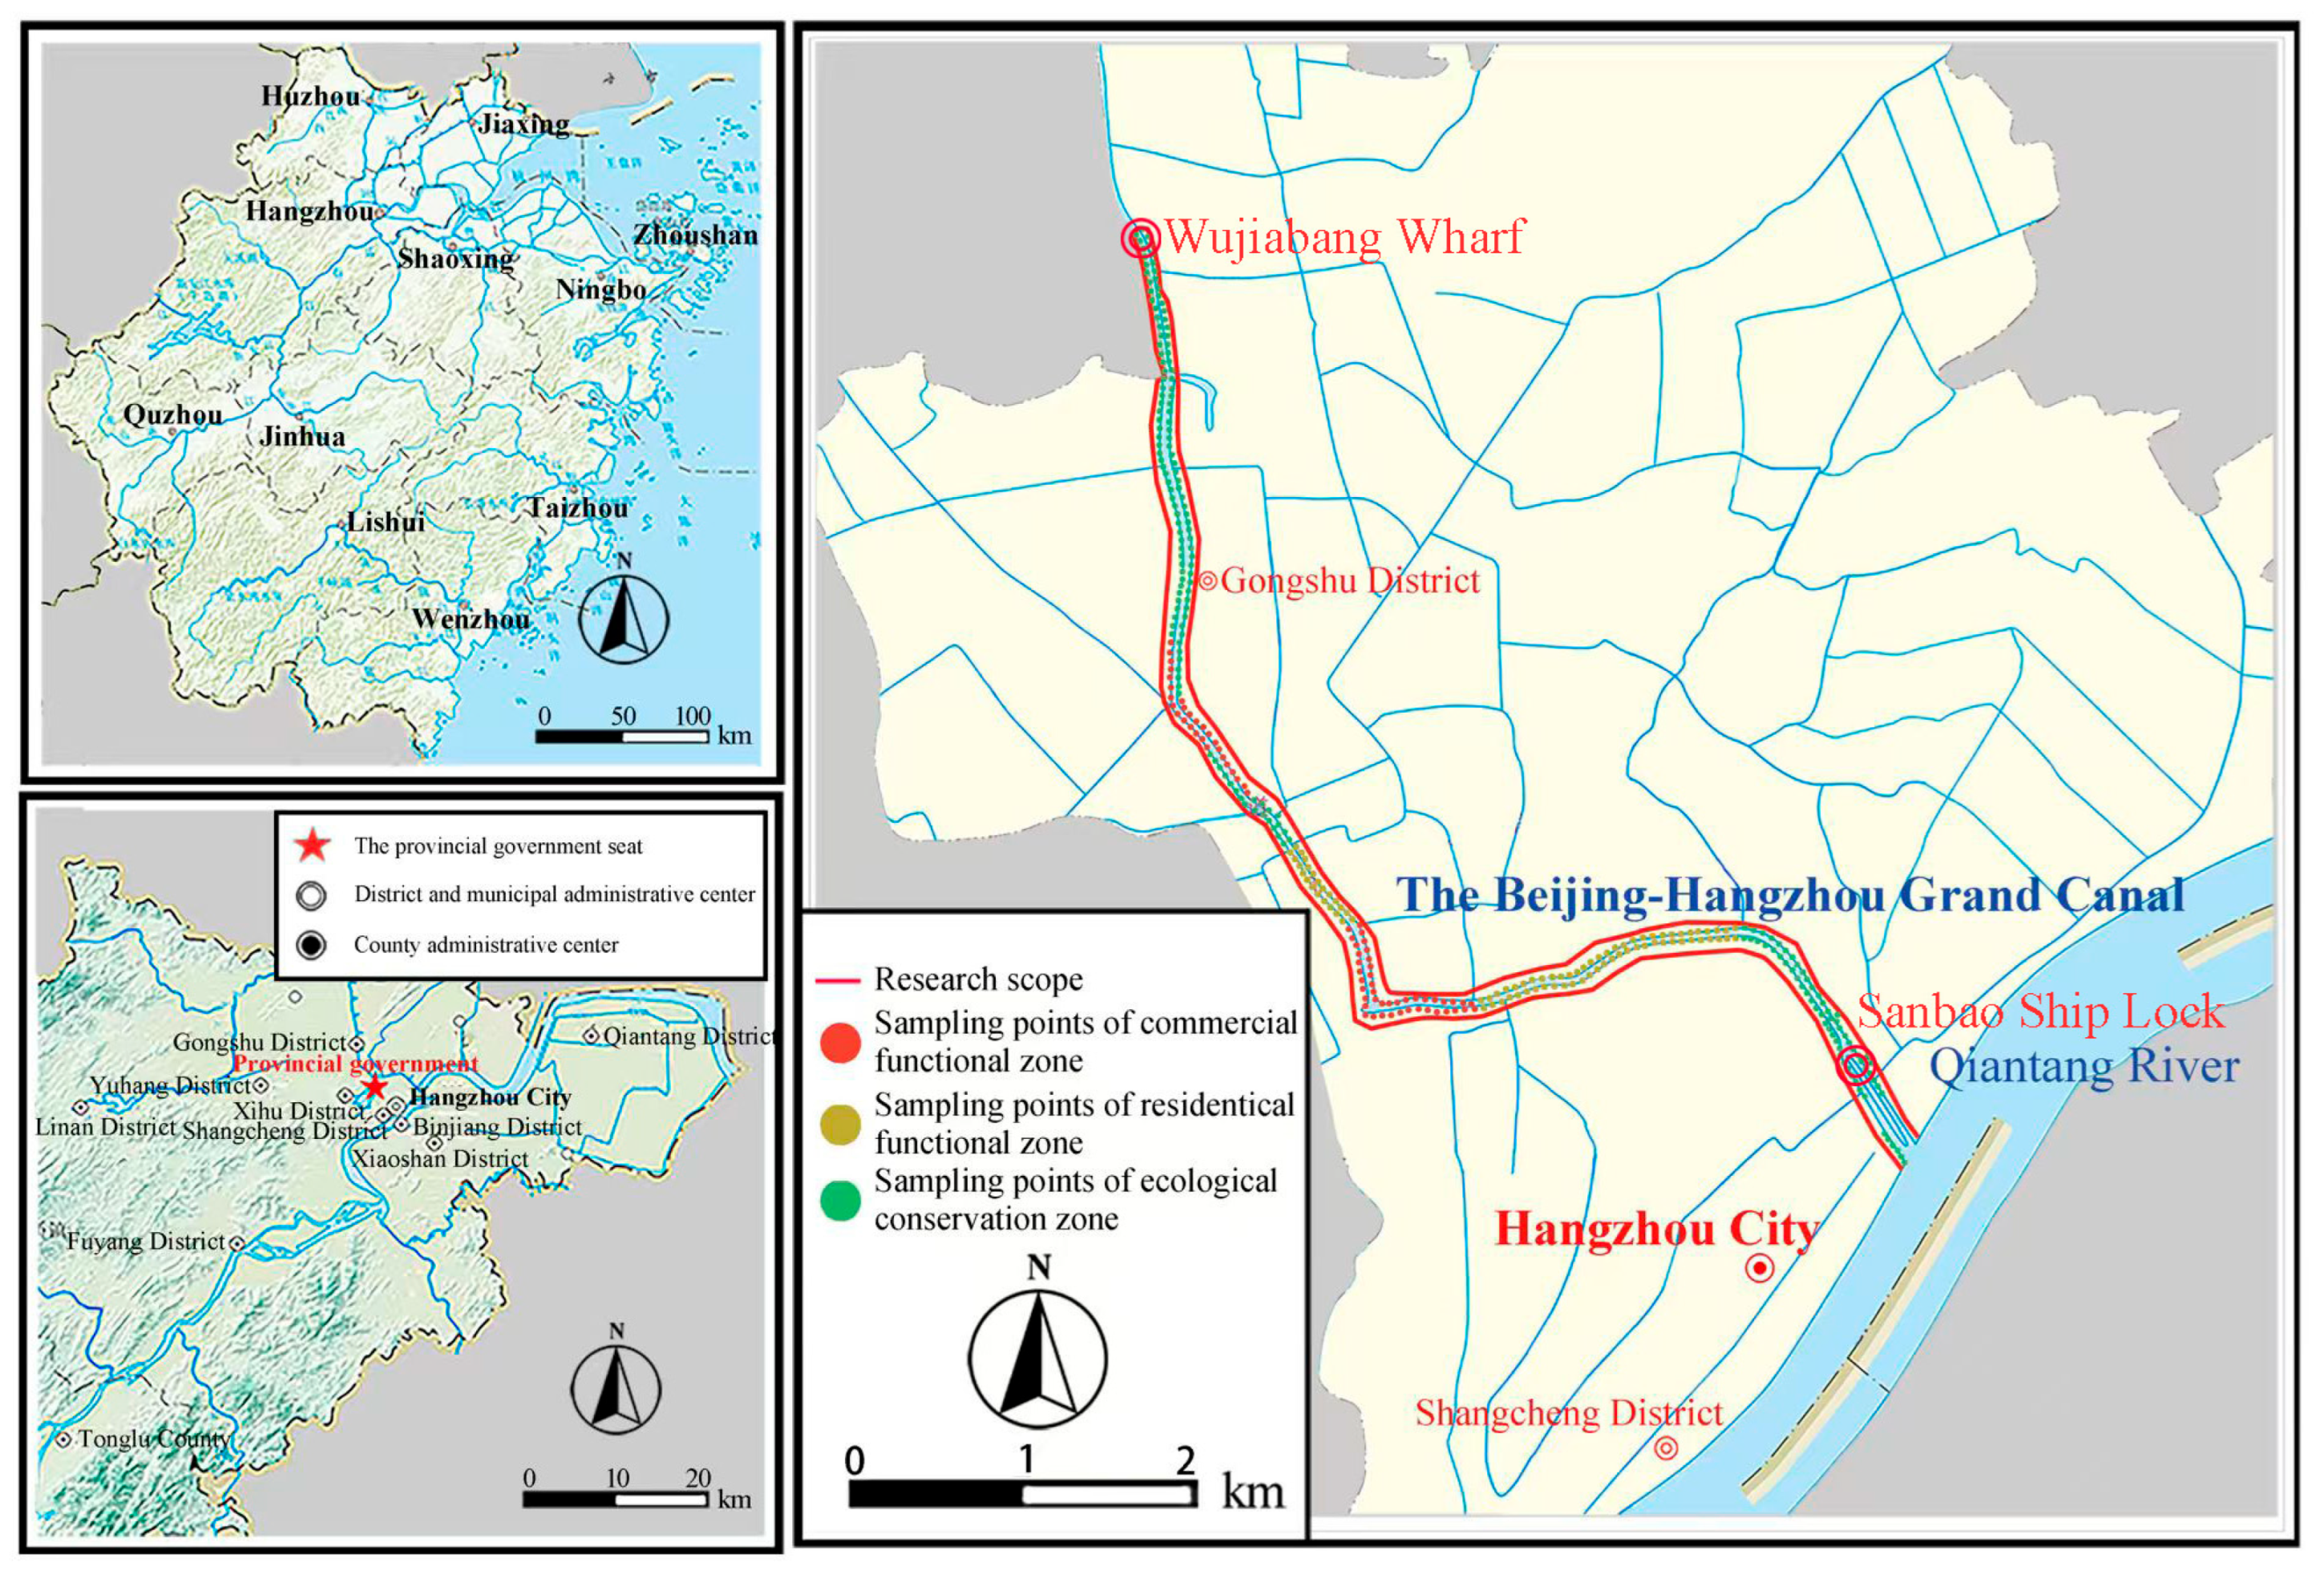
Hangzhou, the capital city of Zhejiang Province, is located along the southeast coast of China in the southern sector of the Yangtze River Delta, and features a subtropical monsoon climate. In 2024, the city recorded a permanent resident population of 12.62 million, with its gross regional product (GRP) reaching 2.186 trillion Chinese yuan (CNY). As a core hub city in the southern Yangtze River Delta, Hangzhou also stands as a national pioneer in high-density urban waterfront space regeneration and living cultural heritage conservation. The focal study area addressed in this study is the Hangzhou section of the Beijing–Hangzhou Grand Canal, which forms a core segment of the living linear cultural heritage officially inscribed on the UNESCO World Heritage List in 2014. Stretching approximately 39 km from Tangqi Town in Yuhang District (north) to Sanbao Lock on the Qiantang River (south), this canal segment traverses multiple urban functional zones across Hangzhou, including commercial and business districts, residential areas, and ecological conservation areas. In recent years, driven by national strategies including the construction of the Grand Canal National Cultural Park, waterfront regeneration along this segment has shifted from a landscape-centric model to an integrated culture-tourism development model centered on heritage conservation, and has ultimately formed a continuous urban public space corridor with pronounced functional heterogeneity.
This study selects the Beijing–Hangzhou Grand Canal (Hangzhou section) as the focal study area based on three core justifications. First, as a continuous linear spatial corridor within a unified urban administrative context, this canal segment represents a natural gradient sample set with pronounced heterogeneity in functional and landscape attributes. Specifically, it enables rigorous control of confounding variables—such as cross-city macro-locational differences and inter-regional policy environment heterogeneity—that could introduce bias into the quantification of recreational vitality, thus significantly improving the internal validity of the study’s empirical findings. Second, this canal segment covers a full and diverse spectrum of waterfront landscape interfaces, which provides a representative sampling foundation for the automated extraction of three-dimensional visual landscape metrics including Green View Factor (GVF), Sky Vision Factor (SVF), and Enclosure Interface View Factor (EIVF), as well as for the construction of a systematic evaluation metrics system for micro-scale multi-dimensional landscape attributes. This design directly responds to the core limitations of existing studies, including excessively narrow metrics dimensions and the absence of systematic integration of three-dimensional visual metrics. Third, this canal segment forms a highly complex waterfront spatial system that integrates ecological corridors, World Heritage sites, commercial and business districts, and residential areas, and is widely acknowledged as a benchmark case for the regeneration and adaptive renewal of complex urban historic waterfront spaces both in China and internationally. The empirical findings derived from this case study not only provide actionable practical implications for enhancing the spatial quality of urban waterfront spaces nationwide in China, but also have critical universal academic value for international urban research, heritage conservation, and public space research. Furthermore, these findings establish a replicable and generalizable research paradigm for investigating recreational vitality in analogous linear public spaces and historic heritage corridors worldwide.

2.2. Spatial Sample Selection for the Beijing–Hangzhou Grand Canal (Hangzhou Section)

This study defined a 17 km continuous linear segment of the Beijing–Hangzhou Grand Canal (Hangzhou section), spanning from Wujiabang Wharf to Sanbao Lock, as the focal study sub-area; this segment constitutes the most intensively developed and highly urbanized reach of the canal within Hangzhou. A systematic equal-interval sampling scheme was adopted, with sampling points established at 100 m intervals along both banks of this canal reach to facilitate field acquisition of landscape imagery. Following field validation and rigorous quality control, a total of 310 valid sampling points were finally retained for subsequent quantitative analysis (Figure 1).
This study adopted a 100 m sampling interval based on three core methodological justifications. First, this sampling grain ensures full, continuous spatial coverage of the waterfront space along the Beijing–Hangzhou Grand Canal (Hangzhou section), while minimizing overlap of landscape imagery arising from over-sampling. Second, this sampling interval design effectively eliminates redundant characterization of landscape features from adjacent sampling points within continuous image frames, thereby ensuring the spatial statistical independence of the landscape metrics extracted for each sampling point. Finally, this sampling design in turn effectively mitigates model bias arising from spatial autocorrelation in the dataset during subsequent statistical modeling analyses.
Subsequently, all sampling points were systematically stratified and assigned to three distinct functional zone typologies in strict compliance with the Hangzhou Territorial Spatial Master Plan (2021–2035) [40]: commercial functional zone, residential functional zone, and ecological conservation zone. Specifically, sampling points within commercial functional zones were predominantly concentrated in commercial clusters and blocks along the canal; sampling points within residential functional zones were evenly distributed across high-density residential communities along the canal waterfront; and sampling points within ecological conservation zones were predominantly located within ecological control zones, including waterfront green spaces and urban parks. Through comparative analyses of sampling points across the three defined functional zone typologies, this study systematically quantifies the heterogeneous effects of landscape attribute metrics on recreational vitality across functional zones, thereby significantly enhancing the targeted applicability and robustness of the study’s empirical findings.

2.3. Research Framework and Robustness Validation

2.3.1. Research Framework

The existing body of scholarship has employed a wide range of methodological approaches to investigate recreational vitality in urban public spaces. For instance, Li et al. [27] and Wang et al. [29] were among the pioneering studies to employ deep learning-based semantic segmentation models to parse street view imagery (SVI) and quantitatively extract landscape metrics including the Green View Factor and Water Body View Factor. These two studies subsequently quantified recreational vitality via either mobile phone signaling data or expert virtual reality (VR) scoring assessments. Finally, they constructed quantitative association models between landscape element metrics and recreational vitality via well-established statistical methods, including correlation analysis and multiple regression. Building on this well-established analytical framework, Nathvani et al. [30] extended this framework to urban street spaces, through integrating time-series SVI and object detection techniques to directly quantify the coefficient of temporal variation in pedestrian flow as a quantitative proxy indicator for recreational vitality. This study additionally extracted neighborhood-scale morphological metrics from open-source geospatial datasets, and empirically verified the effects of urban morphological metrics on street-level recreational vitality through multiple linear regression.
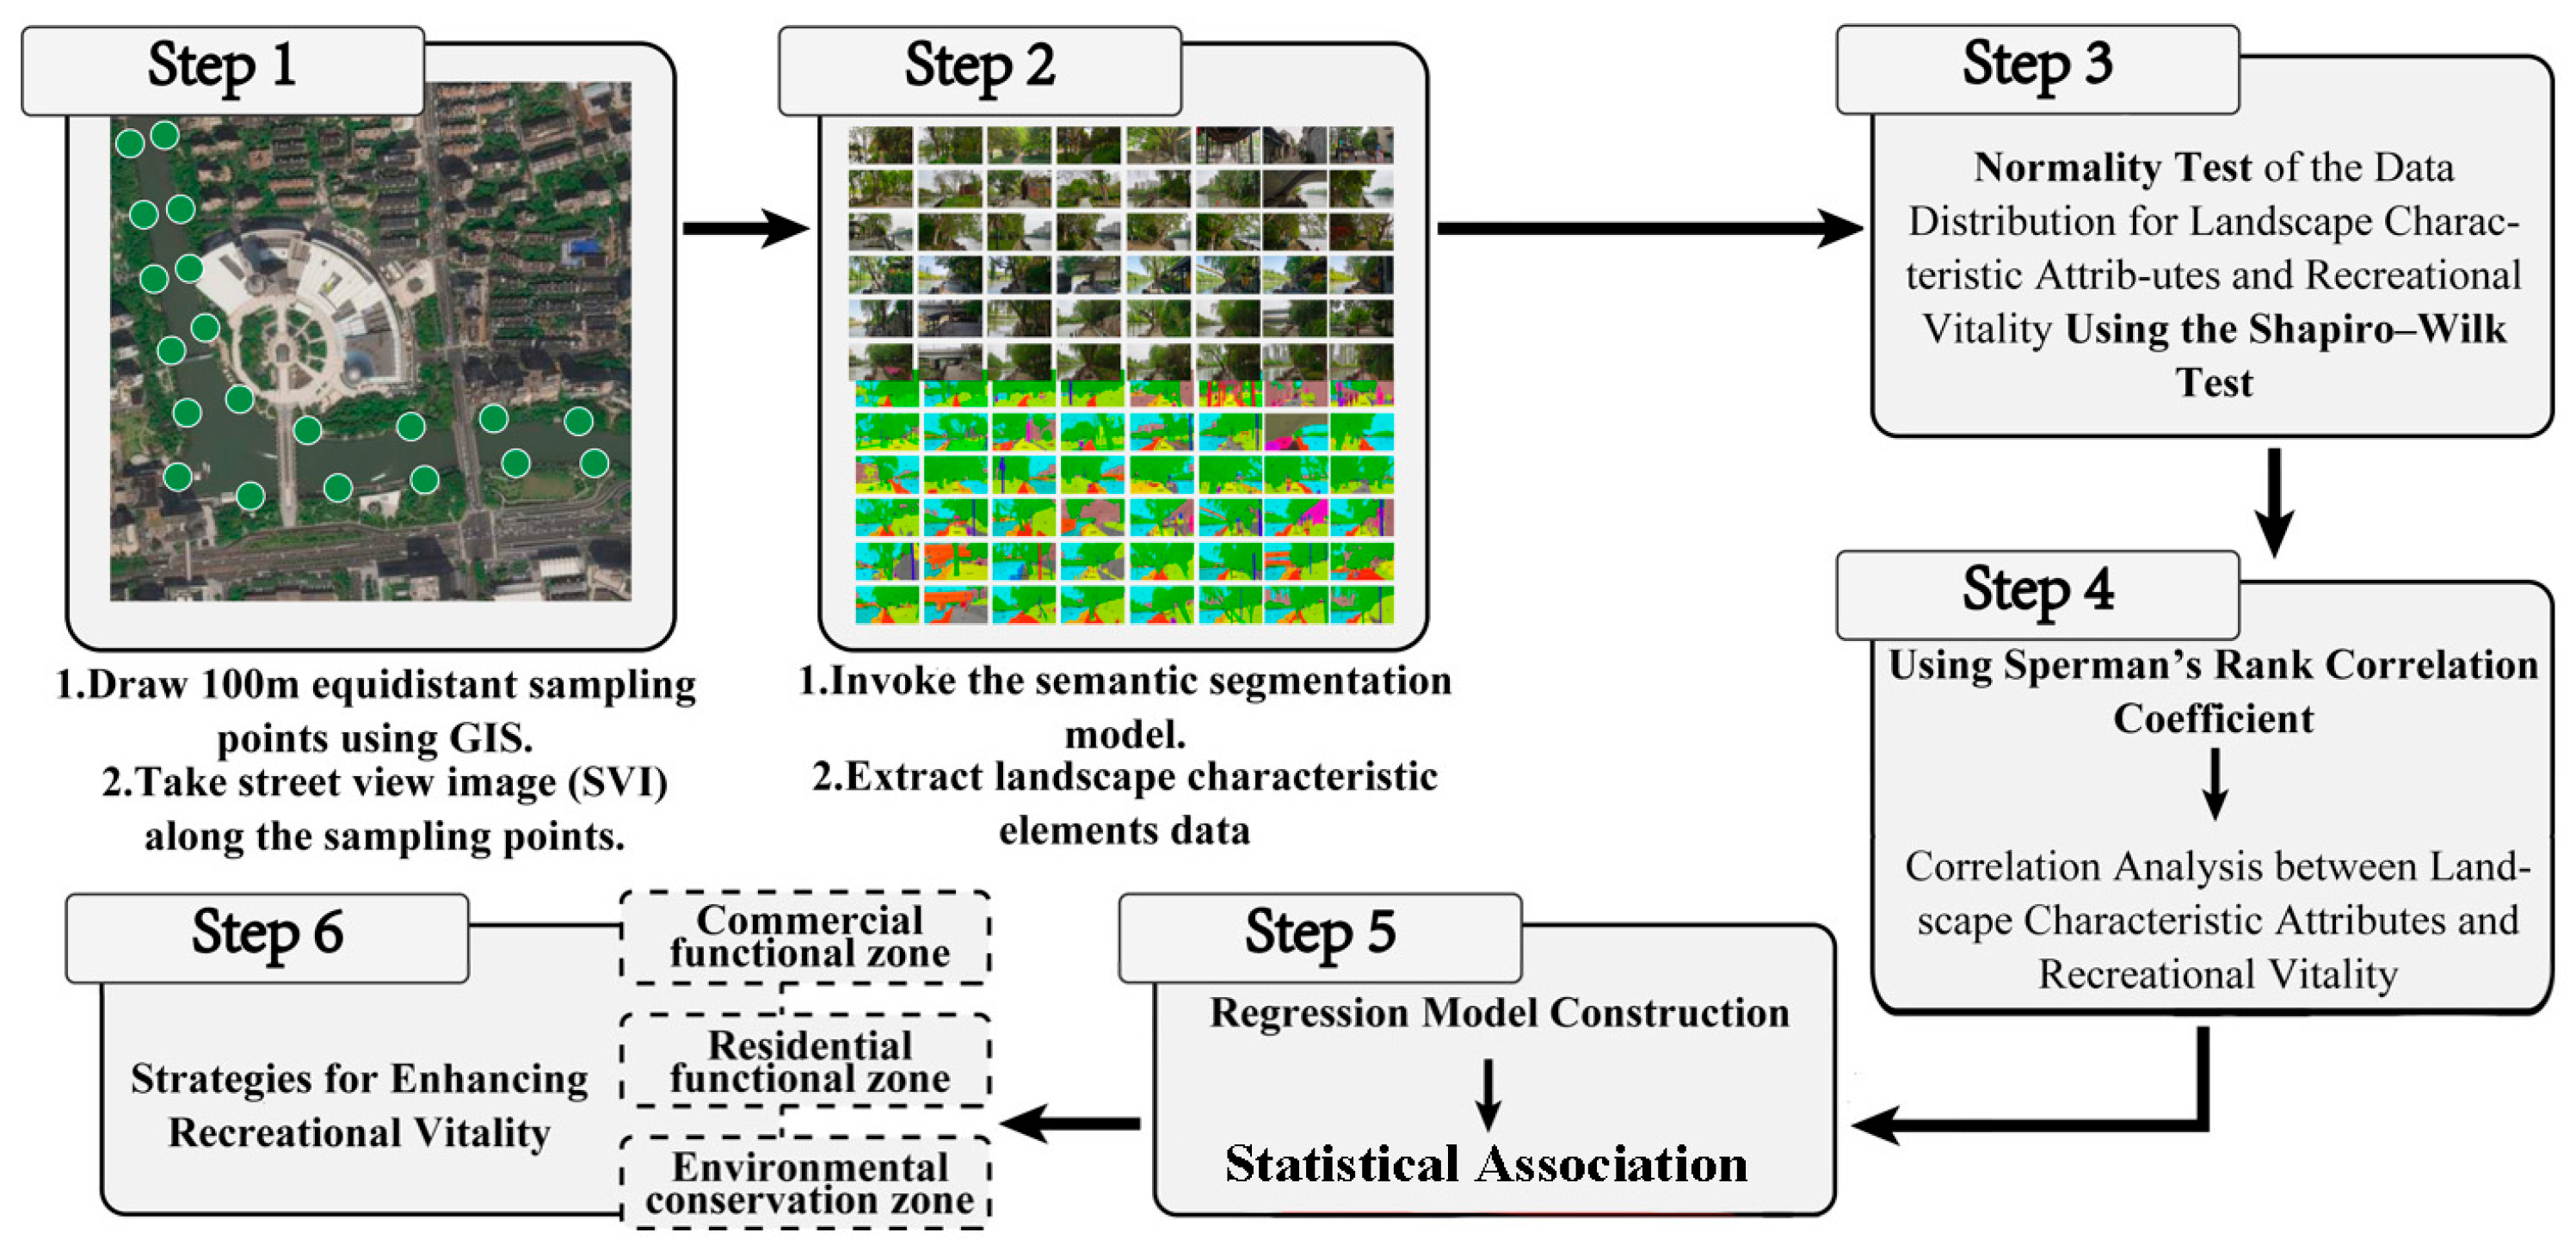
By comprehensively drawing on and systematically integrating the aforementioned well-established methodological frameworks, this study combines a combination of technical and analytical approaches, including the Mask2Former semantic segmentation model, ArcGIS 10.8 spatial analysis techniques, correlation analysis, multiple regression analysis, and complementary analytical methods, to establish a research framework comprising the following sequential research steps: establishment of a systematic evaluation metrics system for landscape characteristic attributes, quantitative characterization of landscape characteristic metrics, quantitative measurement of recreational vitality, bivariate correlation analysis between landscape characteristic metrics and recreational vitality, heterogeneous regression analysis of core landscape metrics across functional zones, and formulation of scenario-adaptive strategies for vitality enhancement, as schematically depicted in Figure 2.
(1)
Construction of a systematic indicator system for landscape characteristic attributes in the waterfront space of the Beijing–Hangzhou Grand Canal (Hangzhou section).
This metrics system was constructed based on the three-dimensional spatial environmental characteristics of the Beijing–Hangzhou Grand Canal (Hangzhou section) waterfront space, encompassing three core dimensions—natural spatial composition, built environment composition, and comprehensive visual composition—designed to comprehensively quantify the physical environmental attributes and visual perceptual quality of waterfront spaces. Specifically, the natural spatial composition dimension focuses on the visual accessibility of core ecological components (namely vegetation, water bodies, soil, and sky), thereby characterizing the natural ecological properties of waterfront spaces. The built environment composition dimension focuses on the spatial configuration of built environmental elements—including impervious surfaces associated with the Hard Pavement View Factor (HPVF), public service facilities, and building enclosure interfaces—thus reflecting the level of human intervention in waterfront spaces. The comprehensive visual composition dimension focuses on quantitative metrics including Landscape Element Richness (LER), Visual Openness Index (VOI), and Spatial Visual Tendency (SVT), to characterize the spatial complexity and diversity of the waterfront visual environment. The establishment of this metrics system provides a standardized classification framework and quantitative calculation basis for the subsequent identification and quantification of landscape elements and their attributes via street view imagery (SVI), thereby ensuring the systematic robustness of feature extraction and the horizontal comparability of the resultant dataset.
(2)
Identification and quantification of waterfront landscape characteristic attributes based on the Mask2Former semantic segmentation model.
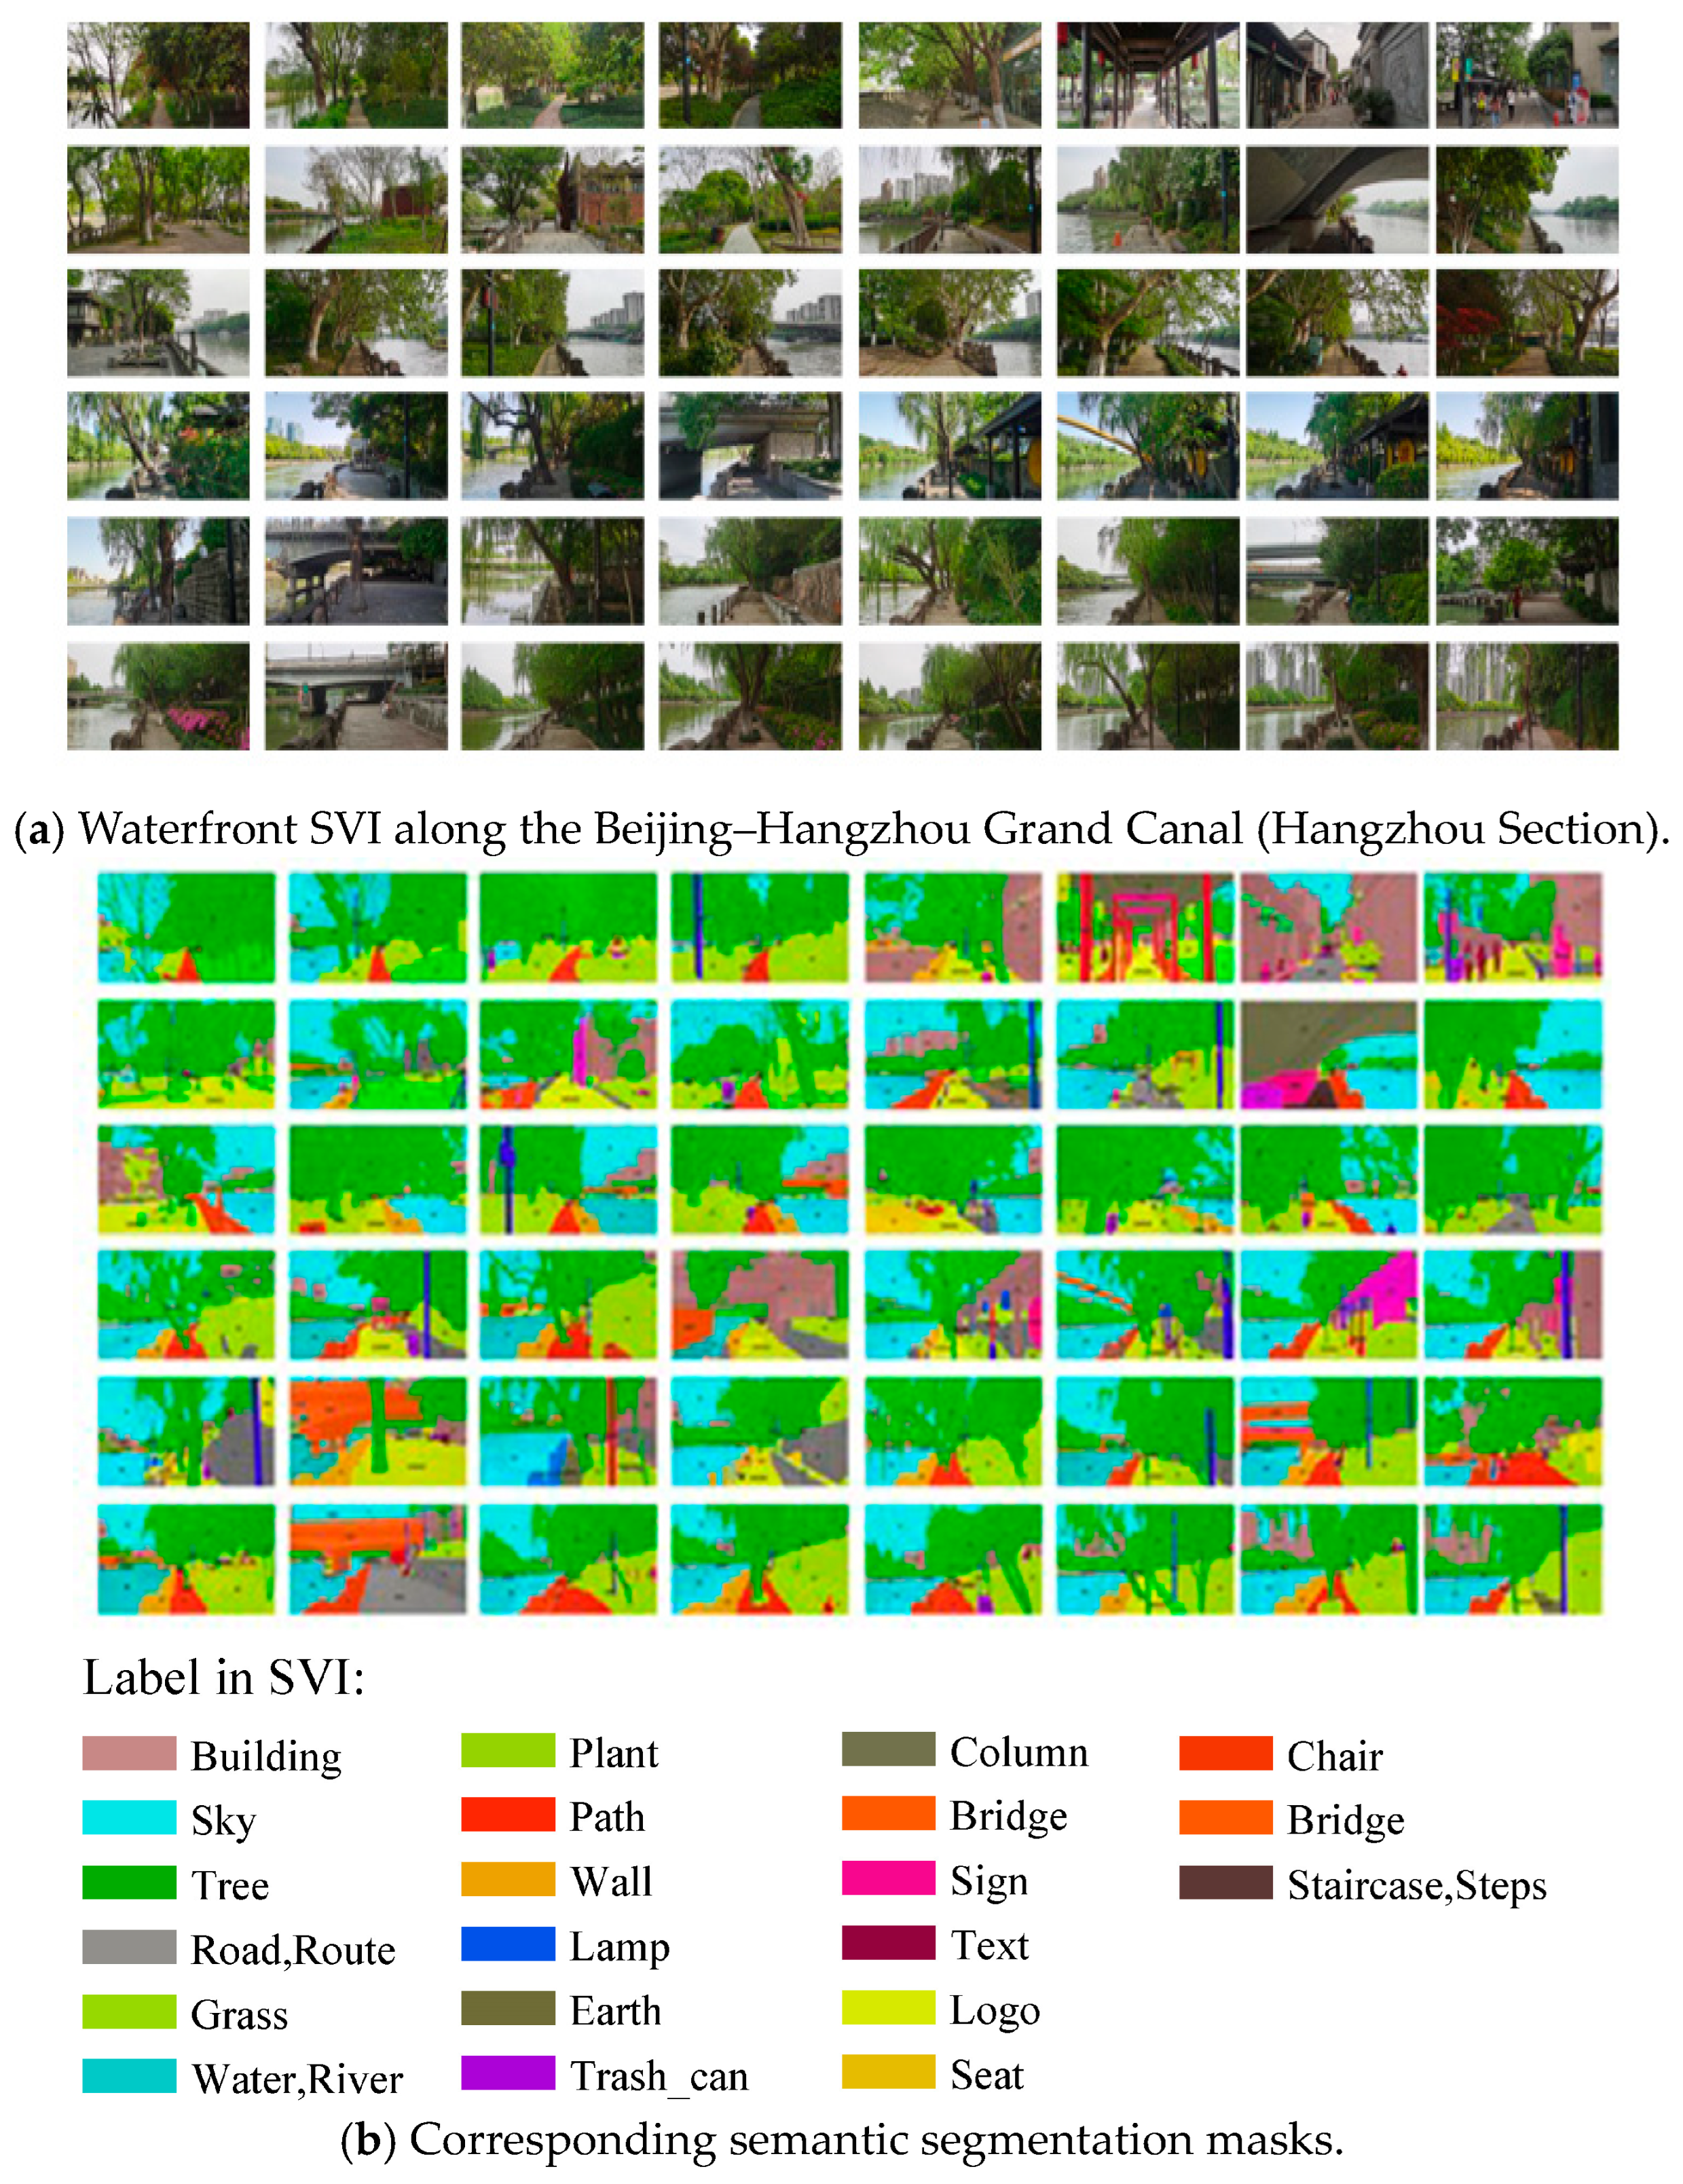
The deep learning-based Mask2Former semantic segmentation model was employed as the core tool for the automated identification, extraction, and quantification of landscape characteristic elements from waterfront street view imagery (SVI) collected at the 310 valid sampling points. Mask2Former is a state-of-the-art deep learning-based universal image segmentation framework based on the Transformer architecture. Through the integration of a mask attention mechanism, it unifies various segmentation tasks under a single mask classification paradigm, facilitating high-precision panoptic segmentation by predicting a set of binary masks and their corresponding class labels (Figure 3). Mask2Former was chosen as the core segmentation model for this study, primarily owing to its superior performance in handling complex semantic scenes in waterfront SVI.
The waterfront space of the Beijing–Hangzhou Grand Canal (Hangzhou section) exhibits pronounced heterogeneity in natural and built environment elements, which display significant scale-dependent variability and complex morphological features. Traditional semantic segmentation models generally demonstrate suboptimal performance when handling such complex scenes, often leading to limitations including ambiguous object boundaries, categorical misclassification, and loss of fine-grained feature details—thus failing to meet the rigorous requirements for high-precision, fine-grained quantification of landscape metrics. In contrast, Mask2Former exhibits robust high-precision segmentation capability, thereby effectively ensuring the accuracy and reliability of quantifying core landscape metrics such as Green View Factor (GVF) and Sky Vision Factor (SVF). This capability, in turn, yields a robust, high-quality dataset for subsequent quantitative analysis of waterfront landscape characteristic attributes and investigations into the causal mechanisms governing the relationship between landscape attributes and recreational vitality.
(3)
Normality test of the data distributions for landscape characteristic attributes and recreational vitality using the Shapiro–Wilk test.
Drawing on the standardized quantitative dataset combining landscape characteristic attributes and recreational vitality generated from the preceding analytical procedures, the Shapiro–Wilk test was performed to evaluate the normality of the distribution across all core research variables. The formula for the Shapiro–Wilk test statistic is given as follows:
W = ( i = 1 n a i x i ) 2 i = 1 n ( x i x ¯ ) 2
In the formula, x i denotes the sample data, a i is the constant coefficient, and x ¯ is the sample mean.
(4)
Correlation analysis between landscape characteristic attributes and recreational vitality based on Spearman’s correlation coefficient.
Building on the normality test results, Spearman’s correlation coefficient—a well-established nonparametric statistical method—was employed to perform bivariate correlation analysis on all core research variables. Spearman’s correlation coefficient does not impose strict normality assumptions on data distributions and can robustly quantify the strength and direction of monotonic associations (including both linear and nonlinear relationships) between paired variables, thus rendering it well-suited to the data characteristics and analytical objectives of this study [41].
The formula for Spearman’s correlation coefficient is given as follows:
ρ = 1 6 d i 2 n ( n 2 1 )
In the formula, d i denotes the rank difference between each pair of observations, and n denotes the total number of samples.
Building on the results of Spearman’s correlation analysis, core landscape characteristic metrics with statistical significance and high correlation coefficients were identified and selected. Subsequently, in conjunction with regression models, this study elucidates the quantitative mechanism through which key waterfront landscape attributes affect recreational vitality.
(5)
Quantitative analysis of the statistical association via regression model construction.
Building on the results of Spearman’s correlation analysis, core landscape characteristic indicators that meet the pre-specified statistical significance threshold (p < 0.05) and exhibit high correlation coefficients were systematically screened and retained for subsequent analyses. With these screened core indicators employed as explanatory variables, multiple regression models were constructed to quantitatively analyze the statistical associative relationship through which key waterfront landscape attributes affect recreational vitality across distinct functional zones, including the commercial functional zone, the residential functional zone, and the ecological conservation zone, respectively.
(6)
Formulation of strategies for enhancing recreational vitality in the waterfront space of the Beijing–Hangzhou Grand Canal (Hangzhou section).
Building on the functional heterogeneity of the commercial functional zone, the residential functional zone, and the ecological conservation zone, differentiated, targeted strategies for recreational vitality enhancement are developed in line with the functional positioning and user demand features of each zone.

2.3.2. Robustness Validation

To ensure the accuracy of semantic segmentation results and the robustness of empirical findings, this study conducted a systematic review of relevant literature on the application of the Mask2Former model in street view image semantic interpretation [42,43,44] and assessed the task-specific robustness of different backbone networks for street view semantic segmentation. Drawing on the internationally accepted validation protocol for the large-scale Mapillary Vistas street view dataset, mean Intersection over Union (mIoU)—a metric that quantifies both the pixel-level classification accuracy and the precision of object boundary localization—was employed as the core validation metric. Higher mIoU values indicate superior overall comprehensive segmentation accuracy and generalization performance of the model [43,44]. The segmentation accuracy and mIoU values for the different networks utilized in this study are presented in Table 1.
Building on the Intersection over Union (IoU) performance metrics of the aforementioned networks, the Swin-Large model was ultimately chosen as the segmentation backbone for the Mask2Former model, specifically for street view image semantic segmentation in the present study. This model combination has been demonstrated to deliver superior segmentation accuracy and generalization performance on complex street view datasets (e.g., the Mapillary Vistas dataset), thereby maximizing the precision and robustness of the extraction of waterfront landscape characteristic indicators in the present study while ensuring high computational efficiency.

2.4. Data Collection and Processing

Consistent with the aforementioned research framework, this study systematically collected and preprocessed two core types of raw data: recreational vitality data obtained from mobile phone signaling data, and waterfront landscape characteristic attribute data extracted from street view imagery (SVI) of the Beijing–Hangzhou Grand Canal (Hangzhou section). The detailed workflows for data collection and preprocessing are presented in Table 2.

3. Indicator System Construction

3.1. Recreational Vitality

Recreational vitality serves as a core indicator for evaluating the utilization efficiency of urban public spaces. Its primary measurement dimensions include four key aspects: activity frequency, participation intensity, activity duration, and the social, environmental, and economic benefits generated by these activities [1,32]. Its core connotation is centered on quantifying the extent to which urban public spaces meet users’ recreational needs, as well as the level of benign mutual human–environment interactions between user activities and the built spatial environment.
Traditional quantitative approaches for measuring recreational vitality rely predominantly on manual on-site fixed-point observations and questionnaire-based surveys. Spatial recreational vitality is assessed by quantifying the spatiotemporal patterns of pedestrian flow and the diversity and compositional structure of activity types within predefined time intervals. In recent years, research on recreational vitality has undergone a paradigm shift toward big data-enabled quantitative assessment. This paradigmatic shift has spawned two primary research strands: one identifies population aggregation hotspots and spatial distribution patterns of recreational activities using social media check-in data; the other achieves real-time dynamic monitoring of population activity density through the deployment of short-range Bluetooth sensing devices.
Among the diverse array of emerging measurement approaches, anonymous mobile phone signaling data has emerged as an invaluable data source for investigating recreational vitality. Particularly in macro- and meso-scale spatial vitality investigations, it offers irreplaceable application merits due to its core strengths of objectivity, high temporal continuity, and extensive spatiotemporal coverage. By passively capturing anonymous user signaling events within the cellular base station grid, such data facilitate high-resolution, high-precision characterization of spatial population activity density and spatiotemporal movement trajectories across the study area, providing a robust, unified quantitative basis for the evaluation of recreational vitality. Notably, its full-population and near-census coverage ensures the acquisition of a sufficient number of valid samples, even in spatial segments with low vitality and low activity intensity. This attribute not only markedly improves the robustness and reliability of statistical analyses but also directly addresses the core limitations inherent to traditional approaches—namely sampling bias, systematic observation errors, and discontinuous time-series datasets.
This study collected and preprocessed anonymous aggregated mobile phone signaling data with an hourly temporal resolution over a consecutive 91-day period spanning September to November 2024. The spatiotemporal distribution patterns of recreational vitality at the 310 predefined valid sampling points along the Beijing–Hangzhou Grand Canal (Hangzhou section) were quantitatively evaluated by utilizing the average hourly signaling data for each sampling point.

3.2. Waterfront Landscape Characteristic Attributes

Waterfront landscape characteristic attributes are defined as a comprehensive characterization of the physical composition, spatial morphology, and visual features of natural and built environment elements within waterfront spaces, which serve as the material foundation governing the environmental quality of waterfront zones. The core objective of establishing this indicator system is to quantify the landscape characteristics of waterfront spaces within the study area by selecting observable, quantifiable spatial feature indicators. The quantified indicators enable the establishment of a fundamental spatial database for subsequent empirical research, thereby laying a quantitative foundation for investigating the effects of waterfront landscape characteristics on recreational vitality.
By systematically integrating the Analytic Hierarchy Process (AHP) and the Entropy Weight Method (EWM), this study identified and selected 16 s-level indicators and established a comprehensive indicator system for waterfront landscape characteristics, encompassing three first-level dimensions: natural spatial composition, built environment composition, and comprehensive visual composition (Table 3). The natural spatial composition dimension comprises six second-level indicators: Sky View Factor (SVF), Water Body View Factor (WBVF), High-rise Green View Factor (HGVF), Low-rise Green View Factor (LGVF), Vertical Greenery Index (VGI), and Natural Surface View Factor (NSVF). Among these, the Sky View Factor (SVF) quantifies the spatial openness of waterfront spaces and directly influences the solar penetration and visual permeability of waterfront areas. The Water Body View Factor (WBVF) directly reflects the visual accessibility of water landscape elements in waterfront areas, serving as a core attribute closely linked to the recreational attractiveness of the canal waterfront. The High-rise Green View Factor (HGVF) primarily quantifies the canopy coverage of arbor vegetation, with a focus on its core ecological functions of shading and microclimate regulation. The Low-rise Green View Factor (LGVF) quantifies the coverage of low-growing vegetation (e.g., shrubs and groundcover plants), which exerts a significant influence on pedestrian recreational comfort and landscape perception. The Vertical Greenery Index (VGI) characterizes the heterogeneity of vertical vegetation distribution, thereby directly reflecting the three-dimensionality of waterfront spaces and the richness of vertical greening landscapes. The Natural Surface View Factor (NSVF) intuitively quantifies the coverage of natural groundcover, which is directly associated with the ecological service provision capacity of waterfront spaces.
The built environment dimension comprises seven second-level indicators: Hard Pavement View Factor (HPVF), Functional Facility View Factor (FFVF), Enclosure Interface View Factor (EIVF), Text Signage View Factor (TSVF), Rest Facility View Factor (RFVF), Cross River Connectivity (CRC), and Vertical Spatial Change Rate (VSCR). Among these, the Hard Pavement View Factor (HPVF) primarily quantifies the extent of surface hardening, which is directly linked to pedestrian recreational comfort, activity suitability, and the spatial carrying capacity of waterfront spaces. The Functional Facility View Factor (FFVF) intuitively reflects the visual accessibility of public service facilities within street view imagery (SVI), serving as a core indicator closely linked to the functional support capacity of waterfront areas. The Enclosure Interface View Factor (EIVF) primarily quantifies the degree of enclosure and morphological features of building and waterfront enclosure boundaries, exerting a significant influence on users’ perception of spatial definition and perceived safety. The Text Signage View Factor (TSVF) focuses on quantifying the visibility and legibility of information signs and wayfinding markers, which is directly linked to the service efficiency of the waterfront wayfinding system. The Rest Facility View Factor (RFVF) emphasizes the visual accessibility and distribution density of resting facilities, which directly influences users’ willingness to stay and the duration of their recreational activities. Cross River Connectivity (CRC) primarily characterizes the convenience of traffic connectivity between the two banks of the waterfront, exerting a profound influence on the overall accessibility and spatial integration of the waterfront. The Vertical Spatial Change Rate (VSCR) effectively characterizes the morphological heterogeneity of the built environment in the vertical dimension, thereby directly reflecting the richness of spatial hierarchy and visual complexity of the waterfront.

4. Results

4.1. Spatiotemporal Differentiation Characteristics of Recreational Vitality in the Beijing–Hangzhou Grand Canal (Hangzhou Section)

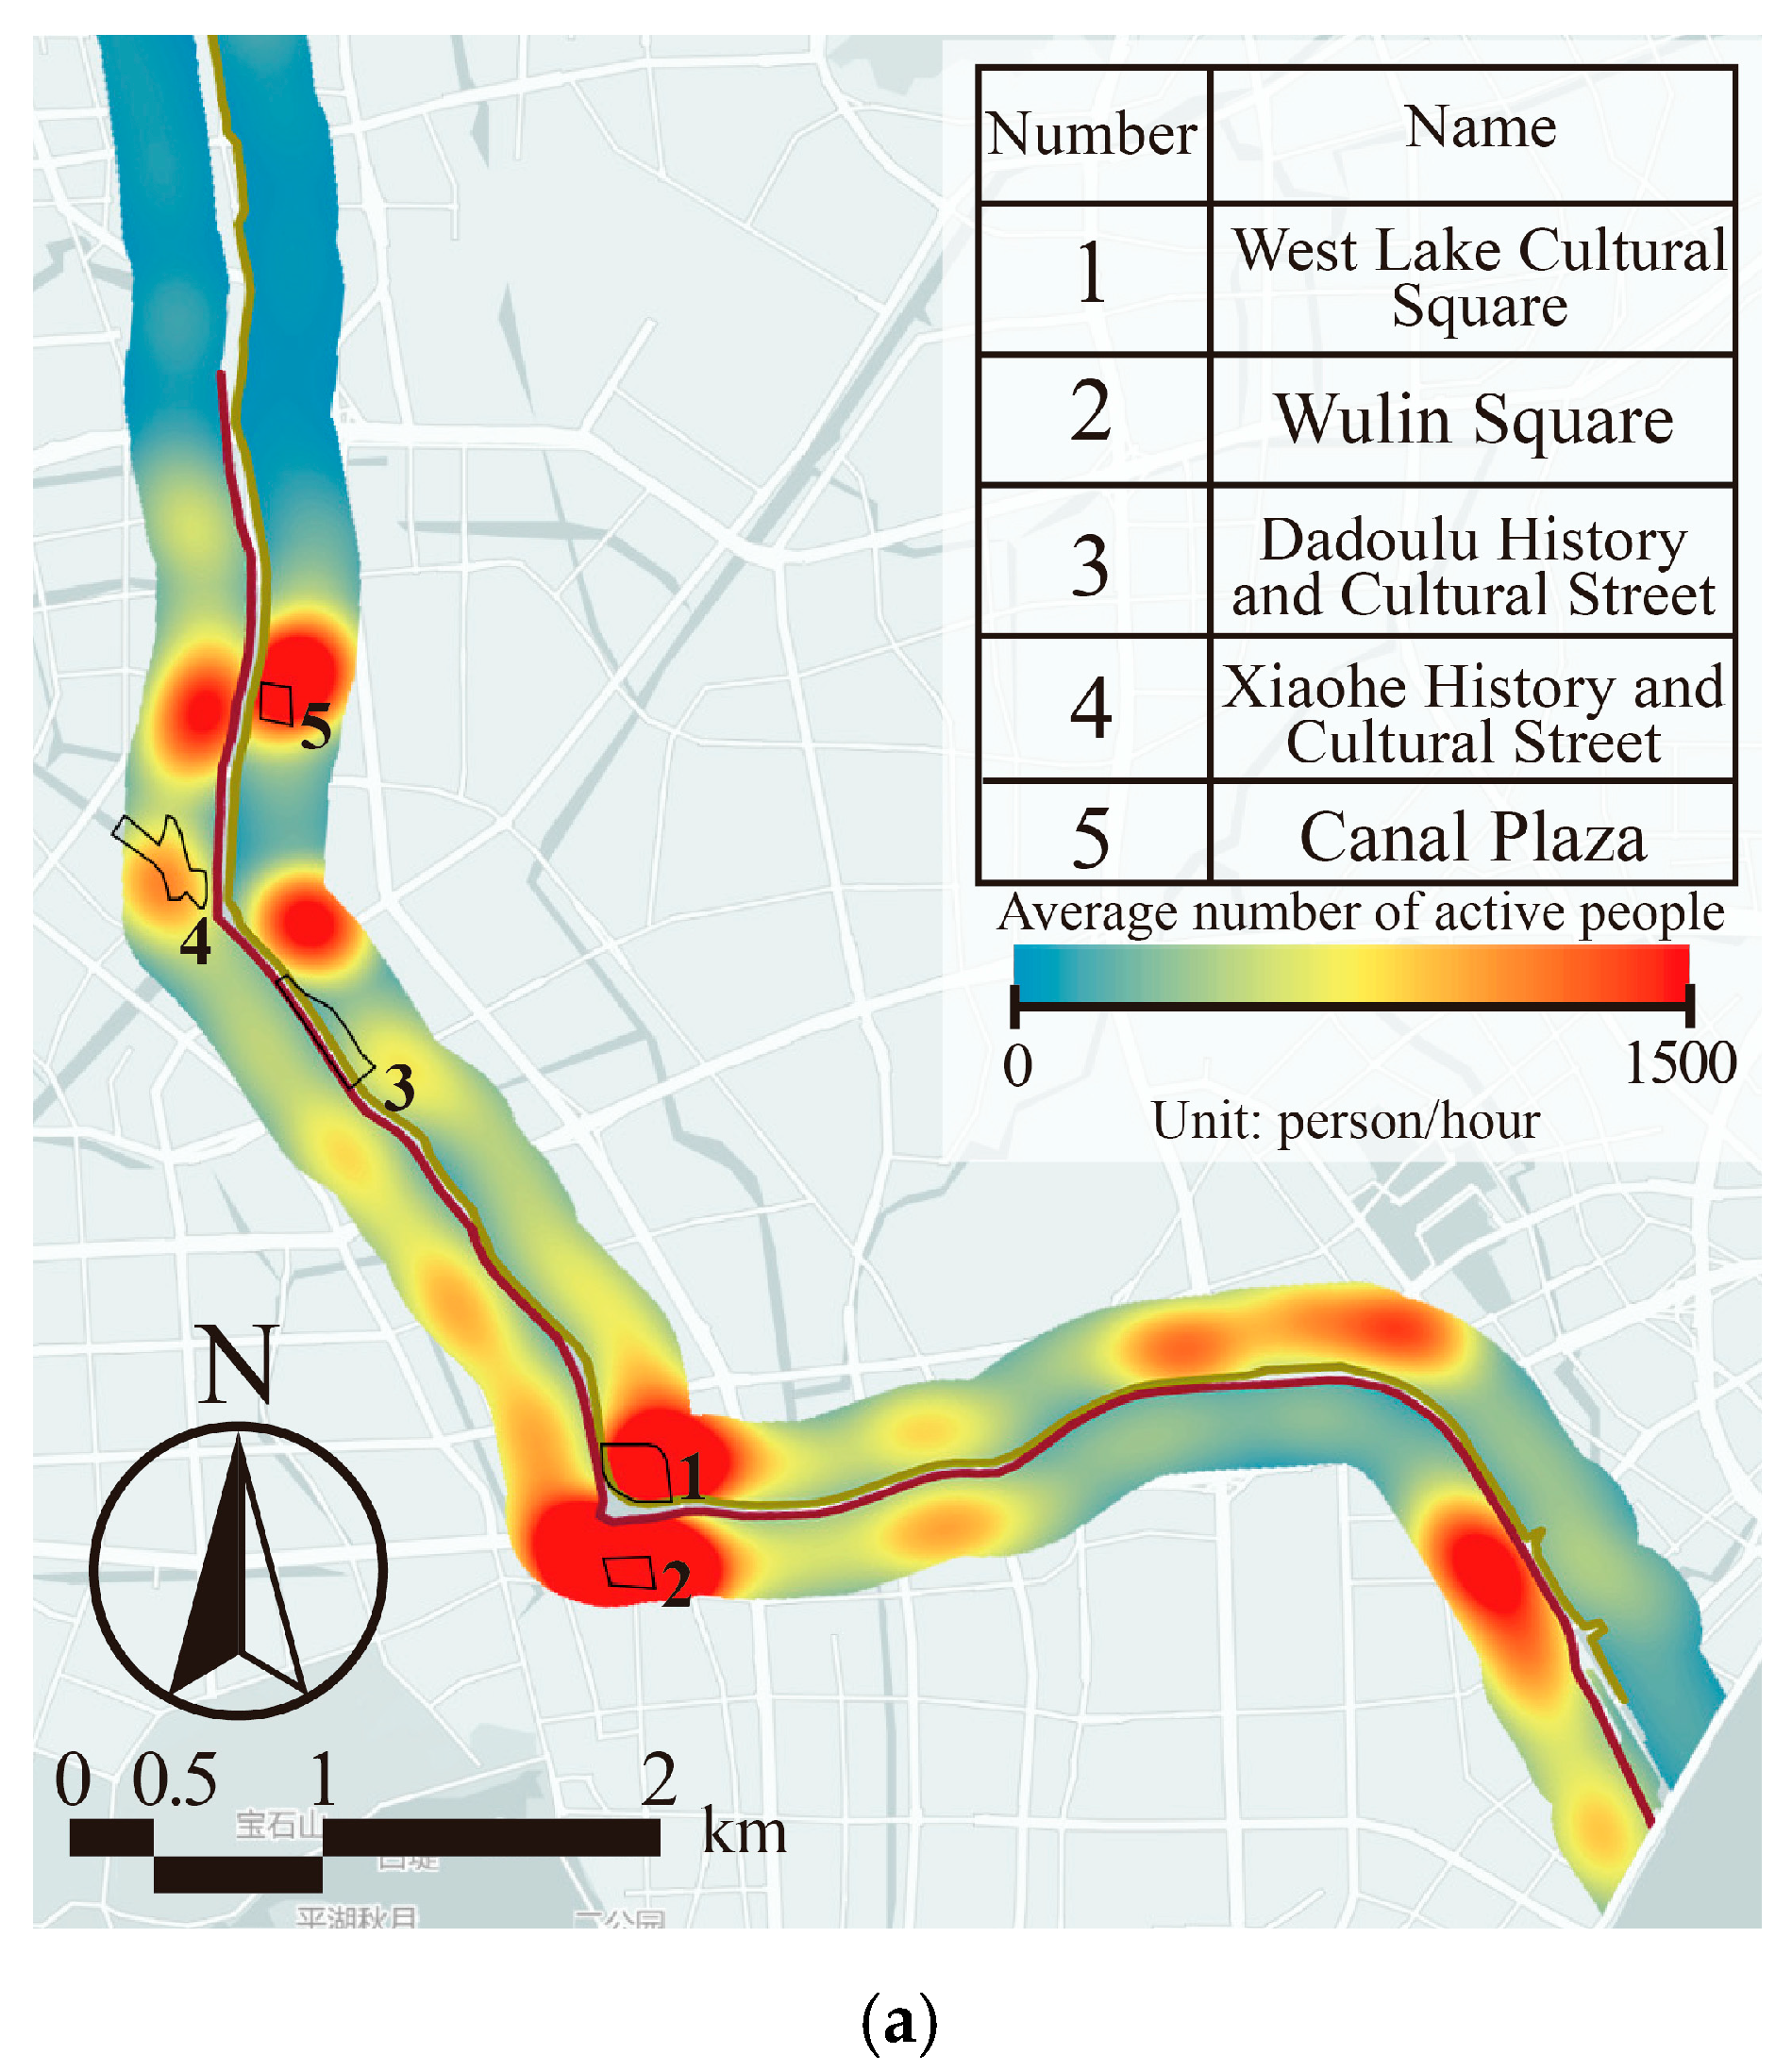
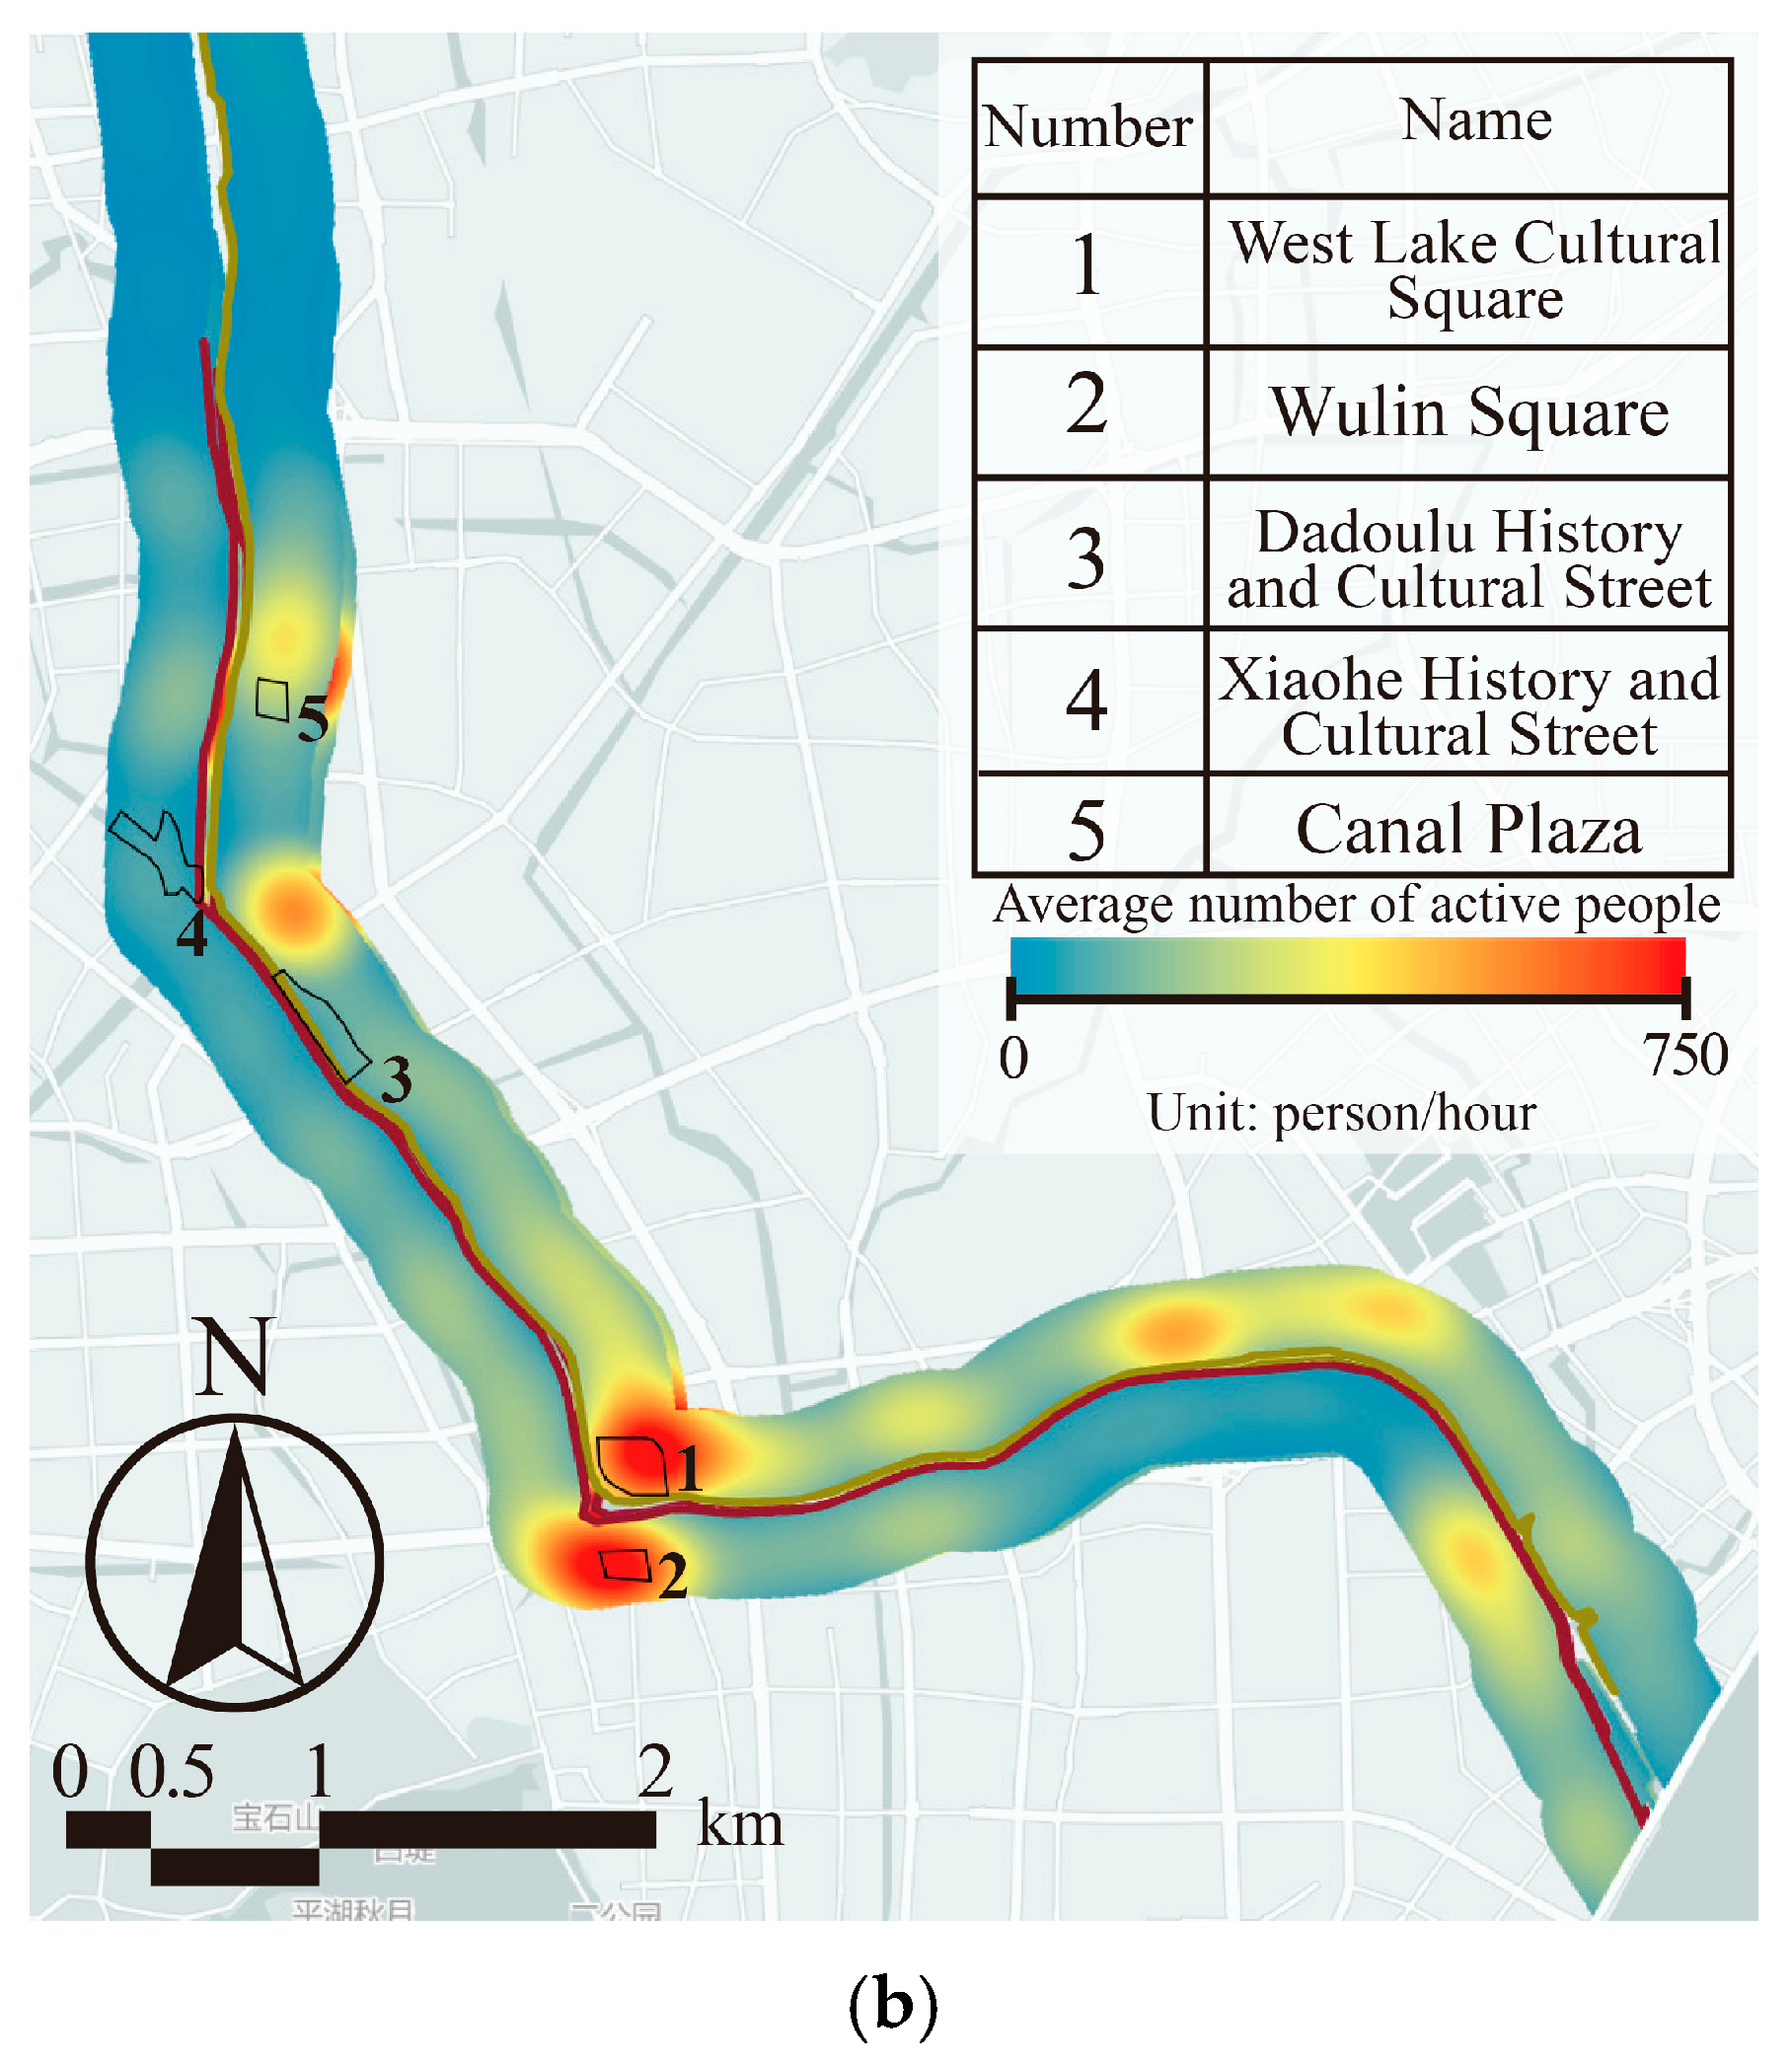
The spatiotemporal characteristics of recreational vitality during holidays and workdays along the Beijing–Hangzhou Grand Canal (Hangzhou section) are illustrated in Figure 4a and Figure 4b, respectively. Analytical findings reveal that its spatiotemporal distribution exhibits significant heterogeneity, with detailed elaboration provided below:
(1)
Spatial Pattern Characteristics: During both holidays and workdays, spatially, the recreational vitality in the study area exhibits prominent linear agglomeration patterns along the canal corridor, consistently conforming to the spatial gradient differentiation rule of “lower in the east and higher in the west, lower in the north and higher in the south”. High-vitality agglomeration zones are primarily distributed in urban core areas characterized by high population density, vibrant commercial activities, high traffic accessibility, and well-developed supporting facilities, specifically including Canal Square, Wulin Square, West Lake Culture Square, and other similar areas. In contrast, peripheral sections distant from the urban core with relatively low development levels remain at a persistently low vitality level throughout the entire observation period.
(2)
Temporal Evolution Characteristics: The overall recreational vitality of the canal waterfront space is significantly higher on holidays than on workdays, with marked disparities in the spatial coverage of high-vitality zones. During holidays, the elevated vitality in core commercial zones (e.g., Canal Square and Wulin Square) is not only further intensified but also gradually extends to representative historical and cultural blocks (including Dadou Road and Xiaohe Historical and Cultural Block), thereby forming contiguous high-intensity vitality clusters. By contrast, the spatial distribution of recreational vitality on workdays is more concentrated, with high-intensity activity hotspots primarily restricted to the central commercial functional zone of the urban core.
(3)
Temporal Stability Characteristics: The waterfront spaces within commercial functional sections along the Beijing–Hangzhou Grand Canal (Hangzhou section) maintain consistently high daily average activity intensity and recreational vitality density throughout the entire observation period, serving as the most stable core vitality nodes across the urban area. Recreational vitality in these sections displays the least temporal fluctuation and the strongest temporal stability, and is resilient to periodic holiday–workday temporal variations. This stability is further corroborated by inter-segment comparisons of vitality dynamics: recreational vitality drops sharply in non-core sections on workdays, whereas only a modest, gradual reduction is detected in commercial functional sections.
Meanwhile, during holidays, the recreational vitality in commercial and business districts demonstrates a far more pronounced “amplification and warming effect” relative to non-holiday periods.
Figure 4. Spatial distribution of recreational vitality in the waterfront space of the Beijing–Hangzhou Grand Canal (Hangzhou Section). (a) Spatial distribution of recreational vitality in the waterfront space of the Beijing–Hangzhou Grand Canal (Hangzhou Section) on holidays. (b) Spatial distribution of recreational vitality in the waterfront space of the Beijing–Hangzhou Grand Canal (Hangzhou Section) on workdays.
Buildings 16 01774 g004aBuildings 16 01774 g004b

4.2. Correlation Analysis Between Waterfront Landscape Characteristic Attributes and Recreational Vitality

The results of the Shapiro–Wilk normality test for waterfront landscape characteristic indicators are detailed in Table A1. Based on the overall data test results, Spearman’s correlation analysis was employed to explore the quantitative relationship between the waterfront landscape characteristic attributes established in this study and recreational vitality in the Beijing–Hangzhou Grand Canal (Hangzhou section). The correlation analysis results for the holiday and workday sample groups are presented in Table 4 and Table 5, respectively.
Based on the aforementioned Spearman’s correlation analysis results, this study systematically clarifies the correlations between the landscape characteristic attributes and recreational vitality in the waterfront spaces of the Beijing–Hangzhou Grand Canal (Hangzhou section), with the specific correlations elaborated as follows:
(1)
Among all the landscape characteristic indicators included in this study, Sky View Factor (SVF), Visual Openness Index (VOI), Enclosure Interface View Factor (EIVF), Text Signage View Factor (TSVF), Hard Pavement View Factor (HPVF), and Natural Surface View Factor (NSVF) are identified as the six core driving indicators that exert statistically significant effects on recreational vitality.
(2)
Core landscape characteristics related to spatial enclosure (including Sky View Factor (SVF), Enclosure Interface View Factor (EIVF), High-rise Green View Factor (HGVF), and Visual Openness Index (VOI)) all exhibit stable and statistically significant correlations with recreational vitality. By contrast, no statistically significant correlation between recreational vitality and most indicators related to landscape visual features and service facility allocation was observed.
(3)
The Enclosure Interface View Factor (EIVF) exhibits a significant negative correlation with recreational vitality. This finding indicates that the visual accessibility of historical and cultural landscapes in waterfront areas is closely associated with the allocation of public service facilities and the rational layout of the built environment, which in turn affects the efficiency of recreational activities and the overall experience of users.
(4)
Both the Sky View Factor (SVF) and Visual Openness Index (VOI) demonstrate a significant negative correlation with recreational vitality. One plausible mechanism underlying this correlation is the impairment of thermal comfort induced by excessive solar radiation: waterfront areas characterized by high visual openness and insufficient shading are more prone to direct solar radiation exposure, which elevates both surface and ambient air temperatures. This thermal environment degradation subsequently reduces users’ perceived thermal comfort, thereby discouraging users from prolonged stays in such areas.
Meanwhile, the associations between several landscape characteristic attributes of the Beijing–Hangzhou Grand Canal (Hangzhou section) and recreational vitality present pronounced heterogeneous patterns between holidays and workdays, as elaborated below:
(1)
Compared with holidays, the negative associations between Hard Pavement View Factor (HPVF), Text Signage View Factor (TSVF) and recreational vitality are more pronounced and statistically significant on workdays. A potential mechanism underlying this observation is that the primary user groups in waterfront spaces on workdays are efficiency-driven commuters and transient passersby. Hard-paved areas without adequate shading intensify exposure to solar thermal radiation and substantially reduce users’ perceived thermal comfort. For commuters, such spaces merely function as quick-passage corridors that are unsuitable for lingering or recreational engagement, thereby strengthening the negative relationships between these two landscape indicators and recreational vitality.
(2)
Four core indicators—Low-rise Green View Factor (LGVF), Vertical Spatial Change Rate (VSCR), Cross River Connectivity (CRC), and Landscape Element Richness (LER)—exhibit heterogeneous effects on recreational vitality between holidays and workdays. A plausible mechanism underlying this phenomenon is the divergence in dominant user behaviors and activity patterns across different time periods. Specifically, holiday visitors are primarily motivated by leisure-oriented demands, with a focus on sensory experiences and landscape appreciation, thus showing a stronger correlation with recreational vitality. In contrast, workday users are mainly efficiency-driven commuters, whose core needs center on rapid transit and basic service access rather than leisure engagement. Among these indicators, Low-rise Green View Factor (LGVF) and Landscape Element Richness (LER) are significantly positively correlated with recreational vitality, while Vertical Spatial Change Rate (VSCR) and Cross River Connectivity (CRC) display relatively weak correlations with vitality levels. This suggests that the optimization of low-rise vegetation coverage and landscape diversity plays a more critical role in enhancing waterfront recreational vitality than traffic accessibility and connectivity.

4.3. Non-Linear Regression Analysis of Key Landscape Characteristic Attributes on Recreational Vitality Across Functional Zoning Types

Based on the aforementioned Spearman’s correlation analysis results, this study identified Sky View Factor (SVF), High-rise Green View Factor (HGVF), Hard Pavement View Factor (HPVF), Enclosure Interface View Factor (EIVF), Text Signage View Factor (TSVF), and Visual Openness Index (VOI) as the core landscape characteristic indicators that influence recreational vitality. The screening criteria adopted were statistical significance (p < 0.05) and the absolute value of the correlation coefficients. On this basis, the nonlinear regression analysis method was further employed to quantify the nonlinear quantitative response relationship between the aforementioned core landscape characteristic indicators and recreational vitality.
The functional differentiation of waterfront spaces in the Beijing–Hangzhou Grand Canal (Hangzhou section) results in significant discrepancies in user demographic structure, dominant activity patterns, and supporting facility configuration across different functional zones. Accordingly, this study adopted a zonal modeling approach and performed nonlinear regression analyses separately for the commercial functional zones, the residential functional zones, and the ecological conservation zones. Five mainstream nonlinear fitting models were systematically verified, including the quadratic function, the cubic function, the exponential function, the power function, and the sigmoid function. With the maximum adjusted coefficient of determination (R2) serving as the core evaluation criterion, the model with the optimal fitting performance was selected as the final regression model, to accurately quantify the differentiated response relationships between core landscape characteristic attributes and recreational vitality across different functional types.

4.3.1. Non-Linear Regression Analysis for the Commercial Functional Zone

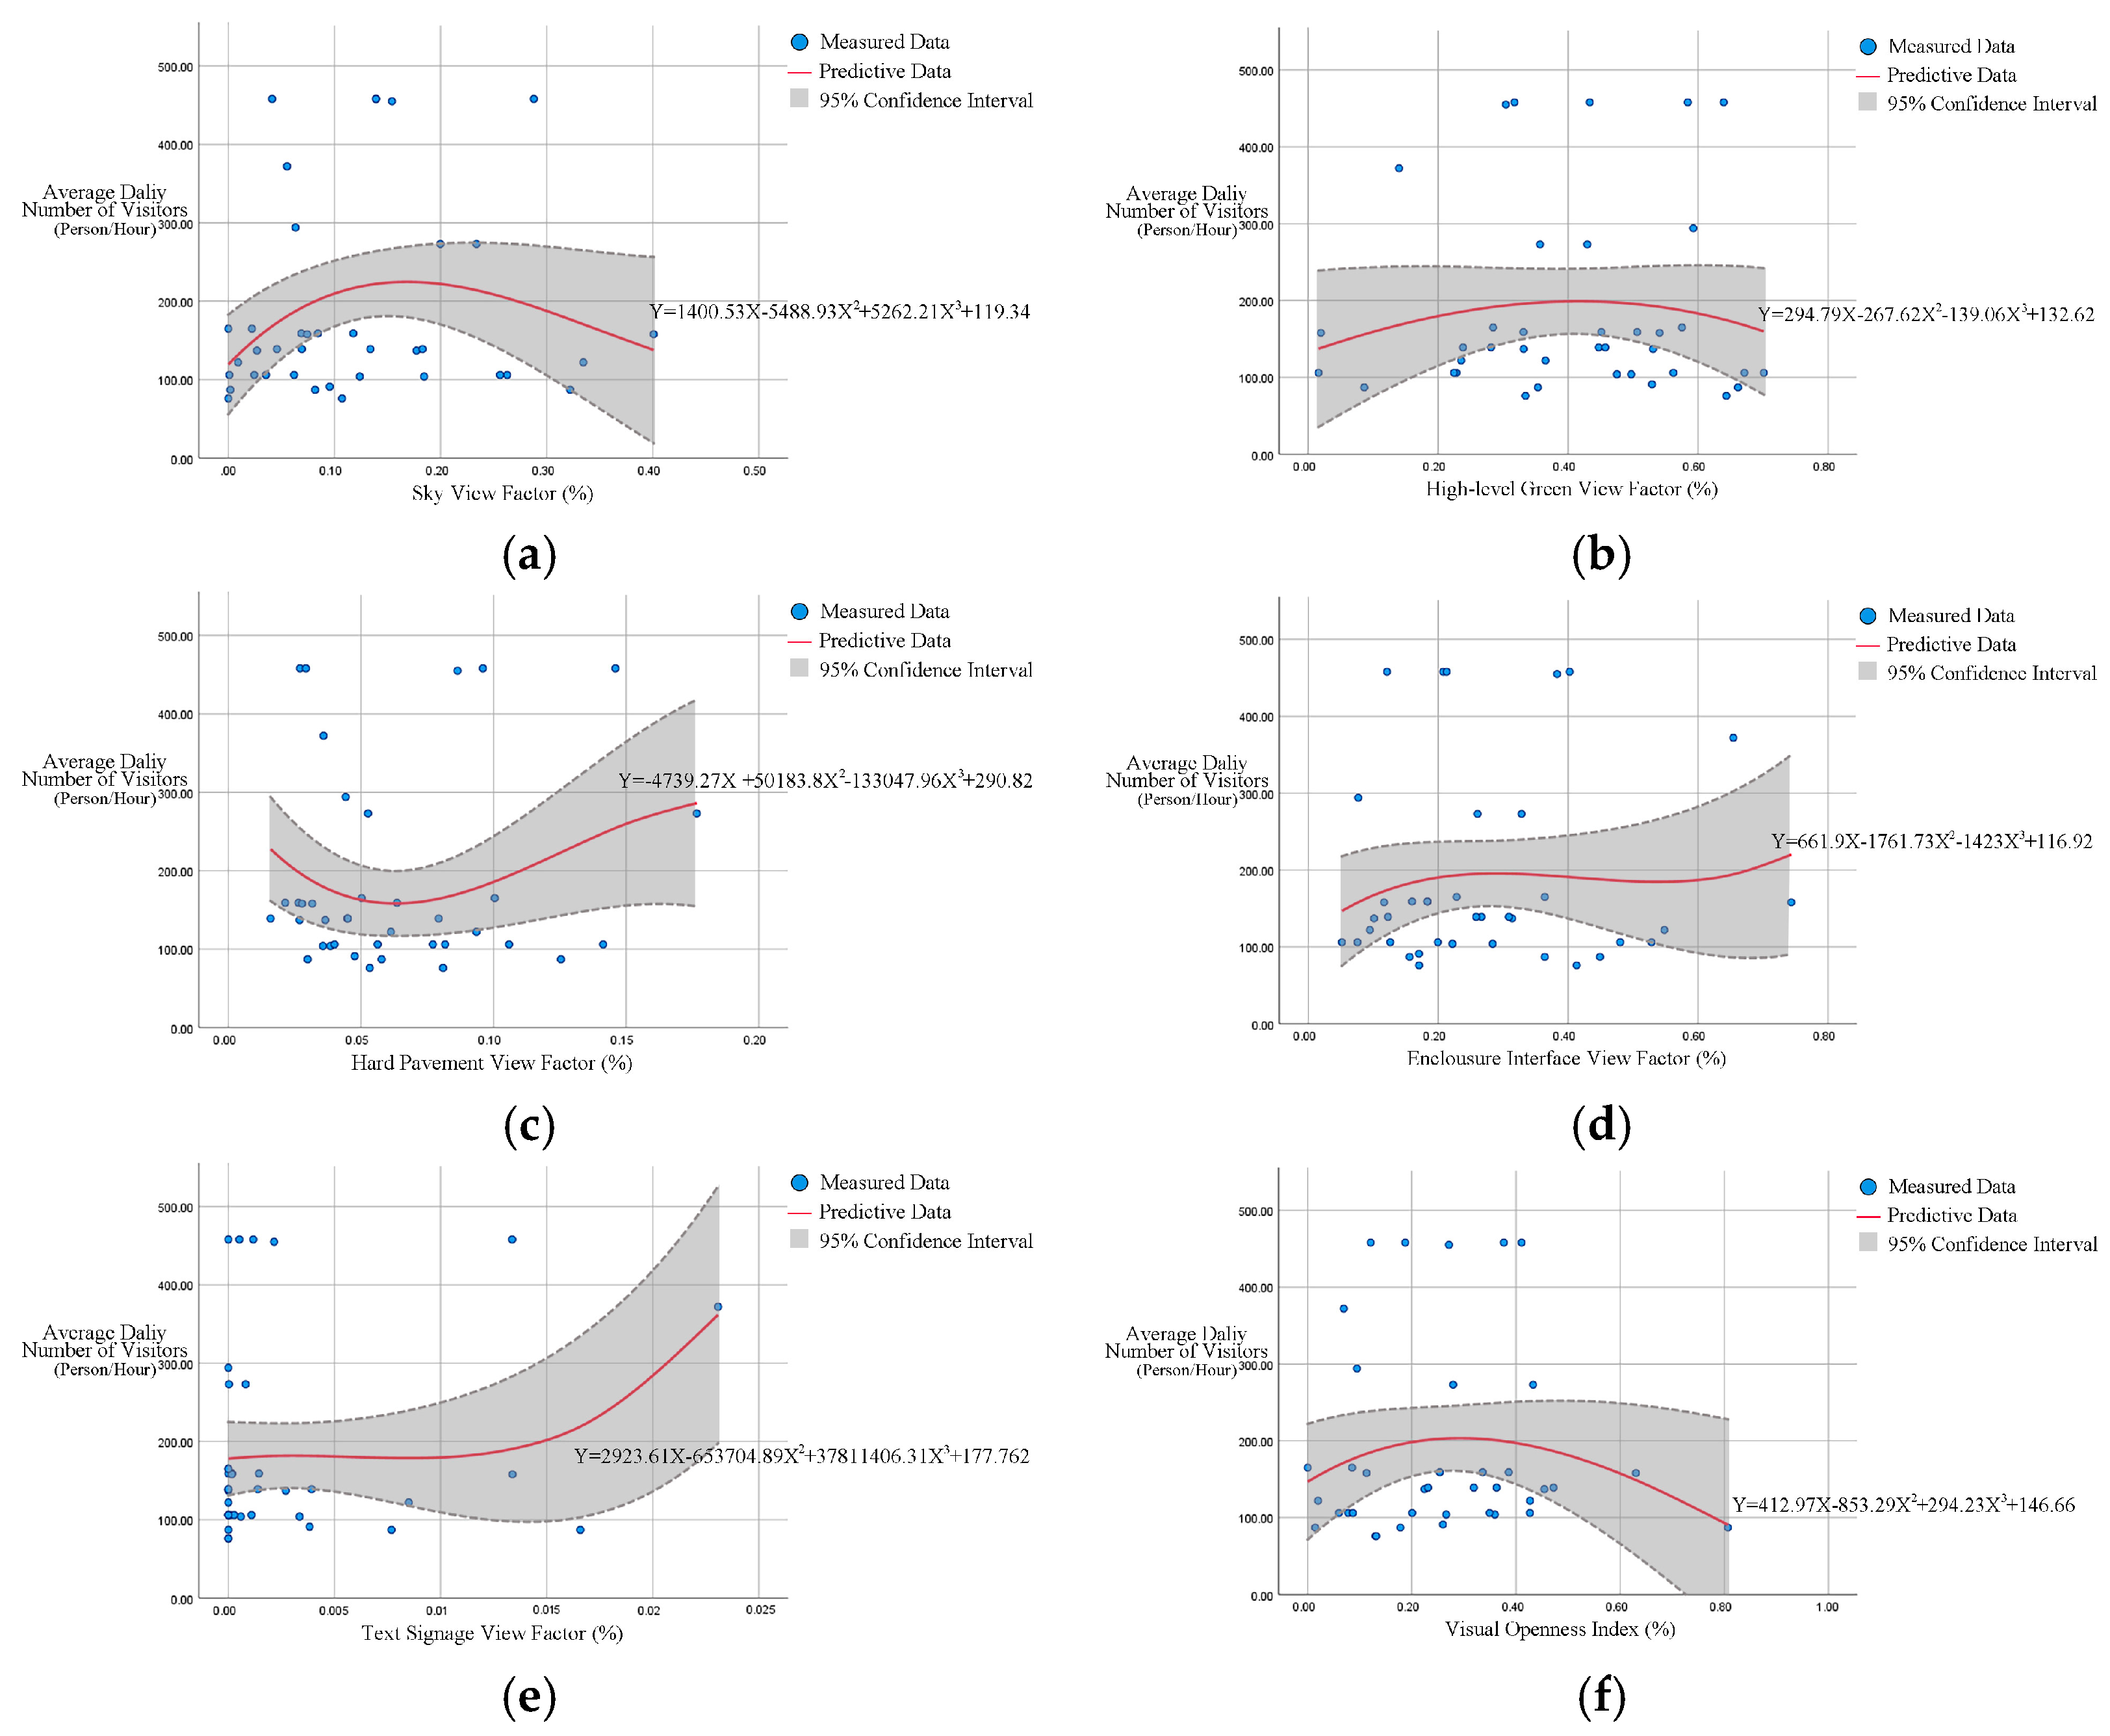
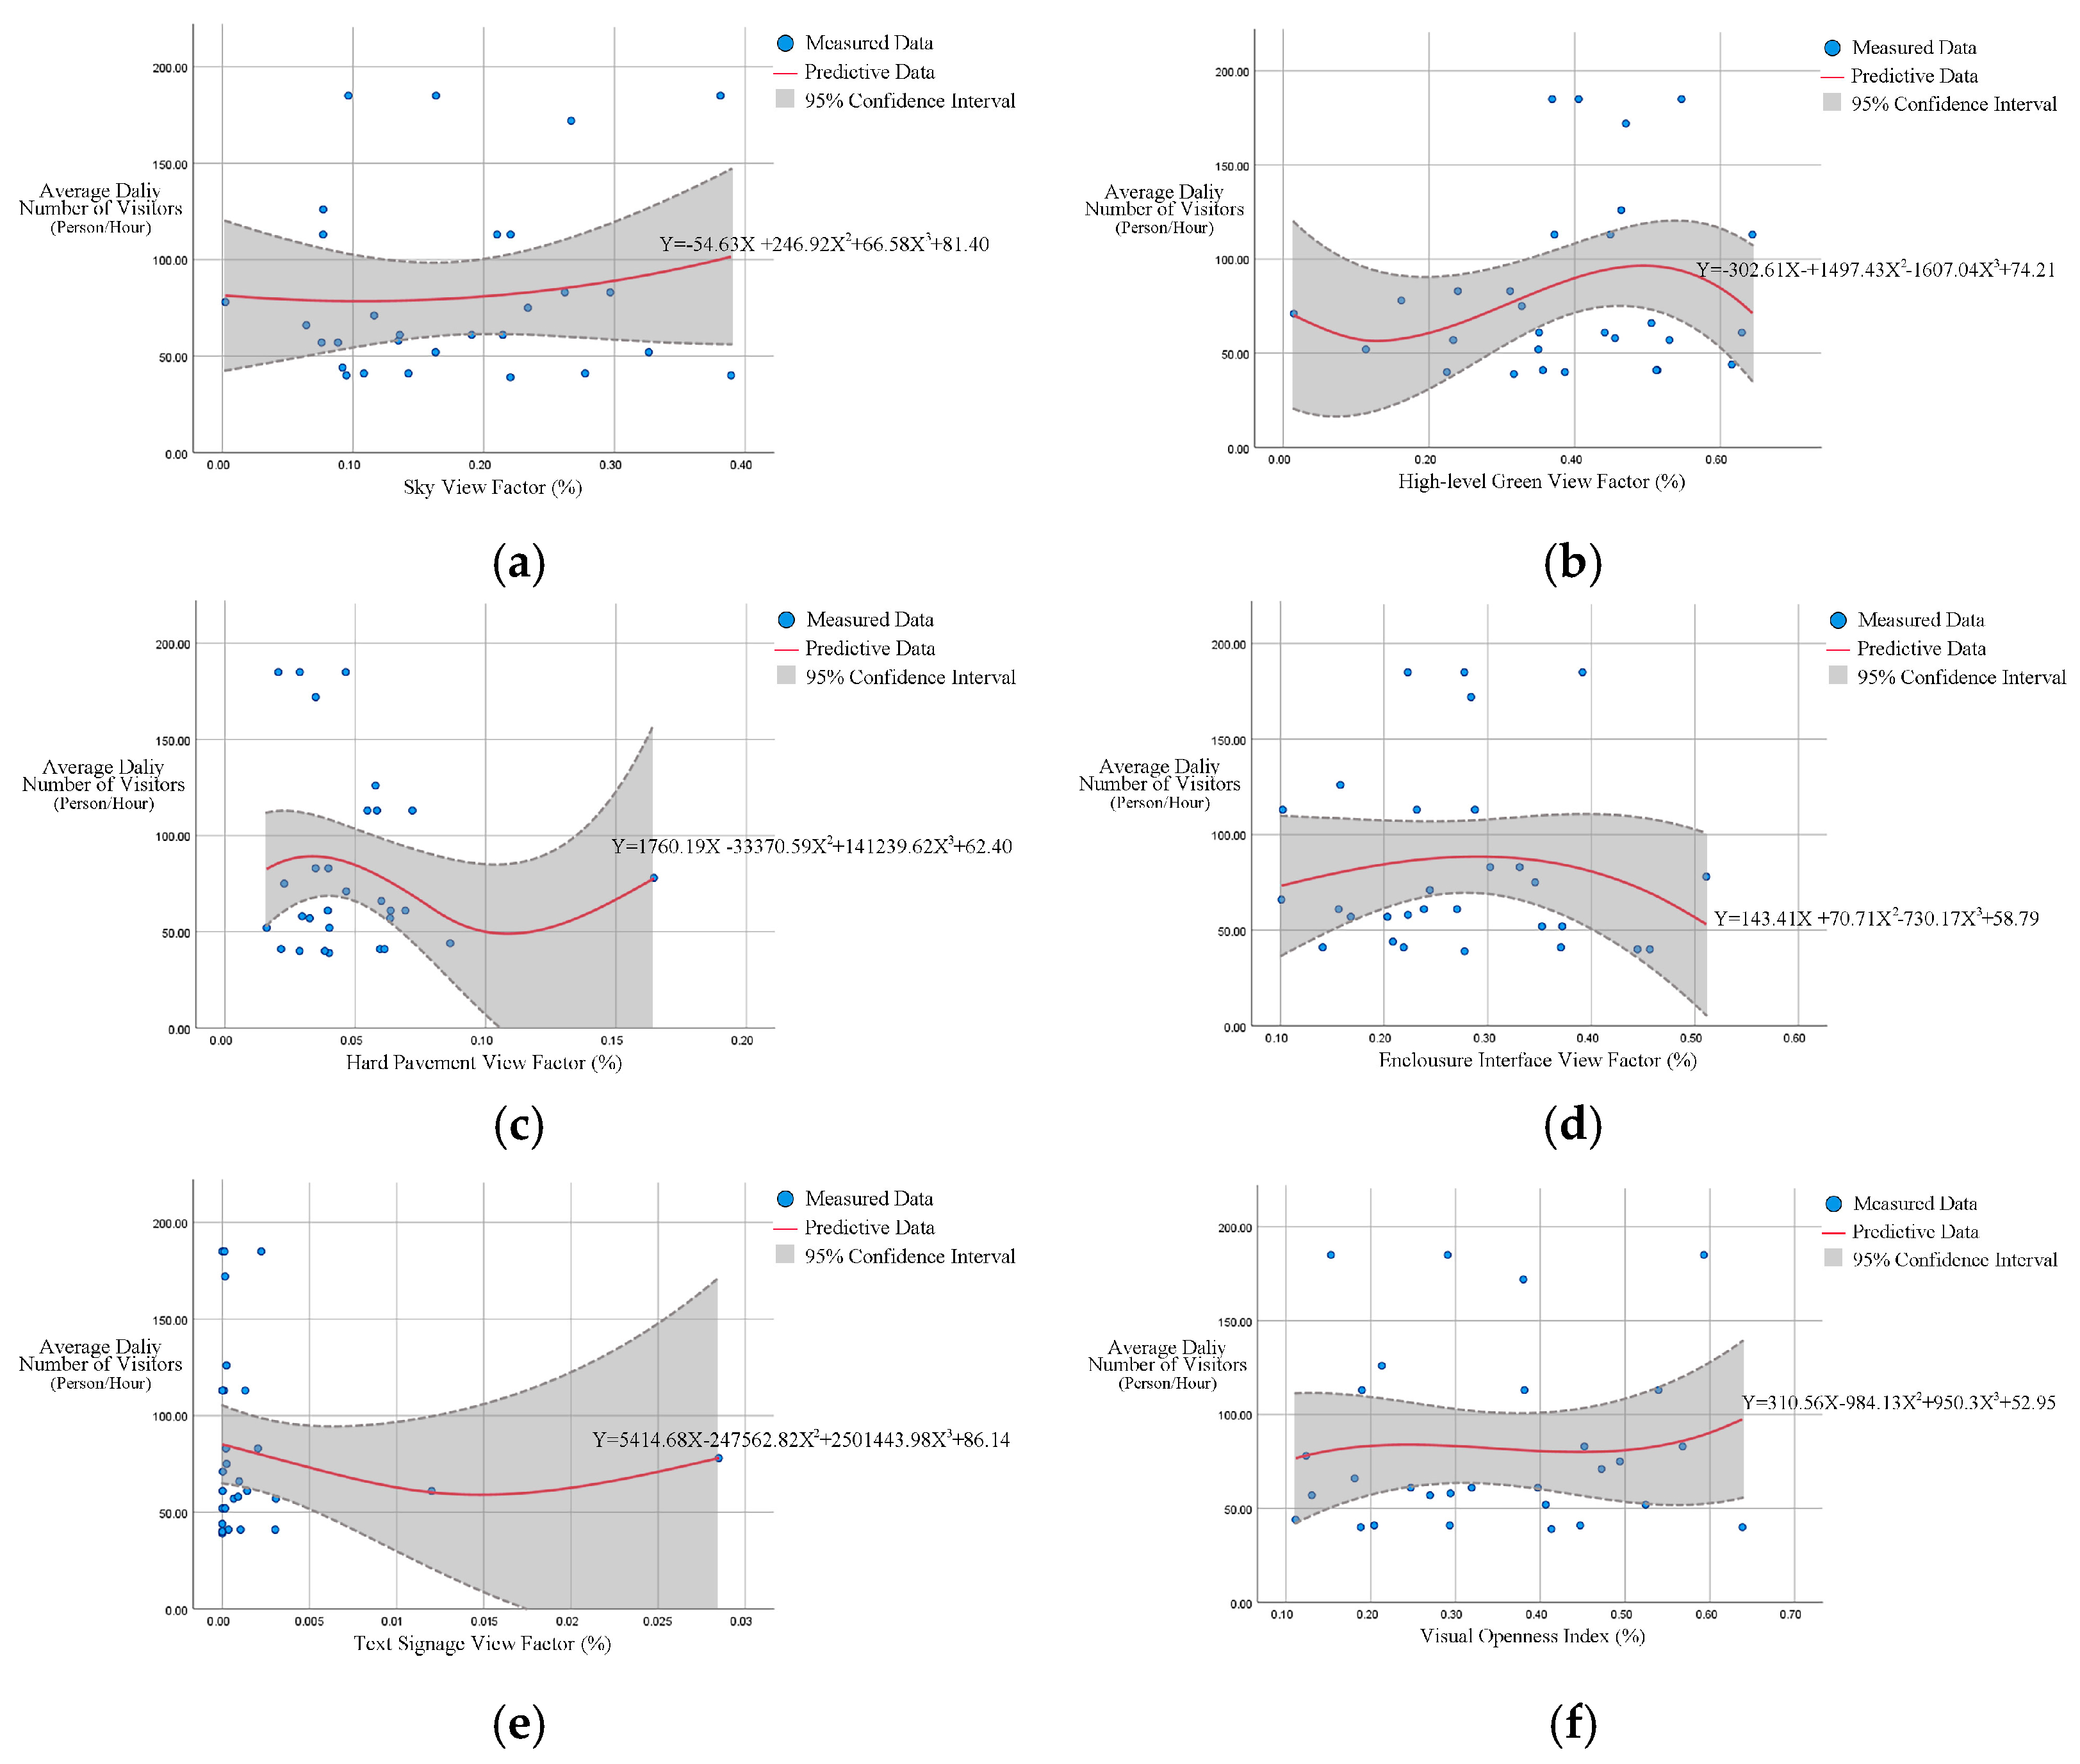
Within the waterfront public spaces of designated commercial functional zones, the optimal nonlinear fitting curves corresponding to the relationships between core landscape attributes and recreational vitality are illustrated in Figure 5.
The results from nonlinear regression analysis systematically clarify the nonlinear quantitative response relationships between core landscape driving factors and recreational vitality in commercial functional zones, with the specific relationships elaborated as follows:
(1)
Both Sky View Factor (SVF) and Visual Openness Index (VOI) demonstrate a significant unimodal inverted U-shaped nonlinear correlation with recreational vitality, indicating the existence of an optimal spatial openness interval. Within this interval, spatial openness effectively enhances the visibility of commercial facades and the clarity of place identity. Once exceeding the critical threshold, excessive openness leads to inadequate shading, blurred spatial boundaries, and loss of place sense, thereby significantly reducing users’ dwell time and consumption willingness.
(2)
The Enclosure Interface View Factor (EIVF) demonstrates a weakly positive, increasing nonlinear correlation with recreational vitality, indicating that the enhancement of recreational vitality in commercial waterfront spaces relies on continuous, well-defined street wall interfaces. Such interfaces not only cultivate a consumption environment featuring a strong sense of security and territoriality, but also promote pedestrian agglomeration through the spatial enclosure effect, thereby enhancing the immersive commercial experience.
(3)
When the High-rise Green View Factor (HGVF) surpasses the critical threshold of 0.416, its impact on recreational vitality undergoes a directional reversal. This finding indicates that greening design strategies in commercial waterfront spaces ought not to blindly pursue a high green view index; instead, the compatibility between greening configurations and commercial display functions must be comprehensively considered to prevent excessive shading of commercial signs and building facades by upper-layer arbor vegetation.
(4)
The Text Signage View Factor (TSVF) exhibits a significant positive linear correlation with recreational vitality, confirming the fundamental role of spatial wayfinding systems in commercial waterfront spaces. A well-defined, legible and hierarchically structured signage system effectively enhances spatial legibility and accessibility, serving as a crucial driver to promote pedestrian flow conversion efficiency and improve commercial operation efficiency.
(5)
The Hard Pavement View Factor (HPVF) exhibits a significant U-shaped nonlinear correlation with recreational vitality, indicating that commercial waterfront spaces require an optimal balance between hard pavement and green space allocation. An excessively low proportion of hard pavement cannot meet the requirements of high-intensity pedestrian flow intensity and commercial activity operation, whereas an excessively high proportion results in inadequate spatial ecological performance and diminished user comfort.

4.3.2. Non-Linear Regression Analysis for the Residential Functional Zone

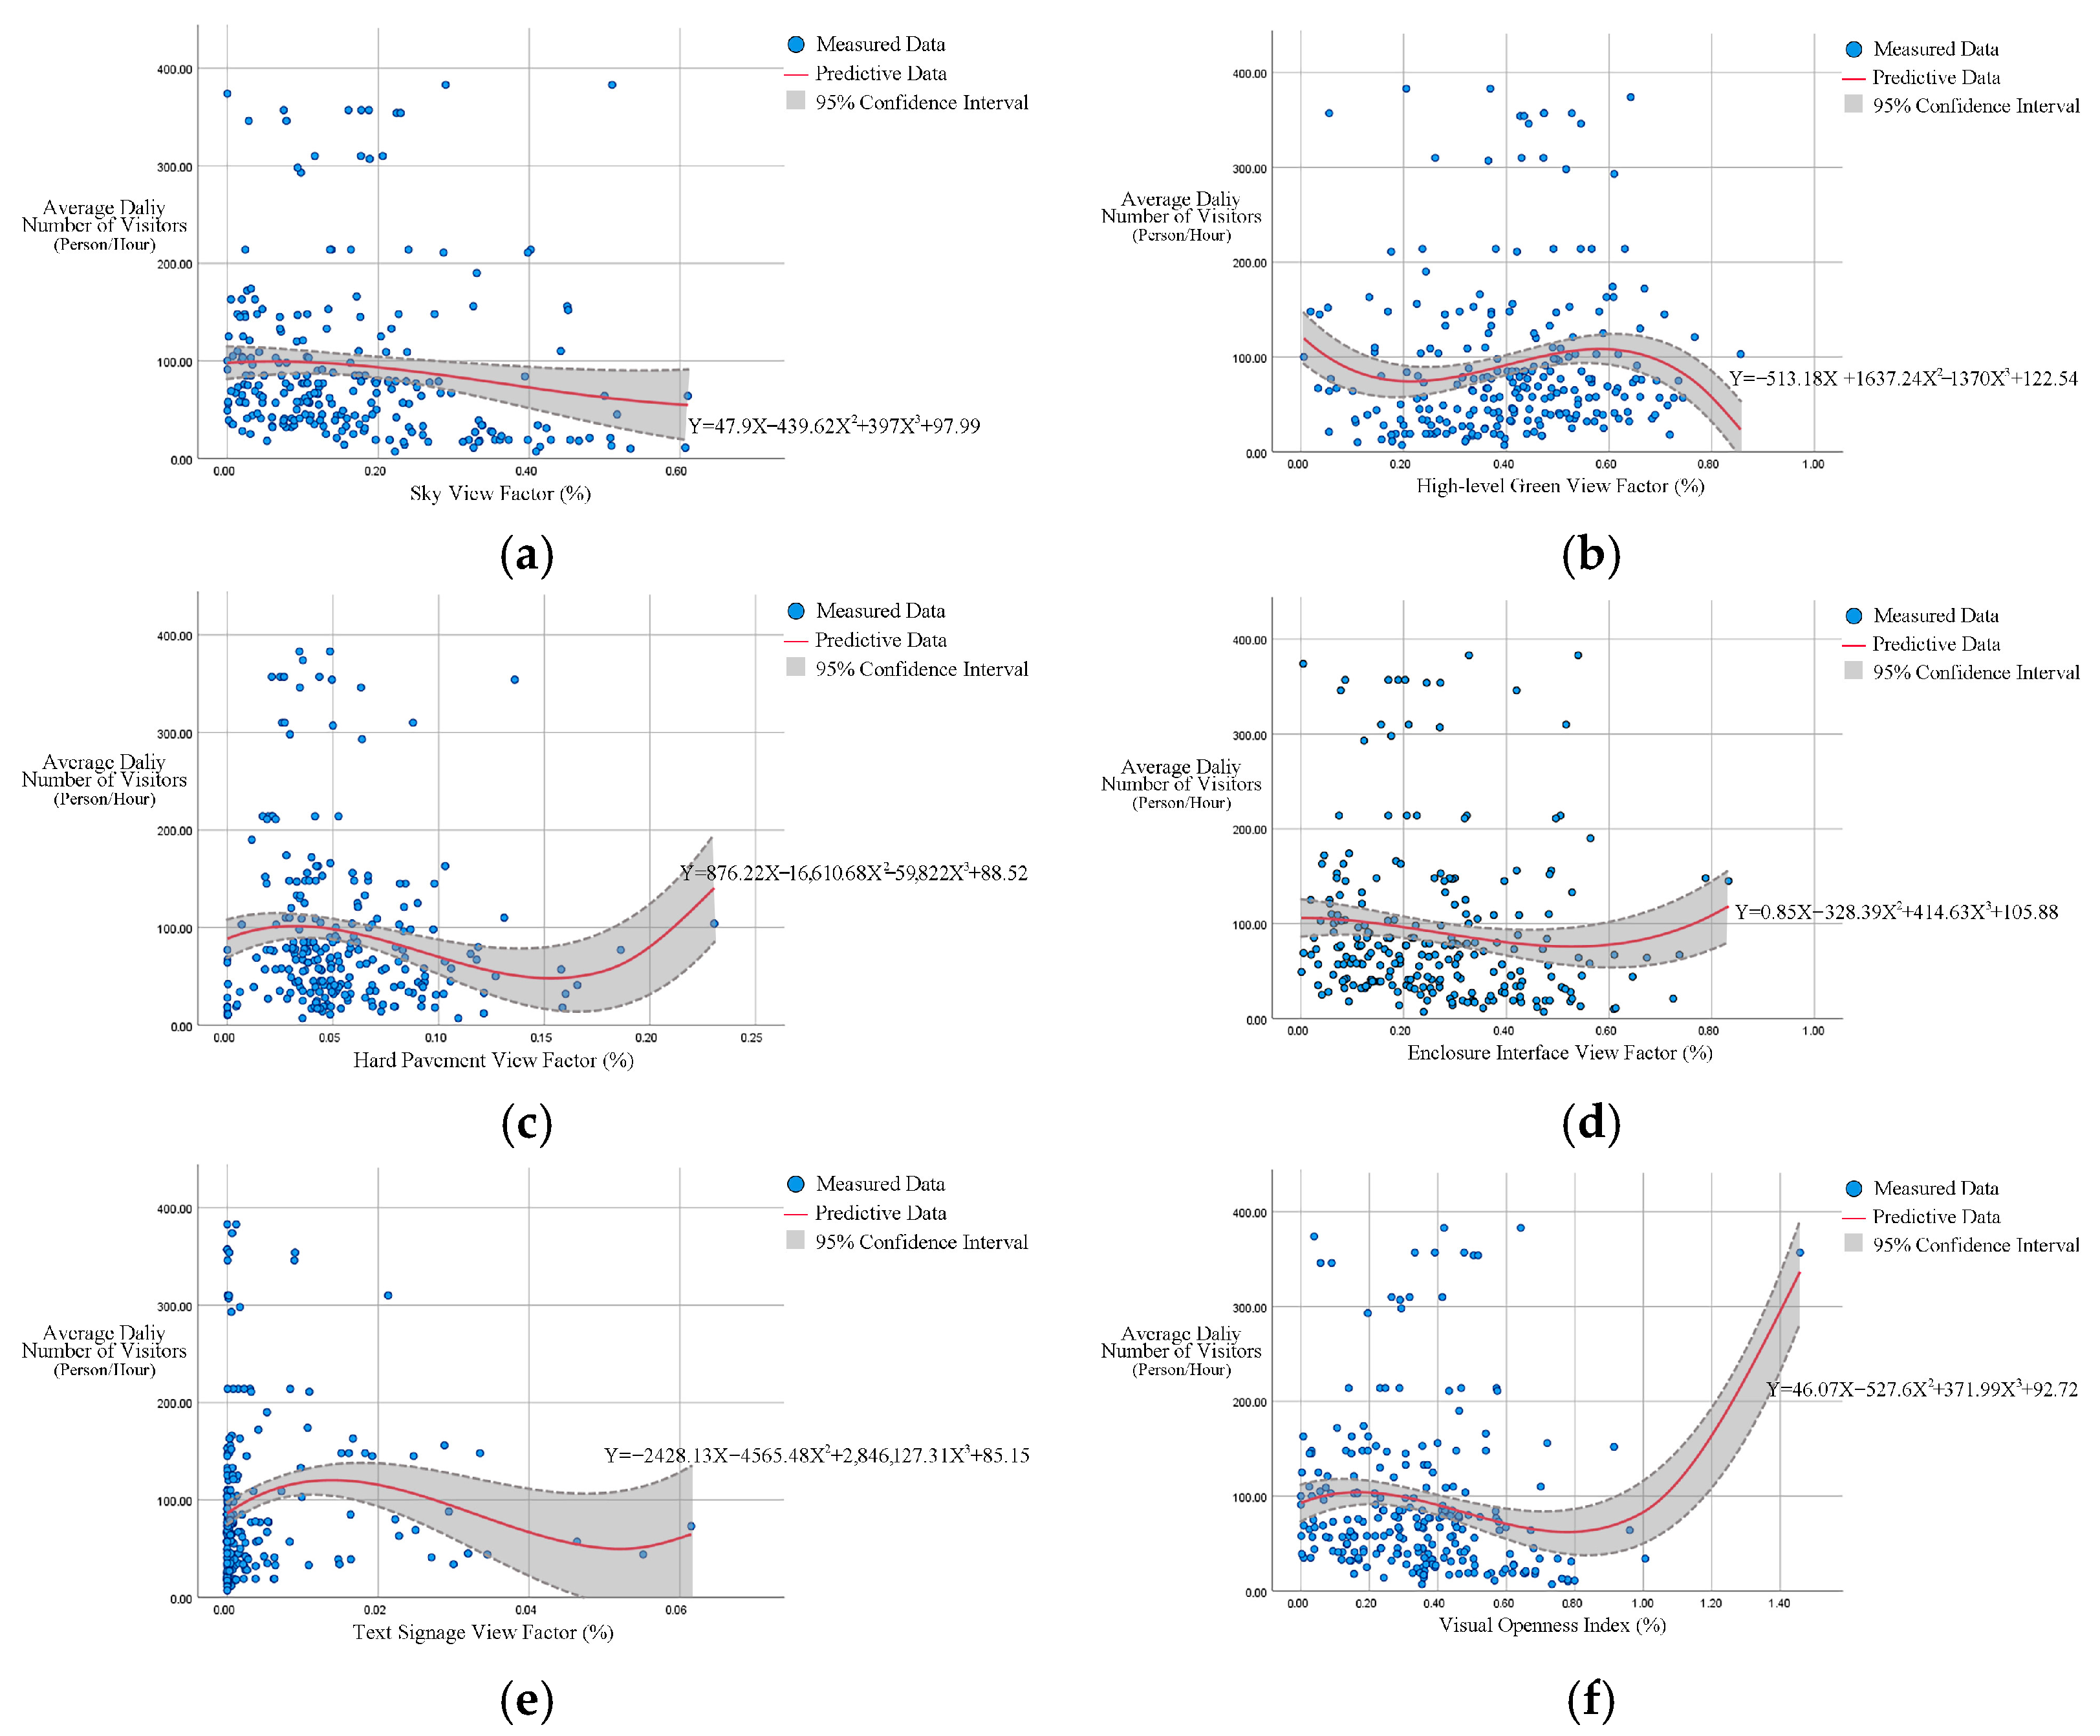
Within the waterfront public spaces of the residential functional zone, the optimal nonlinear fitting curves between core landscape characteristic indicators and recreational vitality are depicted in Figure 6.
Results from nonlinear regression analyses systematically reveal the nonlinear quantitative response relationships between core landscape driving factors and recreational vitality in residential functional zones, as elaborated in the subsequent sections.
(1)
The Sky View Factor (SVF) exhibits a statistically significant positive nonlinear correlation with recreational vitality, which can effectively enhance residents’ natural lighting experience and their perception of unobstructed waterfront vistas, thereby boosting their willingness to participate in daily recreational activities.
(2)
The Enclosure Interface View Factor (EIVF) exhibits a statistically significant unimodal inverted U-shaped nonlinear correlation with recreational vitality: specifically, when the EIVF value is below the critical threshold, excessive spatial openness is prone to impair the sense of place and territoriality; when the EIVF value exceeds the critical threshold, excessive spatial enclosure induces a strong sense of spatial oppression and visual constraint among users.
(3)
The nonlinear response relationships between the Hard Pavement View Factor (HPVF) and High-rise Green View Factor (HGVF) with recreational vitality exhibit a statistically significant trade-off and complementary relationship. This finding profoundly reflects the inherent planning contradictions and tensions between artificial construction demands and natural ecological supply under the constraints of high-density urban residential contexts, and highlights the core planning principle of synergistic integration rather than antagonistic confrontation between artificial activity spaces and natural ecological landscapes.
(4)
The Text Signage View Factor (TSVF) exhibits a statistically significant U-shaped nonlinear response relationship with recreational vitality, which is characterized by a statistically validated trend of initial decrease followed by an upward trajectory. This finding reveals two optimal design strategies for signage systems in residential waterfront spaces: one is to construct a quiet, natural ecological environment with extremely low information density to cater to residents’ demands for leisure, relaxation, and natural healing; the other is to foster a robust community culture and interactive atmosphere with high information density (e.g., community bulletin boards, cultural display panels, and activity guide signs) to meet residents’ needs for community participation and social interaction.

4.3.3. Non-Linear Regression Analysis for the Ecological Conservation Zone

Within the waterfront public spaces of the ecological conservation zones, the optimal nonlinear fitting curves between core landscape characteristic indicators and recreational vitality are depicted in Figure 7.
The statistically validated findings of the nonlinear regression analysis systematically reveal the statistically significant nonlinear quantitative response patterns between the core landscape driving factors and recreational vitality within ecological conservation zones, as elaborated in the following sections.
(1)
The Sky View Factor (SVF) displays a decreasing nonlinear negative correlation, whereas the Visual Openness Index (VOI) exhibits a characteristic unimodal U-shaped nonlinear correlation. This finding implies that in ecological conservation zones, fully open and unshaded spaces possess relatively low recreational attractiveness, whereas the moderate and sufficient canopy coverage established by native mature vegetation can substantially enhance thermal comfort conditions, thereby serving as the core driving factor for boosting the recreational vitality of ecological zones.
(2)
The Hard Pavement View Factor (HPVF) and High-level Green View Factor (HGVF) demonstrate a distinct yet complementary relationship characterized by significant dynamic trade-offs. This indicates that large-scale interventions involving hardscape renovation and intensified commercial development substantially degrade ecosystem integrity, which in turn undermines the area’s recreational attractiveness.
(3)
The Enclosure Interface View Factor (EIVF) initially registers low, fluctuating values before transitioning to a marked, positive nonlinear correlation. This pattern suggests that moderate spatial enclosure, shaped by natural landforms and native vegetation, fosters perceived tranquility and enhances environmental immersion, thereby supporting a high-quality natural recreational experience.
(4)
The Text Signage View Factor (TSVF) exerts a marginally positive effect at minimal levels but shifts to a suppressive influence upon exceeding a critical threshold. This result reinforces that the appeal of ecological conservation–oriented waterfront spaces stems primarily from their inherent natural attributes, whereas proliferating artificial signage detracts from the immersive natural ambiance.

4.4. Comparative Analysis Across Functional Zones: Functional Heterogeneity in Influence Mechanisms

Comparative analysis of nonlinear regressions across the three functional zones—commercial functional zone, residential functional zone, and ecological conservation zone—reveals that the influence of common landscape characteristic metrics on recreational vitality varies considerably contingent upon zone function, as detailed below:
(1)
Differences in the effects of spatial openness and enclosure on recreational vitality across different functional types.
The core landscape indicators characterizing the openness and enclosure of waterfront spaces—Sky View Factor (SVF), Enclosure Interface View Factor (EIVF), and Visual Openness Index (VOI)—exert influence mechanisms on recreational vitality that are essentially determined by the differentiated dominant functions of each functional zone. Among the three functional zones, the nonlinear response curves of the above indicators present distinct divergent characteristics: First, commercial functional zones take commercial display and consumer services as core demands, requiring a dynamic balance between the visibility of commercial presentations and the comfort of consumption experiences. This core trade-off relationship is quantitatively represented by the U-shaped nonlinear correlation between the Text Signage View Factor (TSVF) and recreational vitality. Second, the core function of residential functional zones is to support residents’ daily outdoor recreational activities. Therefore, SVF and VOI show stable positive nonlinear correlations with recreational vitality, while EIVF exhibits a significant inverted U-shaped nonlinear correlation with recreational vitality, which conforms to residents’ preference for daily recreational spaces with “moderate openness and balanced enclosure”. Third, ecological conservation zones prioritize the protection of natural background attributes. The U-shaped curve between VOI and recreational vitality reflects the dual preference of eco-recreational visitors for tranquil and secluded spaces featuring “low permeability and high enclosure” and open natural landscapes featuring “high permeability and low enclosure”.
The core landscape indicators of spatial openness and enclosure—Sky View Factor (SVF), Enclosure Interface View Factor (EIVF), and Visual Openness Index (VOI)—influence recreational vitality through distinct mechanisms shaped by each zone’s primary function. Their nonlinear response curves diverge markedly across zones, as follows: First, in commercial functional zones, where the priority lies in commercial display and consumer service, a fundamental trade-off exists between the visibility of retail offerings and on-site experiential comfort. This trade-off is quantitatively captured by the U-shaped nonlinear correlation between the Text Signage View Factor (TSVF) and vitality. Second, residential functional zones, oriented towards supporting daily outdoor recreation, show consistently positive nonlinear correlations for SVF and VOI with vitality. In contrast, EIVF exhibits a significant inverted U-shaped correlation, quantitatively reflecting a resident preference for spaces characterized by “moderate openness with balanced enclosure.” Third, for ecological conservation zones dedicated to preserving natural attributes, the U-shaped correlation between VOI and vitality reveals the dual preferences of eco-recreational visitors: a desire for both secluded, intimate settings (associated with low visual permeability and high enclosure) and open, expansive vistas (associated with high permeability and low enclosure).
(2)
Trade-offs between hard landscape and green space functions across different functional types.
The nonlinear quantitative response relationships of the Hard Pavement View Factor (HPVF) and High-level Green View Factor (HGVF) with recreational vitality encapsulate the interaction between directly accessible areas for human activity and visually perceived green ecological spaces that do not necessitate physical contact. Through nonlinear regression analysis, this study identifies two distinct response patterns for these core metrics. First, in commercial functional zones, the regression curve of HPVF against recreational vitality displays a U-shape, whereas that of HGVF follows an inverted U-shape. This suggests that commercial functional zones inherently require hard activity surfaces to support high-intensity pedestrian flows and outdoor commercial displays, while simultaneously depending on moderate vegetation to regulate visual perception and microclimate, thereby boosting recreational vitality. Second, in residential functional and ecological conservation zones, HPVF and HGVF demonstrate complex, dynamic trade-off relationships with recreational vitality. This pattern reflects the differentiated demands of various recreational activities—such as cooling off, children’s play, and fitness walking—for green coverage and hardscape configuration within these two functional zones.
(3)
Effects of the Text Signage View Factor (TSVF) on recreational vitality across different functional types.
The Text Signage View Factor (TSVF) manifests substantial variation in its effects across different functional zones. In commercial functional zones, signage functions primarily as a medium for commercial display, promotion, and information transmission, thereby yielding the most pronounced U-shaped relationship between TSVF and recreational vitality. In residential functional zones, signage performs a fundamental function in ensuring spatial legibility and wayfinding within community spaces. In ecological conservation zones, excessive artificial signage detracts from the integrity of natural landscapes and immersive experiences, which is antithetical to the core conservation objectives of such areas.

4.5. Summary of Research Findings

In summary, based on multi-source spatiotemporal data and quantitative analysis, this study reveals the spatiotemporal patterns and influence mechanisms between landscape characteristic attributes and recreational vitality in the waterfront public spaces of the Beijing–Hangzhou Grand Canal (Hangzhou section). The core findings are as follows:
(1)
Recreational vitality exhibits significant spatiotemporal heterogeneity. Spatially, it adheres to a distinct linear agglomeration pattern along the canal corridor, aligning with an overall spatial gradient of “lower in the east and higher in the west, and lower in the north and higher in the south”. Temporally, the overall vitality level is markedly higher on holidays than on workdays. Meanwhile, recreational vitality in the commercial functional zones of the Beijing–Hangzhou Grand Canal (Hangzhou section) remains consistently elevated across all observed periods with minimal fluctuation, demonstrating limited sensitivity to the holiday–workday cycle and thus exhibiting strong temporal stability.
(2)
Sky View Factor (SVF), High-level Green View Factor (HGVF), Hard Pavement View Factor (HPVF), Enclosure Interface View Factor (EIVF), Text Signage View Factor (TSVF), and Visual Openness Index (VOI) exert a significant influence on recreational vitality. Among these, SVF, EIVF, and VOI consistently show significant negative correlations with recreational vitality during both holiday and workday periods. Several other landscape characteristic attributes—including Low-level Green View Factor (LGVF), Vertical Spatial Change Rate (VSCR), Cross-River Connectivity (CRC), and Landscape Element Richness (LER)—exhibit considerable temporal heterogeneity in their associations with recreational vitality.
(3)
The influences of the Sky View Factor (SVF), the Enclosure Interface View Factor (EIVF), and the Visual Openness Index (VOI) on recreational vitality differ across functional zone types. A pronounced trade-off relationship characterizes the Hard Pavement View Factor (HPVF) and the High-level Green View Factor (HGVF) in commercial functional zones, whereas in residential living and ecological conservation zones, these factors display a complementary relationship. Meanwhile, the influence of the Text Signage View Factor (TSVF) on recreational vitality demonstrates functional specificity, being most pronounced in commercial functional zones and least evident in ecological conservation zones.

5. Discussion

5.1. Impacts of Key Landscape Characteristic Attributes on Recreational Vitality

Regarding the impacts of key landscape characteristic attributes on recreational vitality, the findings of this study align with relevant domestic and international research while also offering novel insights. First, the Sky View Factor (SVF), the Enclosure Interface View Factor (EIVF), and the Visual Openness Index (VOI) collectively describe the openness and enclosure of waterfront spaces, acting as core landscape attributes that influence recreational vitality, with their effects varying by functional zone. Existing studies have reached inconsistent conclusions on the relationship between SVF and recreational vitality: some suggest that “a higher SVF can boost recreational vitality” [32,48], while others argue that “SVF is mostly negatively correlated with recreational vitality” [20]. The results of this study provide a functional heterogeneity-based explanation for this discrepancy: the influence of indicators reflecting waterfront openness and enclosure (e.g., SVF) on recreational vitality differs across functional zones—manifesting as an inverted U-shaped relationship in commercial functional zones, a stable positive correlation in residential functional zones, and a persistent negative correlation in ecological conservation zones. This outcome strongly aligns with the conclusion by Xiong et al. [49] that “greater spatial openness is not always better” and further clarifies the functional context governing this principle. To enhance recreational vitality, the general design principle of “moderate openness” requires differentiated application across functional types: commercial functional zones need moderate enclosure to ensure a safe and comfortable consumption environment, while residential functional zones must balance openness and enclosure to satisfy both lighting experience and privacy needs.
Second, this study identifies the High-level Green View Factor (HGVF) as a core landscape characteristic governing recreational vitality. This observation is consistent with existing research indicating that “green view factor constitutes a key determinant of visual quality” [27,50,51] and that “dense tree shade enhances pedestrian thermal comfort” [32]. Furthermore, a threshold inhibition effect of HGVF on recreational vitality is identified in commercial functional zones: when HGVF surpasses a certain threshold, excessively dense tree canopies can obscure commercial signage and building facades, thereby impairing visibility and legibility and consequently suppressing vitality. This finding corroborates the conclusions of Lee et al. [52] that “increases in green view factor within commercial functional zones should align with core commercial functions” and Bao [53] that “green view factor is a pivotal indicator for shaping the ‘nature–urban’ symbiosis of greenways and requires balanced coordination with other spatial elements”, thereby extending the research on how green view factor influences recreational vitality.
Third, the Hard Pavement View Factor (HPVF) constitutes a key artificial determinant influencing recreational vitality, and its effect demonstrates significant functional heterogeneity. Specifically, HPVF exhibits a U-shaped relationship with recreational vitality in commercial functional zones, while demonstrating a more complex, fluctuating relationship in residential living and ecological conservation zones. It aligns with the conclusion reported by Liu et al. that “the influence of artificially constructed elements on recreational vitality has a threshold” [54]. This finding helps resolve inconsistencies in existing research regarding the impact of hard pavement on recreational vitality: to enhance recreational vitality, the proportion of hard pavement has an optimal range that varies by functional type. An excessively low proportion is insufficient to support high-intensity recreational activities, whereas an overly high proportion tends to encroach on green space and degrade the recreational experience [49].
Fourth, the Text Signage View Factor (TSVF) demonstrates a typical U-shaped nonlinear relationship with recreational vitality in both commercial functional zones and residential functional zones, yet exerts only a minimal effect in ecological conservation zones. This result underscores the context-dependent impact of artificial signage elements on recreational vitality: in commercial functional zones, a clear, orderly, and hierarchical signage system constitutes a core landscape attribute that boosts vitality, whereas in ecological conservation zones, excessive artificial signage significantly disrupts the immersive natural experience, thereby reducing vitality. This finding aligns with the conclusion of Li et al. [27] that “artificial landscape characteristic elements exert negative impacts on visual perception in natural spaces”. Meanwhile, some existing studies report a generally negative correlation between artificial elements (e.g., signboards, notices) and recreational vitality [49,55], which contrasts with the function-dependent relationship identified in this study for commercial, business, and residential functional zones. This discrepancy can be attributed to the following: disorderly and excessive signage reduces environmental amenity and leisure experience, thereby producing an overall negative correlation. In contrast, when the functional orientation is explicit, signage system planning tends to be more standardized, explaining the significant functional variation observed for TSVF.

5.2. Strategies for Enhancing Recreational Vitality

This study establishes that the nonlinear response relationships between core landscape characteristic elements and recreational vitality are functionally heterogeneous. Accordingly, enhancing recreational vitality in waterfront spaces necessitates the adoption of targeted, zone-specific strategies for commercial functional zones, residential functional zones, and ecological conservation zones, as detailed below:
(1)
For commercial functional zones, a landscape optimization strategy centered on “moderate openness with selective shading” should be implemented to balance between the Sky View Factor (SVF), the Visual Openness Index (VOI), and the High-level Green View Factor (HGVF), with HGVF held below 0.416. Tree planting density and canopy parameters should be optimized to prevent obstruction of commercial signage and building facades. By harnessing the positive effect of the Text Signage View Factor (TSVF), the development of immersive scenes along continuous commercial interfaces should be promoted to prolong visitor dwell time and increase revisit rates.
(2)
For residential functional zones, an integrated approach to modulating the Sky View Factor (SVF), Visual Openness Index (VOI), and Enclosure Interface View Factor (EIVF) should be implemented to ensure a balanced, moderately open visual field that addresses residents’ needs for natural lighting and open landscapes. The Enclosure Interface View Factor should be carefully controlled to prevent both a loss of place identity due to excessive openness and a sense of spatial compression caused by over-enclosure. Furthermore, the Text Signage View Factor (TSVF) should be regulated through the deployment of a clear and concise wayfinding system to enhance recreational vitality levels.
(3)
For ecological conservation zones, human disturbance should be minimized to prevent large-scale conversion to hardscapes and to reduce the proportion of hard pavement. The High-level Green View Factor (HGVF) should be enhanced by leveraging the shading effect of multi-layered canopy structures integrating trees, shrubs, and grasses. Moderately enclosed interfaces dominated by natural elements can be shaped through micro-topographic refinement and clustered vegetation planting. Moreover, the positive effect of the Enclosure Interface View Factor (EIVF) on recreational vitality should be fully utilized to balance visual openness with spatial closure, thereby avoiding both the loss of ecological privacy due to excessive permeability and the sense of spatial oppression induced by over-enclosure.

5.3. Research Contributions

This study adopts a case study approach, with the Beijing–Hangzhou Grand Canal (Hangzhou section) serving as a representative case, to address two core research questions: (1) Which landscape characteristic attributes significantly influence recreational vitality in waterfront spaces? (2) How do the relationships between these landscape characteristic attributes and recreational vitality vary across commercial functional zones, residential functional zones, and ecological conservation zones?
The study contributes innovations in two primary respects. First, focusing on the micro-scale, it reveals the nonlinear mechanisms through which landscape characteristics influence recreational vitality in micro-scale waterfront spaces, analyzes the differential impacts of identical landscape elements across functional zone types, and demonstrates that general design principles such as “moderate spatial openness” and “prioritizing greening rate” are, to a significant degree, functional-dependent. Second, it advances a comprehensive research framework: establishing a landscape characteristic index system, quantifying the indices, measuring recreational vitality, analyzing correlations between landscape characteristics and vitality, conducting regression analysis of core characteristics across functional zones, proposing functional-adaptive strategies for vitality enhancement. A comprehensive index system spanning natural environment, built environment, and visual perception dimensions is established, and machine learning-based image semantic segmentation is employed to address the technical challenge of quantifying landscape characteristic attributes.
The research framework developed in this study is broadly generalizable and can be applied to studies of waterfront public spaces across diverse climatic zones, cultural contexts, and urban structures. It should be noted, however, that the specific quantitative relationships between individual landscape characteristic attributes and recreational vitality necessitate validation with local, site-specific data. Furthermore, the research framework—encompassing the establishment of a landscape characteristic index system, quantification of indices, measurement of recreational vitality, correlation analysis, regression analysis of core characteristics across functional zones, and the proposal of functional-adaptive strategies for vitality enhancement—can be extended to investigate recreational vitality in various non-waterfront public spaces, such as urban squares, streets, and community parks. While general landscape metrics, including Green View Factor, Sky View Factor, and Hard Pavement View Factor, can be retained, space-specific attributes should be refined or incorporated based on the particular type of target space.
The selection of the Beijing–Hangzhou Grand Canal (Hangzhou section) as a case study is highly representative. As a functioning World Cultural Heritage site, the area integrates multiple core functions—shipping, residential settlement, commercial activity, and ecological conservation. Its spatial complexity and functional heterogeneity are considerably greater than those of typical single-function sites. The findings of this study not only yield a quantitative foundation for optimizing landscape characteristics and enhancing recreational vitality along this canal section, but also deliver actionable insights for the renewal and revitalization of similar linear heritage corridors and multifunctional waterfront spaces globally.

5.4. Research Limitations

This study has certain limitations that warrant further investigation in future research:
(1)
Using street view imagery and machine learning-based semantic segmentation, this study quantitatively examines how micro-scale landscape characteristic attributes influence recreational vitality in waterfront public spaces. However, recreational vitality is a multifactorial outcome shaped by macro-level urban structure, population distribution patterns, policy and institutional constraints, and micro-scale environmental elements. The effects of macro-level factors and their interactions with micro-scale landscape characteristics were not systematically examined in this study and warrant further exploration.
(2)
The empirical analysis of this study is restricted to the multifunctional shoreline sections of the Beijing–Hangzhou Grand Canal (Hangzhou section). While this case holds strong representativeness, the generalizability of the findings requires validation through multi-case comparisons across urban public spaces of varying regions and types. The developmental stage, regional cultural context, climatic conditions, and urban fabric of different cities may substantially modulate the quantitative relationships between landscape characteristics and recreational vitality. Future research could extend the scope to encompass cross-regional and cross-typological case comparisons, aiming to systematically examine the universality and regional specificity of the mechanisms identified herein, thereby generating insights with broader generalizability and explanatory power.

6. Conclusions

In response to the prevalent challenge of inadequate recreational vitality in urban waterfront public spaces during the era of urban stock development, this study adopts a case study approach centered on the Beijing–Hangzhou Grand Canal (Hangzhou section) to investigate the linkages between waterfront landscape characteristic attributes and recreational vitality. Utilizing five nonlinear regression models (power, exponential, quadratic, cubic, and sigmoid functions), the study quantifies, through regression analysis, the response relationships between core landscape characteristic attributes (identified via preliminary Spearman correlation analysis) and recreational vitality within the commercial functional, residential functional, and ecological conservation zones of the waterfront. Based on this analytical foundation, differentiated and targeted strategies for enhancing recreational vitality are proposed for each functional zone type.
This study yields the following key findings: (1) Recreational vitality along the Beijing–Hangzhou Grand Canal (Hangzhou section) exhibits pronounced spatiotemporal heterogeneity: it is significantly higher on holidays than on workdays; high-vitality clusters are concentrated in commercial zones; and an overall spatial gradient of “low in the east and high in the west, low in the north and high in the south” is evident. (2) Across the entire study area and all observation periods, the High-level Green View Factor (HGVF) demonstrates a stable positive correlation with recreational vitality, whereas the Sky View Factor (SVF) and the Enclosure Interface View Factor (EIVF) show significant negative correlations with vitality. (3) The mechanism through which waterfront landscape characteristics influence recreational vitality displays significant functional heterogeneity: in residential functional zones, HGVF has the strongest explanatory power; in commercial functional zones, core spatial attributes exhibit complex nonlinear effects; and in ecological conservation zones, all key landscape attributes collectively show relatively weak explanatory power. (4) Based on this heterogeneous mechanism, the study further proposes targeted, differentiated optimization strategies for enhancing recreational vitality in commercial and business, residential living, and ecological conservation zones, respectively.
The main innovations of this study are as follows: (1) While most existing research on waterfront vitality employs macro spatial units such as blocks or administrative districts, this study downscales to the micro scale, using micro waterfront spaces as the primary analytical unit. This approach overcomes the limitations of macro-scale data and enables a more refined characterization of the intricate relationships between landscape attributes and recreational vitality. (2) The study advances beyond the conventional reliance on two-dimensional planar indicators (e.g., land use type, floor area ratio) by selecting and quantifying a set of micro-scale, three-dimensional visual environment metrics, such as the Sky View Factor (SVF), stratified green view factors (including high-level and low-level), the Enclosure Interface View Factor (EIVF), the Visual Openness Index (VOI), and the Text Signage View Factor (TSVF), thus refining the quantitative assessment framework for the visual environment of micro waterfront spaces. (3) The study clarifies the mechanisms through which landscape attributes influence recreational vitality, establishes optimal-fit nonlinear regression models for core attributes within commercial and business, residential living, and ecological conservation zones, and delineates the functional heterogeneity of their effects. This offers a scientific basis for formulating targeted, differentiated strategies to enhance recreational vitality along the Beijing–Hangzhou Grand Canal (Hangzhou section).
While this study yields valuable insights, it has certain limitations. Future research will expand in two directions: (1) Exploration of multi-scale coupling mechanisms. Subsequent work will incorporate a broader set of landscape characteristic attributes, systematically integrate indicators from both macro and micro perspectives, and establish a multi-scale analytical framework. This will allow for a deeper investigation into the coupling mechanisms and hierarchical transmission effects among macro policy factors, micro landscape attributes, and recreational vitality, thereby elucidating the interactive impacts of macro policy constraints and micro landscape interventions on waterfront recreational vitality. (2) Verification of multi-case universality and heterogeneity. The research scope will be extended to urban waterfront spaces across different levels of economic development, cultural contexts, and climatic conditions, with a large-sample, multi-city database constructed accordingly. This will help validate the universality and regional heterogeneity of the nonlinear influence mechanisms identified in this study and generate more generalizable findings and optimization guidelines for enhancing urban waterfront vitality.

Author Contributions

Conceptualization, W.D.; methodology, W.D.; software, W.D. and R.K.; validation, W.D. and R.K.; formal analysis, W.D. and R.K.; investigation, W.D. and R.K.; resources, W.D.; data curation, W.D. and R.K.; writing—original draft preparation, W.D. and R.K.; writing—review and editing, W.D.; visualization, R.K. and Z.J.; supervision, W.D.; project administration, W.D.; funding acquisition, W.D. All authors have read and agreed to the published version of the manuscript.

Funding

This research was funded by Project of Zhejiang Provincial Education Department, grant number Y202557647; Zhejiang Provincial Social Science Federation Project, grant number 2024N087; Hangzhou Agricultural and Social Development Research Project, grant number 20241029Y008; Zhejiang Provincial Department of Culture and Tourism, grant number 2025KYYY033; General Project of Humanities and Social Sciences Research, Ministry of Education of the People’s Republic of China, grant number 25YJCZH014.

Data Availability Statement

The raw data supporting the conclusions of this article will be made available by the authors on request.

Conflicts of Interest

The funders had no role in the design of the study; in the collection, analyses, or interpretation of data; in the writing of the manuscript; or in the decision to publish the results.

Abbreviations

The following abbreviations are used in this manuscript:
CRCCross-River Connectivity
EIVFEnclosure Interface View Factor
FFVFFunctional Facilities View Factor
GVFGreen View Factor
HGVFHigh-level Green View Factor
HPVFHard Pavement View Factor
LERLandscape Element Richness
LGVFLow-level Green View Factor
NSVFNatural Surface View Factor
RFVFRest Facilities View Factor
SVFSky View Factor
SVIStreet View Imagery
SVTSpatial Visual Tendency
TSVFText Signage View Factor
VGIVertical Greening Index
VOIVisual Openness Index
VSCRVertical Spatial Change Rate
WBVFWater Body View Factor

Appendix A

Normality Test Results of Core Landscape Characteristic Attributes and Recreational Vitality Data for Waterfront Public Spaces along the Beijing–Hangzhou Grand Canal (Hangzhou Section)
The Shapiro–Wilk test is a standard parametric statistical method used to verify whether a small-to-moderate sample dataset (typically 3 to 200 observations) conforms to a normal distribution. The test calculates a W statistic and a corresponding p-value to assess the normality of the data distribution. For this study, the significance level (α) was set at 0.05. If the p-value is greater than 0.05, the null hypothesis that the dataset follows a normal distribution cannot be rejected, and the data is considered to conform to a normal distribution; if the p-value is less than or equal to 0.05, the null hypothesis is rejected, and the dataset is deemed to not follow a normal distribution.
Table A1. Interpretation and analysis of normality test results.
First-Level DimensionSecond-Level IndicatorsWhether the Data Follows a Normal Distribution
Natural Spatial CompositionSky View FactorNo
Water Body View FactorNo
High-level Green View FactorYes
Low-level Green View FactorNo
Vertical Greening IndexNo
Natural Surface View FactorNo
Artificial Built Environment CompositionHard Pavement View FactorNo
Functional Facilities View FactorNo
Enclosure Interface View FactorNo
Text Signage View FactorNo
Rest Facilities View FactorNo
Vertical Spatial Change RateNo
Cross-River ConnectivityNo
Comprehensive Visual CompositionLandscape Element RichnessNo
Visual Openness IndexNo
Spatial Visual TendencyNo

References

  1. Mouratidis, K.; Alió, D.X. Urban vitality versus urban livability: Does vibrancy matter for neighborhood satisfaction and neighborhood happiness? Cities 2026, 168, 168106473. [Google Scholar] [CrossRef] [Scilit]
  2. Zheng, D.; Zhang, K.; Li, P. Urban dynamic space: The transition from growth doctrine to structuralism. Urban Plan. Forum 2025, 3, 16–24. [Google Scholar] [CrossRef]
  3. Han, Y.; Wang, S.; Deng, Z. Critique, empirical study, and implications of the vitality and quality of urban central waterfront: A case study of Guangzhou. Urban Plan. Forum 2021, 4, 104–111. [Google Scholar] [CrossRef]
  4. Ge, Y.; Gan, Q.; Ma, Y.; Guo, Y.; Chen, S.; Wang, Y. Spatial vitality detection and evaluation in Zhengzhou’s main urban area. Buildings 2024, 14, 3648. [Google Scholar] [CrossRef] [Scilit]
  5. Zhang, X.; Wang, Q.; Yun, Y.; Gong, T. A preliminary study on the temporal and spatial characteristics and influence mechanism of urban day and night vitality flow in the built-up area environment: Taking the main urban area of Tianjin as an example. J. Hum. Settl. West China 2025, 40, 132–140. [Google Scholar] [CrossRef]
  6. Wang, Y.; You, Y.; Huang, J.; Yue, X.; Sun, G. Differences in urban daytime and night block vitality based on mobile phone signaling data: A case study of Kunming’s urban district. Open Geosci. 2024, 16, 20220596. [Google Scholar] [CrossRef] [Scilit]
  7. Shi, Y.; Li, T.; Yang, J. Research on urban waterfront space vitality based on mobile phone signaling data—A case study of Jinji Lake in Suzhou. Landsc. Archit. 2021, 28, 31–38. [Google Scholar] [CrossRef]
  8. Niu, X.; Kang, N. Spatio-temporal characteristics and influencing factors of tourist activities in shanghai country parks—A study based on mobile phone signaling data. Chin. Landsc. Archit. 2021, 37, 39–43. [Google Scholar] [CrossRef]
  9. Tao, Z.; Ding, J.; Wang, L.; Chen, D. A study on the spatial and temporal heterogeneity of the influence of urban Park characteristics on recreational vitality. Chin. Landsc. Archit. 2023, 39, 108–113. [Google Scholar] [CrossRef]
  10. Yin, J.; Tang, X.; Wang, Y. Research on the vitality evaluation and regulation of waterfront public space from the perspective of humanism—A case study of the core section of Huangpu River in Shanghai as an example. Chin. Landsc. Archit. 2022, 38, 81–86. [Google Scholar] [CrossRef]
  11. Fan, Y.; Zhang, M. Measurement of the space vitality and influence factors of urban water front space before and after renewal from the perspective of Spatio-temporal Differentiation. Chin. Landsc. Archit. 2023, 39, 77–83. [Google Scholar] [CrossRef]
  12. Jin, A.; Ge, Y.; Zhang, S. Spatial Characteristics of Multidimensional Urban Vitality and Its Impact Mechanisms by the Built Environment. Land 2024, 13, 991. [Google Scholar] [CrossRef] [Scilit]
  13. Wei, H.; Wang, G. Investigating the spatiotemporal pattern between street vitality in historic cities and built environments using multisource data in Chaozhou, China. J. Urban Plan. Dev. 2024, 150, 05024027. [Google Scholar] [CrossRef] [Scilit]
  14. Huang, Y.; Hong, X.; Zheng, Y.; Luo, Z.; Li, Z. Spatial-temporal 0characteristics and influencing factors of urban parkrecreational vitality in Nanjing City. J. Nanjing For. Univ. 2025, 1–15. [Google Scholar]
  15. Fan, Y.; Kuang, D.; Tu, W.; Ye, Y. Which spatial elements influence waterfront space vitality the most?—A comparative tracking study of the Maozhou River renewal project in Shenzhen, China. Land 2023, 12, 1260. [Google Scholar] [CrossRef] [Scilit]
  16. Lyu, G.; Angkawisittpan, N.; Fu, X.; Sonasang, S. Investigating the relationship between built environment and urban vitality using big data. Sci. Rep. 2025, 15, 579. [Google Scholar] [CrossRef] [Scilit]
  17. Chen, J.; Wang, H.; Yang, Z.; Li, P.; Ma, G.; Zhao, X. Comparative Spatial Vitality Evaluation of Traditional Settlements Based on SUF: Taking Anren Ancient Town’s Urban Design as an Example. Sustainability 2023, 15, 8178. [Google Scholar] [CrossRef] [Scilit]
  18. Jiang, Y.; Sun, Z.; Wei, D.; Zhao, P.; Yang, L.; Lu, Y. Revealing the spatiotemporal pattern of urban vibrancy at the urban agglomeration scale: Evidence from the Pearl River Delta, China. Appl. Geogr. 2025, 181, 103694. [Google Scholar] [CrossRef] [Scilit]
  19. Wang, M.; Zhao, J.; Zhang, D.; Xiong, Z.; Sun, C.; Zhang, M.; Fan, C. Assessing urban vitality in high-density cities: A spatial accessibility approach using POI reviews and residential data. Humanit. Soc. Sci. Commun. 2025, 12, 1119. [Google Scholar] [CrossRef] [Scilit]
  20. Li, Q.; Cui, C.; Liu, F.; Wu, Q.; Run, Y.; Han, Z. Multidimensional Urban Vitality on Streets: Spatial Patterns and Influence Factor Identification Using Multisource Urban Data. ISPRS Int. J. Geo Inf. 2022, 11, 2. [Google Scholar] [CrossRef] [Scilit]
  21. Wu, C.; Ye, X.; Ren, F.; Du, Q. Check-in behaviour and spatio-temporal vibrancy: An exploratory analysis in Shenzhen, China. Cities 2018, 77, 104–116. [Google Scholar] [CrossRef] [Scilit]
  22. Chen, J.; Xu, K. On space vitality of city recreation based on space syntax—Taking Haohe scenic spot in Nantong city as an example. Artif. Intell. Sci. Eng. 2020, 45, 70–77. [Google Scholar] [CrossRef]
  23. Tan, D.; Rao, J. Analysis on influencing factors of urban waterfront space vitality in Shenzhen. J. Geo Inf. Sci. 2023, 25, 809–822. [Google Scholar]
  24. Ou, Y.; Lin, L.; Yang, Y. Investigation of the unbalanced of vitality of public space in Dayan old city, Lijiang base on space syntax. Planners 2018, 34, 94–100. [Google Scholar]
  25. Ding, J.; Luo, L.; Shen, X.; Xu, Y. Influence of built environment and user experience on the waterfront vitality of historical urban areas: A case study of the Qinhuai River in Nanjing, China. Front. Archit. Res. 2023, 12, 820–836. [Google Scholar] [CrossRef] [Scilit]
  26. Gao, F.; Liao, S.; Wang, Z.; Cai, G.; Feng, L.; Yang, Z.; Chen, W.; Chen, X.; Li, G. Revealing disparities in different types of park visits based on cellphone signaling data in Guangzhou, China. J. Environ. Manag. 2023, 351, 119969. [Google Scholar] [CrossRef] [Scilit]
  27. Li, X.; Wu, D.; Li, L.; Wang, X. Research on visual perception evaluation of urban riverside greenway landscape based on deep learning. J. Beijing For. Univ. 2021, 43, 93–104. [Google Scholar]
  28. Wu, Z.; Zheng, M.; Zhang, T. Impact characteristics and interaction effects of built environment on street space quality in megacities: A case study of Xi’an, China. City Environ. Interact. 2025, 28, 100257. [Google Scholar] [CrossRef] [Scilit]
  29. Wang, J.; Jiang, H.; Chen, J.; Ke, N.; Wang, M. Identification of autumn landscape characteristics and vitality improvement in urban waterfront spaces based on artificial intelligence: A case study of Huangpu River in Shanghai. Chin. Landsc. Archit. 2024, 40, 15–21. [Google Scholar] [CrossRef]
  30. Nathvani, R.; Cavanaugh, A.; Suel, E.; Bixby, H.; Clark, S.N.; Metzler, A.B.; Nimo, J.; Moses, J.B.; Baah, S.; Arku, R.E.; et al. Measurement of urban vitality with time-lapsed street-view images and object-detection for scalable assessment of pedestrian-sidewalk dynamics. ISPRS 2025, 221, 251–264. [Google Scholar] [CrossRef] [Scilit]
  31. Jiang, X.; Li, X.; Wang, M.; Zhang, X.; Zhang, W.; Li, Y.; Zhang, Q. Multidimensional visual preferences and sustainable management of heritage canal waterfront landscape based on panoramic Image Interpretation. Land 2025, 14, 220. [Google Scholar] [CrossRef] [Scilit]
  32. Zhang, S.; Lu, J.; Guo, R.; Yang, Y. Exploring the relationship between visual perception of the urban riverfront core landscape area and the vitality of riverfront road: A case study of Guangzhou. Land 2024, 13, 2142. [Google Scholar] [CrossRef] [Scilit]
  33. Ji, G.; Sun, H. Assessing urban river landscape visual quality with extreme learning machines: A case study of the yellow river in ningxia hui autonomous region, China. Ecol. Indic. 2024, 165, 112173. [Google Scholar] [CrossRef] [Scilit]
  34. Li, P.; Xu, Y.; Liu, Z.; Jiang, H.; Liu, A. Evaluation and optimization of urban street spatial quality based on street view images and machine learning: A case study of the Jinan old city. Buildings 2025, 15, 1408. [Google Scholar] [CrossRef] [Scilit]
  35. Wang, Y.; Xiu, C. Spatial quality evaluation of historical blocks based on street view image data: A case study of the fangcheng district. Buildings 2023, 13, 1612. [Google Scholar] [CrossRef] [Scilit]
  36. Li, X.; Zhang, C.; Li, W.; Robert Ricard Meng, Q.; Zhang, W. Assessing street-level urban greenery using Google Street View and a modified green view index. Urban For. Urban Green. 2015, 14, 675–685. [Google Scholar] [CrossRef] [Scilit]
  37. Chen, J.; Zhou, C.; Li, F. Quantifying the green view indicator for assessing urban greening quality: An analysis based on Internet-crawling street view data. Ecol. Indic. 2020, 113, 106192. [Google Scholar] [CrossRef] [Scilit]
  38. Sun, S.; Huss, A.; Hensch, N.P.; Vienneau, D.; de Hoogh, K. Comparison of machine learning algorithms for green view index (GVI) prediction using, NDVI and urban form metrics. Urban For. Urban Green. 2026, 120, 129412. [Google Scholar] [CrossRef] [Scilit]
  39. Sztuka, M.I.; Kühn, S. Blue skies: Does visual composition of sky guide subjective judgments of naturalness in the environment? Environ. Res. 2024, 262, 119845. [Google Scholar] [CrossRef] [Scilit] [PubMed]
  40. Hangzhou Municipal People’s Government. Master Plan for Territorial Space of Hangzhou (2021–2035), (Public Draft). Available online: https://www.hangzhou.gov.cn/art/2025/2/6/art_1229063390_4330896.html (accessed on 6 February 2025).
  41. Fan, R.; Meng, D.; Xu, D. Survey of research process on statistical correlation analysis. Math. Model. Its Appl. 2014, 3, 1–12. [Google Scholar]
  42. Peng, Y.; Li, Z.; Shah, A.M.; Lv, B.; Liu, S.; Liu, Y.; Li, X.; Song, H.; Chen, Q. Decoding the Role of Urban Green Space Morphology in Shaping Visual Perception: A Park-Based Study. Land 2025, 14, 495. [Google Scholar] [CrossRef] [Scilit]
  43. Kang, W.; Kang, N.; Wang, P. Predicting Perceived Restorativeness of Urban Streetscapes Using Semantic Segmentation and Machine Learning: A Case Study of Liwan District, Guangzhou. Buildings 2025, 15, 3671. [Google Scholar] [CrossRef] [Scilit]
  44. Zhou, M.; Yin, P.; Cui, J.; Lou, H.; Yang, Z.; Liu, J.; Peng, C. From pixels to 3D models: Mask2Former-driven automated reconstruction of Jiangnan traditional villages using remote sensing images. J. Build. Eng. 2025, 114, 114277. [Google Scholar] [CrossRef] [Scilit]
  45. Cheng, B.; Schwing, A.G.; Kirillov, A. Per-pixel classification is not all you need for semantic segmentation. In Proceedings of the IEEE/CVF Conference on Computer Vision and Pattern Recognition (CVPR), Nashville, TN, USA, 20–25 June 2021; pp. 1–10. [Google Scholar]
  46. Zhang, P.; Liu, W.; Lei, Y.; Wang, H.; Lu, H. Deep Multiphase Level Set for Scene Parsing. IEEE Trans. Image Process. 2020, 29, 4556–4567. [Google Scholar] [CrossRef] [Scilit]
  47. Cheng, B.; Misra, I.; Schwing, A.G.; Kirillov, A.; Girdhar, R. Masked-attention Mask Transformer for Universal Image Segmentation. arXiv 2021, arXiv:2112.01527. [Google Scholar]
  48. Ma, Z. Deep exploration of street view features for identifying urban vitality: A case study of Qingdao city. Int. J. Appl. Earth Obs. Geoinf. 2023, 123, 103476. [Google Scholar] [CrossRef] [Scilit]
  49. Xiong, F.; Wang, Y.; Zheng, X.; Jin, C. Research on the Space Perception and Vitality Character Based on Street View Da-ta-Taking Old Street of Kunming as an Example. Hous. Sci. 2023, 43, 27–33. [Google Scholar] [CrossRef]
  50. Liu, H.; Wu, G.; Liu, M. Measurement of Environmental Restorative Effects and Perceptual Preference from the Perspective of Privacy Driven Activities: A Case Study of Waterfront Public Spaces in Guilin. New Archit. 2025, 4, 108–113. [Google Scholar]
  51. Xiong, X.; Wen, X.; Yang, S.; Liu, L.; Zeng, W. Visual Quality Assessment and Influencing Factors Analysis of Urban Waterfront Greenway Landscape: A Case Study of Nanjing Jiajiang Riverside Greenway. Landsc. Archit. Acad. J. 2024, 41, 69–77. [Google Scholar]
  52. Lee, S.; Cho, N. Nonlinear and interaction effects of multi-dimensional street-level built environment features on urban vitality in Seoul. Cities 2025, 165, 106145. [Google Scholar] [CrossRef] [Scilit]
  53. Bao, Z. Measurement and Analysis of Visual Landscape Characteristics of Urban Waterfront Greenways Based on Deep Learning: A Case Study of the Dasha River in Shenzhen. Master’s Thesis, Harbin Institute of Technology, Harbin, China, 2025. [Google Scholar] [CrossRef]
  54. Liu, W.; Yang, Z.; Gui, C.; Li, G.; Xu, H. Investigating the Nonlinear Relationship Between the Built Environment and Urban Vitality Based on Multi-Source Data and Interpretable Machine Learning. Buildings 2025, 15, 1414. [Google Scholar] [CrossRef] [Scilit]
  55. Cui, X. Research on Visual Perception Satisfaction of Mountain Views in Urban Streets Based on Street View Images. Master’s Thesis, China University of Mining and Technology, Xuzhou, China, 2025. [Google Scholar] [CrossRef]
Figure 1. Distribution of the study area and sampling points in the Beijing–Hangzhou Grand Canal (Hangzhou Section).
Buildings 16 01774 g001
Figure 2. Research framework of this study.
Buildings 16 01774 g002
Figure 3. Representative samples of waterfront SVI along the Beijing–Hangzhou Grand Canal (Hangzhou Section) and their corresponding semantic segmentation masks.
Buildings 16 01774 g003
Figure 5. Regression curves between key landscape characteristic attributes and recreational vitality in commercial functional zones. (a) Sky View Factor—average daily number of visitors; Regression model: cubic function, Goodness of fit R2 = 0.770. (b) High-level Green View Factor—average daily number of visitors; Regression model: cubic function; Goodness of fit R2 = 0.170. (c) Hard Pavement View Factor—average daily number of visitors; Regression model: cubic function; Goodness of fit R2 = 0.770. (d) Enclosure Interface View Factor—average daily number of visitors; Regression model: cubic function; Goodness of fit R2 = 0.170. (e) Text Signage View Factor—average daily number of visitors; Regression model: cubic function; Goodness of fit R2 = 0.590. (f) Visual Openness Index—average daily number of visitors; Regression model: cubic function; Goodness of fit R2 = 0.120.
Buildings 16 01774 g005
Figure 6. Regression curves between key landscape characteristic attributes and recreational vitality in residential functional zones. (a) Sky View Factor—average daily number of visitors; Regression model: cubic function; Goodness of fit R2 = 0.170. (b) High-level Green View Factor—average daily number of visitors; Regression model: cubic function; Goodness of fit R2 = 0.710. (c) Hard pavement view factor—average daily number of visitors; Regression model: cubic function; Goodness of fit R2 = 0.270. (d) Enclosure Interface View Factor—average daily number of visitors; Regression model: cubic function; Goodness of fit R2 = 0.280. (e) Text Signage View Factor—average daily number of visitors; Regression model: cubic function; Goodness of fit R2 = 0.110. (f) Visual Openness Index—average daily number of visitors; Regression model: cubic function; Goodness of fit R2 = 0.060.
Buildings 16 01774 g006
Figure 7. Regression curves between key landscape characteristics and recreational vitality in environment conservation zones. (a) Sky View Factor-average daily number of visitors; Regression model: cubic function; Goodness of fit R2 = 0.150. (b) High-level Green View Factor-average daily number of visitors; Regression model: cubic function; Goodness of fit R2 = 0.230. (c) Hard Pavement View Factor-average daily number of visitors; Regression model: cubic function; Goodness of fit R2 = 0.240. (d) Enclosure Interface View Factor-average daily number of visitors; Regression model: cubic function; Goodness of fit R2 = 0.140. (e) Text Signage View Factor-average daily number of visitors; Regression model: cubic function; Goodness of fit R2 = 0.160. (f) Visual Openness Index-average daily number of visitors; Regression model: cubic function; Goodness of fit R2 = 0.056.
Buildings 16 01774 g007
Table 1. Mean intersection over Union (mIoU) of different backbone networks in street view semantic segmentation tasks.
BackboneMean Intersection over Union
ResNet-5055.40% [45]
ResNet-10154.21% [46]
Swin-Large64.7% [47]
Table 2. Overview of the data collection and processing workflow.
Data NameAcquisition MethodsProcessing Methods
Mobile phone signaling dataAcquired from licensed telecom operatorAnonymization processing, spatial aggregation calculation at sampling point scale
Waterfront SVIOn-site field survey and fixed-parameter image acquisitionStandardized shooting with 3840 × 2160 resolution, 24 mm focal length, 160 cm fixed shooting height, and horizontal shooting angle (Fixed at 160 cm, the shooting height corresponds to the average eye level of adults in Hangzhou, consistent with the actual visual perception of pedestrians)
Waterfront landscape characteristic attribute dataSemantic segmentation of SVI via the Mask2Former modelMin-max normalization of all indicator data to eliminate dimensional effects
Table 3. Quantitative indicator system for waterfront landscape characteristic attributes.
First-Level DimensionSecond-Level IndicatorCalculation Formula & Interpretation
Natural Spatial CompositionSky View Factor
(SVF) [27,32,34,36,38,39]
S V F = P i ( S k y ) P i
P i ( S k y ) represents the number of pixels occupied by the “Sky” label in the SVI; P i represents the total number of pixels in the corresponding SVI.
Water Body View Factor
(WBVF) [27,32,37]
W B V F = P i ( W a t e r ) P i
P i ( W a t e r ) represents the number of pixels occupied by the “Water” label in the SVI;   P i represents the total number of pixels in the corresponding SVI.
Natural Surface View Factor
(NSVF)
N S V F = P i ( E a r t h ) P i
P i ( E a r t h ) represents the number of pixels occupied by the “Earth” label in the SVI;   P i represents the total number of pixels in the corresponding SVI.
High-level Green View Factor
(HGVF) [45,46,47]
H G V F = P i ( T r e e ) P i
P i ( T r e e ) represents the number of pixels occupied by the “Tree” label in the SVI;   P i represents the total number of pixels in the corresponding SVI.
Low-level Green View Factor
(LGVF) [27]
L G V F = [ P i ( G r a s s ) + P i ( P l a n t ) ] P i
P i ( g r a s s ) represents the number of pixels occupied by the “Grass” label in the SVI; P i ( P l a n t ) represents the number of pixels occupied by the “Plant” label in the SVI; P i represents the total number of pixels in the corresponding SVI.
Vertical Greening Index
(VGI)
V G I = [ P i ( G r a s s ) + P i ( P l a n t ) ] P i × P i ( T r e e )
P i ( g r a s s ) represents the number of pixels occupied by the “Grass” label in the SVI; P i ( P l a n t ) represents the number of pixels occupied by the “Plant” label in the SVI;   P i ( T r e e ) represents the number of pixels occupied by the “Tree” label in the SVI; P i represents the total number of pixels in the corresponding SVI.
Artificial Built Environment CompositionHard Pavement View Factor
(HPVF)
H P V F = [ P i ( R o a d ) + P i ( P a t h ) ] P i
P i ( R o a d ) represents the number of pixels occupied by the “Road” label in the SVI; P i ( P a t h ) represents the number of pixels occupied by the “Path” label in the SVI; P i represents the total number of pixels in the corresponding SVI.
Functional Facilities View Factor
(FFVF)
F F V F = [ P i ( L a m p ) + P i T r a s h c a n ] P i
P i ( L a m p ) represents the number of pixels occupied by the “Lamp” label in the SVI; P i ( T r a s h _ c a n ) represents the number of pixels occupied by the “Trash_can” label in the SVI; P i represents the total number of pixels in the corresponding SVI.
Enclosure Interface View Factor
(EIVF) [32,34]
E I V F = [ P i ( W a l l ) + P i B u i l d i n g + P i ( C o l u m n ) + P i ( C e i l i n g ) ] P i
P i ( W a l l ) represents the number of pixels occupied by the “Wall” label in the SVI; P i ( B u i l d i n g ) represents the number of pixels occupied by the “Building” label in the SVI; P i ( C e i l i n g ) represents the number of pixels occupied by the “Ceiling” label in the SVI; P i ( C o l u m n ) represents the number of pixels occupied by the “Column” label in the SVI; P i represents the total number of pixels in the corresponding SVI.
Text Signage View Factor
(TSVF)
T L V F = [ P i ( S i g n ) + P i T e x t + P i ( L o g o ) ] P i
P i ( S i g n ) represents the number of pixels occupied by the “Sign” label in the SVI; P i ( T e x t ) represents the number of pixels occupied by the “Text” label in the SVI; P i ( L o g o ) represents the number of pixels occupied by the “Logo” label in the SVI; P i represents the total number of pixels in the corresponding SVI.
Rest Facilities View Factor
(RFVF)
R F V F = [ P i ( S e a t ) + P i ( C h a i r ) ] P i
P i ( S e a t ) represents the number of pixels occupied by the “Seat” label in the SVI; P i ( C h a i r ) represents the number of pixels occupied by the “Chair” label in the SVI; P i represents the total number of pixels in the corresponding SVI.
Cross-River Connectivity
(CRC)
C R C = P i ( B r i d g e ) P i
P i ( B r i d g e ) represents the number of pixels occupied by the “Bridge” label in the SVI; P i represents the total number of pixels in the corresponding SVI.
Vertical Spatial Change Rate
(VSCR)
V S C R = [ P i ( S t a i r c a s e ) + P i ( S t e p s ) ] P i
P i ( S t a i r c a s e ) represents the number of pixels occupied by the “Staircase” label in the SVI; P i ( S t e p s ) represents the number of pixels occupied by the “Steps” label in the SVI; P i   represents the total number of pixels in the corresponding SVI.
Comprehensive Visual CompositionLandscape Element Richness
(LER)
LER = The number of Label_name output by the Mask2Former semantic segmentation model
Visual Openness Index
(VOI) [34]
V O I = [ P i ( S k y ) + P i ( W a t e r ) ] [ P i T r e e + P i W a l l + P i B r i d g e + P i ( C o l u m n ) ]
P i ( S k y ) represents the number of pixels occupied by the “Sky” label in the SVI;   P i ( W a t e r ) represents the number of pixels occupied by the “Water” label in the SVI;   P i ( T r e e ) represents the number of pixels occupied by the “Tree” label in the SVI;   P i ( W a l l ) represents the number of pixels occupied by the “Bridge” label in the SVI; P i ( B r i d g e ) represents the number of pixels occupied by the “Wall” label in the SVI; P i ( C o l u m n ) represents the number of pixels occupied by the “Column” label in the SVI;
Spatial Visual Tendency
(SVT)
S V T = P ( A r t i f i c i a l ) P ( N a t u r e )
P A r t i f i c i a l = P i ( R o a d ) + P i ( L a m p ) + P i ( W a l l ) + P i ( B r i d g e ) + P i ( C o l u m n ) + P i ( S i g n ) + P i ( T e x t ) + P i ( L o g o )
P N a t u r e = P i ( S k y ) + P i ( W a t e r ) + P i ( E a r t h ) + P i ( T r e e ) + P i ( G r a s s ) + P i ( P l a n t )
P i ( R o a d ) represents the number of pixels occupied by the “Road” label in the SVI; P i ( L a m p ) represents the number of pixels occupied by the “Lamp” label in the SVI; P i ( W a l l ) represents the number of pixels occupied by the “Wall” label in the SVI; P i ( B r i d g e ) represents the number of pixels occupied by the “Bridge” label in the SVI; P i ( C o l u m n ) represents the number of pixels occupied by the “Bridge” label in the SVI; P i ( S i g n ) represents the number of pixels occupied by the “Sign” label in the SVI; P i ( T e x t ) represents the number of pixels occupied by the “Bridge” label in the SVI; P i ( L o g o ) represents the number of pixels occupied by the “Bridge” label in the SVI;
P i ( S k y ) represents the number of pixels occupied by the “Sky” label in the SVI;   P i ( W a t e r ) represents the number of pixels occupied by the “Water” label in the SVI; P i ( E a r t h ) represents the number of pixels occupied by the “Earth” label in the SVI;   P i ( T r e e ) represents the number of pixels occupied by the “Tree” label in the SVI;   P i ( g r a s s ) represents the number of pixels occupied by the the “Grass” label in the SVI; P i ( P l a n t ) represents the number of pixels occupied by the “Plant” label in the SVI.
Table 4. Correlation coefficients between landscape characteristic attributes and recreational vitality in the Beijing–Hangzhou Grand Canal (Hangzhou Section) on holidays.
Landscape Characteristics IndicatorsCorrelation Coefficient
Sky View Factor−0.241 **
Water Body View Factor0.030
High-level Green View Factor0.127 *
Low-level Green View Factor0.030
Vertical Greening Index−0.087
Natural surface View Factor−0.062
Hard Pavement View Factor−0.106
Functional Facilities View Factor0.080
Enclosure Interface View Factor−0.163 **
Text Signage View Factor0.098
Rest Facilities View Factor0.051
Vertical Spatial Change Rate0.013
Cross-River Connectivity−0.021
Landscape Element Richness0.013
Visual Openness Index−0.216 **
Spatial Visual Tendency−0.069
** Correlation is significant at the 0.01 level (two-tailed). * Correlation is significant at the 0.05 level (two-tailed).
Table 5. Correlation analysis between landscape characteristic attributes and recreational vitality of the Beijing–Hangzhou Grand Canal (Hangzhou section) on workdays.
Landscape Characteristics IndicatorsCorrelation Coefficient
Sky View Factor−0.193 **
Water Body View Factor−0.035
High-level Green View Factor0.131 *
Low-level Green View Factor−0.023
Vertical Greening Index−0.082
Natural surface View Factor−0.047
Hard Pavement View Factor−0.139 *
Functional Facilities View Factor0.012
Enclosure Interface View Factor−0.143 *
Text Signage View Factor0.154 *
Rest Facilities View Factor0.020
Vertical Spatial Change Rate−0.069
Cross-River Connectivity0.038
Landscape Element Richness−0.018
Visual Openness Index−0.207 **
Spatial Visual Tendency−0.043
** Correlation is significant at the 0.01 level (two-tailed). * Correlation is significant at the 0.05 level (two-tailed).
Disclaimer/Publisher’s Note: The statements, opinions and data contained in all publications are solely those of the individual author(s) and contributor(s) and not of MDPI and/or the editor(s). MDPI and/or the editor(s) disclaim responsibility for any injury to people or property resulting from any ideas, methods, instructions or products referred to in the content.