1. Introduction
The construction industry accounts for approximately 13% of global gross domestic product, yet it remains among the least digitized sectors of the world economy, with labour productivity growth averaging less than 1% annually over the past two decades [
1,
2]. Artificial intelligence has been identified as a transformative force capable of addressing persistent inefficiencies in project scheduling, cost estimation, safety management, quality assurance, and design optimisation [
3,
4]. Despite this potential, empirical evidence consistently indicates that AI adoption rates within the construction sector lag substantially behind those observed in manufacturing, healthcare, and financial services [
5,
6]. This disparity has prompted growing research seeking to identify, categorise, and analyse the barriers that impede technology integration in construction organisations across diverse national contexts.
Na et al. [
7] proposed an integrated Technology Acceptance Model and Technology–Organisation–Environment (TAM-TOE) framework for AI adoption in South Korean construction firms, identifying perceived usefulness, organisational readiness, and government policy as significant predictors, while a subsequent investigation confirmed that firm size moderates adoption propensity. Katebi & Tehrani [
8] extended this line of inquiry by applying a combined UTAUT2-TOE framework to AI adoption in design practice, while Jallow et al. [
9] provided empirical evidence from the United Kingdom confirming that organisational leadership commitment and workforce competency constitute critical determinants of AI implementation. Trust represents a further dimension of adoption resistance; Emaminejad & Akhavian [
10] examined trustworthiness perceptions toward construction robotics, establishing that perceived reliability and transparency significantly influence acceptance behaviour.
Barrier-specific investigations have addressed multiple dimensions of the adoption problem. Cisterna et al. [
11] conducted a statistical descriptive analysis of AI drivers and barriers across construction organisations, identifying data availability, workforce skills, and financial constraints as recurrent impediments. Singh et al. [
12] examined AI adoption issues within construction supply chains through an interpretive structural approach, revealing circular causal relationships among organisational, psychological, and informational barriers. Cultural and attitudinal resistance has been documented in multiple geographic settings, including South Africa [
13], Ghana [
14], Nigeria [
15], and Iran [
16]. Khan et al. [
17] established that knowledge integration capacity mediates AI adoption in construction small and medium enterprises, while Soomro et al. [
18] identified cognitive barriers as obstacles to AI-driven circular economy practices in construction.
Interpretive Structural Modeling (ISM) and its companion MICMAC classification have been applied to a range of construction management problems, including lean implementation [
19], BIM adoption [
20], prefabrication barriers [
21], and construction safety risk analysis [
22]. Within the specific domain of AI in the AEC sector, Onososen & Musonda [
23] applied ISM to model the perceived benefits of automation and AI, establishing a hierarchical structure of benefit interdependencies. However, the application of ISM to AI adoption barriers in construction remains notably scarce, and no study to date has employed this methodology to examine barrier interrelationships within the Saudi Arabian context.
Saudi Arabia presents a particularly consequential context for this research, given the scale of construction activity driven by the Vision 2030 national transformation programme. Mega-projects including NEOM, the Red Sea Development, and Qiddiya collectively represent hundreds of billions of dollars in planned investment [
24]. Yet the published evidence on AI adoption in the Saudi construction sector remains limited. Alnaser & Elmousalami [
25] examined AI-based digital twin integration using correspondence analysis, but no study has systematically investigated the structural interrelationships among the full spectrum of adoption barriers confronting the sector.
Two critical gaps emerge from the foregoing review. First, while a substantial body of literature has identified and ranked individual barriers to AI adoption in construction, very few studies have modelled the structural interdependencies among these barriers. Conventional survey-based ranking methods treat barriers as independent entities, failing to capture the causal hierarchies through which root-cause factors propagate into the surface-level symptoms that practitioners most readily perceive. Second, the Saudi Arabian construction sector, despite its strategic importance and scale, remains largely unrepresented in the AI adoption literature. The intersection of these two gaps, namely the absence of structural barrier modelling within the Saudi construction context, constitutes the research space that the present study addresses.
Beyond the geographically specific gap, the present study engages a broader theoretical question concerning the reliability of perception-based barrier prioritisation in technology adoption research. Conventional survey methodologies implicitly assume that the severity practitioners assign to barriers accurately reflects their structural importance within the adoption system. However, cognitive accessibility theory and the related literature on institutional distance suggest that practitioners perceive most acutely those barriers that are phenomenologically proximate to their daily work, while structural drivers operating at an institutional remove remain cognitively opaque. This produces a systematic misalignment between perception and causal structure with direct consequences for policy design, yet the empirical validation of this misalignment within construction AI adoption remains absent from the literature.
This study investigates the barriers to AI adoption in Saudi Arabia’s construction industry through a dual-method approach combining quantitative survey analysis with Interpretive Structural Modeling and MICMAC classification. A structured questionnaire was administered to 181 construction industry professionals, generating data across eight constructs encompassing AI usage, perceived benefits, adoption barriers, cultural factors, workforce readiness, government actions, and data challenges. Twelve consolidated barriers were subsequently modelled through ISM to establish their hierarchical interrelationships, and MICMAC analysis classified each barrier according to its driving and dependence power. The study contributes to the literature by providing the first ISM-MICMAC analysis of AI adoption barriers in the Saudi construction sector, revealing a structural hierarchy that diverges substantially from perceptual rankings generated by conventional survey methodologies. The findings offer evidence-based guidance for policymakers and industry stakeholders seeking to allocate resources toward the most structurally consequential intervention points.
3. Research Methodology
3.1. Research Methodology Overview
This section delineates the methodological framework underpinning the present investigation into the adoption challenges of artificial intelligence within Saudi Arabia’s construction industry. The research design employs a quantitative, cross-sectional survey methodology augmented by ISM and MICMAC analysis, thereby constituting a sequential explanatory approach that transitions from descriptive statistical characterization to structural relational modeling.
3.2. Research Design and Philosophical Orientation
The epistemological foundation of this study is situated within the positivist paradigm, predicated on the assumption that the phenomena governing AI adoption barriers are objectively measurable through structured instrumentation and amenable to statistical generalization. A deductive approach was adopted, whereby theoretical constructs drawn from established technology adoption frameworks, including the TAM, TOE framework, and the DOI theory, informed the development of the survey instrument and the subsequent structural modeling of barrier interrelationships.
The investigation proceeds through two analytically distinct phases. The first phase comprises the administration and descriptive analysis of a structured questionnaire employing Likert-type ordinal scales, generating frequency distributions, measures of central tendency and dispersion, Relative Importance Indices, reliability coefficients, and inferential comparisons across demographic subgroups. The second phase synthesizes the survey-derived barrier prioritization with literature-grounded reasoning to construct the ISM hierarchical model and MICMAC classification.
3.3. Survey Instrument Development
Questionnaire development proceeded through a four-stage process. In the first stage, a preliminary item pool was generated through a systematic review of construction technology adoption literature published between 2015 and 2025, with particular emphasis on studies employing TAM, TOE, UTAUT2, and Diffusion of Innovations frameworks in architecture, engineering, and construction contexts. In the second stage, the preliminary items were grouped into eight thematic constructs aligned with the identified theoretical dimensions, and redundant items were consolidated through item-to-item similarity review. In the third stage, a pilot instrument containing 65 candidate items was administered to a small expert panel of eight academic and practitioner specialists active in the Saudi construction sector, whose feedback guided linguistic refinement, removal of items with ambiguous wording, and elimination of items with low discriminative capacity. The final instrument retained 50 items distributed across the eight constructs shown in
Table 1, each measured on a five-point Likert-type scale.
All items were measured on a symmetric five-point Likert-type scale anchored at extreme ends and including a neutral midpoint. For usage-related items in Q1, the scale ranged from 1 (not used) through 3 (moderate use) to 5 (very high use). For agreement-based items in Q2, Q3, Q5, Q6, and Q7, the scale ranged from 1 (strongly disagree) through 3 (neutral) to 5 (strongly agree). For severity-based items in Q4 and Q8, the scale ranged from 1 (not a barrier or challenge) through 3 (moderate) to 5 (very major barrier or challenge). The Relative Importance Index (RII) was computed as the ratio of the sum of weighted responses to the maximum possible weighted sum, yielding values between 0 and 1 to permit direct ranking across items and constructs.
The decision to operationalise cultural factors and workforce readiness as distinct constructs rests on a theoretical distinction drawn from established technology adoption frameworks. Cultural factors capture attitudinal and dispositional conditions held at the individual and collective level, including trust, awareness, resistance to change, and perceived threats to role identity. Workforce readiness captures structural capability conditions, including training provision, leadership competence, and talent availability. Although certain items, notably fear of job displacement, exhibit theoretical overlap with both dimensions, the Unified Theory of Acceptance and Use of Technology (UTAUT2) and the Technology–Organisation–Environment (TOE) framework treat disposition and capability as analytically separable determinants of adoption. The empirical separability of the two constructs is further supported by their distinct Cronbach’s alpha values of 0.827 and 0.879 respectively and by the differential placement of their constituent items in the ISM hierarchy, with cultural-attitudinal items occupying Level II (the linkage layer) and workforce items occupying Level III (the intermediate driver layer). The ISM analysis subsequently demonstrates that boundary-straddling items such as fear of job displacement are structurally consolidated within the attitudinal relay layer rather than the capability layer, confirming the appropriateness of the conceptual separation.
3.4. Sampling Strategy and Data Collection
The sampling frame targeted construction industry professionals with direct or observational exposure to AI technologies operating within the Saudi context. A purposive sampling strategy was adopted owing to the specialised knowledge requirement and the absence of a comprehensive sector-wide sampling frame. Recruitment was conducted through professional networks, institutional channels, and Kingdom-focused construction communities on LinkedIn, yielding 181 valid responses after quality screening for completeness and attention-check consistency. The obtained sample exceeds the ten-respondents-per-item threshold commonly adopted for Likert-based descriptive and non-parametric analyses in construction management research and provides sufficient statistical power for the Kruskal–Wallis, Mann–Whitney, and Spearman tests reported in
Section 4.4.
Table 2 summarizes the demographic profile.
3.5. Analytical Framework
3.5.1. Descriptive and Inferential Statistical Analysis
The primary statistical analysis employs arithmetic means, standard deviations, and the Relative Importance Index (RII = ΣW/(A × N), where A = 5 and N = 181) for all 50 measurement items. Internal consistency reliability is evaluated using Cronbach’s alpha, with the conventional threshold of α ≥ 0.70 adopted as the minimum criterion [
41]. Non-parametric inferential tests are employed owing to the ordinal measurement level: the Kruskal–Wallis H test for multi-group comparisons, the Mann–Whitney U test for two-group comparisons, and Spearman’s rho for bivariate associations.
3.5.2. Interpretive Structural Modeling (ISM)
ISM, developed by Warfield (1974) [
39] transforms poorly articulated mental models of complex systems into hierarchical structural models. The methodology proceeds through: (i) identification of barriers from survey results and literature synthesis; (ii) construction of a Structural Self-Interaction Matrix (SSIM) defining pairwise contextual relationships using four symbols (V: i influences j; A: j influences i; X: mutual influence; O: no relationship); (iii) conversion to an initial binary reachability matrix; (iv) incorporation of transitivity through iterative checking; (v) level partitioning through reachability-antecedent set intersection analysis; and (vi) construction of the hierarchical digraph. The contextual relationship employed is “barrier i will influence barrier j.” Relational judgments were established through triangulation of the technology adoption literature, logical causal reasoning grounded in institutional theory, and the empirical patterns observed in the survey data.
To mitigate researcher bias in the establishment of pairwise contextual relationships, a three-step triangulation procedure was applied. In the first step, each pairwise relationship was tentatively classified on the basis of established theoretical propositions drawn from the Technology–Organisation–Environment framework, institutional theory, and the AI adoption literature reviewed in
Section 2. In the second step, empirical patterns observed in the survey data, particularly the Relative Importance Indices of the contributing items and the Spearman correlations between related constructs, were used to examine the directionality of each proposed link. In the third step, the resulting matrix was subjected to internal consistency checks through the transitivity requirement and through assessment of the coherence of the induced hierarchical levels with the theoretical causal chain. While this triangulation provides defensible grounding for the structural model, the absence of a formal Delphi expert panel remains a recognised limitation that is addressed in
Section 5.5.
The selection of ISM over alternative modelling approaches was deliberate and grounded in the epistemic objectives of the study. DEMATEL, while powerful in quantifying the intensity of causal relationships, presupposes respondent competence in scaling continuous influence magnitudes, a requirement particularly problematic in emerging technology contexts where the respondent pool has heterogeneous exposure to the target technology. PLS-SEM is optimised for testing directional hypotheses within a pre-specified measurement and structural model and is therefore unsuited to discovering the hierarchical architecture that constitutes the core research objective of the present study. ISM, by contrast, is purpose-designed for transforming poorly articulated mental models of complex systems into explicit multi-level hierarchies and is accompanied by the MICMAC classification that directly addresses the driving-dependence dichotomy central to this investigation. Accordingly, ISM-MICMAC represents the most parsimonious and methodologically aligned choice for mapping the structural topology of AI adoption barriers.
3.5.3. MICMAC Analysis
MICMAC extends the ISM analysis by classifying each barrier on a two-dimensional space defined by driving power (row sum in the final reachability matrix) and dependence power (column sum). The resulting scatter plot is partitioned into four quadrants: Autonomous (low driving, low dependence), Independent/Driver (high driving, low dependence), Dependent (low driving, high dependence), and Linkage (high driving, high dependence). The median values of driving and dependence power serve as partitioning thresholds.
4. Results and Analysis
It is appropriate at this point to document the analytical provenance of the descriptive and structural outputs presented in this section. All numerical computations were performed in Python 3.11 using the pandas and scipy libraries, with the Relative Importance Index, mean, and standard deviation computed from the full set of 181 valid responses.
Figure 1 and
Figure 2 were generated using matplotlib directly from the computed summary statistics.
Figure 3 (the ISM hierarchical digraph) was constructed from the level-partitioned reachability matrix using NetworkX (Version 3.6.1), with manual refinement for presentation clarity.
Table 3 and
Table 4 report the reliability coefficients and per-item descriptive statistics respectively;
Table 5 presents per-item means, standard deviations, RII values, and within-construct ranks for Q2 through Q8;
Table 6 and
Table 7 document the consolidated barrier set and the mapping to the original survey items;
Table 8 and
Table 9 present the Structural Self-Interaction Matrix and the Final Reachability Matrix;
Table 10 reports the level-partitioning output; and
Table 11 and
Table 12 present the MICMAC classification and the quadrant summary. All numerical outputs were cross-validated through independent re-computation by two co-authors before inclusion, and
Figure 3 was produced after the level partitioning in
Table 10 had been verified against the Final Reachability Matrix in
Table 9.
4.1. Instrument Reliability
Table 3 presents the Cronbach’s alpha coefficients for all eight question groups. Every scale exceeds the 0.70 threshold, with three constructs (Q1, Q7, Q8) surpassing 0.90. These values confirm sufficient internal consistency to warrant substantive interpretation.
The uniformly high internal consistency observed across the eight constructs, with three constructs exceeding an alpha of 0.90, warrants interpretive reflection. Three complementary factors account for this consistency. First, the survey items within each construct were derived from an extensively validated literature base in construction technology adoption, producing item pools already refined for thematic unity. Second, the iterative pilot testing conducted prior to final deployment enabled removal of items with weak item-to-total correlations, thereby tightening the measurement of each construct. Third, the Saudi construction sector exhibits a relatively homogeneous perceptual landscape, as evidenced by the absence of statistically significant differences across demographic subgroups reported in
Section 4.4; this perceptual homogeneity reduces response variance attributable to contextual heterogeneity and consequently elevates reliability coefficients. While exceptionally high alpha values can occasionally indicate item redundancy, the theoretical distinctiveness of the eight constructs and their differential mean scores argue against that interpretation in the present case.
4.2. Current State of AI Utilization (Q1)
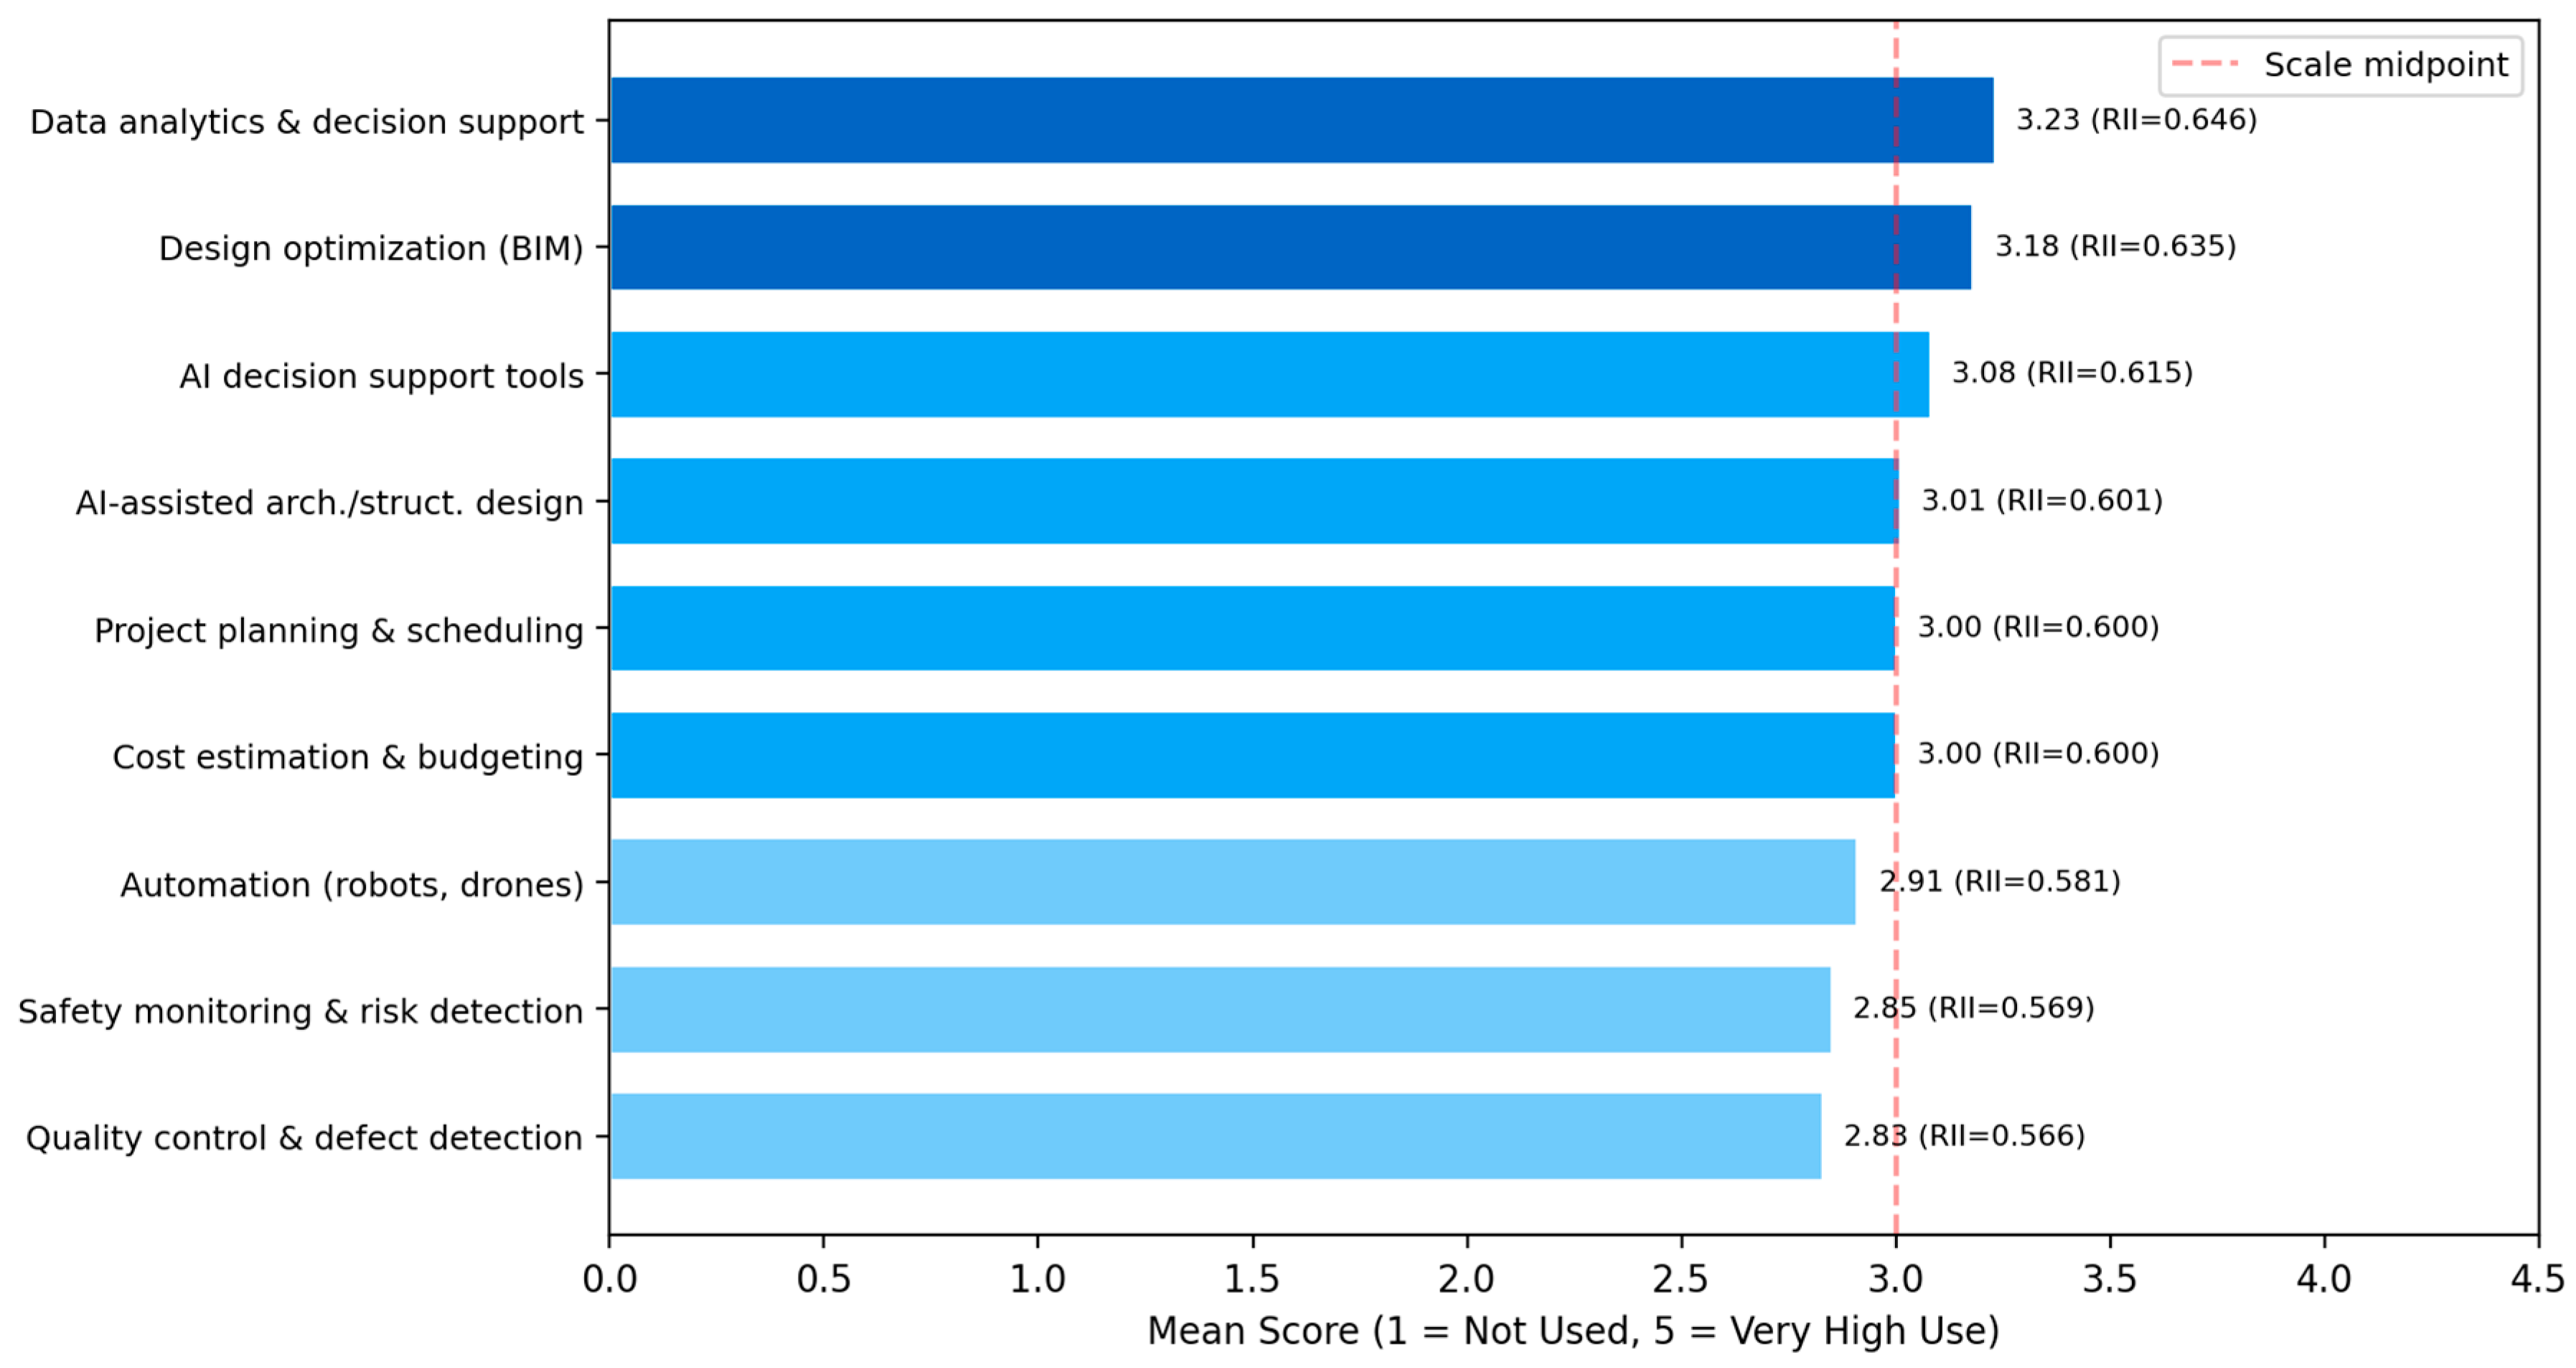
Figure 1 presents the mean utilization scores for the nine AI applications. The overall picture is one of moderate adoption with a clear analytical-over-physical gradient: software-based, data-centric applications (analytics, BIM optimisation, decision support) cluster above the scale midpoint, whereas embodied physical applications (robotics, safety sensors) and operational quality processes trail below it. The standard deviations across all nine items are relatively large (1.07 to 1.23), reflecting substantial heterogeneity in adoption levels and suggesting that AI diffusion remains uneven across organisations and project types.
Table 4 provides the complete descriptive summary.
4.3. Perceived Benefits and Adoption Barriers (Q3, Q4)
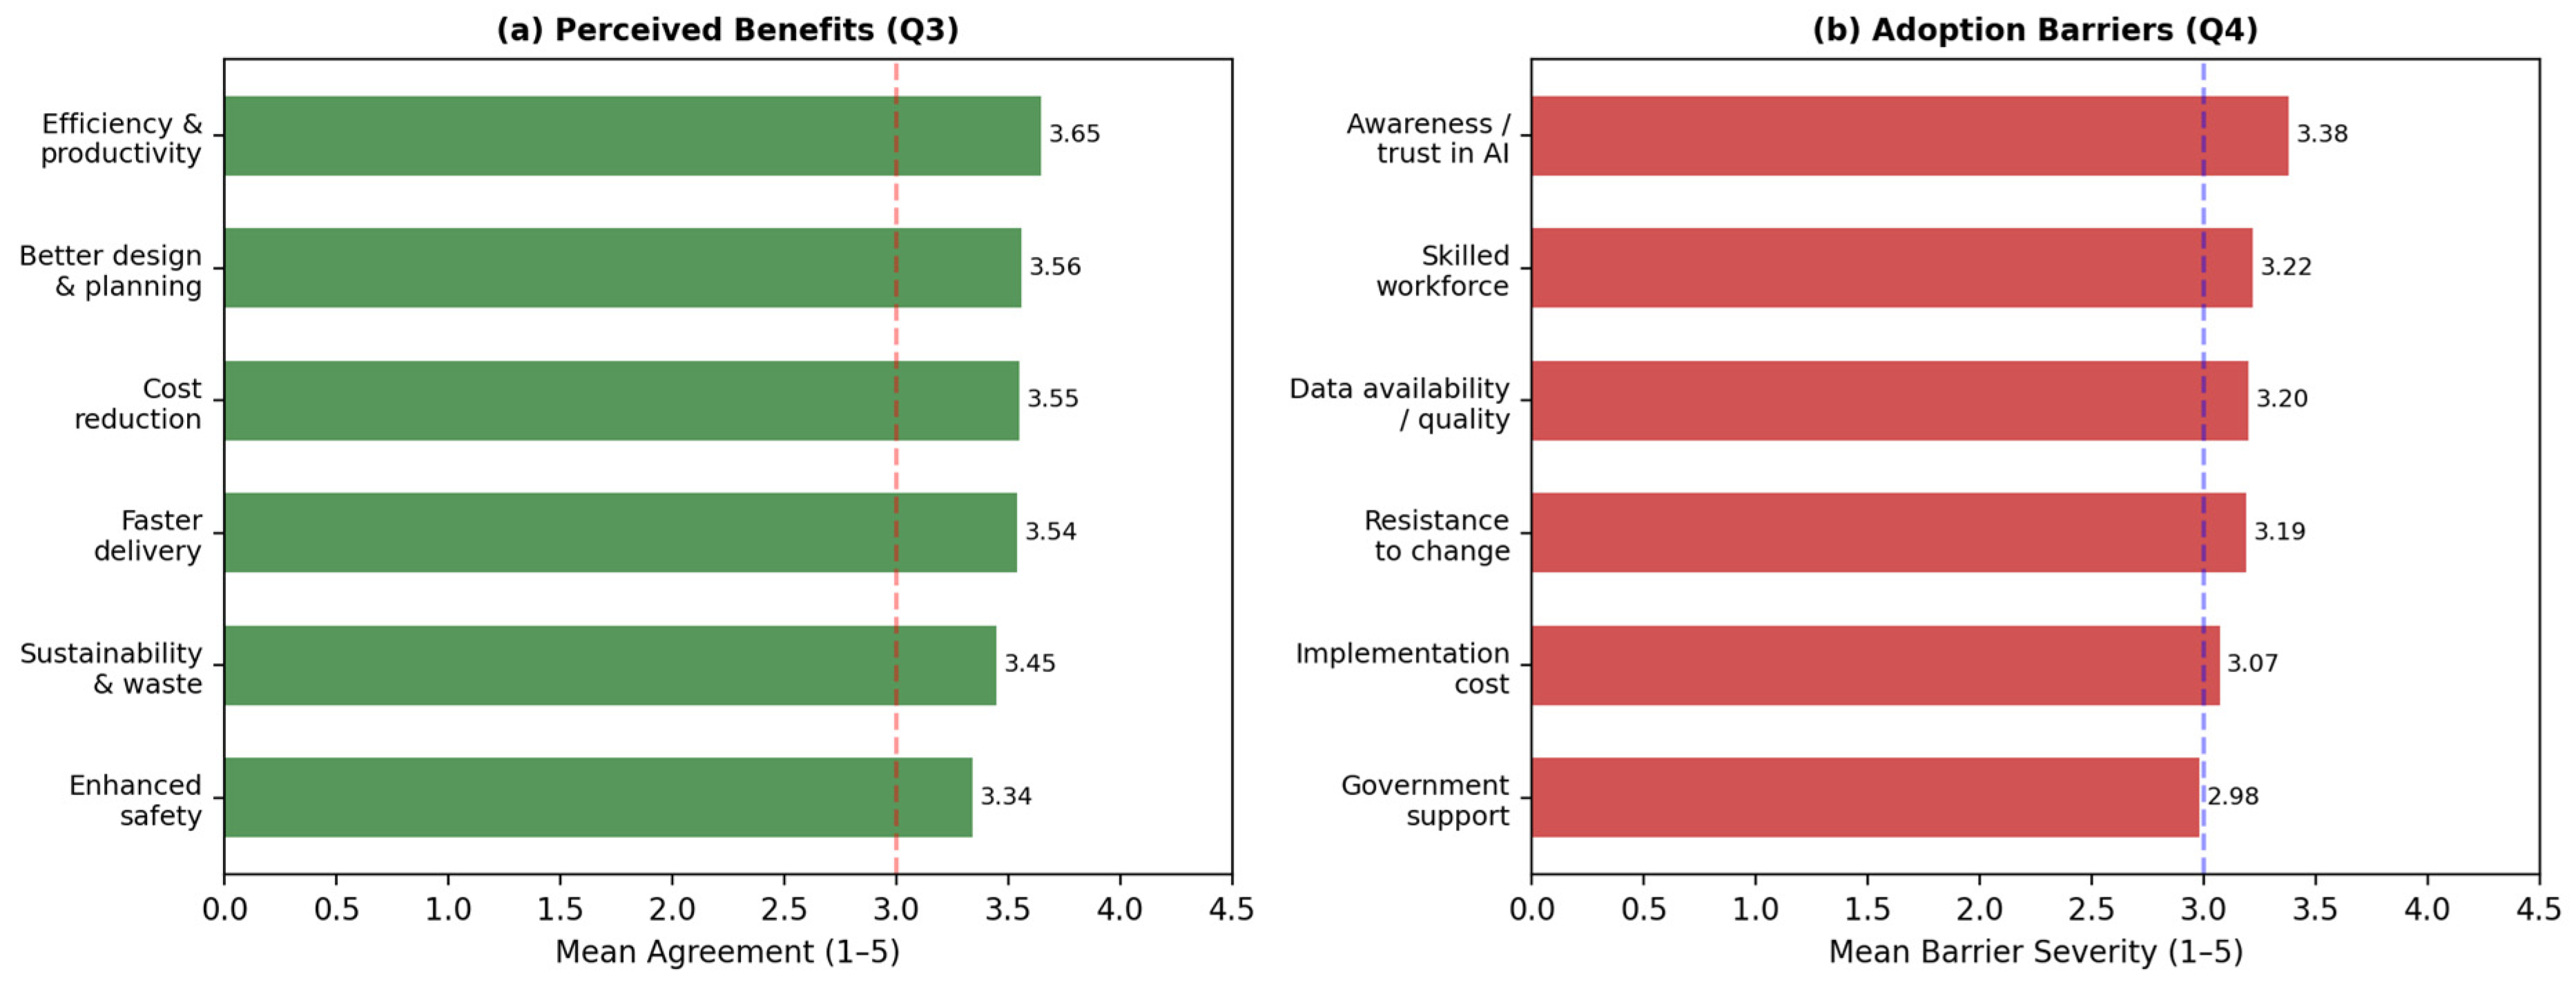
Figure 2 juxtaposes the benefits and barriers constructs. On the benefits side, respondents express the strongest agreement toward improved efficiency and productivity, with approximately 60% concurring. Enhanced safety, despite its critical operational importance, records the lowest endorsement, an outcome that resonates with safety monitoring’s depressed utilization in Q1 and suggests a reinforcing cycle: limited exposure to safety AI constrains the recognition of its potential.
On the barriers side, lack of awareness or trust in AI emerges as the most prominent impediment, with 48.1% classifying it as major or very major. Limited government support registers the lowest severity, falling marginally below the midpoint. As the subsequent ISM analysis demonstrates, this perceptual ranking inverts dramatically when structural causal relationships are modelled. The complete descriptive statistics for all constructs are presented in
Table 5.
The Q7 results merit particular emphasis. All six proposed government interventions register mean scores exceeding 3.50, with agreement rates consistently between 57.5% and 60.8%. This uniformity signals that respondents do not perceive government action as required in a single domain but across a comprehensive, multi-pronged policy portfolio. The Q8 data challenges, meanwhile, present a remarkably uniform pattern: all seven items yield means within the narrow range of 3.38 to 3.46, indicating that data readiness is perceived as a systemic, multidimensional deficiency rather than a problem attributable to any single factor.
4.4. Inferential Group Comparisons
Kruskal–Wallis H tests revealed no statistically significant differences in composite AI usage scores across institutional types (H = 1.988, p = 0.370) or experience levels (H = 4.130, p = 0.389). The Mann–Whitney U test likewise indicated no significant gender-based difference (U = 1154.0, p = 0.641). These results suggest that perceptions of AI adoption status are relatively homogeneous across the sampled demographic subgroups, lending generalisability to the aggregate findings.
Spearman’s correlations reveal two theoretically consequential associations: a moderate positive relationship between AI usage and perceived benefits (ρ = 0.364, p < 0.001), and a parallel positive correlation between usage and perceived barriers (ρ = 0.351, p < 0.001). The latter finding, seemingly paradoxical, is consistent with the competence-awareness hypothesis: deeper practical engagement surfaces implementation challenges invisible to less experienced respondents.
4.5. ISM-MICMAC Structural Analysis
4.5.1. Barrier Identification and Consolidation
Twelve consolidated barriers (B1 through B12) were distilled from the 23 original measurement items through thematic merging and RII-based prioritisation.
Table 6 presents the barrier set with survey-derived metrics.
To enhance the transparency of the consolidation process,
Table 7 presents the mapping between the twelve consolidated barriers and the original survey items, together with the parent construct, the Cronbach’s alpha of that construct, and the Relative Importance Index of each item. Thematic coherence served as the primary consolidation criterion, with RII values used to resolve ambiguities where multiple items aligned with the same latent construct.
4.5.2. Structural Self-Interaction Matrix and Reachability Analysis
The SSIM captures pairwise contextual relationships among the twelve consolidated barriers using four symbols: V denotes that barrier i influences barrier j, A denotes that barrier j influences barrier i, X denotes mutual influence, and O denotes no direct relationship. The relational judgments underlying the SSIM were established through the triangulation procedure detailed in
Section 3.5.2.
Table 8 presents the complete SSIM.
Applying the standard binary substitution rules (V to 1-0, A to 0-1, X to 1-1, O to 0-0) and embedding transitivity through iterative checking produces the Final Reachability Matrix presented in
Table 9. The driving power (row sum) and dependence power (column sum) for each barrier are computed directly from this matrix and serve as the basis for the MICMAC classification.
The transitivity property was verified through the condition that if barrier i reaches j and j reaches k, then i also reaches k. All implied transitive links are captured in
Table 9. The level partitioning procedure described in the next subsection operates on this matrix to produce the hierarchical structure.
4.5.3. Level Partitioning and Hierarchical Model
The iterative level partitioning procedure assigns the 12 barriers to five hierarchical levels.
Table 10 presents the results;
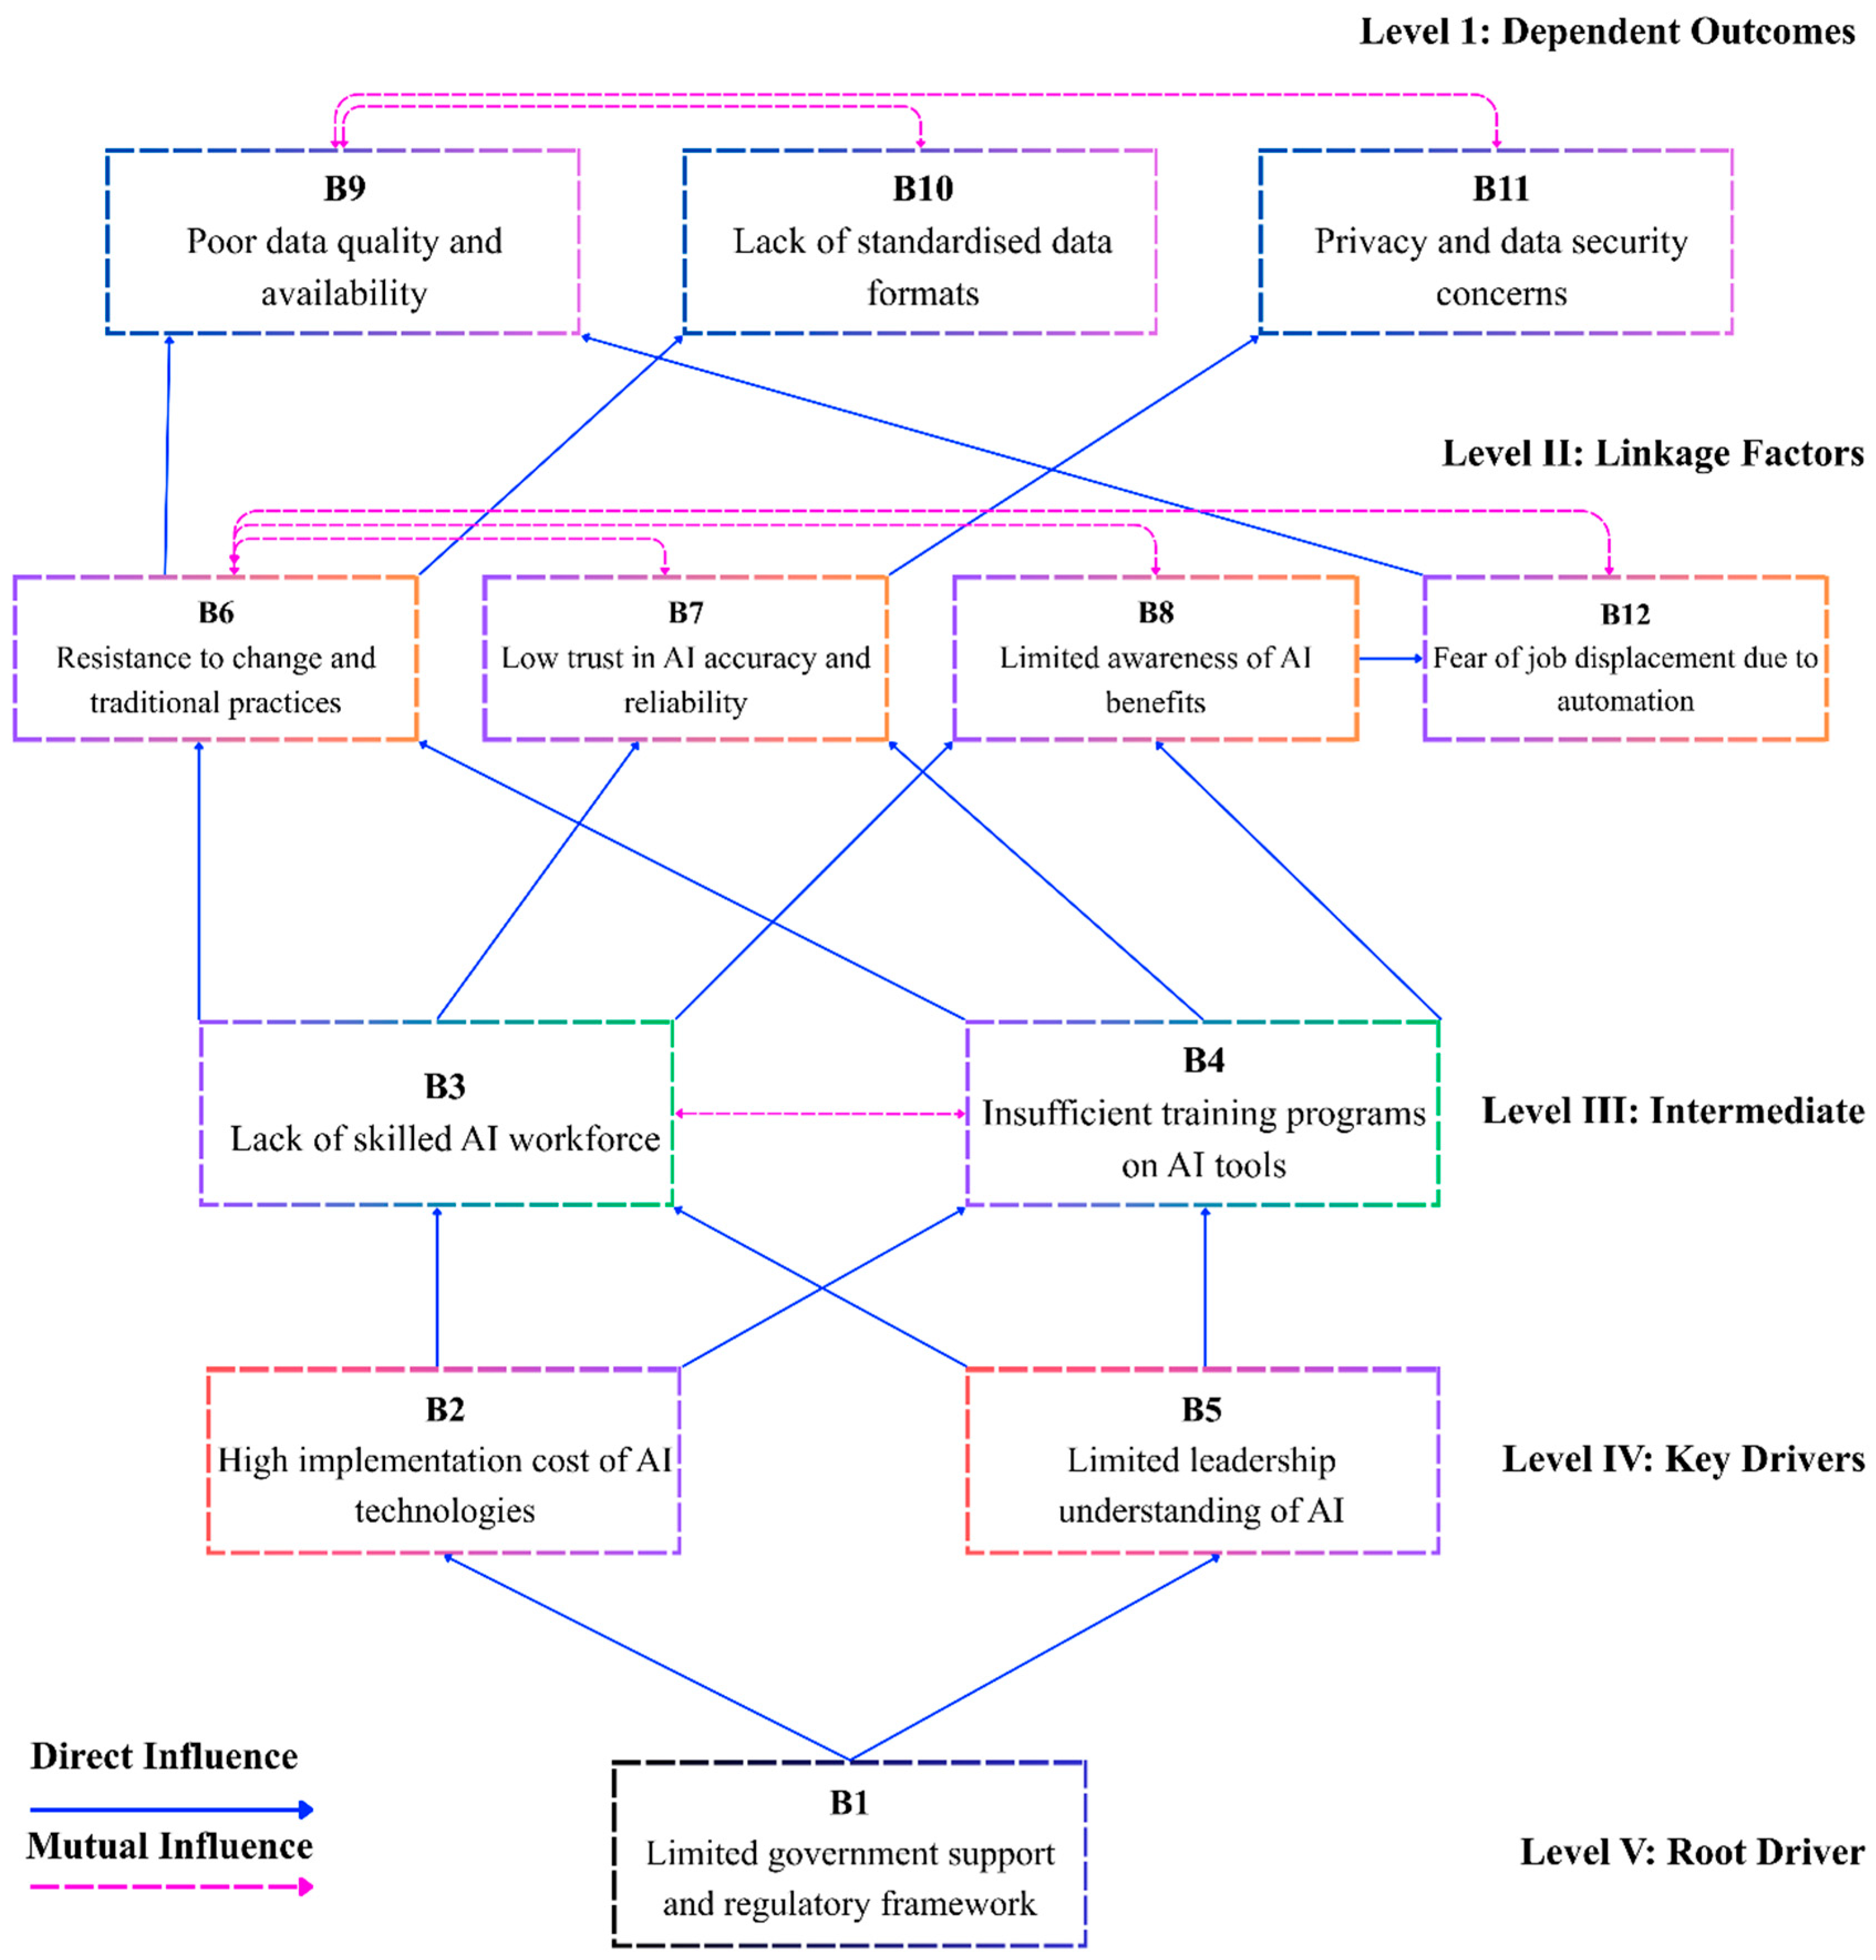
Figure 3 displays the ISM digraph.
The digraph reveals a coherent causal cascade. Government policy deficits (Level V) propagate through cost barriers and leadership deficits (Level IV) into workforce capacity gaps (Level III), which generate attitudinal resistance (Level II), ultimately manifesting as data ecosystem deficiencies at Level I. Critically, the highest-rated survey barriers (data challenges, RII = 0.676 to 0.692) are structurally the most dependent outcomes, while the lowest-rated barrier (government support, RII = 0.596) is the most fundamental driver.
4.5.4. MICMAC Classification
The MICMAC analysis extends the ISM hierarchy by classifying each barrier according to its driving power (the total number of barriers it can influence) and dependence power (the total number of barriers that influence it). With 12 barriers in the system, the classification threshold is set at n/2 = 6.
Table 11 presents the complete classification, and
Table 12 provides the quadrant-level summary.
Three observations from the MICMAC classification merit particular emphasis. First, the five Independent/Driver barriers (B1 through B5) collectively account for 41.7% of the system yet concentrate the overwhelming majority of driving power. B1 alone, with a driving power of 12 and dependence of only 1, reaches every other barrier in the system. This extreme asymmetry identifies government policy as the single highest-leverage intervention point: a unit of improvement at this node propagates through all 11 remaining barriers. B2 and B5, each with driving powers of 10 and dependence of 2, reinforce this finding at the strategic level, indicating that cost reduction mechanisms and leadership education programmes function as powerful secondary levers.
Second, the four Linkage barriers (B6, B7, B8, B12) exhibit identical driving and dependence profiles (7 and 9 respectively), reflecting their tightly interwoven attitudinal nature. Their classification as Linkage variables carries a specific operational implication: these barriers are inherently unstable and bidirectionally sensitive. Positive momentum from upstream improvements in workforce capability and leadership commitment will propagate favourably through this cluster, but equally, deterioration in data ecosystem quality at the dependent level can feed back into this layer, reinforcing distrust and resistance. Policy interventions targeting this cluster must therefore be sustained and synchronized with improvements in the deeper driver layers, as isolated campaigns (e.g., awareness workshops or trust-building exercises conducted without concurrent workforce upskilling) are unlikely to produce durable attitudinal change.
Third, the complete absence of Autonomous barriers is itself a significant structural finding. In many ISM-MICMAC analyses of technology adoption, at least one or two peripheral barriers are found to operate independently of the core system. The absence of such disconnected elements in the present model indicates that the 12-barrier system is fully interconnected and mutually reinforcing. This interconnectedness implies that piecemeal interventions targeting individual barriers in isolation, without consideration of their systemic linkages, would be insufficient to achieve meaningful progress. Instead, the structural architecture demands a coordinated, multi-level intervention strategy calibrated to the hierarchical sequence revealed by the ISM digraph (
Figure 3) and the quadrant classification presented above.
5. Discussion
5.1. Moderate Utilization with Analytical Primacy
The finding that AI utilization occupies a moderate tier (see
Table 4) is consistent with the characterization of the global construction industry as a laggard in technological adoption [
26]. However, the intra-application differentiation provides nuanced insight. The primacy of data analytics and BIM-related optimisation aligns with Regona et al. [
42], who observed that analytical AI applications, requiring lower physical infrastructure investment, tend to precede embodied AI in construction adoption pathways. The depressed utilization of safety monitoring and quality control is particularly consequential given the scale of Saudi Arabia’s mega-project portfolio, including NEOM, the Red Sea Development, and Qiddiya.
The absence of statistically significant differences across demographic subgroups (
Section 4.4) indicates a homogeneous perceptual landscape, suggesting that AI adoption challenges are perceived as systemic, industry-wide phenomena rather than problems localized to specific organisational contexts [
43]. This contrasts with Na et al. [
44], who identified firm size as a significant moderator in South Korean construction, and may reflect the comparatively more centralised structure of the Saudi construction ecosystem wherein government-driven conditions exert dominant influence.
5.2. The Perception–Structure Paradox
The most theoretically significant contribution of this study resides in the systematic divergence between survey-derived barrier rankings and the ISM-derived structural hierarchy. Data-related challenges constitute the highest-rated barriers in the survey (
Table 5, Q8 items), yet the ISM analysis positions them at Level I with maximum dependence power and minimal driving power (
Table 10). Conversely, limited government support registers the lowest barrier rating but occupies Level V as the singular root cause with maximum driving power.
This inversion is explicable through the visibility-causality distinction in complex systems. Data challenges, tangibly encountered in daily practice, possess high phenomenological salience that elevates their perceived severity. Government frameworks, operating at a structural remove from daily experience, are less salient despite their foundational causal role. Respondents accurately report experienced symptoms while underestimating the systemic drivers generating those symptoms. This finding underscores the methodological value of augmenting perceptual surveys with structural modeling capable of penetrating beyond surface-level attributions.
The perception–structure divergence is theoretically explicable through the visibility-causality distinction rooted in cognitive accessibility. Barriers that manifest tangibly in daily practice, such as data quality deficiencies encountered during model training or trust concerns arising from direct interaction with AI outputs, possess high phenomenological salience and enter working memory frequently, producing elevated severity ratings. Barriers operating at institutional distance, such as regulatory frameworks and macro-level policy provisions, are cognitively diffuse for operational professionals and are consequently under-weighted in perceptual assessments despite their foundational causal role. The divergence is further amplified by a locus-of-control bias, whereby respondents more readily attribute adoption difficulties to factors they can directly observe than to upstream institutional conditions they cannot influence. The practical implication is that perception-based barrier prioritisation systematically directs resources toward symptoms rather than causes, and this misdirection is inherent to the method rather than correctable through larger samples alone.
The paradox extends to the workforce domain. Insufficient training (B4) registers the highest RII among all barrier items, yet the ISM positions it at Level III, driven by deeper government and leadership deficiencies. Interventions targeting training in isolation, without addressing structural antecedents, would yield only transient remediation.
5.3. The Structural Architecture of Adoption Barriers
In developing the discussion of the structural hierarchy, the present study advances two emergent theoretical concepts derived from the ISM analysis. The Human Capital Bridge refers to the tightly coupled dyad of workforce skills and training infrastructure that serves as the primary translation mechanism through which strategic-level drivers are converted into operational-level outcomes. The Attitudinal Relay Layer denotes the cluster of linkage variables, comprising resistance to change, low trust, limited awareness, and fear of displacement, which amplifies and propagates the effects of deeper structural conditions through self-reinforcing feedback loops and exhibits bidirectional sensitivity to both upstream drivers and downstream symptoms. These constructs are theoretical contributions of the present research rather than descriptive headers for the ISM levels, and they are intended for transferable application in future studies examining technology adoption in government-influenced ecosystems.
5.3.1. The Government-Policy Foundation (Level V)
The positioning of limited government support as the singular root cause resonates with the TOE framework’s emphasis on the regulatory environment as a foundational enabler of technology adoption [
44,
45]. Within the Saudi context, this acquires particular significance given government’s central role in economic direction-setting through Vision 2030. Na et al. [
7], employing a combined TAM-TOE framework in South Korea, similarly identified government policy as critical, though without structural modeling to establish hierarchical primacy. The strong consensus in Q7 (
Table 5), where all interventions exceed 3.50, provides concurrent validation: respondents intuitively recognise the necessity of government action even while not rating its absence as a top-tier barrier.
5.3.2. The Strategic Driver Layer (Level IV)
The co-positioning of high implementation cost (B2) and limited leadership understanding (B5) reflects their complementary roles as strategic gatekeepers. Cost functions as a tangible resource constraint modulated by government subsidies from Level V. Leadership understanding operates through a distinct mechanism: without strategic comprehension of AI’s return on investment, decision-makers underinvest in both technology and human capital. This echoes Khan et al. [
17] who identified knowledge integration and management-level AI literacy as critical mediators of adoption in construction SMEs.
5.3.3. The Human Capital Bridge (Level III)
Workforce skills (B3) and training programs (B4) at Level III, with mutual influence between them, establish these factors as the critical translation mechanism through which strategic-level drivers are converted into operational-level impacts. The mutual influence relationship captures a bidirectional dependency: skills gaps generate demand for training programs, while inadequate training perpetuates and deepens those gaps. This tightly coupled dyad serves as the primary conduit through which governmental and leadership-level interventions transmit their effects into the attitudinal and data-related outcome layers. The finding that insufficient training registers the highest RII (0.705) among all barrier items, despite its intermediate structural position, reflects the fact that this barrier is the point at which upstream strategic deficiencies become tangibly manifest in professional practice.
5.3.4. The Attitudinal Relay Layer (Level II)
The Level II cluster comprising resistance to change (B6), low trust (B7), limited awareness (B8), and fear of job displacement (B12) functions as a set of linkage variables that amplify and propagate the effects of deeper structural deficiencies. The mutual influence relationships among these four barriers indicate self-reinforcing feedback loops: resistance diminishes willingness to engage with AI, which limits awareness of benefits, which sustains low trust, which intensifies fear of displacement, which reinforces resistance. This characterization aligns with the psychological resistance mechanisms identified by Emaminejad & Akhavian [
10] in their analysis of trust in construction AI, and with Singh et al. [
12], who identified circular causal patterns among organisational, psychological, and informational barriers in construction supply chains.
The MICMAC classification of these barriers as Linkage variables carries important policy implications. Linkage variables are sensitive to perturbations from both directions: improvements in upstream drivers will propagate positively through this layer, but negative feedback from downstream data challenges can also reinforce resistance. This bidirectional sensitivity renders the attitudinal layer inherently unstable and suggests that interventions at this level require sustained reinforcement from deeper structural layers to achieve durable change. Isolated trust-building or awareness campaigns, absent improvements in training infrastructure and leadership commitment, would likely produce only temporary attitudinal shifts.
5.3.5. The Data Ecosystem Outcomes (Level I)
The classification of data quality (B9), standardization (B10), and privacy concerns (B11) as purely Dependent variables at Level I represents the finding with the most direct implications for resource allocation. Despite constituting the most acutely perceived challenges in the survey, these barriers possess the lowest driving power in the structural model, indicating that they are predominantly symptoms of workforce, leadership, and policy deficiencies occupying the lower tiers of the hierarchy. Investing substantially in data infrastructure without concurrently addressing the human and institutional factors that generate data deficiencies would yield diminishing returns. This interpretation is consistent with Soman & Whyte [
33], who identified codification challenges in construction data science as fundamentally rooted in organisational practices rather than in technical infrastructure limitations.
5.3.6. The Correlation Paradox: Experience, Benefits, and Barriers
The concurrent positive correlations between AI usage and both perceived benefits (rho = 0.364, p < 0.001) and perceived barriers (rho = 0.351, p < 0.001) constitute a nuanced empirical pattern that defies simplistic interpretation. The usage-benefits correlation is straightforwardly attributable to experiential learning: professionals who have deployed AI tools have directly observed productivity gains and consequently rate benefits more highly. The parallel usage-barriers correlation demands a more sophisticated theoretical account.
The most parsimonious explanation invokes the competence-awareness hypothesis adapted to technology adoption contexts. Professionals at early stages of AI engagement may systematically underestimate implementation complexity because they have not yet encountered it. As usage deepens and professionals confront practical realities of data integration, model validation, workflow disruption, and regulatory ambiguity, their barrier severity assessments calibrate upward. This carries a significant practical corollary: the aggregate barrier ratings, which include a substantial proportion of respondents with limited AI experience (61.9% reporting only 1 to 5 years of total professional experience), may represent a lower-bound estimate of the true barrier severity that a more experienced cohort would perceive.
5.4. Strategic Implications and Phased Intervention Architecture
The hierarchical architecture revealed by the ISM analysis prescribes a phased intervention strategy that proceeds from root causes to intermediate mechanisms to surface-level outcomes. This bottom-up sequencing contrasts with the priorities that would be derived from survey rankings alone, which would direct resources primarily toward data infrastructure and trust-building at the expense of deeper structural enablers.
The first phase must target the government-policy foundation through a comprehensive national AI regulatory framework for the construction sector, encompassing mandatory data standardization protocols, interoperability requirements, and cybersecurity mandates. Concurrently, financial mechanisms including tax incentives, direct subsidies, and innovation grants should reduce the cost barriers constraining private sector investment. These interventions activate the multiplier effects inherent in B1 having maximum driving power, initiating cascading improvements through the entire barrier hierarchy.
The second phase addresses the strategic driver layer through executive education programs targeting construction industry leadership, designed to develop AI literacy sufficient for informed investment decisions. Industry–academia collaborative structures, such as AI centres of excellence co-funded by government and industry, should institutionalize knowledge transfer pathways. The third phase targets the human capital bridge through curricular reform integrating AI competencies into engineering and construction management programmes, professional certification in construction AI applications, and expanded continuing professional development frameworks.
The fourth phase addresses the attitudinal relay layer through demonstration projects, case study dissemination, and managed pilot implementations generating empirical evidence of AI value within the Saudi context. The fifth and final phase addresses data ecosystem outcomes, which the structural model predicts will be substantially ameliorated by the cascading effects of the preceding phases. Targeted data infrastructure investments at this stage build upon improved organisational capacity and regulatory frameworks established through earlier phases, maximizing their return.
To enable empirical evaluation of the proposed phased intervention architecture, a set of measurable outcome indicators is proposed in
Table 13, keyed to the hierarchical levels of the ISM model. The selection of indicators follows two principles. First, each phase is evaluated against indicators aligned with the driving-power profile of the targeted barriers, ensuring that intervention success is measured at the level at which the intervention operates. Second, the indicators are constructed as replicable survey items or observable administrative data, permitting longitudinal tracking through periodic follow-up studies.
5.5. Theoretical Contributions and Limitations
Several limitations warrant acknowledgment, each of which opens a specific future research avenue. First, the SSIM relationships were established through literature-based triangulation rather than a formal Delphi expert panel, introducing an element of researcher judgment into the structural modelling phase. Future research should validate the present SSIM through structured Delphi rounds involving construction executives, regulators, and AI practitioners with deep contextual expertise in the Saudi sector. Second, the cross-sectional design precludes assessment of how barrier perceptions and structural relationships evolve as AI adoption matures. Longitudinal studies that re-administer the present instrument at multi-year intervals would permit tracking of the hierarchical evolution predicted by the phased intervention architecture. Third, the sample skews toward early-career professionals, with 61.9 percent reporting one to five years of experience, and may underrepresent senior decision-makers whose strategic assessments are critical to adoption outcomes. Purposive stratified sampling of C-suite respondents in follow-up investigations would address this gap. Fourth, the gender distribution of 91.7 percent male reflects sectoral reality but limits generalisability. Parallel studies in contexts with greater gender balance would enable comparative analysis of perceptual patterns. Fifth, the instrument does not capture organisation-level moderators such as firm size or existing technology infrastructure. Future research should embed the present barrier instrument within a multi-level design incorporating firm-level covariates as moderating factors. Taken together, these extensions define a coherent research agenda for maturing the structural understanding of AI adoption in construction.
6. Conclusions
This study set out to develop a systemic understanding of the barriers constraining artificial intelligence adoption in the Saudi Arabian construction industry. Moving beyond conventional perceptual ranking approaches, the research integrated large-sample survey evidence with ISM–MICMAC structural modelling to reveal the hierarchical architecture of adoption constraints. The findings indicate that AI utilization in the sector remains at a moderate stage, characterized by stronger uptake of data-centric analytical tools compared with physically embodied automation technologies. While practitioners most acutely perceive data-related deficiencies and trust concerns, the structural analysis demonstrates that these issues are largely downstream manifestations of deeper institutional and organizational conditions.
The ISM hierarchy identifies limited government support and regulatory clarity as the foundational driver shaping the entire adoption ecosystem. This root constraint propagates through strategic-level cost pressures and leadership capability gaps, which in turn generate workforce readiness deficits and reinforce attitudinal resistance within organizations. Data quality and standardization problems although highly visible in practice emerge as dependent outcomes rather than primary causes. The absence of autonomous barriers in the MICMAC classification further confirms that AI adoption challenges in the Saudi construction sector form a tightly interconnected system requiring coordinated intervention.
From a theoretical perspective, the study contributes to the technology adoption literature by empirically demonstrating the perception–structure paradox, wherein the barriers most strongly perceived by practitioners are not necessarily those with the greatest causal influence. Methodologically, the research illustrates the value of combining perceptual survey methods with structural modelling techniques to capture the systemic dynamics of emerging technology adoption in complex project environments. Practically, the findings suggest that policy-led and leadership-focused initiatives are likely to yield significantly greater leverage than isolated investments in data infrastructure or awareness campaigns.
There are several limitations that need to be acknowledged. Such as the cross-sectional design captures perceptions at a single point in time and may not fully reflect the rapid evolution of AI capabilities. The SSIM relationships, while grounded in literature and logical reasoning, would benefit from future validation through Delphi-based expert consensus. In addition, the sample composition is weighted toward early-career professionals, which may influence barrier salience. Future research should incorporate longitudinal designs, firm-level capability variables, and cross-country comparisons to further refine the structural understanding of AI adoption pathways.
The broader theoretical consequence of these findings is that any AI diffusion strategy relying exclusively on end-user surveys for barrier prioritisation is structurally predisposed to fail, because end-users cannot observe the institutional and policy drivers that generate the symptoms they experience. Effective technology adoption frameworks in government-influenced ecosystems therefore require analytical architectures that explicitly model the causal depth of barriers and sequence interventions accordingly. The Saudi construction case examined here illustrates a generalisable principle that extends beyond the immediate empirical setting: in sectors where state-led institutional conditions exert dominant influence, the perceptual visibility of a barrier tends to be inversely related to its structural causal importance. Recognising this inversion is a prerequisite for designing interventions that produce durable rather than superficial digital transformation.




 ,
,