Article

Decoding Public Perception of Brownfield-Transformed Urban Parks: An Interpretable Machine Learning Framework Integrating XGBoost–SHAP

School of Architecture, Chang’an University, Xi’an 710061, China
*
Author to whom correspondence should be addressed.
Buildings 2026, 16(8), 1632; https://doi.org/10.3390/buildings16081632
Submission received: 9 March 2026 / Revised: 1 April 2026 / Accepted: 11 April 2026 / Published: 21 April 2026
(This article belongs to the Section Architectural Design, Urban Science, and Real Estate)

Abstract

Brownfield-transformed urban parks, particularly those derived from industrial heritage, play a critical role in both cultural preservation and public-space provision. However, existing studies often rely on linear models and general urban contexts, limiting their ability to capture nonlinear, interaction-driven perception and translate analytical results into design-oriented insights. To address this gap, this study develops an interpretable data-driven framework integrating NLP (natural language processing) with explainable machine learning. Using social media reviews from Shougang Park in Beijing, built environmental elements are identified and structured into four dimensions—Accessibility, Safety, Comfort, and Enjoyment. An XGBoost model combined with SHAP analysis is employed to examine variable importance, nonlinear relationships, and interaction effects. The results reveal that visitor satisfaction is governed by heterogeneous and nonlinear relationships rather than independent additive effects. Several variables exhibit threshold-like, diminishing, and inverted-U-shaped patterns, indicating sensitivity to intensity ranges. More importantly, spatial perception emerges from the nonlinear coupling of multiple elements, forming four representative interaction types: compensatory, inverted-U-shaped, context-dependent, and threshold-like relationships. Key interactions are concentrated around industrial landscape, leisure activities, and supporting facilities. Building on these findings, the study translates interactions into design-oriented strategies, emphasizing synergistic configuration, functional balance, moderated development intensity, and context- sensitive programming. By linking interpretable machine learning with spatial design, this research advances an interaction-oriented paradigm and provides a transferable framework for satisfaction-informed evaluation and optimization of brownfields.

1. Introduction

Brownfield sites have increasingly been redeveloped into multifunctional urban parks through remediation and adaptive reuse, representing a key pathway for sustainable urban transformation by integrating land reuse, ecological restoration, and public well-being [1,2]. As cities transition from industrial to post-industrial economies, many former industrial facilities—such as factories, warehouses, and port infrastructures—have been repurposed into multifunctional urban parks, cultural venues, and mixed-use spaces. Representative examples include regeneration initiatives in the Ruhr Region, Landschaftspark Duisburg-Nord, industrial transformations in Turin, and Shougang Park in Beijing, reflecting a broader global shift toward adaptive reuse [3,4,5]. In this context, the regeneration of industrial heritage through brownfield transformation into publicly accessible spaces has become an important pathway for sustainable urban development [6,7]. Beyond physical restoration and functional reconfiguration, the performance of such regenerated environments is closely associated with public spatial perception—how visitors experience, interpret, and emotionally respond to these spaces. Environmental perception is inherently subjective and often exhibits nonlinear and context-dependent patterns in relation to built environment elements [8]. However, much of the existing research in environmental psychology and urban design has relied on linear analytical approaches, which may not adequately capture threshold effects, interaction patterns, or multi-dimensional relationships among environmental variables [9,10]. Consequently, current understanding of how different built environment elements are associated with perceived experience, particularly in complex regeneration contexts, remains limited.
Recent advances in data-driven urban research provide new opportunities to explore these relationships. Machine learning approaches offer flexible tools for modeling high-dimensional data and identifying nonlinear associations within human–environment systems [11]. Among them, XGBoost has demonstrated strong performance in handling complex feature structures [12], while SHAP (Shapley Additive Explanations) provides a means of interpreting model outputs by quantifying the relative contributions of variables and revealing response patterns [13,14]. Despite these advances, three key limitations remain. First, existing studies primarily focus on general urban contexts such as vitality, safety, sentiment, and visual perception, with limited attention to experiential perception in brownfield regeneration settings such as industrial heritage parks. Second, although nonlinear relationships and interaction effects have been widely identified, they are rarely translated into decision-making frameworks based on social media with unstructured information. Third, the linkage between nonlinear response patterns, interaction structures, and design-oriented strategies remains insufficiently developed.
To address these gaps, this study adopts an interpretable machine learning framework that integrates XGBoost modeling with SHAP-based interpretation to examine perception patterns based on social media data. Specifically, the study aims to (1) examine nonlinear relationships and threshold-like patterns in environmental perception, and identify built environment elements associated with variations in visitor satisfaction and emotional responses.; (2) translate insights derived from identified built environment elements and their nonlinear patterns into interpretable, model-informed strategies to support perception-based assessment and design optimization of multifunctional urban parks transformed from industrial heritage brownfields. By transforming unstructured UGC (user-generated content) into structured variables and integrating explainable modeling techniques, the proposed approach establishes an interpretable and data-informed pathway that links perception analysis with design optimization. Beyond the specific case of industrial heritage parks, this framework also demonstrates broader applicability to brownfield regeneration contexts, supporting perception-informed evaluation as well as evidence-informed design and planning practices.

2. Research Background

2.1. Research on the Conservation and Regeneration of Industrial Heritage

Research on industrial heritage regeneration has expanded from project-based practices to broader policy and governance perspectives, with increasing attention to macro-level institutional contexts. In China, this process is closely linked to urban regeneration strategies and evolving heritage governance systems, where Dang et al. (2025) highlight institutional evolution [15], and Lu et al. (2020) reveal a parallel shift in discourse—from material preservation toward cultural value, creative reuse, and socio-economic integration [16]. From this perspective, industrial heritage regeneration is commonly conceptualized as a dual process involving both “public perceptions” and “heritage attributes” within the context of brownfield transformation. The former relates to the creation of accessible and livable environments through landscape design and infrastructure [17], while the latter focuses on preserving and reinterpreting industrial elements such as blast furnaces and machinery to construct place identity and historical narratives [6,7].
In addition, recent research increasingly incorporates sustainability-oriented perspectives. Arbab and Alborzi (2022) propose integrated frameworks linking heritage conservation with sustainable urban development [18], while Sun and Chen (2023) demonstrate how policy-driven regeneration supports functional transformation in post-industrial cities [19]. However, existing studies have primarily focused on brownfield redevelopment, post-occupancy evaluation, and governance mechanisms [3,4], with relatively limited attention to spatial quality and vitality from the perspective of public experiential perception. In particular, quantitative approaches that capture the nonlinear relationships between environmental attributes and public perceptions remain insufficiently examined.

2.2. Studies on Public Perception and Satisfaction

As research perspectives shift from macro-level planning to micro-scale experiential analysis, public perception has increasingly been recognized as a crucial indicator for evaluating the effectiveness of regeneration projects [20,21]. The study of perception is grounded in theories from Environmental Psychology and Human–Environment Relations, emphasizing individuals’ subjective judgments of environmental elements, emotional attachments to places, and the formation of spatial images [22]. Within heritage contexts, perception extends beyond esthetic appreciation to encompass historical memory, cultural identity, and the construction of a sense of place [23].
At the same time, participatory evaluation methods and data-driven approaches, based on user feedback, have gained prominence, providing an important foundation for bridging the gap between objective measurements and subjective experiences [24]. Existing research has largely concentrated on environmental dimensions that influence satisfaction. Multidimensional empirical studies have consistently confirmed the role of physical attributes in shaping public perception. In terms of Accessibility, scholars such as Wu and Sugiyama have demonstrated that transportation convenience and parking availability significantly influence visitors’ willingness to access sites and their overall satisfaction [25,26]. Regarding Safety, studies by Fletcher and colleagues indicate that effective maintenance management and appropriate safety facilities can substantially enhance users’ sense of spatial trust and security [27]. Concerning Comfort, researchers such as Veitch and Talal highlight the close relationships between vegetation quality, microclimatic conditions, resting facilities, and both length of stay and levels of outdoor activity [28,29]. Finally, within the dimension of Enjoyment, studies by Qiu and Liu reveal that distinctive landscape elements—particularly symbolic industrial relics—serve as key sources for establishing place identity and enhancing the appeal of industrial heritage environments [6,30].

2.3. Applications and Advances of the XGBoost–SHAP Framework in Built Environment Perception Studies

Recent studies have increasingly employed machine learning methods to investigate complex relationships between the built environment and human perception, behavior, and environmental performance. Among these, XGBoost has been widely adopted due to its strong predictive performance and its capacity to capture nonlinear relationships and interaction effects beyond conventional linear models [31,32]. Recent studies further demonstrate that residents’ psychological perception is shaped by non-monotonic environmental responses rather than simple linear relationships [33]. Empirical evidence indicates that built environment elements often exhibit threshold effects, diminishing returns, and spatial heterogeneity, particularly in studies of urban vitality and sentiment, underscoring the importance of modeling coupled and context-dependent relationships across multiple spatial dimensions [34]. In addition, interaction effects among built environment elements have been shown to play a critical role in shaping urban outcomes, suggesting that spatial performance emerges from interdependent systems rather than isolated factors [35]. To enhance the interpretability of such models, SHAP (Shapley Additive Explanations) has been increasingly introduced to quantify variable contributions and reveal local and global response patterns [36,37,38,39]. By decomposing model outputs, SHAP transforms black-box predictions into interpretable spatial knowledge, including nonlinear response curves and feature interactions. Moreover, explainable research highlights that without interpretable outputs, the application of advanced machine learning models in urban design and planning remains limited [40].
In parallel, perception-oriented urban research has increasingly integrated social media data and deep learning techniques to capture subjective experience at scale. For example, studies on urban walking experience reveal that spatial perception is jointly influenced by built environment elements and user-generated interactions, reflecting the coupling between physical space and social behavior [41]. At a broader scale, deep learning approaches have shown that urban perception—such as safety, liveliness, and visual quality—can be quantitatively inferred from visual data across large spatial contexts [42]. Building on these developments, the combined XGBoost–SHAP framework has been increasingly applied to identify key elements and nonlinear effects in studies of urban form, thermal environments, green space, and public health outcomes [43]. Further evidence suggests that such frameworks are effective in integrating multi-source data to uncover complex perception patterns [44]. Together, these studies highlight a clear shift from predictive modeling toward interpretable and perception-oriented analysis of the built environment, while also demonstrating the growing integration of multi-source data and explainable AI in urban research.

3. Research Materials and Methods

3.1. Research Design

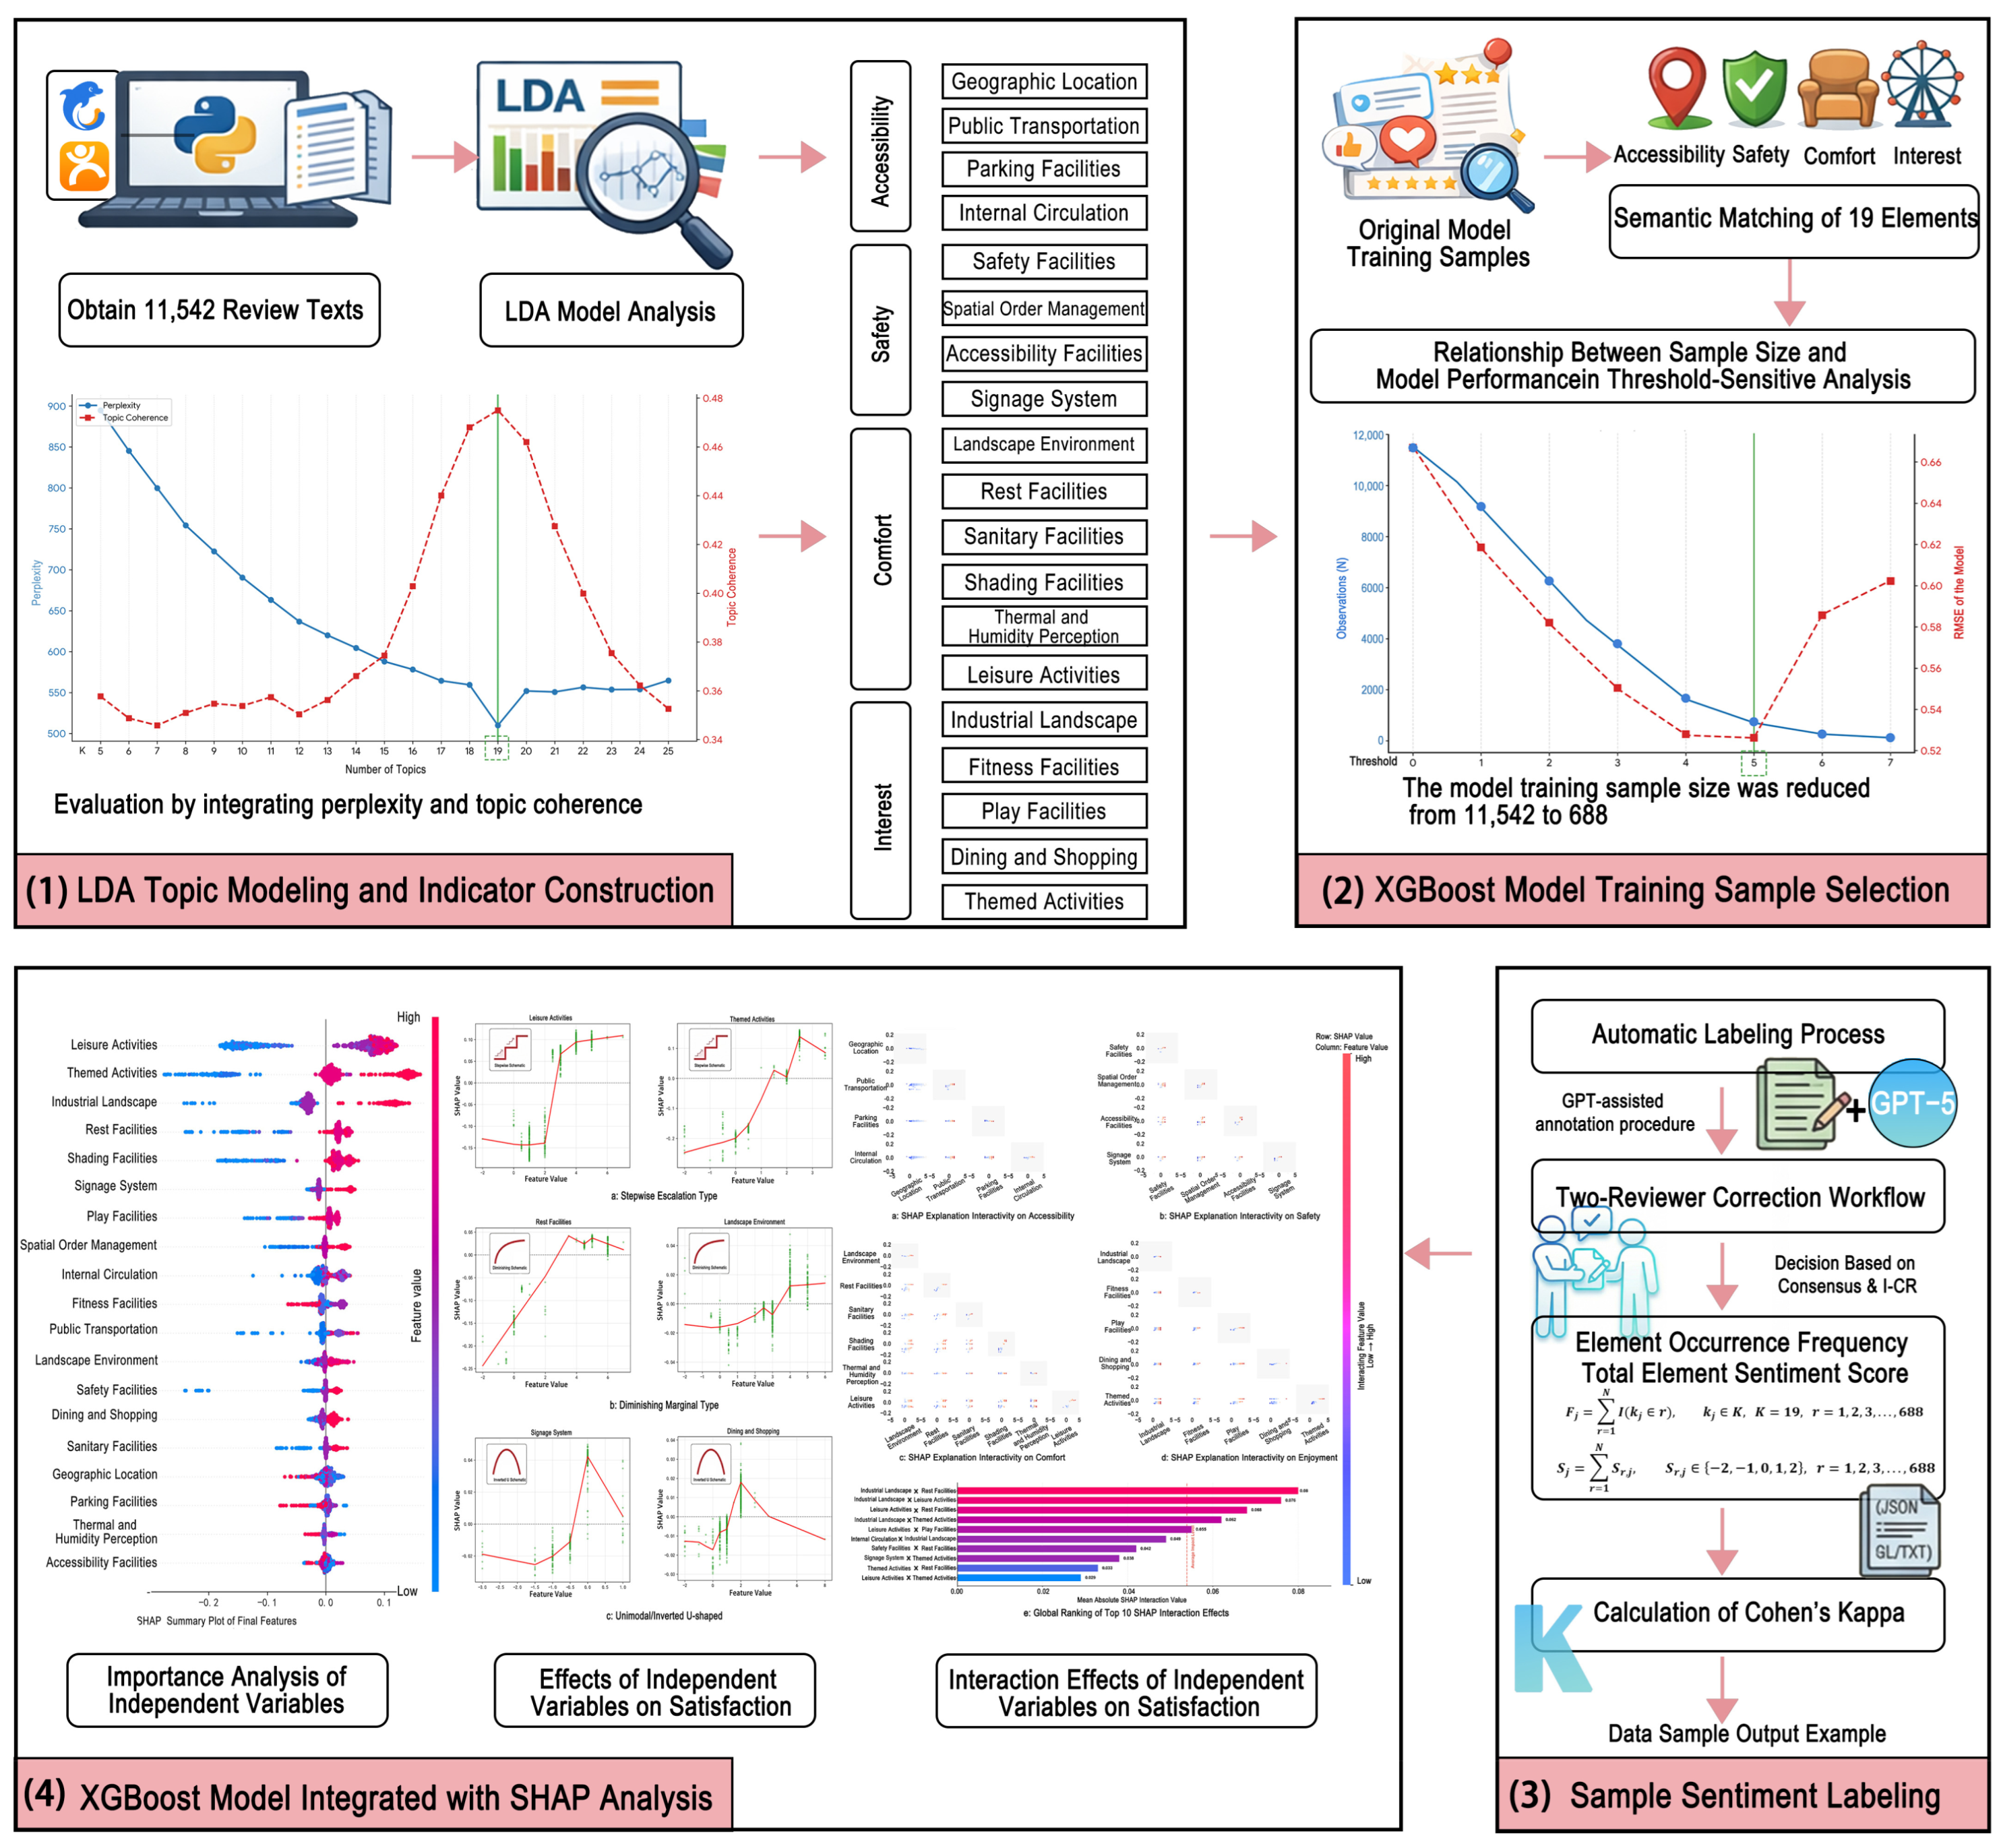
This study constructs a data-driven analytical framework consisting of three stages: qualitative extraction, quantitative modeling and interpretability analysis, and strategy translation. The framework aims to examine how built environment elements are associated with public perception in industrial heritage sites and to provide quantitative support for design optimization (Figure 1). Specifically, first, perception-related elements are identified through text semantic mining; second, machine learning models are applied to capture nonlinear relationships between environmental elements and visitor satisfaction; third, interpretability analysis is conducted to reveal variable contributions, response patterns, and interaction effects, and finally, the analytical results are translated in to interaction-informed design strategies to support spatial optimization.
(1) Qualitative extraction stage. A corpus of 11,542 social media comments was collected via web scraping using Python 3.13. Semantic identification was performed using the LDA (Latent Dirichlet Allocation) topic model [45]. The optimal number of topics was determined by evaluating model perplexity and topic coherence, resulting in the identification of 19 subtopics related to public perception. These subtopics were further synthesized into four principal dimensions: Accessibility [25,26], Safety [27], Comfort [28,29], and Enjoyment [6,30].
(2) Quantitative modeling stage. Given that some comments lacked explicit descriptions of spatial attributes, a keyword dictionary comprising 19 environmental elements was developed, and an “element coverage” indicator was proposed to assess the completeness of textual information. Through threshold sensitivity analysis, a balance was achieved between information quality and sample size. Ultimately, 688 semantically valid comments were retained for modeling. Sentiment labels were generated using GPT-assisted classification and verified manually to construct the training dataset [46]. Based on this dataset, a satisfaction prediction model was built using XGBoost [47].
(3) Interpretability analysis stage. Interpretation stage. To interpret the model results, the SHAP method was employed. By calculating Shapley Value contributions, the analysis identifies the influence of individual spatial elements on satisfaction, as well as their nonlinear relationships and interaction effects. These findings are subsequently translated into actionable spatial optimization and design strategies.
(4) Strategy translation stage. Building upon the identified nonlinear and interaction patterns this stage translates analytical findings into targeted design strategies. Specifically, interaction effects are categorized into four representative types—compensatory, inverted-U-shaped, context-dependent, and threshold-like—and linked to optimization strategies across the four perceptual dimensions and 19 built environment elements. Through this process, the framework establishes a systematic pathway from data-driven analysis to interaction-oriented spatial design, providing actionable guidance for the regeneration and optimization of industrial heritage brownfield parks.

3.2. Data Sources and Preprocessing

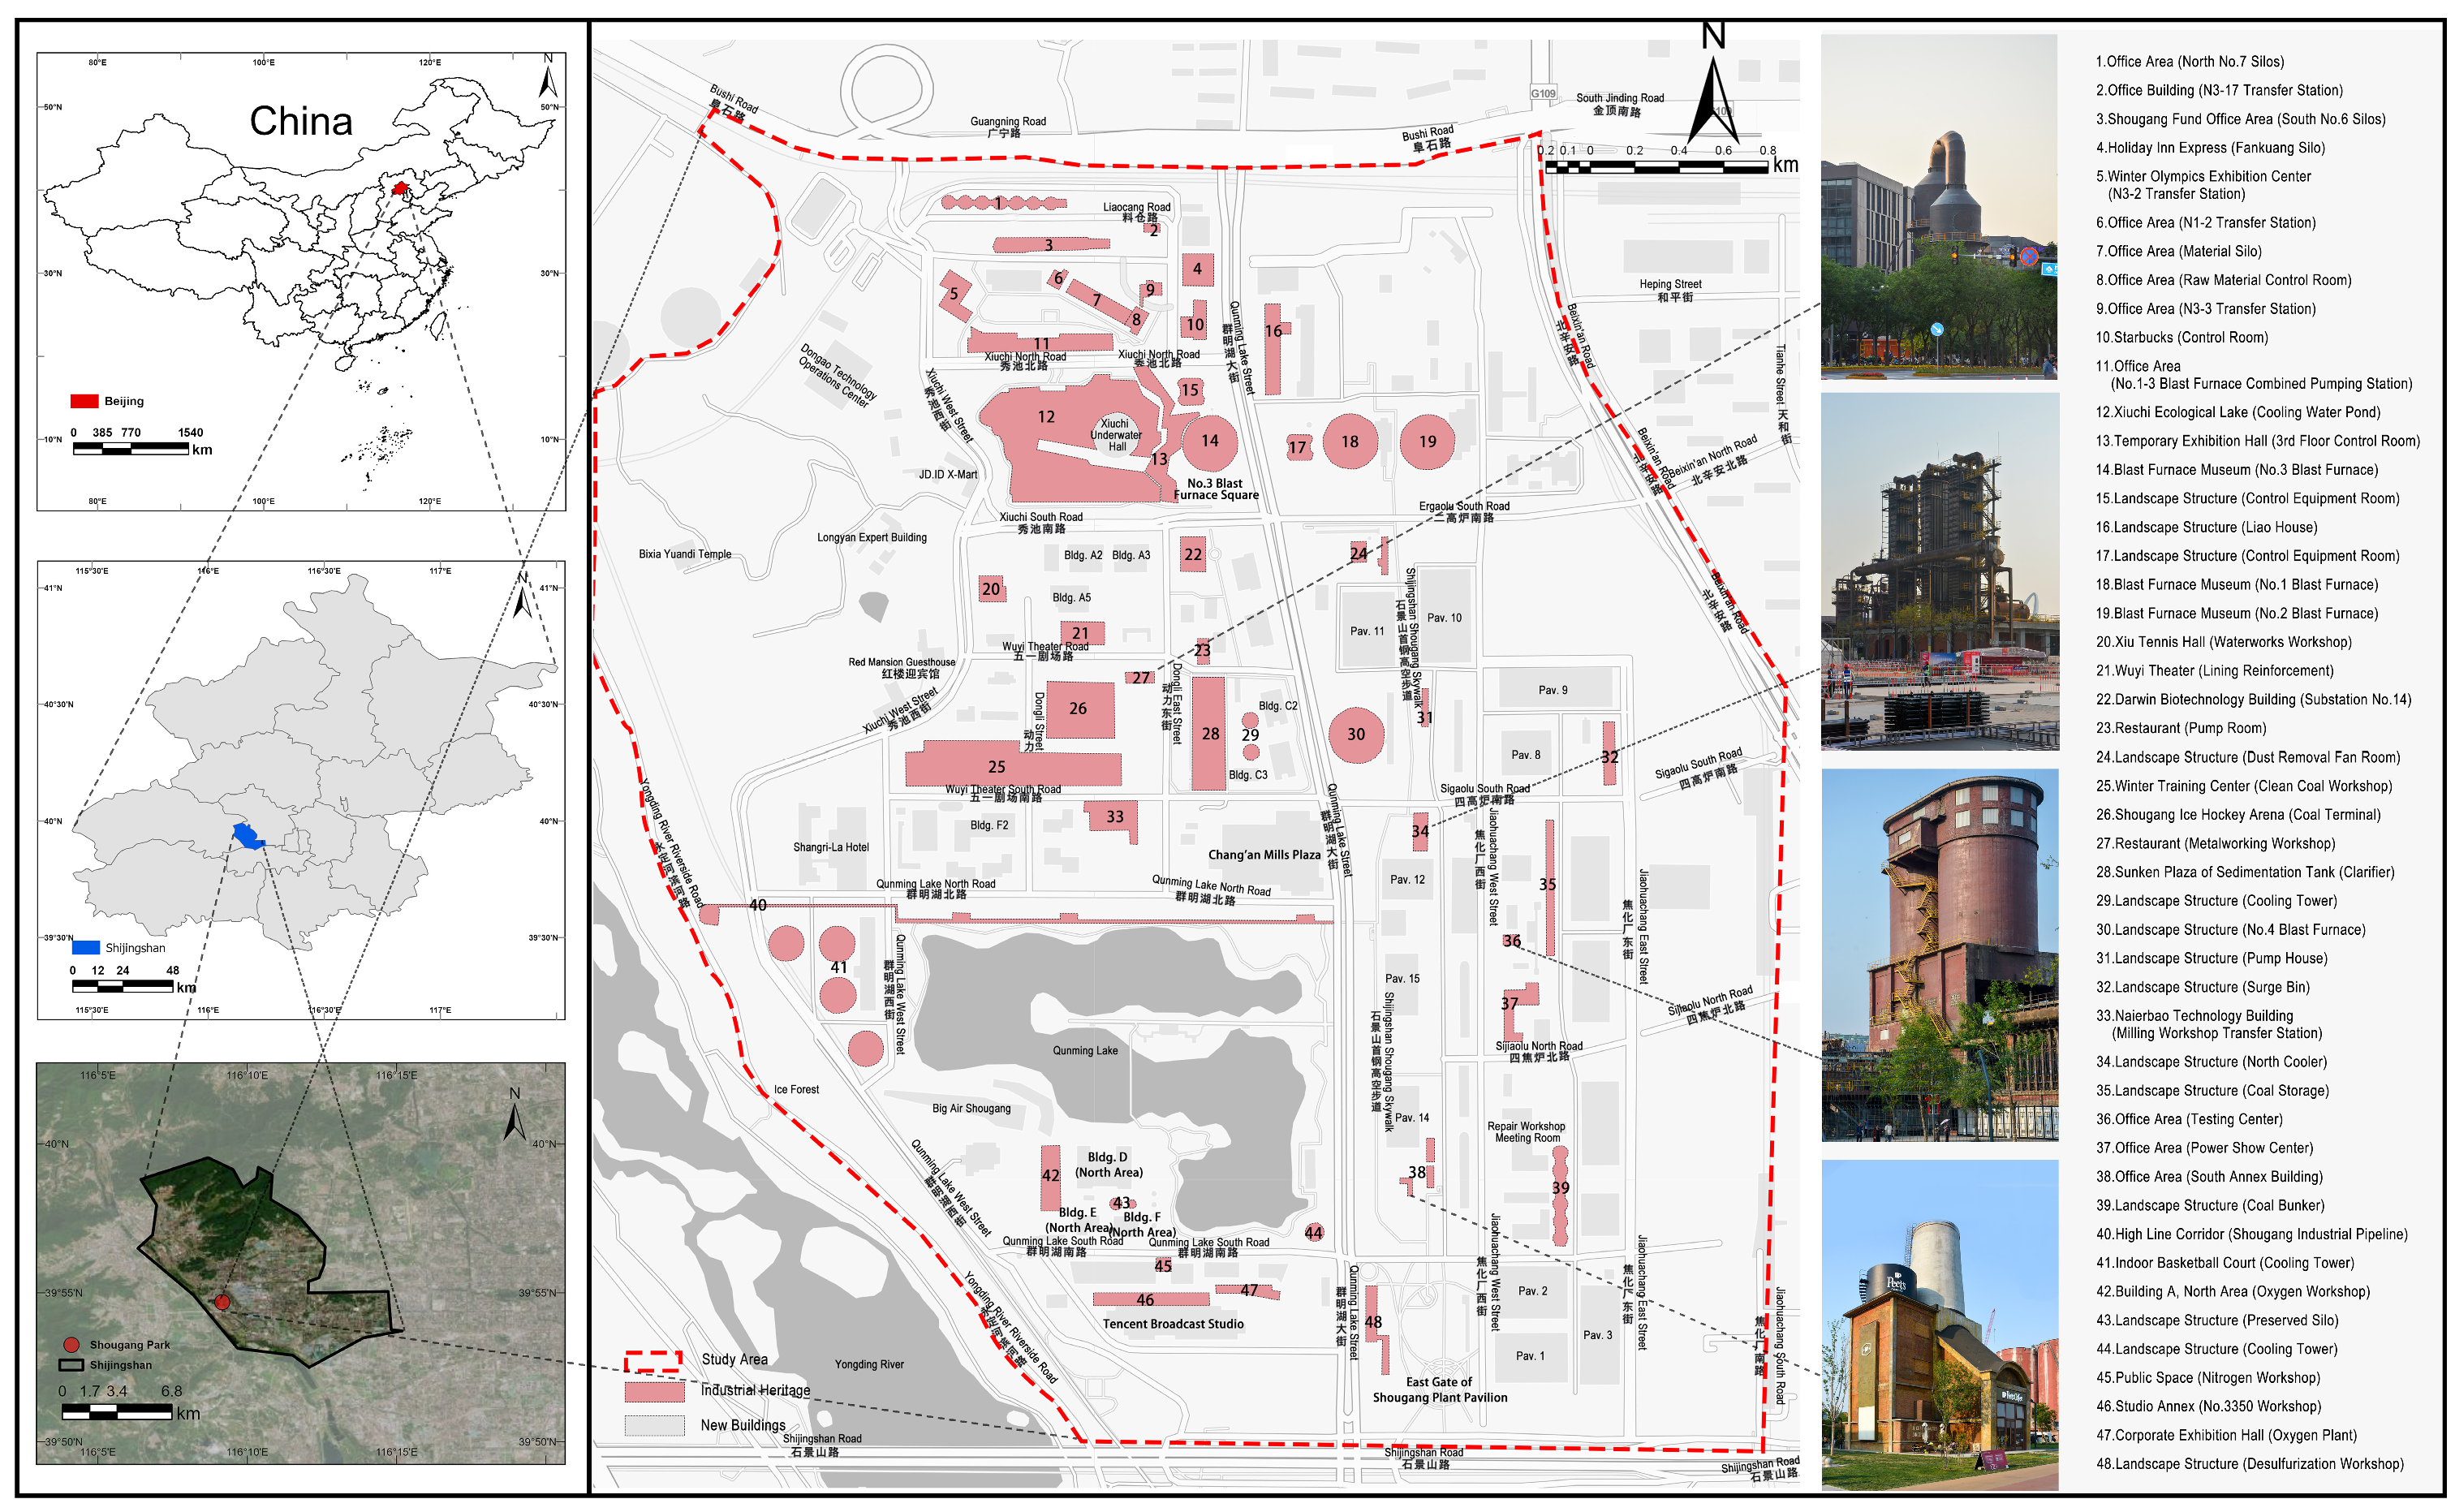
The Shougang Park industrial heritage site is located in Beijing’s Shijingshan District. Historically, it served as the core production base of the Shougang Group and symbolized the development of China’s modern heavy-industry system. It was one of the first sites included in the China Industrial Heritage Protection List, reflecting a high level of historical integrity and strong typological representativeness (Figure 2) [48]. Through the preservation of iconic industrial relics—such as blast furnaces and storage silos—combined with architectural renovation and landscape regeneration, the site has gradually transformed by integrating functions related to technological innovation, cultural and sports activities, and public services. As a result, the area has evolved into both a “high-end industrial innovation hub” and a “post-industrial cultural and sports creative district,” making it a representative example of industrial heritage regeneration in China. Today, Shougang Park hosts frequent public activities and features diverse spatial configurations, complex functional structures, and intensive regeneration interventions. While maintaining a relatively complete industrial landscape foundation, the site also accommodates multiple overlapping scenarios of public use. These characteristics provide rich conditions for examining nonlinear and interaction-dependent perception patterns based on social media data. However, as a large-scale, high-investment regeneration project with strong cultural branding, its empirical findings are context-specific. While the proposed framework is transferable, the results may not be directly generalizable to smaller or less-developed brownfield sites.
In terms of data sources, this study collected public review data from the Ctrip platform. As one of China’s major online travel service providers, Ctrip features a large user base, a standardized evaluation system, and rich textual content. Its review data thus provide valuable insights into visitors’ experiential feedback regarding tourism destinations and public-space environments [49]. Using a web-scraping program developed in Python, a total of 11,542 raw comments related to Shougang Park were collected. Each record contains two types of information: review text and a five-point satisfaction rating. The comments span from August 2020 to October 2025, covering multiple phases of public evaluation over time. Only publicly available comments were collected in compliance with platform usage policies. All reviews were treated in a standardized and anonymized manner, with any potential personal identifiers removed or not collected during the data acquisition process to ensure user privacy and data protection. The raw data were preprocessed through a systematic pipeline to ensure quality and reproducibility: HTML tags, hyperlinks, and non-textual symbols were removed; duplicate or invalid reviews, including those with missing or zero-length content or repetitive characters, were excluded; text was normalized for case, whitespace, and variant expressions; stop words were filtered using a standard Chinese stop-word dictionary; punctuation, emojis, and special characters were either removed or replaced with placeholders. The resulting cleaned dataset was then used for all downstream analyses, including sentiment annotation and model training. In the subsequent sentiment annotation stage, GPT-assisted classification was applied under human supervision, where a subset of samples was manually reviewed and cross-checked to ensure labeling consistency and reduce potential bias introduced by automated annotation.

3.3. LDA Topic Modeling and Indicator Construction

Based on the preprocessed dataset, natural language processing techniques were first employed to perform semantic structuring of the review texts [50]. The study used Jieba for Chinese word segmentation and applied the TF–IDF method to identify keywords with relatively high informational weight. This step helped reduce the influence of high-frequency but low-information words on topic identification.
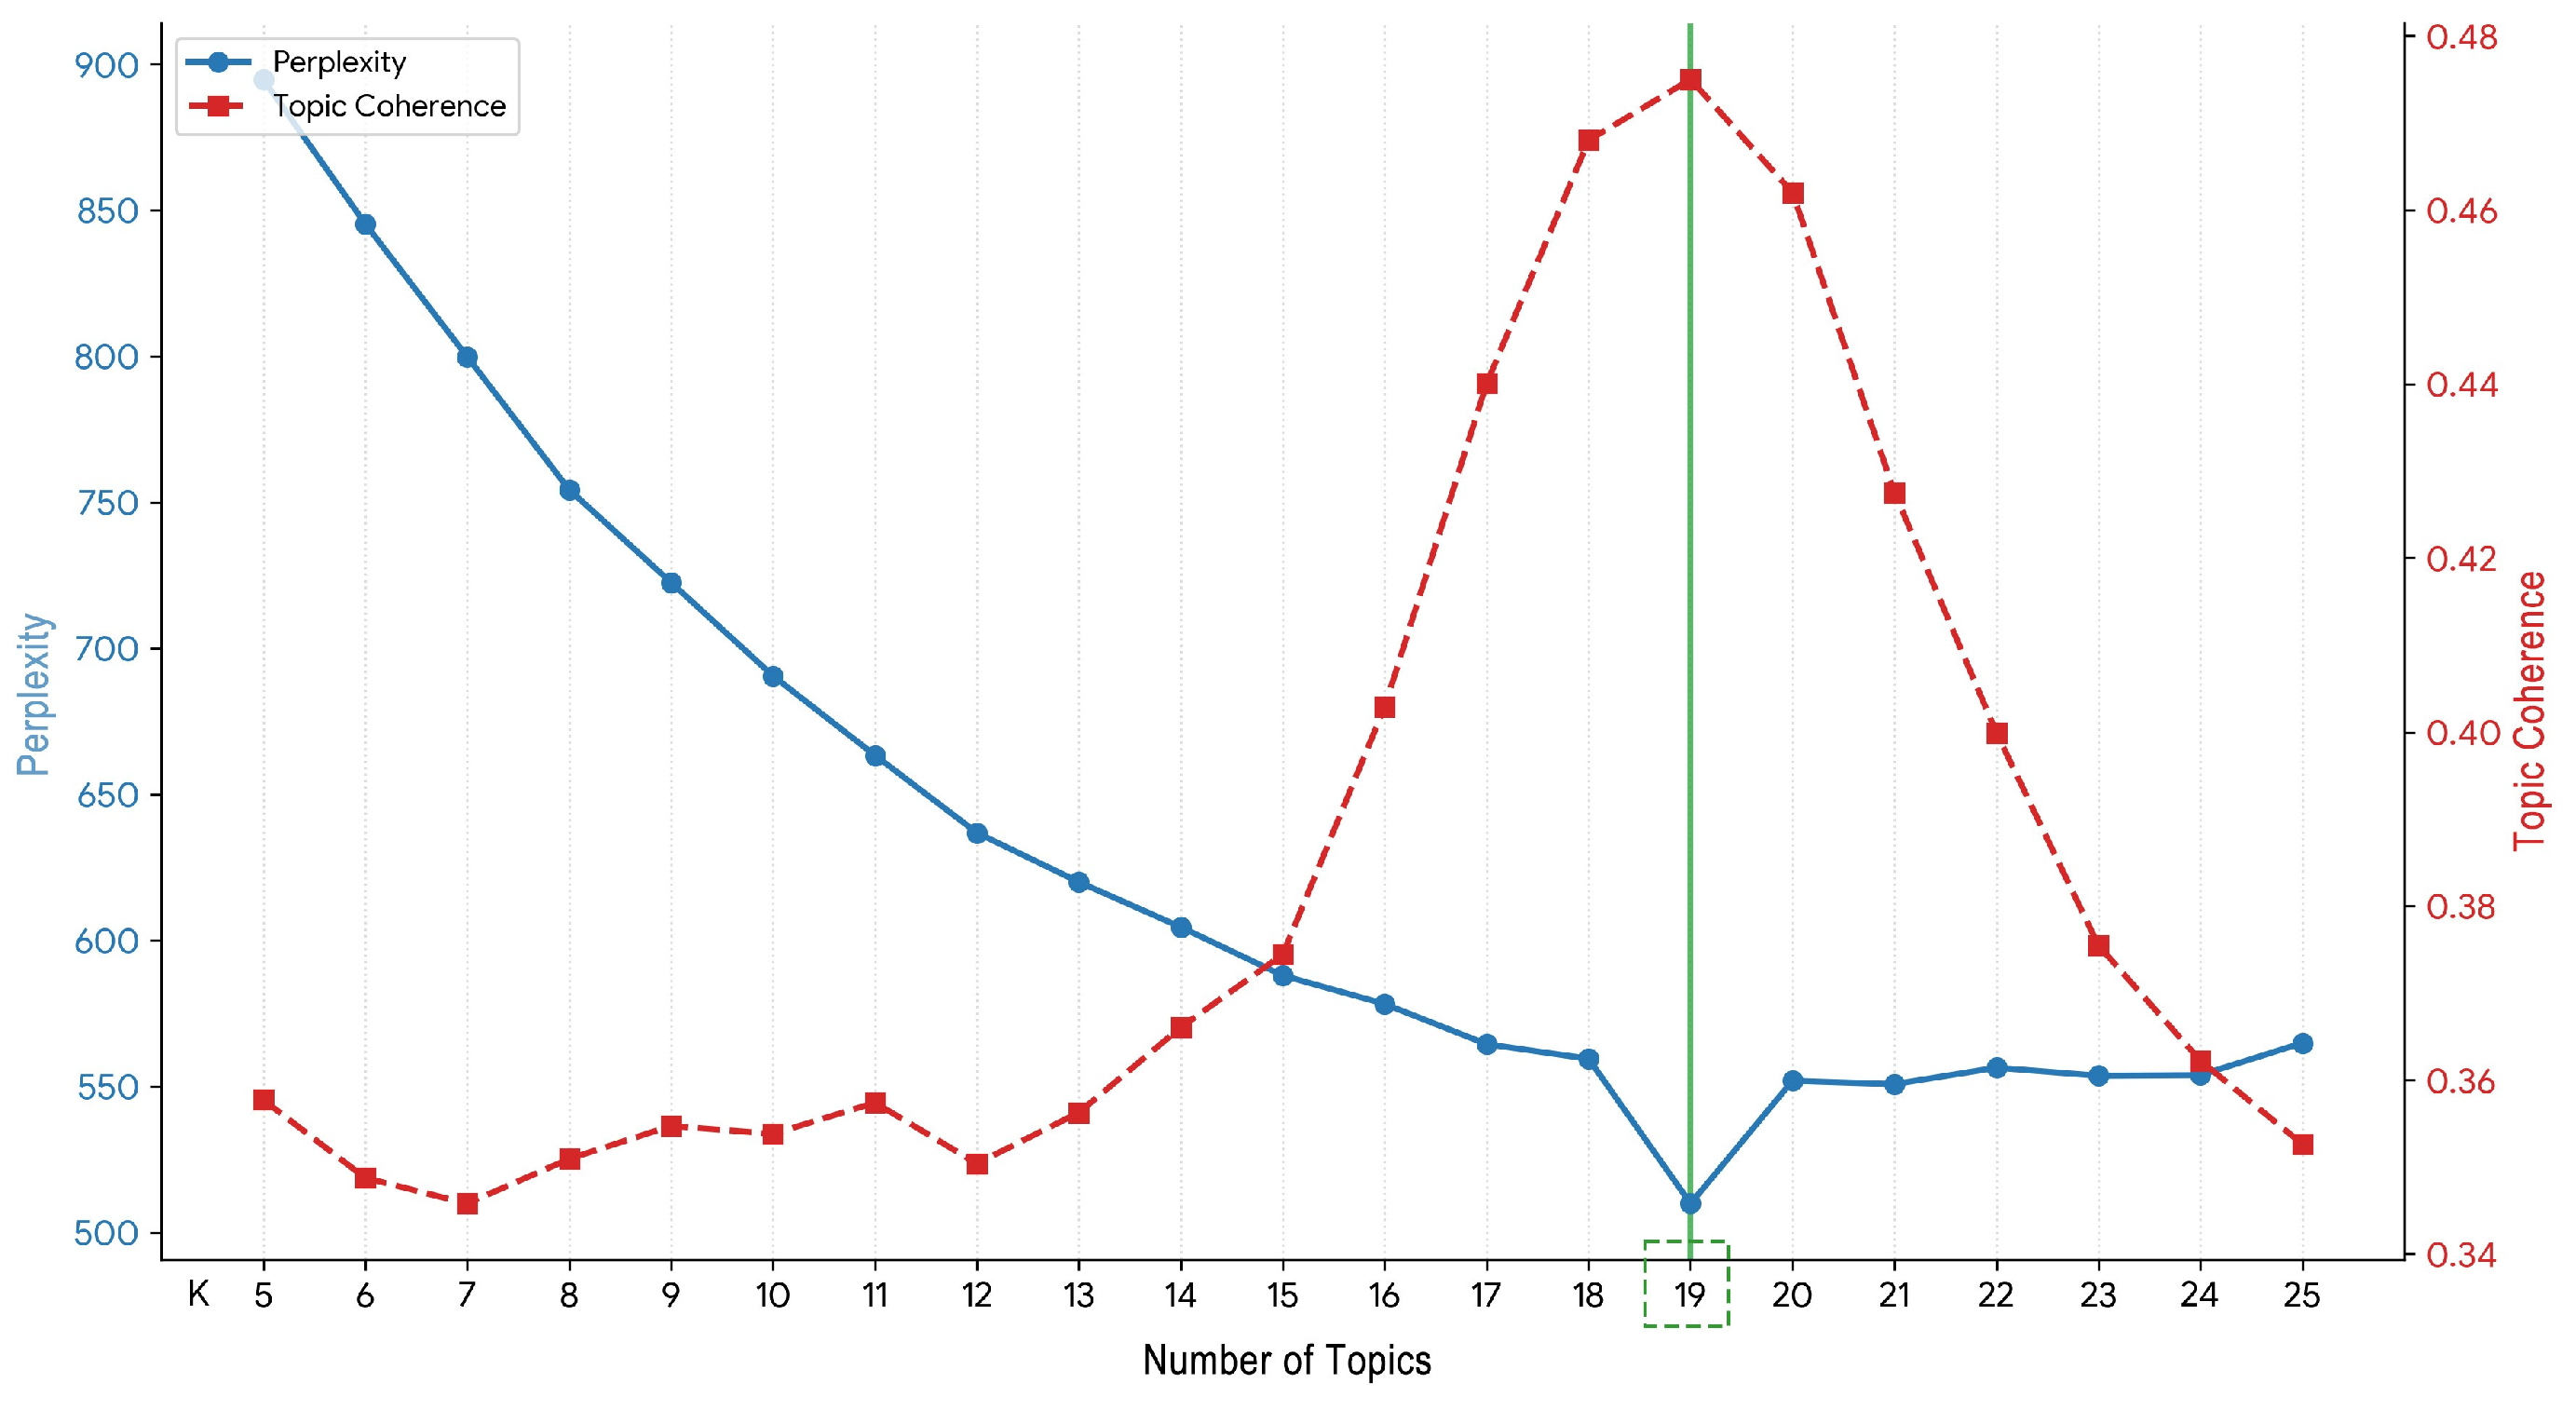
Subsequently, Latent Dirichlet Allocation (LDA) was implemented using the Gensim library in Python to perform unsupervised topic modeling [51]. The model was trained with the online variational Bayes algorithm, using symmetric Dirichlet priors (α and η), chunk_size = 2000, passes = 100, and a fixed random seed (random_state = 42) to ensure reproducibility. The number of topics was systematically explored within K = 5–25, and model performance was evaluated using both perplexity and topic coherence (C_v), computed via the Coherence Model in Gensim. The optimal configuration (K = 19) was determined based on a combined criterion of (1) a local minimum in perplexity, (2) a peak or plateau in coherence score, and (3) improved interpretability of topics in representing distinct built environment elements (Figure 3).

3.4. Training Sample Selection for the XGBoost Model

During the exploratory analysis of the dataset, it was observed that although all samples contained numerical rating labels, a considerable proportion of the review texts consisted only of simple emotional expressions such as “very good,” “nice,” or “recommended,” without describing specific built environment attributes. If such texts are directly used for supervised learning, a weak correspondence may emerge between satisfaction scores and influencing factors, potentially introducing label noise [52]. This, in turn, may reduce the model’s ability to identify the mechanisms through which environmental characteristics influence public perception. Therefore, prior to formal model training, it is necessary to conduct structured filtering of textual information quality [53] to improve both the semantic validity and interpretative value of the samples.
To measure the density of spatial information contained in each review, this study constructs an element coverage score (ECS) [54], which quantifies the breadth of built environment elements expressed within a single comment. The index is calculated based on a pre-established keyword dictionary covering 19 built environment elements and is defined as follows (1):
ECS i = k = 1 19 I ( w ik ) ,
where ECSi represents the element coverage score of review i; k denotes the k-th category of built environment elements; and wik indicates whether the keyword corresponding to the k-th element appears in review i. The indicator function I(wik) is defined as (2):
I ( w ik ) = 1 , if the element keyword appears in the review 0 , otherwise
It should be noted that when keywords belonging to the same element category appear multiple times within a review, they are counted only once. This approach ensures that the indicator reflects the breadth of spatial element coverage rather than the frequency of occurrence, thereby minimizing the interference from high-frequency emotional words or repeated expressions when identifying structural information.
To enhance the accuracy of semantic matching, synonyms, near-synonyms, and common variants within the keyword dictionary were standardized and consolidated. For example, terms such as “rest area,” “seat,” and “bench” were grouped under the category Rest Facilities, while “bus,” and “subway” were unified under Public Transportation. For terms with potential ambiguity, contextual semantic interpretation within the review text was used to determine their classification, reducing the risk of misidentification. To further justify this threshold, the retained and excluded samples were compared in terms of rating and temporal distributions, showing broadly consistent patterns without substantial distortion of overall sentiment structure or temporal dynamics. Although reviews with lower ECS values may still reflect valid overall satisfaction, they contain limited information on specific environmental attributes and are therefore less suitable for modeling environment–perception relationships. Accordingly, the ECS-based filtering is treated as a task-oriented sampling strategy that prioritizes explanatory relevance while maintaining acceptable representativeness, thereby enhancing model interpretability without introducing significant selection bias.
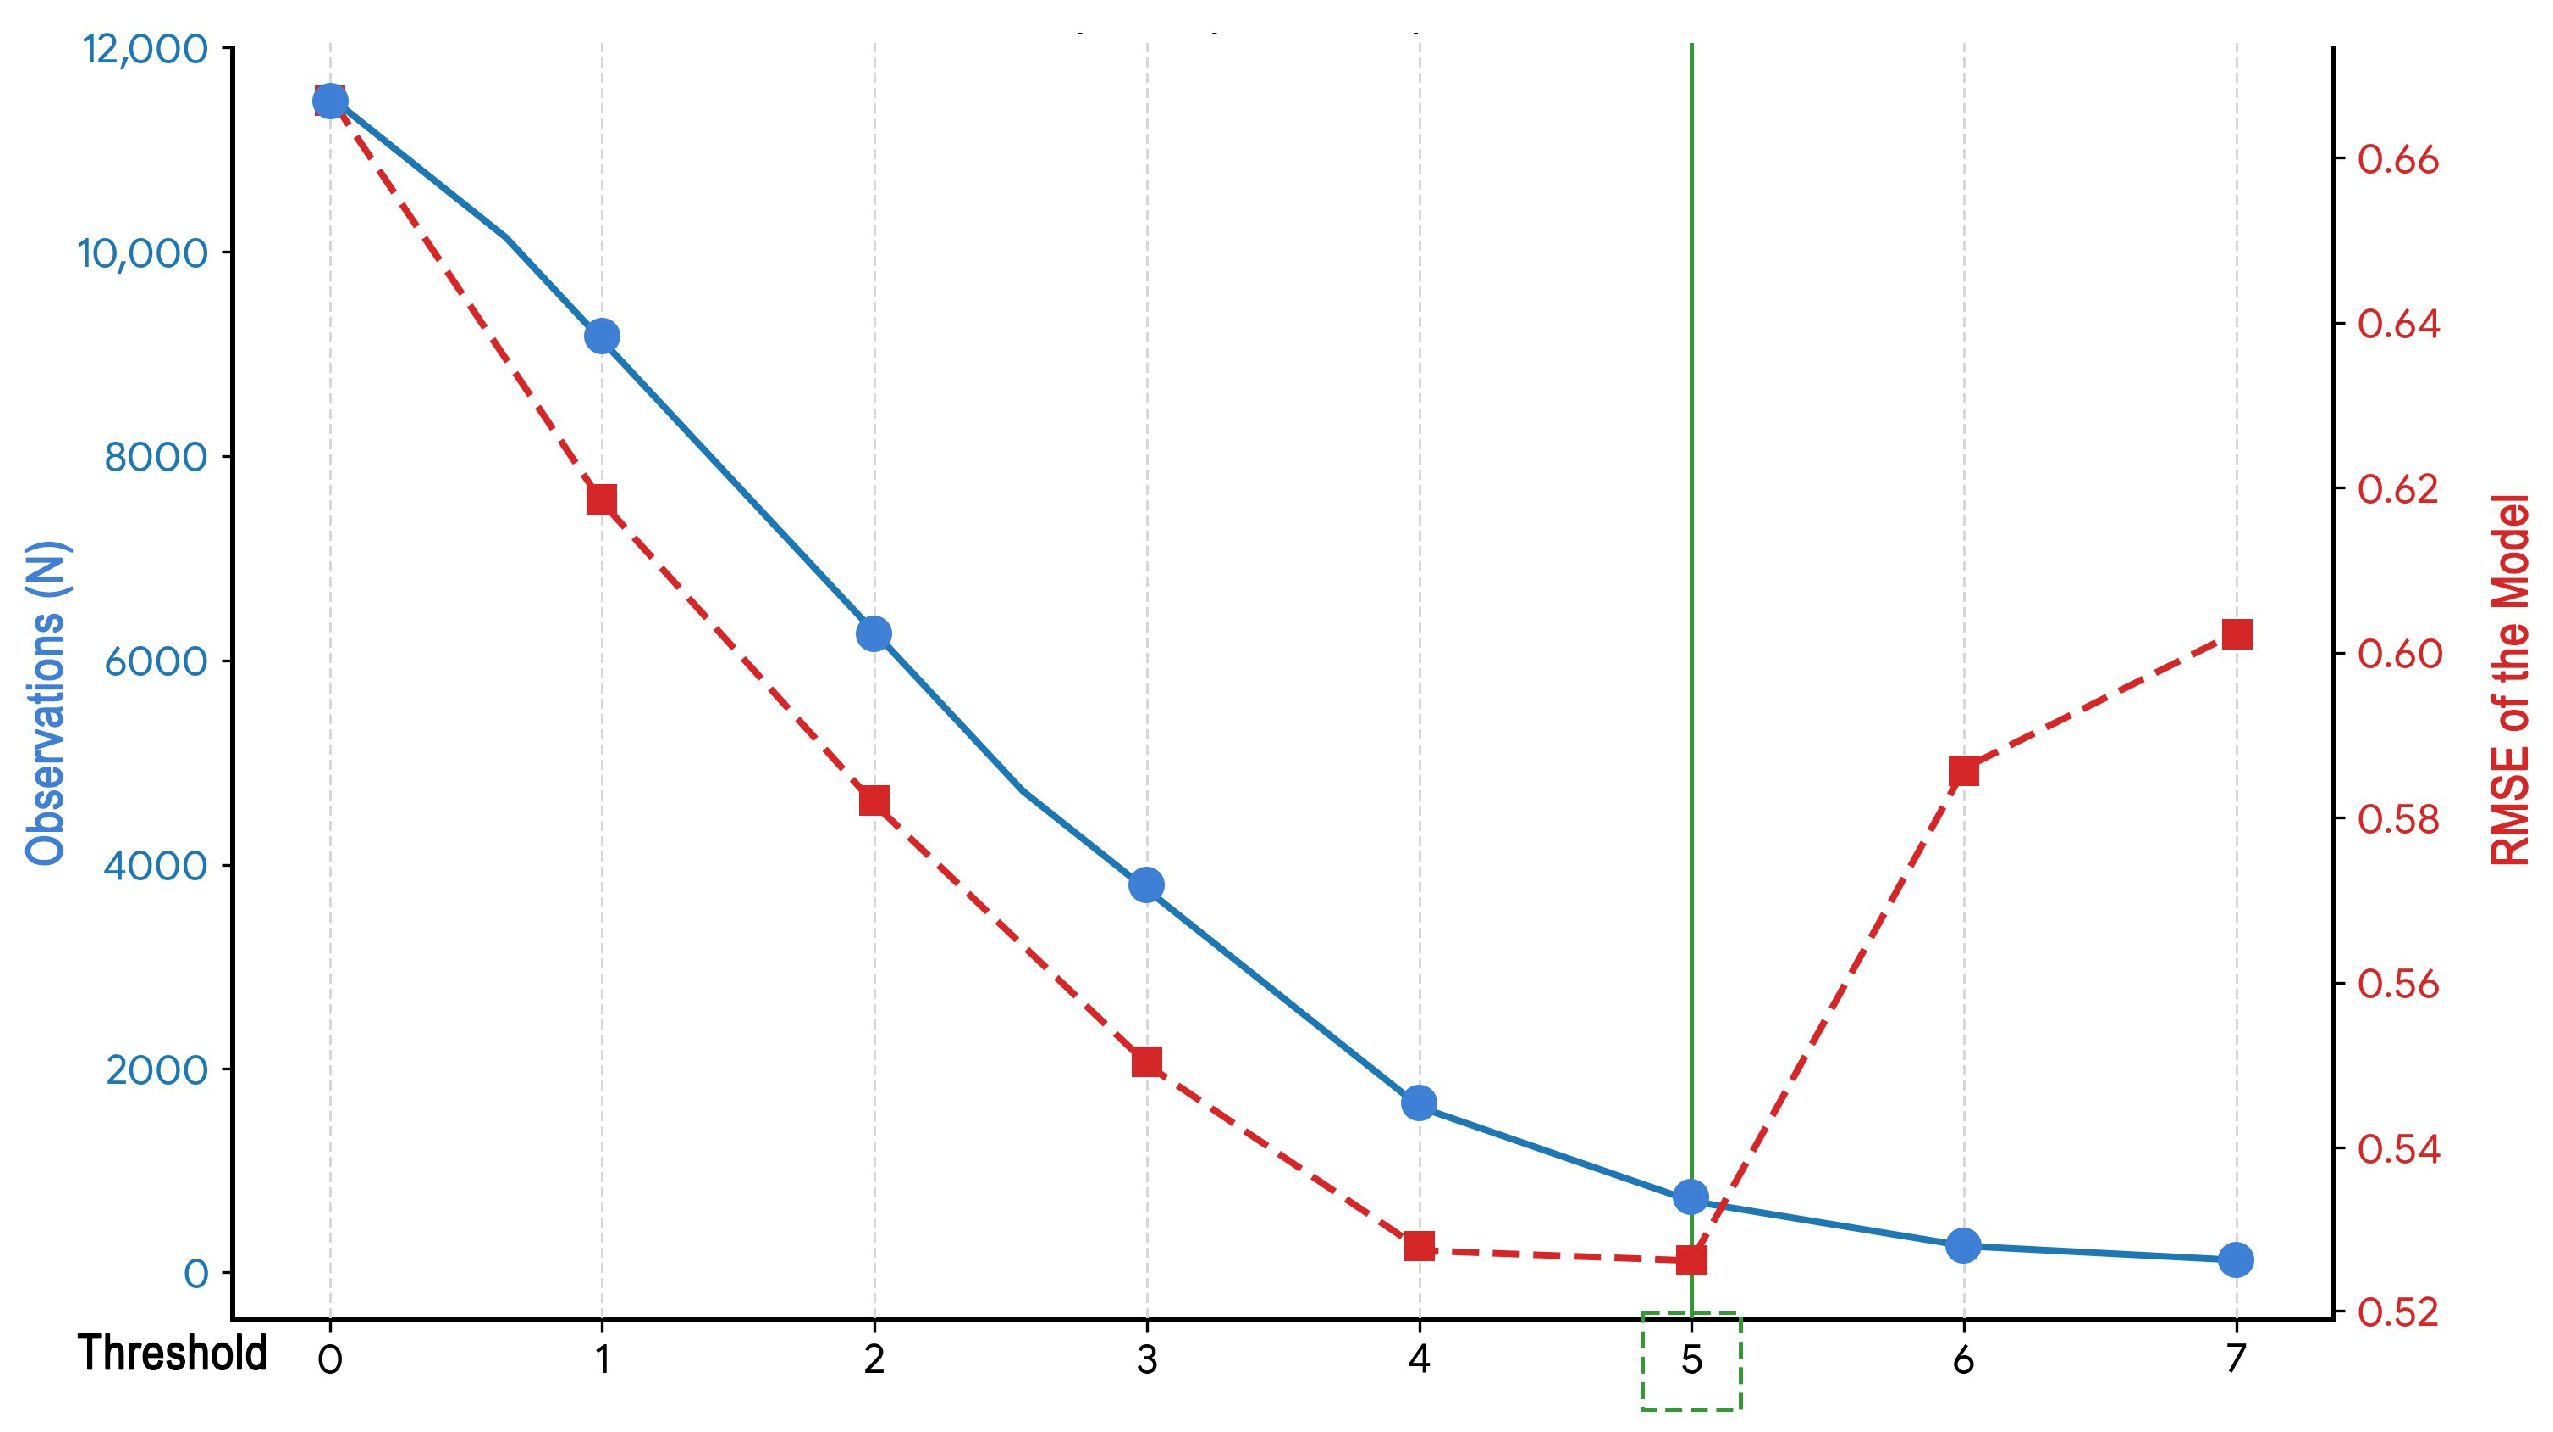
Subsequently, a threshold sensitivity analysis was conducted to systematically examine the relationship between sample size and model performance under various coverage thresholds (Figure 4). This procedure aids in identifying an optimal threshold that balances semantic richness with sufficient sample availability for model training using XGBoost.

3.5. Sentiment Annotation and Structured Data Construction

To quantify the directional and intensity effects of 19 built environment theme elements on visitor satisfaction, this study constructed structured sentiment-annotated data for XGBoost model training. The unit of analysis is a single review, which may mention multiple built environment elements. Each review originally includes a five-point satisfaction rating provided by the platform; however, to better capture the influence of specific environment elements, reviews were first screened based on the ECS, which measures the number of distinct elements mentioned. ECS does not serve as the model target but ensures that only reviews containing sufficiently rich semantic information are included, mitigating potential interference from high-frequency sentiment words or repeated expressions.
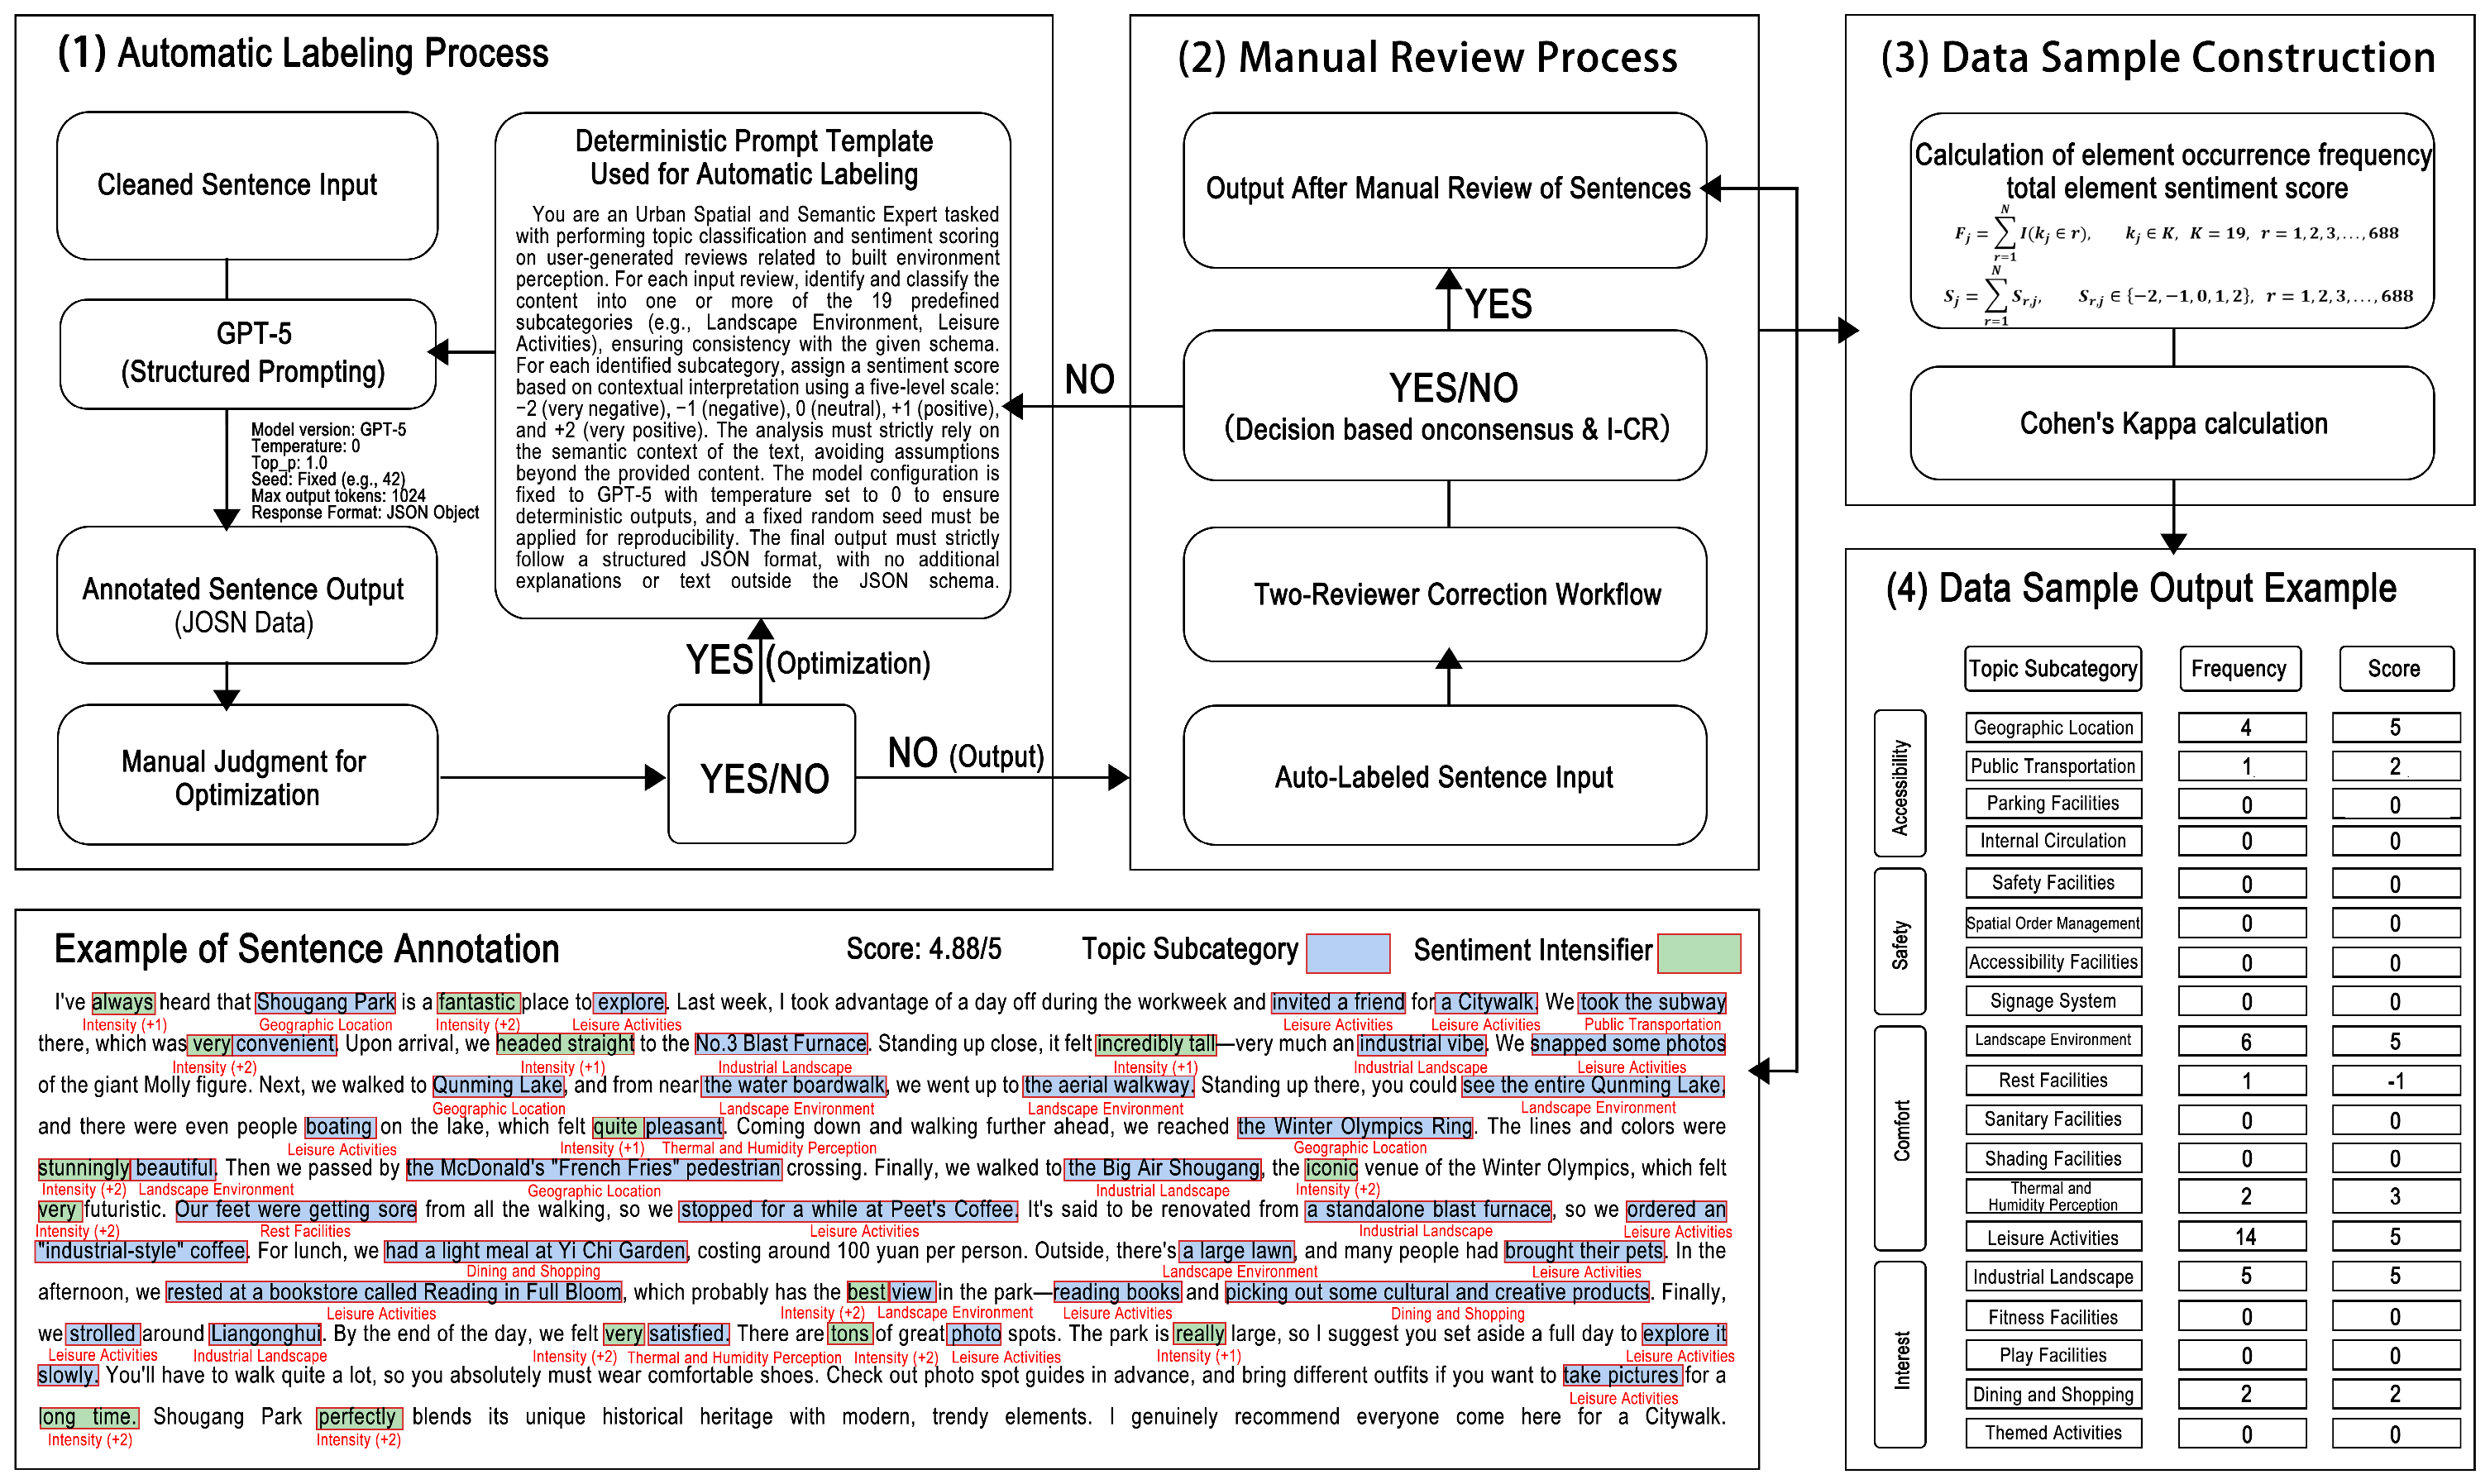
As illustrated in Figure 5, the annotation process follows a structured three-step workflow integrating GPT-assisted labeling, manual verification, and data construction. First, cleaned review texts are input into a GPT-based model using a deterministic prompt template to perform automatic topic classification and sentiment scoring at the element level. Second, the auto-labeled results are subjected to a two-reviewer manual verification process, where discrepancies are resolved through consensus to ensure annotation reliability. Third, the validated annotations are transformed into structured indicators, including element occurrence frequency and cumulative sentiment scores.
For the retained samples, each identified element kjK (where K = 19) within a review r is assigned a sentiment score Sr,j ∈ {−2, −1, 0, 1, 2}, reflecting its polarity and intensity based on contextual interpretation. The annotation process follows a two-stage procedure: GPT-assisted automatic labeling using a structured prompt, followed by manual verification and correction to ensure consistency and reliability.
Based on the annotated data, two types of structured indicators are constructed. First, the occurrence frequency of each element across all reviews is calculated as (3):
F j = r = 1 N I k j r ,   k j K ,   K = 19 ,   r = 1 , 2 , 3 , , 688
where I(kjr) is an indicator function that equals 1 if element kjk appears in review r, and 0 otherwise. This measure captures the overall representation of each element in the dataset.
Second, the cumulative sentiment score of each element is computed as (4), which aggregates the sentiment contributions of element kj across all reviews.
S j = r = 1 N S r , j ,       S r , j 2 , 1 , 0 , 1 , 2 ,       r = 1 , 2 , 3 , , 688
For model training, each element mentioned in a review was assigned a manually verified sentiment score ranging from −2 (very negative) to +2 (very positive), reflecting its polarity and intensity. This process converts unstructured textual reviews into structured numerical indicators suitable for XGBoost modeling, enabling reliable analysis of the relationships between environment elements and visitor satisfaction (Figure 5).

3.6. Model Development and Interpretation

To explore the relationship between environmental elements and tourist satisfaction, both a multiple linear regression model (OLS) and a nonlinear XGBoost model were constructed. The OLS model was employed as a baseline to examine whether the relationships among variables can be adequately captured under linear assumptions. The model is expressed as (5):
y i = β 0 + k = 1 19 β k x i k + ε i i = 1 , 2 , 3 , , 688
where i denotes the sample index, yi is the observed tourist satisfaction, xik represents the independent variables, βk are regression coefficients, and εi is the error term.
All variables were preprocessed through numeric conversion, missing value imputation, and consistency checks. The dataset was randomly divided into training and testing sets at a ratio of 8:2 with a fixed random seed (random_state = 42) to ensure reproducibility. And to capture potential nonlinear relationships and interaction effects, an XGBoost regression model was constructed. Hyperparameter optimization was conducted using the Optuna framework, in which the TPE (Tree-structured Parzen Estimator) algorithm was employed for efficient search. The optimization objective was to minimize the MSE (mean squared error) on the validation set. The search space included key parameters such as the number of trees (n_estimators: 50–500), maximum tree depth (max_depth: 3–10), learning rate (0.01–0.3), subsample ratio (0.6–1.0), feature sampling ratio (colsample_bytree: 0.6–1.0), and regularization terms (reg_alpha and reg_lambda).
Regularization terms were incorporated to control model complexity and mitigate overfitting, while repeated training–validation evaluation within the optimization process ensured model stability. In addition, SHAP was introduced to interpret the model by decomposing feature contributions. And the SHAP value for feature j in sample i is defined as (6):
y i = S F \ j | S | ! ( | F | | S | 1 ) ! | F | ! f S j ( x i ) f S ( x i )
where F denotes the full set of features and S represents a subset excluding feature j. This approach enables the identification of nonlinear effects, marginal contributions, and interactions.

4. Results

4.1. Basic Data Characteristics and Topic Distribution

Based on the results of LDA topic modeling, a two-stage coding process was employed to construct the perception index system. First, keywords extracted from user-generated reviews were grouped into 19 sub-categories through semantic clustering based on contextual similarity. Subsequently, these sub-categories were further aggregated into four higher-level perceptual dimensions—Accessibility [25,26], Safety [27], Comfort [28,29], and Enjoyment [6,30]—according to their functional roles and experiential attributes, with reference to existing frameworks of built environment evaluation and environmental perception. The results indicated that setting the number of topics to K = 19 achieved an optimal balance between semantic differentiation and generalization capacity (see Figure 3). Consequently, a public perception index system for industrial heritage sites was constructed (Table 1).
During the data modeling stage, the original set of 11,542 review comments was screened for informational validity. Threshold sensitivity analysis revealed that setting the element coverage score threshold to 5 provided an optimal balance between sample size and model performance. At this threshold, 688 high-quality samples were retained, and the model’s RMSE (root mean square error) decreased to 0.5261, indicating that filtering out low-information comments effectively reduced noise and improved predictive accuracy (Figure 4).
Subsequently, the valid review samples underwent sentiment annotation, converting textual semantic information into structured variables using a five-level sentiment quantification scale. To assess the reliability of the annotation, 20% of the samples were randomly re-annotated, and Cohen’s Kappa coefficient was calculated, resulting in 0.82, demonstrating a high level of consistency. Through these procedures, a structured dataset containing 19 spatial element sentiment variables and overall satisfaction scores was created, providing a robust data foundation for the subsequent training of the XGBoost model and variable contribution analysis.

4.2. Model Performance Comparison

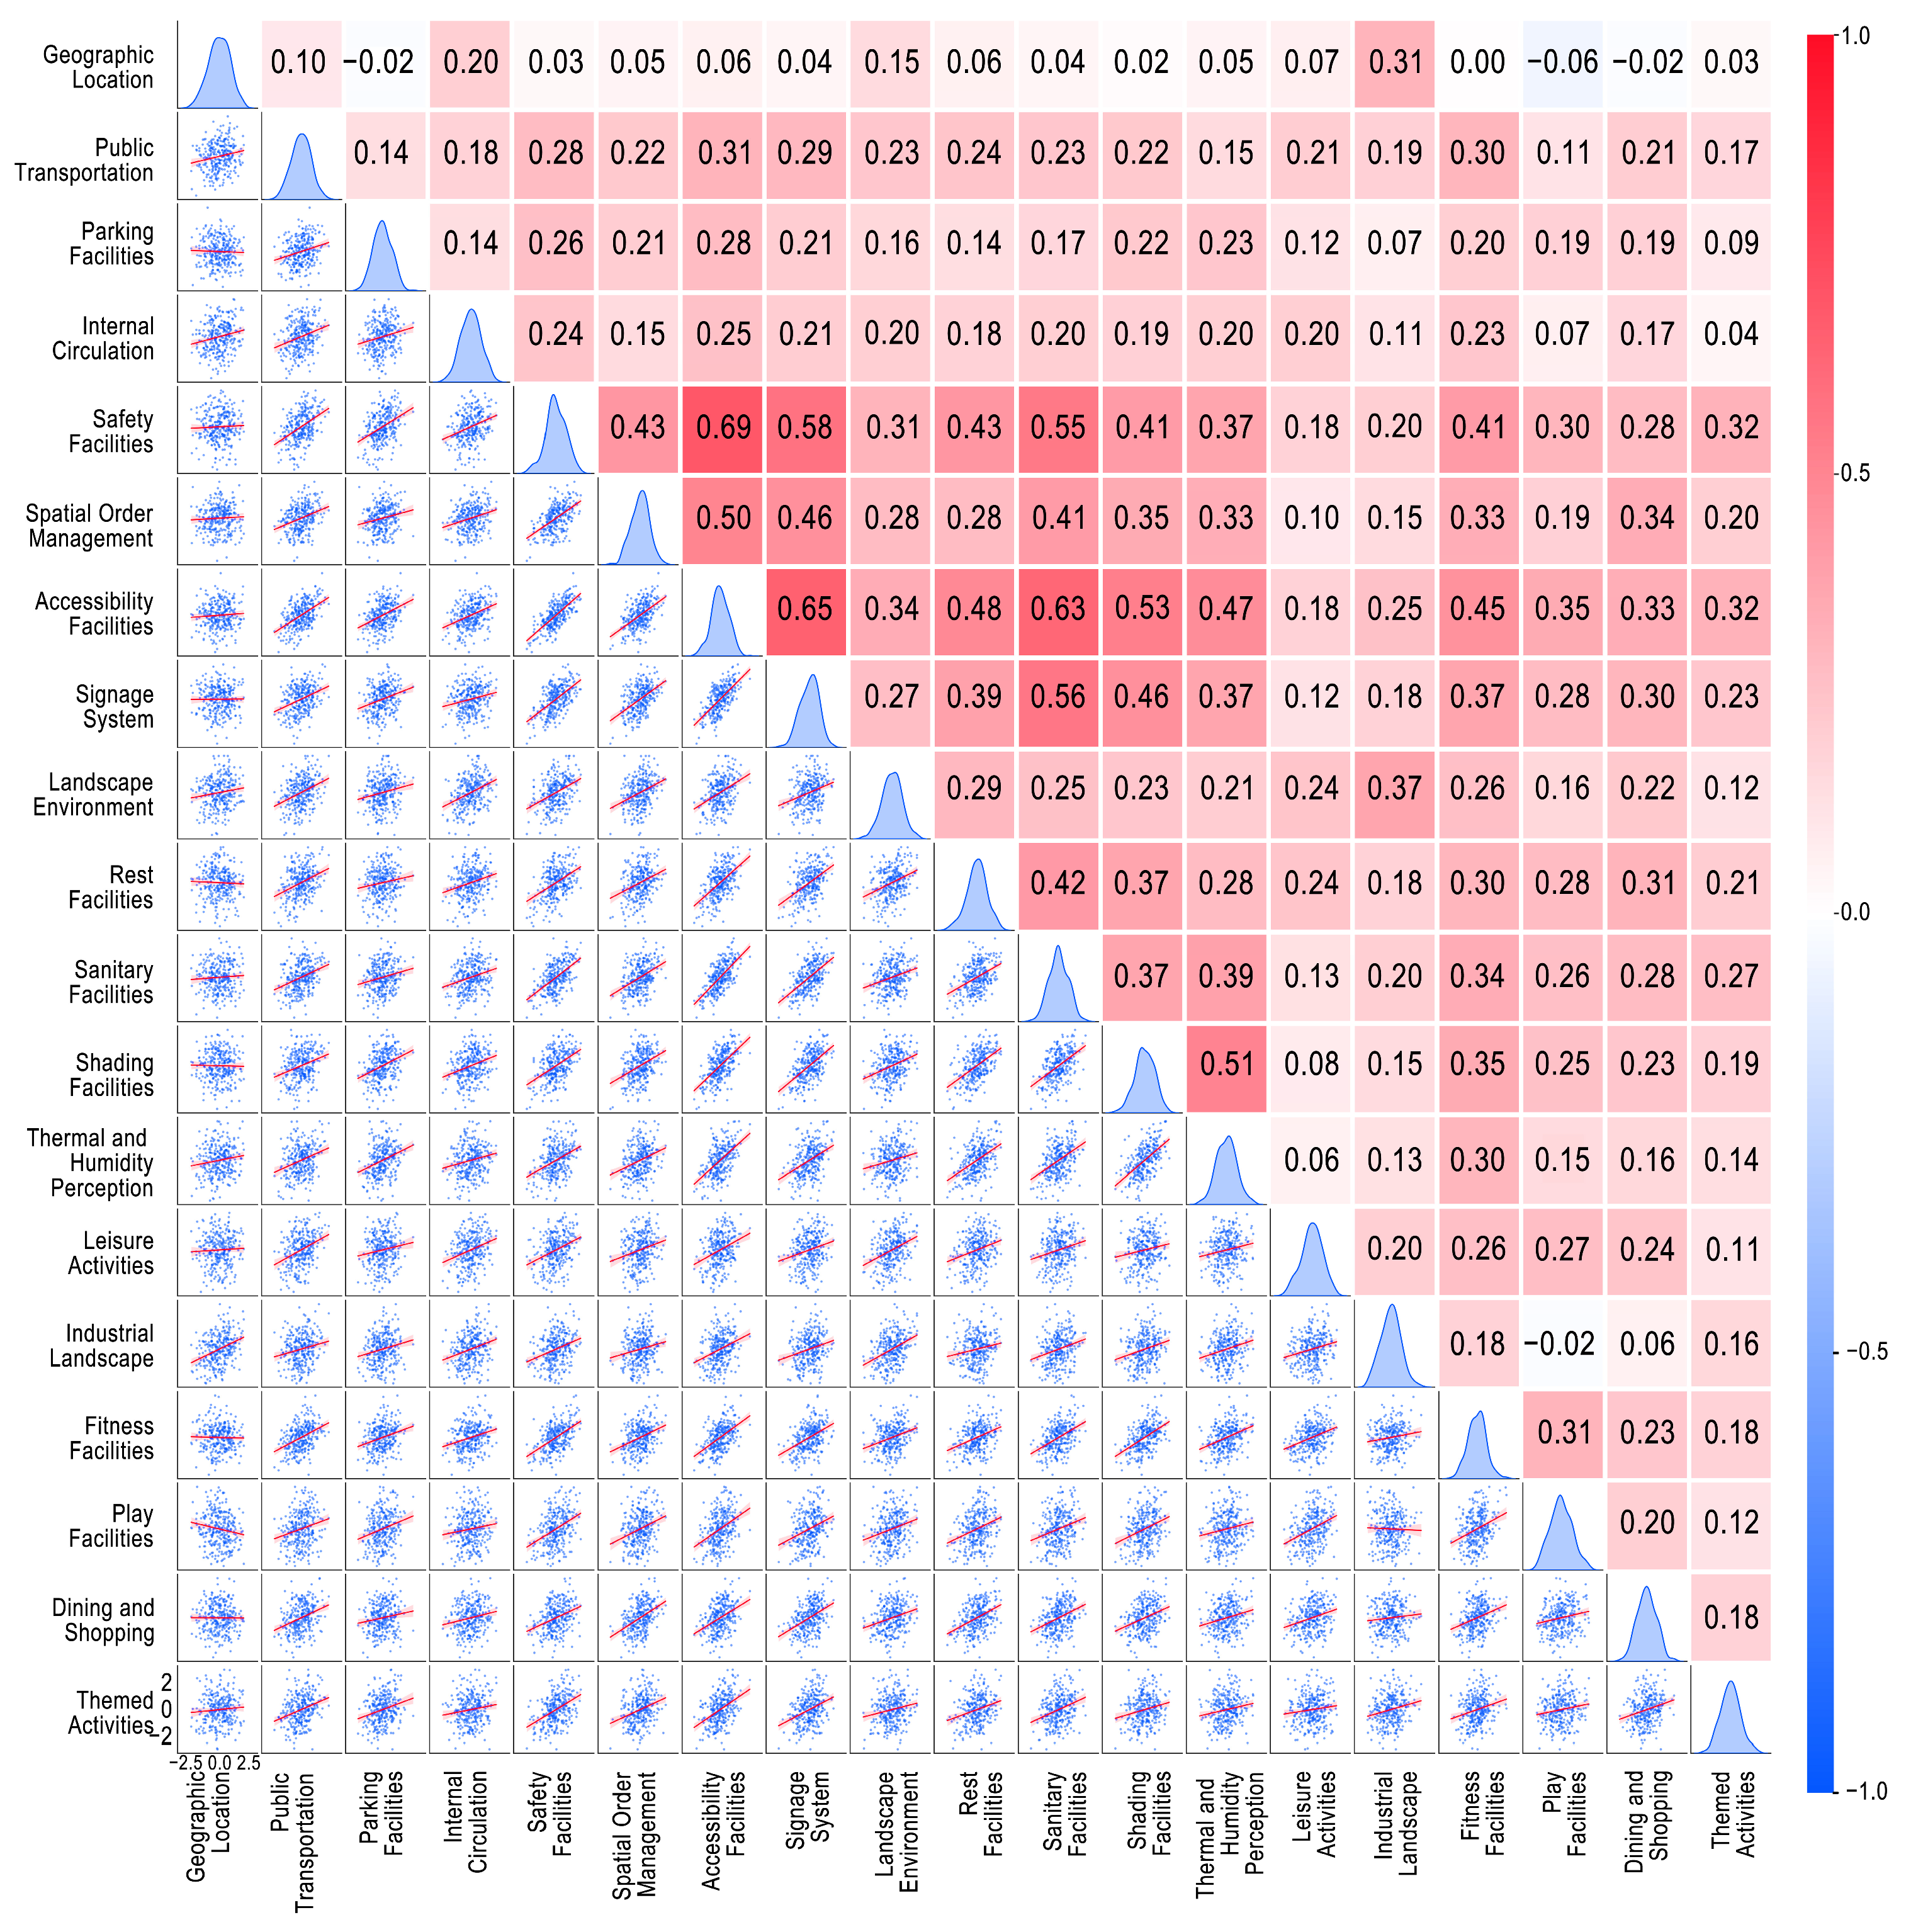
Prior to model construction, Pearson correlation analysis was conducted among the 19 independent variables. The results show that most correlation coefficients fall within the range of 0.10–0.40, with a maximum value of 0.69, which is below the multicollinearity threshold (|r| ≥ 0.80). This indicates that no significant multicollinearity exists and supports subsequent modeling, including both OLS regression and XGBoost. Furthermore, the scatter plots and corresponding fitted lines provide additional insights into the nature of these relationships. Specifically, most scatter distributions appear relatively dispersed, and the fitted regression lines exhibit gentle slopes, indicating that linear relationships between variables are generally weak. This pattern suggests that the underlying associations are likely complex and nonlinear rather than strictly linear (Figure 6).
Based on the same dataset and data split (8:2), the OLS model achieved an R2 of 0.7787 and an MSE of 0.0594, indicating moderate explanatory and predictive performance. As shown in Table 2, only part of the variables are statistically significant, suggesting that the linear model may not fully capture the underlying relationships. In contrast, the optimized XGBoost model achieved an R2 of 0.9165 and an MSE of 0.0224, significantly outperforming the OLS model. The nonlinear model improves explanatory power by 17.7% and reduces prediction error by 62.3%, indicating that the relationships between environmental attributes and tourist satisfaction are not purely linear. RMSE was used in sensitivity analysis for interpretability, while MSE was adopted during model optimization. As RMSE is the square root of MSE, both metrics are consistent and reflect the same prediction error from different perspectives. Furthermore, SHAP analysis reveals nonlinear response patterns and interaction effects among variables, confirming that the XGBoost model provides a more accurate representation of the complex coupling mechanisms.

4.3. Heterogeneity Analysis of Factor Contributions

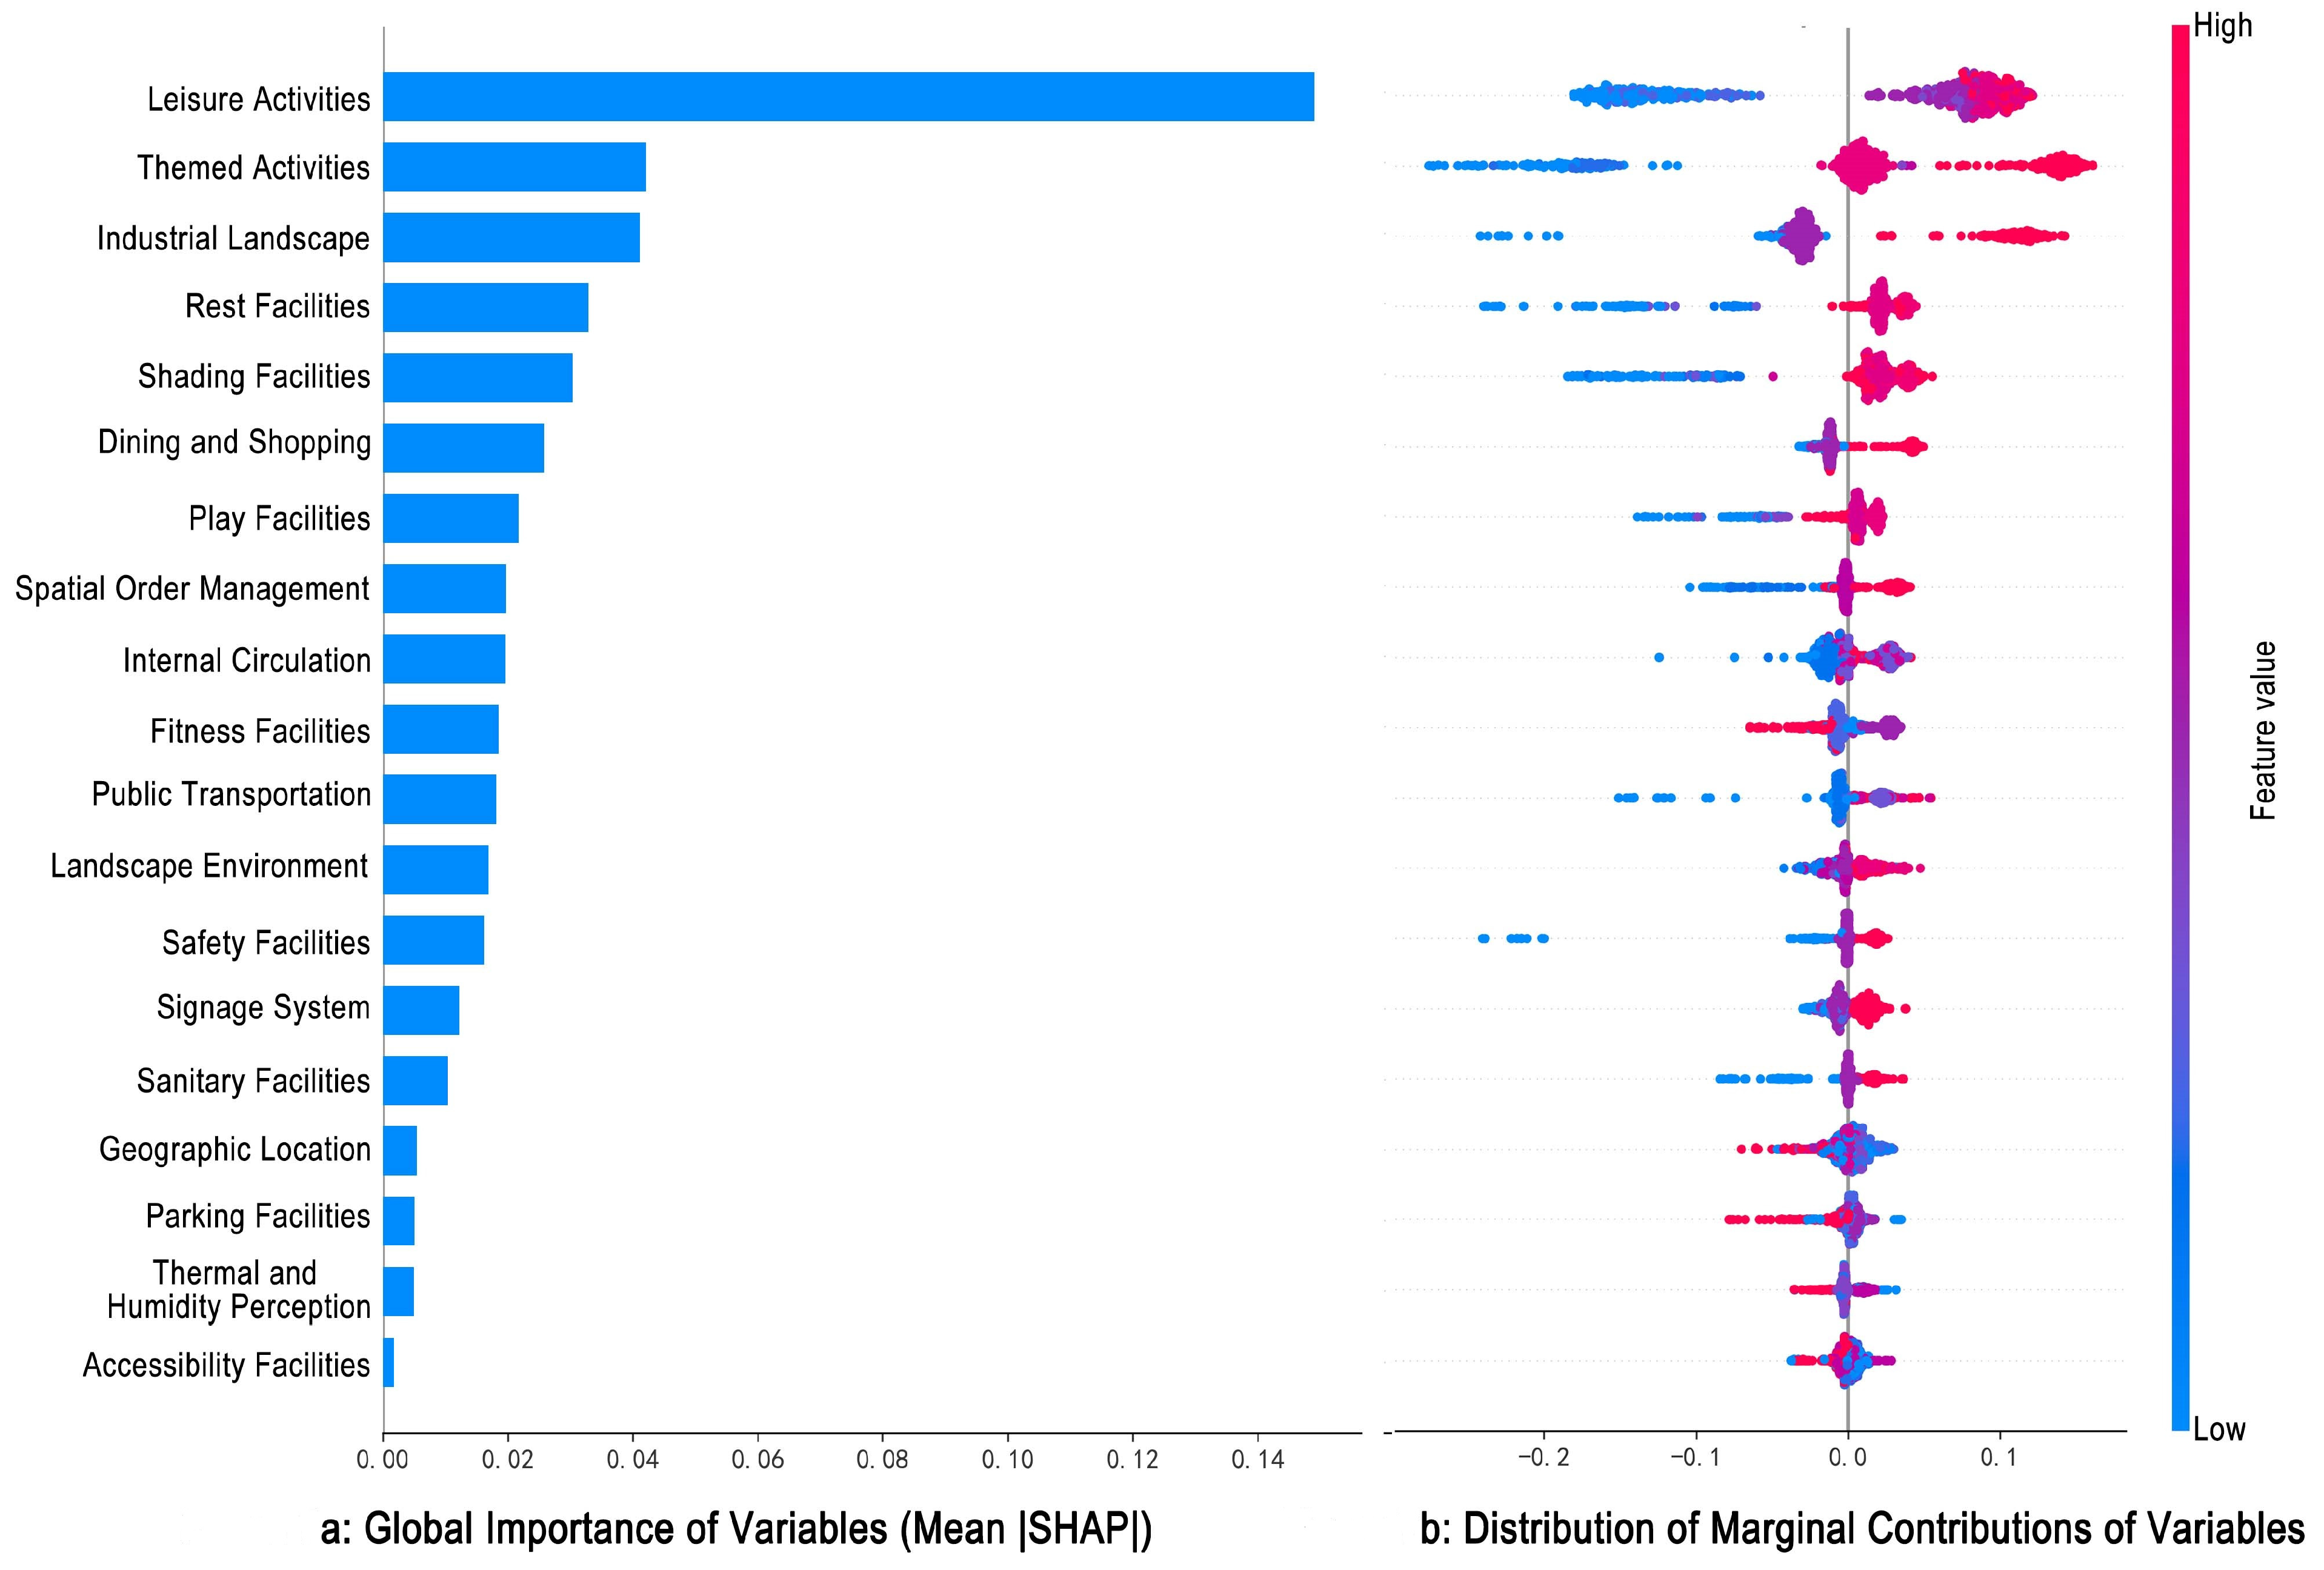
To reveal the strength and direction of each spatial experience factor on overall satisfaction, SHAP was applied to the XGBoost model for interpretability analysis. Figure 7a shows the mean absolute SHAP values of all variables, reflecting their overall contribution strength to the prediction. Figure 7b presents the marginal impact distributions across variable value ranges, highlighting the directional effects and sample-level heterogeneity of each factor.
The 19 sub-categories exhibit a clear hierarchical pattern (Figure 7a). Leisure Activities emerges as the most influential factor, followed by Themed Activities and Industrial Landscape, forming a second tier. Intermediate contributors include spatial service and organization elements, such as Rest Facilities, Shading Facilities, and Signage System. Other variables, including Play Facilities, Spatial Order Management, Internal Circulation, and Public Transportation, show modest contributions. Geographic Location, Parking Facilities, Thermal and Humidity Perception, and Accessibility Facilities rank lowest, with minimal mean marginal contribution. Overall, the importance distribution follows a “few critical factors dominate, others decline gradually” pattern.
Examining the SHAP summary plot (Figure 7b) reveals that high-importance variables exhibit clear directional effects. For instance, for Leisure Activities, high-value samples (red) cluster in the positive SHAP range, contributing positively to satisfaction, while low-value samples (blue) appear in the negative range, suppressing predicted satisfaction. Themed Activities and Industrial Landscape show similar trends, indicating a stable positive correlation between higher values and satisfaction. In contrast, low-ranking variables mostly have SHAP values near zero with limited horizontal spread, suggesting marginal or auxiliary effects. Some spatial service factors show context-dependent impacts: for example, in Spatial Order Management, Internal Circulation, and certain service facilities, some high-value samples still fall in the negative SHAP range, indicating that misalignment between configuration or management and visitor needs (e.g., overly strict rules, inefficient traffic organization, or suboptimal facility layout) can negatively affect overall experience. Similarly, Dining and Shopping and Parking Facilities concentrate near zero, confirming limited marginal influence.
Overall, Figure 7 highlights significant differences in both the strength and direction of influence among spatial factors, providing a foundation for subsequent nonlinear and interaction mechanism analyses.

4.4. Nonlinear Relationships and Threshold Effects

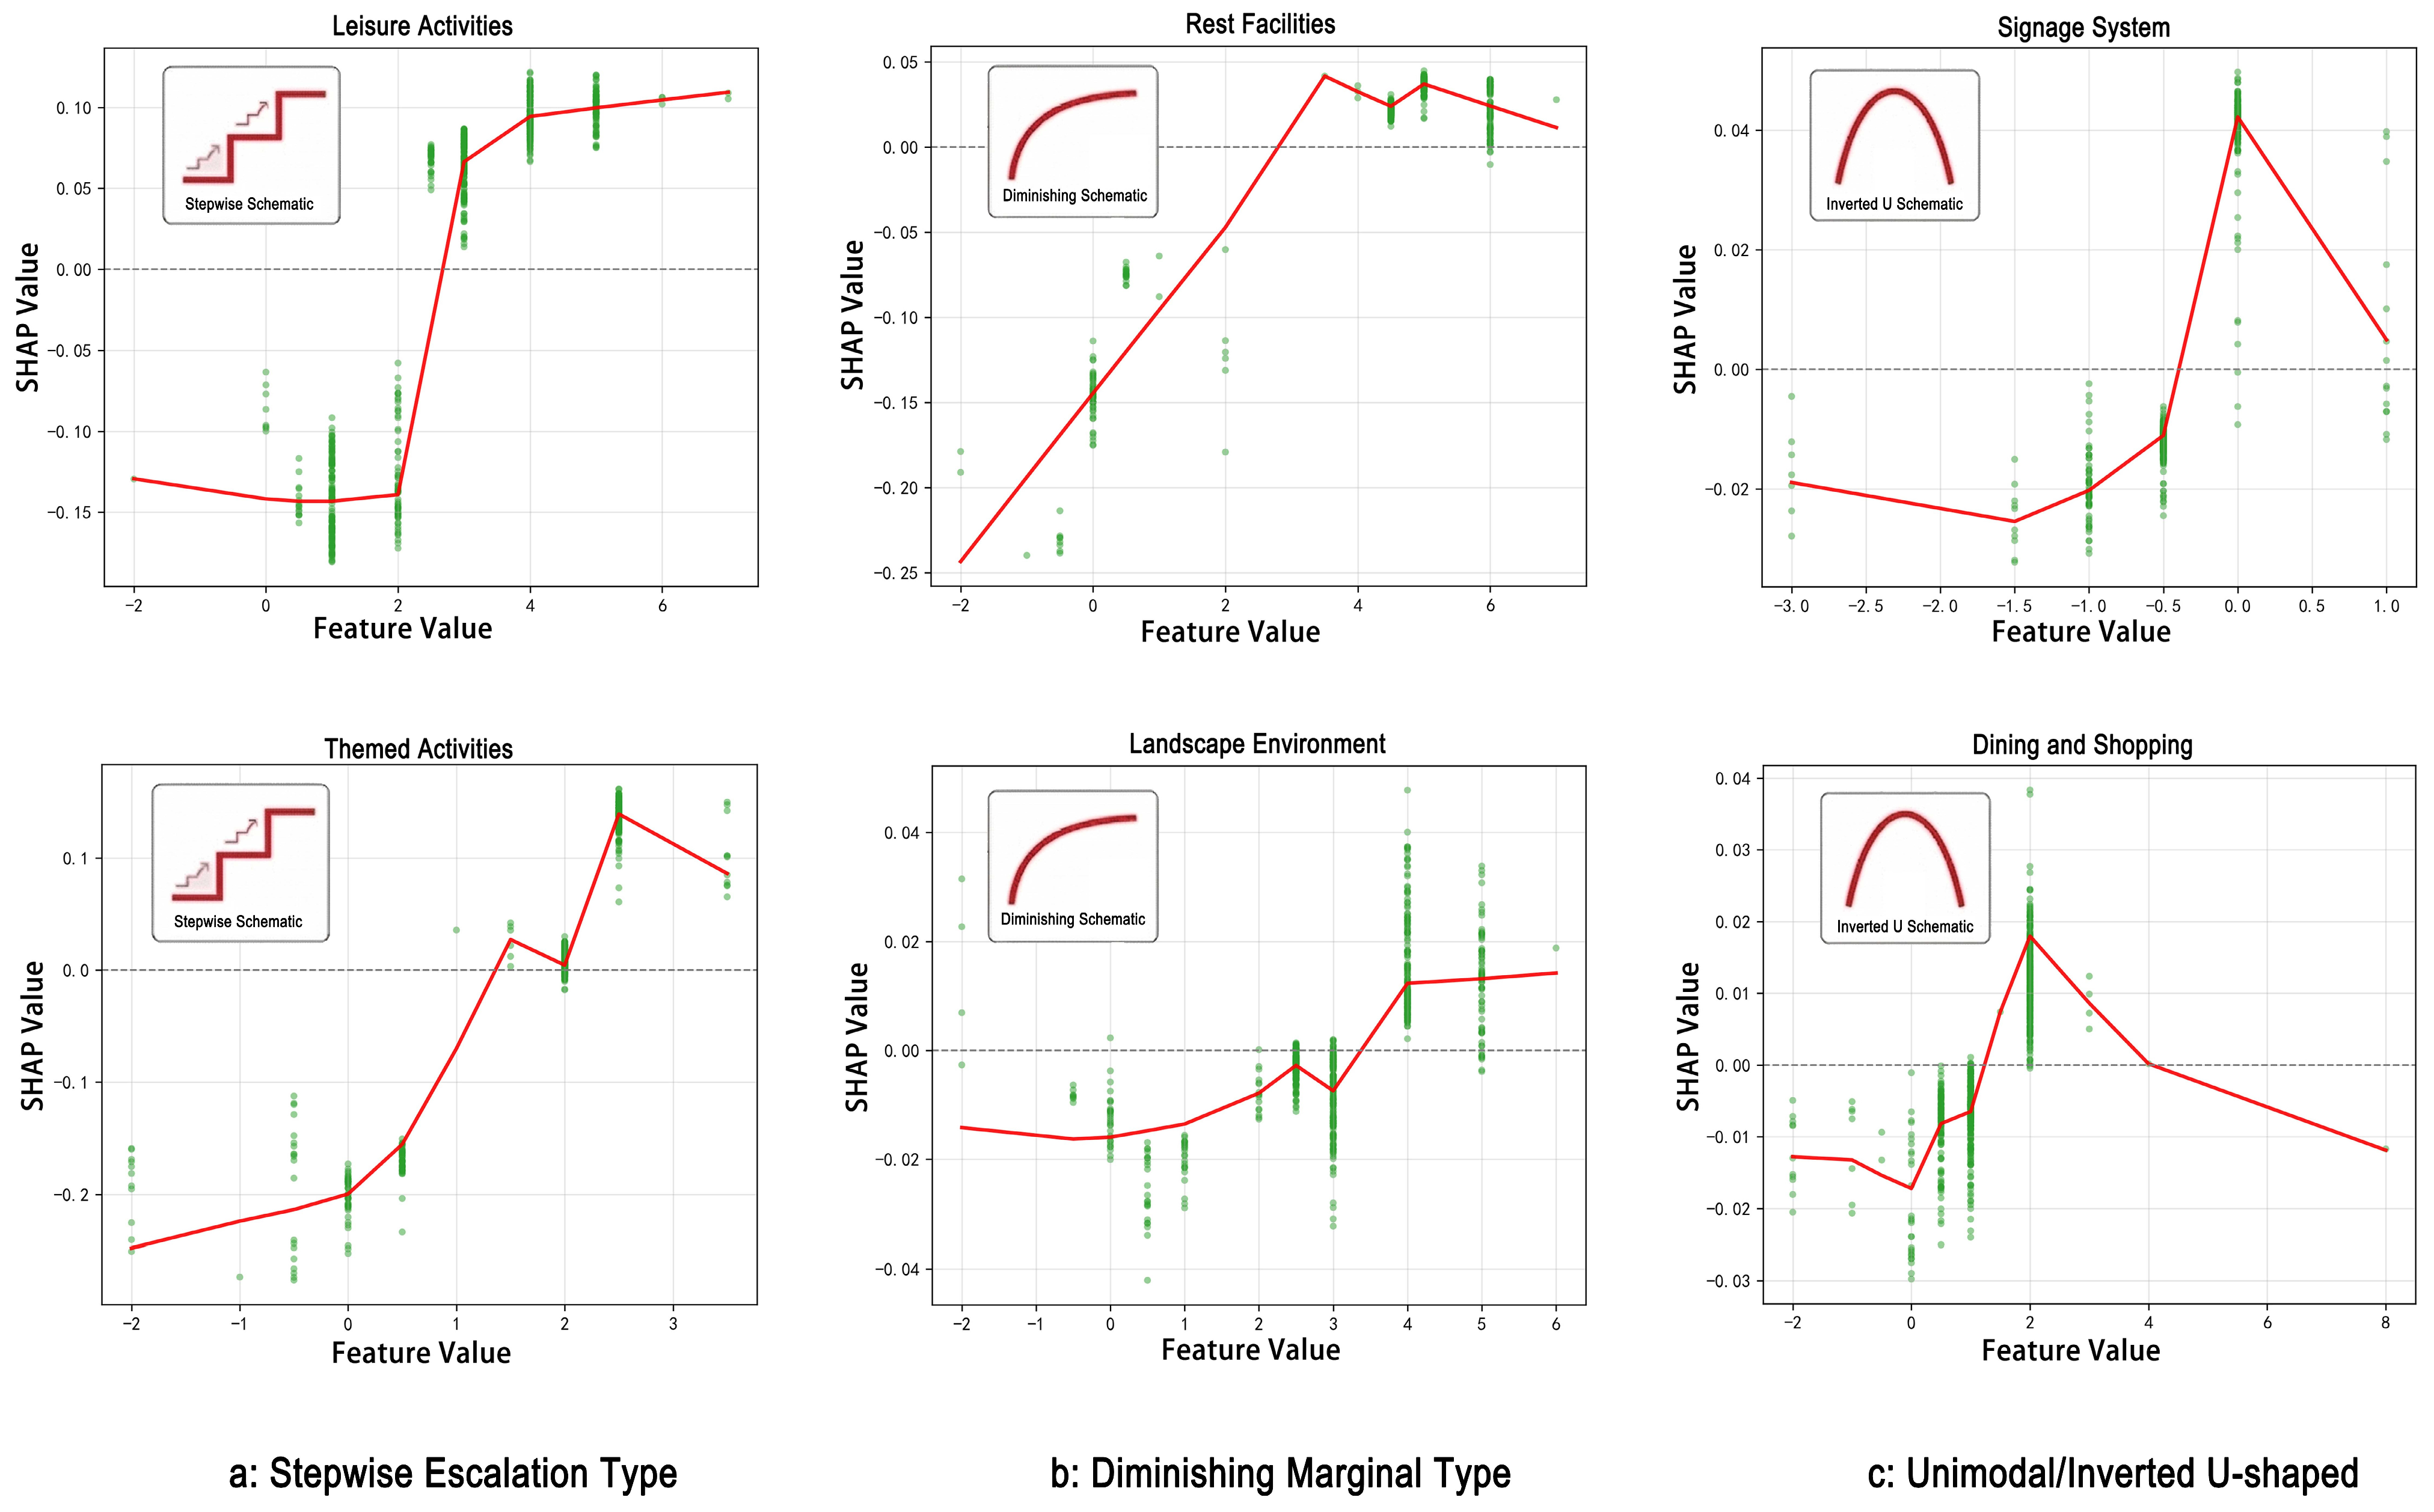
To further examine how environmental elements influence public satisfaction across different value ranges, SHAP dependence plots were analyzed for representative elements (Figure 8a–c). These plots visualize how SHAP values change with feature values, thereby revealing potential nonlinear response patterns. However, it is important to emphasize that the observed shapes should be interpreted as empirical tendencies within the sampled data distribution, rather than precise thresholds or deterministic functional relationships, particularly given the uneven sample density visible in several value ranges. Overall, three general response patterns can be identified from the plots: stage-like increase, marginal diminishing, and inverted-U-like. These categories are used to describe typical trends rather than strict classifications.
(1)
Stage-like increase pattern (Figure 8a)
In Figure 8a, Leisure Activities and Themed Activities exhibit a pattern where SHAP values remain relatively low (often negative) at lower feature values and increase more noticeably at moderate-to-higher ranges. For example, in the Leisure Activities plot, the red fitted curve shows a clear upward shift around the mid-value range, after which it stabilizes in the positive domain. A similar upward tendency is observed for Themed Activities, although the increase appears more gradual and slightly fluctuating at higher values. From the scatter distribution, it can be observed that data points are relatively concentrated in specific value bands, especially in the mid-range, while extreme values are sparsely represented. Therefore, the apparent “step-like” increase should be understood as a localized response amplification within observed data intervals, rather than evidence of a distinct threshold point.
(2)
Marginal diminishing pattern (Figure 8b)
Figure 8b presents variables such as Rest Facilities and Landscape Environment, where SHAP values increase at lower-to-mid ranges and then tend to level off or slightly fluctuate at higher values. For instance, Rest Facilities shows a relatively steep increase in SHAP values from low to mid values, followed by a flatter trend, with some variability in higher ranges. Similarly, Landscape Environment demonstrates a mild upward trend that stabilizes after mid-range values. Notably, the scatter points in higher value ranges appear more dispersed and less dense, suggesting that the plateau-like behavior may be influenced by limited observations in these regions. As such, this pattern is more appropriately interpreted as a diminishing marginal tendency within the observed sample, rather than a definitive saturation point.
(3)
Inverted-U-like pattern (Figure 8c)
In Figure 8c, Signage System and Dining and Shopping display a peak-like pattern, where SHAP values increase to a maximum at intermediate values and then decline at higher levels. For example, Dining and Shopping shows its highest SHAP contribution around the mid-value range, after which the curve gradually decreases. A similar pattern is observed for Signage System, although with a narrower peak and greater variability. However, the scatter plots indicate that observations are more concentrated around the middle value ranges, while both low and high extremes contain fewer data points. This uneven distribution limits the robustness of the inferred peak shape. Therefore, these patterns should be interpreted as indicative of potential mid-range effectiveness, rather than precise optimal intervals.
In summary, the SHAP dependence plots reveal that environmental variables exhibit nonlinear and value-dependent response patterns, highlighting the limitations of purely linear assumptions. Nevertheless, due to variations in sample density and the descriptive nature of SHAP visualizations, these patterns should be regarded as empirical response trends rather than exact thresholds or prescriptive design rules. Any interpretation of “turning points” or “optimal ranges” should therefore be treated cautiously and understood as context-dependent tendencies within the observed dataset.

5. Discussions

5.1. Interaction Analysis

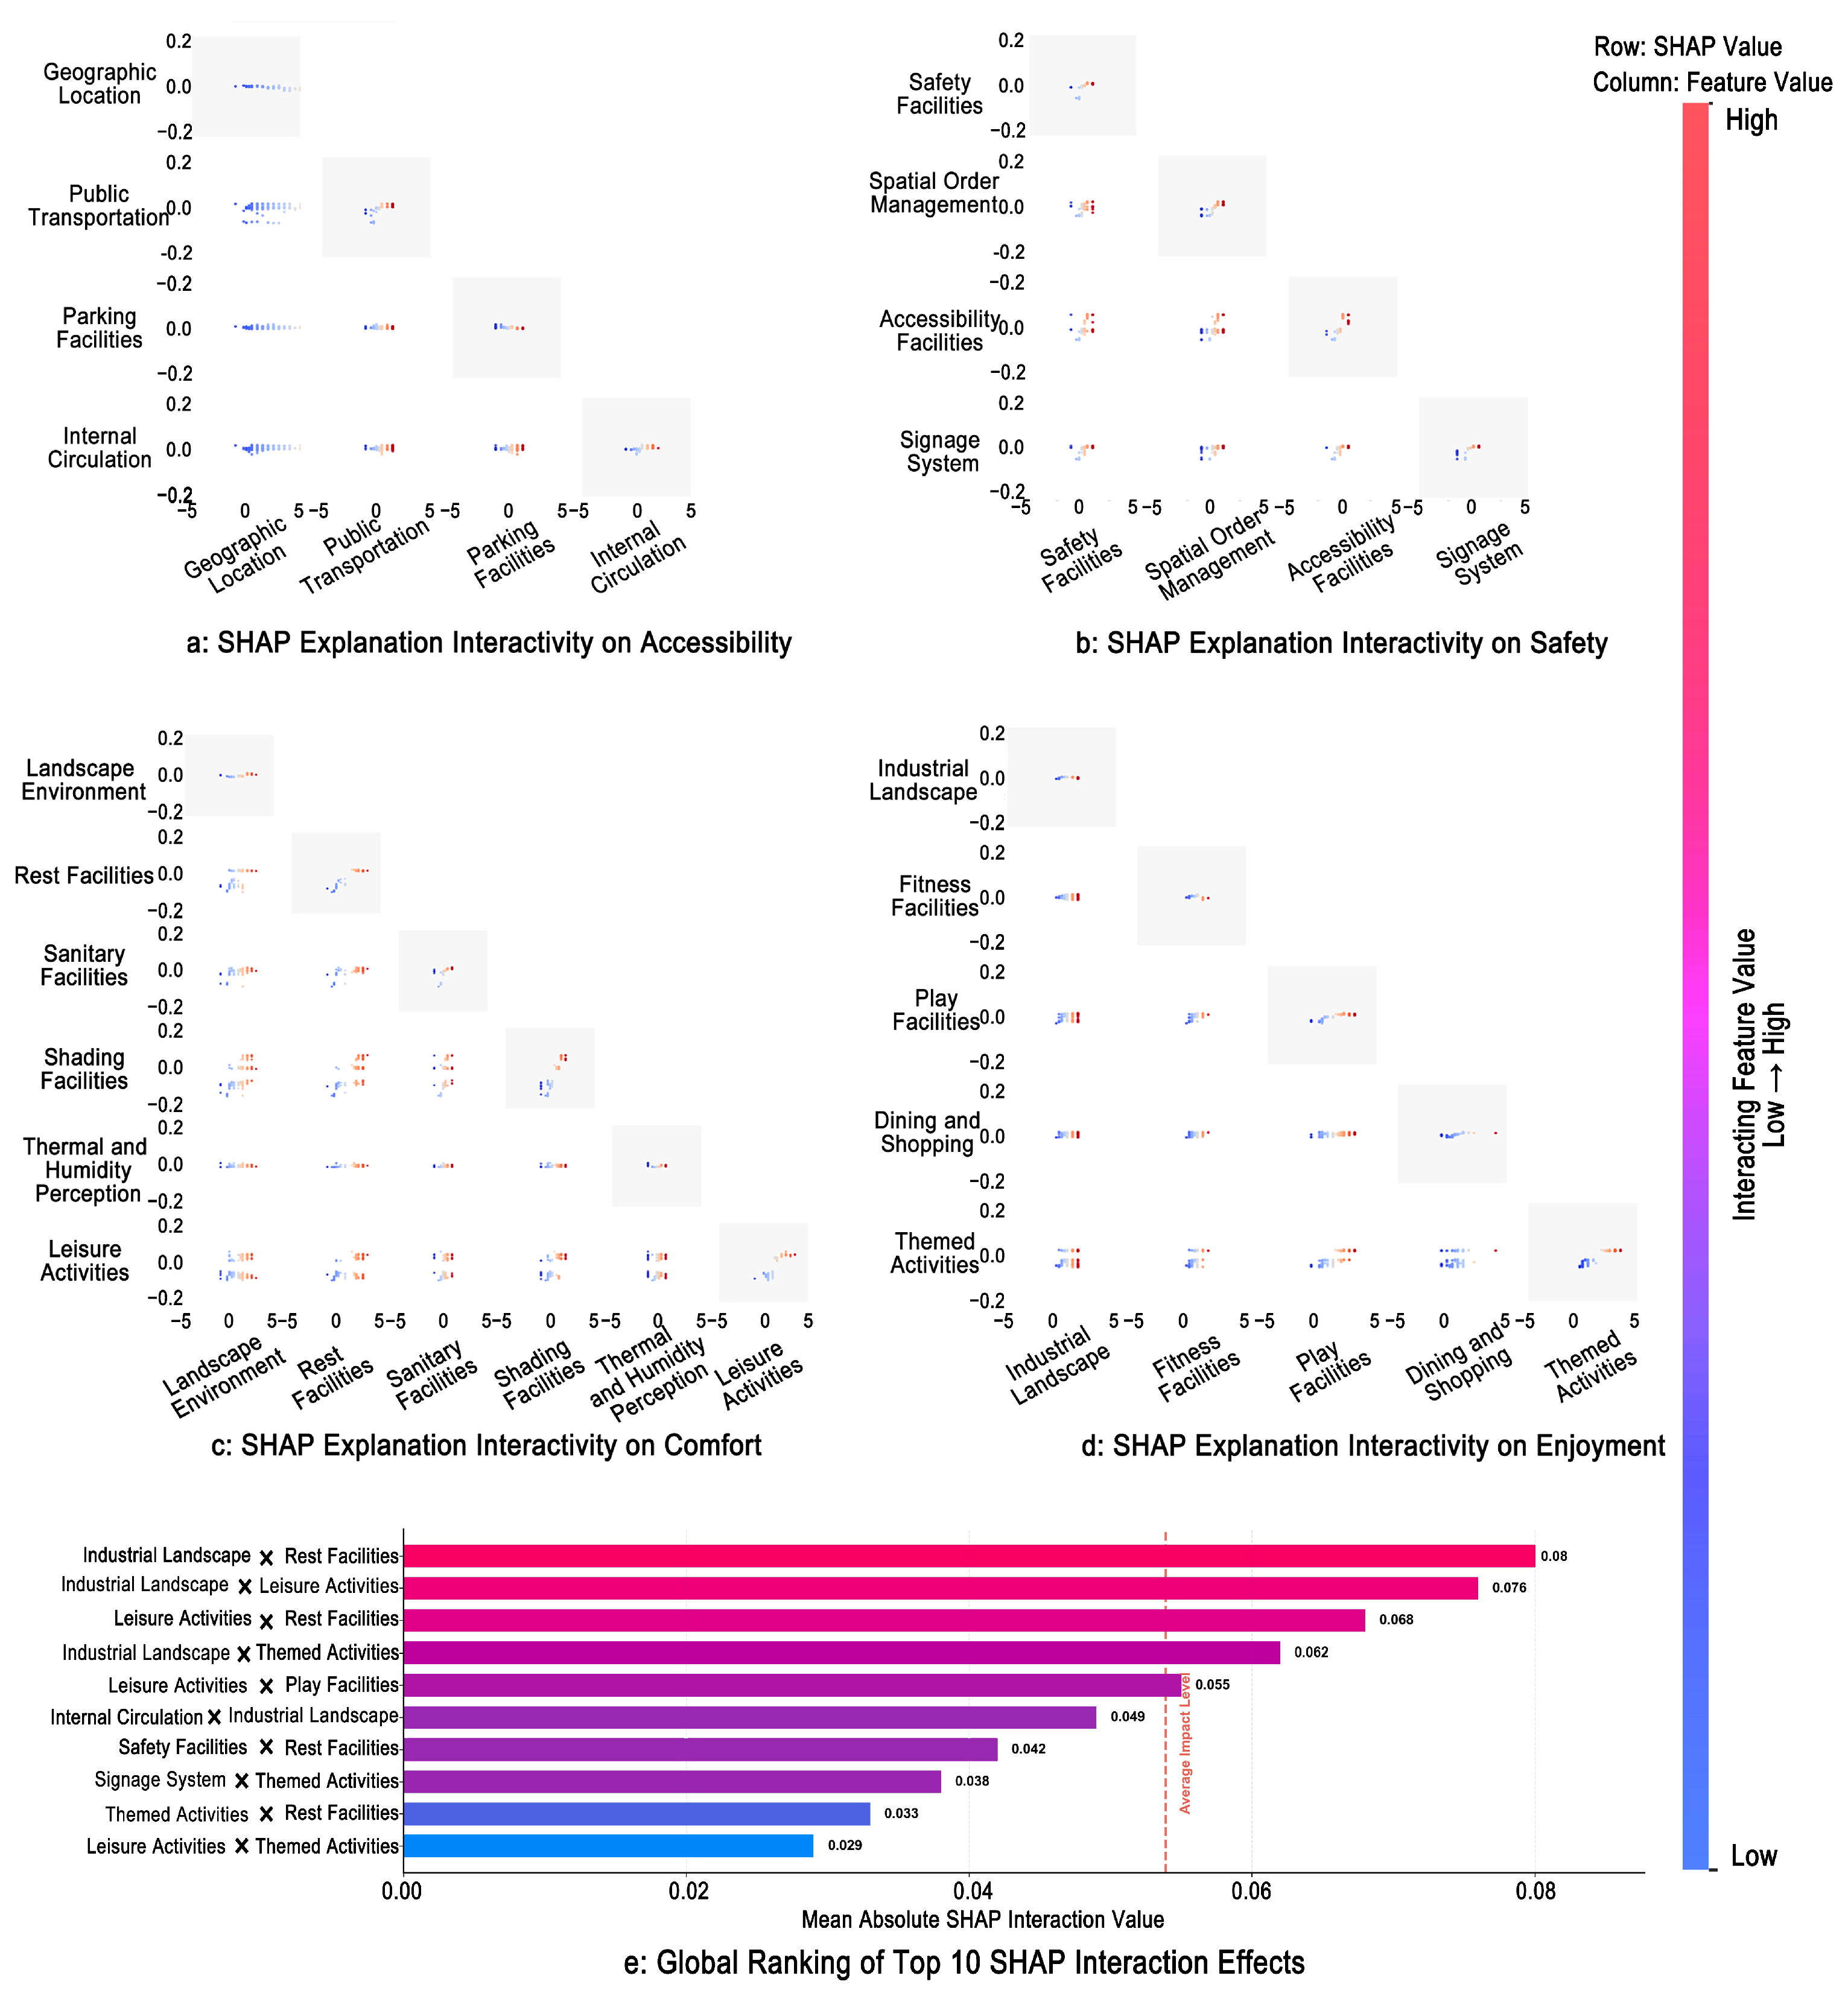
The SHAP interaction analysis indicates that visitor satisfaction in industrial heritage parks is not driven by individual built environment elements in isolation, but rather emerges from the synergistic and compensatory interactions among multiple spatial dimensions. To enhance the rigor of the analysis, this study employs mean absolute SHAP interaction values to systematically rank all feature pairs, thereby quantitatively identifying the most influential interactions contributing to model predictions. This metric captures the average joint contribution of feature pairs across the full sample, providing a more comprehensive understanding of structural relationships than single-feature importance measures. The results suggest that interaction effects play a substantial role in the overall model and exhibit pronounced nonlinear and multi-dimensional coupling characteristics.
The local interaction patterns illustrated in Figure 9a–d reveal distinct structures across perceptual dimensions, which should be interpreted as conditional empirical patterns rather than fixed relationships. In the Accessibility and Safety dimensions, interactions are primarily characterized by functional-level synergy and compensation. For Accessibility (Figure 9a), combinations of Public Transportation with Internal Circulation and Parking Facilities exhibit relatively strong positive interactions in medium-to-high value ranges, suggesting that their joint improvement is associated with enhanced perceived accessibility. In the Safety dimension (Figure 9b), the interaction between Safety Facilities and Spatial Order Management shows a stable positive contribution, while Signage System and Accessibility Facilities are also associated with improved safety perception under certain conditions. In contrast, the Comfort and Enjoyment dimensions reflect more experiential and composite interaction patterns. In Comfort (Figure 9c), Landscape Environment, Rest Facilities, and Shading Facilities display synergistic tendencies, jointly contributing to improved stay quality. In Enjoyment (Figure 9d), interactions among Themed Activities, Play Facilities, and Dining and Shopping are associated with higher satisfaction levels.
The global ranking based on mean absolute SHAP interaction values reveals a structured and hierarchical interaction pattern rather than a simple list of feature pairs (Figure 9e). High-impact interactions are strongly concentrated around three key elements—Industrial Landscape, Leisure Activities, and Rest Facilities—with the strongest pairs including Industrial Landscape × Rest Facilities (SHAP interaction = 0.080), Industrial Landscape × Leisure Activities (SHAP interaction = 0.076), Leisure Activities × Rest Facilities (SHAP interaction = 0.068), and Industrial Landscape × Themed Activities (SHAP interaction = 0.062). These values are substantially higher than those at the lower end of the top-10 ranking, indicating that visitor perception is primarily shaped by the coupling of heritage landscape character, activity systems, and supporting infrastructure. Moreover, the interaction structure exhibits a clear hierarchy: top-ranked pairs form a core interaction layer that drives perceptual enhancement, while lower-ranked pairs (e.g., Internal Circulation × Industrial Landscape, Safety Facilities × Rest Facilities, and Signage System × Themed Activities) constitute a supporting layer that stabilizes and mediates experience.

5.2. Representative Interaction Analysis

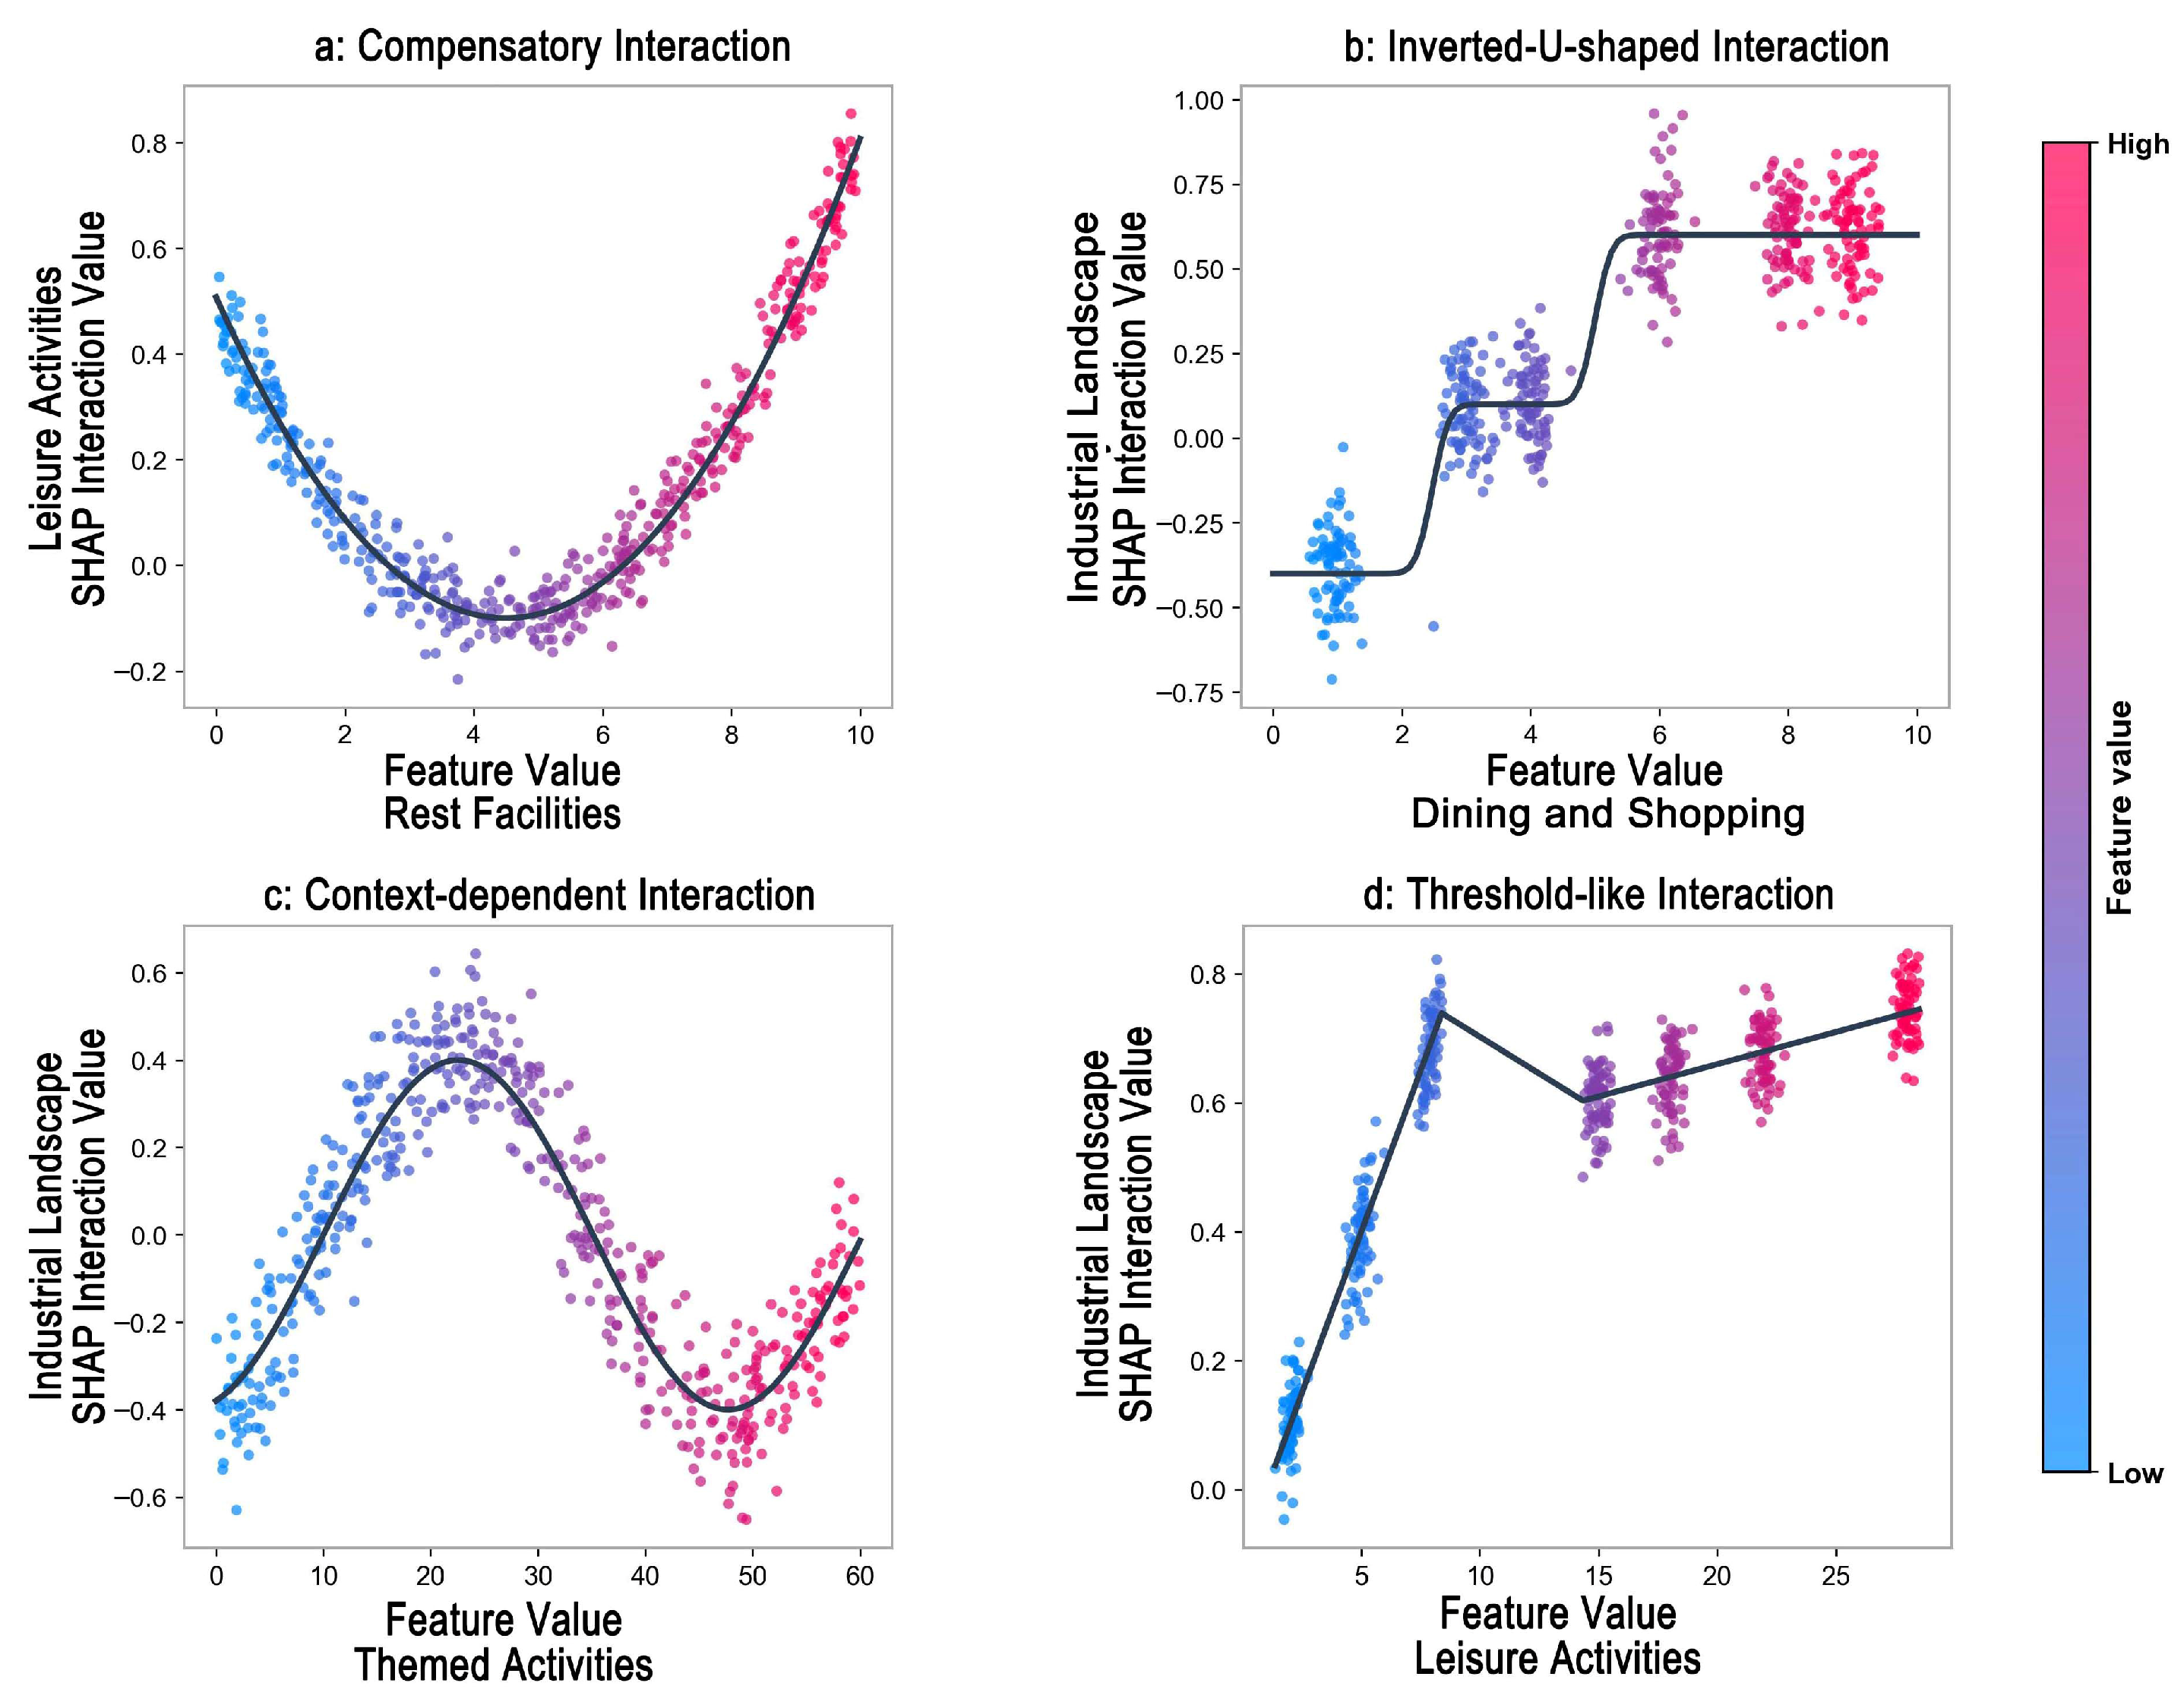
Building upon the global interaction ranking (Figure 9e), this section further examines the localized SHAP interaction patterns of high-ranking feature pairs to identify representative interaction mechanisms. As illustrated in Figure 10a–d, four dominant interaction types can be generalized: compensatory, inverted-U-shaped, context-dependent, and threshold-like interactions.
First, compensatory interactions (Figure 10a) are characterized by a strengthening interaction effect as the provision of supporting facilities increases. At lower levels, the interaction remains weak, but it becomes increasingly positive as rest facilities improve, indicating that infrastructure can enable or amplify the experiential value of activity-related elements. This pattern reflects functional complementarity and suggests that design should prioritize balancing facility provision rather than over-investing in single elements.
Second, inverted-U-shaped interactions (Figure 10b) exhibit increasing interaction effects at moderate levels of commercial intensity, followed by stabilization or slight decline at higher levels. This pattern implies diminishing marginal returns, where excessive commercial development may weaken the integrity of the industrial landscape. Accordingly, design interventions should maintain commercial intensity within an appropriate range to balance spatial activation and heritage preservation.
Third, context-dependent interactions (Figure 10c) display substantial variation in both direction and magnitude across value ranges, highlighting the conditional and context-sensitive nature of experiential relationships. This suggests that the effectiveness of thematic programming depends strongly on spatial and cultural context, and thus design strategies should avoid uniform solutions and instead adopt site-specific, differentiated approaches.
Finally, threshold-like interactions (Figure 10d) show a rapid increase in interaction effects at lower levels, followed by a more gradual growth pattern. This indicates a stage-like enhancement process, where initial improvements generate significant perceptual gains, while further enhancements yield diminishing returns. From a design perspective, this supports a phased development approach, prioritizing the attainment of foundational thresholds before incremental optimization.

5.3. Proposed Design Optimization Strategies

Based on the preceding analyses, this study proposes a precision design framework guided by interaction effects, shifting from element-focused optimization toward interaction-oriented spatial configuration. The results demonstrate that visitor perception is shaped not only by the performance of individual built environment elements, but also by their coupled and nonlinear interactions across spatial dimensions. Accordingly, the proposed framework identifies key interaction structures, quantifies their contributions through SHAP values, and translates these patterns into coordinated design strategies. This approach emphasizes that improvements in isolated elements may be insufficient unless their synergistic and compensatory relationships are explicitly considered, thereby addressing the limitations of conventional single-factor design.
Within this framework, dimension-specific yet interconnected strategies are developed to operationalize the empirical findings (Table 3). For Accessibility, coordinated enhancement of public transport, internal circulation, parking systems, and regional connectivity improves spatial continuity and reduces transfer friction. For Safety, integrating safety facilities with spatial order management and signage systems strengthens environmental legibility and operational clarity. For Comfort, priority should be given to the combined configuration of landscape quality, shading, and rest facilities, particularly by reinforcing the linkage between rest spaces and activity areas to enhance stay experience. For Enjoyment, industrial landscape elements, themed activities, recreational facilities, and commercial services should be aligned in accordance with threshold-like and inverted-U interaction patterns, ensuring a balance between experiential richness and heritage authenticity. These strategies are summarized in Table 2, which links SHAP-based interaction insights to actionable design interventions, supporting interaction-aware spatial optimization and sustainable development in industrial heritage brownfield parks.

5.4. Comparison with Previous Studies and Theoretical Implications

The findings of this study are broadly consistent with recent research demonstrating that the relationship between the built environment and perception-related outcomes is inherently nonlinear and interaction-dependent [39,40,41,42,43,44]. Previous studies have identified threshold effects, diminishing returns, and inverted-U-shaped relationships in urban vitality and psychological perception, indicating that spatial responses are sensitive to intensity ranges and contextual conditions [33,42]. In addition, growing evidence suggests that built environment elements influence outcomes through coupled and context-dependent interactions rather than independent effects [33,44]. For example, studies on urban vitality and residents’ sentiments highlight synergistic and antagonistic relationships among spatial factors, while research on walking experience further shows that perception emerges from the joint influence of physical environment and social interaction [41]. In addition, Zhu et al. demonstrate that residents’ psychological perception is shaped by nonlinear and non-monotonic responses to urban visual environmental attributes, with clear threshold effects and optimal ranges, indicating that improvements in environmental quality do not necessarily lead to continuous perceptual gains [33]. These findings align with the present study in emphasizing that spatial perception is shaped by complex, nonlinear, and multi-dimensional relationships.
Despite these similarities, this study extends previous research into two key aspects. First, while existing studies mainly focus on general urban contexts, this research examines multifunctional urban parks transformed from industrial heritage brownfields, where perception is more strongly driven by the coupling between industrial landscape, leisure activities, and supporting facilities. Second, rather than only identifying nonlinear patterns, this study systematically translates interaction effects into design-oriented strategies, linking compensatory, inverted-U-shaped, context-dependent, and threshold-like relationships with specific spatial optimization approaches. In doing so, the study advances current research from identifying nonlinear relationships to developing an interaction-based design paradigm, which integrates interpretable machine learning with spatial design decision-making. This perspective also responds to recent calls for improving the explainability and practical applicability of AI-based urban perception studies [40], thereby providing a transferable framework for perception-informed planning in brownfield regeneration contexts.

6. Conclusions

6.1. Key Findings and Contributions

This study develops a research framework integrating text analysis and interpretable machine learning to investigate the relationship between built environment elements and public satisfaction in industrial heritage sites, with Shougang Park as a case study. The main findings are summarized as follows.
(1)
Methodological Contribution.
This study proposes a quantitative and transferable approach for extracting perception-related information from social media texts. By transforming unstructured user-generated content into structured variables and integrating XGBoost with SHAP-based interpretation, the framework enables both the identification and explanation of complex relationships between built environment characteristics and visitor satisfaction. Compared with conventional approaches, this method improves robustness in modeling nonlinear and high-dimensional data while enhancing interpretability, thereby providing a scalable pathway for perception-based evaluation across diverse contexts.
(2)
Empirical and Conceptual Findings.
The results demonstrate that visitor satisfaction is governed by heterogeneous and nonlinear relationships across four perceptual dimensions—accessibility, safety, comfort, and enjoyment—structured through a system of 19 built environment elements. Rather than acting independently, these elements exhibit distinct response patterns, including threshold-like growth, diminishing marginal effects, and inverted-U-shaped relationships, indicating that perceptual responses are highly sensitive to intensity levels and contextual conditions. More importantly, interaction analysis reveals that spatial perception emerges from the nonlinear coupling of multiple elements, forming four representative interaction types: compensatory, inverted-U-shaped, context-dependent, and threshold-like relationships. This finding shifts the understanding of spatial perception from factor-based explanations toward a relational and interaction-driven perspective.
(3)
Design-oriented and Theoretical Implication.
Building upon these findings, the study translates nonlinear and interaction patterns into interaction-informed design strategies. The results indicate that effective spatial design should move beyond isolated element optimization toward interaction-oriented configuration, emphasizing the coordination of multiple elements within a dynamic system. Specifically, design interventions should enhance synergistic relationships across spatial systems, leverage compensatory effects to support experiential quality, regulate development intensity in response to nonlinear effects, and adopt context-sensitive and staged strategies in spatial programming. More fundamentally, this study establishes a conceptual bridge between interpretable machine learning and urban design, demonstrating how data-driven analysis can inform spatial decision-making through an interaction-based design paradigm. This contribution provides a transferable framework for perception-informed planning and supports the sustainable regeneration of multifunctional urban parks transformed from industrial heritage brownfields.

6.2. Limitations and Future Research

Despite these contributions, several limitations should be acknowledged. This study is based on a single-case analysis of Shougang Park, and the findings are inherently influenced by its specific spatial characteristics, climatic conditions, scale, and historical context. As a large-scale brownfield-transformed urban park located in a temperate monsoon climate, certain perception dimensions—such as shading facilities and thermal–humidity perception—may be particularly prominent, whereas in other climatic regions or urban contexts, different environmental concerns may emerge. Similarly, variations in park size, historical background, and popularity may affect both the composition of perception factors and the structure of their relationships. Therefore, while the proposed methodological framework is transferable, the empirical findings should be interpreted as context-dependent rather than universally generalizable.
In addition, the data are derived from platform-specific social media reviews, which may include non-authentic or promotional content and may not fully represent the entire visitor population. The reliance on text-based user-generated content also introduces potential biases related to linguistic expression and contextual interpretation, while the exclusion of low-information reviews may lead to an overrepresentation of more salient perceptions. Furthermore, the absence of multi-modal data, such as behavioral or visual information, limits the comprehensiveness of the analysis. Future research is encouraged to apply the proposed framework across diverse geographic settings and park types, as well as to integrate multi-source data to further examine its robustness and generalizability.

Author Contributions

Conceptualization, X.W., X.C. (Xiangru Chen) and Z.Z.; methodology, X.W., X.C. (Xiangru Chen) and C.Y.; software, Z.Z. and X.C. (Xiangru Chen); validation, X.C. (Xiangru Chen) and Z.Z.; formal analysis, X.C. (Xiangru Chen); investigation, X.C. (Xiangru Chen) and X.C. (Xinling Chen); resources, X.W.; data curation, X.C. (Xiangru Chen) and X.C. (Xinling Chen); writing—original draft preparation, X.C. (Xiangru Chen) and X.W.; writing—review and editing, X.W., X.C. (Xiangru Chen) and C.Y.; visualization, X.C. (Xiangru Chen), Z.Z. and C.Y.; supervision, X.W.; project administration, X.W.; funding acquisition, X.W. All authors have read and agreed to the published version of the manuscript.

Funding

This research was funded by the National Social Science Fund of China, grant number 23XTQ011.

Data Availability Statement

The data used in this study were collected from publicly available social media comments related to Shougang Park. Due to platform policies and privacy considerations, the raw data cannot be made publicly available. The processed data supporting the findings of this study are available from the corresponding author upon reasonable request.

Acknowledgments

During the preparation of this manuscript, the authors used GPT-5 to assist with sentiment annotation of training samples for the XGBoost model through prompt engineering and for final language polishing of the manuscript. The authors have reviewed and edited all outputs generated by the tool and take full responsibility for the content of this publication.

Conflicts of Interest

The authors declare no conflicts of interest.

References

  1. Zhang, L.; Wang, Y.; Ding, Q.; Shi, Y. Current Status and Prospects of Ecological Restoration and Brownfield Reuse Research Based on Bibliometric Analysis: A Literature Review. Land 2025, 14, 1185. [Google Scholar] [CrossRef]
  2. Fu, Y.; Dong, W. How Perceived Value, Environmental Awareness, and Social Identity Shape Public Support for Industrial Heritage: The Mediating Role of Place Attachment. Front. Psychol. 2025, 16, 1645646. [Google Scholar] [CrossRef] [PubMed]
  3. Wang, S.; Duan, W.; Zheng, X. Post-Occupancy Evaluation of Brownfield Reuse Based on Sustainable Development: The Case of Beijing Shougang Park. Buildings 2023, 13, 2275. [Google Scholar] [CrossRef]
  4. Chu, T.; Zhou, M.; Wu, J. Sustainability Performance Differences of Industrial Heritage Regeneration Implementation Modes. Buildings 2024, 14, 3489. [Google Scholar] [CrossRef]
  5. Zhao, W. The Rebirth of Old Industrial Remains: A Case Study of the Winter Olympic Office Area of Shougang Cultural Industry Park. Archit. Cult. 2018, 166, 102–103. [Google Scholar]
  6. Qiu, S.; Bao, L.; Xu, J.; Wei, F. Research on the Influence Mechanism of “Landscape-Heritage” on PublicSpatiotemporal Behavior: A Case Study of Shougang Industrial Heritage Park. Landsc. Archit. 2025, 32, 41–48. [Google Scholar] [CrossRef]
  7. Tao, H.; Wen, Y.; Liu, M.; Wu, Y. Industrial Heritage Protection from the Perspective of Spatial Narrative. Land 2025, 14, 1105. [Google Scholar] [CrossRef]
  8. Ding, C.; Cao, X.; Næss, P. Applying Gradient Boosting Decision Trees to Examine Non-Linear Effects of the Built Environment on Driving Distance in Oslo. Transp. Res. Part A Policy Pract. 2018, 110, 107–117. [Google Scholar] [CrossRef]
  9. Chen, C.; Wang, J.; Li, D.; Sun, X.; Zhang, J.; Yang, C.; Zhang, B. Unraveling Nonlinear Effects of Environment Features on Green View Index Using Multiple Data Sources and Explainable Machine Learning. Sci. Rep. 2024, 14, 30189. [Google Scholar] [CrossRef]
  10. Wu, X.; Tao, T.; Cao, J.; Fan, Y.; Ramaswami, A. Examining Threshold Effects of Built Environment Elements on Travel-Related Carbon-Dioxide Emissions. Transp. Res. Part D Transp. Environ. 2019, 75, 1–12. [Google Scholar] [CrossRef]
  11. Liu, J.; Wang, B.; Xiao, L. Non-Linear Associations Between Built Environment and Active Travel for Working and Shopping: An Extreme Gradient Boosting Approach. J. Transp. Geogr. 2021, 92, 103034. [Google Scholar] [CrossRef]
  12. Chen, T.; Guestrin, C. Xgboost: A Scalable Tree Boosting System. In Proceedings of the 22nd ACM Sigkdd International Conference on Knowledge Discovery and Data Mining, San Francisco, CA, USA, 13–17 August 2016; pp. 785–794. [Google Scholar]
  13. Lundberg, S.M.; Lee, S.-I. A Unified Approach to Interpreting Model Predictions. Adv. Neural Inf. Process. Syst. 2017, 30, 4765–4774. [Google Scholar]
  14. Lundberg, S.M.; Erion, G.; Chen, H.; DeGrave, A.; Prutkin, J.M.; Nair, B.; Katz, R.; Himmelfarb, J.; Bansal, N.; Lee, S.-I. From Local Explanations to Global Understanding with Explainable AI for Trees. Nat. Mach. Intell. 2020, 2, 56–67. [Google Scholar] [CrossRef] [PubMed]
  15. Dang, X.; Hong, Q.; Liu, W.; Wang, Y. China’s Heritage Governance Blueprint: Revisiting Evolutionary Trajectories, Reframing Institutional Priorities and Mapping the National Registry. Habitat. Int. 2025, 165, 103541. [Google Scholar] [CrossRef]
  16. Lu, N.; Liu, M.; Wang, R. Reproducing the Discourse on Industrial Heritage in China: Reflections on the Evolution of Values, Policies and Practices. Int. J. Herit. Stud. 2020, 26, 498–518. [Google Scholar] [CrossRef]
  17. Zhang, Q.; Lee, J.; Jiang, B.; Kim, G. Revitalization of the Waterfront Park Based on Industrial Heritage Using Post-Occupancy Evaluation—A Case Study of Shanghai (China). Int. J. Environ. Res. Public Health 2022, 19, 9107. [Google Scholar] [CrossRef]
  18. Arbab, P.; Alborzi, G. Toward Developing a Sustainable Regeneration Framework for Urban Industrial Heritage. J. Cult. Herit. Manag. Sustain. Dev. 2021, 12, 263–274. [Google Scholar] [CrossRef]
  19. Sun, M.; Chen, C. Renovation of Industrial Heritage Sites and Sustainable Urban Regeneration in Post-Industrial Shanghai. J. Urban Aff. 2023, 45, 729–752. [Google Scholar] [CrossRef]
  20. Zheng, X.; Chen, T.; Zheng, C.; Heath, T. Unlocking Public Engagement in Reused Industrial Heritage: Weighting Point Evaluation Method for Cultural Expression. Buildings 2024, 14, 2695. [Google Scholar] [CrossRef]
  21. Chen, X.; Chen, J.; Pu, W.; Fan, G.; Lu, Z. Modeling Spatial–Behavioral Dynamics in Cultural Exhibition Architecture Through Mapping and Regression Analysis. Buildings 2025, 15, 3049. [Google Scholar] [CrossRef]
  22. Lynch, K. The Image of the City; MIT Press: Cambridge, MA, USA, 1964. [Google Scholar]
  23. Firth, T.M. Tourism as a Means to Industrial Heritage Conservation: Achilles Heel or Saving Grace? J. Herit. Tour. 2011, 6, 45–62. [Google Scholar] [CrossRef]
  24. Dai, D.; Liu, S.; Zhang, T. Using Public Participation Geographic Information System to Evaluate Cultural Service of Modern Urban Parks: Taking Shanghai Fuxing Park as Case Study. Landsc. Archit. 2019, 26, 95–100. [Google Scholar] [CrossRef]
  25. Wu, H.; Gong, C.; Wang, R.; Niu, X.; Cao, Y.; Cao, C.; Hu, C. Moderating Effects of Park Accessibility and External Environment on Park Satisfaction in a Mountainous City. Land 2025, 14, 77. [Google Scholar] [CrossRef]
  26. Sugiama, A.G.; Nurhikmah, W.; Rini, R.O.P.; Wigati, E. Investigating the Essence of Recreational Accessibility and Its Effects on Satisfaction, Memories, and Loyalty of City Park Visitors. Afr. J. Hosp. Tour. Leis. 2023, 12, 1524–1541. [Google Scholar]
  27. Fletcher, D.; Fletcher, H. Manageable Predictors of Park Visitor Satisfaction: Maintenance and Personnel. J. Park Recreat. Adm. 2003, 21, 21–37. [Google Scholar]
  28. Veitch, J.; Rodwell, L.; Abbott, G.; Carver, A.; Flowers, E.; Crawford, D. Are Park Availability and Satisfaction with Neighbourhood Parks Associated with Physical Activity and Time Spent Outdoors? BMC Public Health 2021, 21, 306. [Google Scholar] [CrossRef]
  29. Talal, M.L.; Santelmann, M.V. Visitor Access, Use, and Desired Improvements in Urban Parks. Urban For. Urban Green. 2021, 63, 127216. [Google Scholar] [CrossRef]
  30. Liu, S.; Higgs, C.; Arundel, J.; Boeing, G.; Cerdera, N.; Moctezuma, D.; Cerin, E.; Adlakha, D.; Lowe, M.; Giles-Corti, B. A Generalized Framework for Measuring Pedestrian Accessibility Around the World Using Open Data. Geogr. Anal. 2022, 54, 559–582. [Google Scholar] [CrossRef]
  31. Yang, D.; Lin, Q.; Li, H.; Chen, J.; Ni, H.; Li, P.; Hu, Y.; Wang, H. Unraveling Spatial Nonstationary and Nonlinear Dynamics in Life Satisfaction: Integrating Geospatial Analysis of Community Built Environment and Resident Perception via MGWR, GBDT, and XGBoost. ISPRS Int. J. Geo-Inf. 2025, 14, 131. [Google Scholar] [CrossRef]
  32. Hoang, N.-D.; Tran, V.-D.; Huynh, T.-C. From Data to Insights: Modeling Urban Land Surface Temperature Using Geospatial Analysis and Interpretable Machine Learning. Sensors 2025, 25, 1169. [Google Scholar] [CrossRef]
  33. Zhu, J.; Wang, S.; Ma, H.; Shan, T.; Xu, D.; Sun, F. Nonlinear Effect of Urban Visual Environment on Residents’ Psychological Perception—An Analysis Based on XGBoost and SHAP Interpretation Model. City Environ. Interact. 2025, 27, 100202. [Google Scholar] [CrossRef]
  34. Yu, M.; Ji, Q.; Zheng, X.; Cui, W. Nonlinear Effects of the Built Environment on Urban Vitality in Jinan Based on Multi-Source Data and Explainable AI. Sci. Rep. 2026, 16, 4923. [Google Scholar] [CrossRef] [PubMed]
  35. Zhang, Y.; Wang, X.; Ye, Y.; Wang, L.; Zhang, Y.; Qin, W.; Chi, Y.; Liu, G.; Yao, S. Nonlinear Relationships and Interaction Effects of Urban Built Environment on Urban Vitality Based on Explainable Machine Learning. City Environ. Interact. 2025, 28, 100244. [Google Scholar] [CrossRef]
  36. Bai, D.; Miao, C.; Xi, Y.; Liu, H.; He, C. The Impact of 2D/3D Building Morphology and Green Spaces on Urban Heat Environments: Relative Contributions, Interaction and Marginal Effects. Ecol. Indic. 2025, 180, 114296. [Google Scholar] [CrossRef]
  37. Tan, J.; Wei, Q.; Liao, Z.; Kuang, W.; Deng, H.; Yu, D. Relationship between urban form and surface temperature based on XGBoost SHAP interpretable machine learning model. Chin. J. Appl. Ecol./Yingyong Shengtai Xuebao 2025, 36, 659. [Google Scholar] [CrossRef]
  38. Cao, W.; Wang, L.; Wang, J.; Elsadek, M.; Zhang, D. Nonlinear Health Benefits of Public Green Space: Evidence from a Nationwide Machine Learning Study in China. Front. Public Health 2025, 13, 1680591. [Google Scholar] [CrossRef]
  39. Li, X.; Zhang, Y. The Non-Linear Impact of Green Space Recreational Service Performance on Residents’ Emotional States in High-Density Cities. Land 2026, 15, 56. [Google Scholar] [CrossRef]
  40. Sangers, R.; van Gemert, J.; van Cranenburgh, S. Explainability of Deep Learning Models for Urban Space Perception. arXiv 2022, arXiv:2208.13555. [Google Scholar] [CrossRef]
  41. Chen, X.; Sun, Y.; Ibrahim, F.I.B.; Kamarazaly, M.A.B.; Abidin, S.N.B.Z.; Tang, S. Social Media Interaction and Built Environment Effects on Urban Walking Experience: A Machine Learning Analysis of Shanghai Citywalk. PLoS ONE 2025, 20, e0320951. [Google Scholar] [CrossRef]
  42. Dubey, A.; Naik, N.; Parikh, D.; Raskar, R.; Hidalgo, C.A. Deep Learning the City: Quantifying Urban Perception at a Global Scale. In Proceedings of the Computer Vision—ECCV 2016; Leibe, B., Matas, J., Sebe, N., Welling, M., Eds.; Springer International Publishing: Cham, Switzerland, 2016; pp. 196–212. [Google Scholar]
  43. Aman, J.; Matisziw, T.C. Urban Sentiment Mapping Using Language and Vision Models in Spatial Analysis. Front. Comput. Sci. 2025, 7, 1504523. [Google Scholar] [CrossRef]
  44. Wu, W.; Zhou, Y.; Yu, H.; Niu, X.; Gao, Y. Nonlinear Relationship and Spatial Heterogeneity Between Built Environment and Residents’ Sentiments: A Comprehensive Framework Integrating Multimodal Data with AI. 2025. Available online: https://discovery.researcher.life/article/nonlinear-relationship-and-spatial-heterogeneity-between-built-environment-and-residents-sentiments-a-comprehensive-framework-integrating-multimodal-data-with-ai/fa9655664df33d029f329b7d03673242 (accessed on 10 April 2026).
  45. Blei, D.M.; Ng, A.Y.; Jordan, M.I. Latent Dirichlet Allocation. J. Mach. Learn. Res. 2003, 3, 993–1022. [Google Scholar]
  46. Friðriksdóttir, S.R.; Nielsen, D.S.; Einarsson, H. Hotter and Colder: A New Approach to Annotating Sentiment, Emotions, and Bias in Icelandic Blog Comments. March 2025, pp. 181–191. Available online: https://aclanthology.org/2025.nodalida-1.18.pdf (accessed on 10 April 2026).
  47. Xiang, C.; Rosni, N.A.B.; Ab Ghafar, N. A Landscape Narrative Model for Visitor Satisfaction Prediction in the Living Preservation of Urban Historic Parks: A Machine-Learning Approach. Sustainability 2025, 17, 5545. [Google Scholar] [CrossRef]
  48. Zhang, M. The State-Led Approach to Industrial Heritage in China’s Mega-Events: Capital Accumulation, Urban Regeneration, and Heritage Preservation. Built Herit. 2024, 8, 30. [Google Scholar] [CrossRef] [PubMed]
  49. Yang, N. Opinion Sharing in Online Travel Communities: A Corpus-Based Comparison of Members’ Stance Expression in Ctrip and Tripadvisor. Discourse Context Media 2025, 65, 100885. [Google Scholar] [CrossRef]
  50. Cai, M. Natural Language Processing for Urban Research: A Systematic Review. Heliyon 2021, 7, e06322. [Google Scholar] [CrossRef]
  51. Lin, Z.; Huang, Q.; Zhong, J.; Xie, J.; Wang, Y.; He, W. Public Attitudes toward DeepSeek on Chinese Social Media: A Study Based on Sentiment Analysis and Topic Modeling. Soc. Netw. Anal. Min. 2026, 16, 9. [Google Scholar] [CrossRef]
  52. Cao, B.; Jiang, K.; Fan, J. SLaNT: A Semi-Supervised Label Noise-Tolerant Framework for Text Sentiment Analysis. In Proceedings of the International AAAI Conference on Web and Social Media, Buffalo, NY, USA, 3–6 June 2024; Volume 18, pp. 191–202. [Google Scholar] [CrossRef]
  53. Li, L.; Xu, X.; Xiao, S.; Wang, L. Emotional polarization to conflict governance: Need feature and satisfaction for aging-adapted retrofitting in historic urban communities—An IPA-BERTopic framework using social media data. Open House Int. 2025, 51, 385–401. [Google Scholar] [CrossRef]
  54. Zheng, X.; Huang, Y.; Xie, Z.; Zheng, A. Understanding Wetland Park Feature Influence Through Cross-Regional Multimodal Analysis and Interpretable Modeling. Sci. Rep. 2025, 15, 40504. [Google Scholar] [CrossRef]
  55. Dong, W.; Wang, N.; Dong, Y.; Cao, J. Examining the Nonlinear and Interactive Effects of Built Environment Characteristics on Travel Satisfaction. J. Transp. Geogr. 2025, 123, 104111. [Google Scholar] [CrossRef]
Figure 1. Method concept diagram.
Buildings 16 01632 g001
Figure 2. Study area.
Buildings 16 01632 g002
Figure 3. LDA topic model diagram.
Buildings 16 01632 g003
Figure 4. Threshold sensitivity inflection point chart.
Buildings 16 01632 g004
Figure 5. Emotion annotation construction process.
Buildings 16 01632 g005
Figure 6. Analysis of indicator correlation.
Buildings 16 01632 g006
Figure 7. SHAP-based global interpretation results of the XGBoost model.
Buildings 16 01632 g007
Figure 8. Nonlinear response patterns of environmental variables.
Buildings 16 01632 g008
Figure 9. SHAP explanation interactivity.
Buildings 16 01632 g009
Figure 10. Localized SHAP interaction patterns.
Buildings 16 01632 g010
Table 1. Built-environment elements and keyword construction.
Primary CategorySub-CategoryKeywords
Accessibility [5,17]Geographic LocationTransportation location, distance to city center, proximity to commercial areas, navigation and positioning
Public TransportationDirect subway access, bus connections, transfer convenience, walking time
Parking FacilitiesParking capacity, charging standards, peak hour congestion, parking convenience
Internal CirculationRoute guidance, walking continuity, slow-traffic conditions, path distribution
Safety [21]Safety FacilitiesSecurity monitoring, night lighting, security patrols, emergency support
Spatial Order ManagementFlow monitoring, queuing and waiting, management efficiency, order regulations
Accessibility FacilitiesRamp slope, accessible elevators, low-level facilities, step design
Signage SystemSignage guidance, information density, panoramic maps, location identification
Comfort [22,23]Landscape EnvironmentGreening richness, water feature quality, visual esthetics, air quality
Rest FacilitiesSeat density, node configuration, resting space, staying comfort
Sanitary FacilitiesToilet cleanliness, trash bin distribution, environmental hygiene
Shading FacilitiesTree shade, shading structures, solar radiation intensity, rain shelter function
Thermal and Humidity PerceptionNatural ventilation, thermal comfort, perceived temperature
Leisure ActivitiesSuitability for walking, freedom of activity, sense of relaxation, atmosphere of daily life
Enjoyment [33,55]Industrial LandscapeRetention of industrial relics, historical atmosphere, symbol recognition, spirit of place
Fitness FacilitiesSports field configuration, completeness of fitness equipment, vitality space, functional diversity
Play FacilitiesChildren’s amusement, parent–child interactivity, safety standards, types of entertainment
Dining and ShoppingRichness of dining supply, consumption experience, price rationality, business format structure
Themed ActivitiesFestival activities, exhibitions and markets, cultural performances, social interaction
Table 2. Significance analysis of the OLS model (* p < 0.05; ** p < 0.01; *** p < 0.001).
Variablesβ Coefficientp-Value
Geographic Location−0.0060.333
Public Transportation0.05730.004 **
Parking Facilities0.01620.289
Internal Circulation0.02830.097
Safety Facilities0.18510 ***
Spatial Order Management0.08630 ***
Accessibility Facilities0.30430 ***
Signage System0.15460 ***
Landscape Environment0.02840.068
Rest Facilities0.04820.054
Sanitary Facilities0.16210 ***
Shading Facilities0.13490 ***
Thermal and Humidity Perception−0.01580.467
Leisure Activities0.03680.04 *
Industrial Landscape0.0110.499
Fitness Facilities−0.02320.398
Play Facilities0.03490.117
Dining and Shopping0.02210.207
Themed Activities0.04870.022 *
Table 3. Design optimization strategies.
CategorySub-CategoryStrategy Focus
AccessibilityGeographic LocationStrengthen regional connectivity and entrance visibility
Public TransportationImprove transit accessibility and interface integration
Parking FacilitiesOptimize distribution and pedestrian linkage
Internal CirculationEnhance continuity and wayfinding clarity
SafetySafety FacilitiesUpgrade lighting and surveillance coverage
Spatial Order ManagementImprove spatial organization and crowd regulation
Accessibility FacilitiesEnsure barrier-free and inclusive design
Signage SystemStrengthen legibility and directional guidance
ComfortLandscape EnvironmentEnhance greenery and environmental quality
Rest FacilitiesIncrease provision and optimize placement
Sanitary FacilitiesImprove accessibility and maintenance
Shading FacilitiesIntegrate shading with activity spaces
Thermal & Humidity PerceptionImprove microclimate through design interventions
Leisure ActivitiesProvide diverse and accessible activity options
EnjoymentIndustrial LandscapePreserve and highlight heritage characteristics
Fitness FacilitiesIntegrate fitness functions with open space
Play FacilitiesDiversify recreational experiences
Dining and ShoppingControl intensity and spatial distribution
Themed ActivitiesDevelop context-sensitive programming
Disclaimer/Publisher’s Note: The statements, opinions and data contained in all publications are solely those of the individual author(s) and contributor(s) and not of MDPI and/or the editor(s). MDPI and/or the editor(s) disclaim responsibility for any injury to people or property resulting from any ideas, methods, instructions or products referred to in the content.