Article

Performance Analysis of a Solar-Assisted Air Source Heat Pump with Cascaded Latent Heat Storage and Utilization for Building Heating


1
School of Energy and Environmental Engineering, Hebei University of Technology, Tianjin 300401, China
2
Department of Environmental Engineering, Hebei University of Environmental Engineering, Qinhuangdao 066102, China
*
Author to whom correspondence should be addressed.
Buildings 2026, 16(8), 1541; https://doi.org/10.3390/buildings16081541
Submission received: 6 March 2026 / Revised: 31 March 2026 / Accepted: 7 April 2026 / Published: 14 April 2026

Abstract

The solar-assisted air source heat pump (SAHP) is a key technology of low carbon heating. However, the SAHP is still inefficient and unstable at low temperatures. Cascaded latent heat storage (CLHS) can store multi-stage thermal energy, which provides the possibility for the multiple utilization of solar energy. Hence, this paper proposed the SAHP integrated with CLHS for building heating. The high-temperature and medium-temperature latent heat storage (LHS) units are used for direct heating, and the low-temperature LHS unit preheats the air for the air source heat pump (ASHP). The thermal performance of the CLHS device is evaluated through combined numerical simulations and experimental tests. Results show that the average heat storage rate of the cascaded system is 61.1% higher than that of a conventional single-stage LHS unit. The heat storage uniformity of CLHS gradually improves with increasing inlet flow rate, but shows a trend of first increasing and then decreasing with the increase in fluid inlet temperature. Among the three tested levels, 80 °C was found to be the most uniform heat storage of the CLHS device. The performance of the system was further analyzed using TRNSYS to assess seasonal building heating performance. The overall efficiencies of the high/middle/low temperature LHS units are 93.6%, 81.6% and 94.3%, respectively. And the solar heat supply accounts for 70.8% of the total heat supply of the system. Compared with the non-preheating system where the low-temperature LHS unit is removed, the COP of the graded heating system is increased by 18.3%, and the energy consumption is reduced by 16.6%. Further parametric optimization based on the Hooke–Jeeves method reduces total system energy consumption by 20.7% and associated pollutant emissions by 20.6% compared with the pre-optimization system. The findings provide practical insights into the application of CLHS in solar-assisted heat pump systems for building heating.

1. Introduction

Energy crisis and environmental pollution are the key issues that limit the development of human society [1,2]. Building heating has emerged as a significant area due to its high energy consumption and substantial carbon emissions [3,4,5]. To mitigate these environmental impacts, clean heating technologies such as solar heating and ASHP have been widely promoted as promising alternatives. However, despite their carbon-reduction benefits, in actual operation, the performance of these technologies is strongly affected by weather conditions and load fluctuations [6,7], leading to operational instability during the heating season.
Hence, researchers coupled solar collector and SAHP for efficient heating. Liu et al. [8] confirmed that the SAHP increased the evaporation temperature by 3.7 °C compared to a conventional air source heat pump, keeping the evaporator in a frost-free state. Correspondingly, the SAHP achieved an 18.7% improvement in COP. Wan et al. [9] investigated the SAHP under three coupling modes: preheating, series, and parallel. SAHP can save 120.81 kW·h and reduce carbon emissions by 2182.36 kg. Nevertheless, solar collector cannot work at night. In this case, the performance of SAHP is not ideal. Thermal energy storage is necessary. From a building engineering perspective, integrating thermal energy storage into SAHP systems is essential to ensure stable heating performance and reliable indoor thermal comfort. By storing excess solar energy and releasing it when needed, the stability and energy efficiency of SAHP can be further improved [10,11].
Thermal energy storage (TES) technologies commonly used in building heating systems can be classified into three types [12,13,14,15]: sensible heat storage, latent heat storage, and chemical heat storage. Among these, LHS based on phase change materials has a high energy density [16] and an approximately isothermal heat storage and release process [17,18], which plays a crucial role in improving the performance of ASHP. Qu et al. [19] tested that the COP of the phase change material (PCM)-SAHP system was 65% higher than that of the SAHP at a temperature below 10 °C, and the operation was more stable. Gao et al. [20] proposed a new type of SAHP with LHS unit integrated into the condenser. The average performance coefficient of the new system is 5.42, which is 143.0% higher than that of the original SAHP. Moreover, the LHS unit completed heat storage in 1.8 h, which was shortened to 32.7% of the original. Wu et al. [21] proposed a PCM-filled solar collector and combined it with the evaporator of the SAHP. Compared with ASHP, the performance of the other three modes has been improved differently. The average COP and exergy efficiency of new system increased by 70% and 67%, respectively. These studies indicate that latent heat storage can effectively enhance the operational stability and energy efficiency of SAHP systems in building heating applications.
Furthermore, some researchers have optimized the SAHP integrated PCM by simulation. Kanimozhi et al. [22] developed a thermal energy storage system operating with phase change materials (PCMs) for solar water heating applications, utilizing design of experiments modeling to optimize the system’s design and performance. Shailendra et al. [23] established a model to calculate various parameters such as the effectiveness of PCMs, hot water quality, total heat content, and charging duration, evaluating the effectiveness of PCMs in the storage tank of a solar water heating system. Li et al. [24] analyzed the effects of solar collector area, SAHP heating capacity and PCM tank capacity on total electricity use, operating cost, thermal uncomfortable ratio, and CO2 emission. The optimal parameters are solved by genetic algorithm to achieve 2.7–14.9% power saving. Kong et al. [25] used annual life cycle cost and thermal comfort as indicators. The lowest cost of the optimized operation cost is 18.3 CNY/m2, which can save up to 46% compared with the traditional heating system. Such optimization studies highlight the importance of system-level parameter design when balancing energy consumption, operating cost, and thermal comfort in building heating systems.
Notably, most of the LHS devices used for SAHP are single-stage, which constrains its operational flexibility. For instance, when an LHS device with a phase change temperature of 50 °C is applied, using it for air preheating may result in inefficient utilization of stored thermal energy. If the LHS device with a phase change temperature of 30 °C is used, it cannot assist heating. Moreover, since the temperature difference between the fluid and the phase change material gradually decreases [26], the melting of PCM in a single-stage LHS device is non-uniform.
The CLHS refers to the arrangement of multiple PCMs with different melting points along the fluid flow direction [27,28]. The CLHS maintains a nearly constant temperature difference between the heat transfer fluid and PCMs during the melting and solidification cycles, thereby enhancing the thermal performance of the LHS device [29]. Compared with the single stage LHS, the CLHS device has a higher heat storage rate and efficiency [30,31]. And Bagherzadeh et al. [32] have proved through experiments that in the solar heating system, the CLHS stores more heat and exergy than the single latent heat storage (SLHS). More importantly, the CLHS can provide multi-level thermal energy, which allows the SAHP to have more operation modes to adapt to different scenarios.
Despite the theoretical advantages of CLHS in providing multi-level thermal energy, its systematic integration with SAHP systems remains underexplored. A critical research gap exists regarding the synergistic control of cascaded thermal resources specifically, allocating medium- and high-grade latent heat for direct space heating while utilizing low-grade heat to preheat the SAHP evaporator to prevent frosting. To address this gap, in this study, a SAHP system integrated with CLHS is investigated for building heating applications. Experimental tests and numerical simulations are conducted to evaluate the thermal performance and heat storage uniformity of the CLHS device compared to SLHS. Furthermore, a graded heating system combining the SAHP and CLHS is analyzed using TRNSYS to assess its seasonal energy performance and to identify suitable operating parameters for building heating systems.

2. Methods

2.1. Simulation of CLHS

2.1.1. Model Description

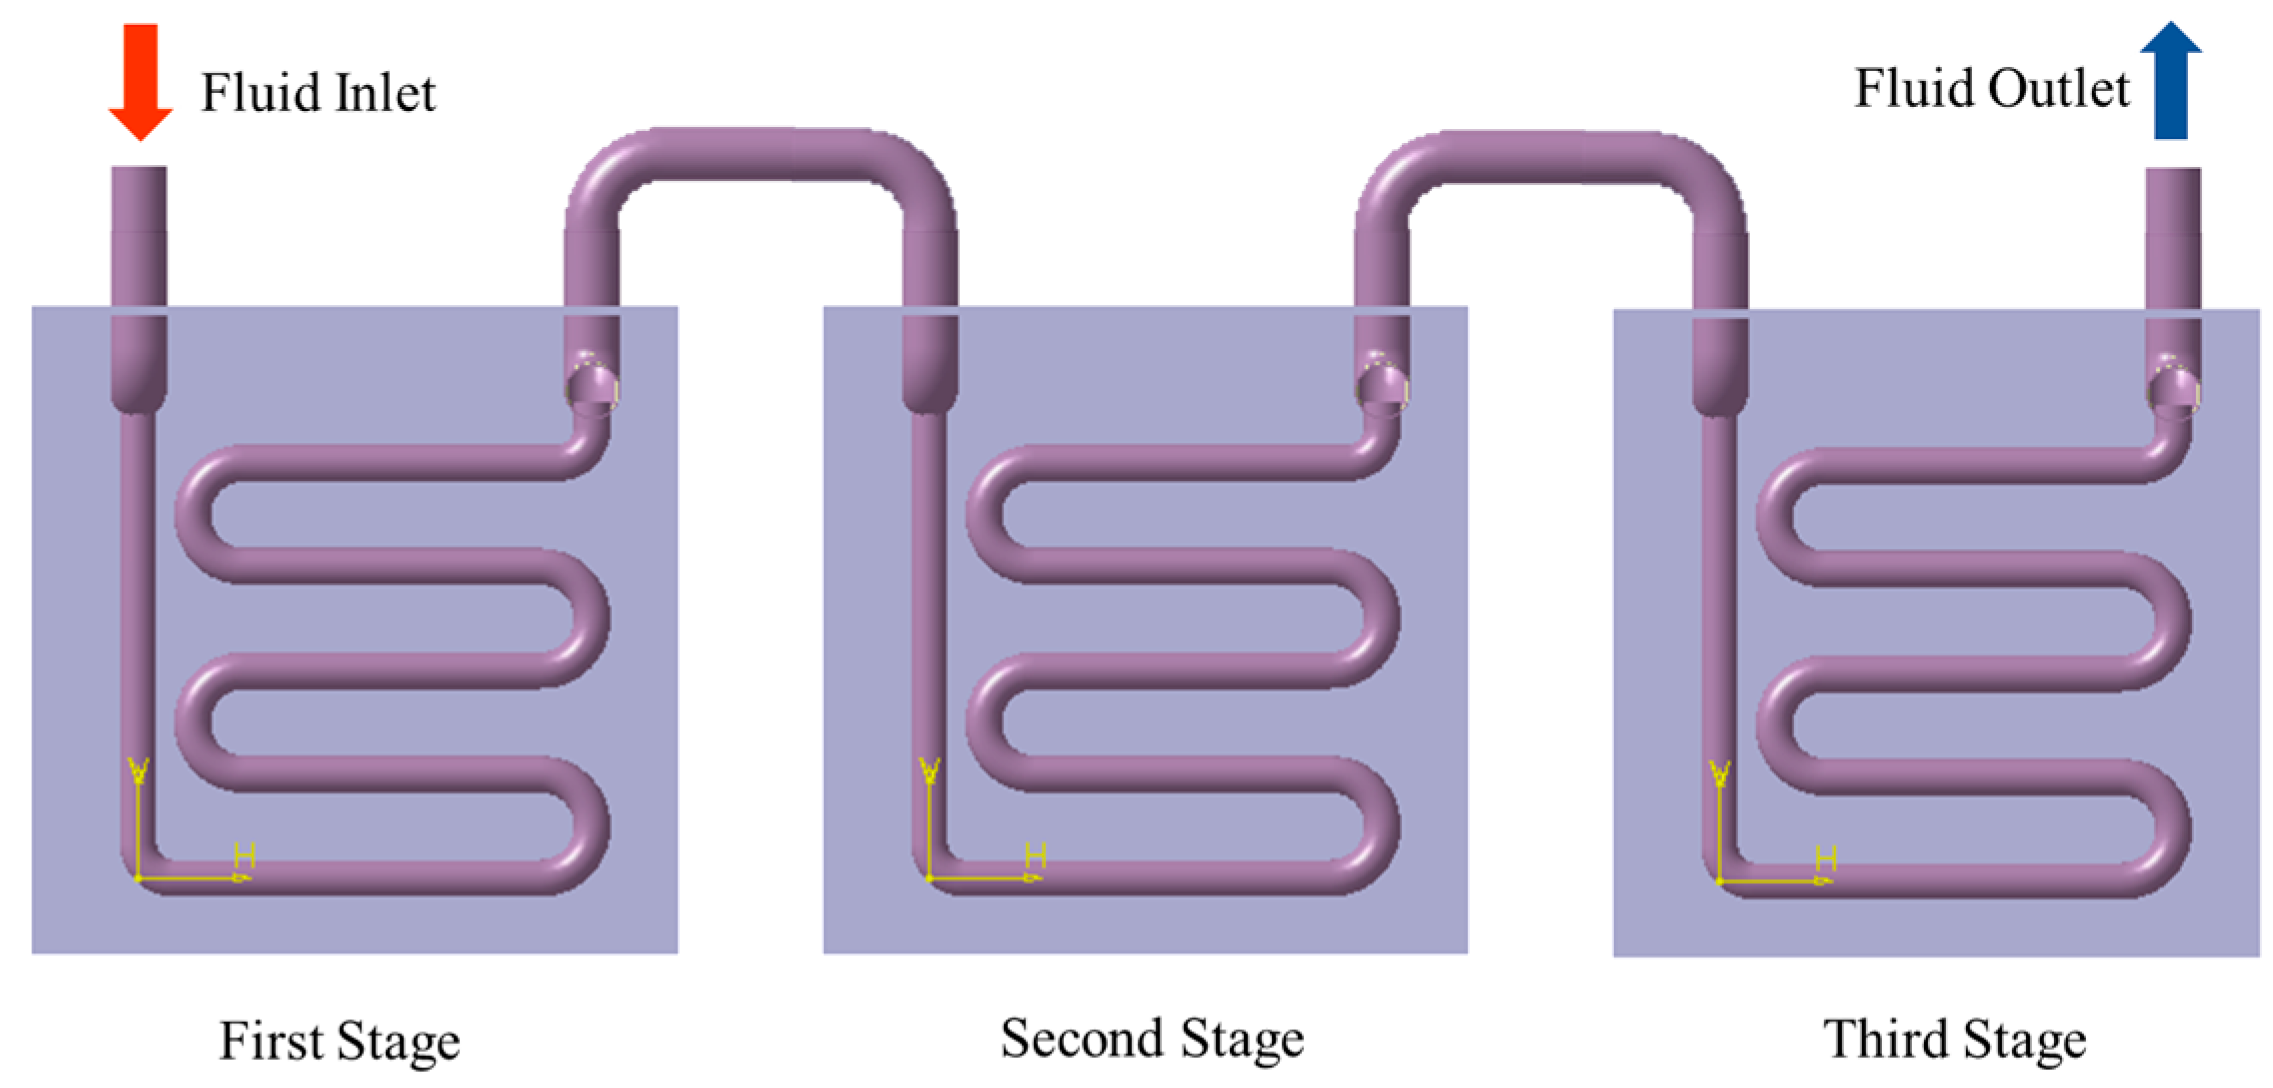
The inner vessel of the actual physical device has dimensions of 250 mm in length, width, and height. The 2D model is built based on the longitudinal section of the actual device along the fluid flow direction, maintaining the exact full-scale geometric dimensions without any dimensional reduction or enlargement, as shown in Figure 1. A 2D model was adopted because the system exhibits geometric symmetry, and the primary heat transfer occurs within the cross-sectional plane. This simplification effectively reduces computational time while providing acceptable accuracy for system-level analysis. The 2D computational domain measures 250 mm by 250 mm, with a built-in heat tube diameter of 16 mm and thickness of 1 mm; horizontal and longitudinal heat exchanger tubes are spaced 32 mm apart. For the CLHS, the phase change temperatures of the three-stage LHS units were set at 25 °C, 42 °C, and 60 °C. For the SLHS, the phase change temperatures of three-stage LHS units were 42 °C. The PCMs used in the experiments (product codes: SW25, SW42, and SW60) are commercial-grade paraffin waxes (primarily a mixture of straight-chain saturated hydrocarbons) supplied by Shanghai Joule Wax Co., Ltd., Shanghai, China, with a purity of 99%. The phase transition temperatures, latent heat, and specific heat capacities were measured using a Differential Scanning Calorimeter (DSC). The thermal conductivity and density were measured by a Hot Disk thermal constants analyzer and an electronic densitometer, respectively. The specific parameters of the actual PCMs are listed in Table 1.

2.1.2. Mathematical Model

The enthalpy method is used to solve the phase change heat transfer problem. The following simplified assumptions are adopted, which are common in previous studies:
(1)
The heat loss of LHS unit is ignored;
(2)
The heat transfer fluid is the incompressible Newtonian fluid.
(3)
The PCM is isotropic, and the physical parameters are constant.
(4)
The outer wall of the LHS device is set as an adiabatic boundary. The contact between the outer wall of the tube and the PCM is defined as ideal thermal contact, neglecting the contact thermal resistance.
(5)
A fully developed outflow boundary condition is adopted at the fluid domain outlet, where the flow velocity exhibits no gradient variation along the flow direction at the outlet cross-section.
In addition, the heat transfer solution methods for each region are as follows: For the PCM, the Laplacian term in the energy governing equation fully accounts for two-dimensional heat conduction in both the axial and radial directions. For the fluid, in addition to the convective heat transfer term, both the axial and radial heat conduction of the heat transfer fluid are simultaneously accounted for in the momentum and energy equations. For the tube wall, two-dimensional steady-state heat conduction in the axial and radial directions is solved simultaneously.
When the internal heat source and convection during the phase change process are not considered, the equation for the entire region is:
ρ   h   t = k 2 T
( ρ , k ) = ρ s , k s                             h < h s * ρ s l , k s l           h s h h l * ρ l , k l                                 h < h l *  
When the specific heat capacities of the solid and liquid phases are constants, the equations for temperature and enthalpy is:
( T T m e l t ) = ( h h s * ) c s                           h < h s * 0                                       h s h h l * ( h h s * ) c 1                             h < h l *  
The finite volume method (FVM) is used for numerical simulation of phase change heat transfer, with the simulation calculations performed using FLUENT 2022R1 software.
The energy conservation equation can be expressed as:
ρ c ρ T t = · ( k T ) + Q
After discretization, the discrete equation for the control volume is obtained:
ρ c ρ T n + 1 T n t V = f a c e s k T · A + Q V
where V is the control volume and A is the surface area vector of the control volume.
Additionally, the specific configurations of the model in this study are as follows:
(1)
The two-dimensional computational domain employs a semi-structured quadrilateral mesh with local refinement near the near-wall region of the heat exchange tube. Through grid independence verification using three mesh sets of 2 mm, 1.0 mm, and 0.5 mm, a 1.0 mm mesh with a total of 127,642 elements and 139,848 nodes was ultimately selected to balance computational accuracy and efficiency.
(2)
Transient calculations adopt a fixed global time step of 10 s, with a maximum of 20 iterations per time step.
(3)
Numerical solutions are obtained using a pressure-based first-order implicit transient solver, with the pressure-velocity coupling handled by the SIMPLE algorithm.
(4)
The simulation employs equation residuals as the primary convergence criterion, with convergence residual thresholds set to 1 × 10⁻³ for the continuity, momentum, and turbulence equations, and a stringent threshold of 1 × 10⁻⁶ for the energy equation.
(5)
The phase change process is solved using the built-in solidification/melting model in the software, with the mushy zone constant set to 1 × 10⁴ to match the near-isothermal phase change characteristics of the paraffin-based PCM.
(6)
A mesh independence study was conducted using three grid systems with maximum sizes of 1.5 mm, 1.0 mm, and 0.5 mm. The relative deviation in melting time between the 1.0 mm and 0.5 mm grids was less than 1.5%. Thus, the 1.0 mm grid was adopted for all simulations to balance accuracy and computation time.

2.2. Experiments of CLHS

2.2.1. Design of CLHS

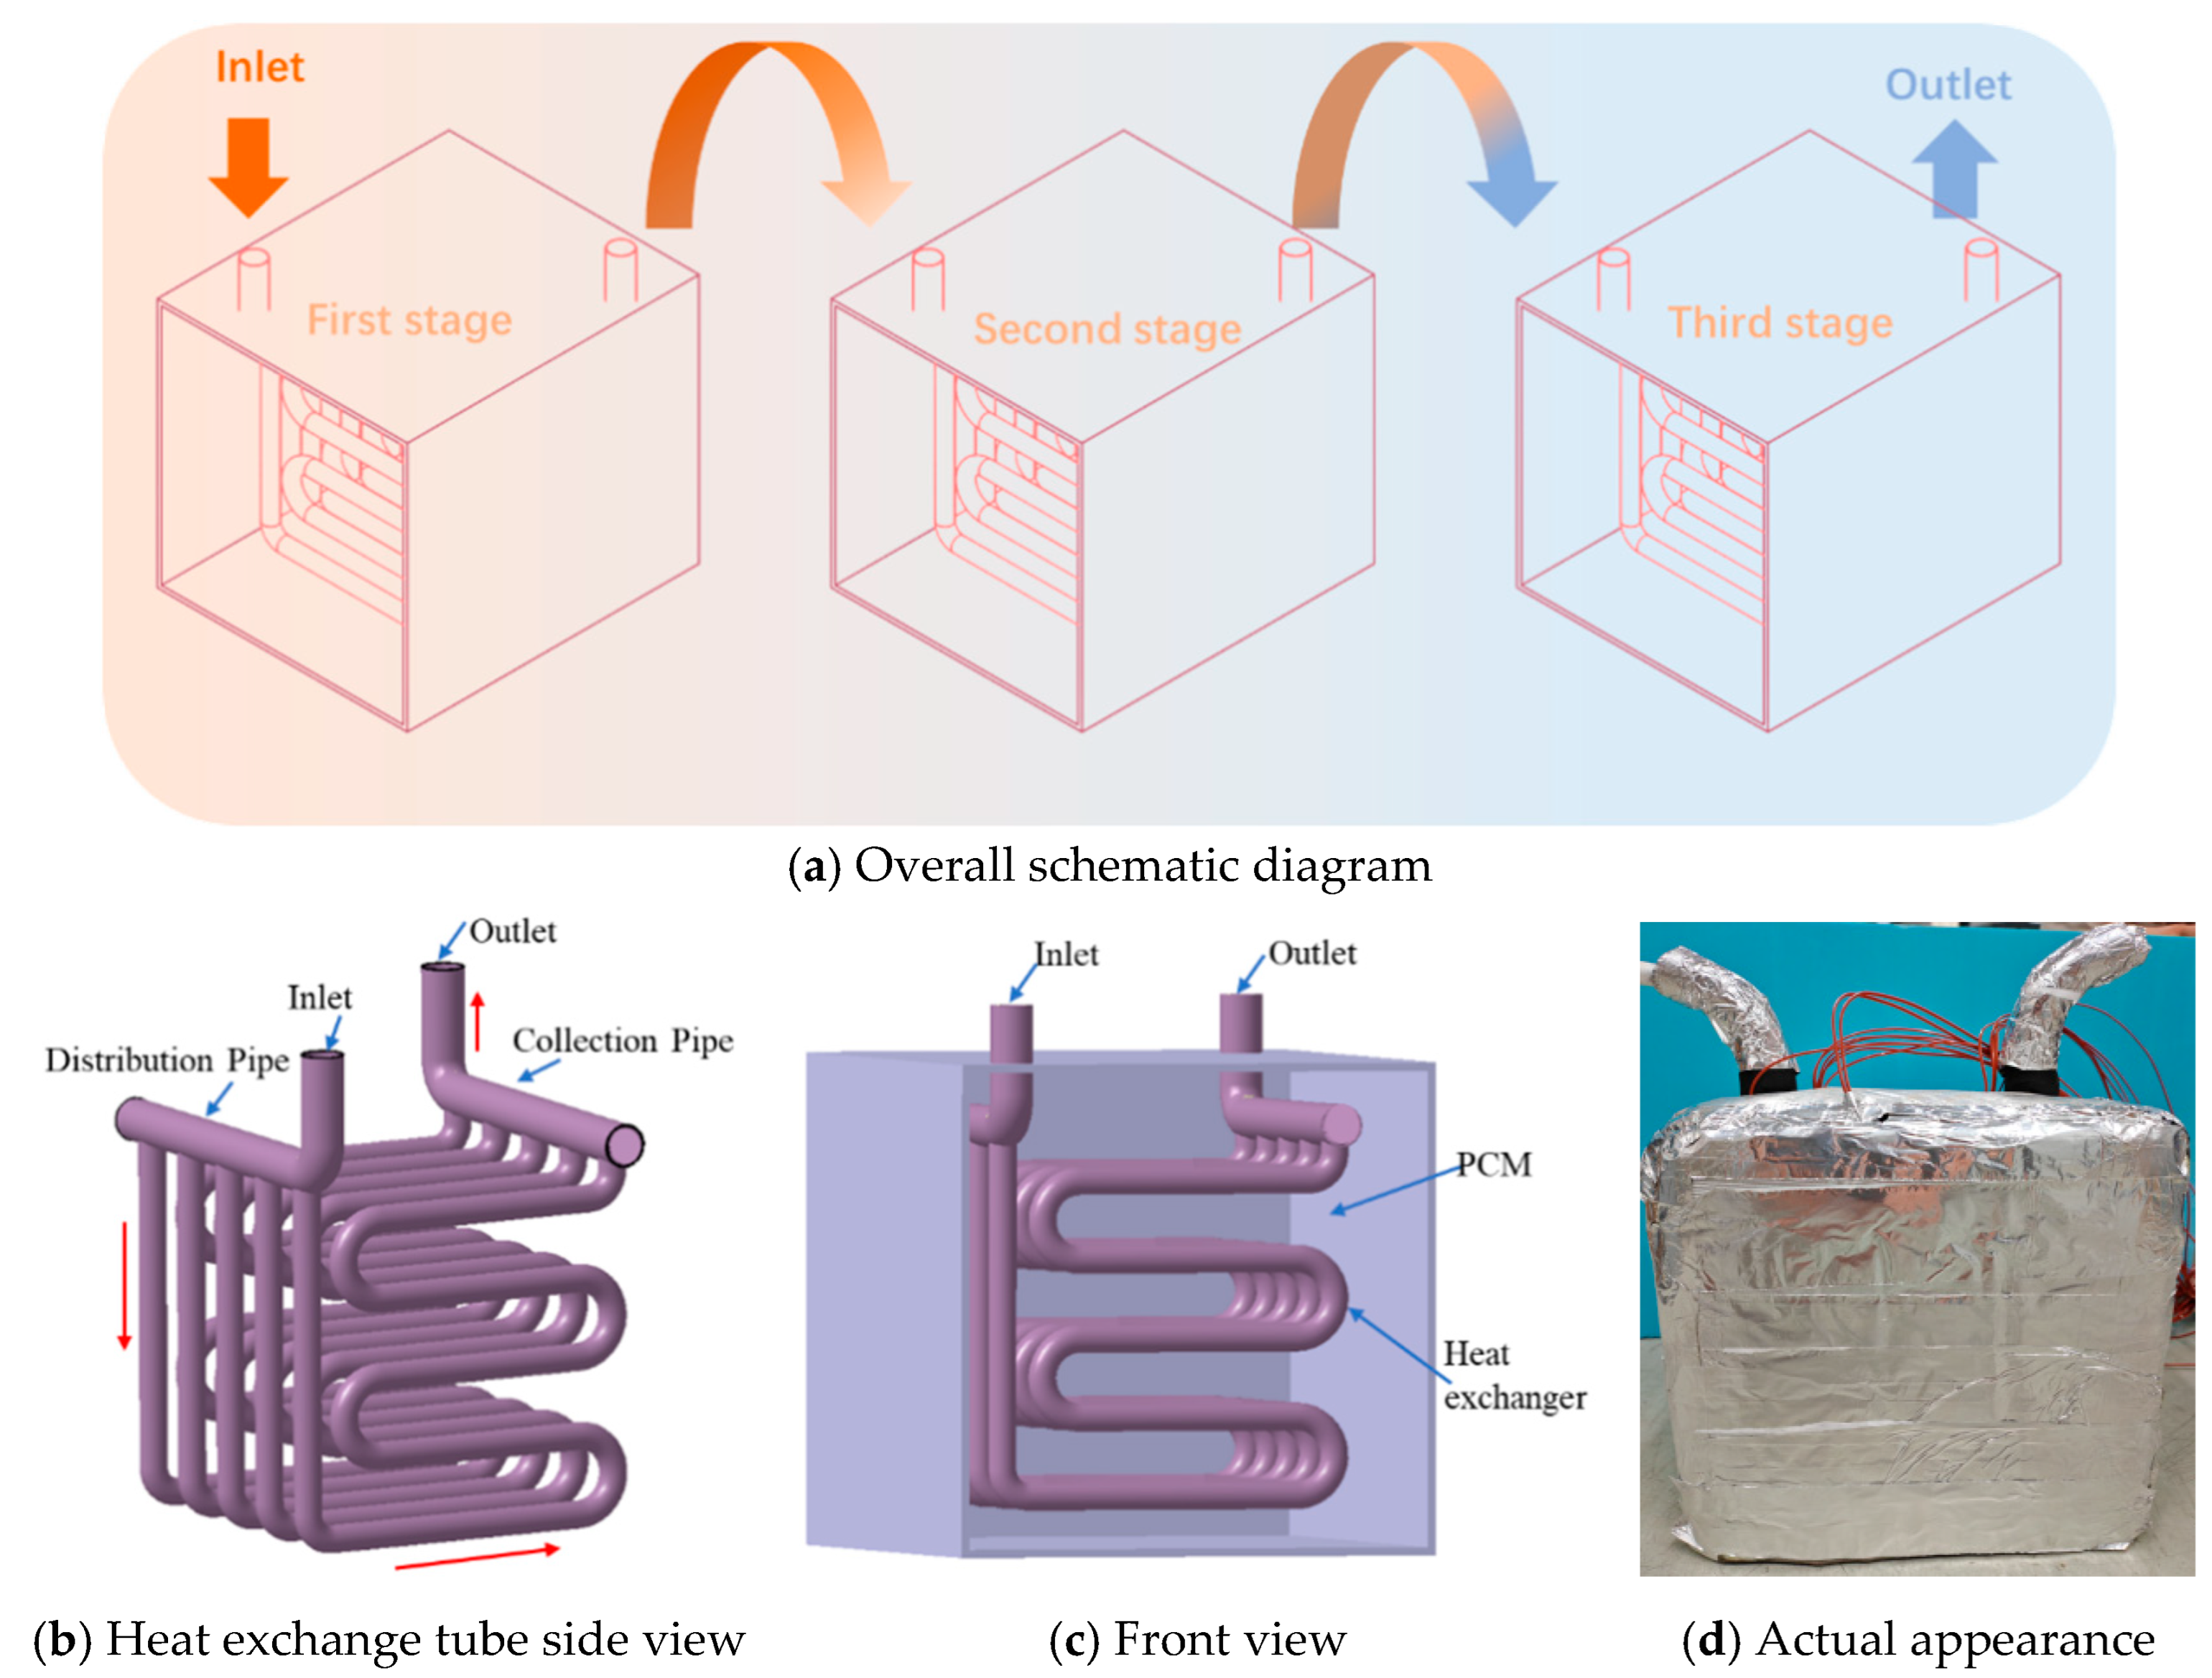
Figure 2a–d illustrate the configuration and physical prototype of the proposed three-stage latent heat storage unit. A custom copper heat exchanger with a serpentine branch-tube geometry is utilized. The parallel branch tubes, having an outer diameter of 16 mm and a wall thickness of 1 mm, are linked to header manifolds at both upper ends. Both the inflow and outflow manifolds measure 25 mm in outer diameter with a 1.3 mm wall thickness. A uniform grid spacing of 32 mm is maintained longitudinally and transversely. To prevent hydraulic imbalance, an equivalent-path flow arrangement is applied. The heat transfer fluid enters the lower header via a vertical standpipe and flows upwards through the serpentine network, maximizing thermal charging and discharging efficiencies. The phase change material is encapsulated within a cubic inner tank measuring 250 mm × 250 mm × 250 mm. All exterior boundaries are wrapped with robust rubber insulation to minimize thermal dissipation to the ambient environment.

2.2.2. Experiment Setup

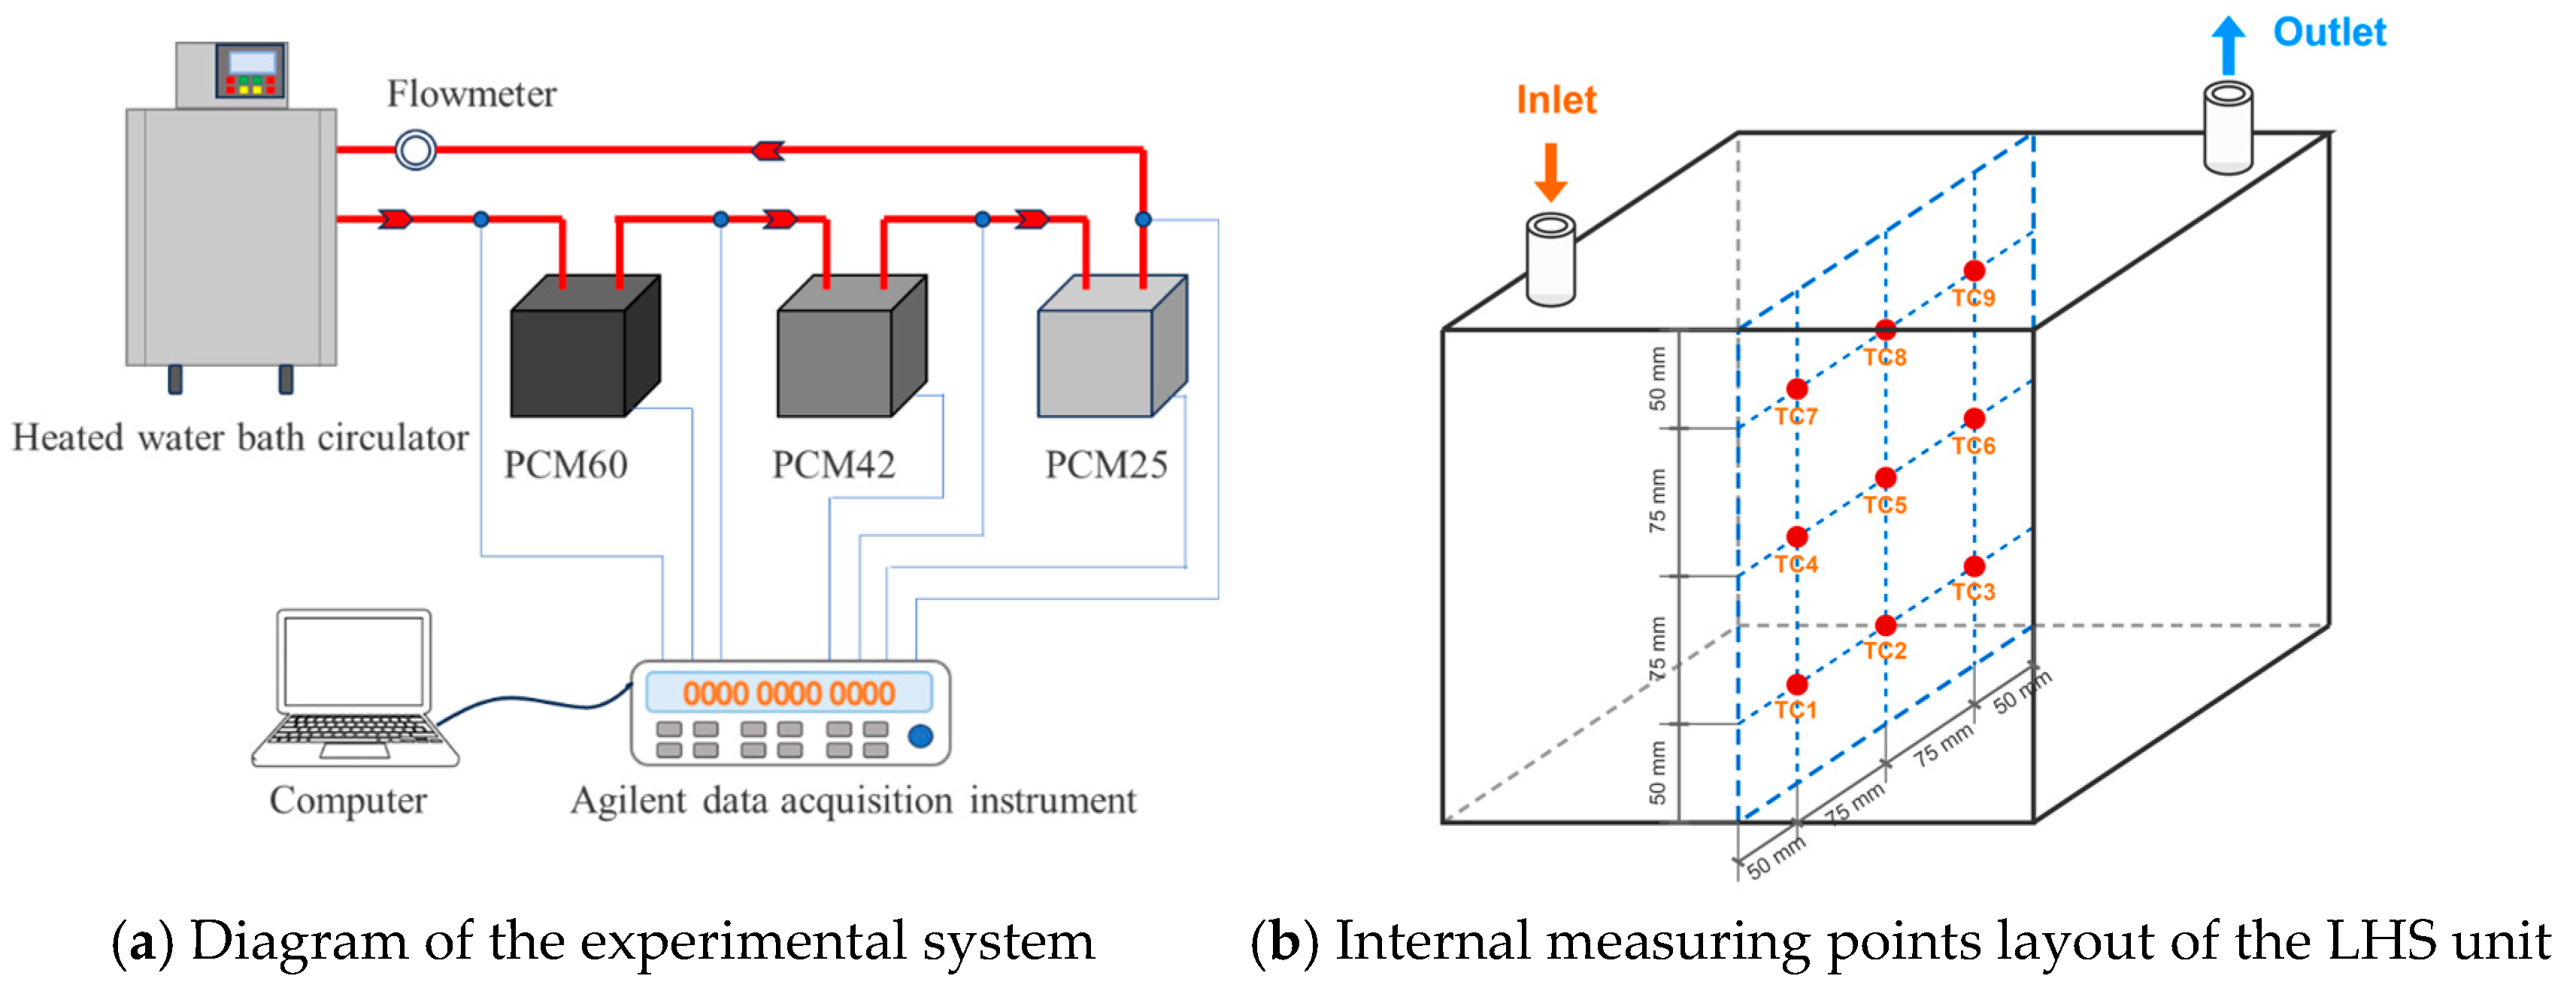
The experimental system primarily consists of the CLHS, the data acquisition and the accessories, shown in Figure 3a. The thermal storage system consists of three thermal storage boxes and a temperature-controlled water bath. The phase change temperatures of the three thermal storage devices are 25 °C, 42 °C and 60 °C respectively. The data acquisition system consists of K-type thermocouples, flow meters, Agilent data acquisition instruments, etc. These accessories include pipelines, valves, insulation, and other components. All pipelines in the system are insulated to prevent systems from being affected by the external ambient temperature. The CLHS test uses a program-controlled thermostatic bath (operating range: 0 °C to 100 °C) to provide energy for the phase change thermal storage box. Before each test, the phase change material is cooled to 15 °C. The water is heated to the set temperature in the thermostatic water bath, and is then pumped to the heat exchange copper tube of the three-stage LHS device to exchange heat. After exchanging heat, it returns to the thermostatic water bath to achieve heat storage of the phase change thermal storage device. The experiments test the effects of flow rate and temperature of water on the thermal storage effects of the thermal storage device. The specific experimental operating conditions for the CLHS performance evaluation, including the variations in water flow rates and inlet temperatures, are systematically summarized in Table 2.
As depicted in Figure 3, nine K-type thermocouples (TC 1~TC 9, arranged in a 3 × 3 grid) were installed on the vertical longitudinal mid-plane of each LHS unit. The average temperature of the unit is defined as the arithmetic mean of these nine readings. The accuracies of the flow meters and K-type thermocouples are ±1.0% and ±0.5 °C, respectively. To minimize errors, the specific inlet/outlet thermocouples were pre-calibrated in a thermostatic bath, reducing the differential temperature measurement uncertainty to ±0.1 °C. Based on the actual tests in Section 3.2, even at high flow rates with small ΔT, the maximum relative uncertainty for the heat storage capacity is determined to be <10.0% using the standard error propagation method. The experimental test data includes: the inlet and outlet water temperature and flow rate of the heat storage tank, as well as the PCM average temperature in the LHS unit. All data are collected by Agilent data loggers with a collection time interval of 5 s. The heat storage capacity of the heat storage tank is calculated from these data, and the calculation formula is as follows:
Q H S = m w × c w × T w 1 T w 2 3600 × t 1000
where QHS is the heat storage capacity of the heat storage device, MJ; mw is the flow rate of circulating water, kg/h; cw is the specific heat capacity of circulating water, 4.2 kJ/(kg·K); Tw1 is the inlet water temperature of the heat storage device, °C; Tw2 is the outlet water temperature of the heat storage device, °C; and Δt is the recording time interval, h.
The variance analysis method [33] is used to analyze the differences between multiple groups of data. The larger the difference index, the greater the difference between different groups of data. The calculation formula is as follows:
F = S S R / m 1 S S E / n m
S S R = i = 1 3 n i × y i ¯ y ¯ 2
S S E = i = 1 3 j = 1 n i y i j y i ¯ 2
where m is the number of LHS units, n is the number of collected data. n i is the number of data collected for each latent heat storage module, y i ¯ is the average temperature of each latent heat storage unit, °C, y ¯ is the average temperature data of the three latent heat storages, °C. y i j is the data collected for each latent heat storage module.
To validate the numerical model described in Section 2.1, the experimental outlet water temperature is compared with the simulated output. The validation criteria are defined by the mean absolute error (MAE) and mean absolute percentage error (MAPE). Detailed comparison results and error levels are presented in Section 3.1.

2.3. TRNSYS Simulation of Graded Heating System

2.3.1. System Description

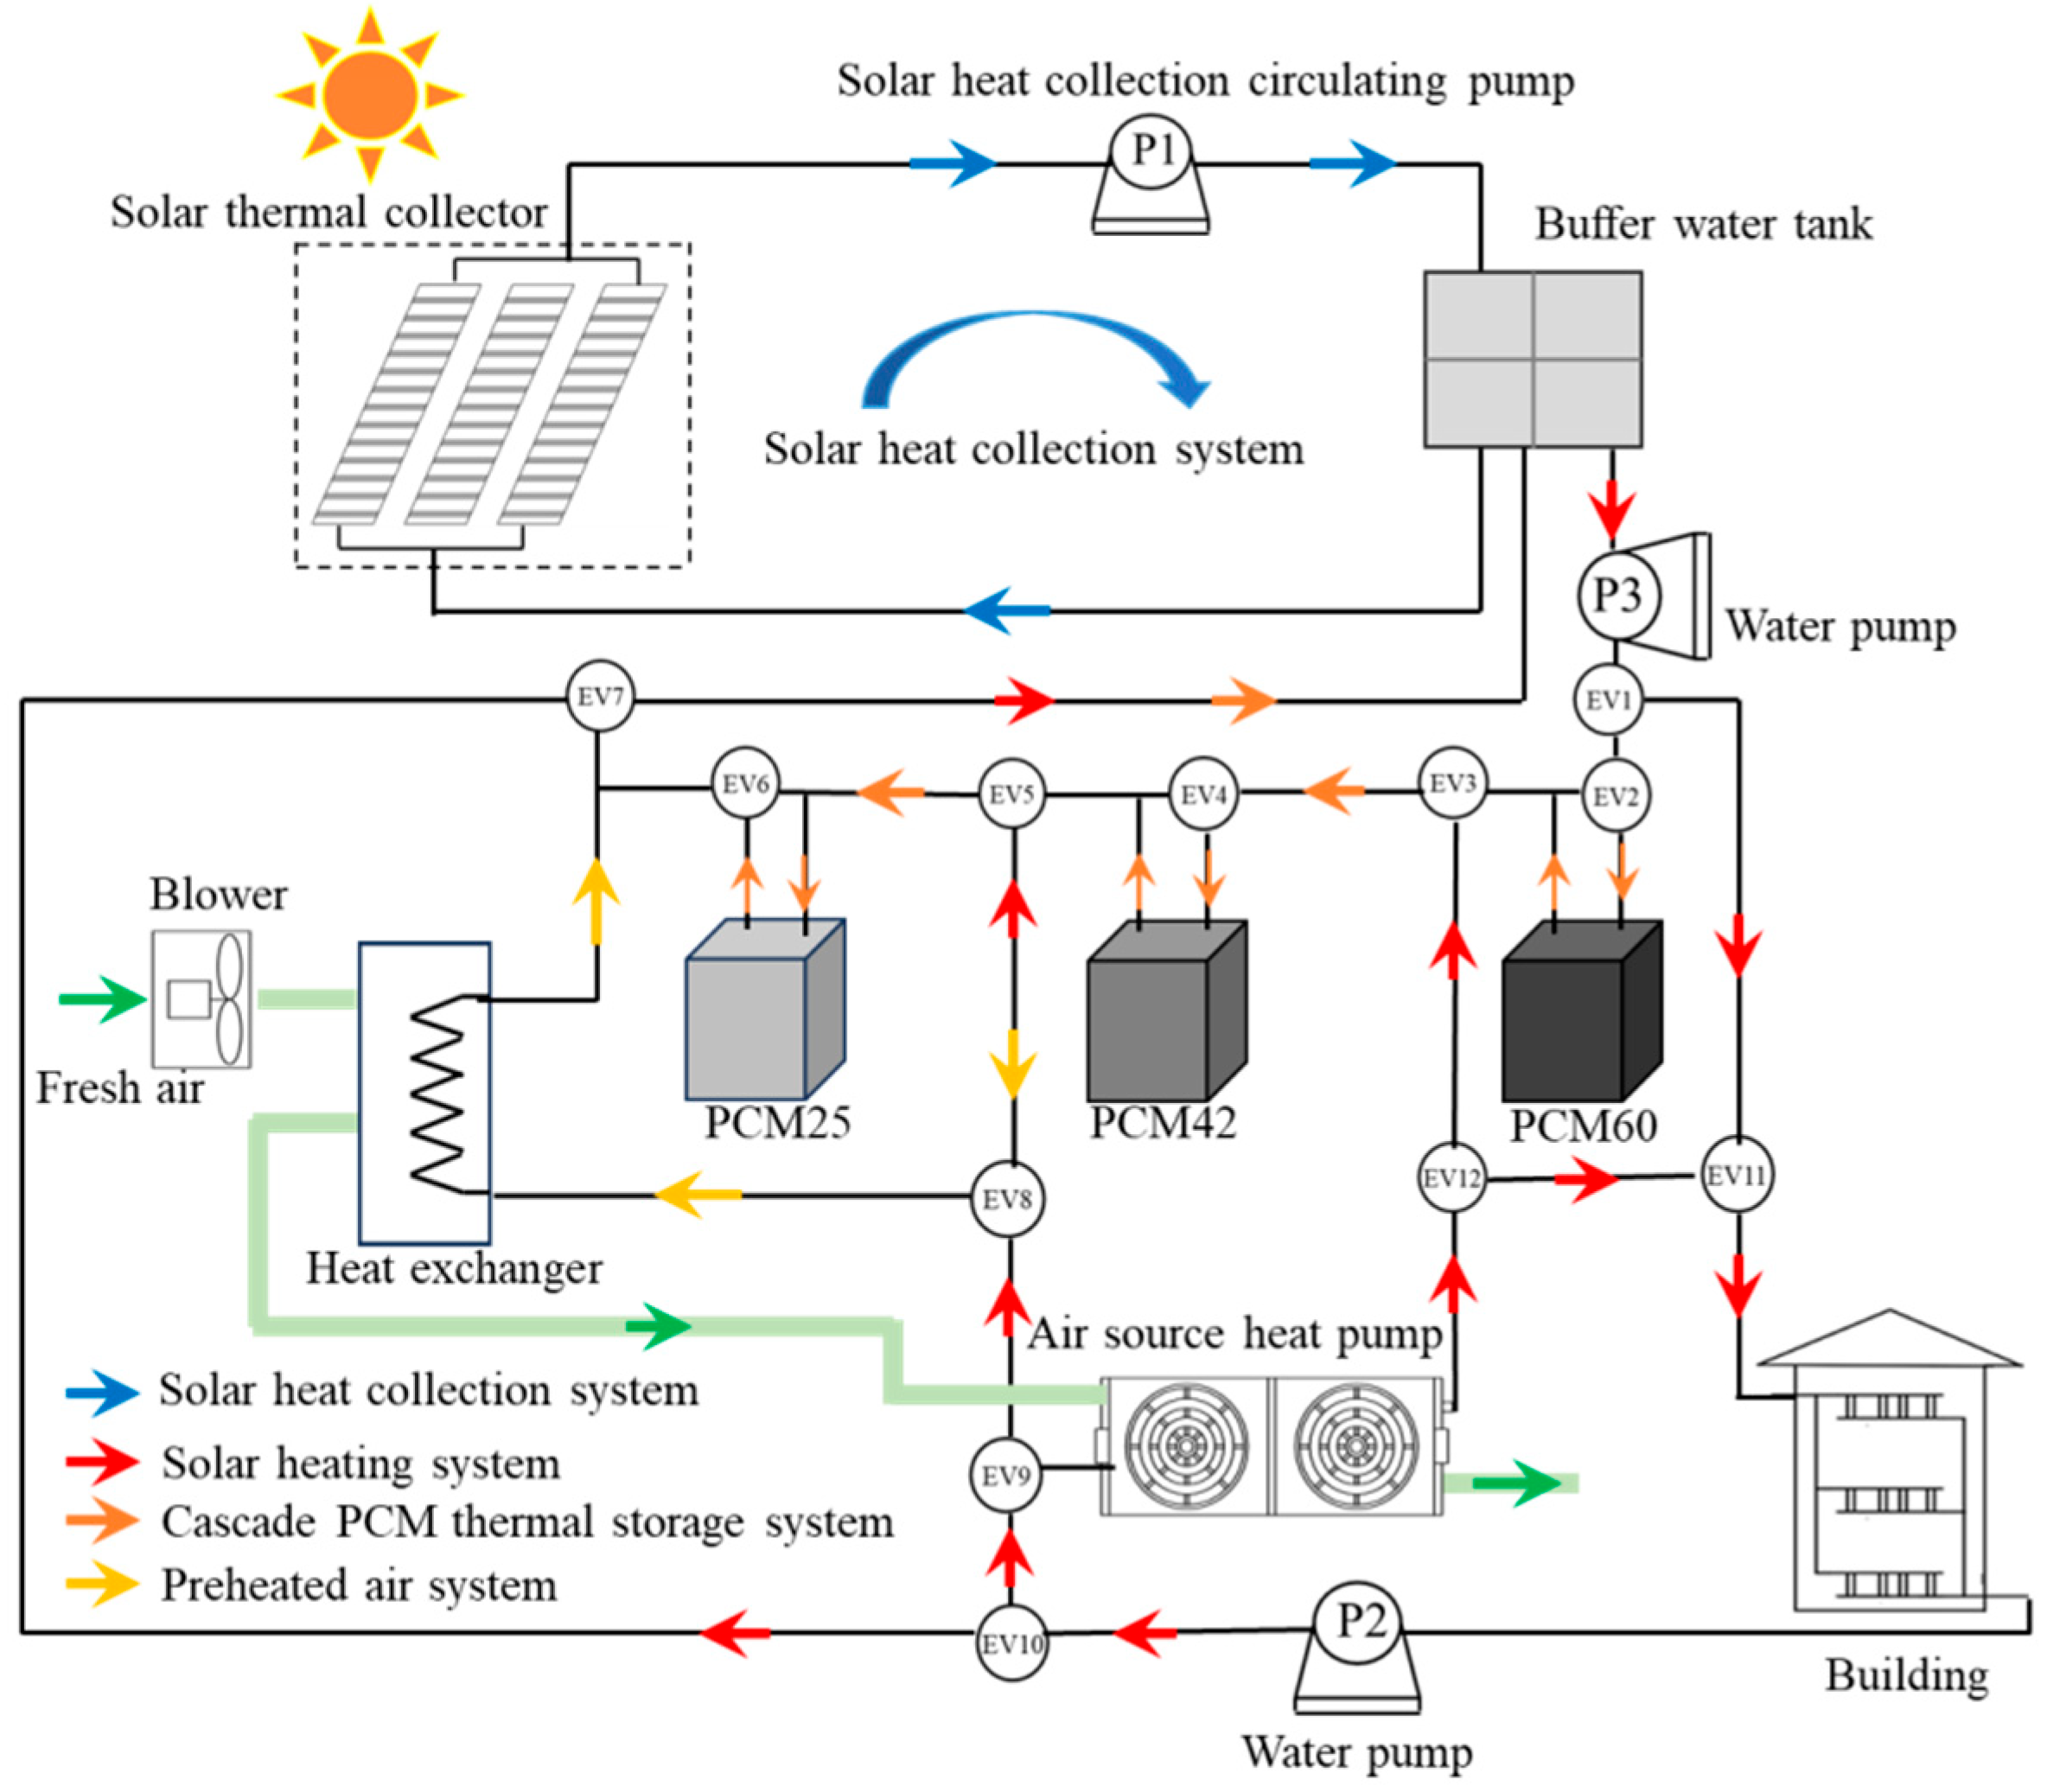
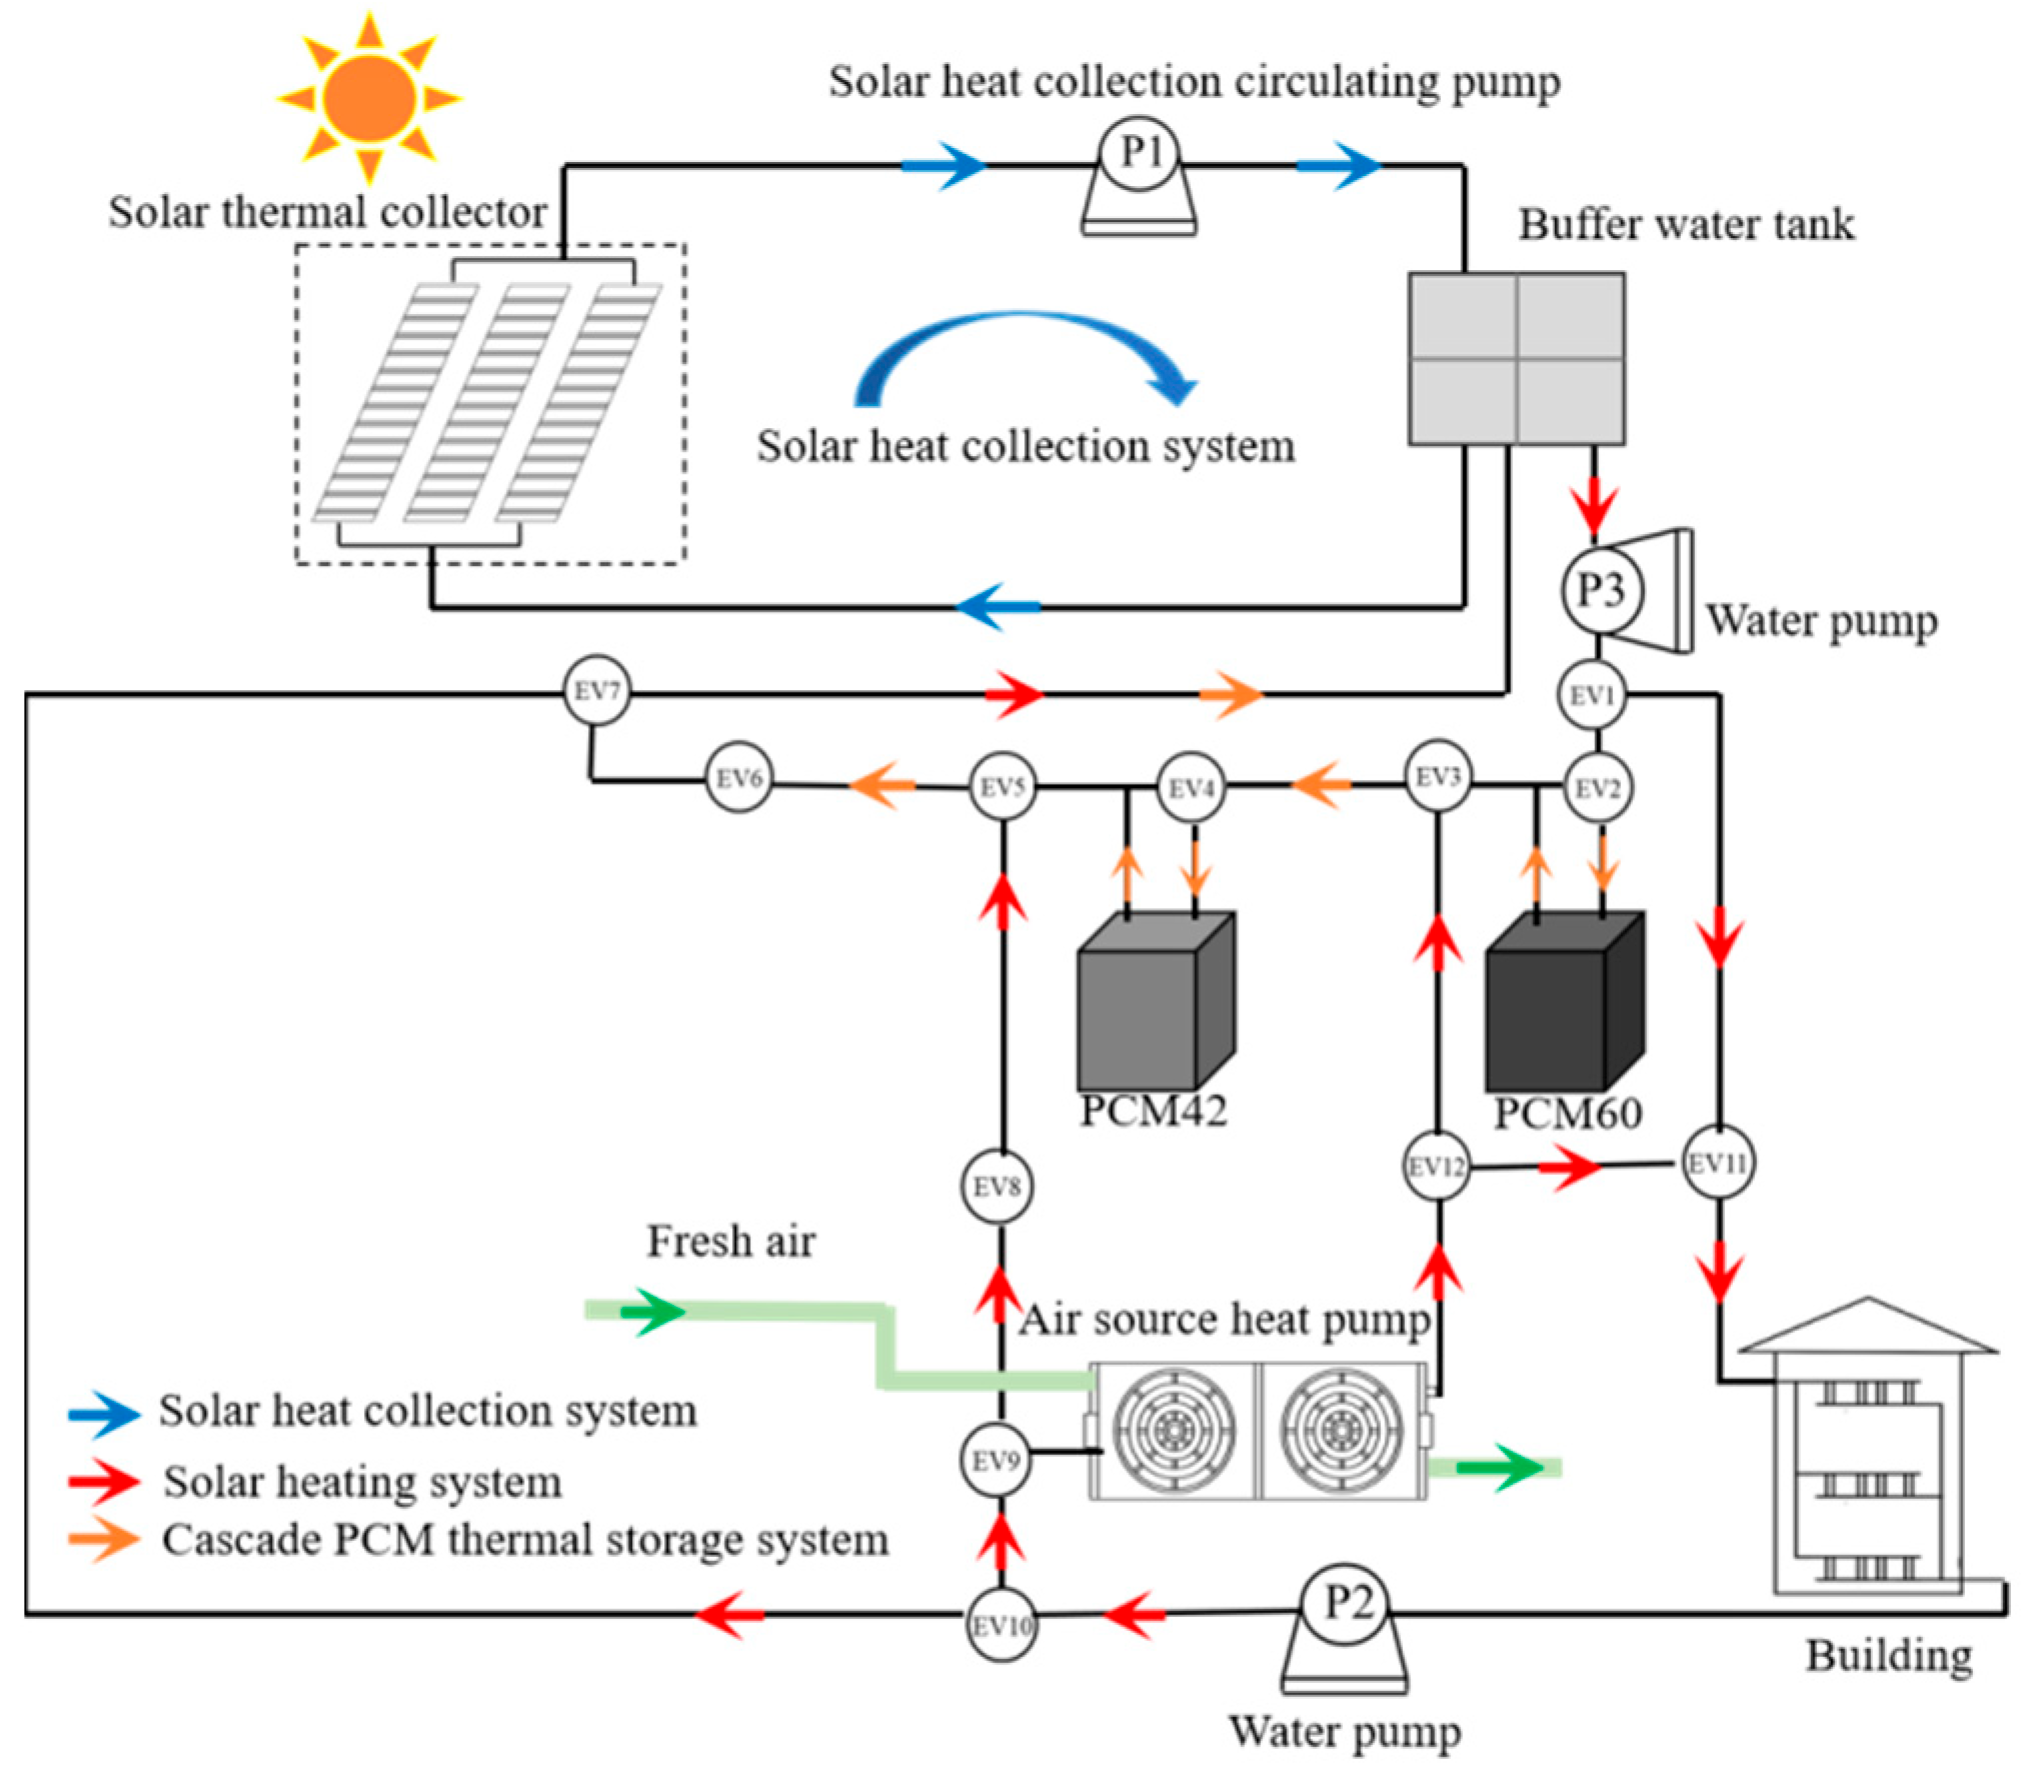
As shown in Figure 4, the concentrating solar collector and the buffer water tank constitute a solar thermal collection system, which is mainly used to store heat for the phase-change heat storage device and provide heat for the building; after the water in the buffer water tank is heated by the solar collector, it enters the high/middle/low temperature LHS unit in turn for heat storage. Following the principle of temperature-grade matching, the high-temperature and middle-temperature LHS units have sufficient energy to provide direct building heating. Since the low-grade heat in the low-temperature LHS unit cannot meet direct heating demands, it is exclusively recovered to preheat the inlet air of the ASHP. The ASHP serves as an auxiliary heat source to ensure the stable heating of the graded heating system.
Furthermore, to illustrate the systemic benefits of recovering this otherwise unusable low-grade solar heat, a conventional SAHP coupled CLHS serves as the comparison as shown in Figure 5. This system naturally omits the low-temperature recovery module and consists exclusively of high and middle-temperature LHS units for direct heating. All other components, including the solar collector array, water tank, and circulation pumps, remain unchanged.

2.3.2. Model Description

The main parameters of graded heating system model are shown in Table 3.
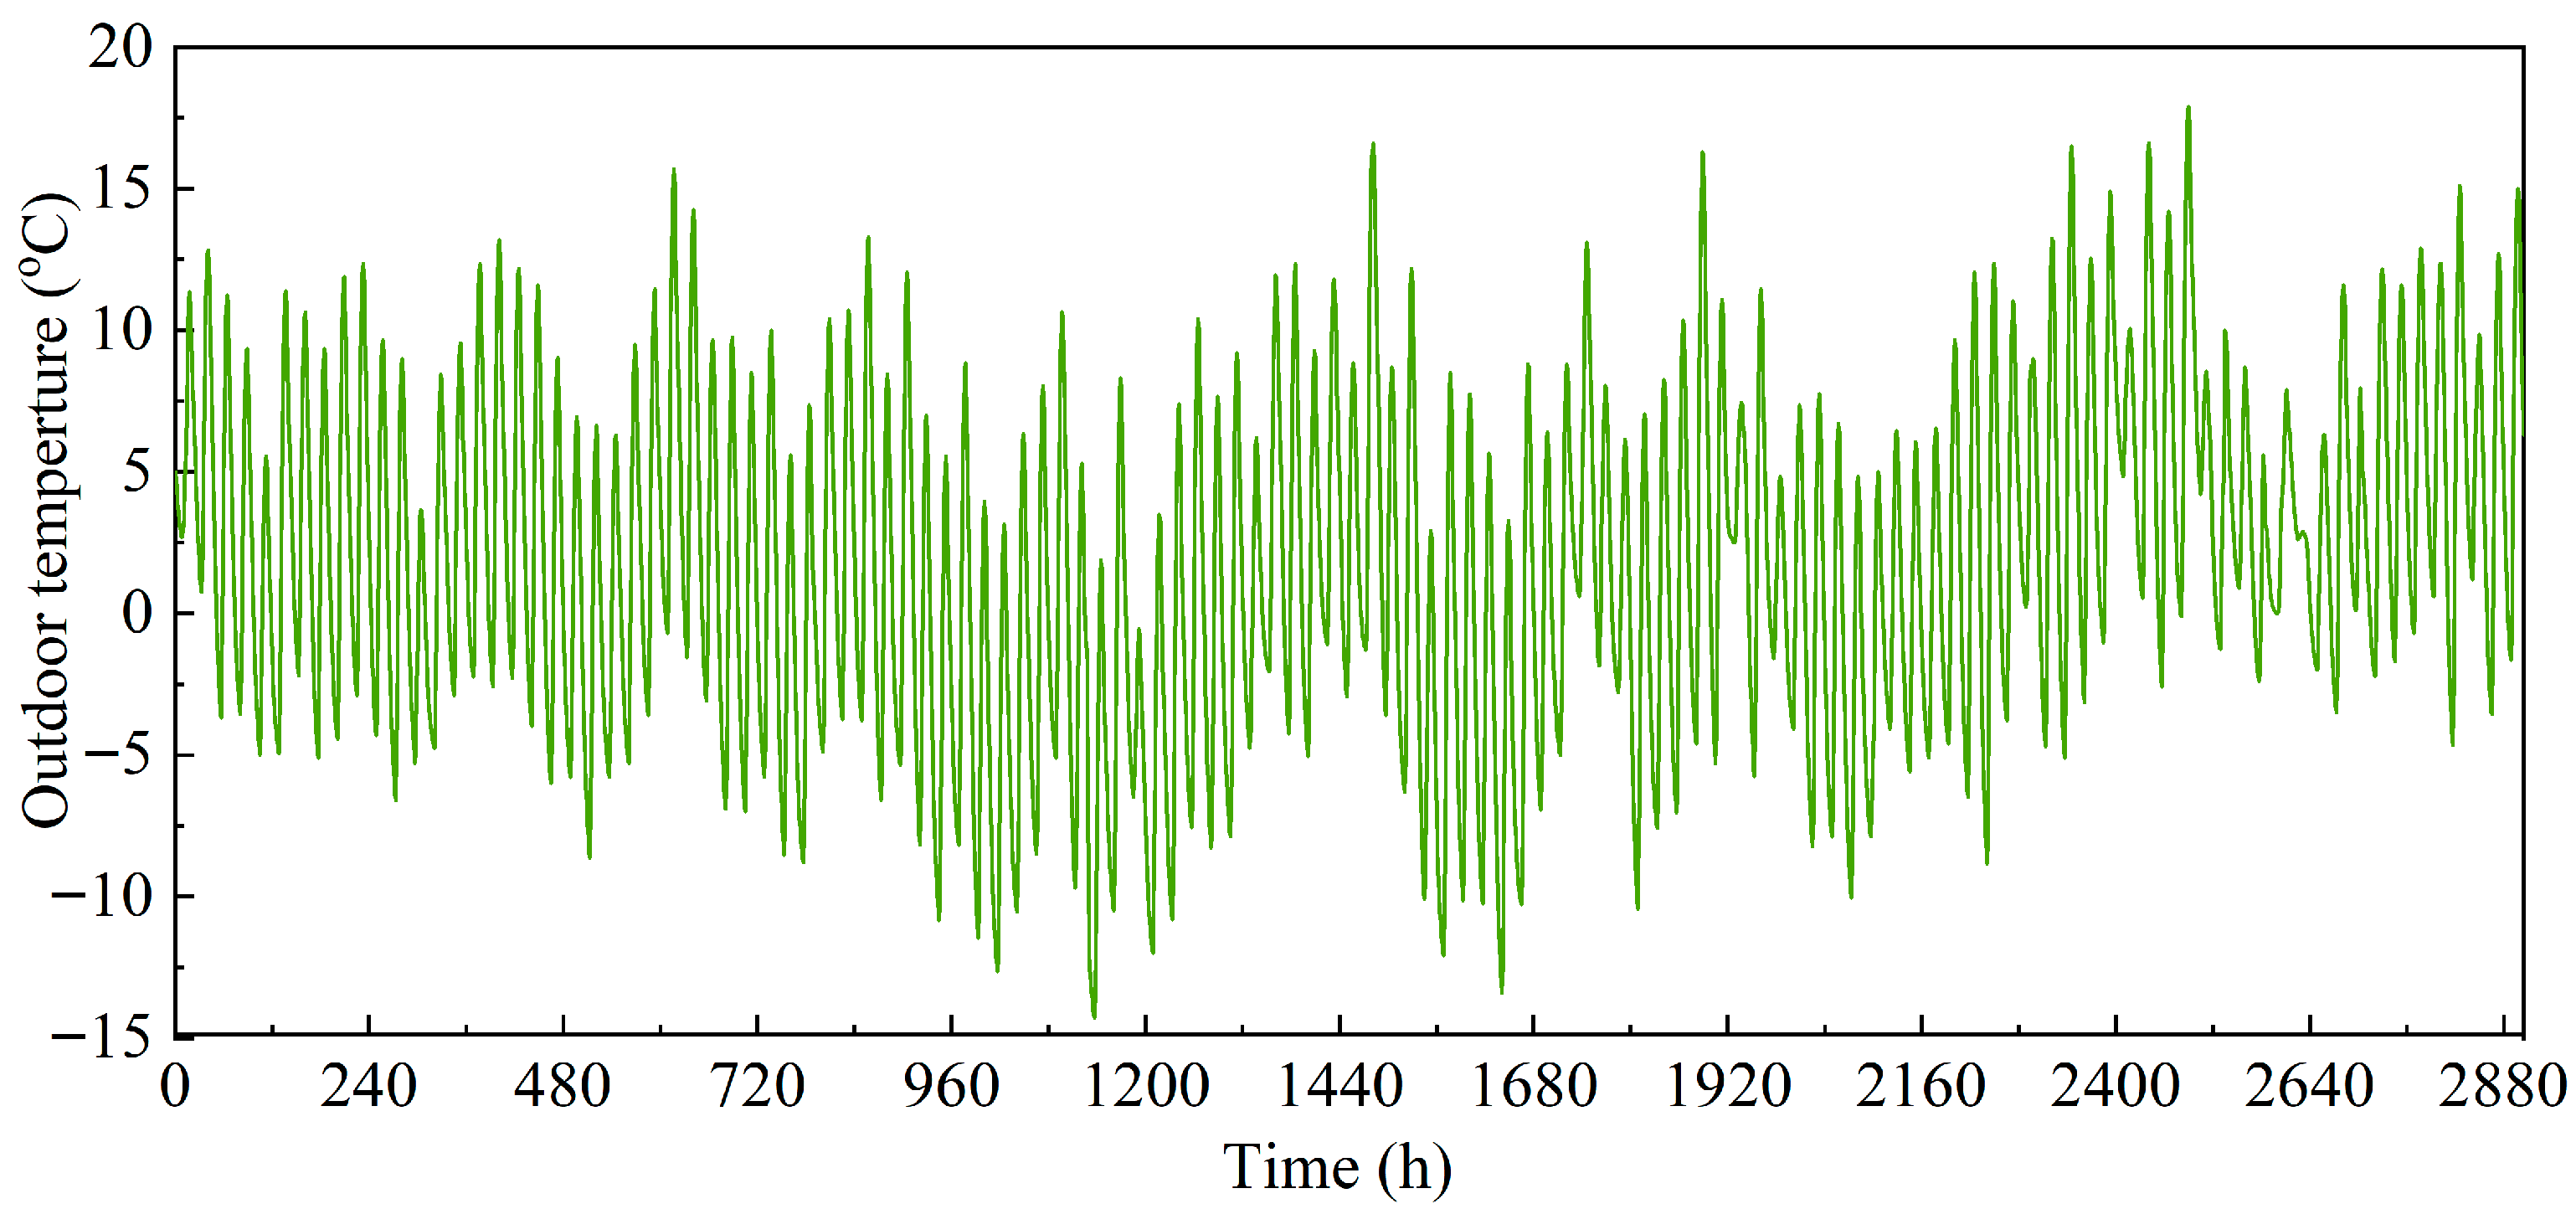
The continuous seasonal simulation utilizes the typical meteorological year data for Tianjin from the Meteonorm database. This dynamic evaluation covers the entire local heating period from November 15 to March 15. The simulation execution time step is set to 5 min. The variations in outdoor meteorological parameters during the heating period is shown in Figure 6.
The latent heat storage device is edited using FORTRAN 90 software and embedded in TRNSYS 18 simulation software. The main assumptions and energy equations of the latent heat storage device are as follows:
(1)
Assume that the phase change process is an isothermal process;
(2)
Assume that the heat transfer fluid flow mode is single-phase flow;
(3)
Assume that the heat transfer rate between the PCM and the heat transfer fluid around each heat exchange tube is the same;
(4)
Ignore the potential heat convection inside the PCM;
(5)
The liquid and solid PCM have the same specific heat capacity;
(6)
The PCM does not expand during the phase change process.
In the study of Sari et al. [34], assumptions (1), (4), (5) and (6) have been widely discussed. Since the tube diameter is short relative to the tube length, the study of Regin et al. [35] proved that assumption (2) is reasonable. The study of Tay et al. [36] suggested that assumption (1) is reasonable.
The heat transfer balance equation of the heat transfer fluid inside the latent heat storage device as follows:
2 r i × h f × π × T f x , t T w x , t = C p f × m f × T f x , t t
where ri is the radius of the heat exchange tube, m; hf is the heat transfer coefficient between the heat transfer fluid and the tube wall, W/(m·K); Tf is the temperature of the heat transfer fluid, °C; Tw is the tube wall temperature, °C; cpf is the specific heat capacity of the heat exchange fluid, kJ/(kg·K); and mf is the mass flow rate of the heat exchange fluid, kg/h.
According to the principle of energy conservation, the heat transfer process between the PCM and the heat transfer fluid is as follows:
For the melting process, when T p c m < T m t :
2 r i × h f × π × T f x , t T w x , t = ρ s × C pcm × π × r 2 π × r o 2 × T p c m x , t t
When T p c m = T m t :
2 r i × h f × π × T f x , t T w x , t = 2 π × ρ l × H × r pd x , t × r l x , t t
When T p c m > T m t :
2 r i × h f × π × T f x , t T w x , t = ρ l × C pm × π × r 2 π × r o 2 × T p c m x , t t
For the solidification process, when T p c m < T m t :
2 r i × h f × π × T f x , t T w x , t = ρ s × C pcm × π × r 2 π × r o 2 × T p c m x , t t
When T p c m = T m t :
2 r i × h f × π × T f x , t T w x , t = 2 π × ρ l × H × r pd x , t × r l x , t t
When T p c m > T m t :
2 r i × h f × π × T f x , t T w x , t = ρ l × C pcm × π × r 2 π × r o 2 × T p c m x , t t
where ρ l is the density of liquid PCM, kg/m3; ρ s is the density of solid PCM, kg/m3; C pcm is the specific heat capacity of PCM, kJ/(kg·K); r o is the outer radius of the heat exchange tube, m; r is the radius of the latent heat storage device, m; H is the latent heat value of PCM, kJ/kg; r p d is the radial melting degree of PCM, m; and T m t is the real-time phase change temperature, °C.
The boundary conditions of the latent heat storage device as follows:
T f / x = 0 = T i n p c m t
where T i n p c m is the inlet temperature of the heat transfer fluid in the latent heat storage device, °C.
The initial conditions of the latent heat storage device are as follows:
r f / t = 0 = r o ; T f / t = 0 = T p c m / t = 0 = T inital
where T inital is the initial temperature of PCM, °C.

2.3.3. Operation Strategy

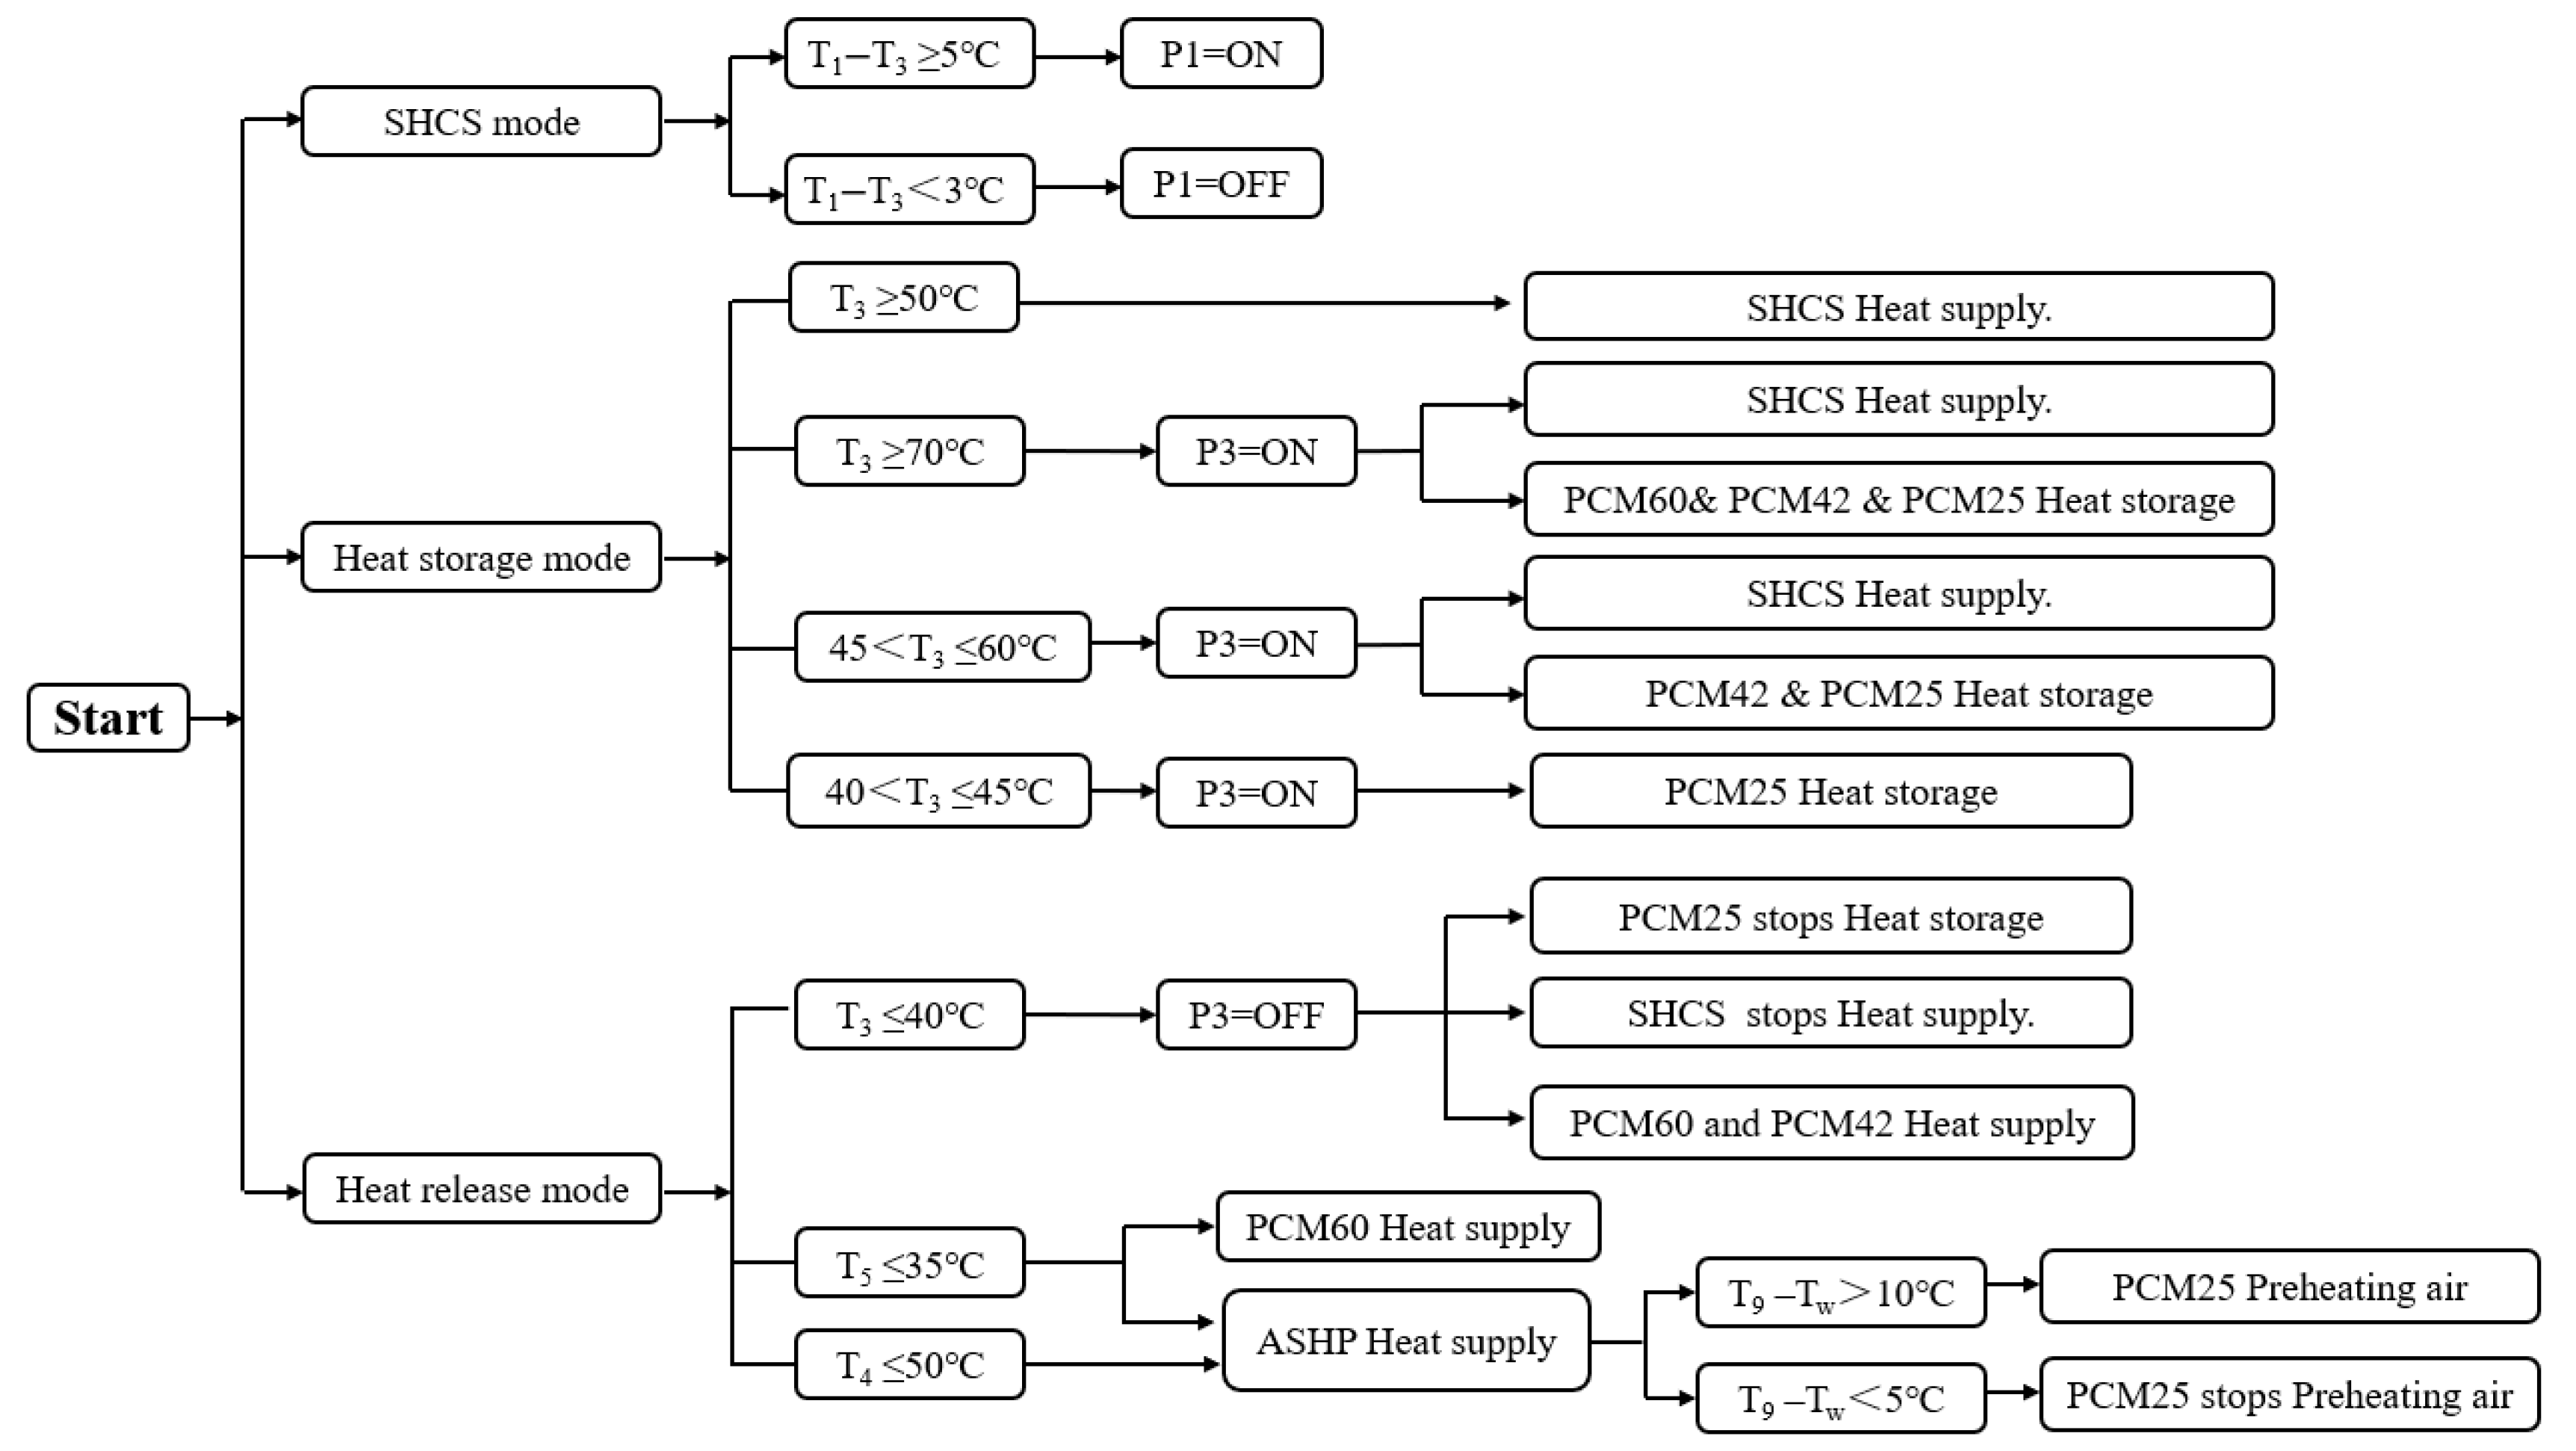
The system operation strategy is shown in Figure 7. The operation of the solar collection system depends on the difference between the collector outlet temperature and the circulating water tank temperature. The operation of the CLHS depends on the circulating water tank temperature. The operation of the heat release system depends on the circulating water tank temperature and the outlet water temperature of the single-stage LHS unit, and the operation of the ASHP inlet air preheating device depends on the difference between the PCM25 unit temperature and the ambient temperature. The system monitoring points are shown in Table 4.

2.3.4. Evaluation Metrics

(1)
Economic Evaluation
The Levelized Cost of Heat (LCOH) functions as a pivotal analytical tool for evaluating the economic viability and sustainability of thermal energy systems like the CLHS. By calculating the integrated production cost per unit of thermal energy over the system’s entire lifecycle, LCOH offers actionable insights for decision-making. Its computational framework incorporates four critical dimensions: initial capital investment, ongoing energy consumption expenditures, periodic maintenance costs, and total heat output. Operational costs, specifically, are derived from the dynamic interplay between the system’s energy consumption profile and real-time electricity pricing, as illustrated in Equation (19) [37]. The formula synthesizes fixed costs and variable costs, distributing total expenditures across the system’s lifetime heat production. This approach enables a holistic, quantified assessment of the system’s economic performance.
L C O H = C c a p + t = 1 T C o p ( 1 + 0.03 ) t + t = 1 T C m a i n ( 1 + 0.03 ) t t = 1 T Q h e a t ( 1 + 0.03 ) t
where C c a p is the initial investment of the system, CNY; t denotes a specific year within the lifespan of the device in CLHS heating system, year; C o p is the operating cost of the system, CNY; C m a i n is the maintenance cost of the device in CLHS heating system, CNY; and Q h e a t is the heat generated by CLHS system, kWh. In this study, the annual maintenance cost is assumed to be 1% of the system construction cost [38].
The capital expenditures for key system components are structured as follows: The low-temperature LHS unit is priced at 8200 CNY per metric ton (CNY/t), with the high-temperature and middle-temperature LHS units costing 8000 CNY/t and 7800 CNY/t, respectively. The solar collector system requires an investment of 1000 CNY per square meter (CNY/m2), while the air-source heat pump incurs a capital cost of 2400 CNY per kilowatt (CNY/kW). Ancillary components include the water tank at 600 CNY per cubic meter (CNY/m3) and the circulating pump at 150 CNY/kW. All values are denominated in Chinese Yuan (CNY), with units corresponding to mass (metric ton), volume (cubic meter), surface area (square meter), or power capacity (kilowatt), depending on the functional specifications of each component.
Furthermore, it should be noted that the current economic analysis assumes constant thermophysical properties of the PCMs over the 20-year system lifespan. In actual operation, continuous melting and freezing thermal cycles may induce progressive PCM degradation, such as phase separation or a gradual loss of latent heat capacity. This degradation represents a primary source of uncertainty in the long-term LCOH bounding, which necessitates further long-term experimental monitoring in practical engineering.
(2)
Environmental Evaluation
The emissions of CO2, SO2, and NOx are selected as the key indicators for environmental analysis of the CLHS system, and the pollutant emission is calculated as follows:
E p = α p × Q h e a t H c × η p o w e r × η g r i d × η h e a t × 1 A
where Ep is the emission intensity of the pollutant, kg/m2; p represents the pollutant type (CO2, SO2, or NOx); α p is the fuel-specific emission coefficient for pollutant, kg/kg, ( α c o 2 = 2.493 kg/kg, α s o 2 = 0.075 kg/kg, α N o x = 0.0375 kg/kg); Hc is the calorific value of standard coal, 29.307 MJ/kg; and   η p o w e r is the thermal power generation efficiency of the thermal power plant, 35%. η g r i d is the transmission efficiency of the power network, 92%. η h e a t is the thermoelectric conversion efficiency, 99%. A represents the building heating area, m2.

2.4. System Optimization

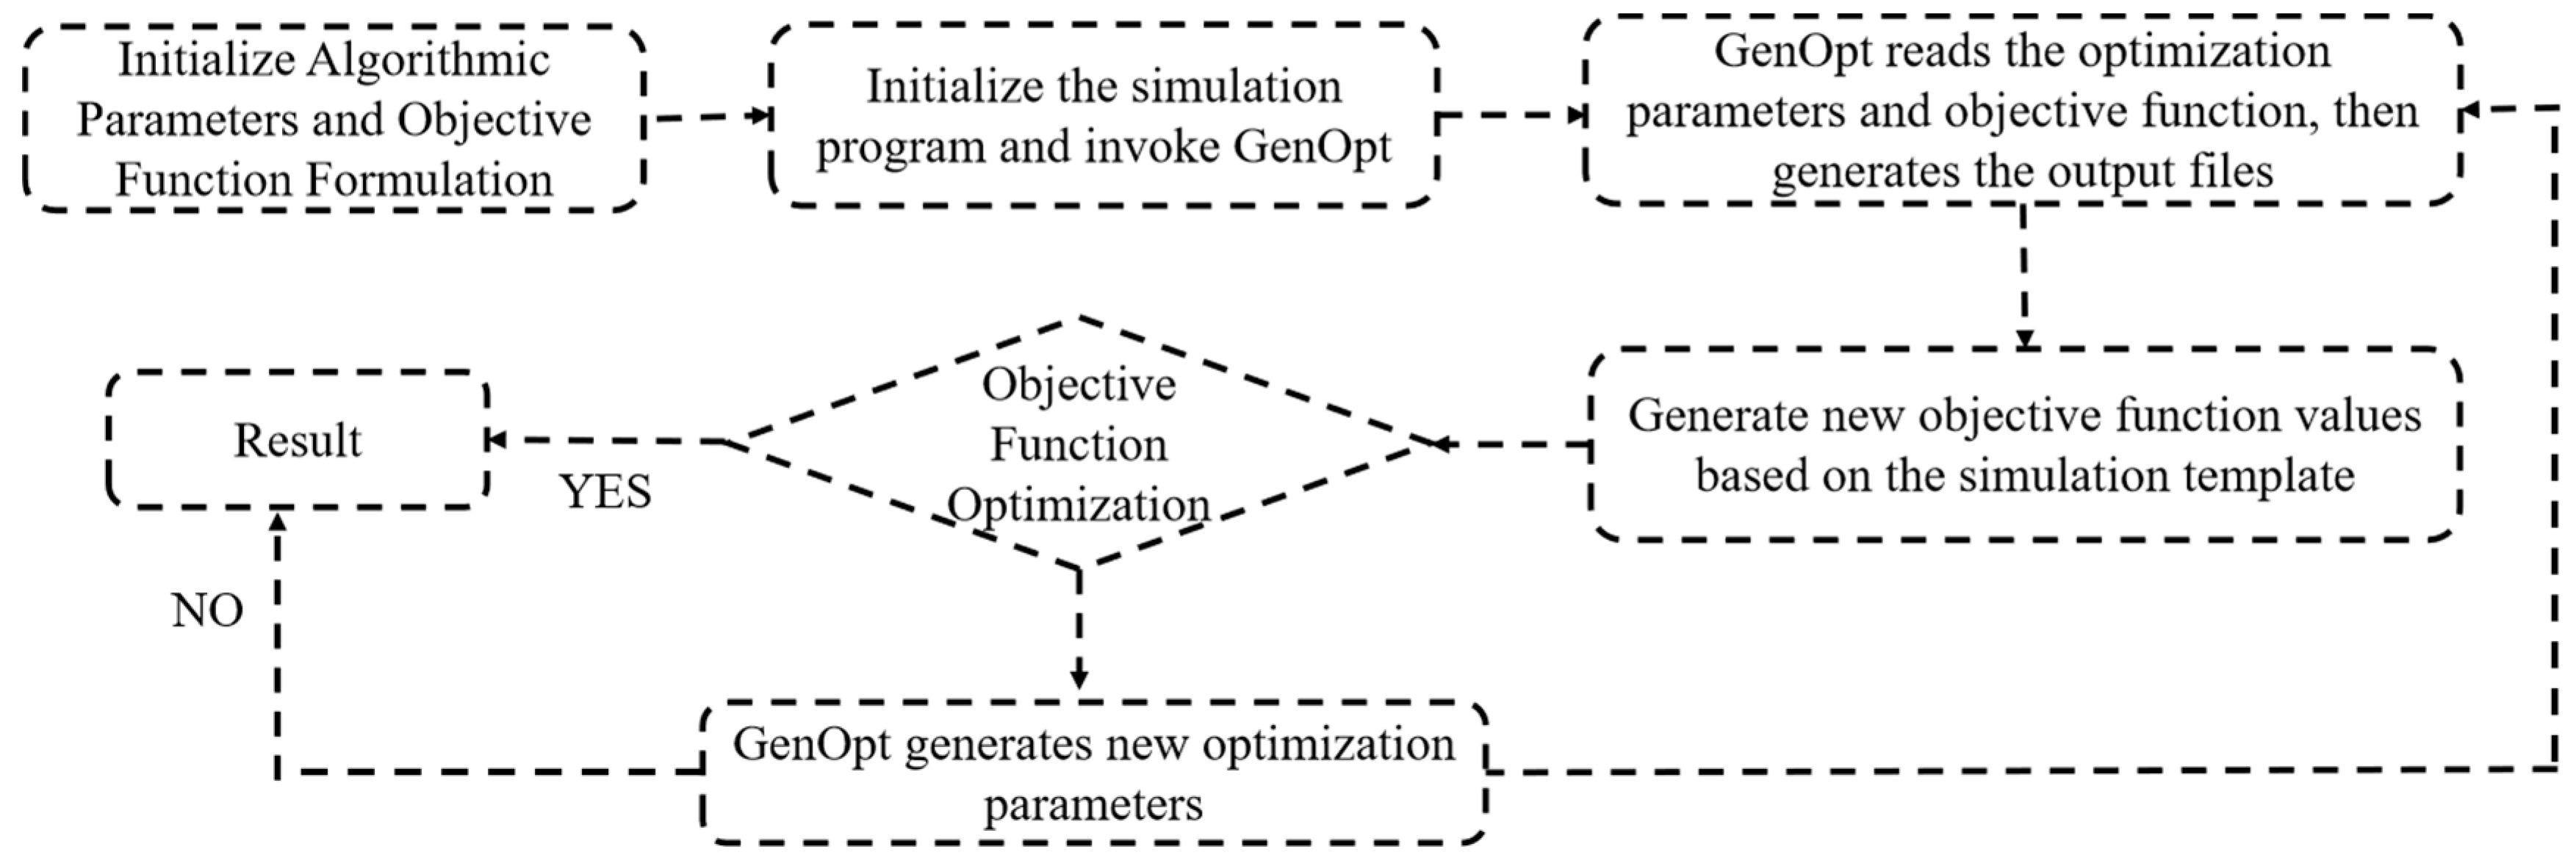
The optimization of system parameters necessitates the adoption of robust strategies to efficiently converge toward optimal solutions, given the complex interactions among system variables. In this study, the GenOpt 3.1.1 framework was employed, leveraging its capacity to integrate simulation models with heuristic algorithms. As illustrated in Figure 8, the optimization workflow critically depends on the selected algorithm. Here, the Hooke-Jeeves optimization algorithm—also termed the pattern search or step-size acceleration method—is utilized. This algorithm operates analogously to locating the minimum point on a multidimensional surface, effectively solving for the extremum of an objective function.
The optimization objective is to minimize the Equivalent Annual Cost (EAC), a metric that consolidates lifecycle expenditures into annualized terms, with key variables subjected to optimization including the solar energy system heat collection area (m2), the heating capacity of the air-source heat pump (kW), and the thermal storage capacities of three LHS units.
To ensure indoor thermal comfort with a minimum temperature threshold of 20 °C, a penalty mechanism is incorporated into the heating system’s optimization framework. Specifically, a financial penalty of 2000 CNY per hour is imposed when the room temperature falls below 20 °C, which is integrated into the annual cost function (Equation (21)) [37] to explicitly quantify its economic impact. Given the substantial weight of this penalty, the optimization algorithm prioritizes parameter configurations that maintain temperatures above the critical threshold, thereby aligning system performance with both energy efficiency and occupant comfort requirements.
E A C = i × ( i + 1 ) n ( i + 1 ) n 1 × C c a p + C o p + C m a i n
where EAC represents the CLHS system annual cost, CNY/year; i represents the discount rate, i = 3%; and n represents the lifespan, 20 years.

3. Results and Discussion

3.1. Comparison of CLHS and SLHS

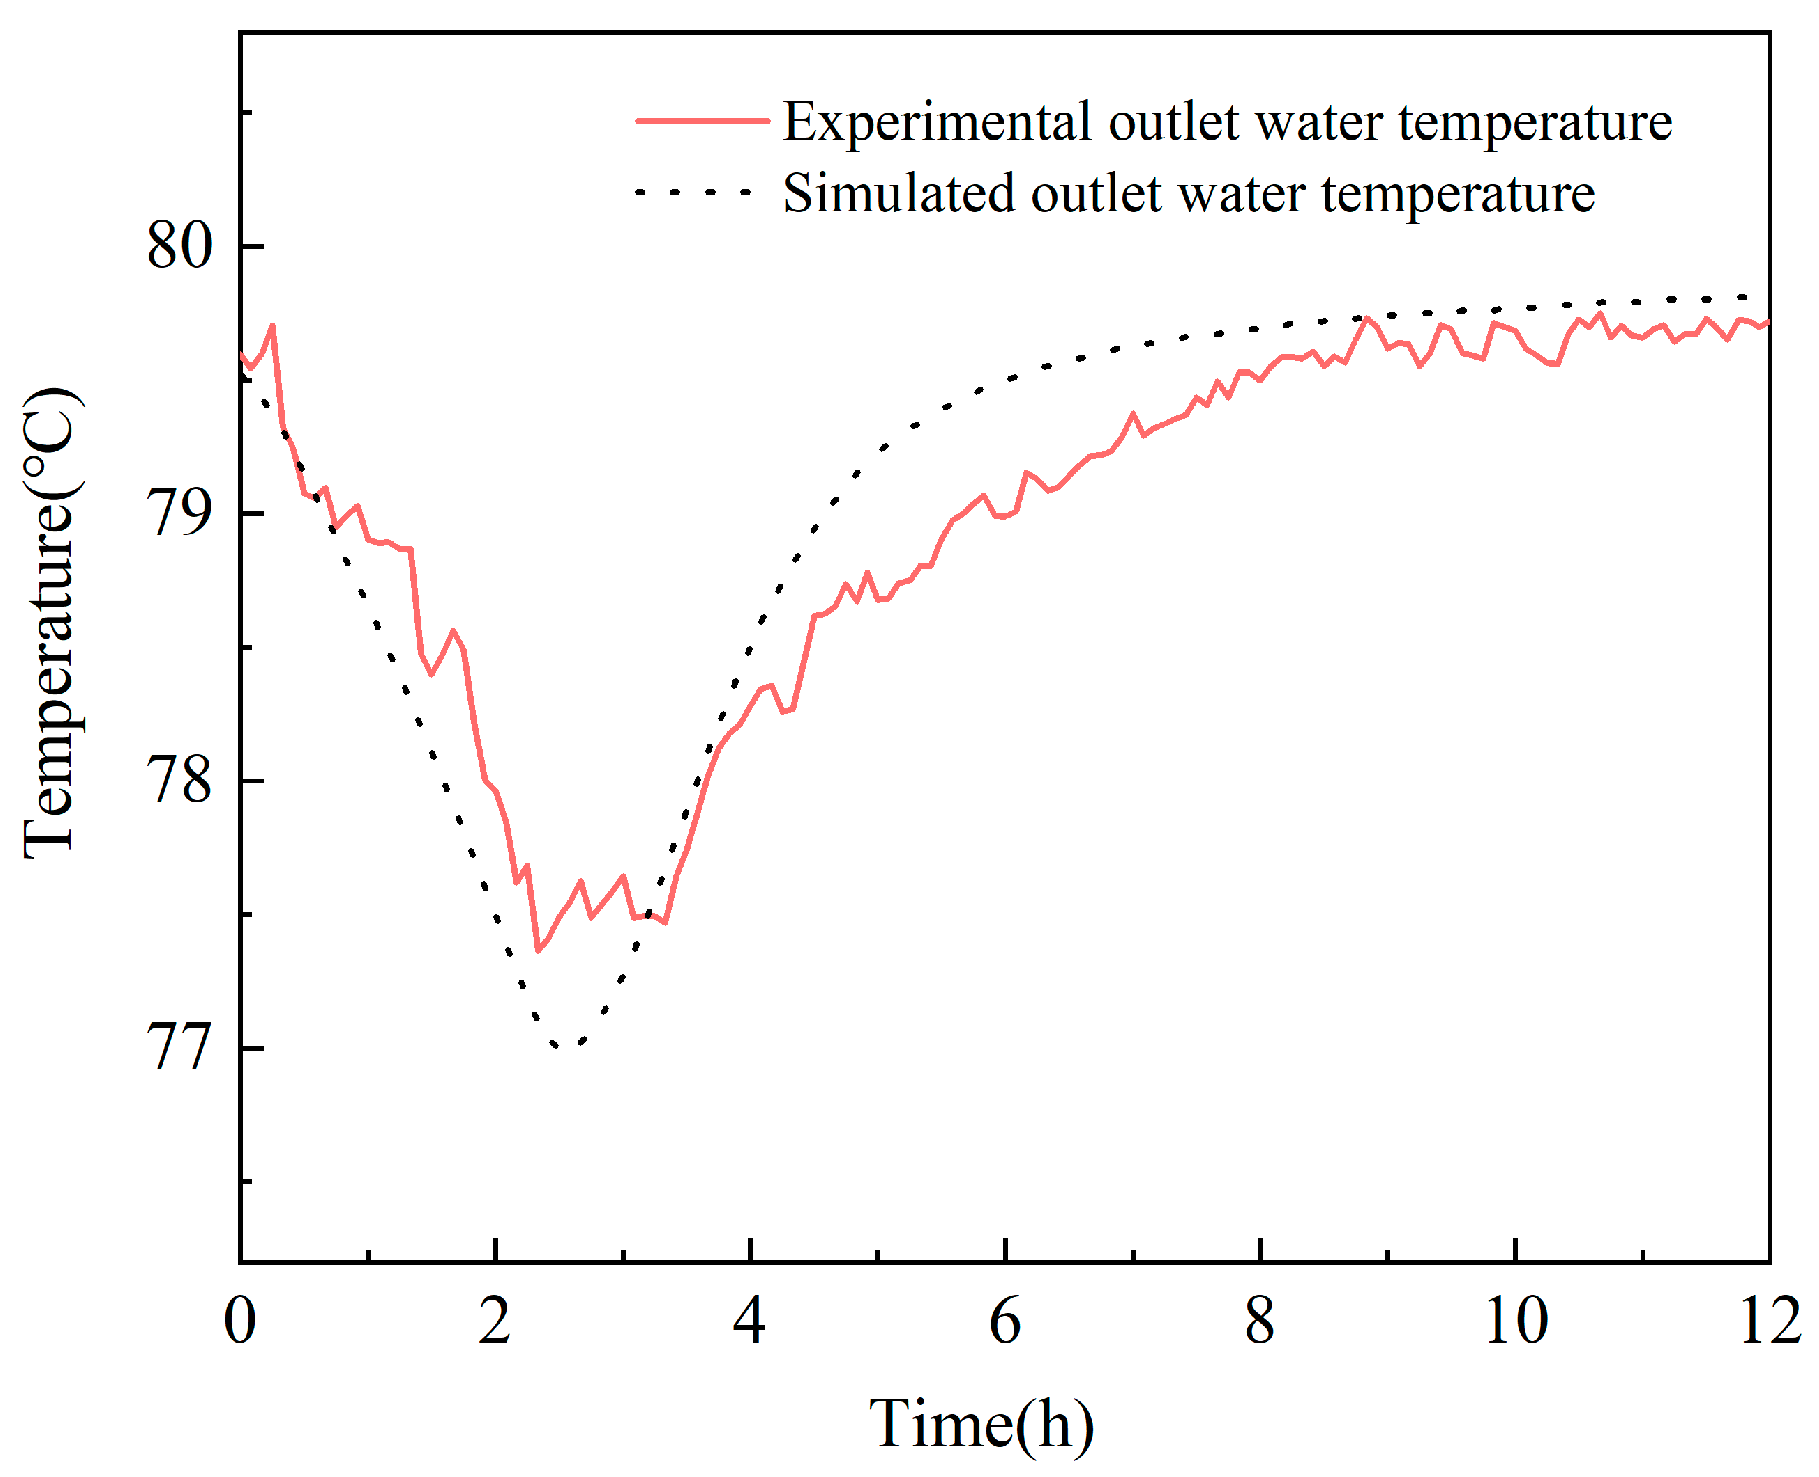
A preliminary experiment was conducted on a single PCM60 unit using the geometric dimensions described in Section 2.2. Under an inlet water temperature of 80 °C, the experimental outlet water temperature was compared with the simulated outlet water temperature to validate the numerical model. The validation data are the same inlet/outlet temperature data used in Section 3.2.2. The model shows good agreement with the experimental results, with a MAE [39] of 0.26 °C and a MAPE [39] of 0.33%. The comparison is shown in Figure 9.
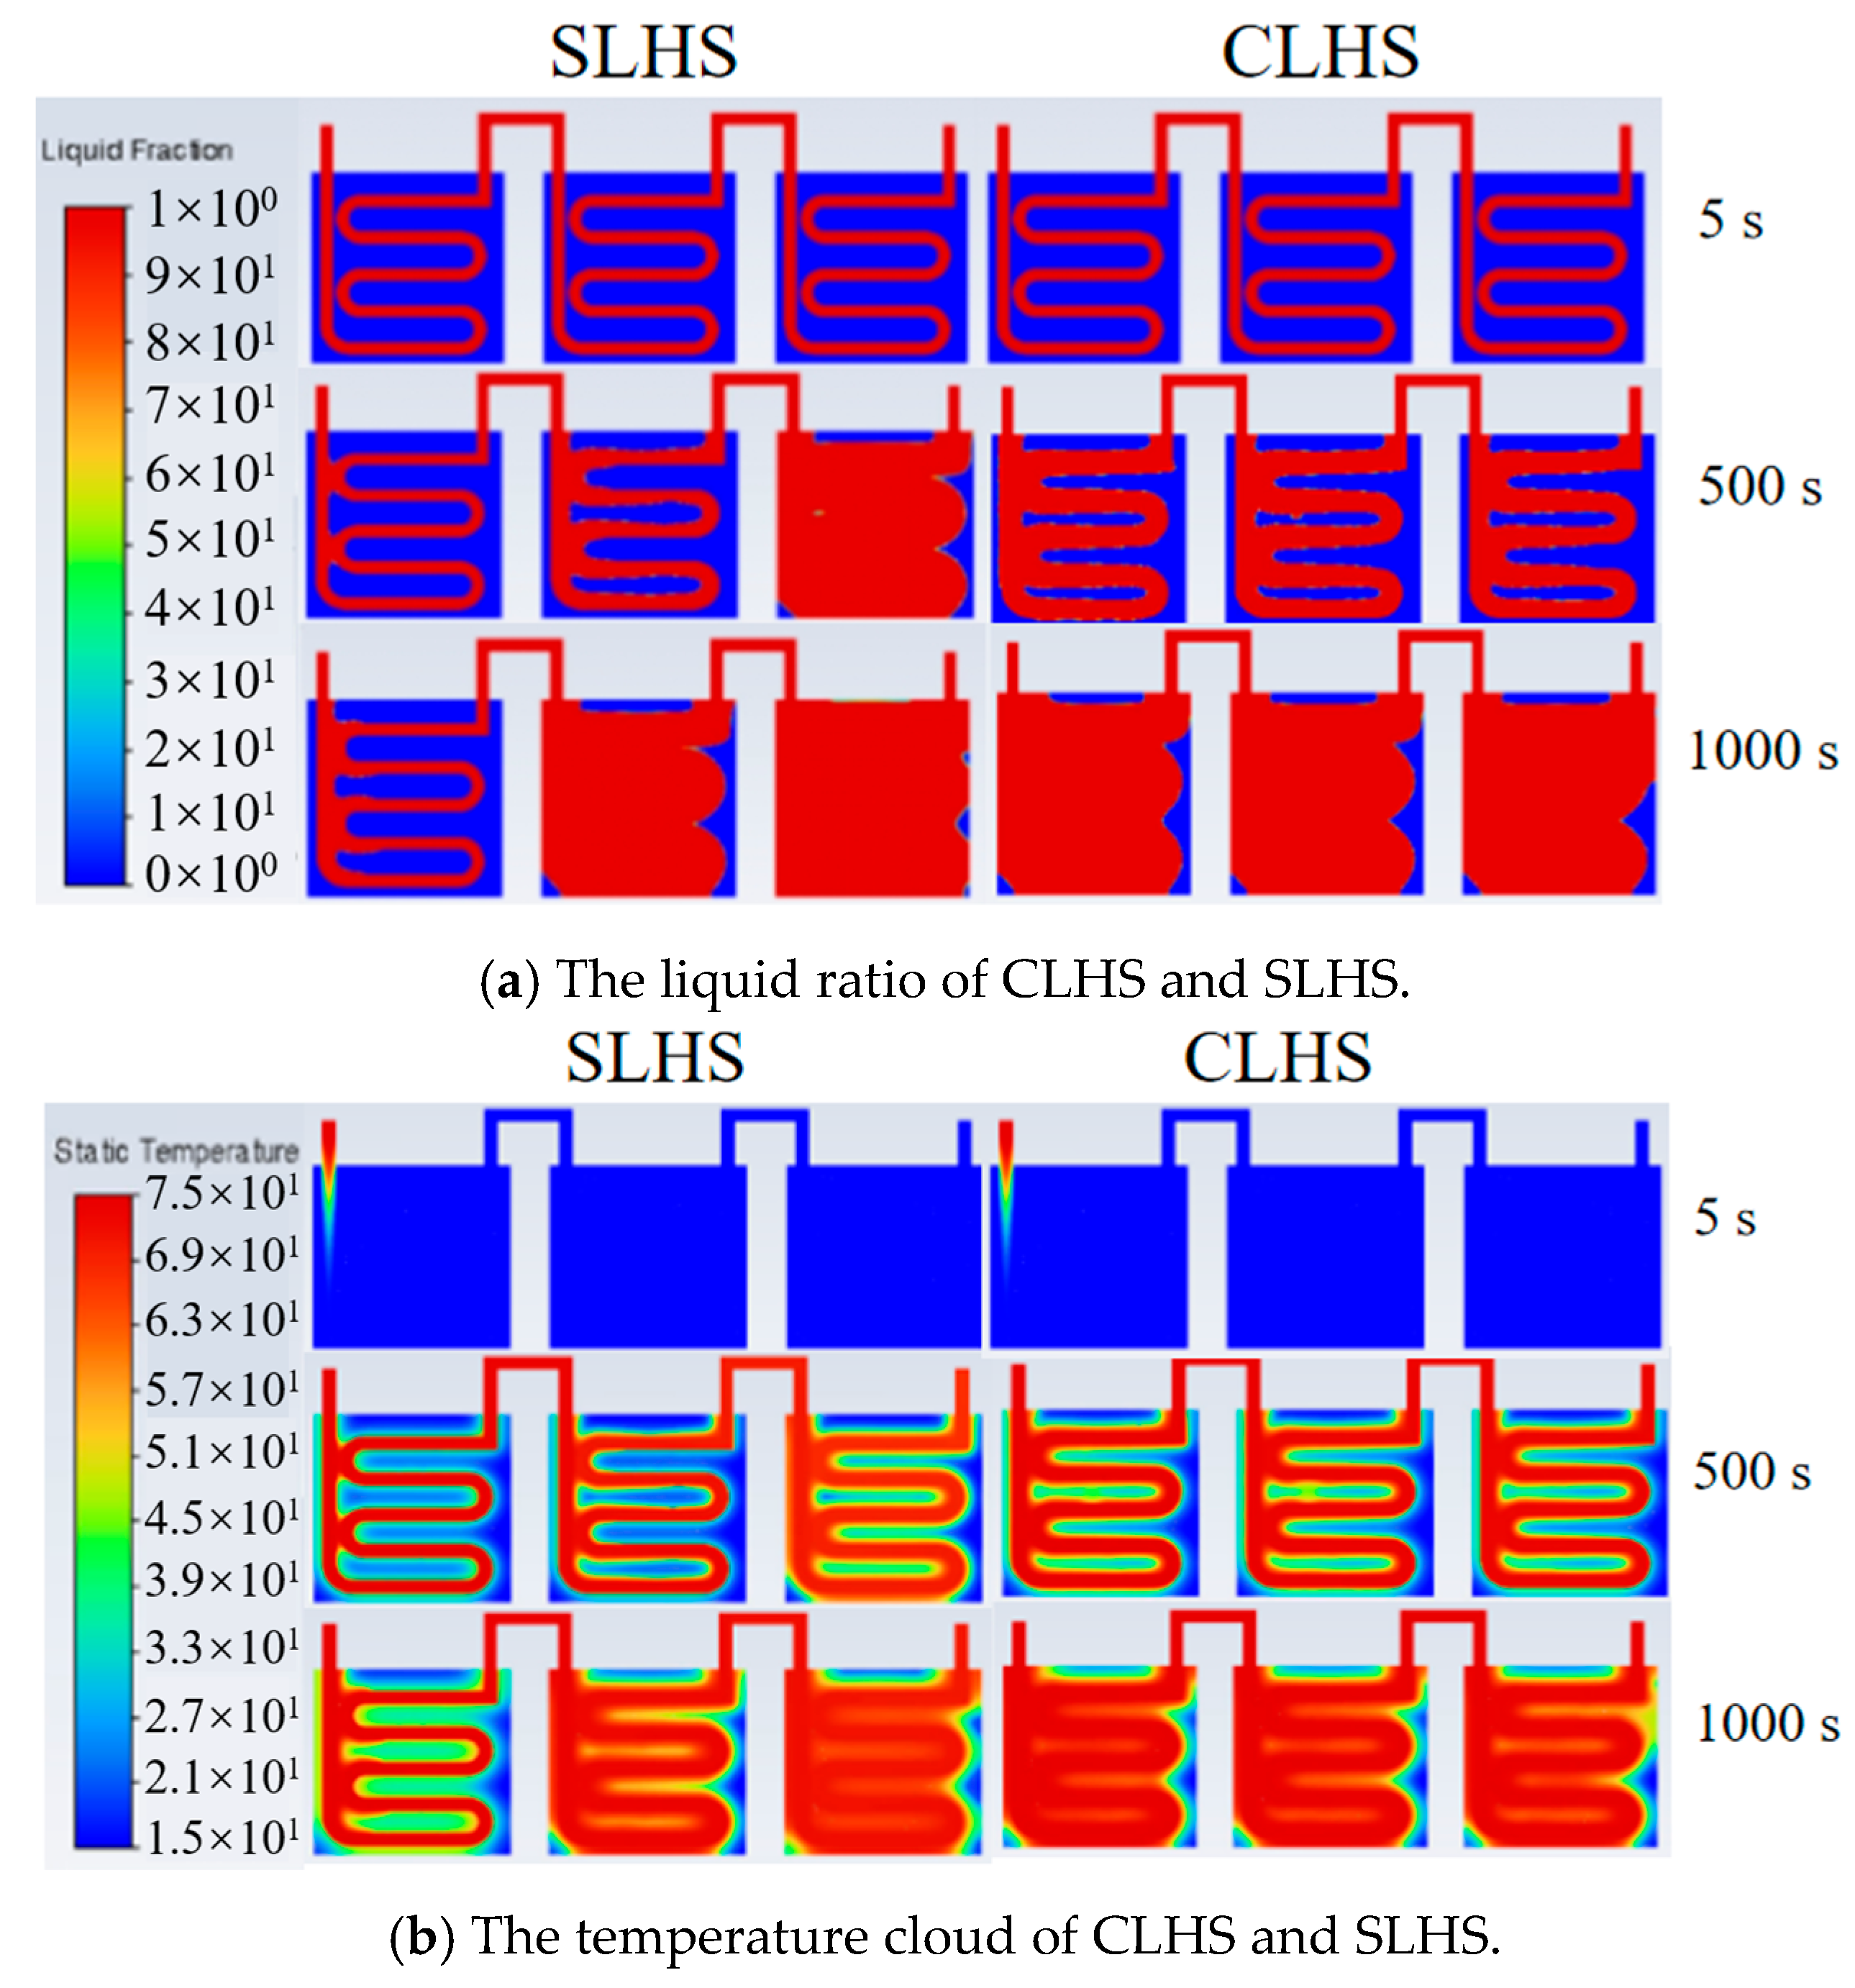
Based on the validated numerical model, Figure 10a,b present the liquid fraction and temperature evolution of CLHS and SLHS under identical boundary conditions. It can be found that the liquid ratio and internal temperature of CLHS is always faster than that of SLHS. At the end of heat storage process, the PCM of the CLHS at outlet has completely melted, while most of the PCM of the SLHS at the outlet has not melted. Correspondingly, the average heat storage rate of CLHS is 0.087 kW, while the total heat storage rate of SLHS is 0.054 kW. The heat storage rate of CLHS is 61.1% higher than that of SLHS. Moreover, the uniformity of CLHS is also better than that of SLHS. At the end of melting, the liquid ratios/internal temperatures of the three LHS units of CLHS are consistent, while that of SLHS are significantly different. This is because the CLHS makes the temperature difference between the fluid and the PCM more uniform. Hence, the application of CLHS in the solar heating system is better than that of SLHS.

3.2. Thermal Performance of CLHS

3.2.1. Effect of Flow Rate

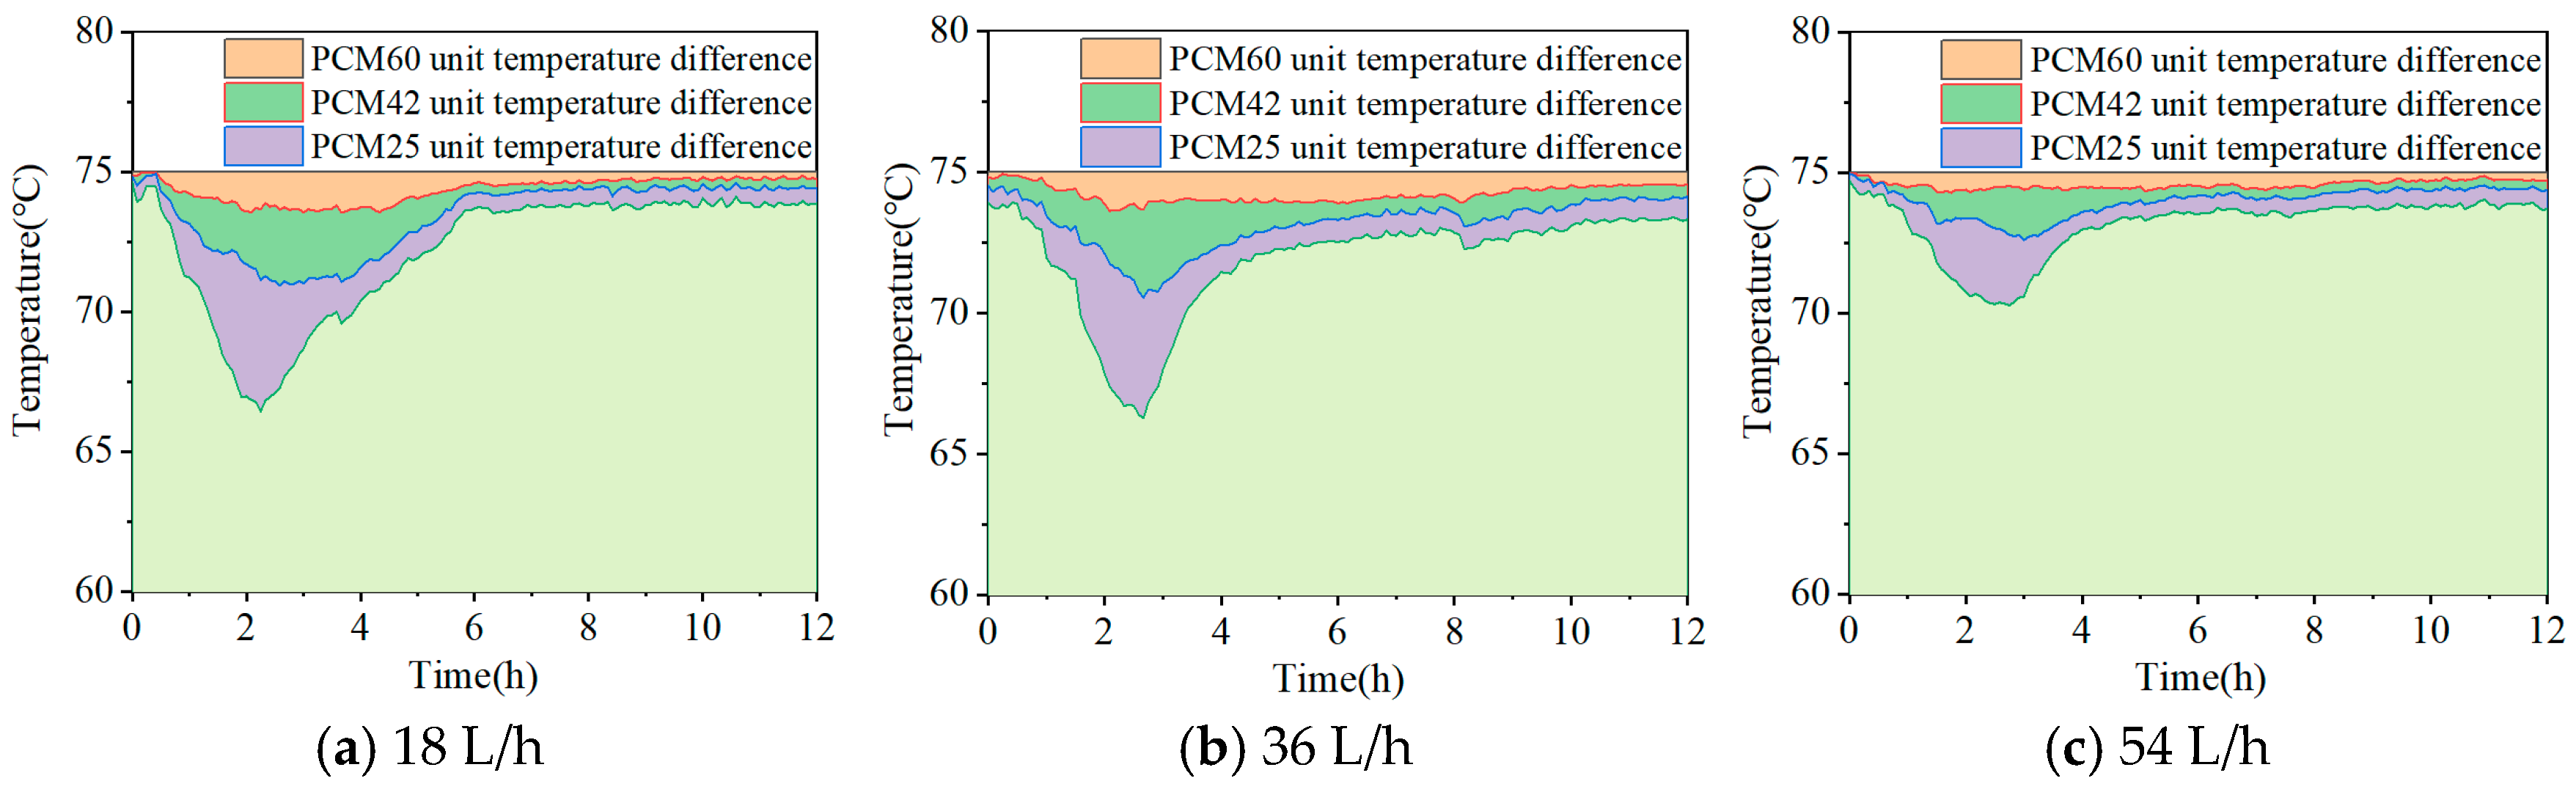
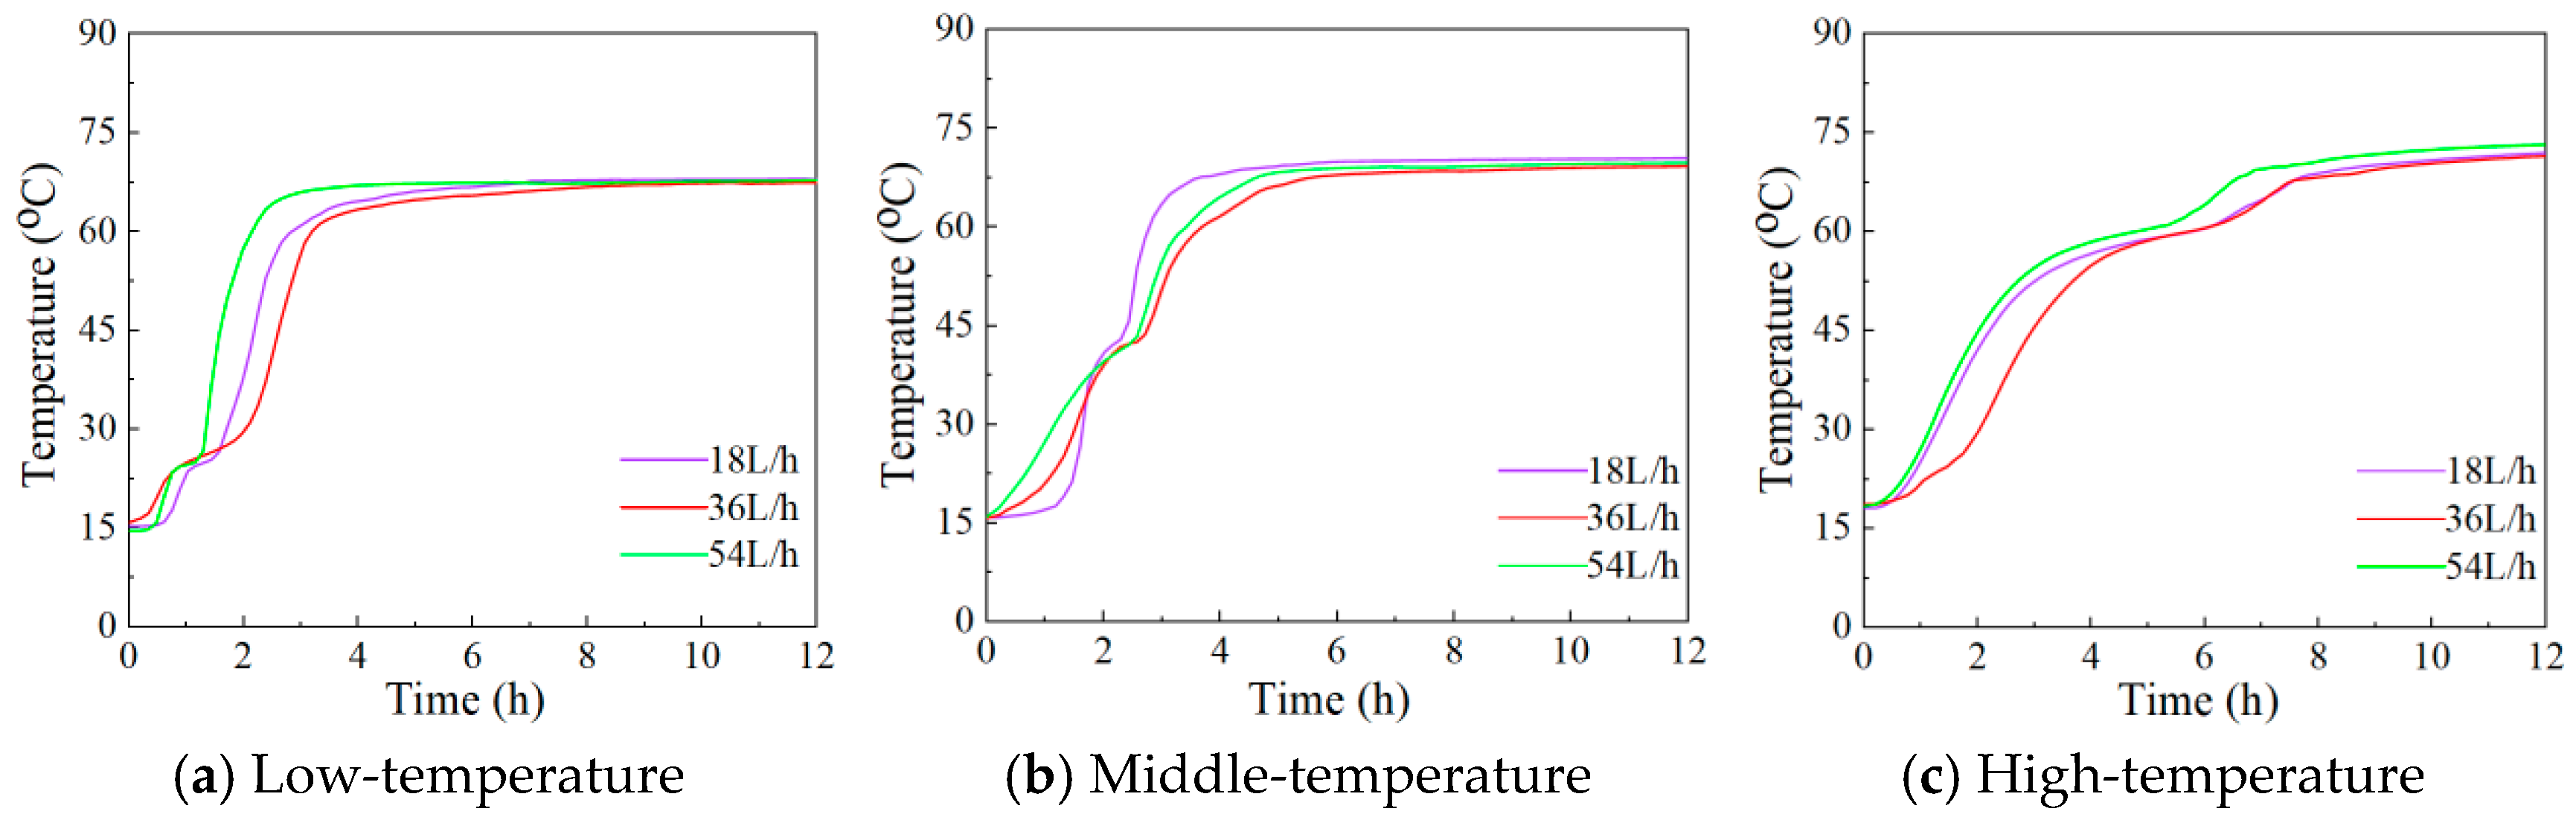
The influence of flow rate on the heat storage performance of the LHS device under different fluid rates was studied. The inlet temperature of the CLHS device was kept at 75 °C. The experiment set up three working conditions with different inlet water flow rates: laminar flow state (18 L/h), transition flow state (36 L/h), and turbulent flow state (54 L/h). The initial temperature of the LHS device was 15 °C.
Figure 11a–c show the changes in the inlet and outlet temperature difference and the average temperature of the internal materials of the LHS units under different water inlet flow rates. Each phase change thermal storage device presents a corresponding phase change temperature under different water inlet flow rates, indicating that each phase change thermal storage device has positive phase change thermal storage characteristics under different water inlet flow rates. When the water inlet flow rates are 18 L/h, 36 L/h and 54 L/h, respectively, the total thermal storage power of the CLHS device is 0.027 kW, 0.032 kW and 0.042 kW, respectively. The increase in water inlet flow rate is conducive to improving the total thermal storage power of the CLHS device. With the increase in water inlet flow rate, the time of the latent heat storage device in the phase change stage can be shortened.
Figure 12 shows the temperature characteristics at inlet/outlet of LHS unit under different water circulation flow rates. As the water inlet flow rate increases, the difference between the inlet and outlet temperature differences in the three latent heat storage modules gradually decreases. Through variance analysis, the difference index between the inlet and outlet temperature differences in the three latent heat storage modules under conditions of water inlet flow rates of 18 L/h, 36 L/h and 54 L/h were 28.75, 20.53 and 18.26 respectively. When the difference in inlet and outlet temperature in the three LHS units is smaller, the difference in heat storage efficiency is smaller. Hence, the larger the flow rate, the higher the heat storage synchronization of the CLHS.

3.2.2. Effect of Inlet Temperature

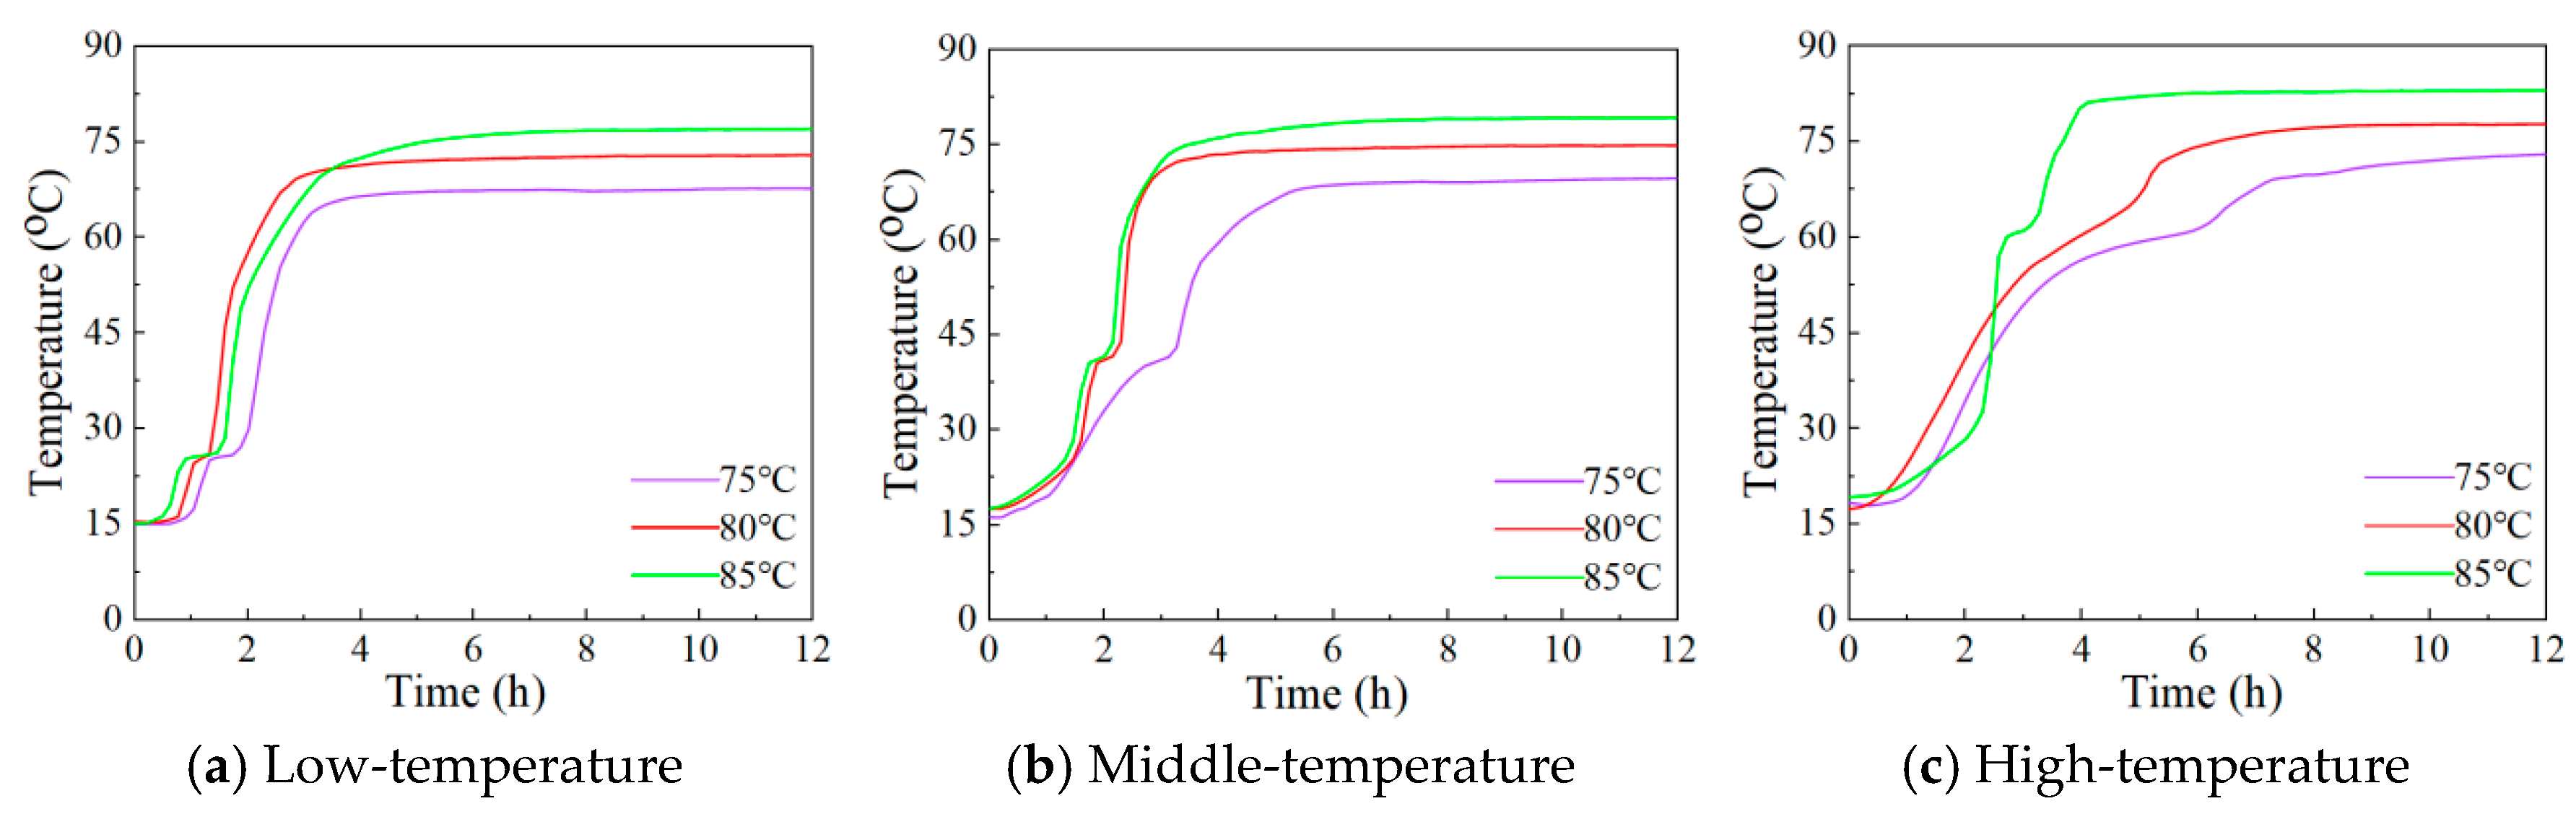
According to the above analysis of the most suitable water flow rate, the water flow rate of the CLHS device is kept unchanged at 54 L/h, and the influence of different water inlet temperatures on the thermal storage performance of the phase change thermal storage device was studied. The experiment established three working conditions with different water inlet temperatures: 75 °C, 80 °C and 85 °C. The initial temperature of the phase change thermal storage device under the three working conditions was 15 °C.
Figure 13a–c show the changes in the average temperature of the internal materials of each latent heat storage device at different inlet water temperatures. Each LHS unit has undergone the obvious latent heat storage process. When the inlet water temperature is 75 °C, 80 °C and 85 °C, the total heat storage power of the CLHS device is 0.038 kW, 0.068 kW and 0.091 kW, respectively. The increase in inlet water temperature is beneficial to improving the total heat storage power of the CLHS device and accelerating the heat storage rate.
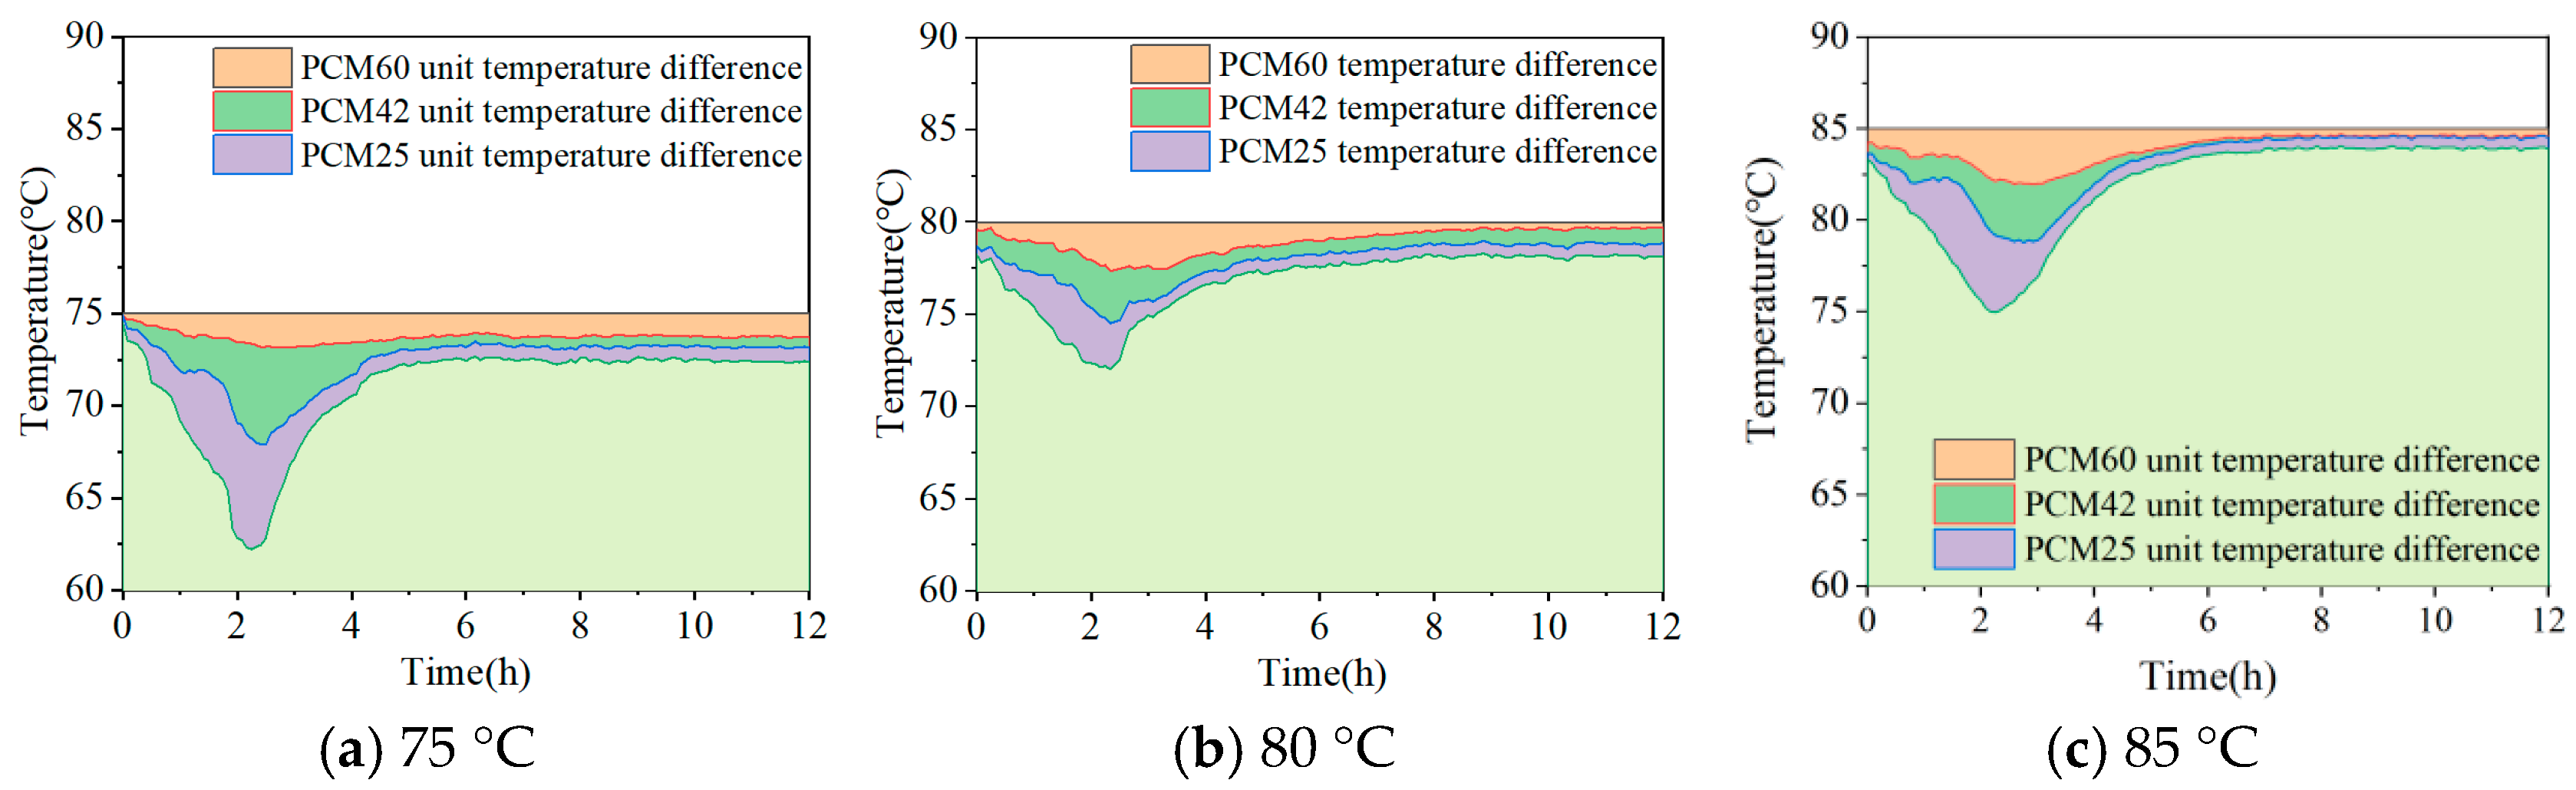
Figure 14 shows the temperature characteristics at inlet/outlet of LHS unit under different inlet water temperatures. As the inlet water temperature increases, the difference between the inlet and outlet temperature differences in the three latent heat storage modules first decreases and then increases. Through variance analysis, the difference index between the inlet and outlet temperature differences in the three LHS units under inlet water temperatures of 75 °C, 80 °C and 85 °C are 2.52, 2.19 and 9.36 respectively. When the inlet water temperature is 75 °C, the inlet and outlet temperature difference in the high-temperature LHS unit is small, and the inlet and outlet temperature difference in the middle-temperature LHS unit and the low-temperature LHS unit is large, resulting in the low heat storage efficiency of the high-temperature LHS unit. When the inlet water temperature is 85 °C, the inlet and outlet temperature difference in the high-temperature LHS unit increases, and the inlet and outlet temperature difference in the low-temperature LHS unit decreases. When the inlet water temperature is 80 °C, the difference between the inlet and outlet temperature differences in the three LHS units is small, and the heat storage efficiency of the three LHS units is highly synchronized. The higher the water temperature, the greater the heat loss of the solar collector to the environment, the lower the thermal efficiency. Hence, the inlet water temperature was set as 80 °C.

3.3. Performance of Graded Heating System

3.3.1. Energy Distribution Characteristics

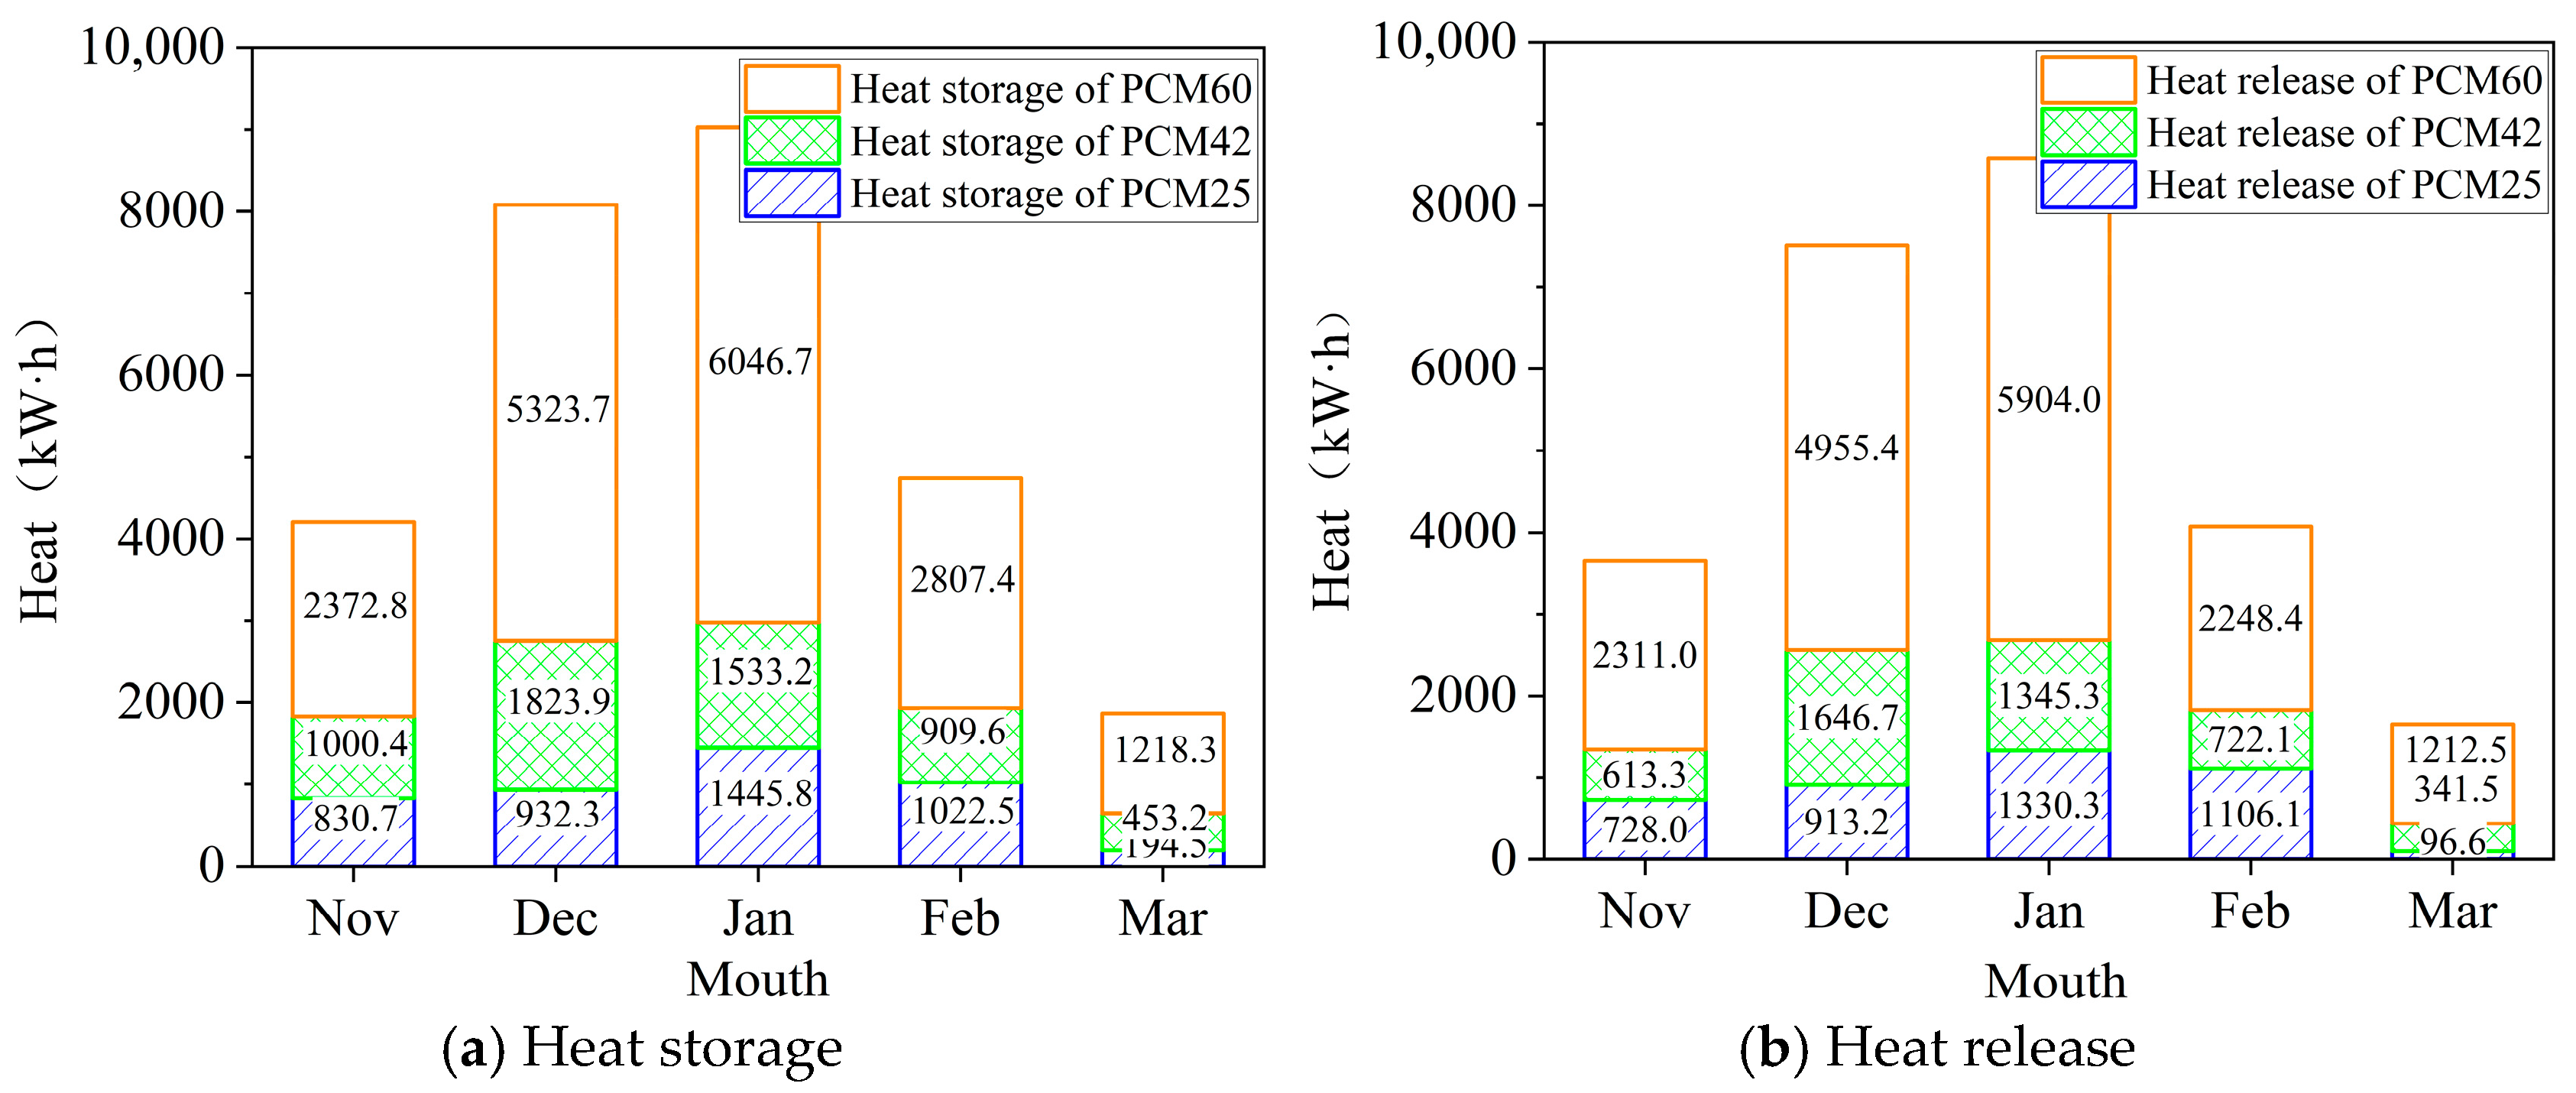
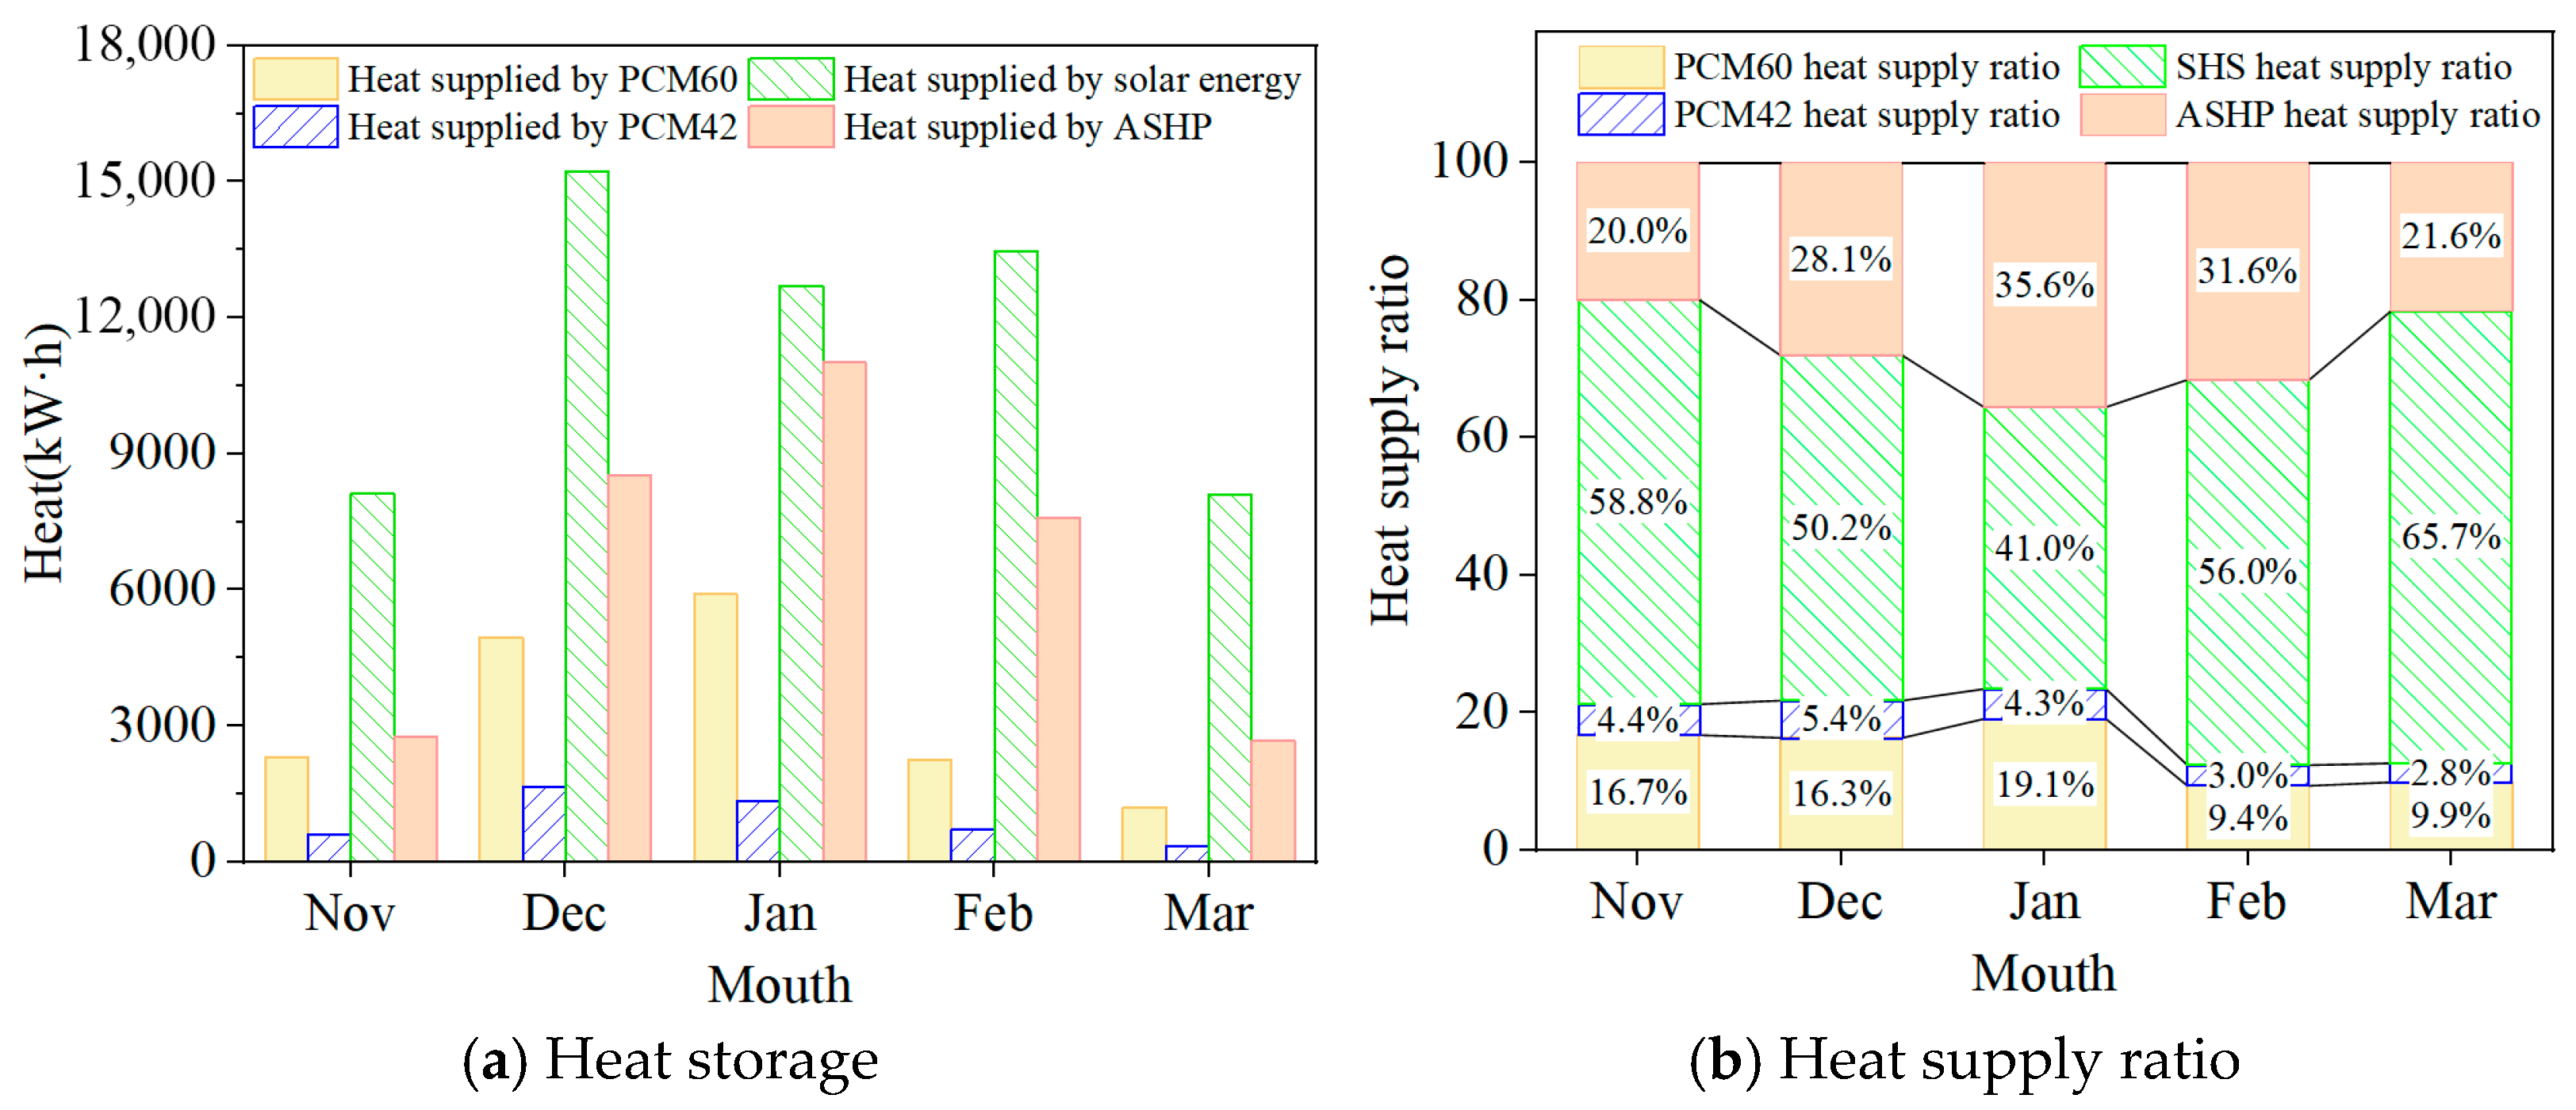
Figure 15 shows the heat storage and release of the CLHS device during the heating season on a monthly basis. The total heat storage of the high/middle/low-temperature LHS units is 17,768.8/5720.4/4425.9 kWh. The total solar energy collection for the heating season is 83,367.6 kWh, and the heat storage of the three LHS units accounts for 21.3%, 6.9% and 5.3% of the total solar energy collection, respectively. Part of the remaining solar energy collected is directly used for building heating, while the other part is retained in the buffer water tank.
Furthermore, the high-temperature LHS unit provides 16,631.4 kWh for building heating, the middle-temperature LHS unit provides 4668.9 kWh for building heating, and the low-temperature LHS unit has a total heat release of 4174.2 kWh, which is used to preheat the outdoor air entering the ASHP evaporator. The overall efficiencies of the high-temperature, middle-temperature, and low-temperature LHS units are 93.6%, 81.6%, and 94.3%, respectively. The lower efficiency of the middle-temperature LHS unit is primarily attributed to a smaller heat transfer temperature difference during the discharging process. Since its phase change temperature of 42 °C is close to the return water temperature of the building heating system, the heat transfer rate is relatively low. Consequently, this unit is often incompletely discharged during dynamic operation cycles. In contrast, both the PCM60 unit for direct heating and the PCM25 unit for preheating cold outdoor air operate with substantially larger temperature differences, enabling more thorough heat release and higher cycle efficiencies. Therefore, the CLHS device can effectively utilize the solar heat.
Figure 16 shows the heat supply and proportion of the CLHS, solar collector and ASHP. The direct solar heating accounts for a large proportion. The CLHS stores solar heat and releases heat to provide heat for the building through the high-temperature and middle temperature LHS units when the solar thermal collection system cannot operate, thus making up for the defect caused by intermittent and unstable solar heating. However, when the solar radiation intensity is low enough to provide little or no heat, and the CLHS device is also unable to provide heat, the ASHP plays the role of auxiliary heating equipment, effectively ensuring the stability of the heating of the CLHS and graded heating system. Through statistical analysis, the direct heating of the high-temperature LHS unit, middle temperature LHS unit, ASHP and solar thermal system are 16,631.4 kWh, 4668.9 kWh, 32,551.5 kWh and 57,586.2 kWh respectively. The heat storage in the CLHS device thoroughly comes from the solar thermal system. Therefore, the internal solar heat contribution reaches 70.8% of the total heat supply of the entire system itself. The CLHS and graded heating system implements a clean heating model with solar heating as the main source and the ASHP as the auxiliary source.
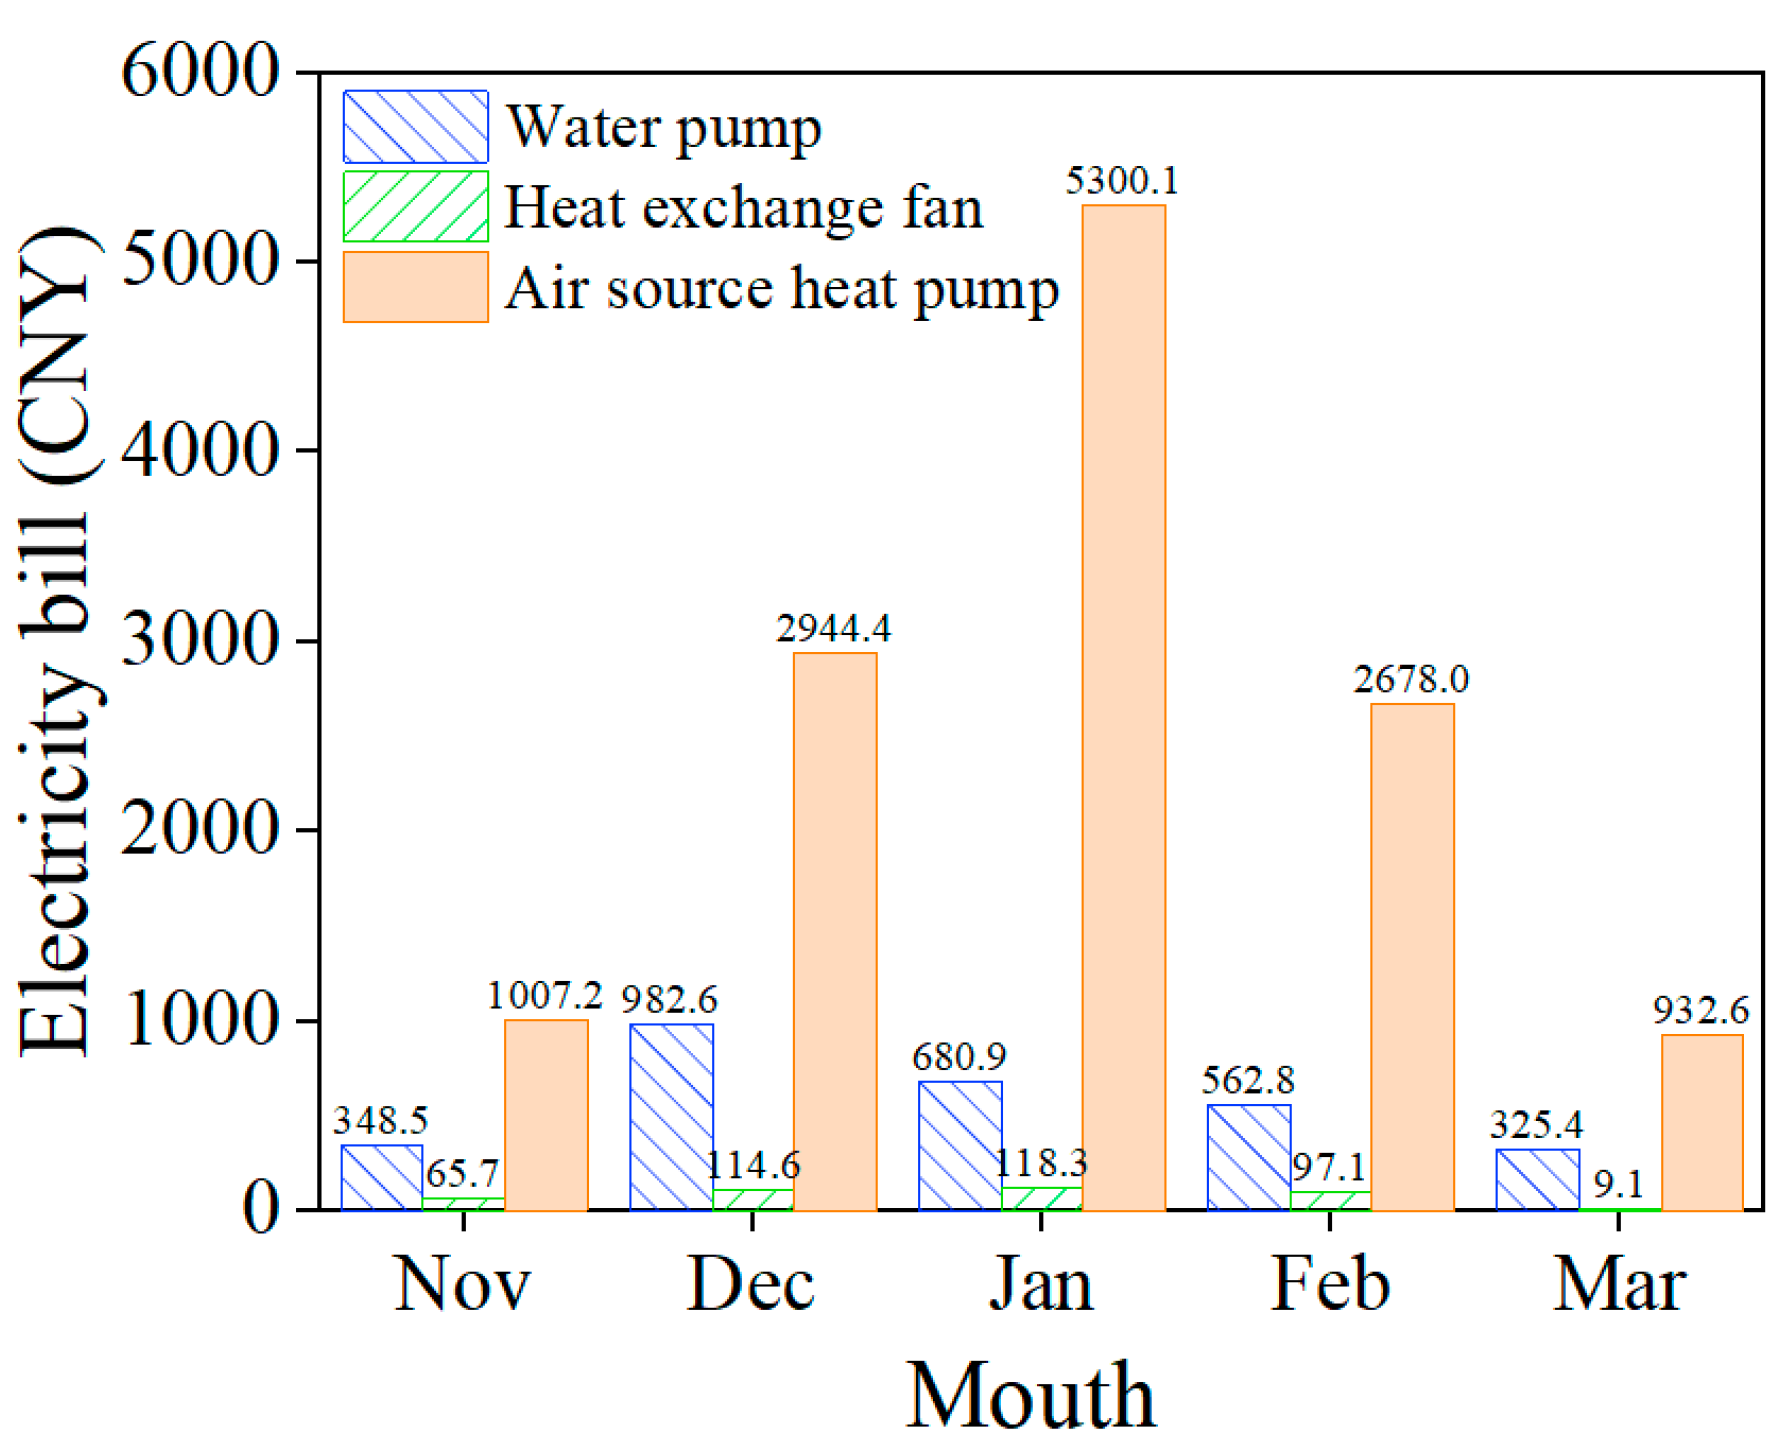
Figure 17 shows the changes in the operating costs of the internal equipment used in the CLHS and hierarchical heating system. At an electricity price of 0.79 CNY/kWh, the total operating cost of the proposed system is 16,167.4 CNY. To evaluate the economic benefits, the proposed system is directly compared with a conventional solar energy coupled ASHP heating system without a CLHS device. The operating cost of this conventional system is 17,625.3 CNY. Consequently, the proposed graded system saves 16.7% of the heating operation costs compared to the system lacking thermal storage.

3.3.2. Performance Enhancement from Low-Grade Heat Recovery

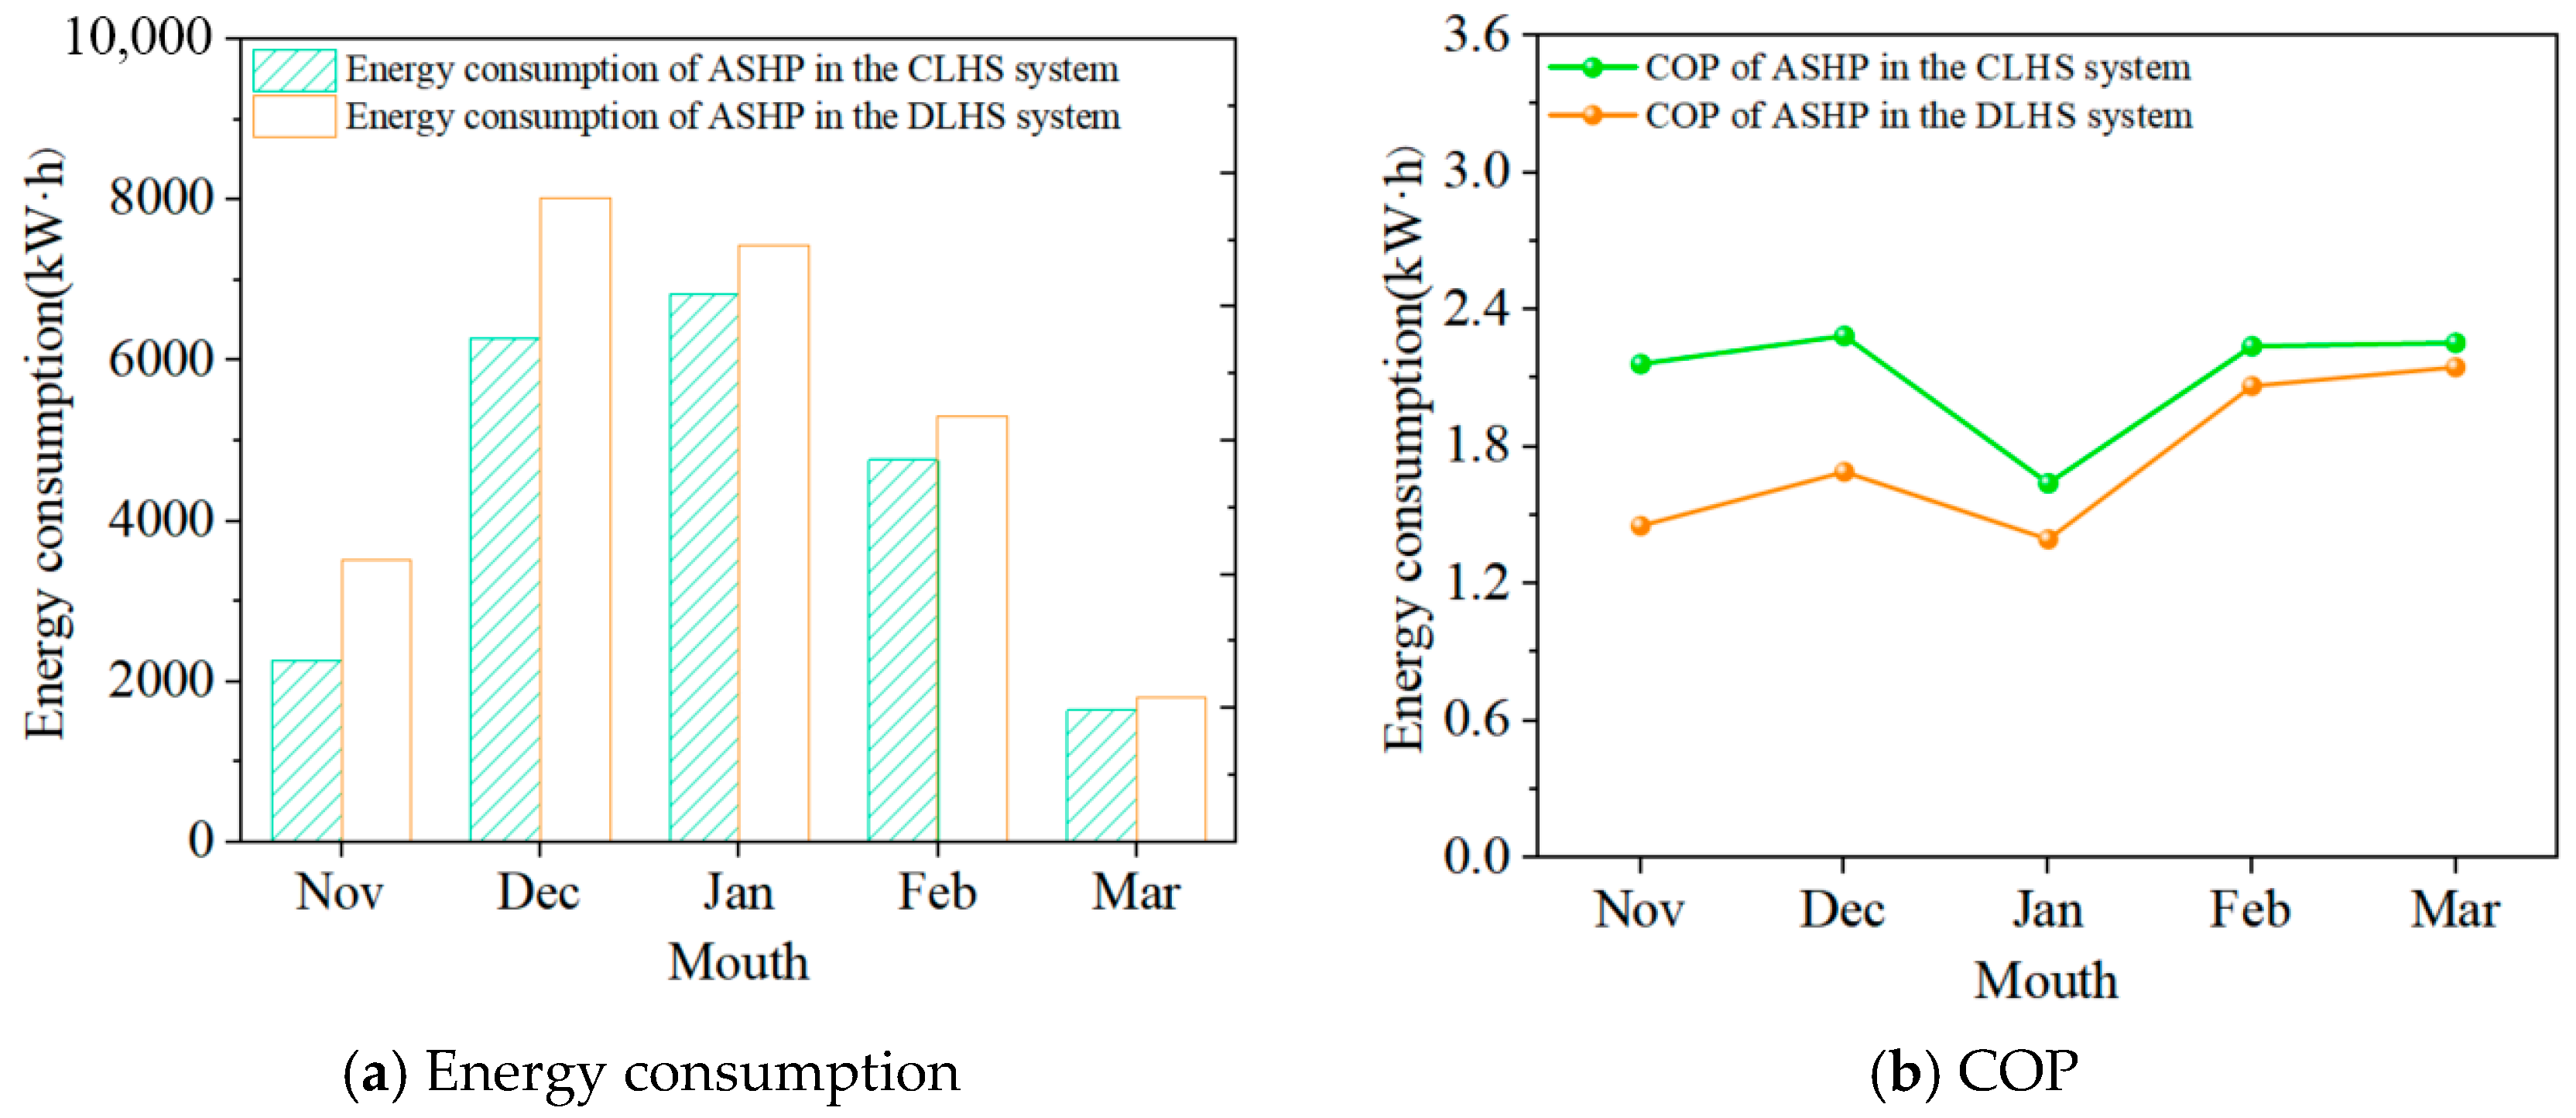
The primary energy consumption of the system is attributed to the ASHP. Figure 18a illustrates the monthly energy consumption of ASHP. The total energy consumptions of ASHP with preheating and non-preheating are 21,768.7 kWh and 26,109.8 kWh, respectively. In the graded heating system with preheated air, ASHP consumes 16.6% less energy compared to that without preheated air. Correspondingly, the COP of ASHP with preheating has risen by 18.3%, shown in Figure 18b. This indicates that the addition of a low-temperature LHS unit in the CLHS system significantly reduces energy consumption. Preheating the air is highly beneficial for improving the COP of ASHP and reducing energy consumption. The reported COP improvement essentially stems from capturing the otherwise unusable low-grade solar heat to elevate the heat pump intake temperature.
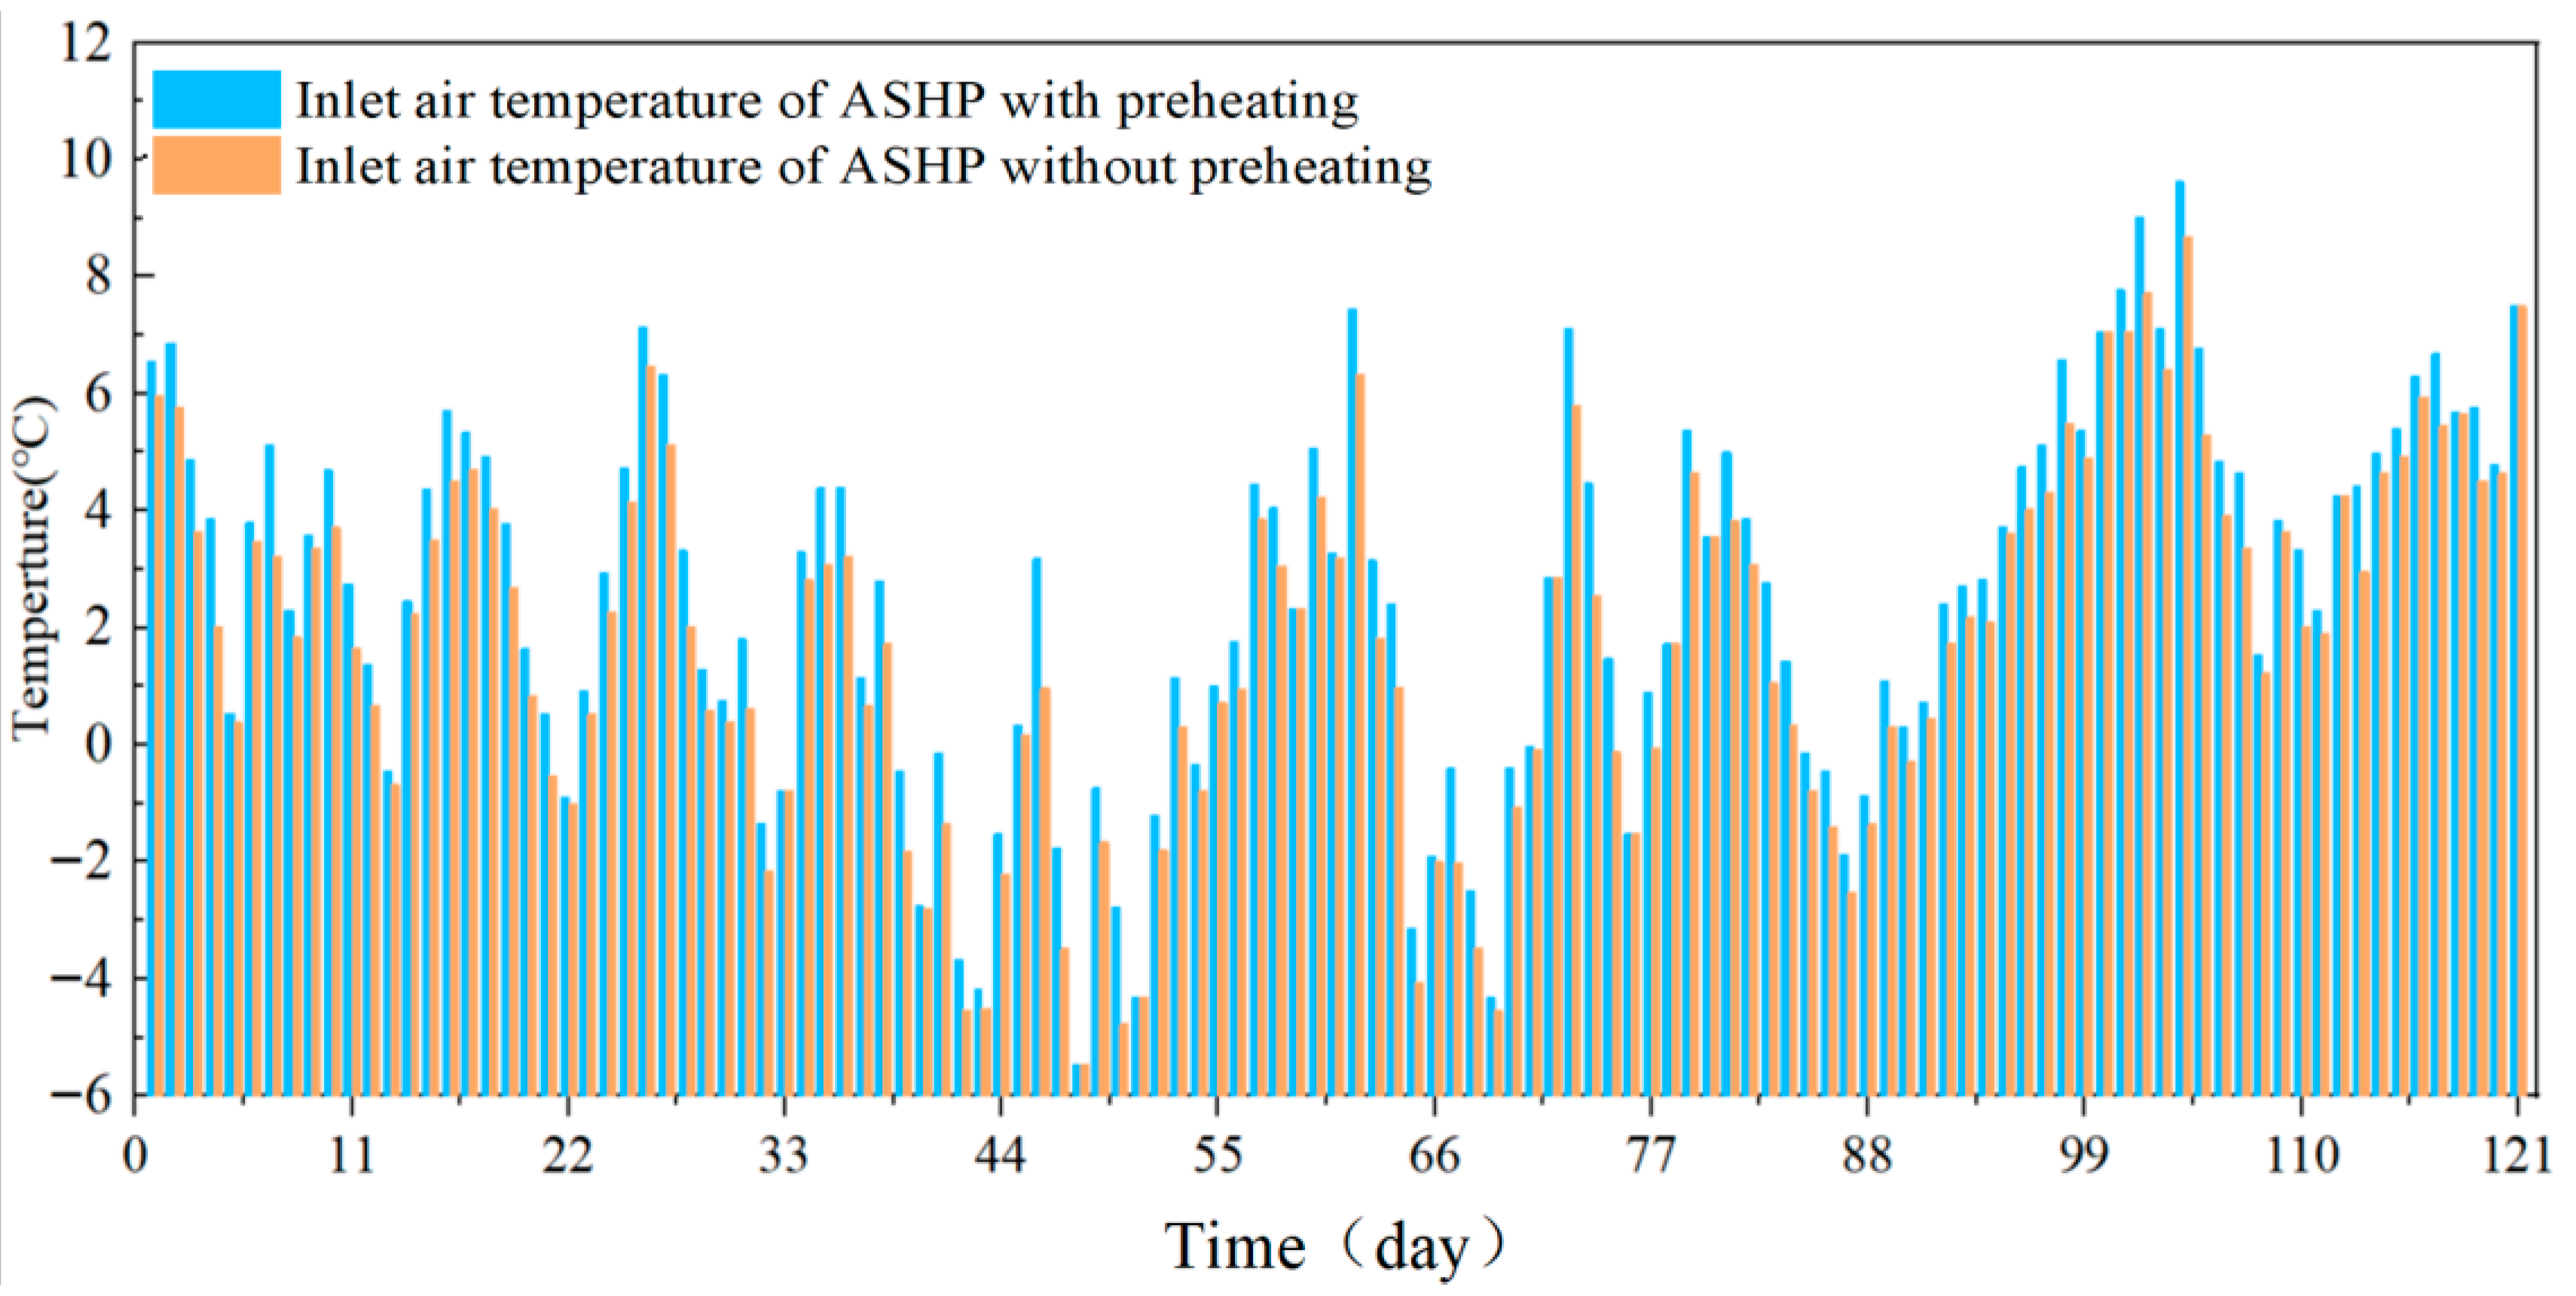
Figure 19 shows the air intake temperature of ASHP in a preheating and non-preheating system. During the heating season, the average air intake temperature of the ASHP with and without preheating was 2.52 °C and 1.86 °C respectively. By utilizing low-grade heat for preheating, the average air intake temperature increased by 35.5%. Therefore, the cascade storage architecture effectively transforms unusable low-temperature solar energy into a preheating source, which substantially improves the COP and reduces the overall energy consumption of the ASHP. Importantly, the 0.66 °C increase in the ASHP inlet-air temperature represents the seasonal average over the heating period rather than a uniform rise at every operating hour. Therefore, the 18.3% COP enhancement should be regarded as a system-level effect induced by the 25 °C PCM unit. By recovering low-grade heat for inlet-air preheating, the unit changes the ASHP operating profile and reduces operation in low-temperature, frosting-prone, and start-up-loss periods.

3.4. Optimization of Graded Heating System

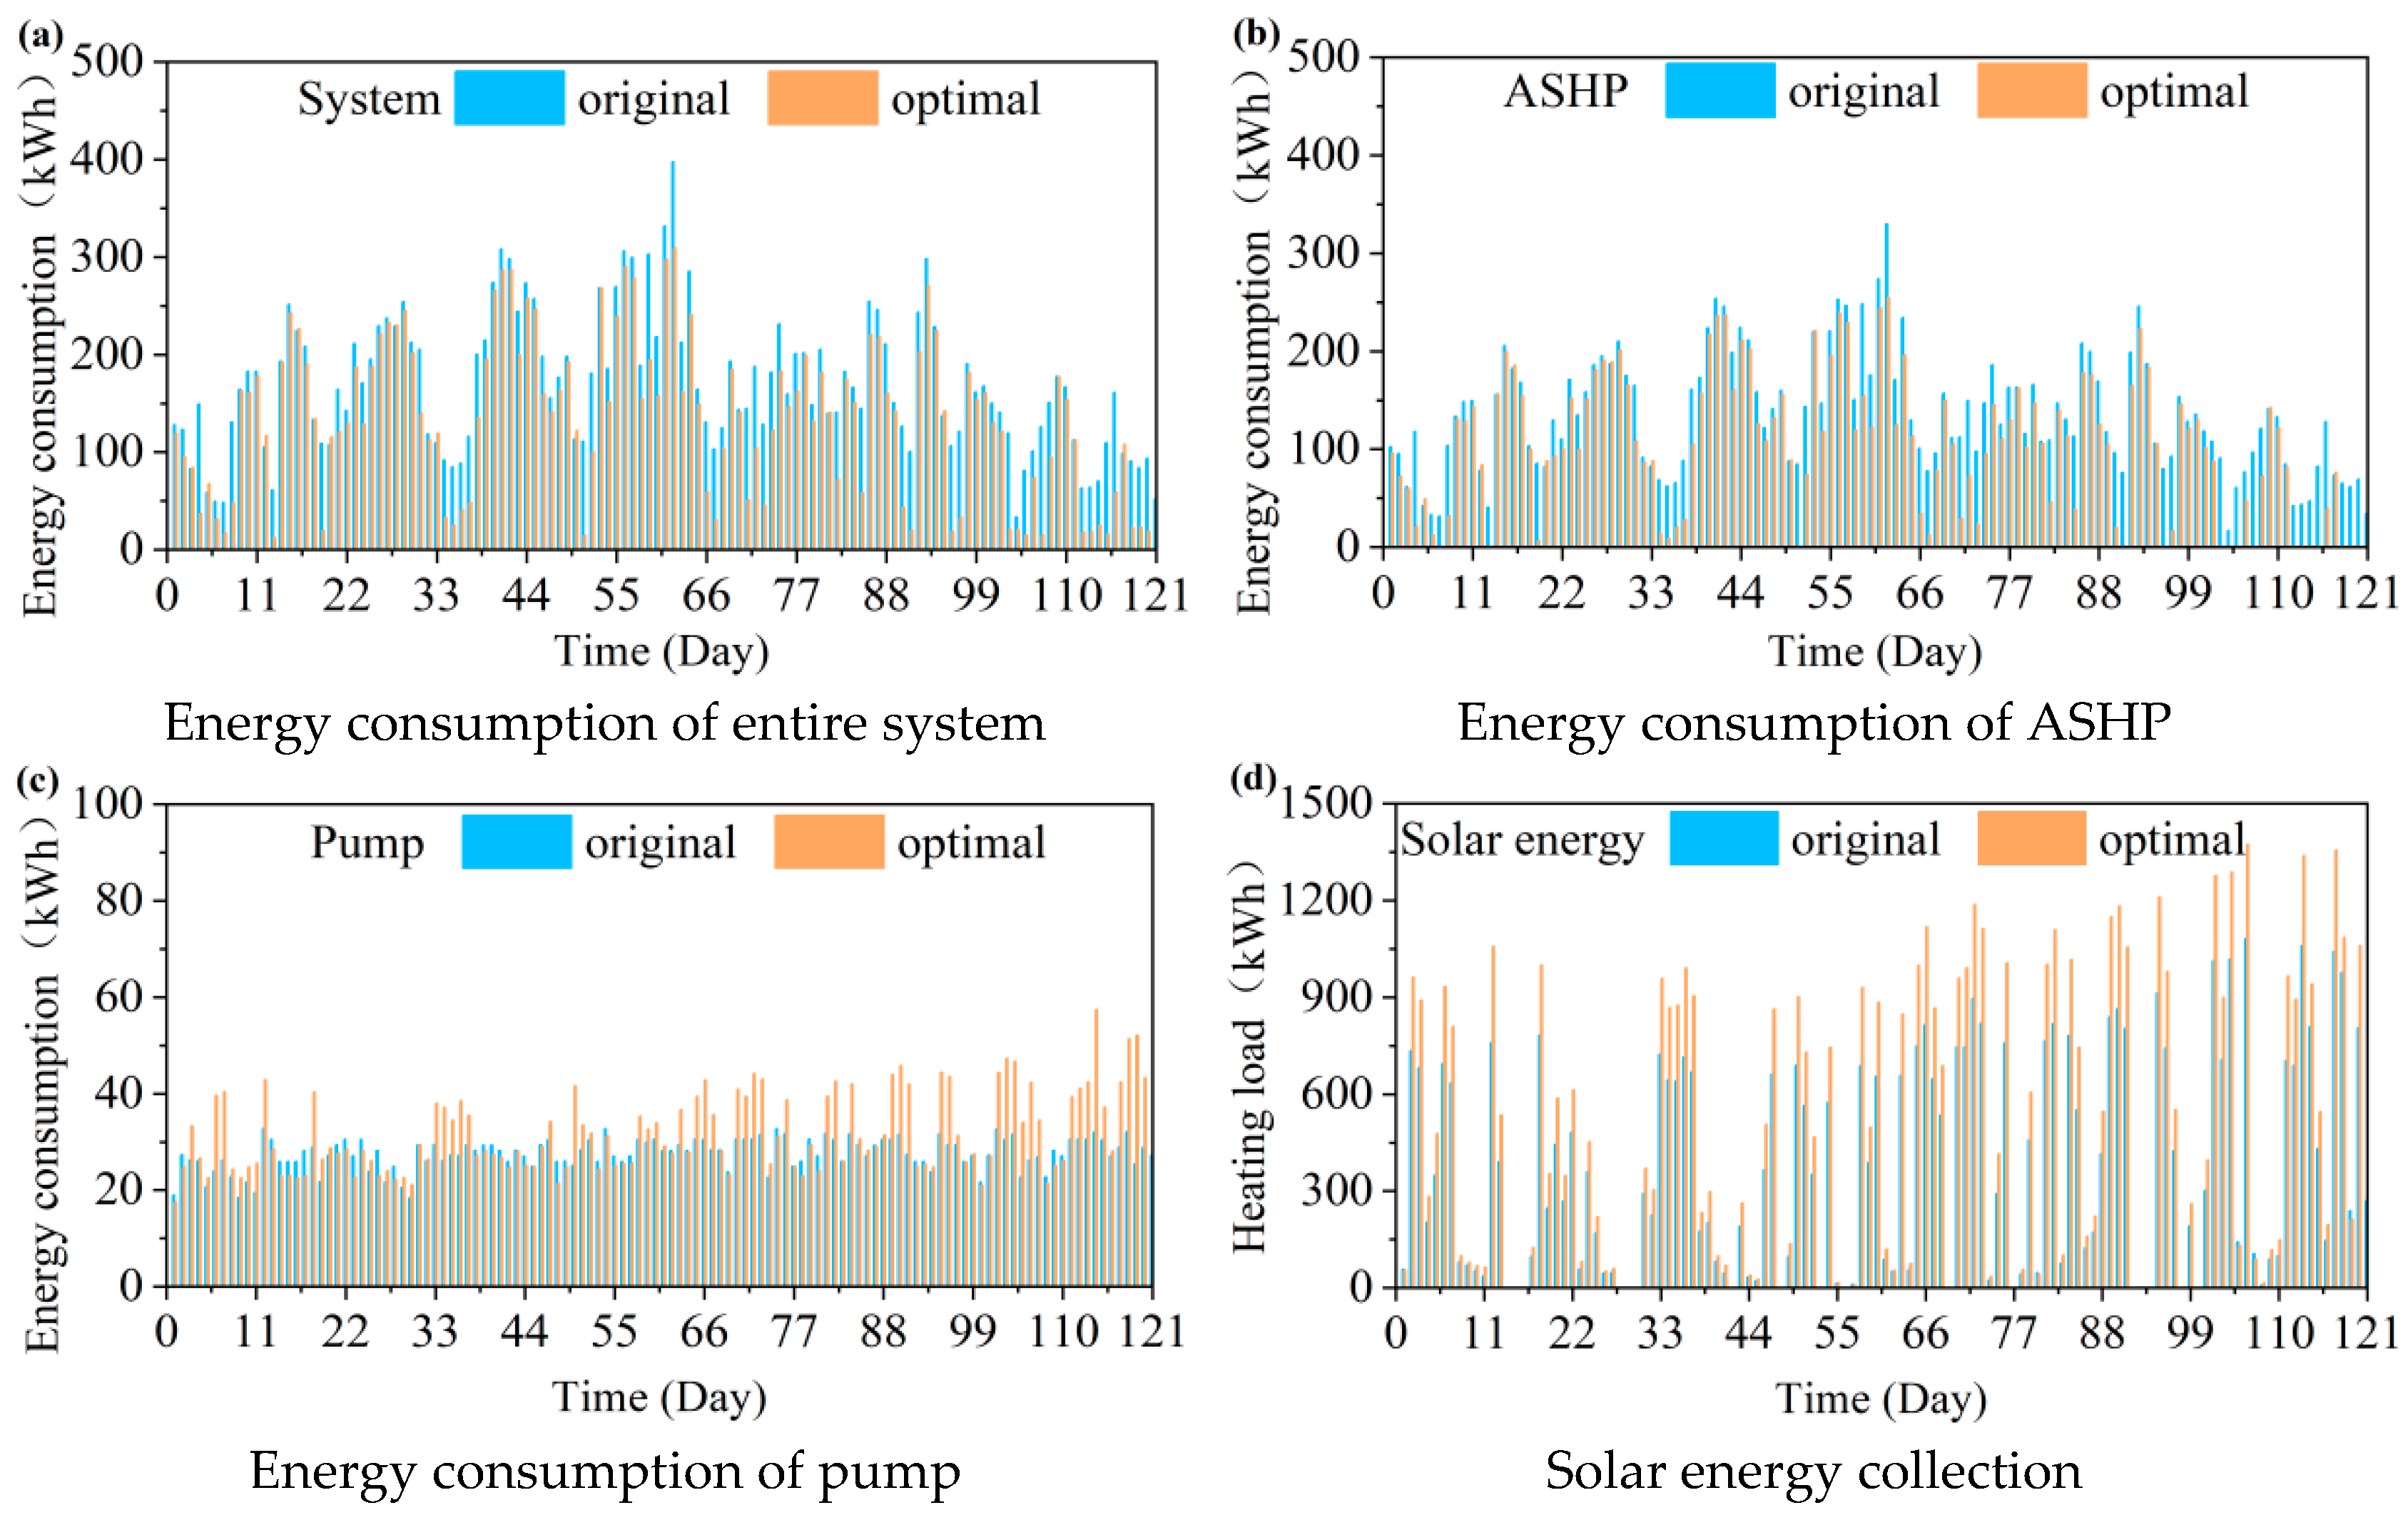
The Hooke-Jeeves algorithm in the GenOpt framework was employed to optimize the parameters of the CLHS system. The optimized solar collection area is 354 m2, the ASHP has a power of 58 kW, and the CLHS system has a thermal capacity of 908.5 MJ. Overall, the optimization process yielded a reduction in the surface area of solar collectors, a reduction in the power rating of the heat pump, and corresponding adjustments to the thermal storage capacity. Due to the optimized parameter matching and improved overall system efficiency, the total energy consumption during the heating season decreased by 20.7%, as shown in Figure 20a. Concurrently, the downsized power rating of the air-source heat pump led to a 23.5% reduction in its total energy consumption, as depicted in Figure 20b. It is noteworthy that the percentage reduction in overall system energy consumption was lower than that of the air-source heat pump. This discrepancy stems from the fact that system energy consumption comprises contributions from the air-source heat pump, water pumps, and fans. In the optimized system, the improved solar thermal utilization efficiency prolonged the operational time of water pumps, thereby increasing their energy consumption by 15.6% compared to the pre-optimization state, as illustrated in Figure 20c. The solar collector surface area is shown in Figure 20d.
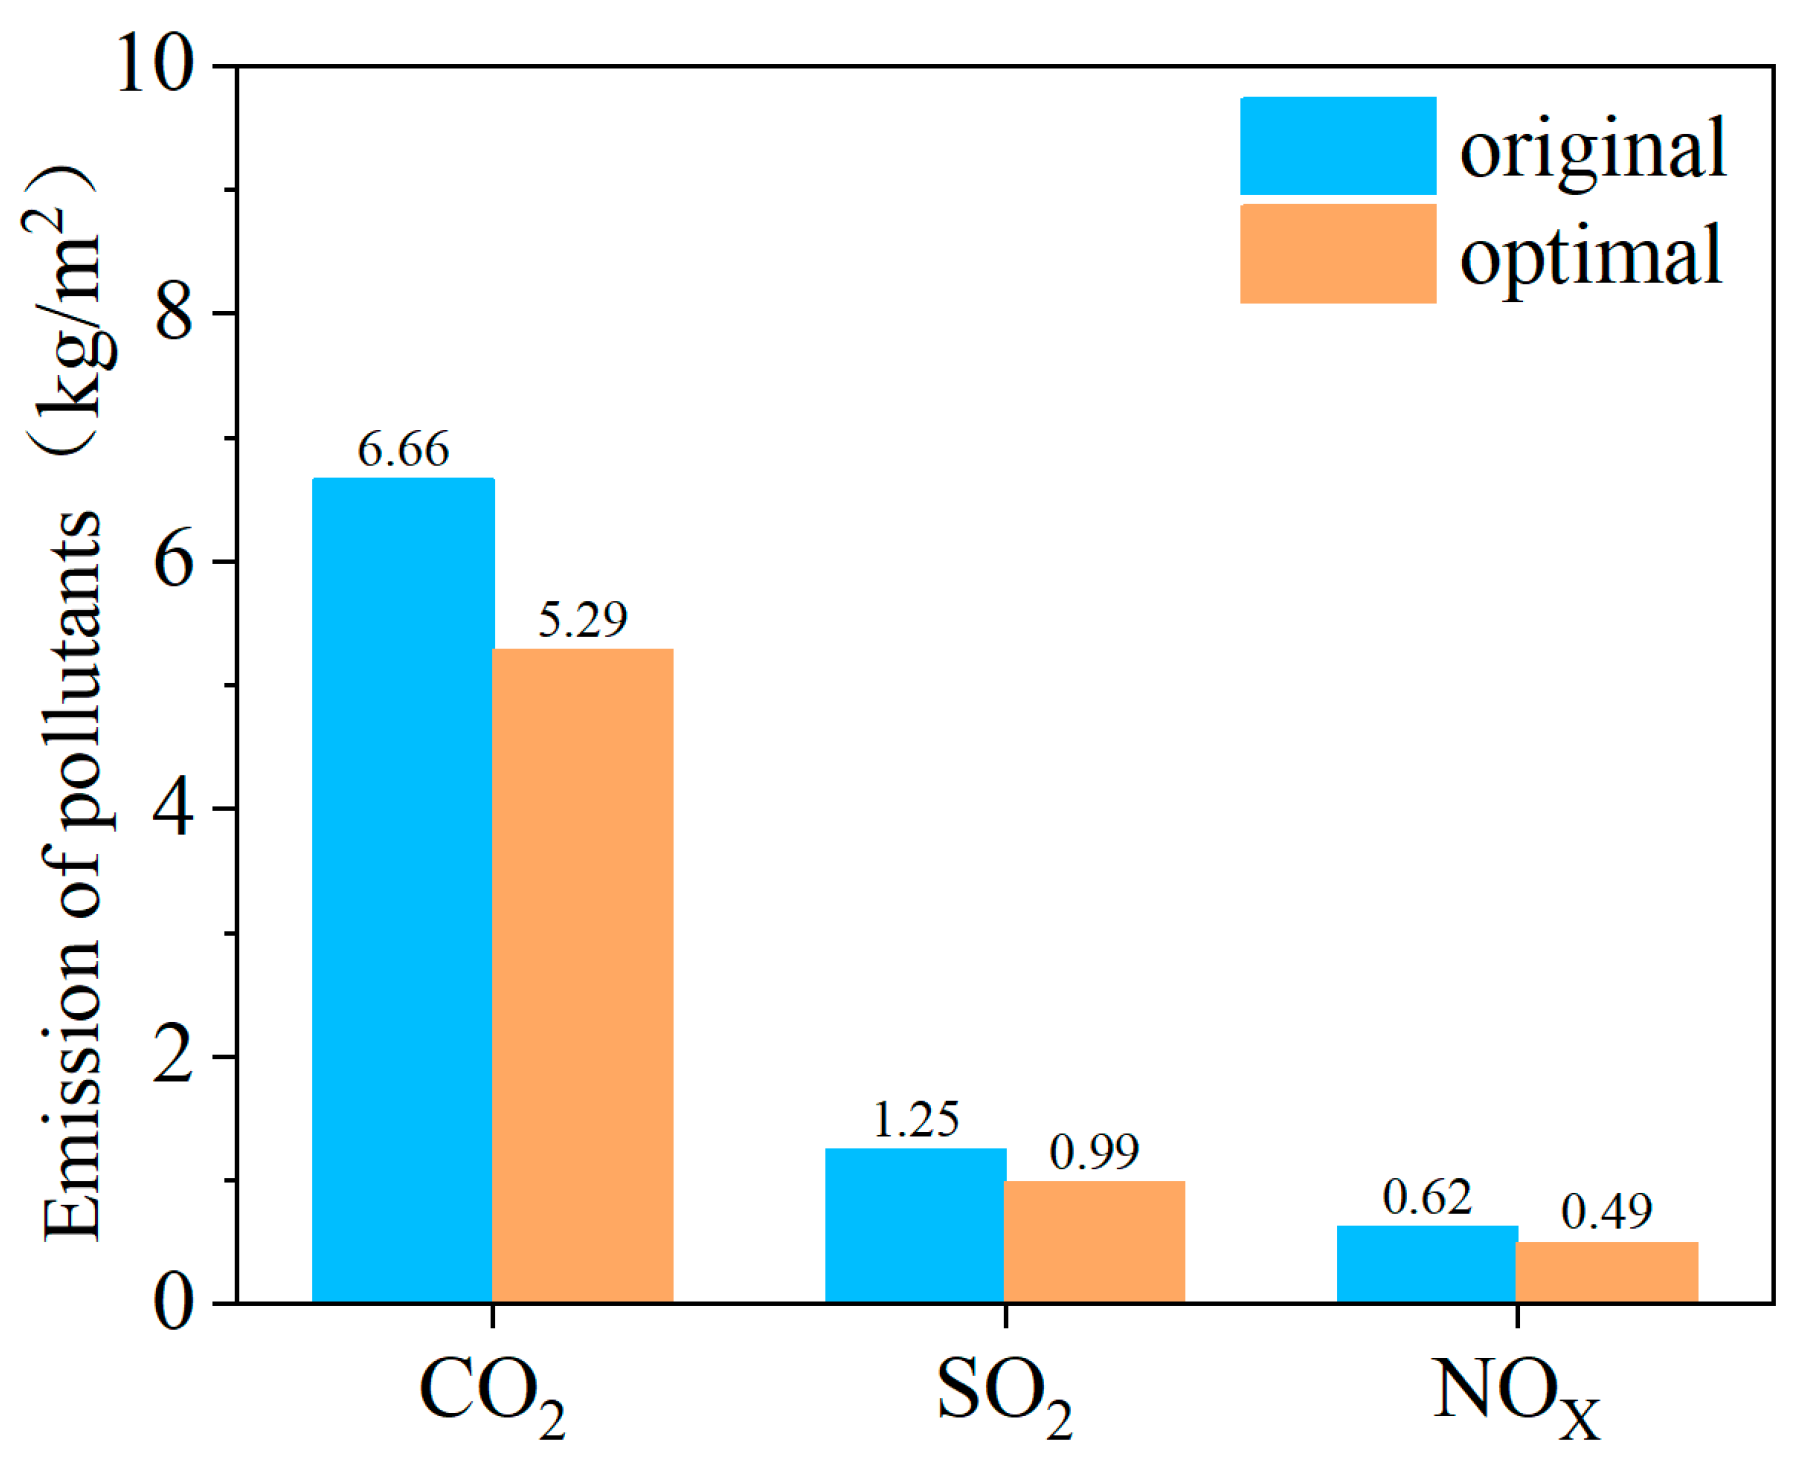
Figure 21 shows the CO2, SO2, and NOx emissions per unit area before and after optimization. Higher energy consumption leads to higher pollutant emissions. After optimization, with the reduction in energy consumption, the CO2, SO2, and NOX emissions decreased by 20.6%, 20.8%, and 21.0%, respectively. And the total pollutant emissions is reduced by 20.6%.
While this study presents a feasible approach for the graded heating system, it is necessary to explicitly outline the associated model idealizations and validity boundaries. First, the numerical simulation adopts simplified isothermal phase transitions and neglects internal natural convection. Although these idealizations ensure computational efficiency, they may slightly overestimate the dynamic heat transfer rates. Second, the system performance and economic analyses are closely tied to the meteorological characteristics and static electricity tariffs of Tianjin. Consequently, the optimal parameter configurations and the reported 70.8% solar heat contribution are most applicable to regions with comparable solar irradiation and heating loads. Future studies will focus on long-term experimental validations under diverse dynamic climatic boundaries.

4. Conclusions

This study integrated a cascaded latent heat storage unit with a solar-assisted air source heat pump to systematically address the operational instability and low-temperature inefficiency inherent in conventional clean heating. By evaluating the system through combined experiments and TRNSYS simulations, the main findings are concise and integrated as follows:
(1)
The cascaded structural design fundamentally resolves the non-uniform phase transition defect prevalent in single-stage storage devices. Driven by a matched temperature gradient, the dynamic heat storage rate is enhanced by 61.1% compared to typical single-stage units. Furthermore, experimental evaluations under different thermal boundaries indicate that an inlet fluid temperature of 80 °C yields the minimal discrepancy index, demonstrating the best synchronous heat storage performance across the internal modules.
(2)
The practical relevance of this graded architecture lies in its ability to thoroughly extract and deploy low-grade solar heat, which accounts for 70.8% of the total system heat supply. By utilizing the 25 °C latent heat storage unit to preheat the ambient air for the heat pump, the operating profile of the heat pump is significantly altered. Consequently, this recovery strategy elevates the seasonal average COP by 18.3% and reduces heat pump energy consumption by 16.6% compared to a conventional non-preheating system.
(3)
Based on the Hooke-Jeeves algorithm, the parameter optimization of the graded heating system was conducted. This configuration further reduces the total heating energy consumption by 20.7% and decreases the associated greenhouse gas and pollutant emissions by 20.6%.
(4)
Despite demonstrating valid technical and economic viability, the current study relies on simplified isothermal phase transition models and localized meteorological boundaries in Tianjin. Future investigations will prioritize full-scale, long-term experimental validations under diverse dynamic climatic conditions to broaden the applicability of these findings.

Author Contributions

Conceptualization, Y.S., L.W. and J.C.; Methodology, Y.Z. and B.X.; Software, Y.S.; Validation, X.K.; Formal Analysis, Y.Z. and B.X.; Data Curation, L.W.; Writing—Original Draft, Y.S. and B.X.; Writing—Review and Editing, Y.Z. and B.X.; Visualization, J.C.; Supervision, X.K.; Funding Acquisition, B.X. and X.K. All authors have read and agreed to the published version of the manuscript.

Funding

This study was financially supported by the National Natural Science Foundation of China (No. 52478086, No. 52508110), Science and Technology Research Project of Colleges and Universities in Hebei Province (No. QN2025229, No. CXY2024026), and Central-Local Cooperation Program (No. 246Z4510G).

Data Availability Statement

The original contributions presented in this study are included in the article. Further inquiries can be directed to the corresponding author.

Conflicts of Interest

The authors declare no conflicts of interest.

Nomenclature

Abbreviations
SAHPsolar-assisted air source heat pump
CLHScascaded latent heat storage
LHSlatent heat storage
ASHPair-source heat pump
TESthermal energy storage
PCMphase change material
SLHSsingle latent heat storage
MAEmean absolute error
MAPEmean absolute percentage error
Symbols
Asurface area vector of control volume, m2
cspecific heat, J/(kg·K)
hheat transfer coefficient between fluid and PCM, W/(m·K)
Llatent heat of PCM, J/(kg·K)
mthe number of units
nthe number of collected data
Qthe heat storage capacity of the device, MJ
Δtrecording time interval, h
rradius of heat exchange tube, m
m ˙ the mass flow rate, kg/h
r the radius of the latent heat storage device, m
SSRsquare sum regression
SSEerror sum of squares
Ttemperature, K
Vcontrol volume, m3
Greek symbols
ρdensity, kg/m3
λthermal conductivity, W/(m·K)
Subscripts
eequivalent
ssolid
lliquid
meltphase transition temperature
HSheat storage
wwater
ininlet
ithe number of data
jthe number of LHS unit
outoutlet
initialinitial state

References

  1. Liu, J. China’s renewable energy law and policy: A critical review. Renew. Sustain. Energy Rev. 2019, 99, 212–219. [Google Scholar] [CrossRef] [Scilit]
  2. Zhang, D.; Wang, J.; Lin, Y. Present situation and future prospect of renewable energy in China. Renew. Sustain. Energy Rev. 2017, 76, 865–871. [Google Scholar] [CrossRef] [Scilit]
  3. Gao, Y.; Meng, X. A comprehensive review of integrating phase change materials in building bricks: Methods, performance and applications. J. Energy Storage 2023, 62, 106913. [Google Scholar] [CrossRef] [Scilit]
  4. Allouhi, A.; El Fouih, Y.; Kousksou, T. Energy consumption and efficiency in buildings: Current status and future trends. J. Clean. Prod. 2015, 109, 118–130. [Google Scholar] [CrossRef] [Scilit]
  5. Ma, Z.; Awan, B.; Lu, M. An Overview of Emerging and Sustainable Technologies for Increased Energy Efficiency and Carbon Emission Mitigation in Buildings. Buildings 2023, 13, 2658. [Google Scholar] [CrossRef] [Scilit]
  6. Suberu, M.; Mustafa, M.; Bashir, N. Energy storage systems for renewable energy power sector integration and mitigation of intermittency. Renew. Sustain. Energy Rev. 2014, 35, 499–514. [Google Scholar] [CrossRef] [Scilit]
  7. Kittner, N.; Lill, F.; Kamen, D. Energy storage deployment and innovation for the clean energy transition. Nat. Energy 2017, 2, 649–653. [Google Scholar] [CrossRef] [Scilit]
  8. Liu, S.; Wan, Z.; Wang, Z. Comprehensive evaluation of an integrated solar-air source heat pump in efficiency enhancement and frost resistance. Appl. Therm. Eng. 2025, 280, 128374. [Google Scholar] [CrossRef] [Scilit]
  9. Wan, Z.; Li, P.; Liu, S. Operation optimization and performance analysis of multi-mode solar-air source heat pump combined heating system. Appl. Therm. Eng. 2026, 282, 128783. [Google Scholar] [CrossRef] [Scilit]
  10. Mahon, H.; O’Connor, D.; Friedrich, D. A review of thermal energy storage technologies for seasonal loops. Energy 2022, 239, 122207. [Google Scholar] [CrossRef] [Scilit]
  11. Jouhara, H.; Abnieńska-Góra, A.; Khordehgah, N. Latent Thermal Energy Storage Technologies and Applications: A Review. Int. J. Thermofluids 2020, 5–6, 100039. [Google Scholar] [CrossRef] [Scilit]
  12. Ali, E.; Ajbar, A.; Lamrani, B. Numerical Investigation of Thermal Energy Storage Systems for Collective Heating of Buildings. Buildings 2024, 14, 141. [Google Scholar] [CrossRef] [Scilit]
  13. Verda, V.; Colella, F. Seasonal Thermal Energy Storage for District Heating: A Review of Techno-Economic Performance. Buildings 2023, 13, 2670. [Google Scholar]
  14. Sarbu, I.; Dorca, A. Review on heat transfer analysis in thermal energy storage using latent heat storage systems and phase change materials. Int. J. Energy Res. 2019, 43, 29–64. [Google Scholar] [CrossRef] [Scilit]
  15. Cabeza, L.F.; de Gracia, A. Thermal Energy Storage for Building Decarbonization: Current Status and Future Perspectives. Buildings 2022, 12, 1987. [Google Scholar]
  16. Lebedev, V.; Amer, A. Limitations of using phase change materials for thermal energy storage. IOP Conf. Ser. Earth Environ. Sci. 2019, 378, 12044–12048. [Google Scholar] [CrossRef] [Scilit]
  17. Nomura, T.; Okinaka, N.; Akiyama, T. Technology of latent heat storage for high temperature application: A review. ISIJ Int. 2010, 50, 1229–1239. [Google Scholar] [CrossRef] [Scilit]
  18. Lin, W.; Yao, X.; Zhao, W. Pathways to Carbon Neutrality in the Built Environment: Phase Change Materials. Green Carbon 2024, 2, 197–204. [Google Scholar] [CrossRef] [Scilit]
  19. Qu, M.; Tang, Y.; Zhang, T. Experimental investigation on the multi-mode heat discharge process of a PCM heat exchanger during TES based reverse cycle defrosting using in cascade air source heat pumps. Appl. Therm. Eng. 2019, 151, 154–162. [Google Scholar] [CrossRef] [Scilit]
  20. Gao, J.; Li, S.; Wu, F. Study on efficient heating method by solar coupled air source heat pump system with phase change heat storage in severe cold region. Appl. Energy 2024, 367, 123206. [Google Scholar] [CrossRef] [Scilit]
  21. Wu, J.; Xian, T.; Liu, X. All-weather characteristic studies of a direct expansion solar integrated air source heat pump system based on PCMs. Sol. Energy 2019, 191, 34–45. [Google Scholar] [CrossRef] [Scilit]
  22. Kanimozhi, B.; Bapu, B.; Pranesh, V. Thermal energy storage system operating with phase change materials for solar water heating applications: DOE modelling. Appl. Therm. Eng. 2017, 123, 614–624. [Google Scholar] [CrossRef] [Scilit]
  23. Shailendra, S.; Abhishek, A.; Amritanshu, S. Numerical Analysis of Phase Change and Container Materials for Thermal Energy Storage in the Storage Tank of Solar Water Heating System. J. Therm. Sci. 2024, 33, 408–421. [Google Scholar]
  24. Li, Y.; Liang, J.; Chen, W. Optimal design of a solar-assisted heat pump system with PCM tank for swimming pool utilization. Renew. Energy 2025, 240, 122272. [Google Scholar] [CrossRef] [Scilit]
  25. Kong, X.; Liu, Y.; Li, H. Optimization of solar-air source heat pump heating system with phase change heat storage. Appl. Therm. Eng. 2024, 245, 1222897. [Google Scholar] [CrossRef] [Scilit]
  26. Lu, S.; Zhai, X.; Gao, J. Performance optimization and experimental analysis of a novel low-temperature latent heat thermal energy storage device. Energy 2022, 239, 122496. [Google Scholar] [CrossRef] [Scilit]
  27. Tao, Y.; He, Y. A review of phase change material and performance enhancement method for latent heat storage system. Renew. Sustain. Energy Rev. 2018, 93, 245–259. [Google Scholar] [CrossRef] [Scilit]
  28. Xu, H.; Zhao, J. Analytical considerations on optimization of cascaded heat transfer process for thermal storage system with principles of thermodynamics. Renew. Energy 2019, 132, 826–845. [Google Scholar] [CrossRef] [Scilit]
  29. Liu, L.; Shao, S. Recent advances of low-temperature cascaded latent energy storage technology: A state-of-the-art review. Renew. Sustain. Energy Rev. 2023, 186, 113641. [Google Scholar] [CrossRef] [Scilit]
  30. Farid, M.; Khalaf, A. Performance of direct contact latent heat storage units with two hydrated salts. Sol. Energy 1994, 52, 179–189. [Google Scholar] [CrossRef] [Scilit]
  31. Farid, M.; Kim, Y.; Kansawa, A. Thermal Performance of a Heat Storage Module Using PCM’s with Different Melting Temperature: Experimental. J. Sol. Energy Eng. 1990, 112, 125–131. [Google Scholar] [CrossRef] [Scilit]
  32. Bagherzadeh, K.; Piroozmand, V.; Ahmadi, R. Cascading latent heat thermal energy storage in parabolic trough solar collector as a promising solution: An experimental investigation. Energy Convers. Manag. 2024, 300, 117942. [Google Scholar] [CrossRef] [Scilit]
  33. Gelman, A. Analysis of Variance. In Microeconometrics; Palgrave Macmillan: London, UK, 2010; pp. 339–347. [Google Scholar]
  34. Sari, A.; Kaygusuz, K. Thermal performance of palmitic acid as a phase change energy storage material. Energy Convers. Manag. 2002, 43, 863–876. [Google Scholar] [CrossRef] [Scilit]
  35. Regin, A.; Solanki, S.; Saini, J. Latent heat thermal energy storage using cylindrical capsule: Numerical and experimental investigations. Renew. Energy 2006, 31, 2025–2041. [Google Scholar] [CrossRef] [Scilit]
  36. Tay, N.; Belusko, S.; Bruno, F. An effectiveness-NTU technique for characterising tube-in-tank phase change thermal energy storage systems. Appl. Energy 2012, 91, 309–319. [Google Scholar] [CrossRef] [Scilit]
  37. Fu, S.; Wang, L.; Long, H. Research on the optimization of the clean heating system for regional residential buildings based on the multi-objective optimization strategy. Front. Energy Res. 2024, 12, 1374369. [Google Scholar] [CrossRef] [Scilit]
  38. Wang, X.; Jia, Y.; Zuo, D. Study on Optimization of Two-Stage latent heat storage Coupled Solar-Air Source Heat Pump Heating System in Severe Cold Region. Energy Eng. 2025, 122, 1603–1627. [Google Scholar] [CrossRef] [Scilit]
  39. Wang, L.; Yuan, J.; Qiao, X.; Kong, X. Optimal rule based double predictive control for the management of thermal energy in a distributed clean heating system. Renew. Energy 2023, 215, 118924. [Google Scholar] [CrossRef] [Scilit]
Figure 1. Diagram of CLHS device.
Buildings 16 01541 g001
Figure 2. Diagram of CLHS device.
Buildings 16 01541 g002
Figure 3. Diagram of the experimental system and internal measuring points layout of the LHS unit.
Buildings 16 01541 g003
Figure 4. Diagram of graded heating system.
Buildings 16 01541 g004
Figure 5. Diagram of non-preheated solar-air source heat pump coupled CLHS.
Buildings 16 01541 g005
Figure 6. Outdoor temperature variation during the heating season.
Buildings 16 01541 g006
Figure 7. System operation strategy.
Buildings 16 01541 g007
Figure 8. Optimization flow chart.
Buildings 16 01541 g008
Figure 9. Comparison of experimental and simulated outlet water temperatures of a single PCM60 unit under an inlet water temperature of 80 °C.
Buildings 16 01541 g009
Figure 10. Liquid fraction and temperature distribution of CLHS and SLHS.
Buildings 16 01541 g010
Figure 11. LHS units temperatures under different flow rates.
Buildings 16 01541 g011
Figure 12. Inlet/outlet temperatures of LHS units under different flow rates.
Buildings 16 01541 g012
Figure 13. LHS units temperatures under different fluid temperatures.
Buildings 16 01541 g013
Figure 14. Inlet/outlet temperatures of LHS units under different fluid temperatures.
Buildings 16 01541 g014
Figure 15. Thermal energy distribution of CLHS.
Buildings 16 01541 g015
Figure 16. Operation analysis of CLHS and hierarchical heating system.
Buildings 16 01541 g016
Figure 17. Operating cost of components.
Buildings 16 01541 g017
Figure 18. Comparison of ASHP with and without preheating.
Buildings 16 01541 g018
Figure 19. Inlet temperatures of ASHP with and without preheating.
Buildings 16 01541 g019
Figure 20. Operation results before and after optimization.
Buildings 16 01541 g020
Figure 21. Pollutant discharge per unit area before and after optimization.
Buildings 16 01541 g021
Table 1. Phase change material properties.
PCMMelting ProcessFreezing ProcessThermal ConductivityDensity
T (°C)ΔHm (J/g)c (J/(g·°C))T (°C)ΔHm (J/g)c (J/(g·°C))λ (W/(m·K))ρ (g/cm3)
PCM2522.45195.261.4524.85196.832.010.42420.9531
PCM4241.63218.421.4842.95210.582.510.30980.9301
PCM6060.68206.471.4861.29211.542.460.29850.9226
Table 2. Summary of experimental operating conditions.
Experimental GroupInitial Temperature (°C)Inlet Fluid Temperature (°C)Water Flow Rate (L/h)
Effect of flow rate157518
157536
157554
Effect of inlet temperature157554
158054
158554
Table 3. Main parameters of the simulation system.
ComponentsParametersNumericUnit
Heating buildingsheating area2150m2
External wall heat transfer coefficient0.450W/(m2·K)
External window heat transfer coefficient1.01W/(m2·K)
Roof heat transfer coefficient0.249W/(m2·K)
Ground heat transfer coefficient0.629W/(m2·K)
Floor heat transfer coefficient0.255W/(m2·K)
Concentrating solar collectorsInstallation angle40°
Land area occupied by solar collectors400m2
PCM25Weight1500kg
PCM42Weight3320kg
PCM60Weight6540kg
ASHPHeating power86kW
FanAir volume13,300m3/h
Table 4. System monitoring points.
ParametersData Source
T1Solar collector outlet temperature
T2Solar collector inlet temperature
T3Circulating water tank water temperature
T4Outlet temperature of PCM 60 unit
T5Outlet temperature of PCM 42 unit
T6Outlet temperature of PCM 25 unit
T7Average temperature inside the PCM 60 unit
T8Average temperature inside the PCM 42 unit
T9Average temperature inside the PCM 25 unit
T10inlet water temperature of ASHP
T11outlet water temperature of ASHP
TWAmbient temperature
Disclaimer/Publisher’s Note: The statements, opinions and data contained in all publications are solely those of the individual author(s) and contributor(s) and not of MDPI and/or the editor(s). MDPI and/or the editor(s) disclaim responsibility for any injury to people or property resulting from any ideas, methods, instructions or products referred to in the content.