3.1. Experimental Observations of Freeze–Thaw Deterioration
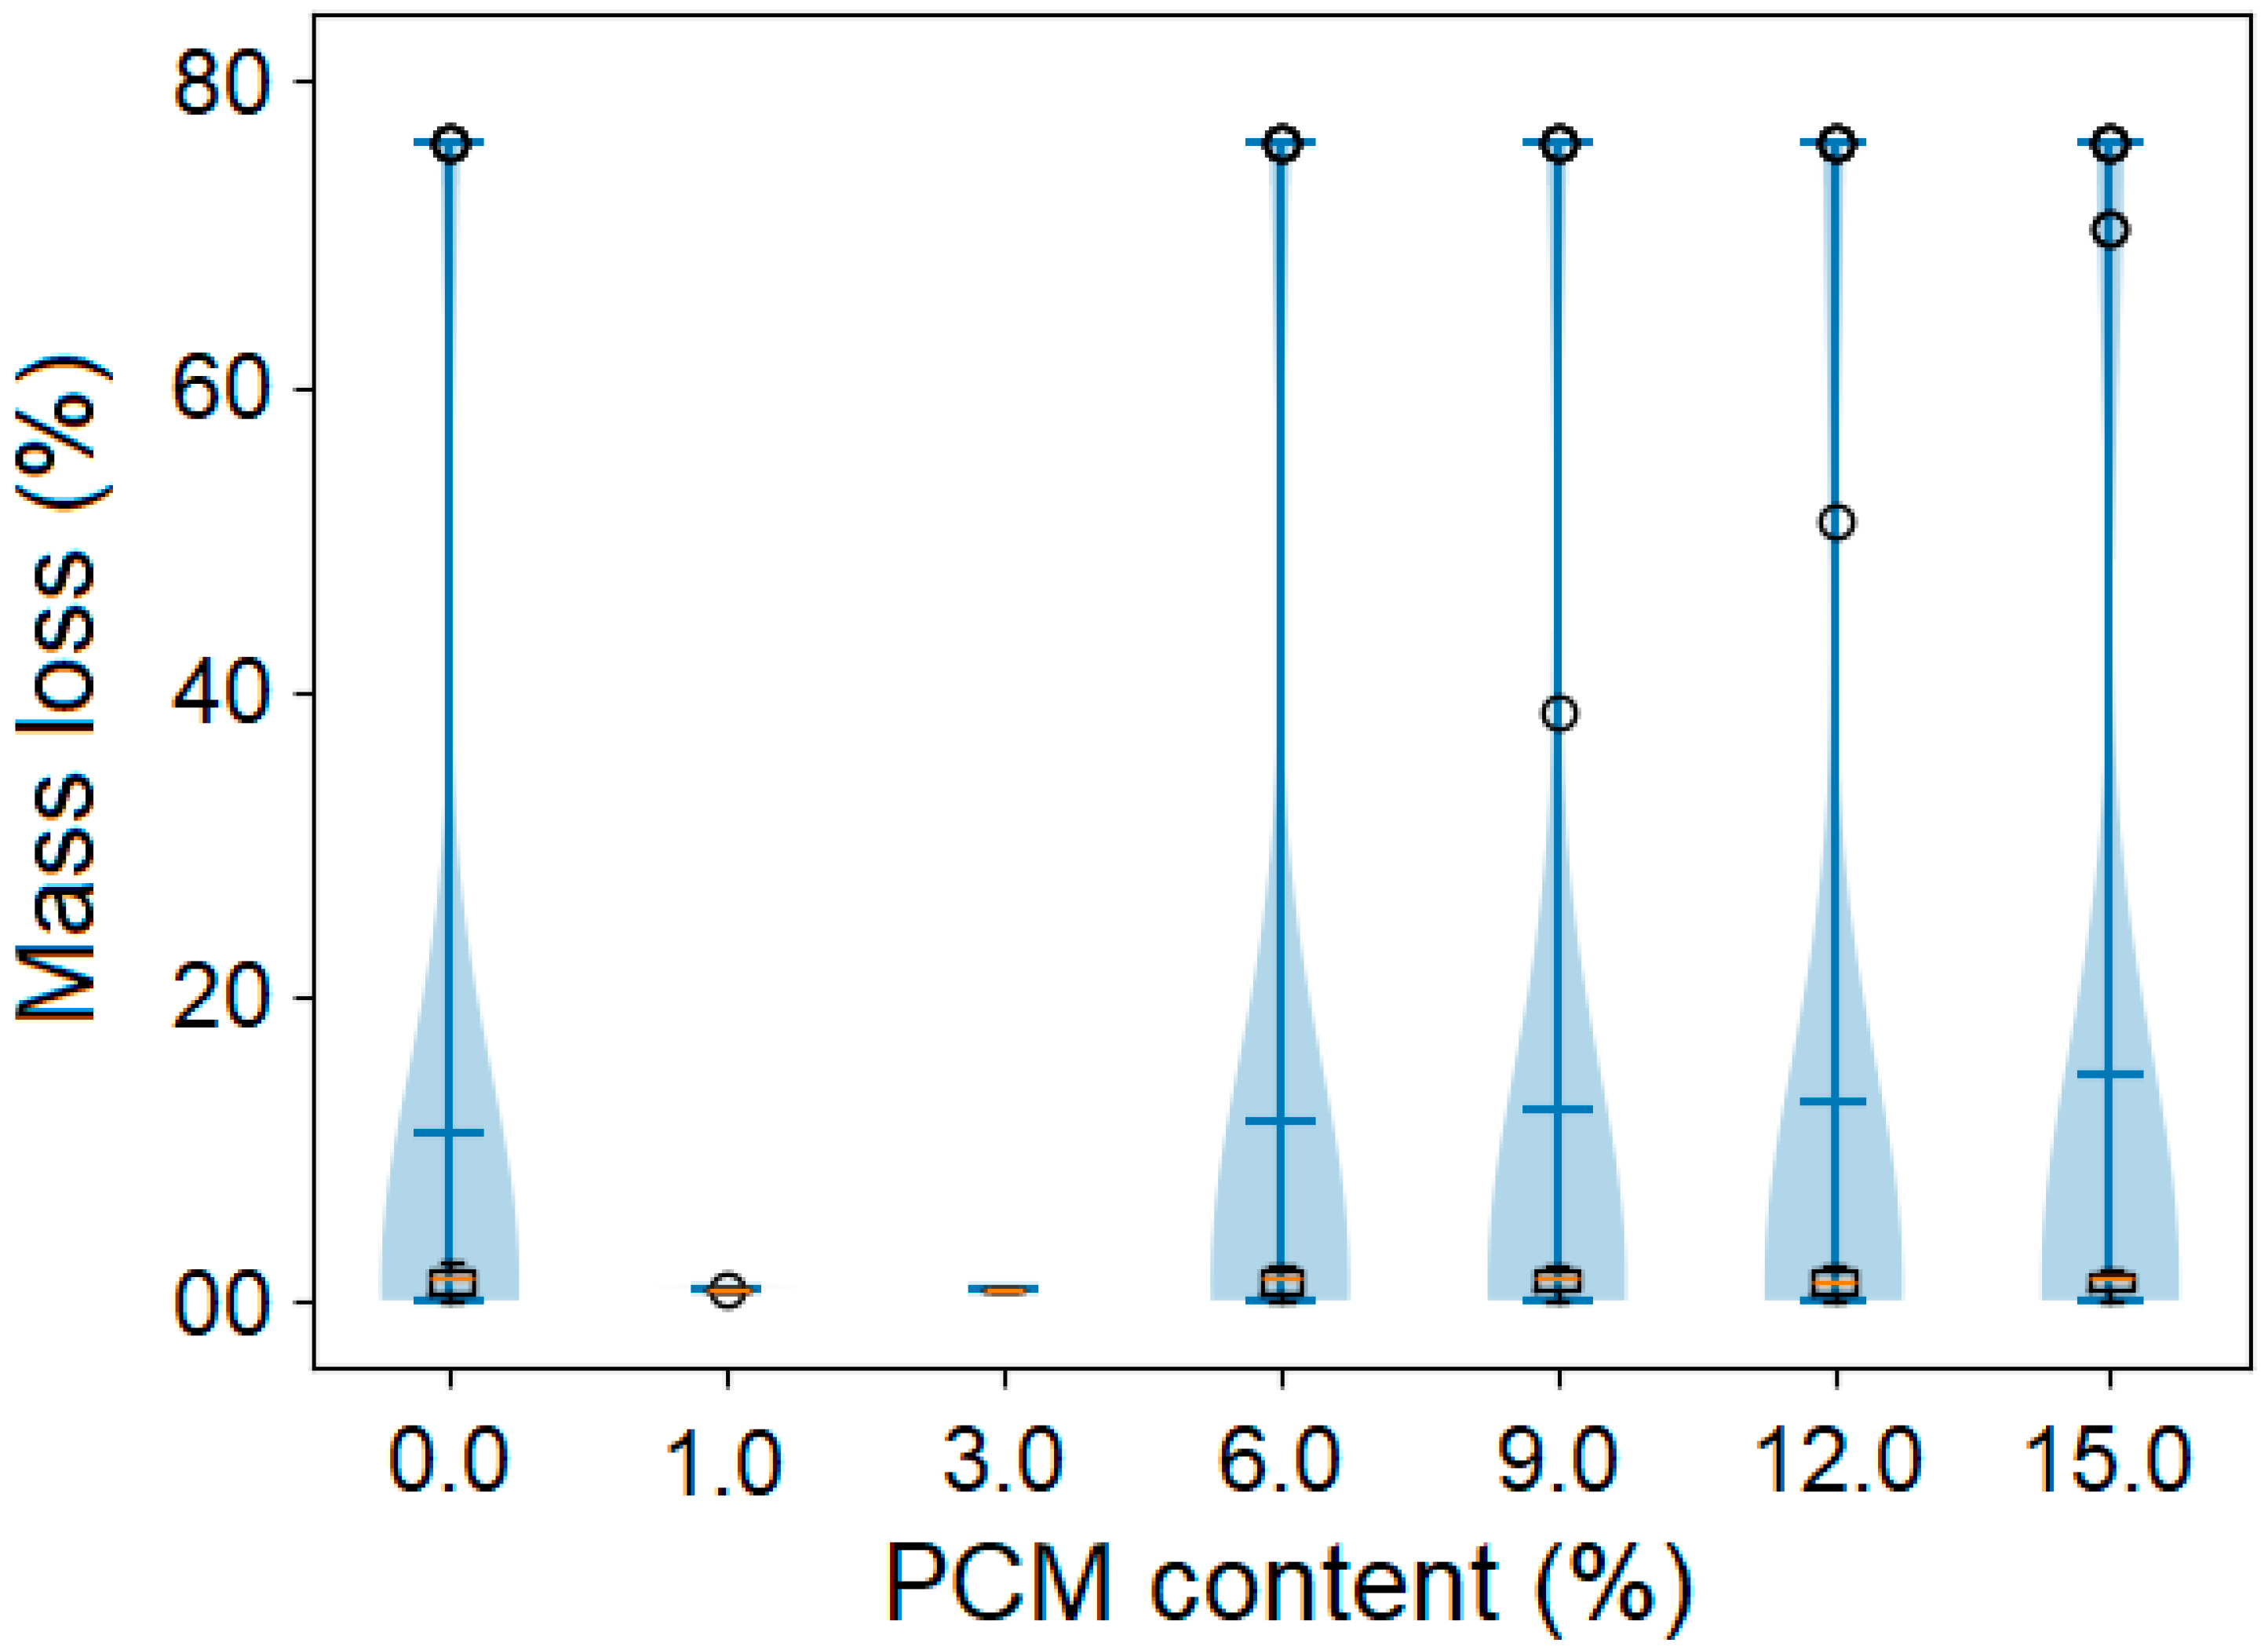
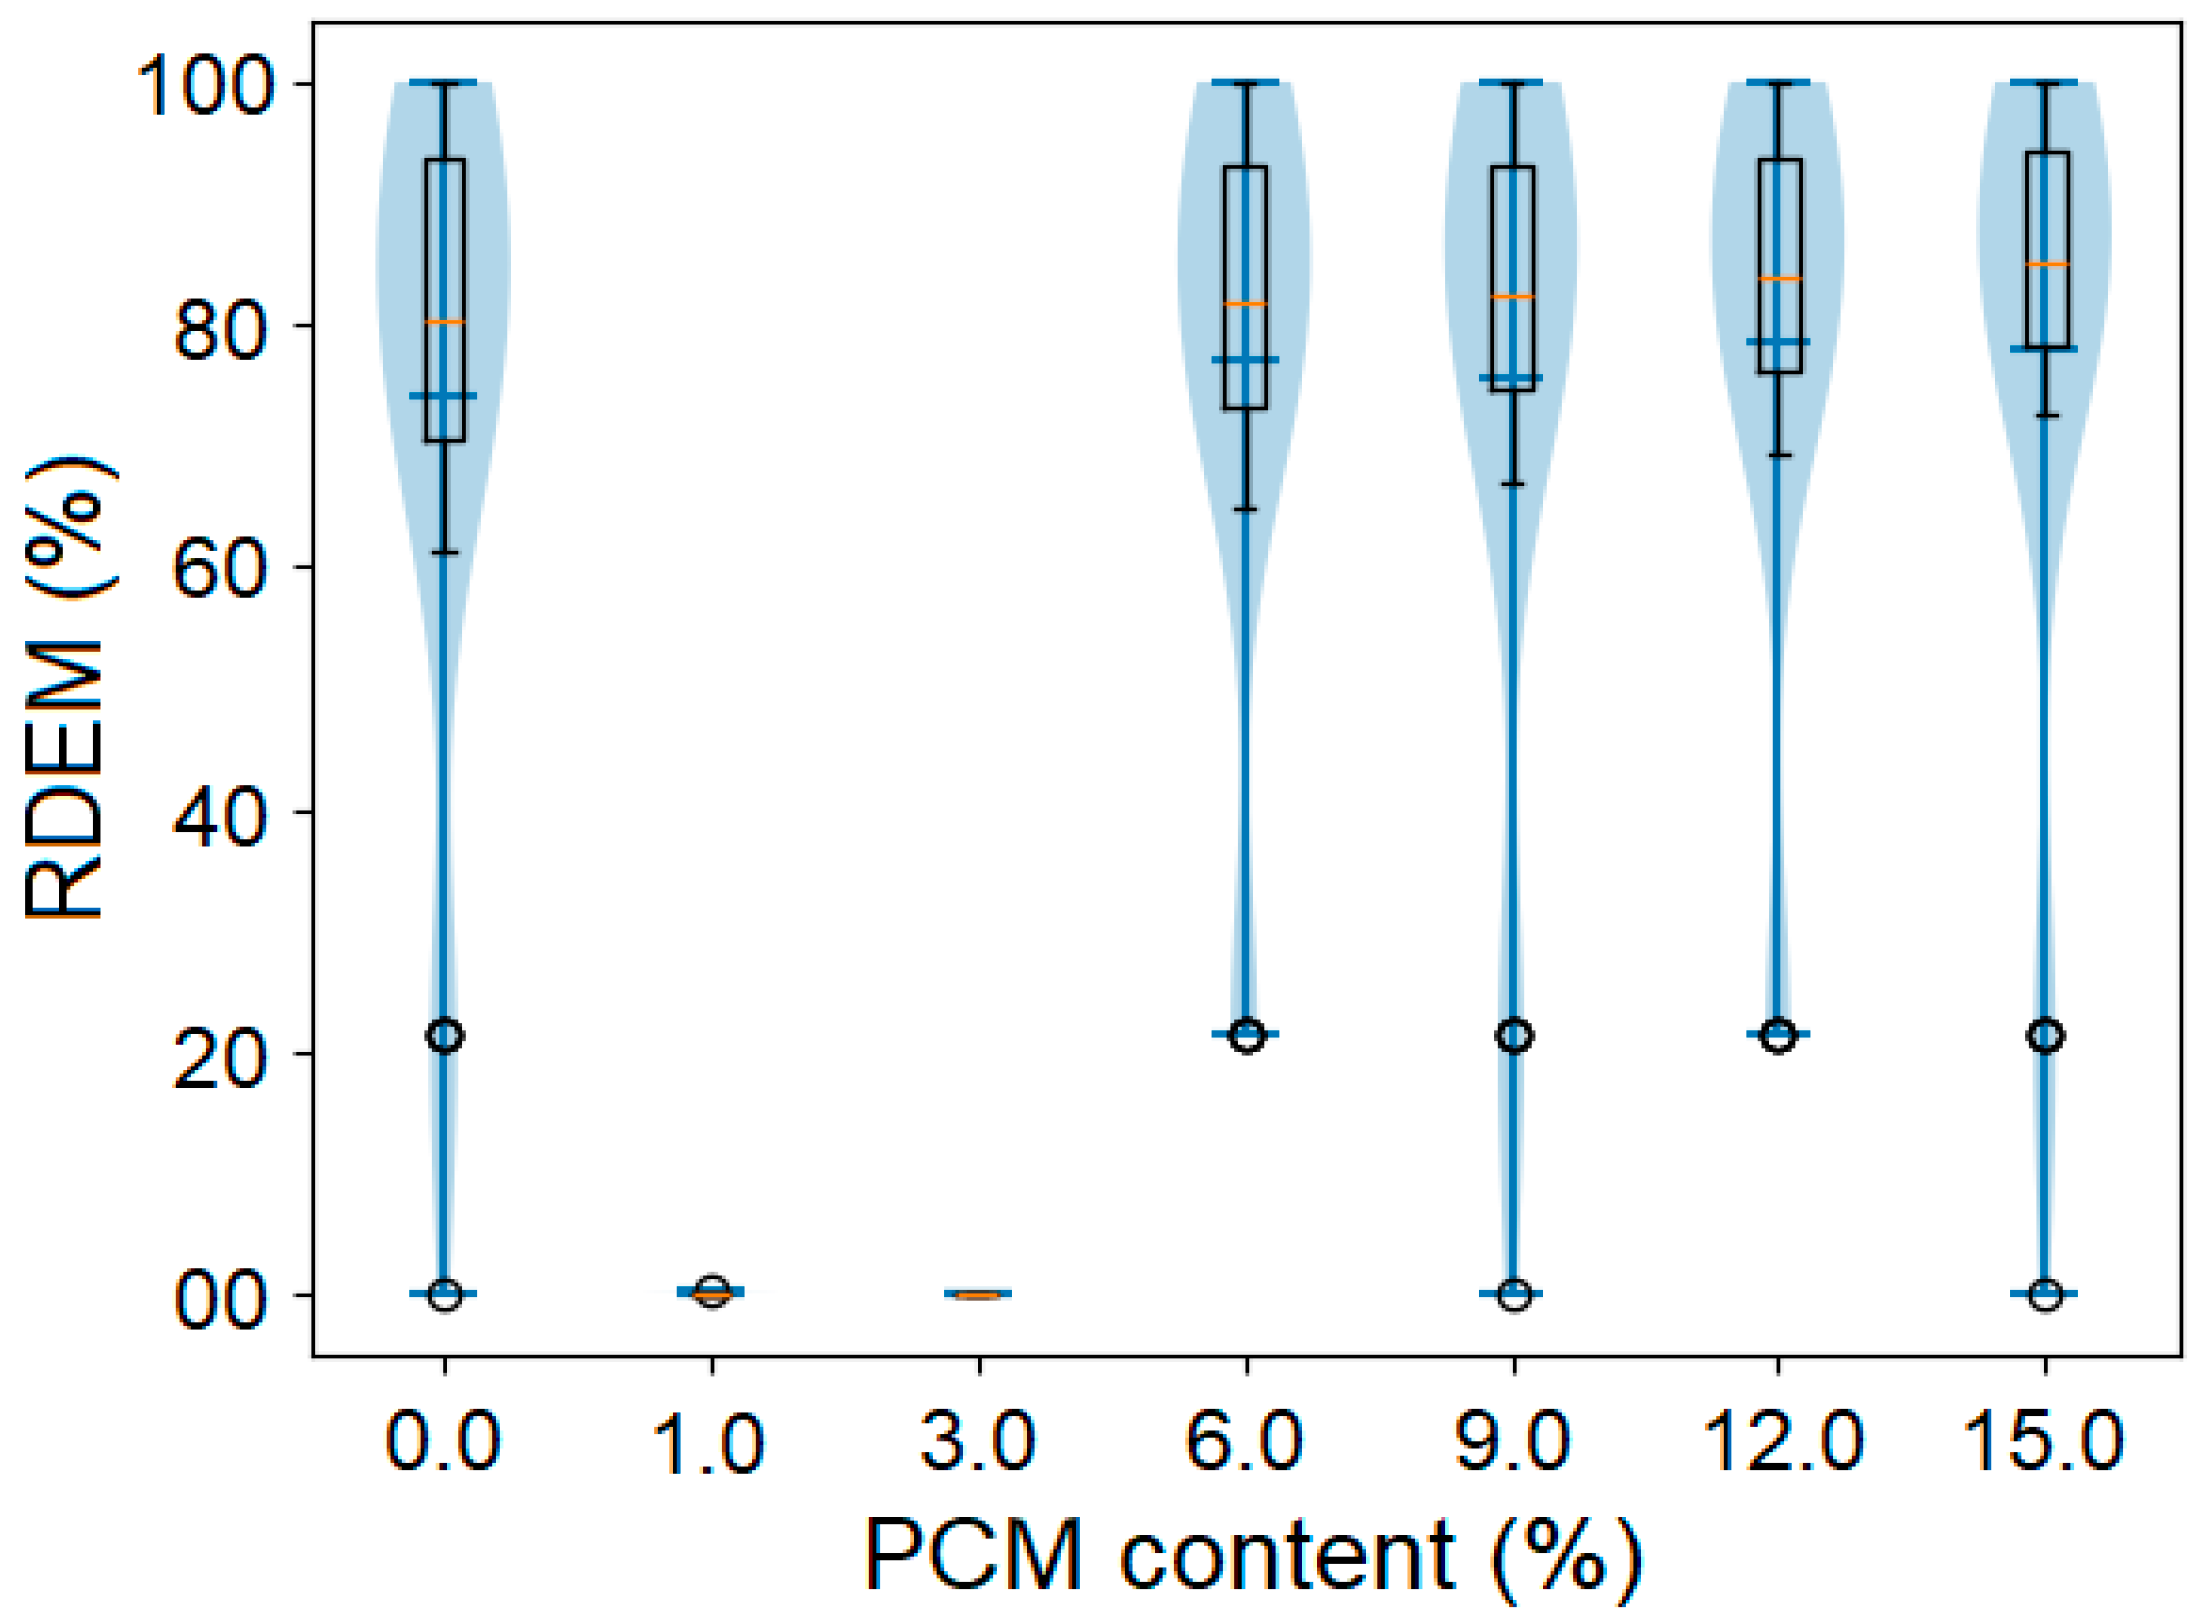
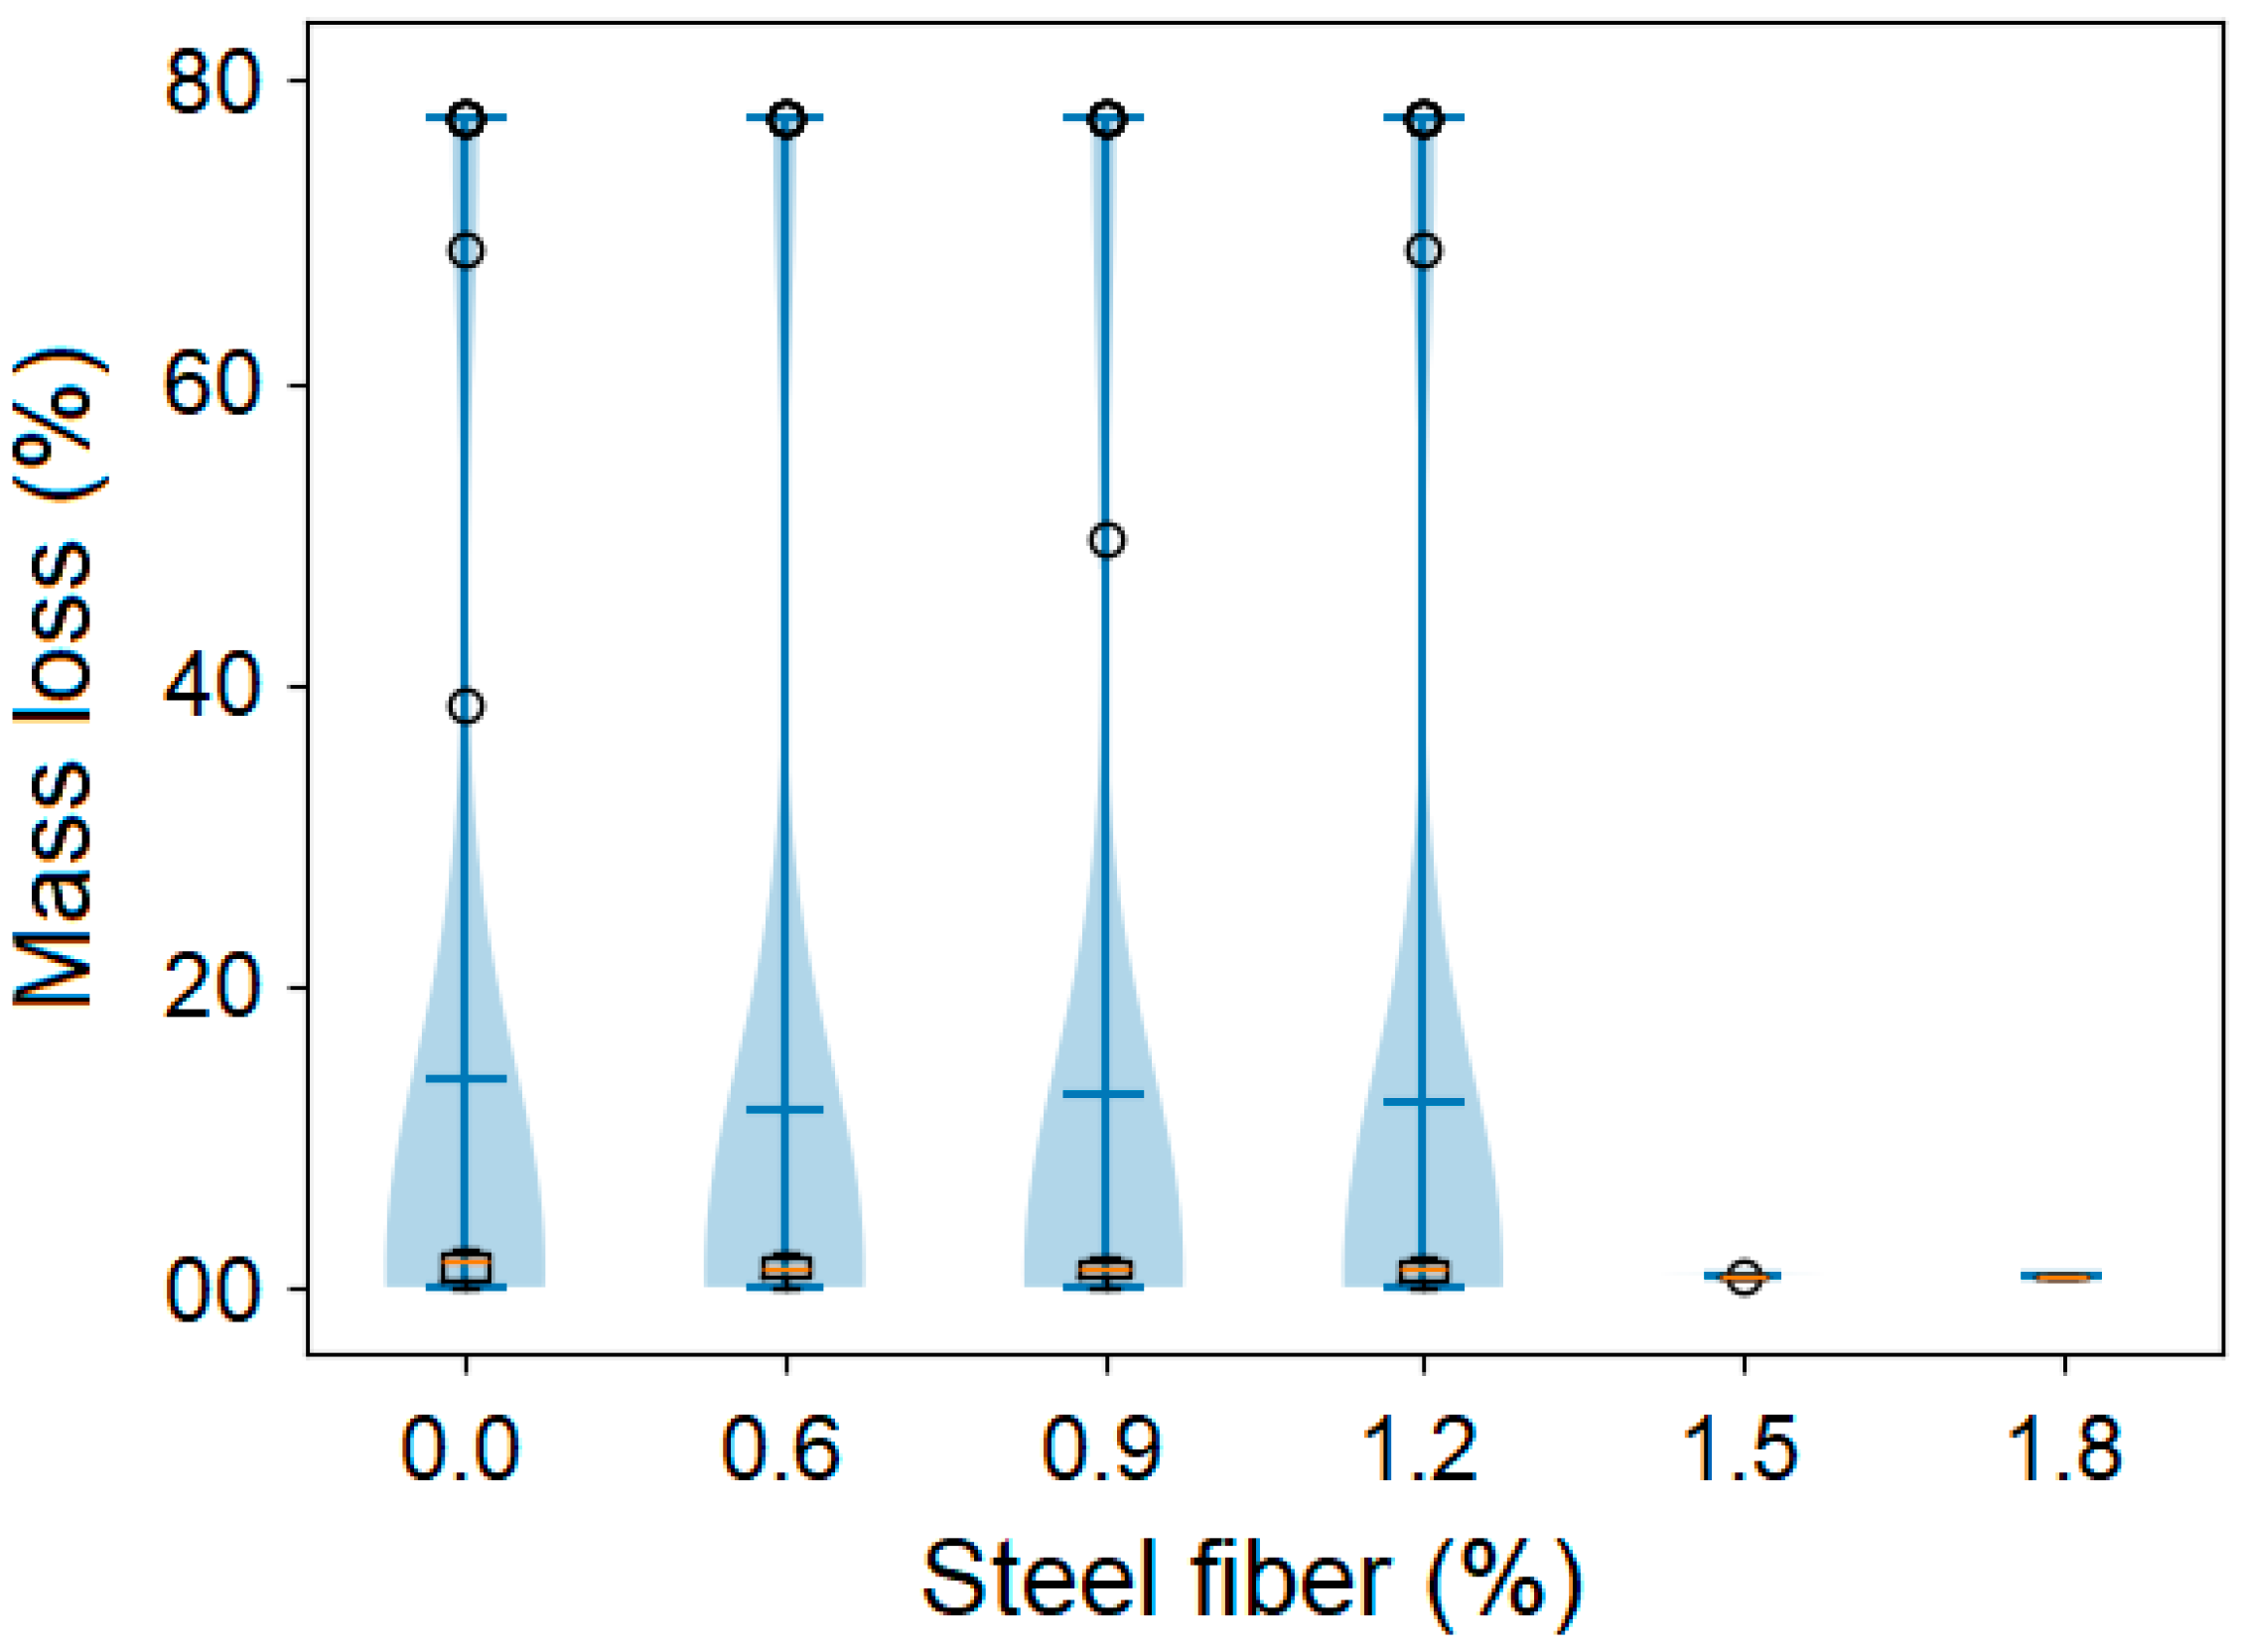
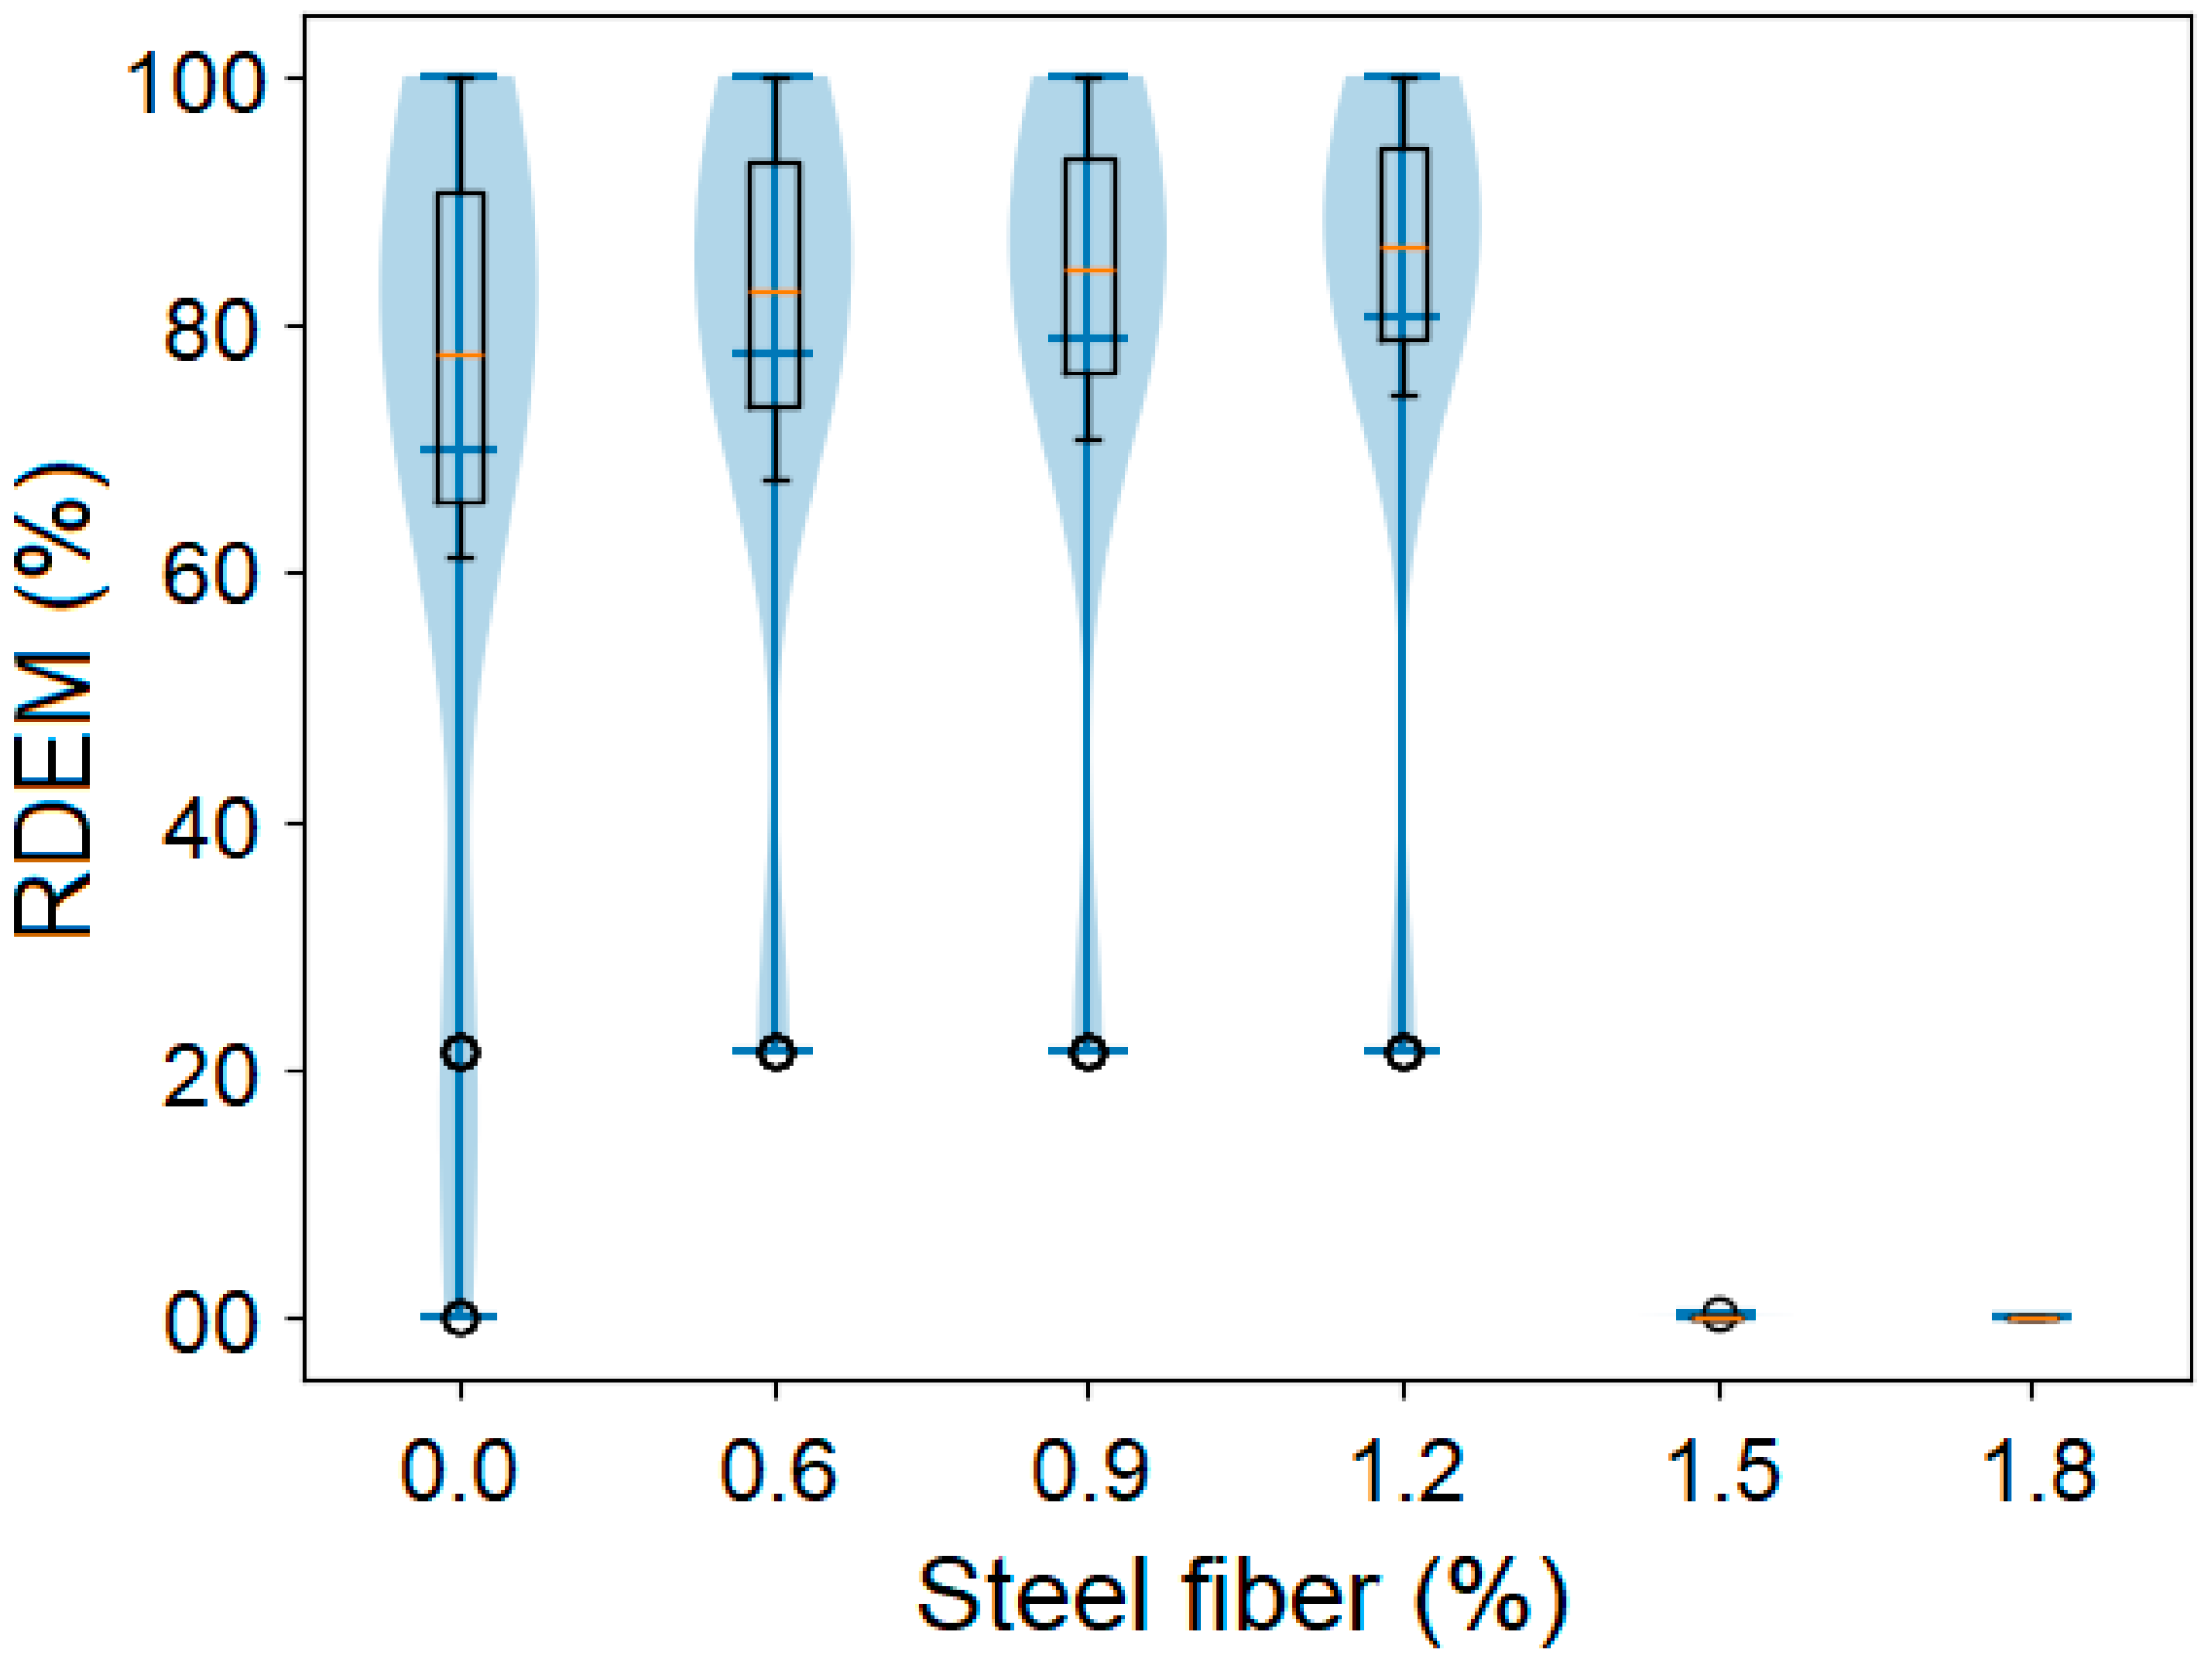
Freeze–thaw deterioration of steel fibre-reinforced phase-change concrete of the concrete was systematically observed through loss in mass and relative dynamic modulus measurements at periodic intervals up to the point of 300 cycles. The experimental results showed that there were unique deterioration trends depending on PCM content, as well as the dosage of steel fibre (
Figure A4 (
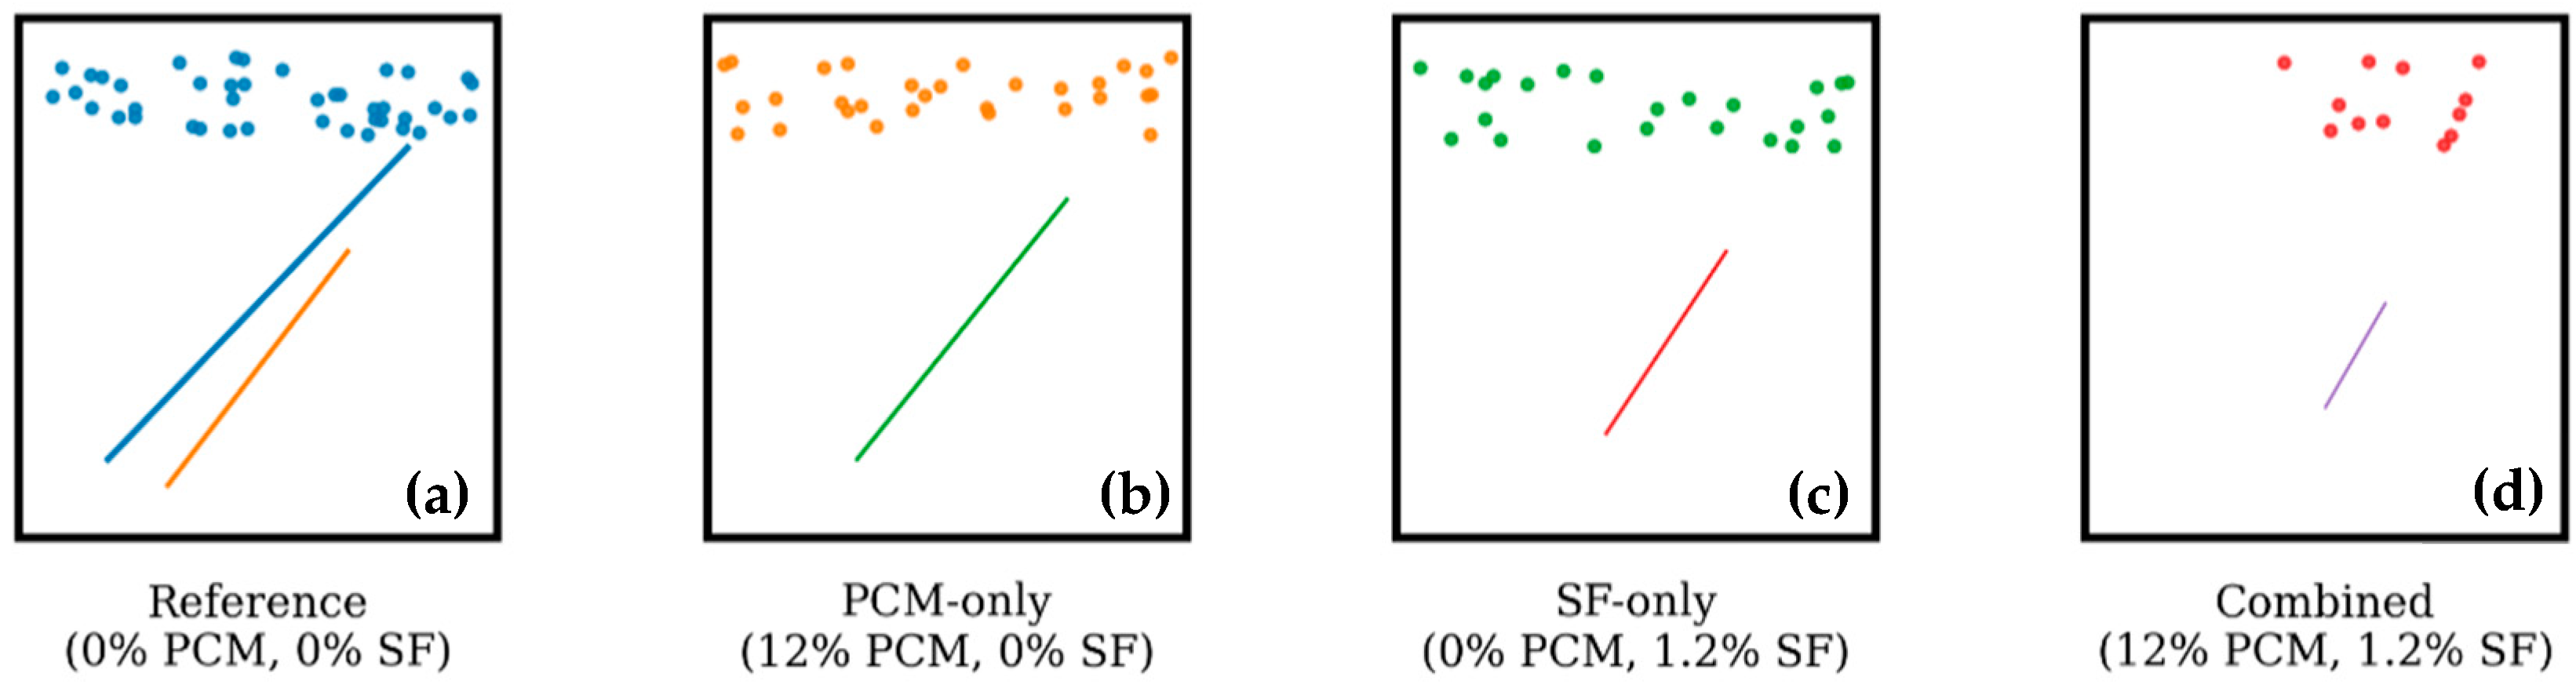
Appendix F)). In addition to the mean values, the variability of the measurements was investigated in order to determine statistical reliability. The comparatively low standard deviation and coefficient of variation reported among repeated specimens suggest that the experimental results are reliable and repeatable. This validates the reported freeze–thaw performance trends across various mix settings. Representative deterioration patterns after 300 freeze–thaw cycles are shown in
Figure A4 (
Appendix F), providing visual evidence of surface damage and material degradation under different mix configurations.
3.1.1. Mass Loss Evolution
In all mixtures, mass loss, which measures surface scaling and material breakdown, increased gradually with freeze–thaw cycles. Nonetheless, the material’s composition had a significant influence on the mass loss rate and quantity. The reference combination (0% PCM, 0% SF) was the most degraded, with a mass loss of 2.45, which was close to the F300 specification threshold of 5, but still within acceptable limits. Mass loss was also decreased to 2.12% by PCM alone at 12%, representing a 13.5% improvement over the reference. The given enhancement is related to PCM’s thermal regulation effect, which minimises the severity of strains encountered during freezing and softens internal temperature gradients.
Steel fibre reinforcement alone at 1.2% proved to be more effective, reducing mass loss to 1.98–19.2% less than average. The capacity of steel fibres to fill cracks avoids the formation of microcracks and their coalescence to generate spalling on the surface, which explains their excellent performance. The most significant improvement was noticed in compounded combinations. Although the extreme-performance configuration (12% PCM + 1.2% SF) reduced mass loss to 1.87, a 23.7% improvement over the reference, the economical design (9% PCM + 0.9% SF) performed best, with a mass loss of 1.95.
Interestingly, the growth of mass loss in all mixes follows a three-stage pattern, with a sluggish buildup period (0–100 cycles), an enhanced degradation phase (100–250 cycles), and final stability (250–300 cycles). This pattern demonstrates the damage induced by freeze–thaw as progressive, with initial microcrack formation increasing over time to a critical point in terms of surface spalling.
3.1.2. Relative Dynamic Modulus Degradation
The relative dynamic modulus of elasticity (RDEM) is a sensitive indicator of internal stiffness deterioration, which has been linked to microcrack formation and propagation inside the cementitious matrix. RDEM degradation, like mass loss, was found to be substantially dependent on PCM and steel fibre composition.
By 300 cycles, the RDEM of the reference mixture had gradually decreased to 61.2, slightly higher than the minimum of 60 at F300 standard. This demonstrates that the reference concrete operates with a moderate safety margin despite the fact that it barely meets the durability requirements. At 300 cycles, the RDEM had increased to 72.6% with the addition of 12% PCM and 74.3% steel fibres alone. Steel fibres’ exceptional performance reflects their mechanical significance in maintaining structural integrity through stress redistribution and microcrack bridging.
The combined arrangements demonstrated a lot of synergy. The 9% PCM + 0.9% SF mixture retained 79.4% and 66.8% of the RDEM after 200 and 300 cycles, respectively. The reference had the highest residual stiffness after 300 cycles, with an RDEM of 72.6% − 18.6% higher than the reference, and the extreme-performance configuration (12% PCM + 1.2% SF). This improved performance indicates that better resistance to internal damage buildup is obtained by the thermomechanical interaction of PCM temperature regulation and steel fibre mechanical reinforcement.
The RDEM degradation curves show that the protective action of PCM and steel fibres is most pronounced at the intermediate and late stages of freeze–thaw exposure (more than 150 cycles), implying that both materials are particularly useful in slowing the formation of microcrack networks once they have emerged.
To evaluate statistical dependability, the variability of the experimental outcomes was closely studied in addition to the average trends. At least three duplicate specimens were evaluated for each mixture and measurement point, and the reported data provide the average response. For both mass loss and RDEM, the coefficient of variation (CV) was generally less than 5%, suggesting low experimental dispersion and strong repeatability.
The tightly regulated boundary conditions used in this investigation, such as a constant water-binder ratio, a uniform curing regime, and consistent workability control, are responsible for the comparatively low variability. These circumstances reduce external sources of variability and guarantee that PCM and steel fibre contents are the main factors influencing the observed variations in durability performance. As a result, the trends found in this investigation can be regarded as reflective of the intrinsic material behaviour and statistically reliable.
The claimed best performance at specified PCM and steel fibre contents can be explained using thermomechanical and microstructural principles. PCM improves thermal control by absorbing and releasing latent heat near the freezing point, which reduces temperature variations and limits ice formation inside the pore structure. This helps to reduce internal hydraulic and osmotic pressures during freeze–thaw cycles. However, increasing PCM content creates soft inclusions, which can increase porosity and weaken the interfacial transition zone (ITZ), lowering mechanical integrity. As a result, there exists an ideal PCM range that maximises thermal benefits while minimising microstructural damage.
Steel fibres address this constraint by increasing crack resistance and ensuring structural continuity. Fibres use fracture-bridging mechanisms to limit microcrack propagation and delay crack coalescence under cyclic stress, increasing resistance to stiffness degradation and mass loss.
3.2. Model Performance Evaluation
3.2.1. Comparative Assessment of ML Algorithms
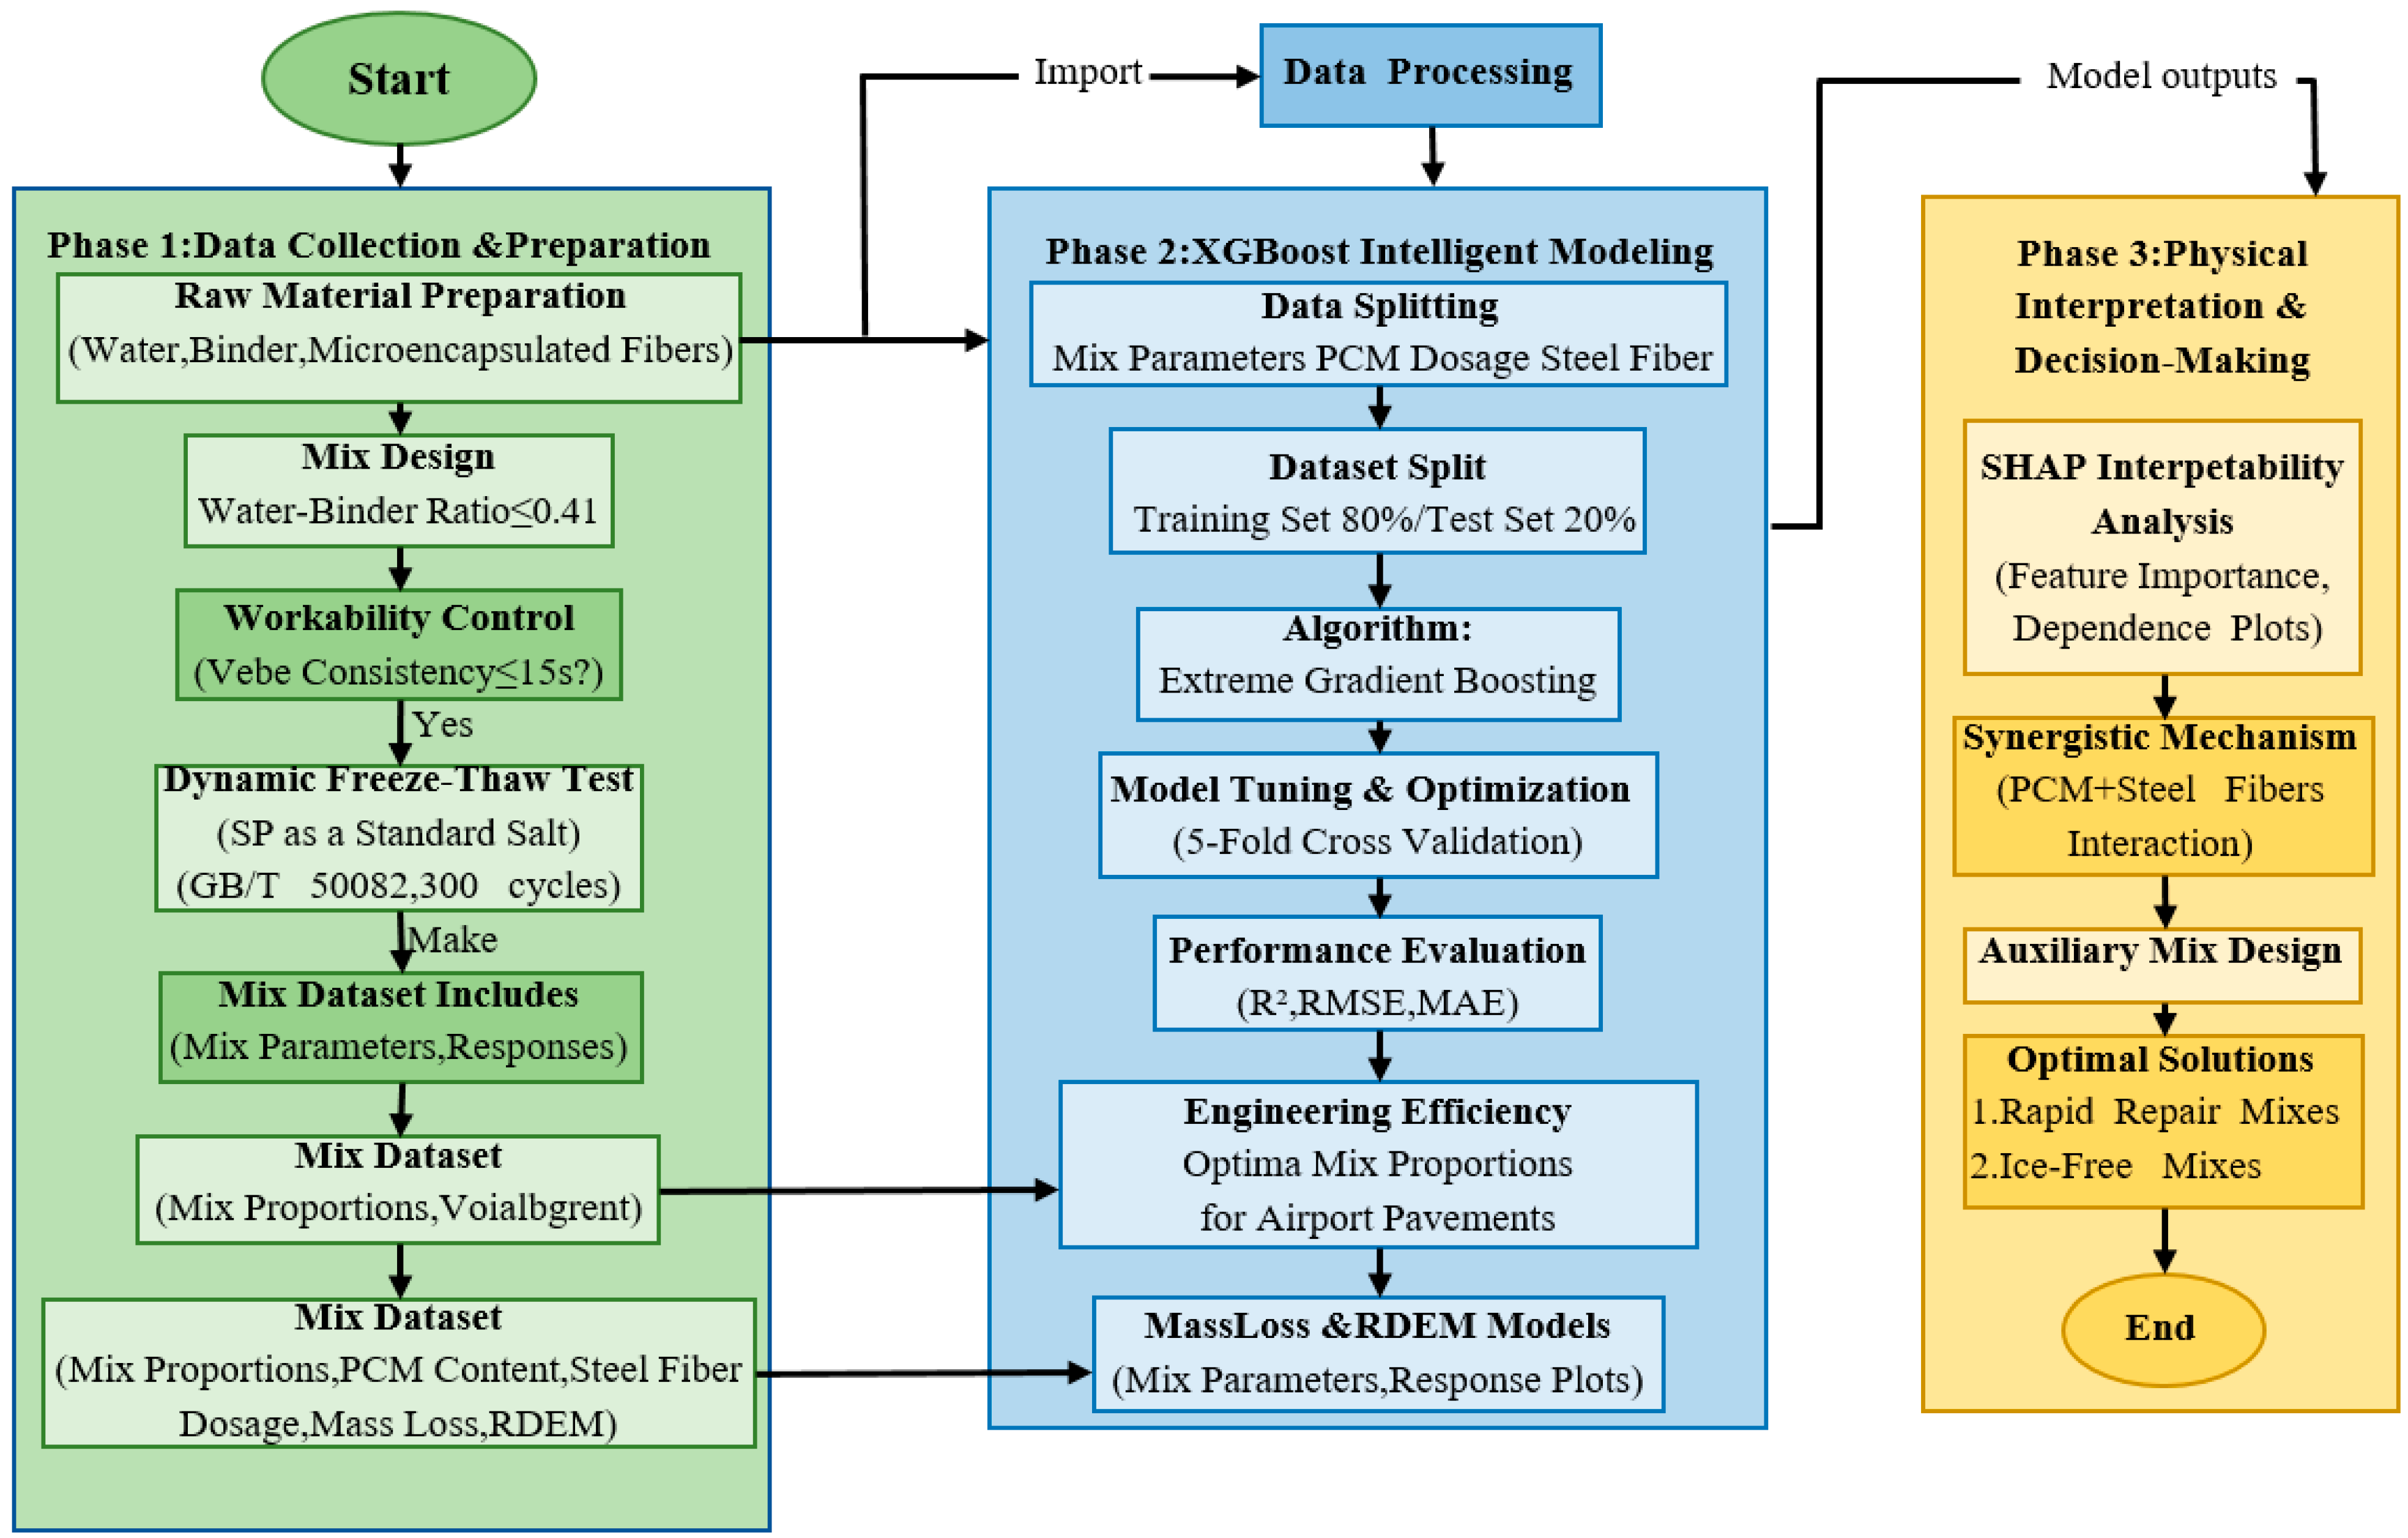
Several well-known regression models were used as a baseline in the comparison study to ensure methodological rigour and support the selection of XGBoost as the primary predictive model. They comprised Artificial Neural Networks (ANNs), Random Forest (RF), Support Vector Regression (SVR), and Linear Regression (LR). To ensure a fair and unbiased comparison, all models were trained under identical settings, with the same dataset split (80% training, 20% testing), input features (Cycles, SF_Vol, PCM_Rep), and performance measures.
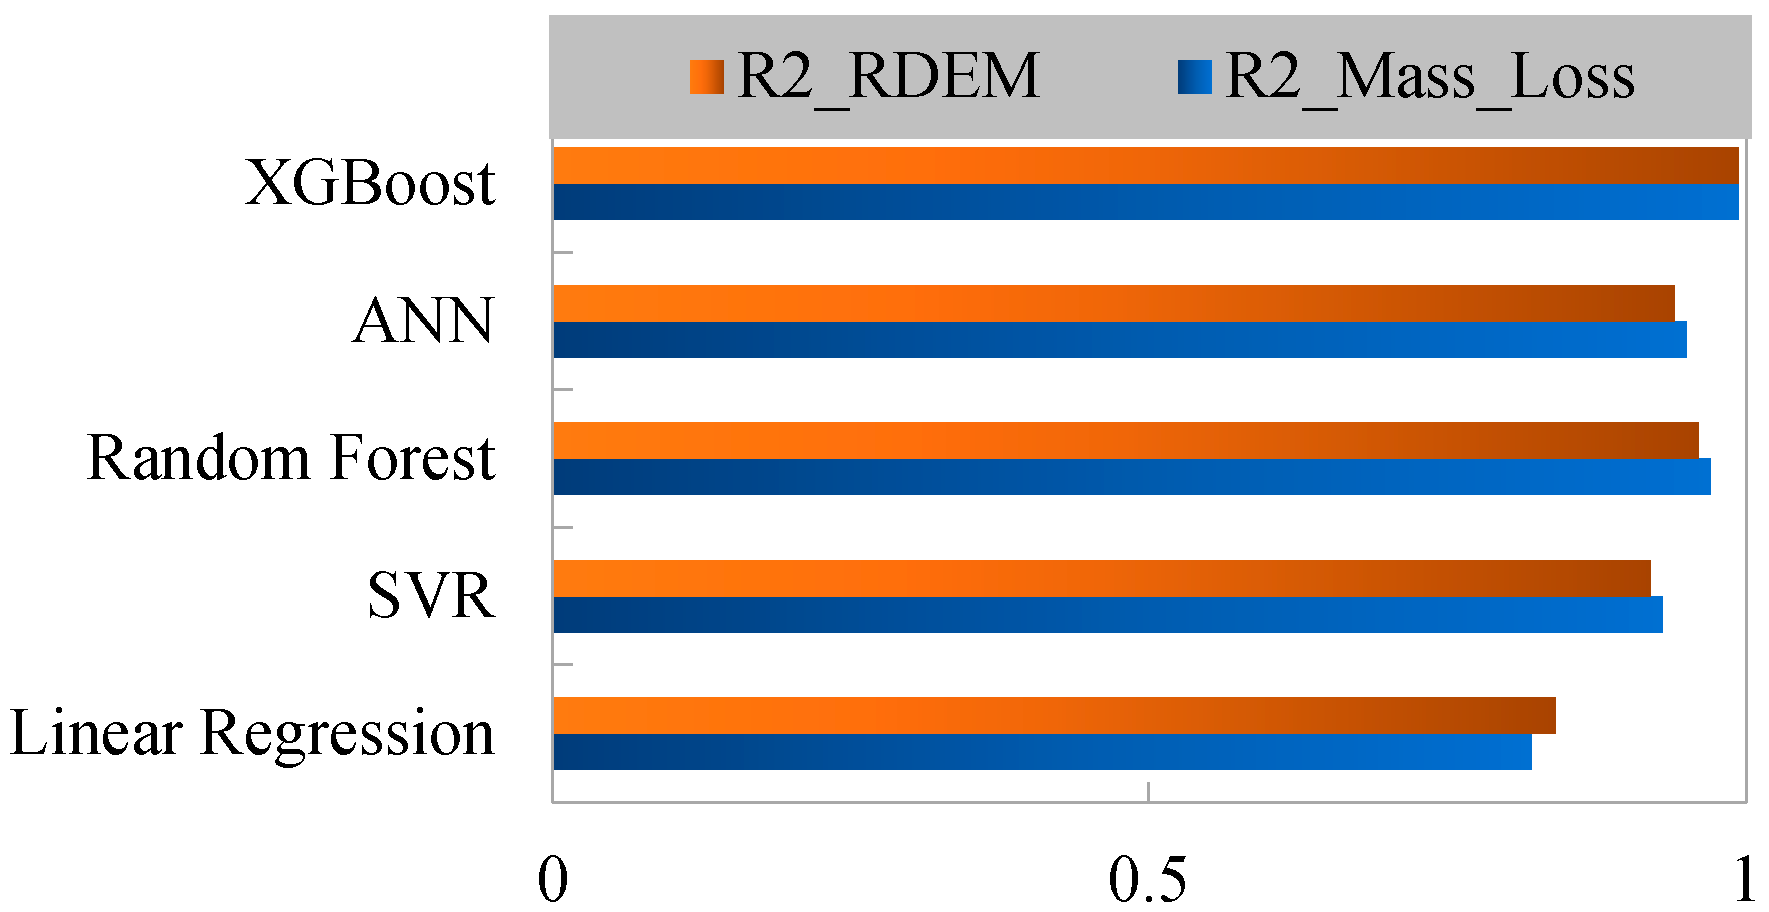
Linear Regression had the lowest accuracy, with
R2 values of 0.82 for mass loss and 0.84 for RDEM. This poor performance demonstrates that nonlinear developments in the freeze–thaw degradation process cannot be properly explained by linear assumptions. Nonlinear modelling approaches are important because of the deterioration processes that include progressive microcrack development, nonlinear damage development, and complicated interactions between PCM and steel fibres (
Table 6).
Support Vector Regression and Artificial Neural Networks showed improved prediction power, with
R2 values ranging from 0.92 to 0.95. Nonetheless, the comparably small sample size of those experimental datasets containing boundaries, as well as the impacts of nonlinear interactions between PCM and steel fibres, continued to have an impact on performance. Regularisation was ineffective in ANN, which is prone to overfitting due to the training of sophisticated neural structures on large datasets (
Table 6).
Random Forest also improved prediction accuracy, with R2 values of 0.97 and 0.96 for mass loss and RDEM. This improvement demonstrates the natural advantage of ensemble learning approaches in explaining complex, nonlinear degradation behaviour using feature randomisation and bootstrap aggregation. However, Random Forest’s prediction error (RMSE = 2.53 for RDEM and 0.124 for mass loss) was significantly higher than that of XGBoost.
The XGBoost model outperformed all baseline strategies, achieving
R2 values of 0.9938 for mass loss prediction and 0.9935 for RDEM prediction (
Figure 2). Among all the models studied, the mass loss was 0.0957, and the RDEM was 0.9687. This superior predictive capability is due to XGBoost’s inherent algorithmic benefits, which include second-order Taylor expansion of the loss function to compute accurate gradient optimisation, explicit L1 and L2 regularisation to help control model complexity and avoid overfitting, and built-in support for missing values to improve robustness when using small to medium engineering datasets. Furthermore, XGBoost showed competitive training performance and was capable of producing significantly higher accuracy at a much lower computation time than ANN.
Among the evaluated models, XGBoost demonstrated the best predictive performance in this study, achieving higher accuracy compared to the other algorithms under the same dataset and evaluation conditions (see
Figure 2). This can be attributed to its ability to capture nonlinear relationships and incorporate regularisation, which is particularly advantageous for structured datasets of moderate size.
It should be noted that the high prediction accuracy is achieved within a relatively small but highly controlled dataset, which may contribute to reduced variability and improved model fitting.
3.2.2. XGBoost Prediction Accuracy
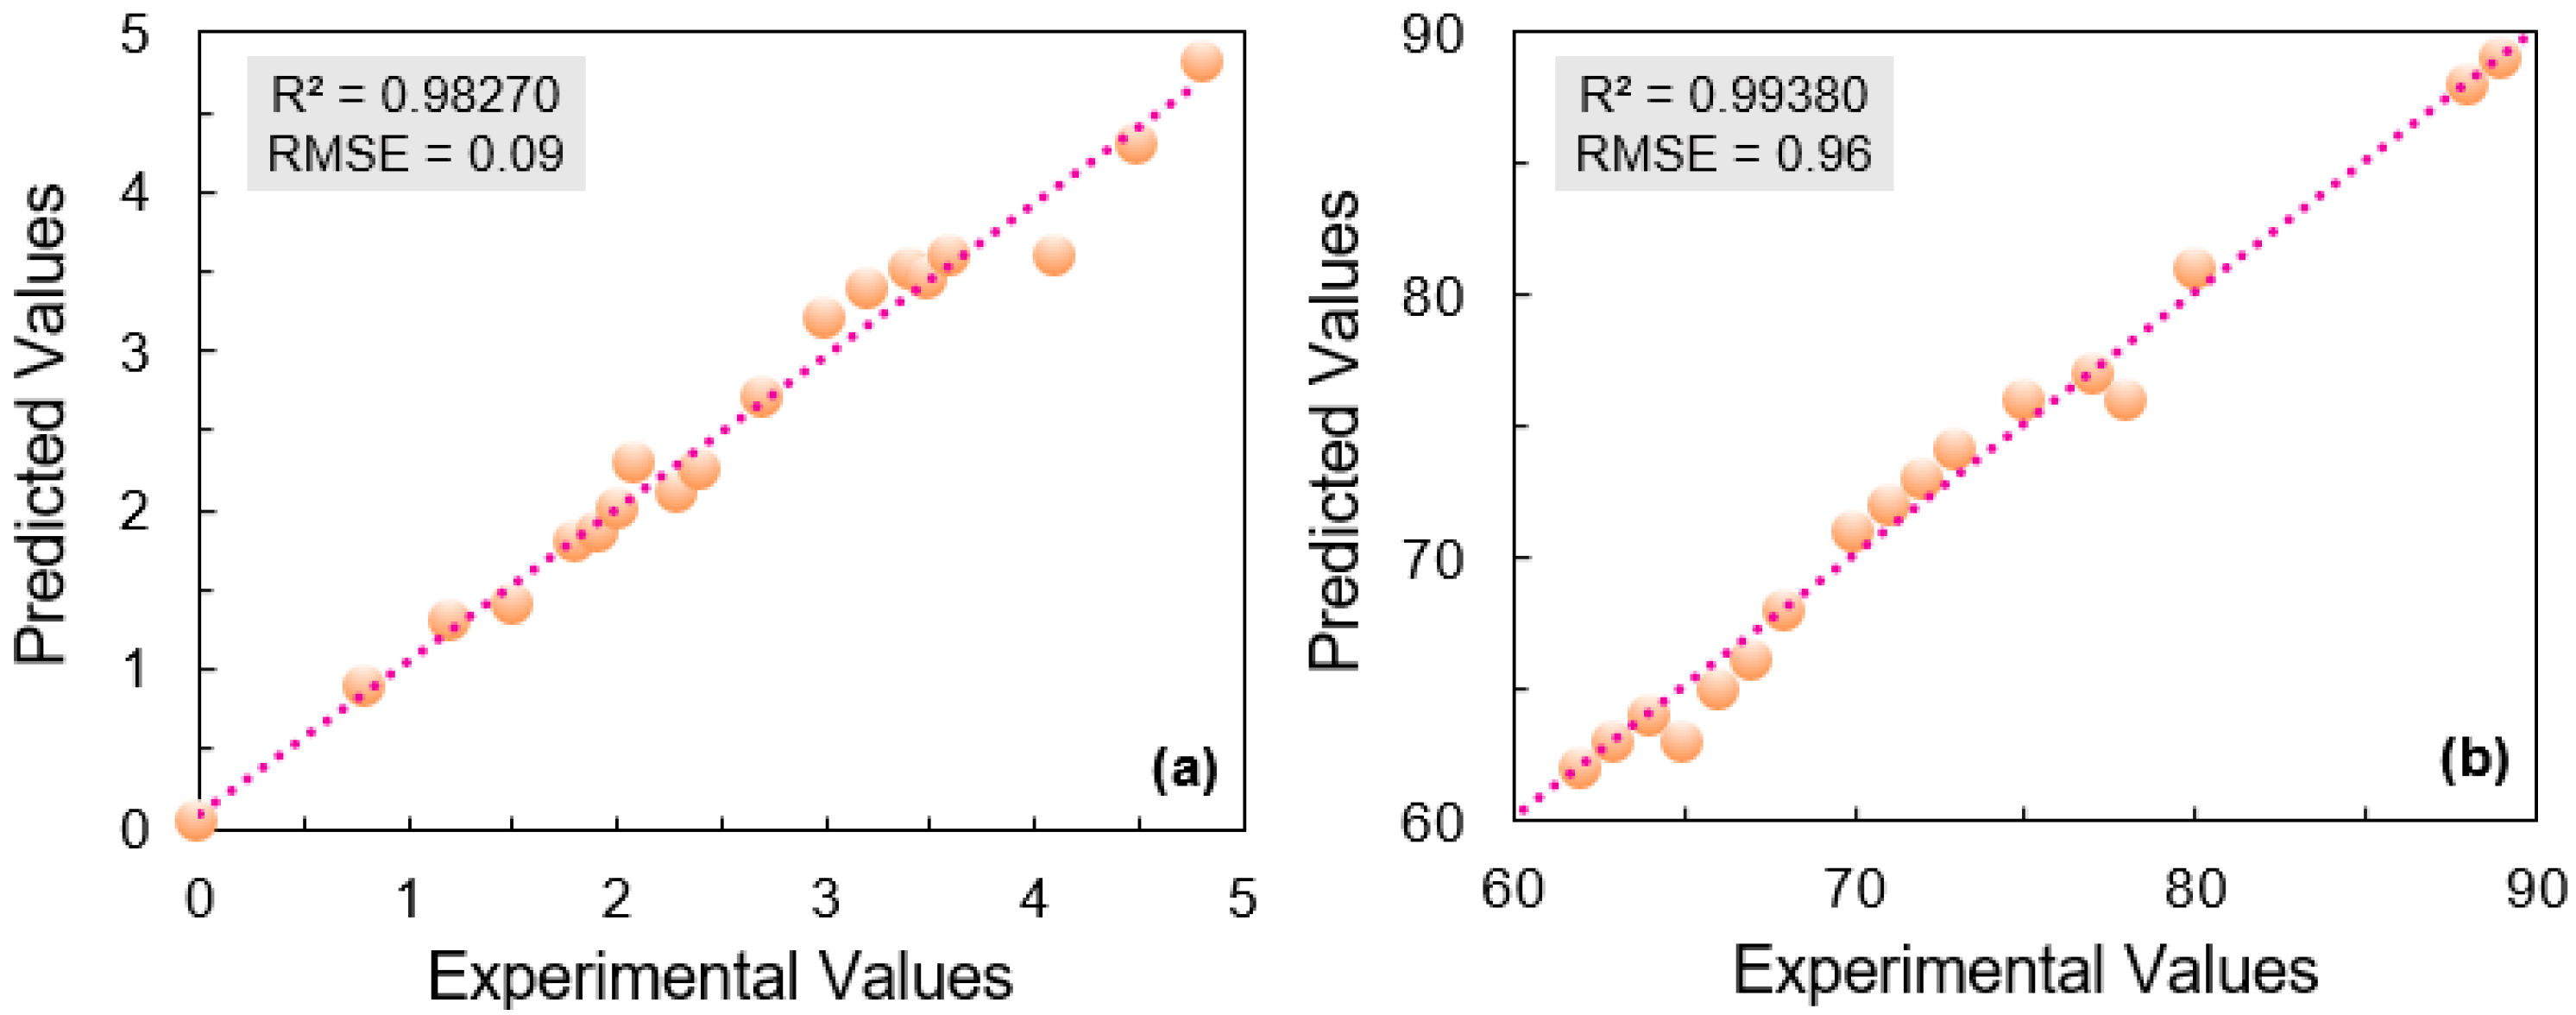
Figure 3 shows that the projected values for both durability indicators using the XGBoost model are very consistent with the experimental values. Scatter points for mass loss rate are practically on the ideal diagonal line (
y =
x), indicating a very exact prediction across the entire spectrum of deterioration (
Figure 3a). The coefficient of determination (
R2) is close to 0.9935 even at the freeze–thaw stages, with an RMSE of 0.0957, indicating that the prediction error is low.
Figure 3b shows the relative dynamic modulus of elasticity (RDEM); the data points are virtually identical to the ideal fit line, with an
R2 of 0.9938 and an RMSE of 0.9687. The proposed model accurately captures the nonlinear cumulative damage characteristics of steel fibre-reinforced PCM concrete up to 300 freeze–thaw cycles, with minimal dispersion and no systematic departure. Technically, the typical F300 durability tests need a significant amount of energy and take approximately three months in the laboratory. In contrast, with the parameters of mix design and target cycle number, the suggested XGBoost-based system can forecast freeze–thaw damage indices within milliseconds. This is due to digital transformation, which removes the typical time constraints in cold-region concrete research and applications, significantly accelerating the decision-making process for airport pavement design.
The exceptional predictive accuracy shows substantial practical significance of this research. Traditional F300 durability testing takes about three months in the laboratory, consumes a significant amount of energy throughout the freeze–thaw cycle, and requires extensive preparation and measurement of specimen samples. In contrast, the proposed XGBoost-based model predicts freeze–thaw damage indices in milliseconds using only mix design specifications and the target number of cycles. Because of this digital shift, making decisions about airport pavement design now takes a few seconds rather than months, as it did in traditional cold-region concrete study and application.
It should be noted that the high prediction accuracy (
R2 ≈ 0.99) is achieved within a controlled experimental dataset with limited variability. As discussed in
Section 2.4.3 and
Section 4, this performance reflects strong interpolation capability rather than unrestricted generalisation. Potential sources of overestimation, such as data correlation and limited dataset size, have been acknowledged and discussed accordingly.
3.2.3. Synergistic Performance of PCM–Steel Fibre Combinations
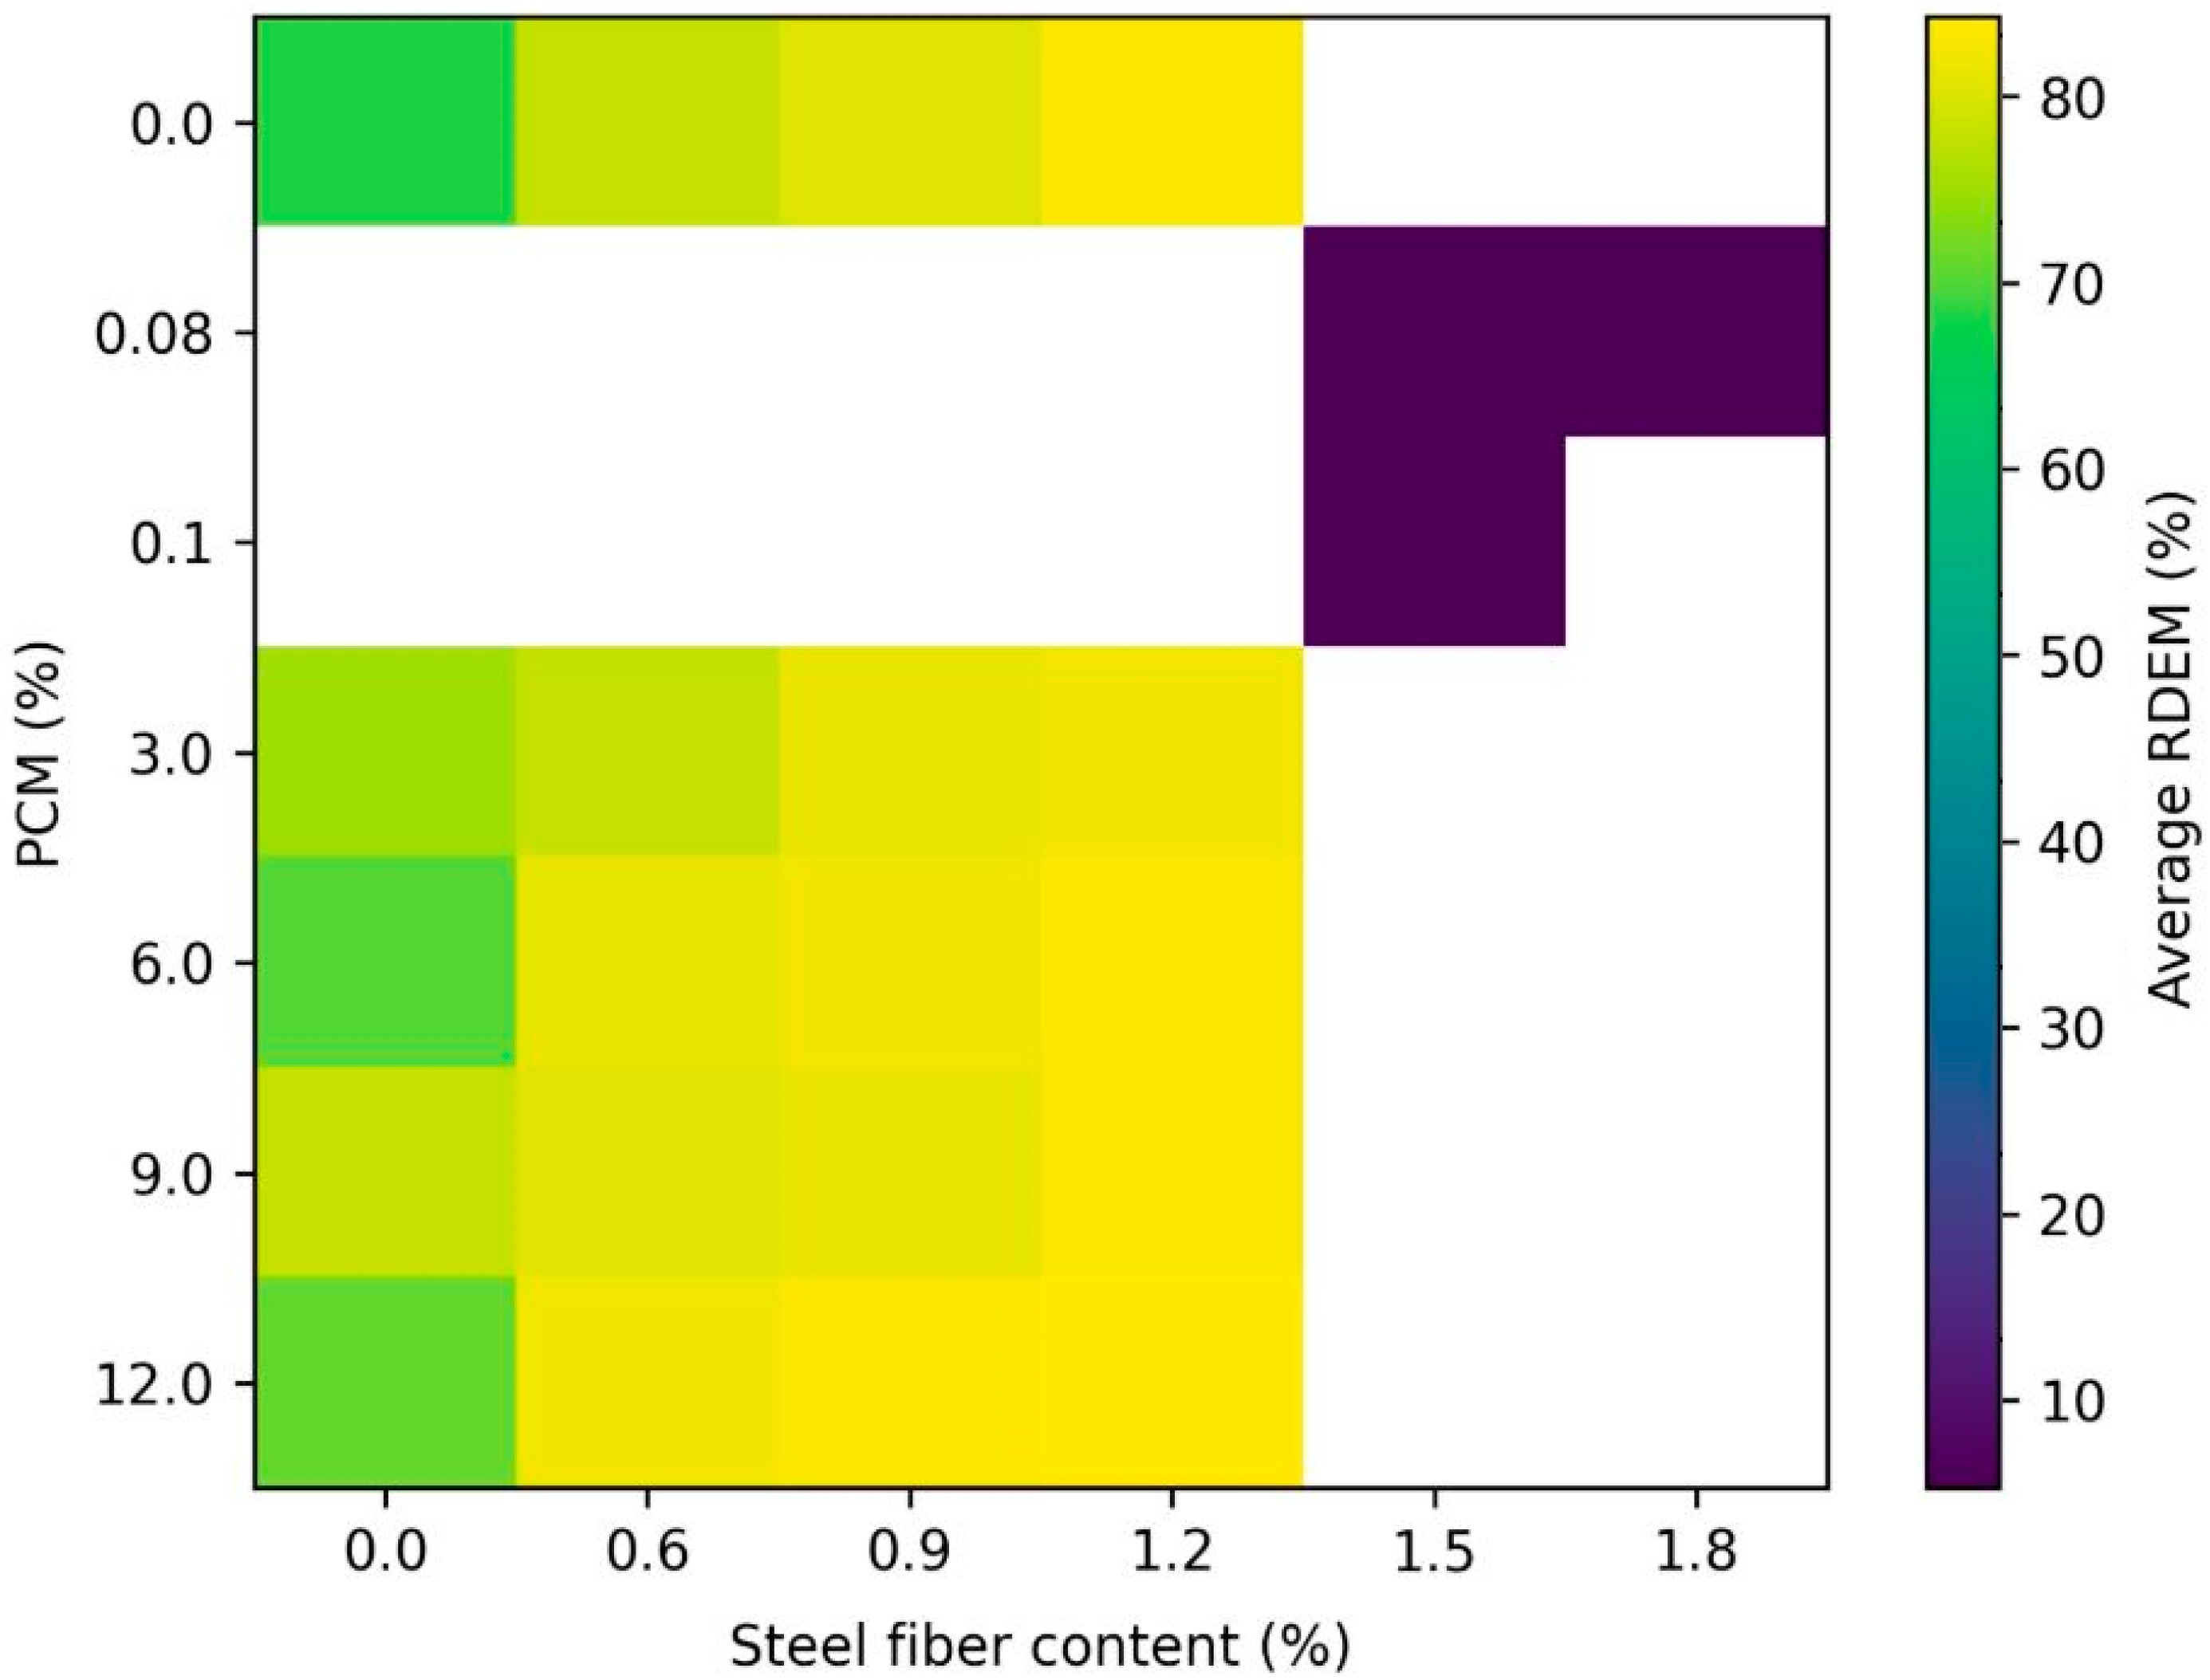
A heatmap visualisation was created to show the average relative dynamic modulus (RDEM) of various material combinations in order to study the overall influence of PCM substitution and steel fibre reinforcing on freeze–thaw durability (
Figure 4). The heatmap vibrantly depicts how the two design parameters interact to shape the durability performance.
As demonstrated in
Figure 4, the higher the steel fibre concentration, the higher the RDEM value, indicating more resistance to internal stiffness loss during freezing and thawing. This tendency validates the strengthening role of steel reinforcement fibres in terms of crack containment and the preservation of the cementitious matrix’s load-transfer system. Similarly, while managing internal temperature variations during freezing occurrences, higher PCM replacement levels increase durability performance. The PCM–steel fibre combinations have the best RDEM values, indicating a strong synergistic effect of mechanical reinforcing processes and thermal regulation.
Figure 4 also shows that mixtures incorporating fibre reinforcement along with moderate-to-high PCM content exhibit the highest and most consistent durability performance. This finding supports the optimal mixture designs identified through SHAP analysis and machine learning predictions. This image is thus another indication of the thermomechanical coupling mechanism that govern freeze–thaw resistance in steel fibre phase-change concrete.
3.2.4. Residual Analysis and Model Robustness
To provide a more comprehensive evaluation of model performance, residual analysis was conducted in addition to standard metrics such as
R2 and RMSE. The robustness of the model was further evaluated based on the validation strategy described in
Section 2.4.3. Training and testing predictions have all undergone a residual analysis to determine the reliability of the model. This model satisfies the assumptions of homoscedasticity and independence, as confirmed by the residual plots. No discernible patterns or trends were observed, and the differences between predicted and actual values were randomly distributed across the graph. The residuals were approximately normally distributed with mean values near zero (−0.002 in the case of mass loss, and −0.12 in the case of RDEM), with no outliers exceeding three standard deviations.
The cross-validation results indicated that the five folds were consistent. In the case of mass loss and RDEM, the mean R2 of cross-validation was 0.991 and 0.990, respectively, and the standard deviation was 0.002 and 0.003. The high quality of generalisation of the model is already justified by the fact that the variance between folds is very low, which indicates that the model is stable and is not overly reliant on specific data partitions.
The sensitivity study also established the strength of the model when it was demonstrated that the model remained stable even in cases where the input features were varied slightly. This is particularly important in the case of engineering, where the input parameters might possess inherent measurement uncertainty.
The high prediction accuracy (
R2 ≈ 0.99) may indicate overfitting, especially given the limited sample size. However, this performance is mostly due to the experimental database’s high quality and boundary control. Unlike earlier research, which used heterogeneous multi-source datasets, all samples in this work were created under strictly controlled conditions, such as a constant water-binder ratio, identical curing regime, and uniform aggregate system [
3,
4,
5,
6]. This considerably decreases background noise while increasing signal-to-noise ratio, allowing the model to learn the fundamental correlations between input variables and durability indicators more efficiently.
Furthermore, several measures were used to reduce overfitting. These include (i) five-fold cross-validation during hyperparameter optimisation, (ii) the application of regularisation techniques within XGBoost (L1 and L2 penalties), (iii) randomisation is introduced through subsampling and column sampling, and (iv) evaluation on an independent testing dataset. The consistency of training, cross-validation, and testing results demonstrates that the model detects generalisable patterns rather than noise.
The residuals are generally small and randomly distributed around zero, with no clear systematic bias observed. This indicates that the model predictions are well-balanced across the range of values and that errors are not concentrated in specific regions of the dataset. The absence of significant skewness or clustering in the residual distribution further supports the reliability of the model.
Nonetheless, it is noted that additional validation using larger-scale or field datasets would be advantageous in fully confirming the model’s durability under more general engineering situations. This issue will be resolved in future development.
3.2.5. SHAP-Based “Thermal-Mechanical” Synergistic Frost Resistance Mechanism of Pavement
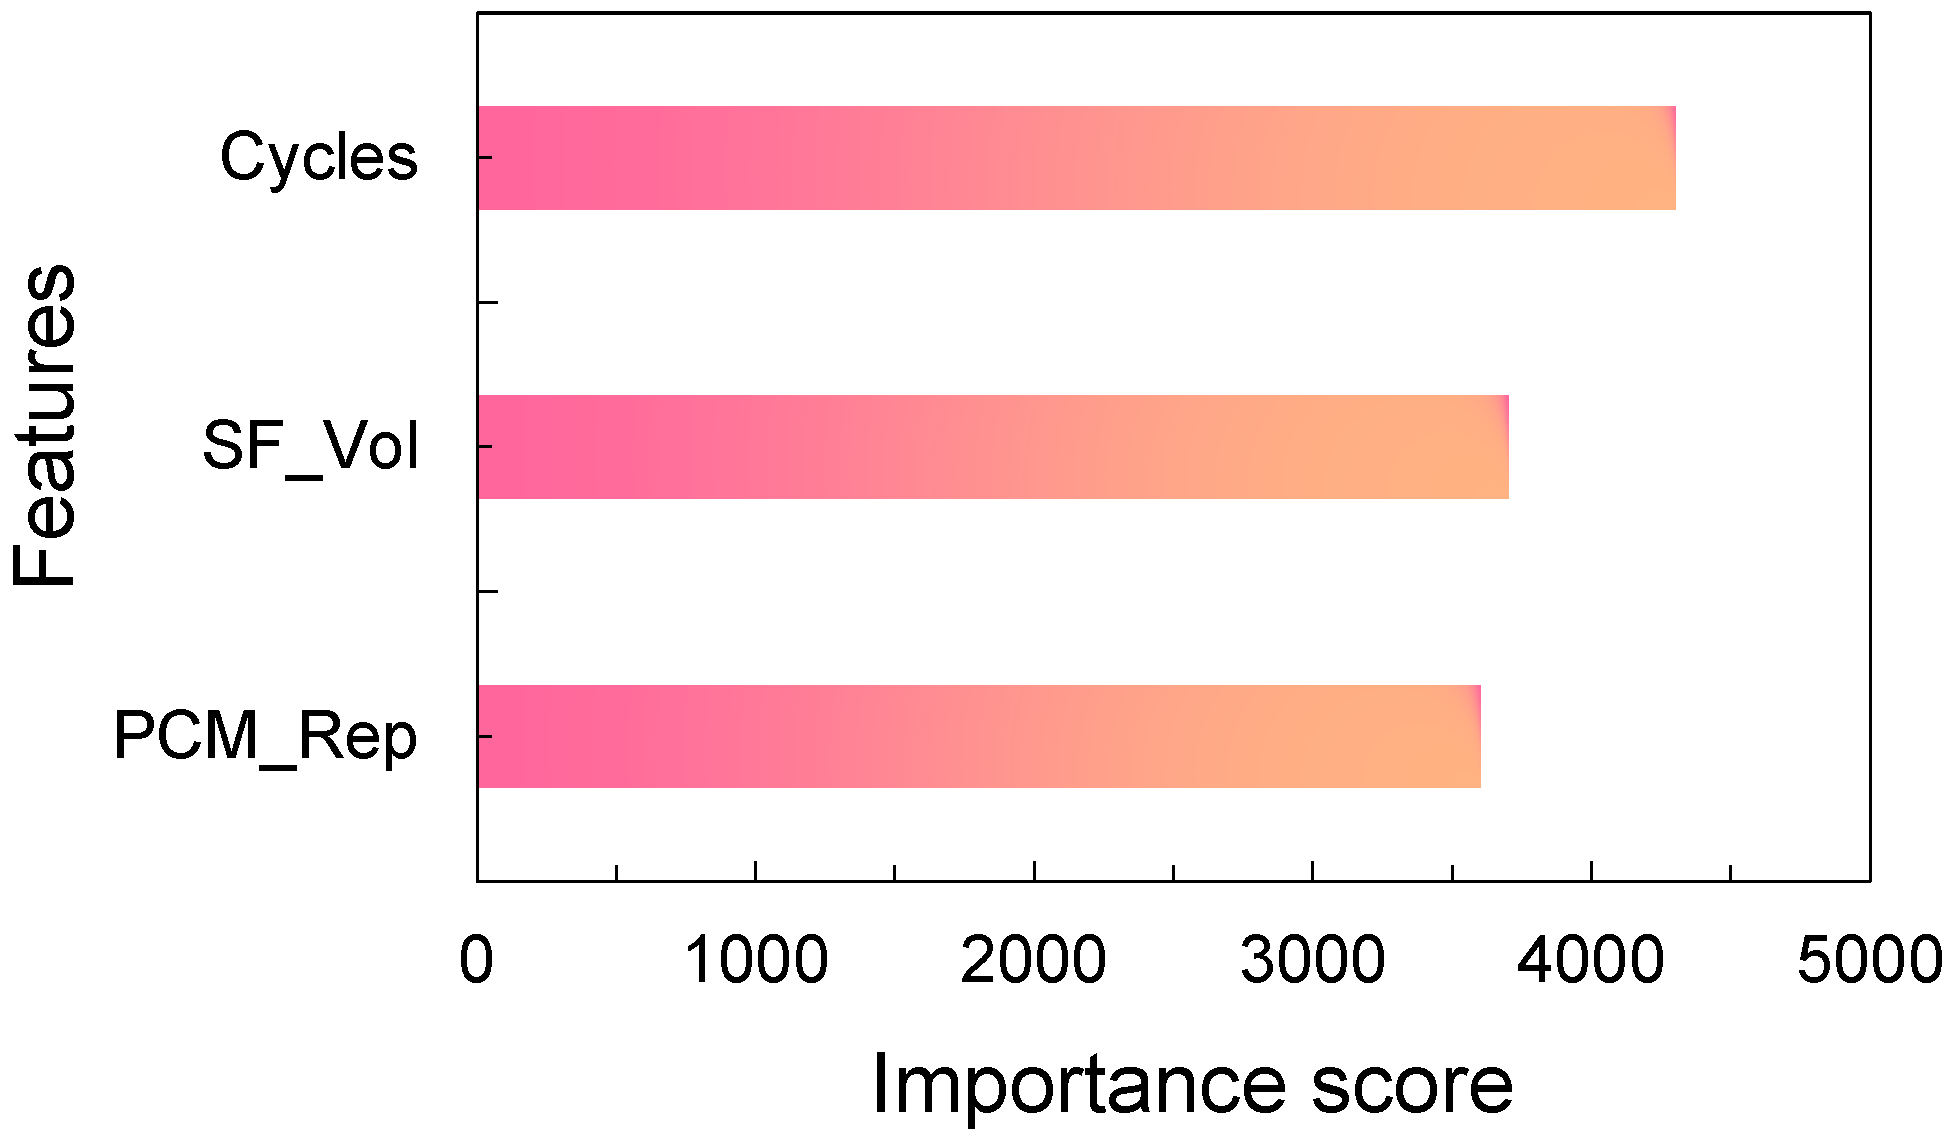
The relative importance of each input variable in predicting the relative dynamic modulus under freeze–thaw cycles was quantified using feature importance analysis, as illustrated in
Figure 5. The results indicate that the number of freeze–thaw cycles is the most critical factor, highlighting that cumulative environmental loading primarily drives pavement concrete degradation. The steel fibre volume fraction (SF_VOL) ranks second, contributing significantly to stiffness retention through energy dissipation and crack-bridging mechanisms, while the phase-change material substitution rate (PCM_Rep), though a smaller modification, still plays an important complementary role by regulating temperature and enhancing frost resistance. The hierarchical ranking (Cycles > SF_VOL > PCM_Rep) indicates that pavement durability under F300 conditions is governed by a coupled thermomechanical mechanism. Steel fibres enhance structural integrity, PCM moderates temperature-induced stress variations, and environmental loading dictates the overall degradation pattern. In addition to standard empirical evaluation, this mathematical explanation adds mechanical insight.
The second most important number is the volume fraction of the steel fibre (SF_Vol), which has a mean value of 2.36 (
Figure 5), indicating that it plays an essential mechanical function in reducing stiffness deterioration through energy dissipation and fracture bridging. Steel fibres are the major structural protection layer against internal damage from freeze–thaw cycles, according to this quantitative evaluation.
A mean value of 1.84 for the phase-change material substitution rate (PCM_Rep) implies that heat regulation is critical, even if its influence on frost resistance is complementary and less substantial. Under the hierarchical ranking (Cycles > SF_Vol > PCM_Rep), a highly linked thermomechanical process determines pavement integrity at F300 conditions: steel fibres improve structural integrity, PCM controls temperature-induced stress fluctuations, and environmental loading determines the degradation framework.
The same order of ranking was found in mass loss prediction, with cycles coming in first (mean |human| = 0.68), followed by SF_Vol (0.31) and PCM_Rep (0.24). In comparison to RDEM, the protective characteristics of PCM appear to be stronger in preserving internal structural integrity and less severe in deterring surface scaling since PCM’s involvement in influencing mass loss is not as prominent. This discrepancy is consistent with the process of internal heat regulation rather than surface protection, as shown in PCM.
3.2.6. SHAP Summary Plot
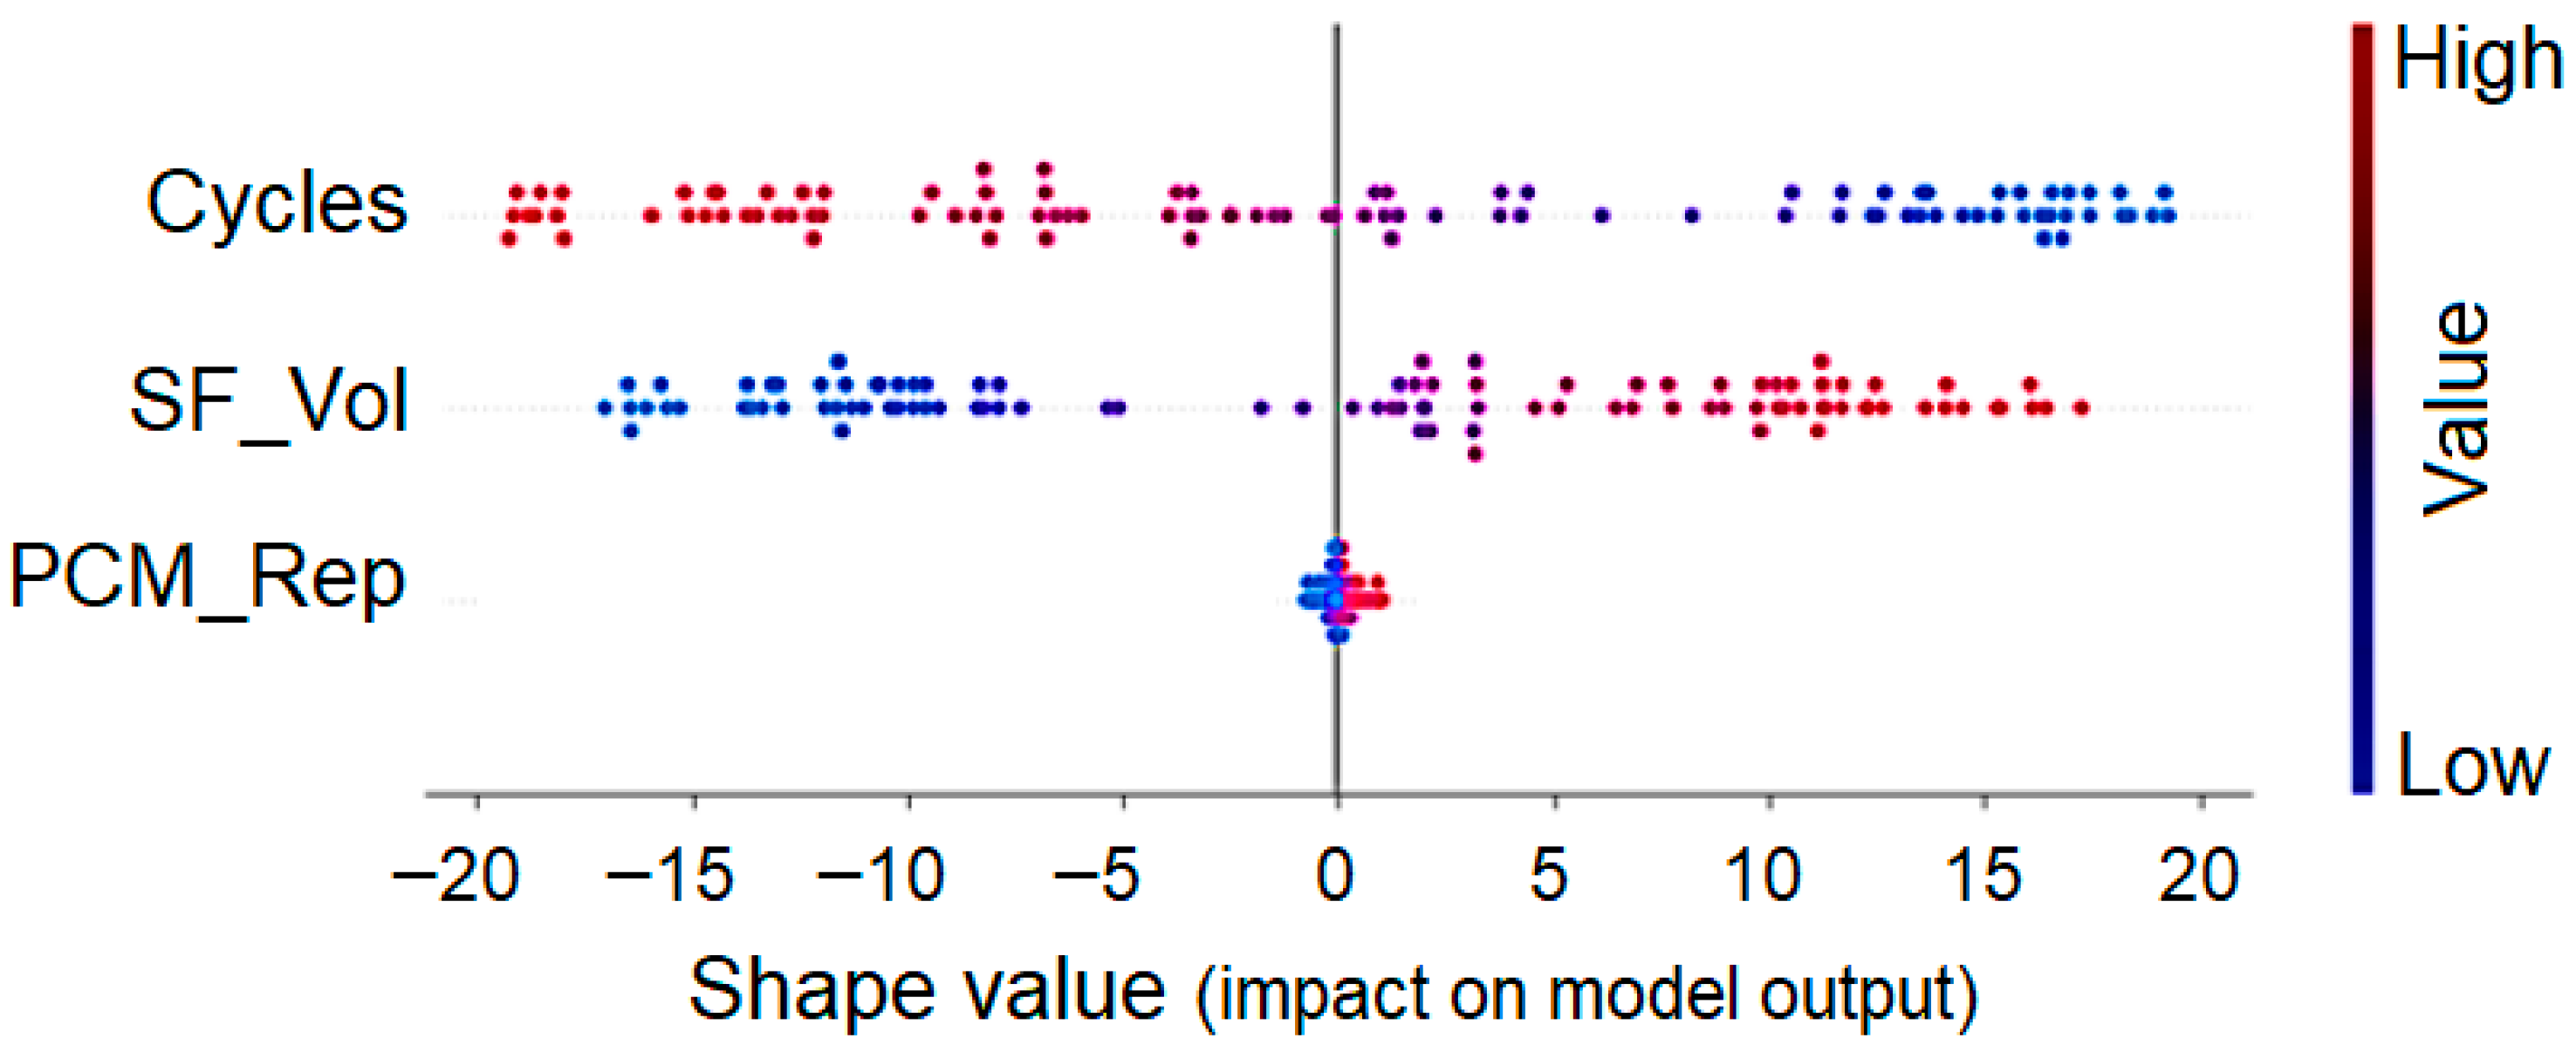
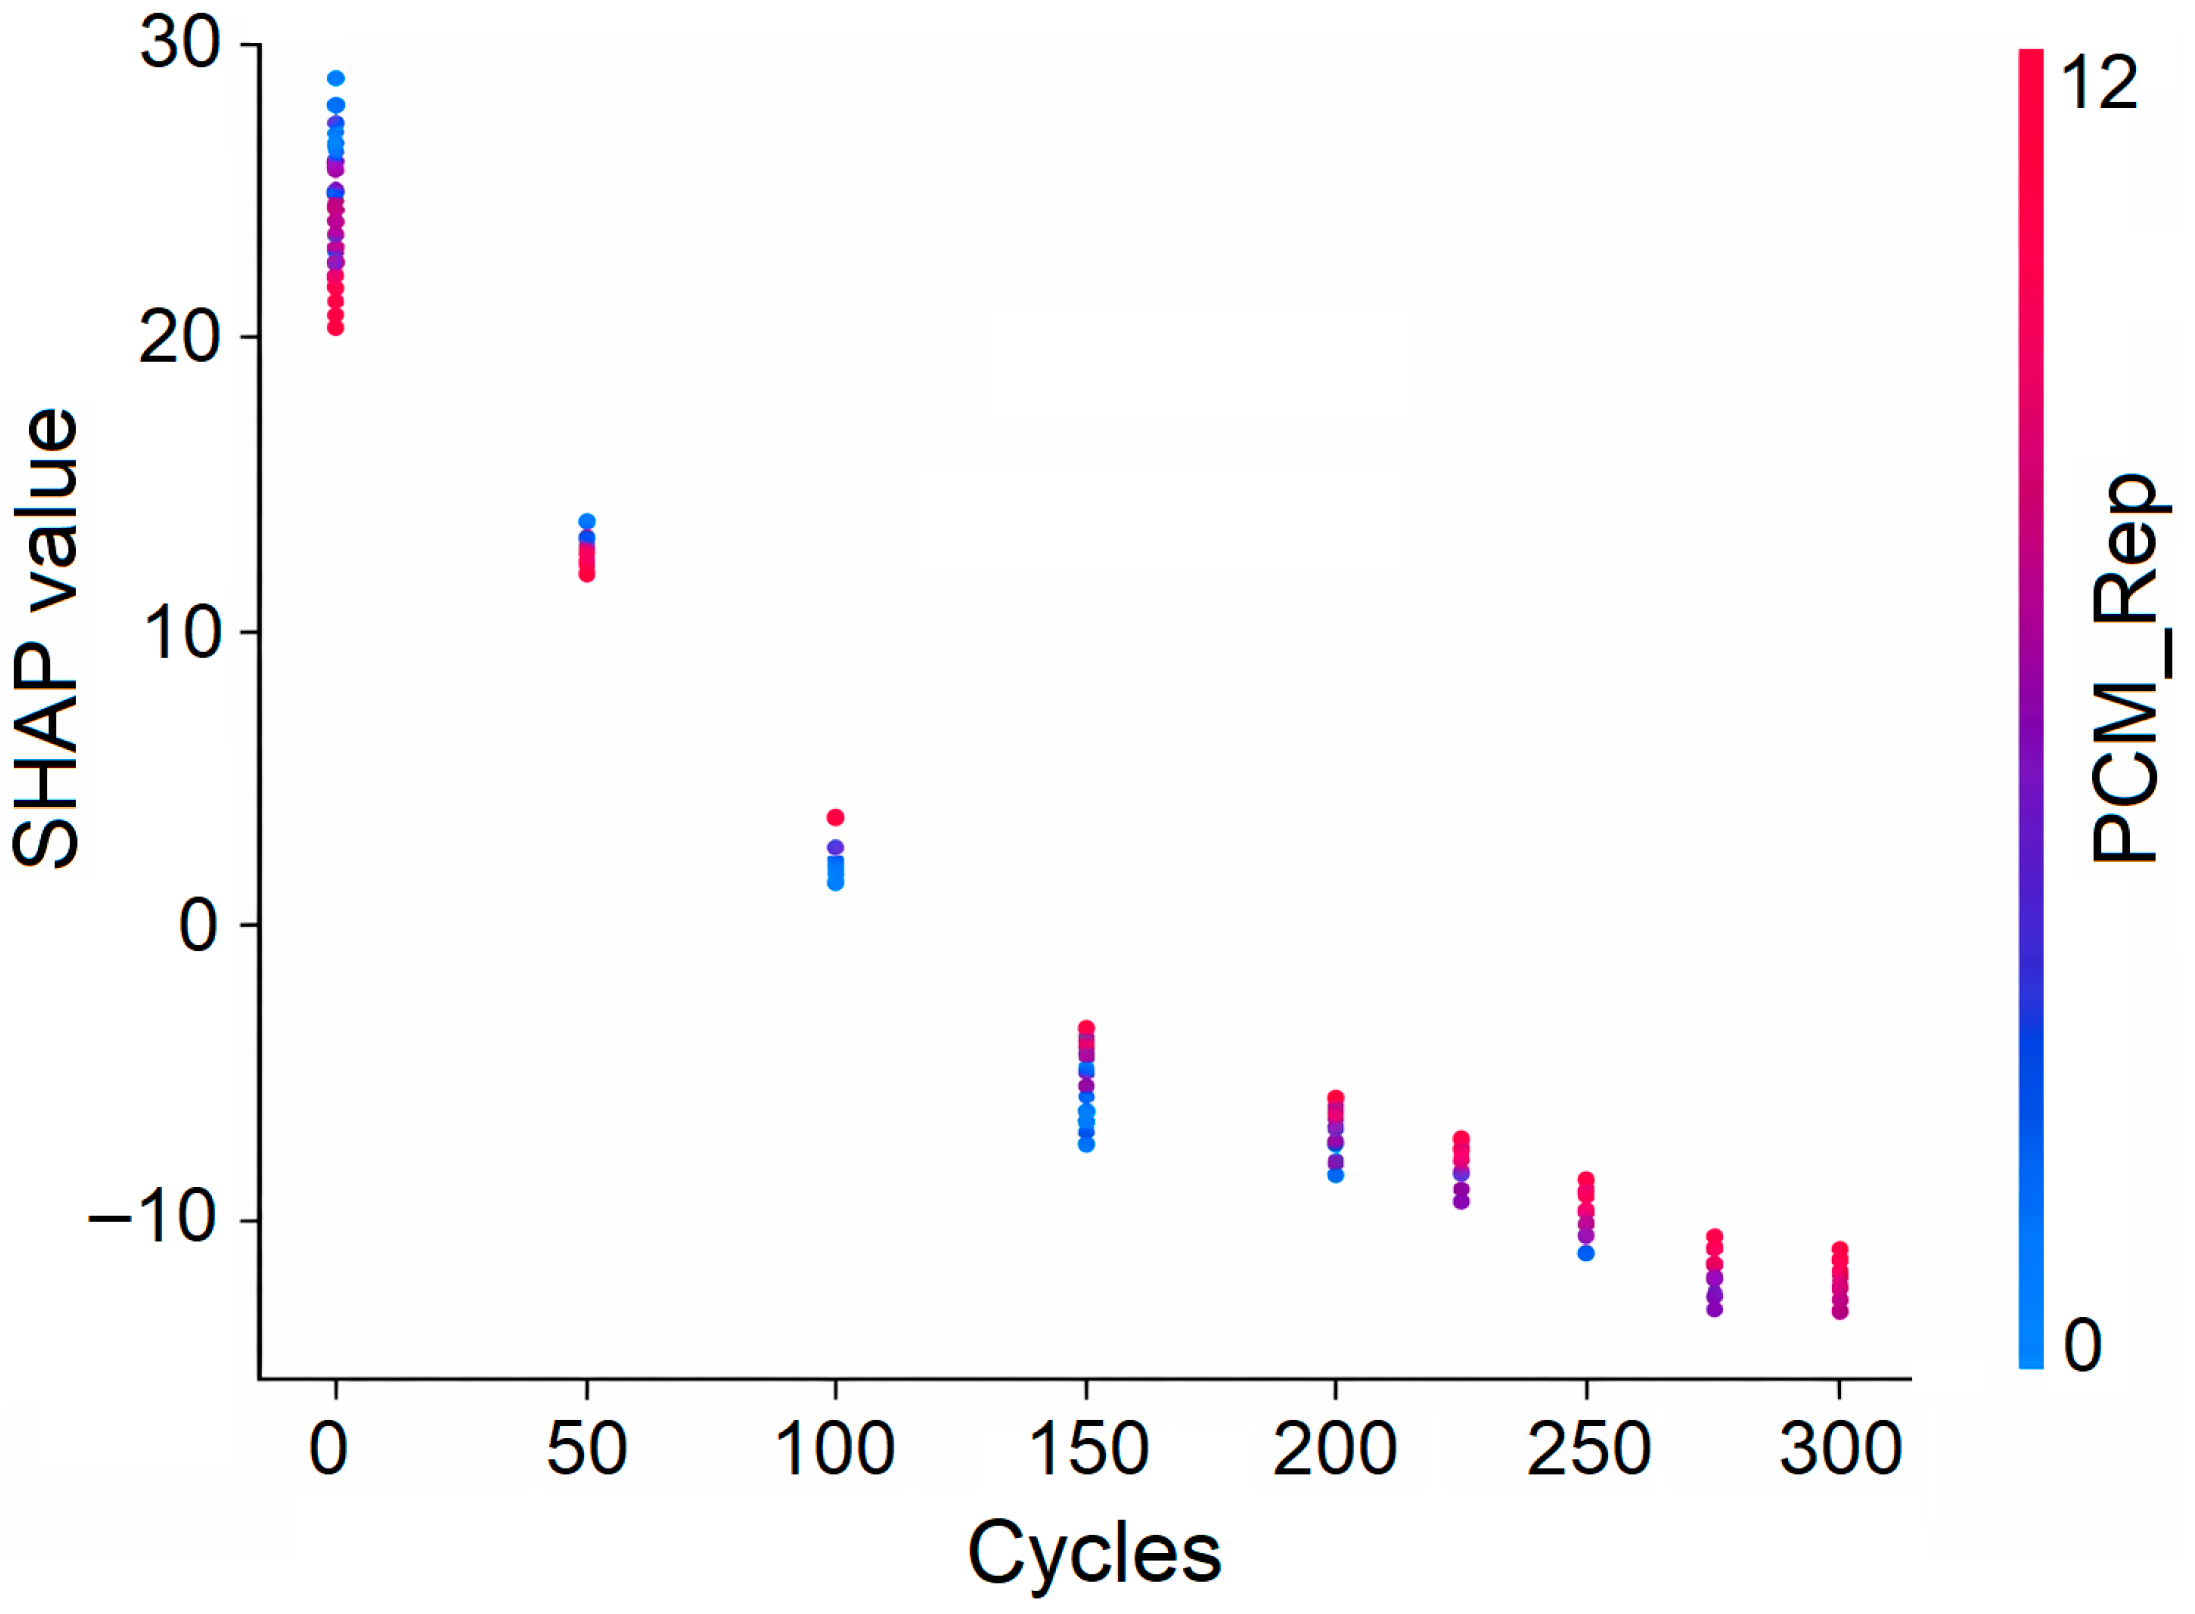
Figure 6 shows the SHAP summary (beeswarm) graphic, which provides a detailed description of the influence of each attribute on the forecast value of the relative dynamic modulus expected. Colour gradients show feature values (blue low, red high), whereas horizontal distributions of SHAP values represent the value and direction of each variable’s contribution to model output. The freeze–thaw cycle number (Cycles) has the highest SHAP distribution, indicating that it plays a significant role in stiffness deterioration. The larger the cumulative freezing-thawing damage, the higher the number of cycles (red dots) associated with negative SHAP values, suggesting a significant fall in the anticipated modulus (
Figure 6). On the other side, the modulus forecast contains fewer cycle numbers (blue points).
Increased fibre contents (red points) largely result in positive SHAP values, indicating that they are effective at reducing stiffness loss through crack-bridging and stress redistribution mechanisms. The volume fraction of steel fibre (SF Vol) has a substantial positive correlation with the model result. Conversely, low fibre content is typically associated with poor durability performance.
The SHAP values of PCM substitution rate (PCM_Rep) are more concentrated around the zero value, indicating a moderate but consistent impact. Because of the thermal buffering effect, which reduces internal freeze–thaw stresses, greater quantities of PCM slightly improve durability projections.
The SHAP analysis reveals the presence of a thermomechanical synergistic process: PCM is utilised for heat regulation, steel fibres for structural reinforcement, and environmental stress (cycles) for maintaining degradation levels. This explanatory model improves the physical soundness of the XGBoost model under the supplied F300 engineering boundary constraints.
The freeze–thaw cycle number (cycles) has the highest SHAP distribution, indicating that it plays a substantial role in stiffness deterioration. The relationship between cumulative freezing–thawing damage and number of cycles (red points) is mostly between negative SHAP values, which indicate a significant reduction in anticipated modulus. SHAP values for cycles range from −8 to +2, with negative values increasing as the number of cycles increases. Such a monotonically negative correlation is consistent with the scientific reality that internal damage increases with each subsequent freeze–thaw cycle.
Smaller numbers of cycles (blue dots), which represent the minimum condition of damage during the initial exposure stages, are positively connected with modulus prediction. The model effectively learned the nonlinear damage accumulation rule that propagates freeze–thaw damage, as evidenced by the distinct separation of the high-cycle (red) and low-cycle (blue) terms.
The model output shows a clear positive association with the steel fibre volume fraction (SF_Vol). Higher fibre content (red points) typically results in positive SHAP readings. It demonstrates how steel fibres can effectively minimise stiffness loss due to stress redistribution and crack-bridging mechanisms. Low fibre levels (blue dots) typically result in negative SHAP values, indicating poor durability performance. The SHAP distribution of SF_Vol is rather diffused, indicating that there is no total additivity of fibre contribution, but rather an interaction with other parameters, particularly cycle number, at which the benefits of fibre ingestion become more obvious as deterioration develops.
The summary plot of the SHAP distribution of mass loss revealed directional patterns (similar to those seen in mass loss), with PCM_Rep, SF_Vol, and Cycles contributing positively but moderately and negatively. Importantly, the protective advantages of SF_Vol and PCM_Rep on mass loss were slightly smaller when compared to RDEM effects, demonstrating that these materials are more successful at retaining internal stiffness than preventing surface scaling.
3.2.7. Dependence Plots: Interaction Between PCM and SF
Figure 7 shows a SHAP-dependent plot for the PCM substitution rate (PCM_Rep), with colours showing the volume proportion of steel fibres (SF_Vol). Dependence plots help to better understand how PCM and steel fibres interact. This plot shows directly how the marginal contribution of PCM to the anticipated RDEM changes with varied amounts of fibre.
There is a definite pattern of interaction: at a given PCM level, larger steel fibre content always leads to higher SHAP values, which shows that the positive contributions to durability are stronger. On the other hand, at low fibre contents, the extra benefit of PCM stays small. This shows that the efficiency of PCM is not independent; it is much affected by the presence of steel fibres.
In addition, the slope of the SHAP values in relation to PCM content is steeper as the fibre dose goes up. This means that the extra advantage of PCM is greater when there is enough mechanical reinforcement. This non-parallel distribution of coloured data points is clear proof of the interaction effects that the model found.
3.2.8. Synergistic Effects of PCM and Steel Fibres
This section presents results at two levels to distinctly differentiate between data-driven discoveries and physical interpretation. The synergistic effects between PCM and steel fibres are determined by experimental observations and SHAP analysis. Secondly, the observed patterns are analysed through recognised thermomechanical mechanisms of freeze–thaw damage in cementitious materials. SHAP analysis elucidates statistical correlations and interaction effects, whereas the suggested physical mechanisms offer a logical interpretation of these data rather than direct empirical evidence.
The SHAP analysis, combined with experimental observations, reveals a coherent mechanistic depiction of how PCM and steel fibres synergistically enhance freeze–thaw resistance. The SHAP dependence study also shows that the gap between different fibre levels is bigger when the PCM content goes up (
Figure 7). This divergence reveals that the combined effect of PCM and steel fibres is not only additive; it shows a substantial coupling characteristic, which is consistent with the quantified interaction contribution (~46%) in the SHAP decomposition.
It is crucial to elucidate that SHAP analysis offers a data-driven interpretation of feature contributions inside the prediction model, rather than direct experimental validation of physical mechanisms. The found interaction patterns between PCM and steel fibres align with established thermomechanical behaviour; nonetheless, SHAP does not provide independent evidence of the underlying mechanisms. The proposed “thermal regulation—elastic buffering—fibre bridging” paradigm should be considered a physically plausible explanation, supported by both experimental evidence and insights derived from the model.
3.2.9. Thermal Regulation Mechanism (Latent Heat Effect)
The principal defensive mechanism of PCM microencapsulated is temperature regulation via latent heat storage and release. During the freezing process, the PCM core freezes into a solid, emitting latent heat as the temperature approaches the phase transition point. This exothermic process, by managing the internal temperature drop, creates a thermal shield that keeps the cementitious matrix from experiencing unanticipated temperature reductions.
The SHAP investigation confirms the importance of this mechanism; rising PCM doses consistently increase anticipated RDEM, and the effect is more pronounced with increasing PCM contents, as demonstrated by positive SHAP values of PCM_Rep. This has two key benefits for thermal buffering:
First, PCM minimises the temperature differential between the inside and outside of the concrete by slowing the rate of change in temperature. Even without total freezing, differential strains resulting from strong heat gradients can cause microcracking. As a result, PCM’s regulating effect reduces heat-related stress.
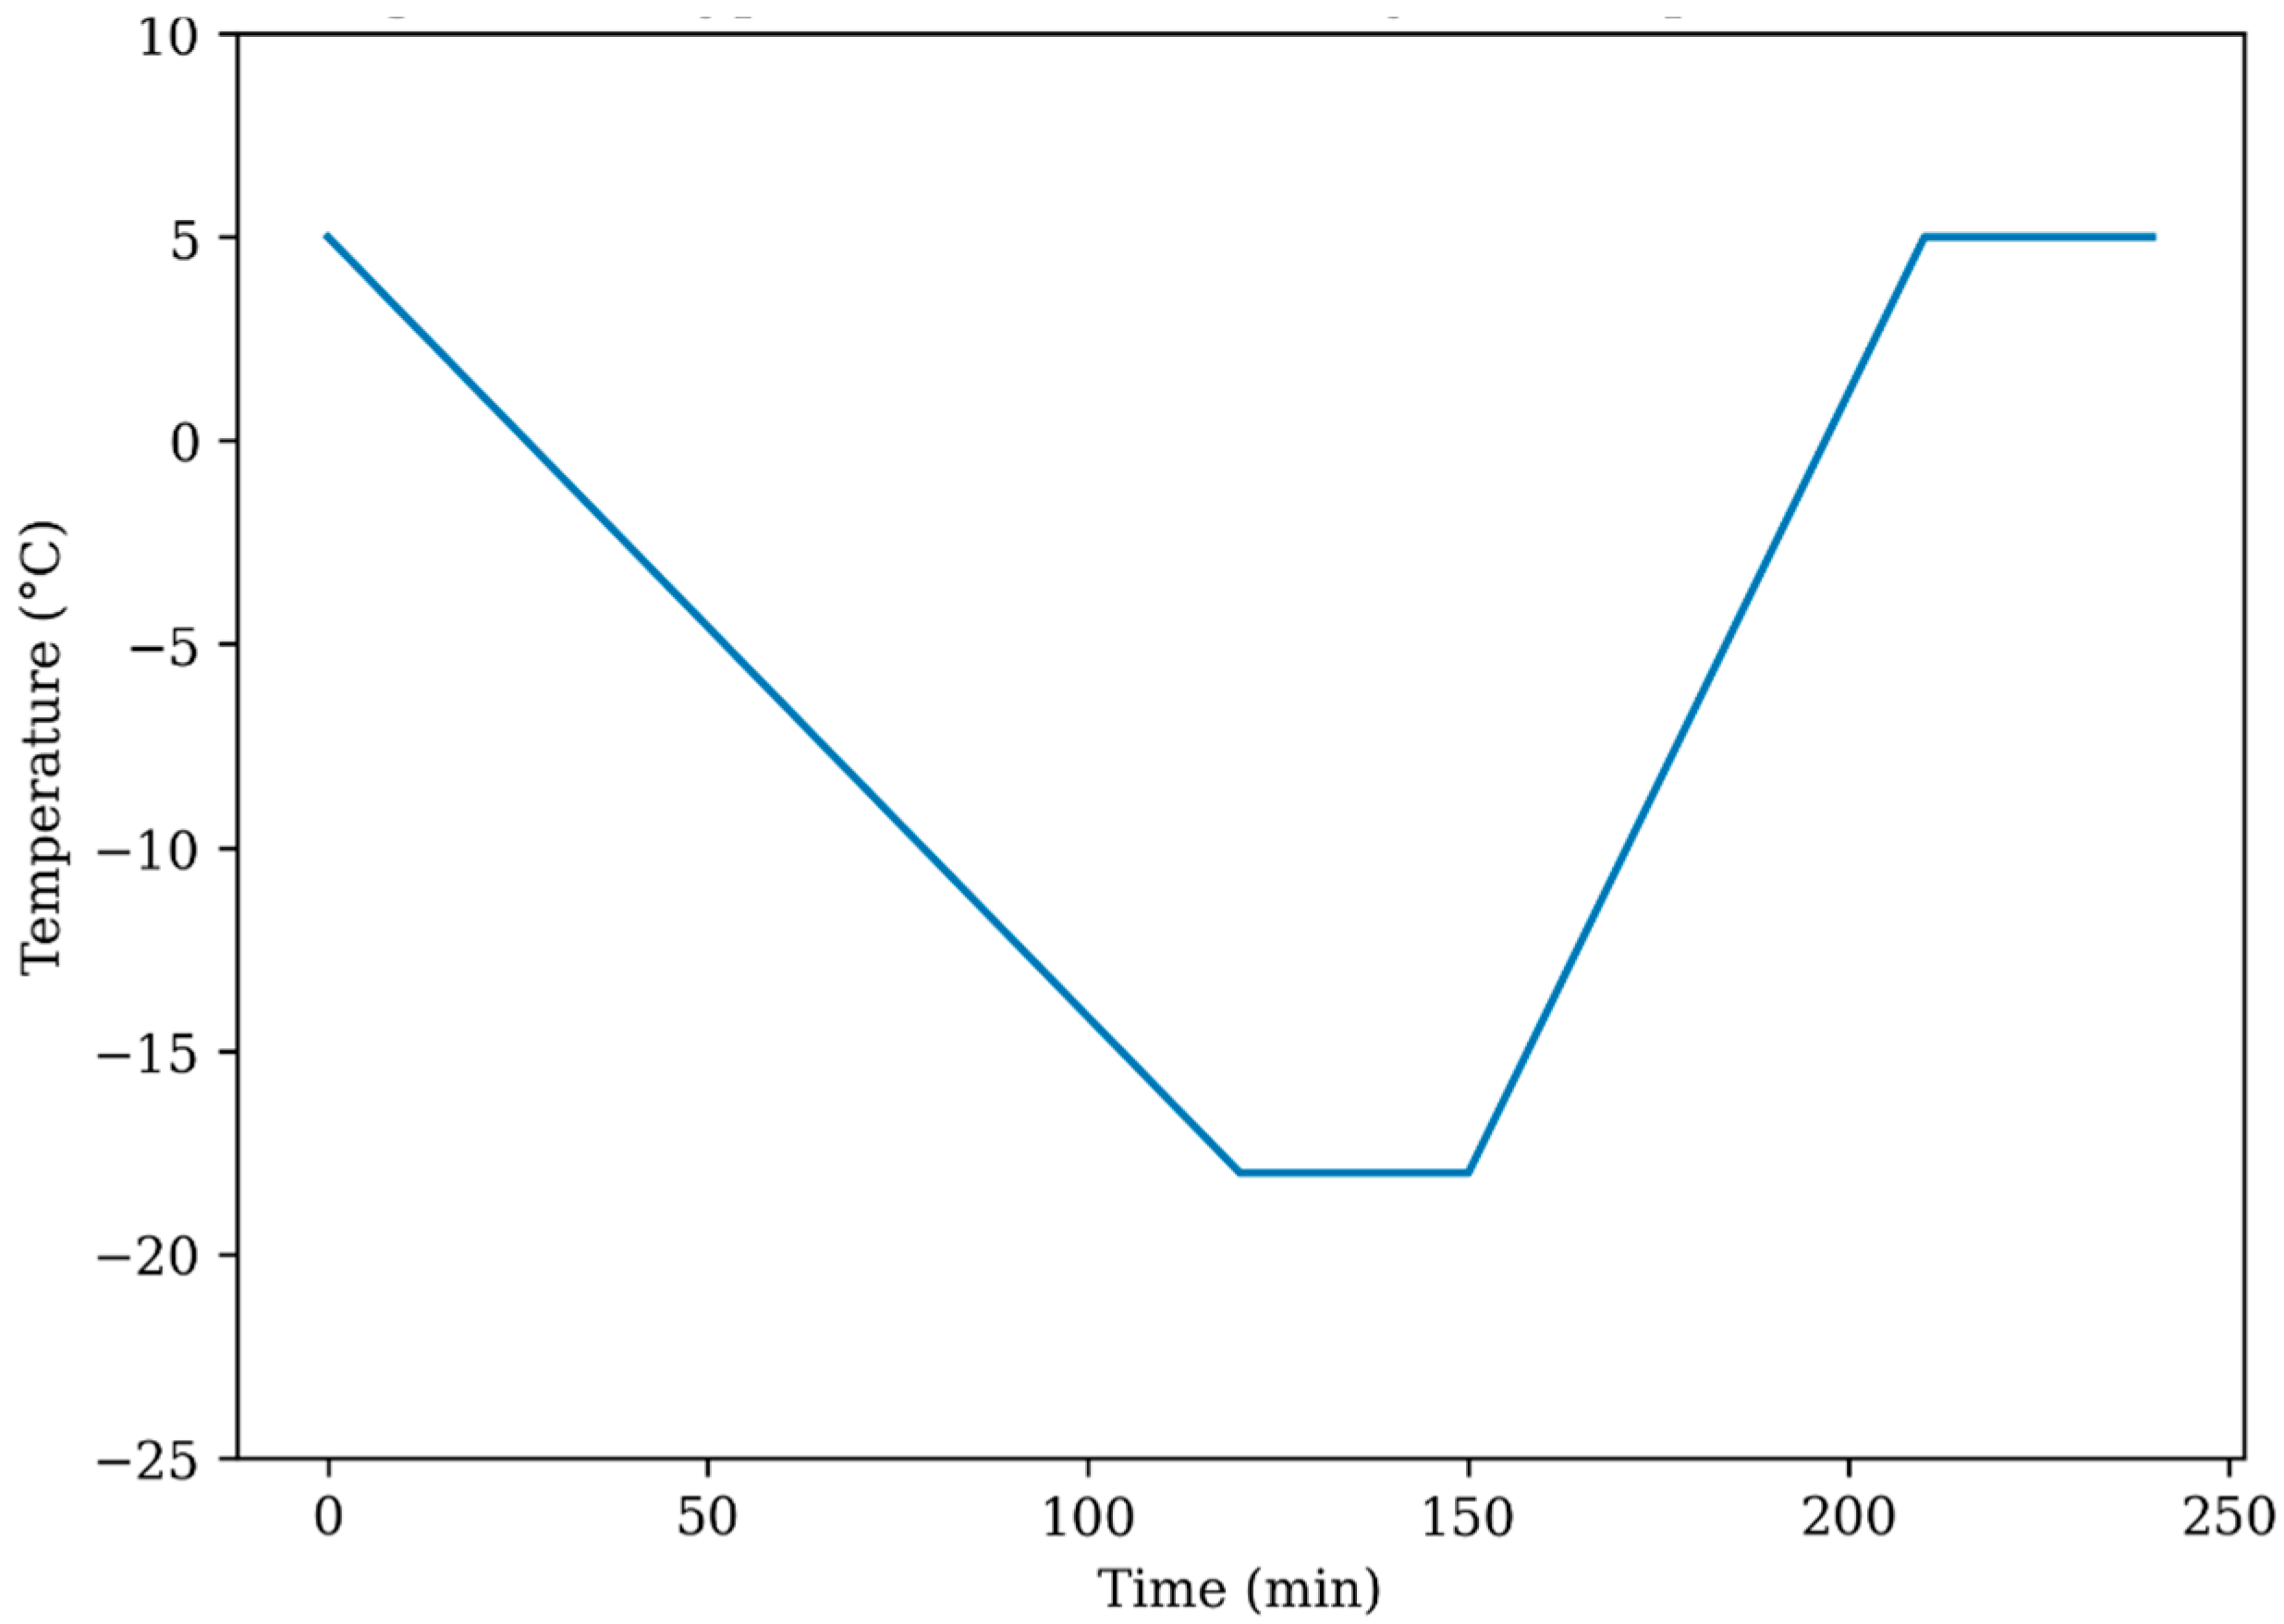
Second, PCM minimises the number of effective freeze–thaw cycles that the interior structure experiences by delaying the beginning of freezing in the pore system. Despite exterior temperatures ranging from −18 °C to +5 °C, PCM regions can see fewer true freeze incidents, extending service life.
The experimental results support this conclusion, showing that under identical external exposure conditions, mixtures containing 12% PCM maintained a substantially higher RDEM after 300 cycles (72.6%) compared to the reference mixture (61.2%). This 11.4% increase can be directly attributed to the temperature-regulating effects of the PCM.
3.2.10. Elastic Buffering of Microcapsule Shells
In addition to latent heat effects, the mechanical qualities of the microcapsule’s shell contribute to frost resistance. The elastic structure of the polymer shell (melamine-formaldehyde resin) allows it to stretch under pressure without tearing. The hydraulic pressure generated by the volumetric expansion (about 9%) of ice within capillary pores has the potential to break the hard cement matrix. Nonetheless, this pressure can induce the elastic shell of a microcapsule to deform, absorbing energy and reducing stress.
This flexible buffering technique is most successful at high PCM concentrations (912%), which are sufficient to produce an infiltrating network of microcapsules in the matrix. At such concentrations, the elastic shells form a dispersed energy-absorbing structure capable of sustaining ice expansion without causing damage to the surrounding cement paste [
19]. This clarification is validated by the SHAP study, which shows its interaction with steel fibres. If the PCM relied solely on thermal management, it would be able to accumulate its benefits regardless of fibre composition. The enhanced effect of PCM in fibre-reinforced mixtures is believed to result from a mechanical contribution. Elastic buffering of the microcapsules reduces the force needed to initiate microscale cracks, thereby easing the stress on the fibres and improving their bridging performance. Although soft inclusions might be expected to weaken matrix integrity, the combined two-step process of thermo-regulation and elastic buffering explains why higher PCM dosages (12%) in conjunction with steel fibres lead to improved performance. Flexible microcapsules are not defects, but rather scattered stress absorbers that protect the rigid cement framework.
3.2.11. Fibre Bridging and Crack Restraint
Steel fibres provide the primary mechanical protection against freeze–thaw degradation by redistributing stress and bridging cracks [
3]. Increased fibre levels have a beneficial effect on predicted lifetime on a periodic basis, and SHAP analysis shows that SF_Vol is the second most significant attribute.
The reinforcing mechanism operates at many scales. Individual fibres bridge incipient cracks at the microscale level, transmitting tensile loads across the crack face and preventing crack opening. This fracture-bridging action prevents isolated microcracks from cracking together (posing a hazard to structural integrity). The fibre network is a three-dimensional structure that forms a strong skeleton on the macroscopic level, keeping the cement structure stiff as it splits [
30]. The experimental RDEM statistics indicate this effect: after 300 cycles, mixes containing 1.2% SF still had 74.3% of RDEM, while the reference (1.2%) had 61.2 percent, which is directly proportional to fibre reinforcement.
The time required for fibres to become effective is a key distinguishing characteristic. In the highly degraded phase (i.e., the phase at which crack networks would otherwise propagate catastrophically), the fibres appear to be quite helpful, as the SHAP dependency graphs reveal that SF_Vol contributions become increasingly positive at even higher cycle numbers. This is consistent with the physical knowledge that fibres do not prevent fracture formation, but rather govern its progression once formed [
7]. Fibre bridging begins to operate only when matrix cracking has occurred.
3.2.12. Quantification of ThermoMechanical Coupling
The SHAP interaction study allows for a quantitative examination of the thermomechanical relationship between PCM and steel fibres. The synergistic contribution can be calculated and assessed by breaking down the prediction into main effects and interaction effects. In the case of an extreme-performance configuration (12% PCM + 1.2%SF), the total SHAP in predicting RDEM is somewhat greater than +5.2 compared to the baseline (average prediction). In this total, approximately 2.8 (54) is due to the significant effects of PCM and SF individually, while 2.4 (46) is due to the interaction effect—the additional benefit above and above simple additivity. This is practically a balanced distribution of the primary and interaction effects, demonstrating quantitatively the coupled configurations’ excellent performance as a result of synergy rather than superposition.
The economic model’s overall SHAP contribution (9% PCM + 0.9% SF) is approximately +3.8, with the main effects being the highest (2.2 or 58%), followed by the interaction effects (1.6 or 42%). The percentage contribution is large, despite the fact that absolute synergy is decreased at such moderate dosages, demonstrating that synergistic advantages are not limited to severe formulations.
A physical explanation for this quantitative synergy is straightforward: PCM reduces stress on the fibre reinforcement system through elastic buffering and temperature regulation. PCM will lessen the displacements necessary for fibres to cross the crack by minimising temperature differences and absorbing frost expansion pressures. Fibres, on the other hand, provide the structural support essential to keep the matrix together while allowing PCM to work in recurrent cycles [
41]. This mutual reinforcement creates a positive feedback loop that benefits both materials, with PCM insulating the matrix to allow fibres to bridge and fibres insulating the matrix to allow PCM to regulate.
The thermomechanical contacting mechanism revealed by SHAP analysis calls into question the traditional idea that all functional additives invariably cause unfavourable interfacial defects and so reduce durability. Instead, the employment of appropriately engineered PCM and steel fibres results in a composite system in which the whole is substantially greater than the sum of its parts. The findings of this study have important significance for building high-durability concrete to be used in hostile locations.
It is important to emphasise that the quantified interaction effects derived from SHAP represent statistical contributions within the predictive model. While these results provide strong evidence of synergy between PCM and steel fibres, the underlying physical mechanisms are inferred based on established material behaviour rather than directly measured in this study. Therefore, the proposed thermomechanical coupling mechanism should be understood as a physically consistent interpretation of the data-driven findings.