1. Introduction
Health emergencies associated with the spread of infectious diseases require rapid and effective responses, including architectural ones. Temporary treatment centers represent an essential infrastructure for managing epidemic outbreaks, particularly in resource-limited settings [
1,
2].
A substantial body of research addresses natural ventilation assessment through field measurements, computational fluid dynamics (CFD), and dynamic simulation tools. While these approaches provide detailed and accurate representations of airflow behavior, they typically assume stable building typologies, time for iterative modelling, and access to detailed geometric and operational inputs. Such conditions are often not met during the rapid deployment or adaptation of temporary healthcare facilities in emergency contexts.
Depending on the type of pathogen and its transmission route, infection control may require different design strategies: in the case of respiratory diseases transmitted through the air—such as COVID-19, SARS, or influenza—ventilation represents a key factor for contagion prevention [
3], while for viruses such as Ebola and Marburg, transmitted mainly through direct (and indirect) contact with the body fluids of infected individuals or animals, natural ventilation can still contribute to improving environmental comfort and reducing secondary risks, even though it is not a primary containment measure [
4,
5].
Among the passive strategies recommended by the World Health Organization (WHO), natural ventilation represents an effective and sustainable solution for ensuring air renewal and indoor air quality, particularly in contexts with limited access to energy or technological resources [
6,
7]. However, the design of reliable natural ventilation systems is made complex by the dynamic nature of the physical phenomena that drive it—wind and thermal buoyancy—and by their interaction with behavioral variables such as window operation and occupant presence [
8,
9].
Standard formulas for calculating the instantaneous airflow rate Q [m
3/s or L/s], based on physical parameters such as wind speed, temperature difference, or pressure coefficients, require hourly climatic data and construction details that are often unavailable in field conditions [
7,
10]. They are also frequently based on knowledge of indoor temperature, which in turn depends on the ventilation airflow rate itself. Although detailed climatic datasets are increasingly accessible through open databases, their effective use still requires time, technical expertise, and reliable site and building-specific assumptions. In emergency response and early-stage design, decisions often need to be taken under severe uncertainty, making simplified tools particularly valuable. Even simplified ventilation equations still require several climatic and geometric parameters that may not be readily available during emergency deployments. This limitation has the effect of reducing the applicability of conventional models at the early design stage, particularly in emergency situations where decisions must be made rapidly, creating the need for operational tools that can support rapid design decisions using a minimal set of inputs.
To overcome this limitation, the present work proposes a simplified equation for estimating natural ventilation, designed to support designers in the preliminary definition of openings and spatial configurations, even in the absence of detailed climatic data. This study proposes and tests a simplified, low-data workflow intended to support rapid, early-stage decision-making in temporary healthcare facilities during emergencies.
The proposal is based on dynamic simulations carried out using Design Builder (Version 7.3.1.003) and EnergyPlus (E+) (Version 9.4) [
11] on two existing treatment centers, located in Equatorial Guinea and Ivory Coast, and further analyzed in three additional climatic contexts—beyond their original construction sites—using meteorological data from open-access sources [
12,
13]. The simulation results were compared with the values obtained from the formulas adopted by the World Health Organization (WHO) and the British Standards Institution, as well as with those generated by the simplified equation developed in this work [
7,
14]. The objective is to assess the consistency and accuracy of the proposed model, providing a practical field contribution to the architectural design of healthcare facilities [
5,
15] and to the performance verification of existing buildings.
In this perspective, the study represents a first step toward the definition of simplified operational tools for the design of natural ventilation in emergency contexts. However, given the limited number of analyzed case studies, further research is required to expand the sample and verify the robustness of the proposed approach across different architectural and climatic configurations. The research group intends to continue developing this work, inviting the scientific community to contribute through additional case studies and field measurements to progressively consolidate a shared methodological framework.
2. Background
To understand the limitations and potential of natural ventilation strategies in health emergency contexts, it is necessary to situate this research within the existing scientific debate. Previous studies have highlighted both the central role of ventilation in infection prevention and control and the operational difficulties associated with the availability and quality of data required by conventional models.
Natural ventilation represents one of the oldest and most effective passive strategies to ensure air renewal and improve indoor environmental quality. Pioneering studies [
8,
9] provided a solid theoretical framework for understanding the physical phenomena that govern its functioning, distinguishing the two main driving forces—wind and thermal buoyancy—and developing mathematical models for estimating airflow rates. More recently, engineering and architectural approaches have emphasized the role of natural ventilation as a low-tech and sustainable solution, capable of combining health, comfort, and reduced energy consumption [
16,
17].
In the healthcare sector, the World Health Organization (WHO) has included natural ventilation among the main strategies for infection control in facilities with low technological access [
5,
7,
14]. In the manual for the
Severe Acute Respiratory Infections Treatment Centre (SARI) [
5], passive ventilation is recommended as a preventive measure to improve air renewal in the absence of mechanical systems. However, the design of effective systems remains a challenge, since the available formulas—as well as the more recent approaches based on infection risk assessment [
15]—require hourly climatic data, aerodynamic coefficients, and geometric parameters that are often inaccessible or difficult to obtain in emergency situations.
Several technical standards, such as the
Code of practice for Design of buildings: ventilation principles and designing for natural ventilation (BS 5925, 1980) [
14] and the ASHRAE
Handbook-Fundamentals (2009) [
10], propose well-established methods for calculating ventilation rates. Although accurate, these tools are complex and scarcely applicable in emergency or first-response contexts, where both time and available information are limited. Experimental validation studies [
15,
18] have also shown the difficulty of obtaining reliable predictions when real wind and temperature conditions vary rapidly. Although these models provide accurate estimations in controlled conditions, they are not widely used in emergency design due to the detailed climatic inputs and complex calculations required, which are difficult to manage during the rapid deployment of those facilities.
These challenges become even more evident in vulnerable contexts, as demonstrated by recent research on the need for resilient and low-technology housing solutions [
19]. In such scenarios, the speed of implementation becomes more relevant than absolute computational precision, and the use of simplified models can represent a necessary compromise to ensure minimum safety and comfort conditions. Moreover, research on analytical ventilation models points out their limited applicability when dealing with complex geometries or variable conditions [
15,
18].
The gap identified in the literature is therefore clear: on the one hand, accurate models and formulas for natural ventilation calculation are available; on the other, there is still a lack of an operational tool that can be immediately applied during emergency situations, guiding design decisions with a minimal set of input data. It is from this need that the present research originates, aiming to propose and test a simplified equation for estimating airflow rates in temporary healthcare contexts. This gap motivates the development of operational tools that are low-data, and explicitly bounded in scope, particularly for planning in emergencies.
3. Materials and Methods
This research focuses on the evaluation of natural ventilation strategies in infectious disease treatment centers, with the objective of proposing a simplified equation for estimating airflow rates in emergency contexts where access to detailed climatic and environmental data may be limited or non-existent.
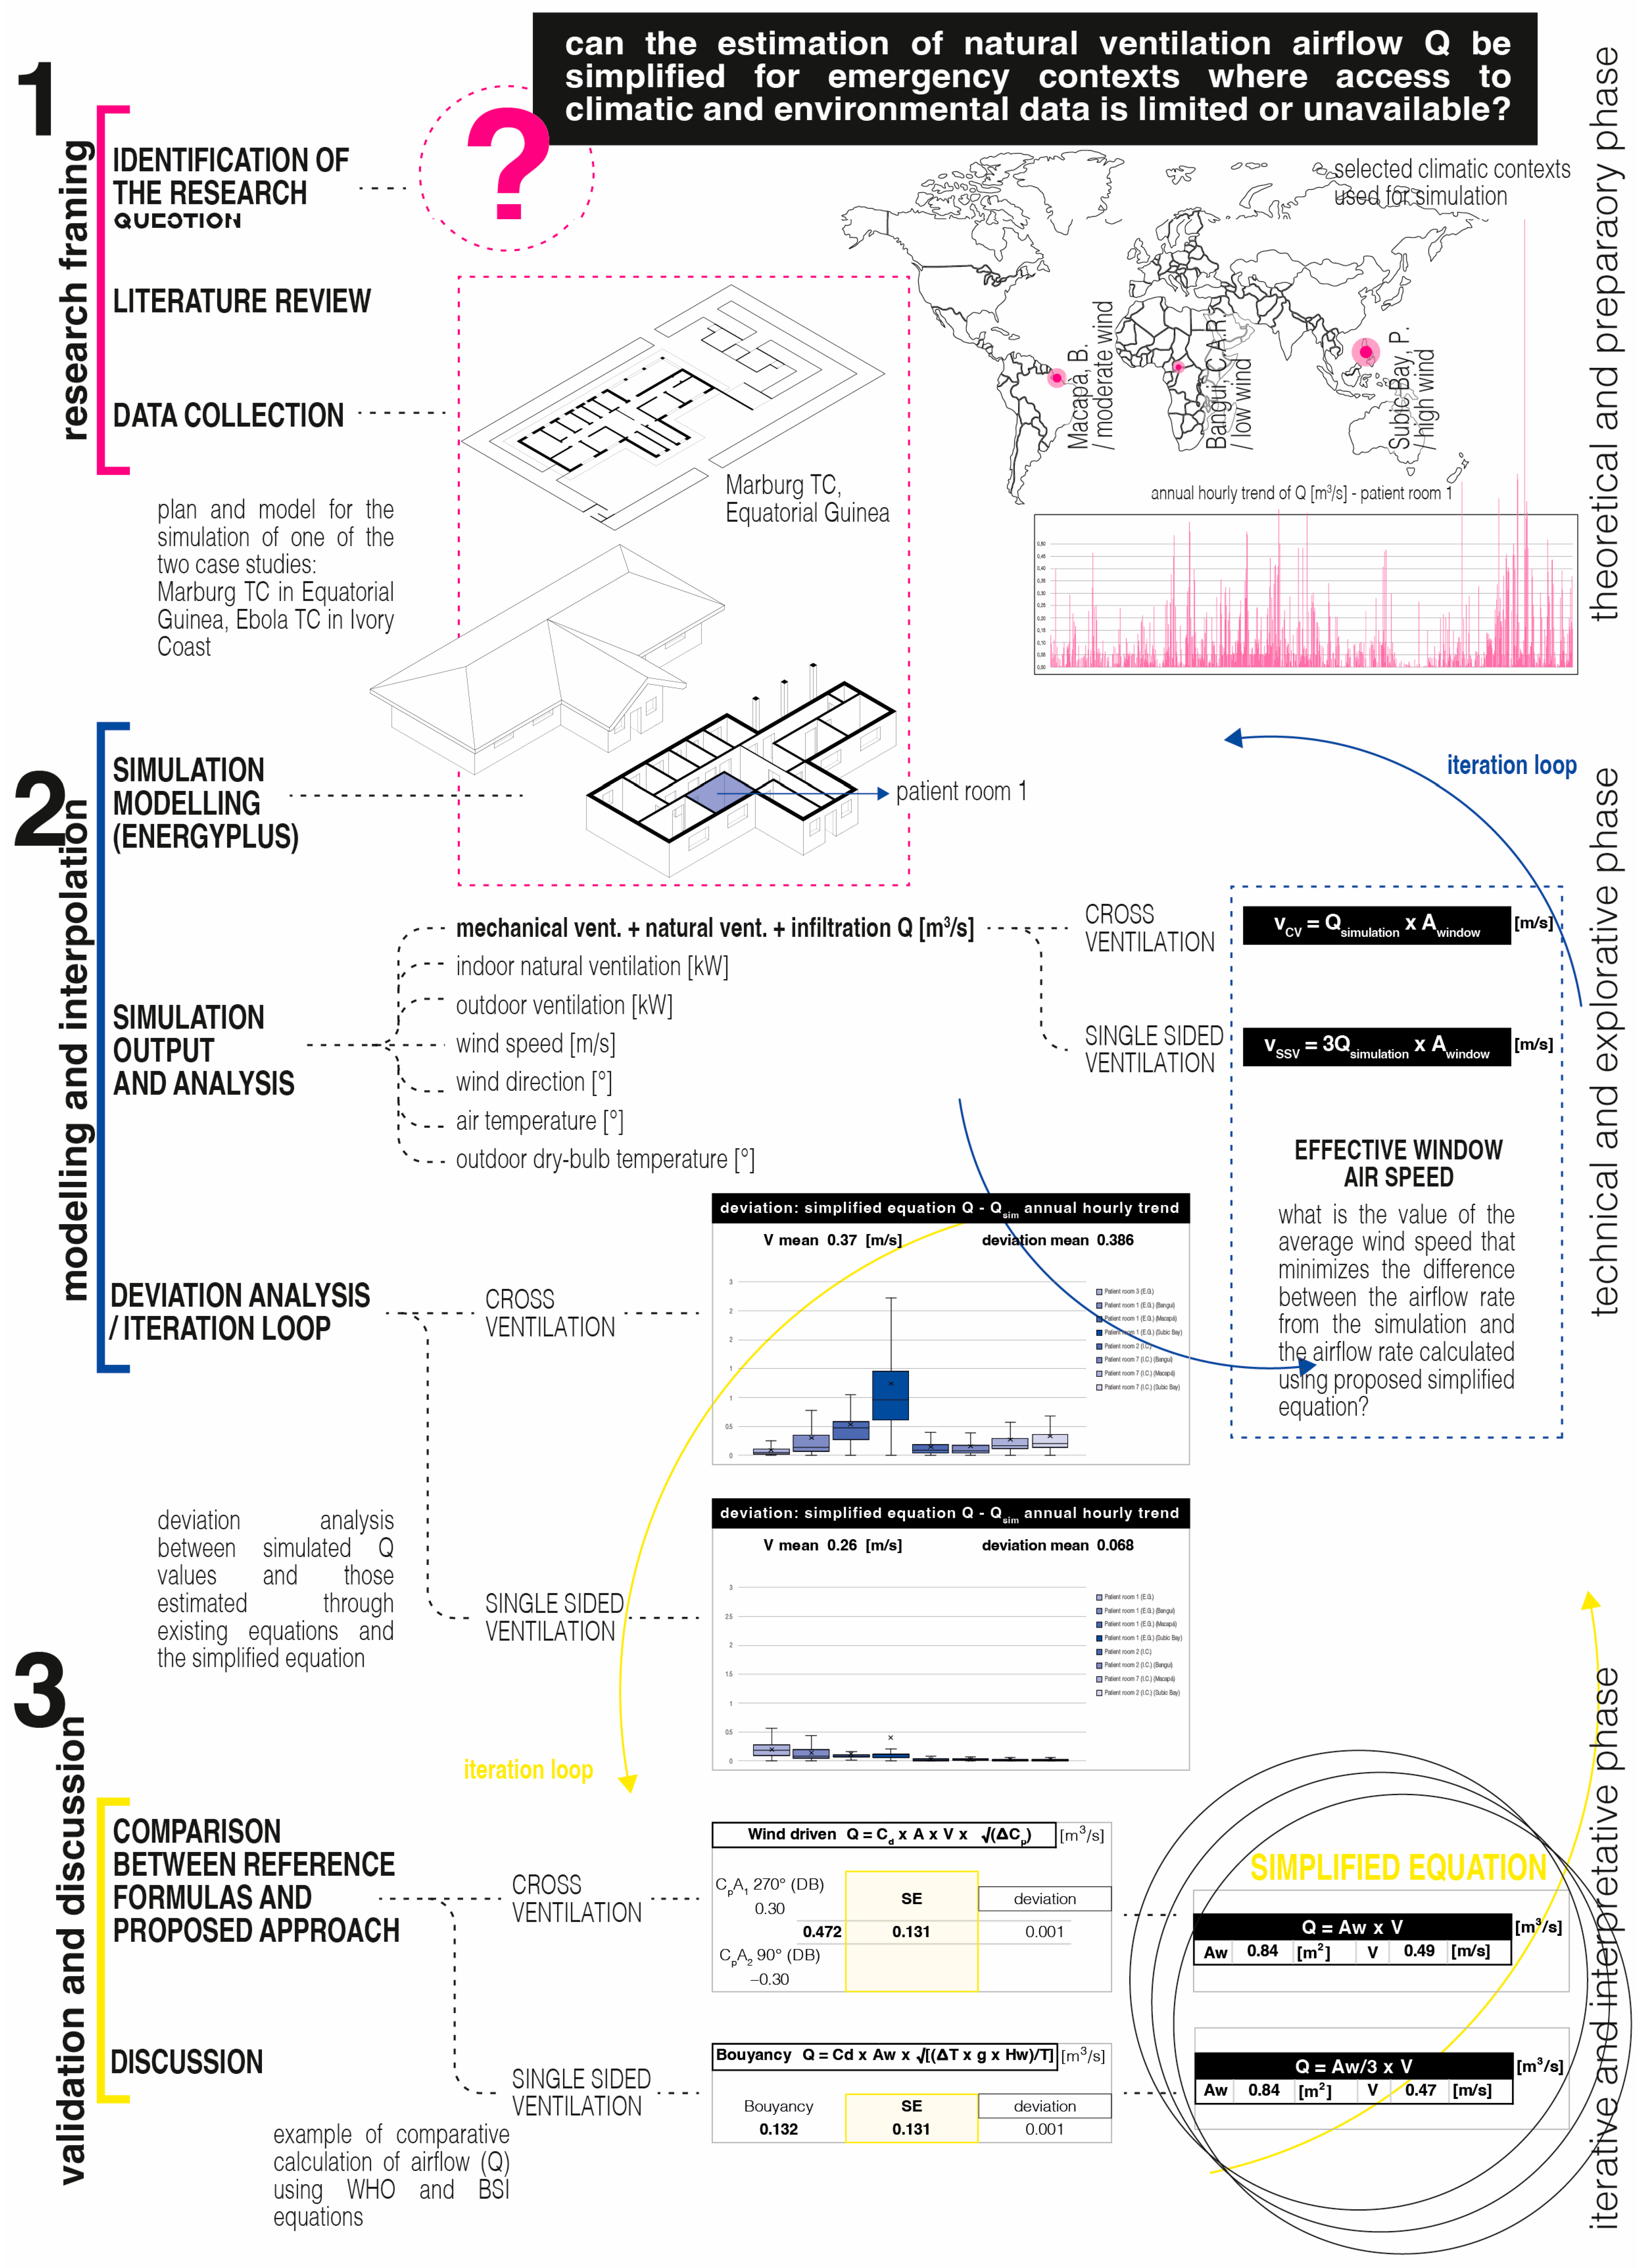
The study was structured into three main phases:
Phase 1: Definition of the theoretical and methodological framework, including the identification of the research question, literature review, and collection of baseline data;
Phase 2: Modeling and simulation using EnergyPlus (E+), followed by result analysis and iterative consistency and plausibility checks
Phase 3: Comparison between simulated values, existing reference formulas (WHO, BSI, ASHRAE), and the proposed simplified equation, followed by a critical discussion of the findings.
The overall workflow integrating these steps and illustrating the relationships among the various phases is shown in
Figure 1.
Natural ventilation is a complex phenomenon governed by two main physical drivers: wind and thermal buoyancy. Both are highly variable over time and also influenced by behavioral factors, such as the opening and closing of doors and windows or the presence of occupants. Although consolidated mathematical models exist for calculating the instantaneous airflow rate Q [m
3/s or L/s] generated by each mechanism [
8,
9,
18], they require a large amount of input data: local wind speed and direction, indoor and outdoor temperature, opening height and area, for each hour of the year. Such data are often inaccessible in field conditions, especially during emergency situations [
6,
7].
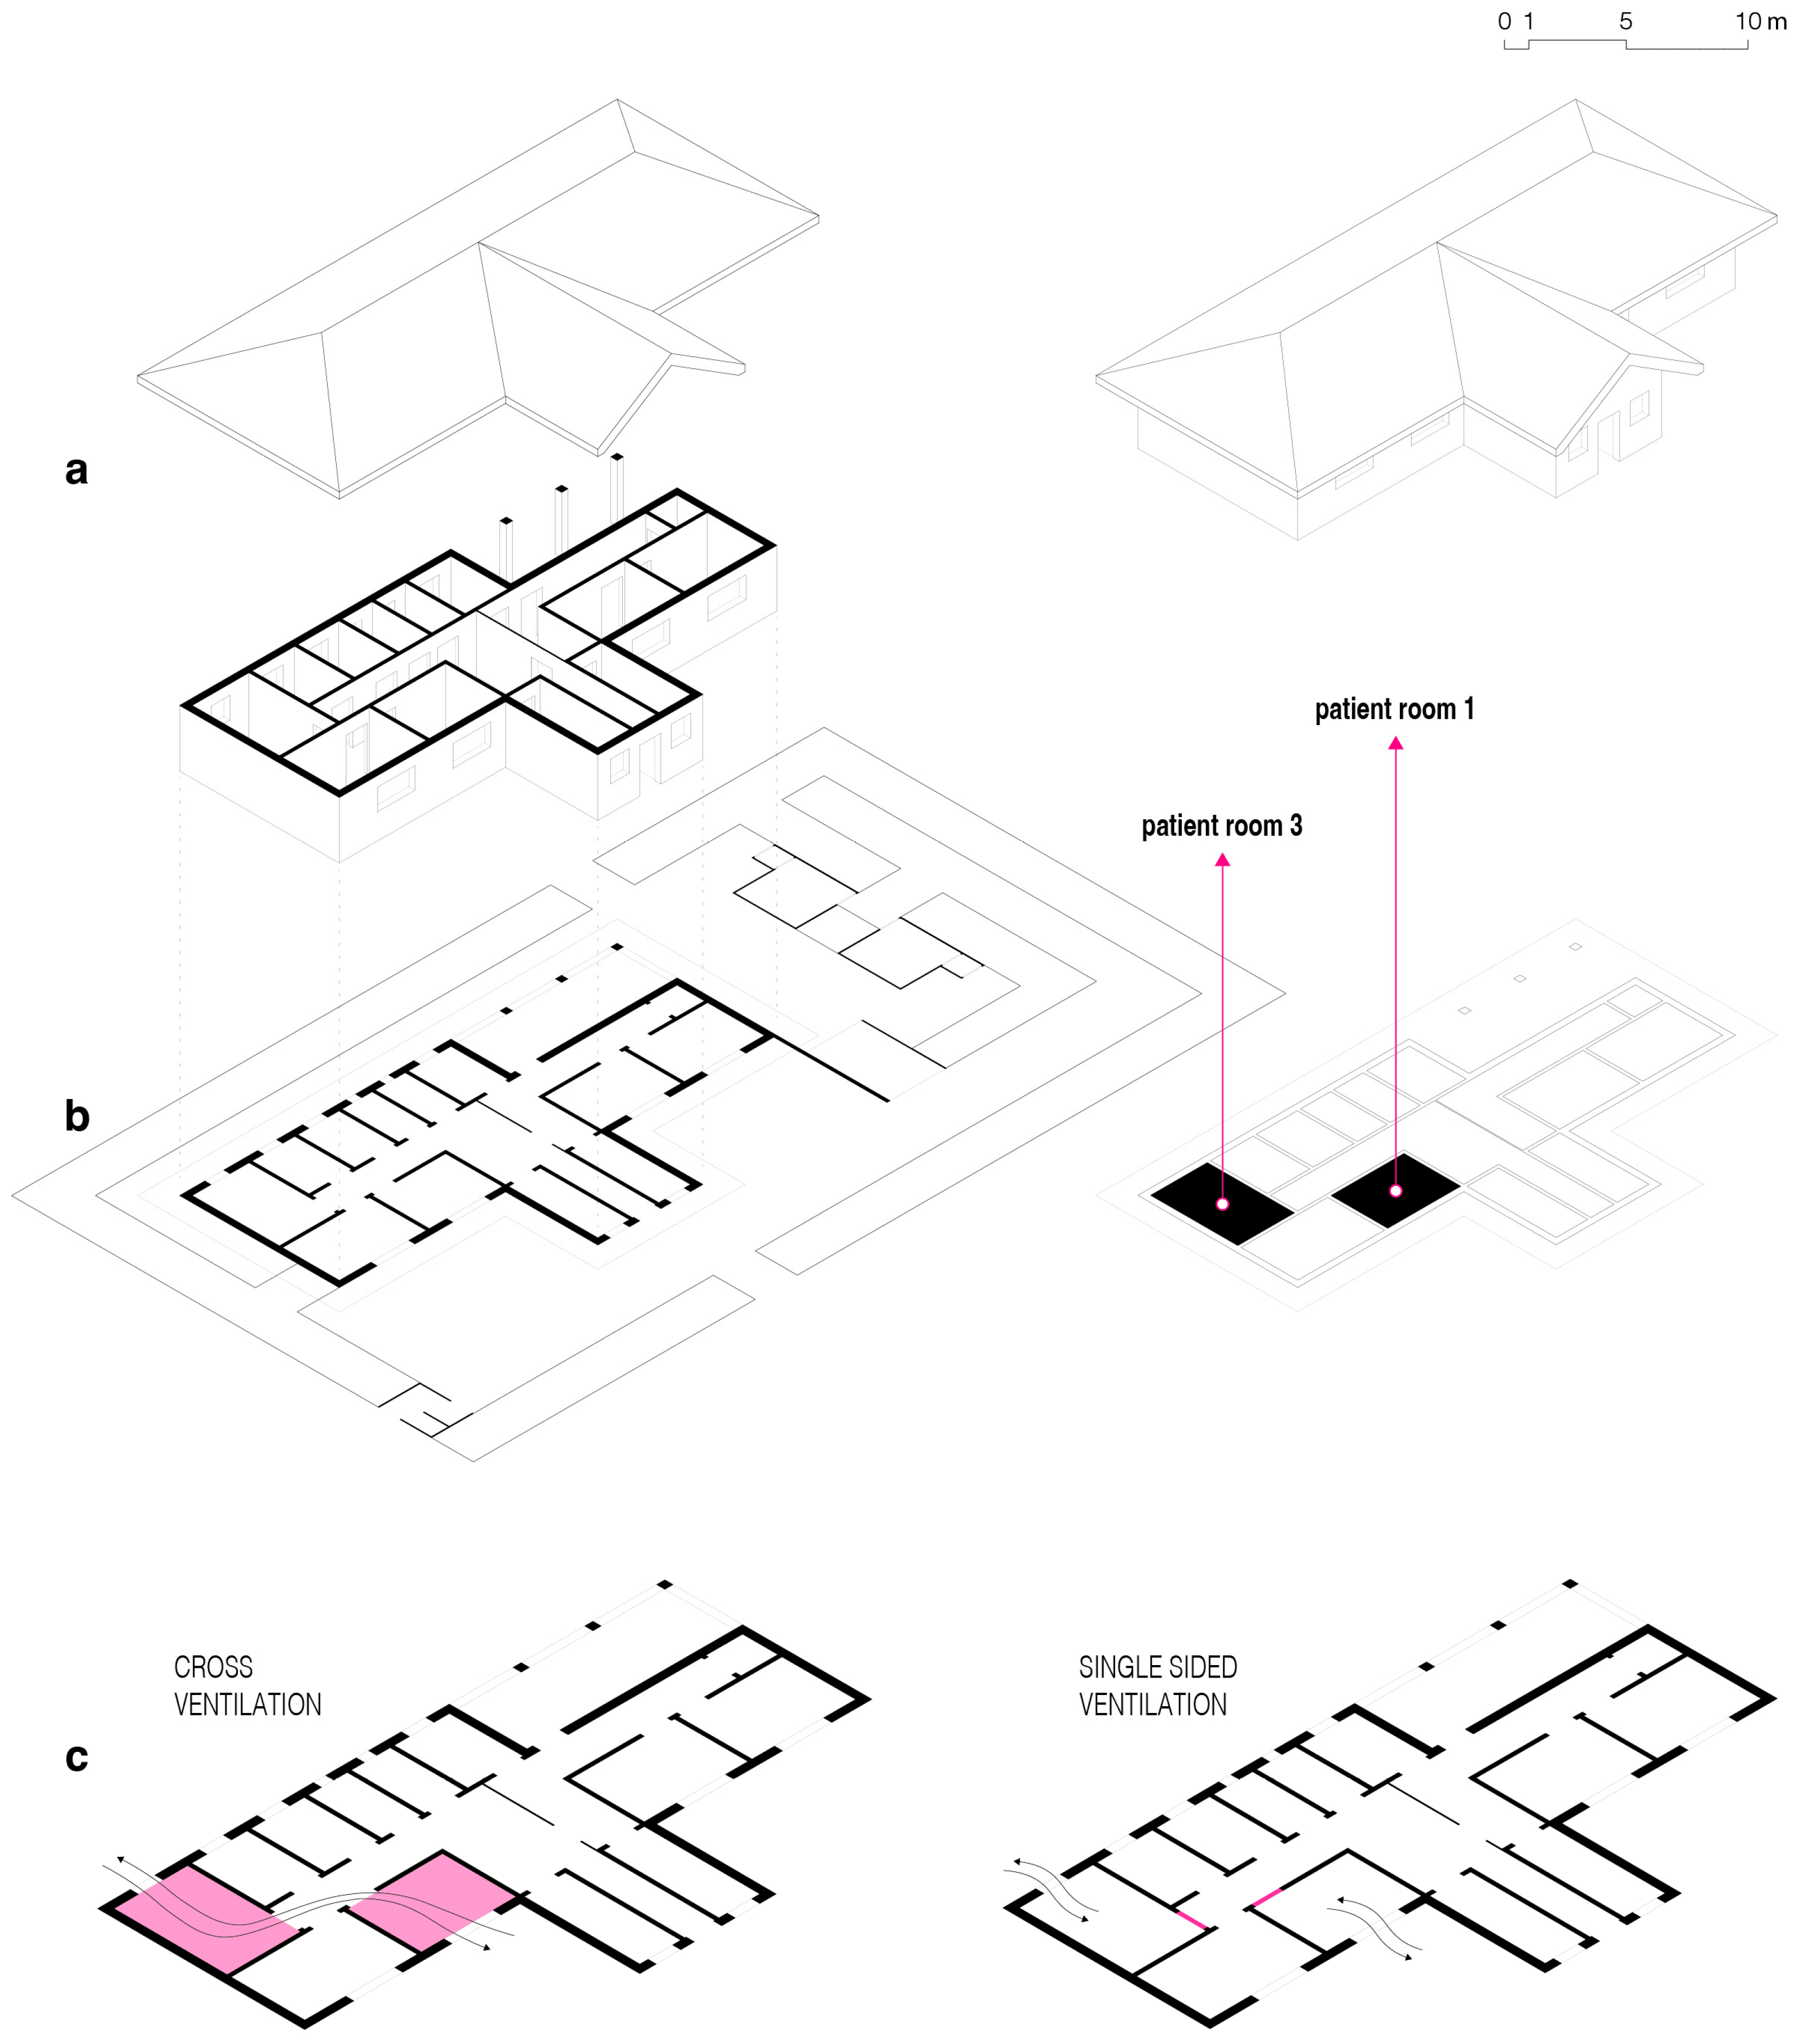
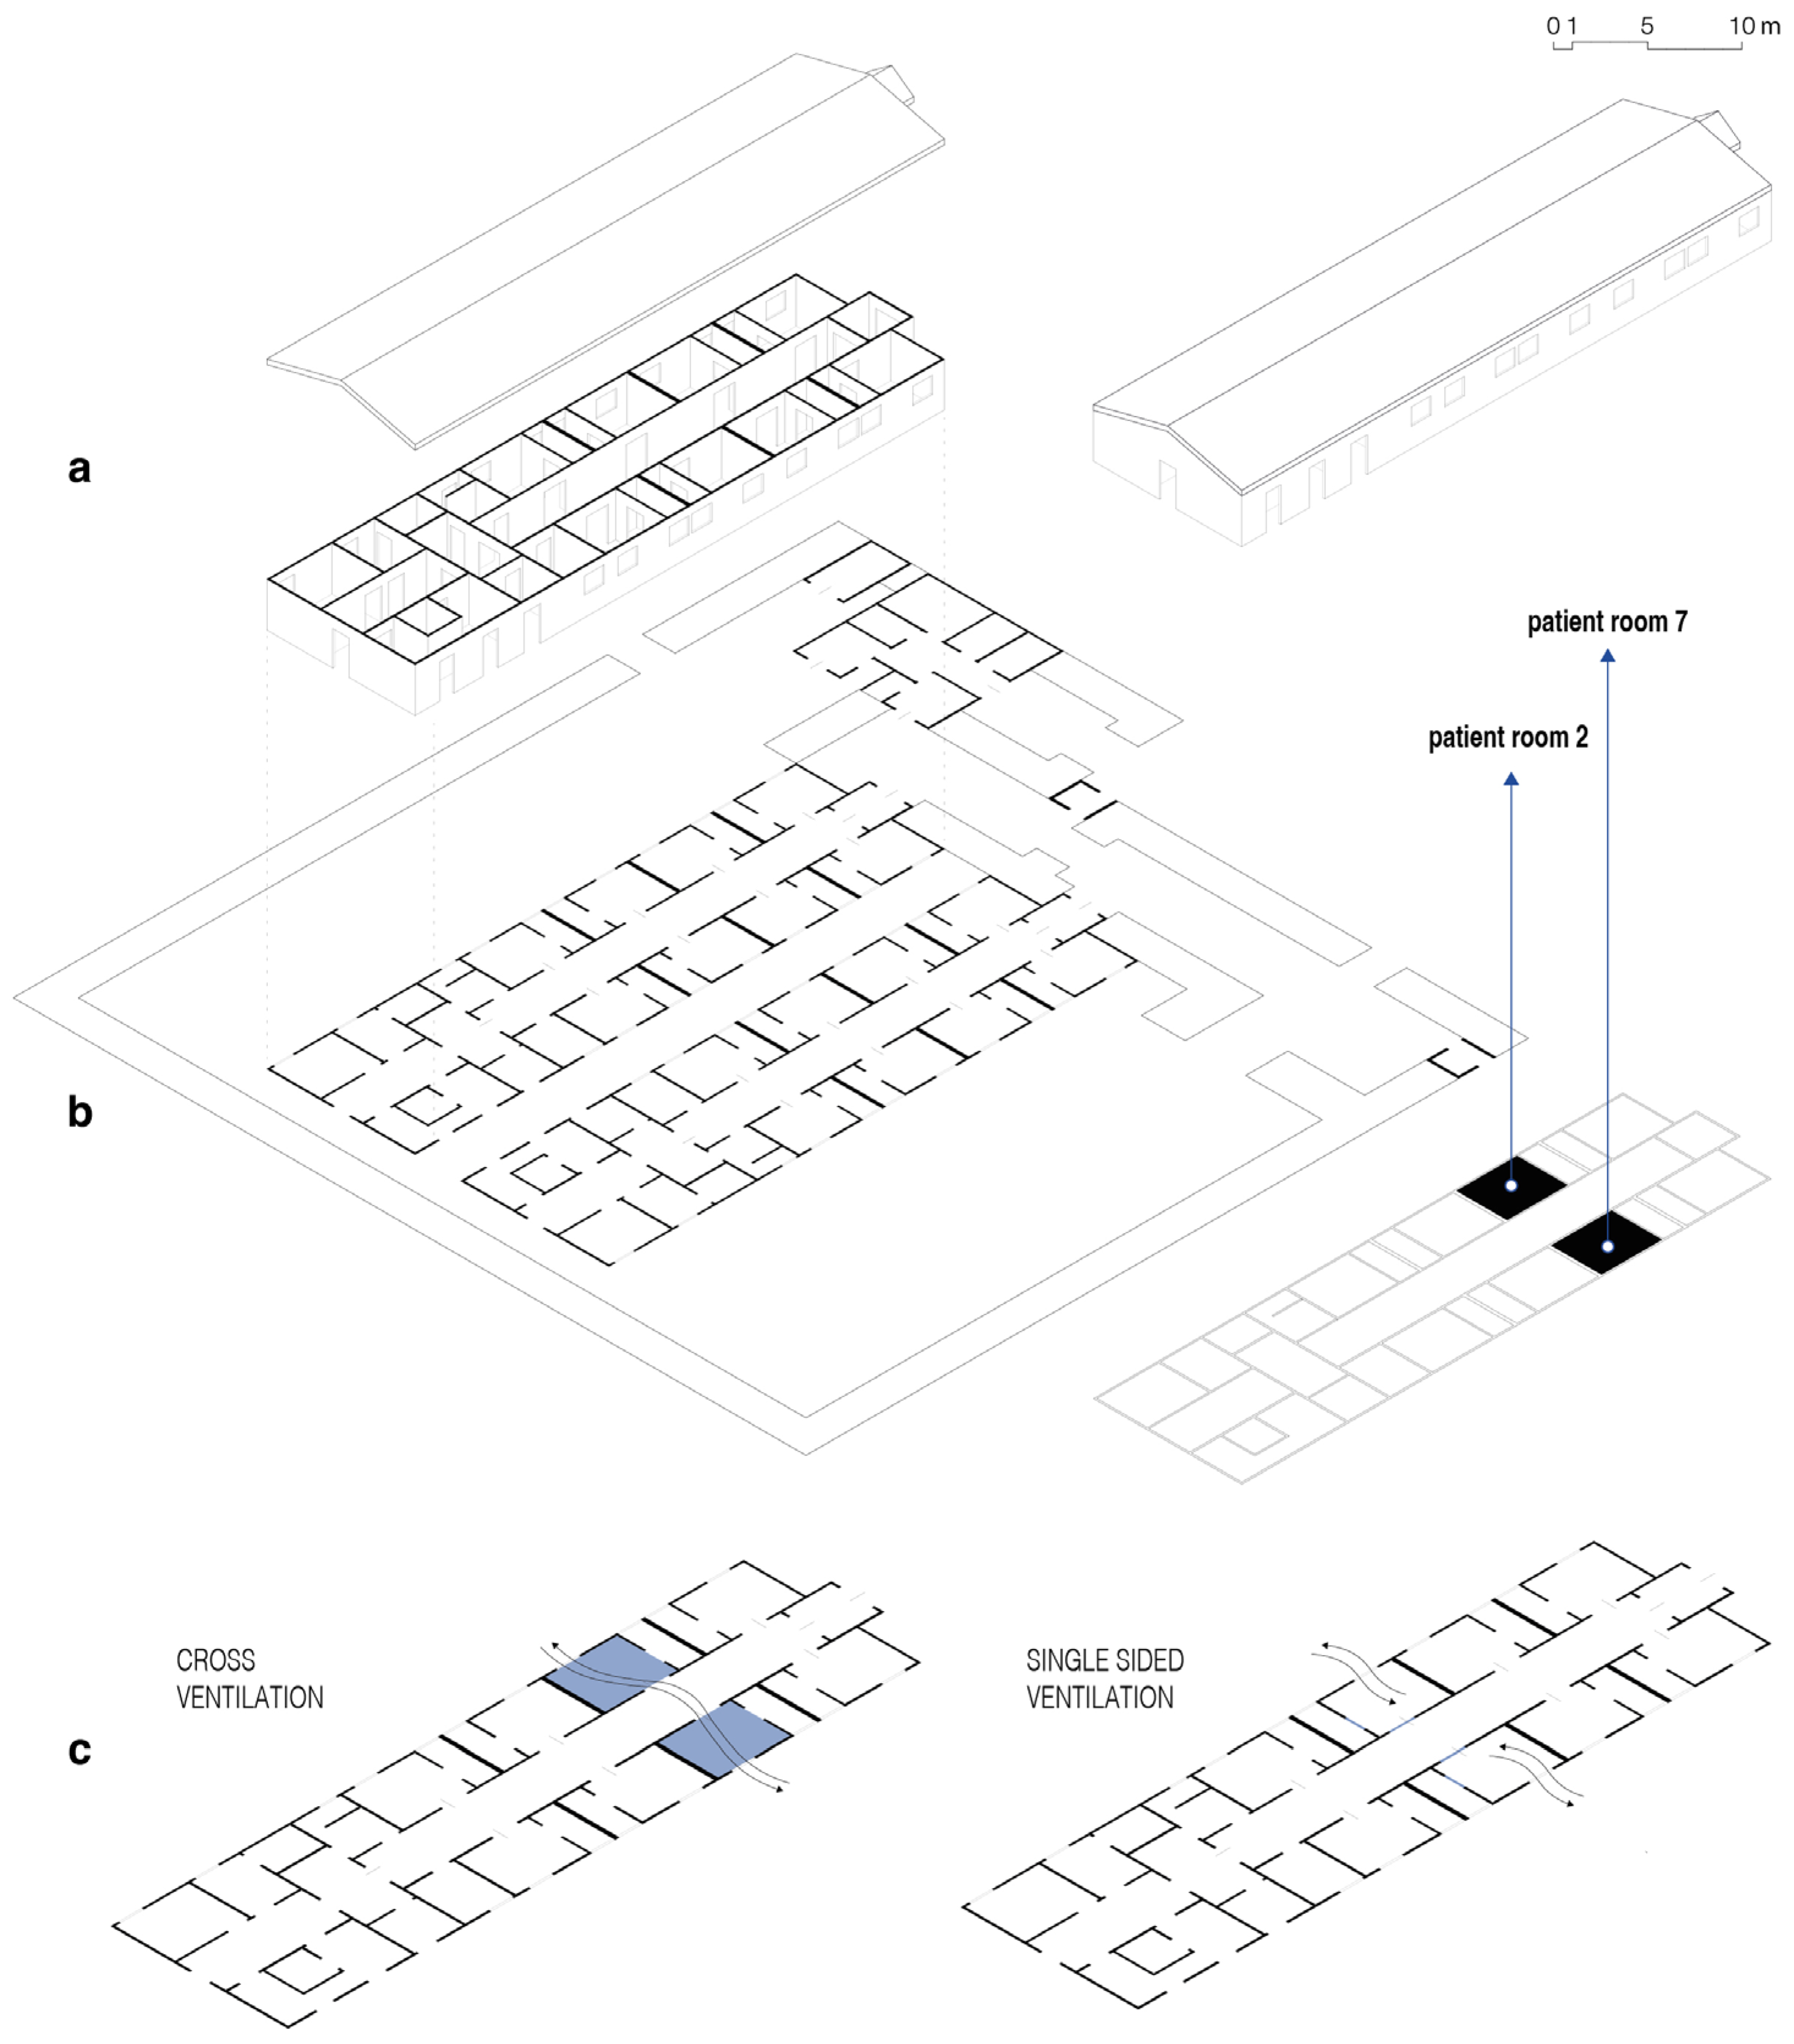
To explore the possibility of adopting a simplified methodology, two documented treatment centers were modeled: one in Equatorial Guinea, built in 2023 in response to the Marburg epidemic, and one in Ivory Coast, constructed in 2020 as part of preventive planning measures following Ebola and Marburg outbreaks in the region. The 3D models were developed in Design Builder and simulated using the EnergyPlus (E+) engine to model natural ventilation under both single-sided and cross-ventilation configurations [
11].
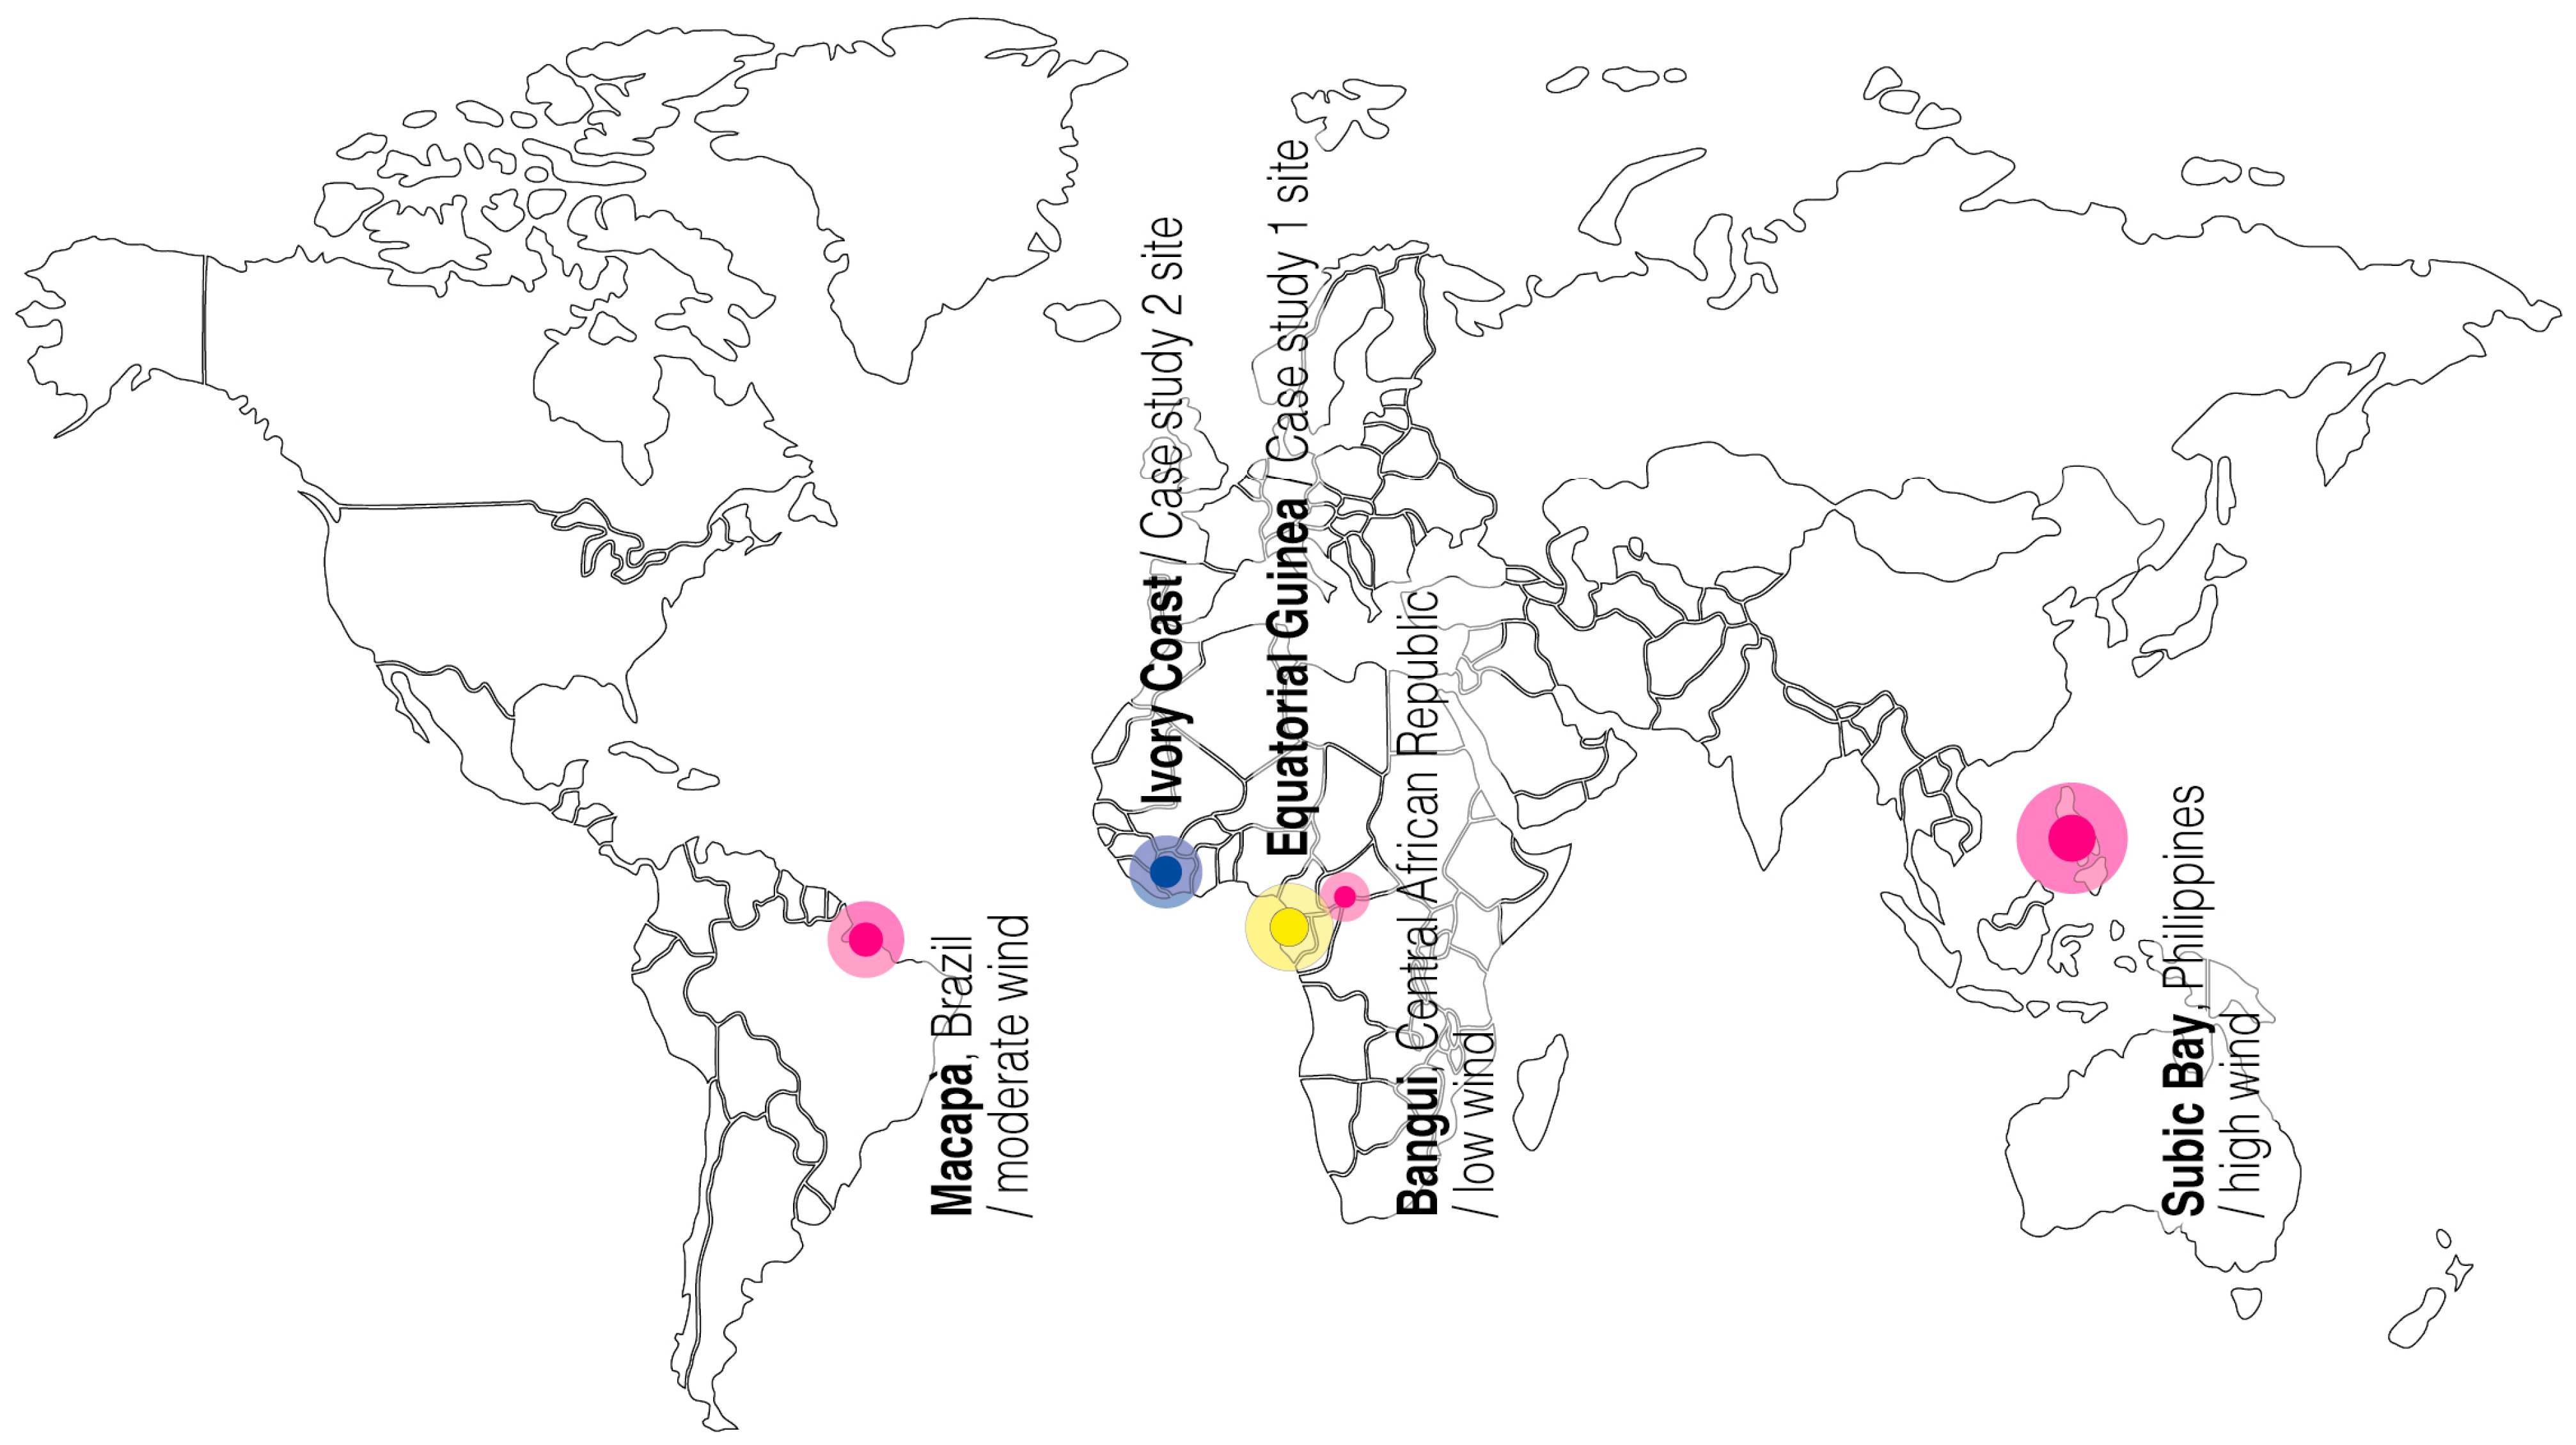
Each center was subjected to simulations under four climatic conditions:
The actual site conditions of the buildings (Equatorial Guinea and Ivory Coast);
Three additional scenarios representative of different wind exposure levels, selected according to average wind intensity and variability:
Bangui (Central African Republic)—low wind exposure;
Macapá (Brazil)—medium wind exposure;
Subic Bay (Philippines)—high wind exposure.
The classification into low, medium, and high wind exposure was based on mean annual wind speed and variability, as derived from the .epw climate datasets used in the simulations.
The selection was made to verify the sensitivity of results to different anemometric conditions (average wind speed, prevailing direction, and variability of speed and direction over time), based on hourly climatic data from .epw meteorological files available in open-access databases [
12,
13], consistent with other simplified approaches for rapid-response design [
15,
19].
The main simulation assumptions are explicitly reported in
Table 1, including climatic data sources, geometric inputs, window opening assumptions, and key EnergyPlus (E+) settings. These assumptions were adopted to ensure comparability between the different climatic scenarios and case studies. It should be noted, however, that variations in opening ratios, occupancy patterns, or indoor thermal conditions may influence ventilation behavior. Therefore, the selected parameters represent controlled modelling conditions rather than the exact operational settings of real facilities.
Simulations were carried out using EnergyPlus (E+), obtaining hourly natural ventilation flow rates for an entire typical year.
Subsequently, the average values of these simulated flow rates were compared with those calculated using the formulas indicated by the World Health Organization (WHO) in the Manual for
Severe Acute Respiratory Infections Treatment Centre (SARI)—for the design of passive ventilation systems in healthcare facilities—and by the British Standards Institution in the
Code of practice for Design of buildings: ventilation principles and designing for natural ventilation [
5,
7,
14].
Single-sided ventilation formulas:
Wind-driven:
where A
w is the smallest openable area [m
2] and V is the incident wind speed [m/s] [
5];
Wind-driven:
where A
w is the smallest openable area [m
2] and V is the incident wind speed [m/s] [
14];
Buoyancy-driven flow [
15]:
where the discharge coefficient C
d is estimated according to the ASHRAE
Handbook-Fundamentals [
10] as
where ΔT is the indoor–outdoor temperature difference, g is the gravitational acceleration (9.81 m/s
2), H is the height of the openings, and T is the absolute indoor temperature.
Cross-ventilation formula:
Wind-driven:
where C
d is the discharge coefficient, ΔC
p is the pressure coefficient difference between the two facades, depending on wind incidence angle and building geometry (typical values range from 0.3 to 0.65 [
10]), and A
w is the equivalent area of the opposite openings, calculated as
with A
1 and A
2 representing the openings on one facade, and A
3 and A
4 representing those on the opposite facade [
14].
These formulas are mainly derived from steady-state mass and energy balance assumptions and are used to estimate airflow rates corresponding to specific values of wind speed or temperature difference, typically associated with hourly time steps.
In other words, they can be applied using average values of temperature, wind speed, and direction.
The mean wind speed, along with its intensity and prevailing direction, is easier to obtain than hourly-resolved data and can be used in emergency contexts where time constraints prevent detailed simulations.
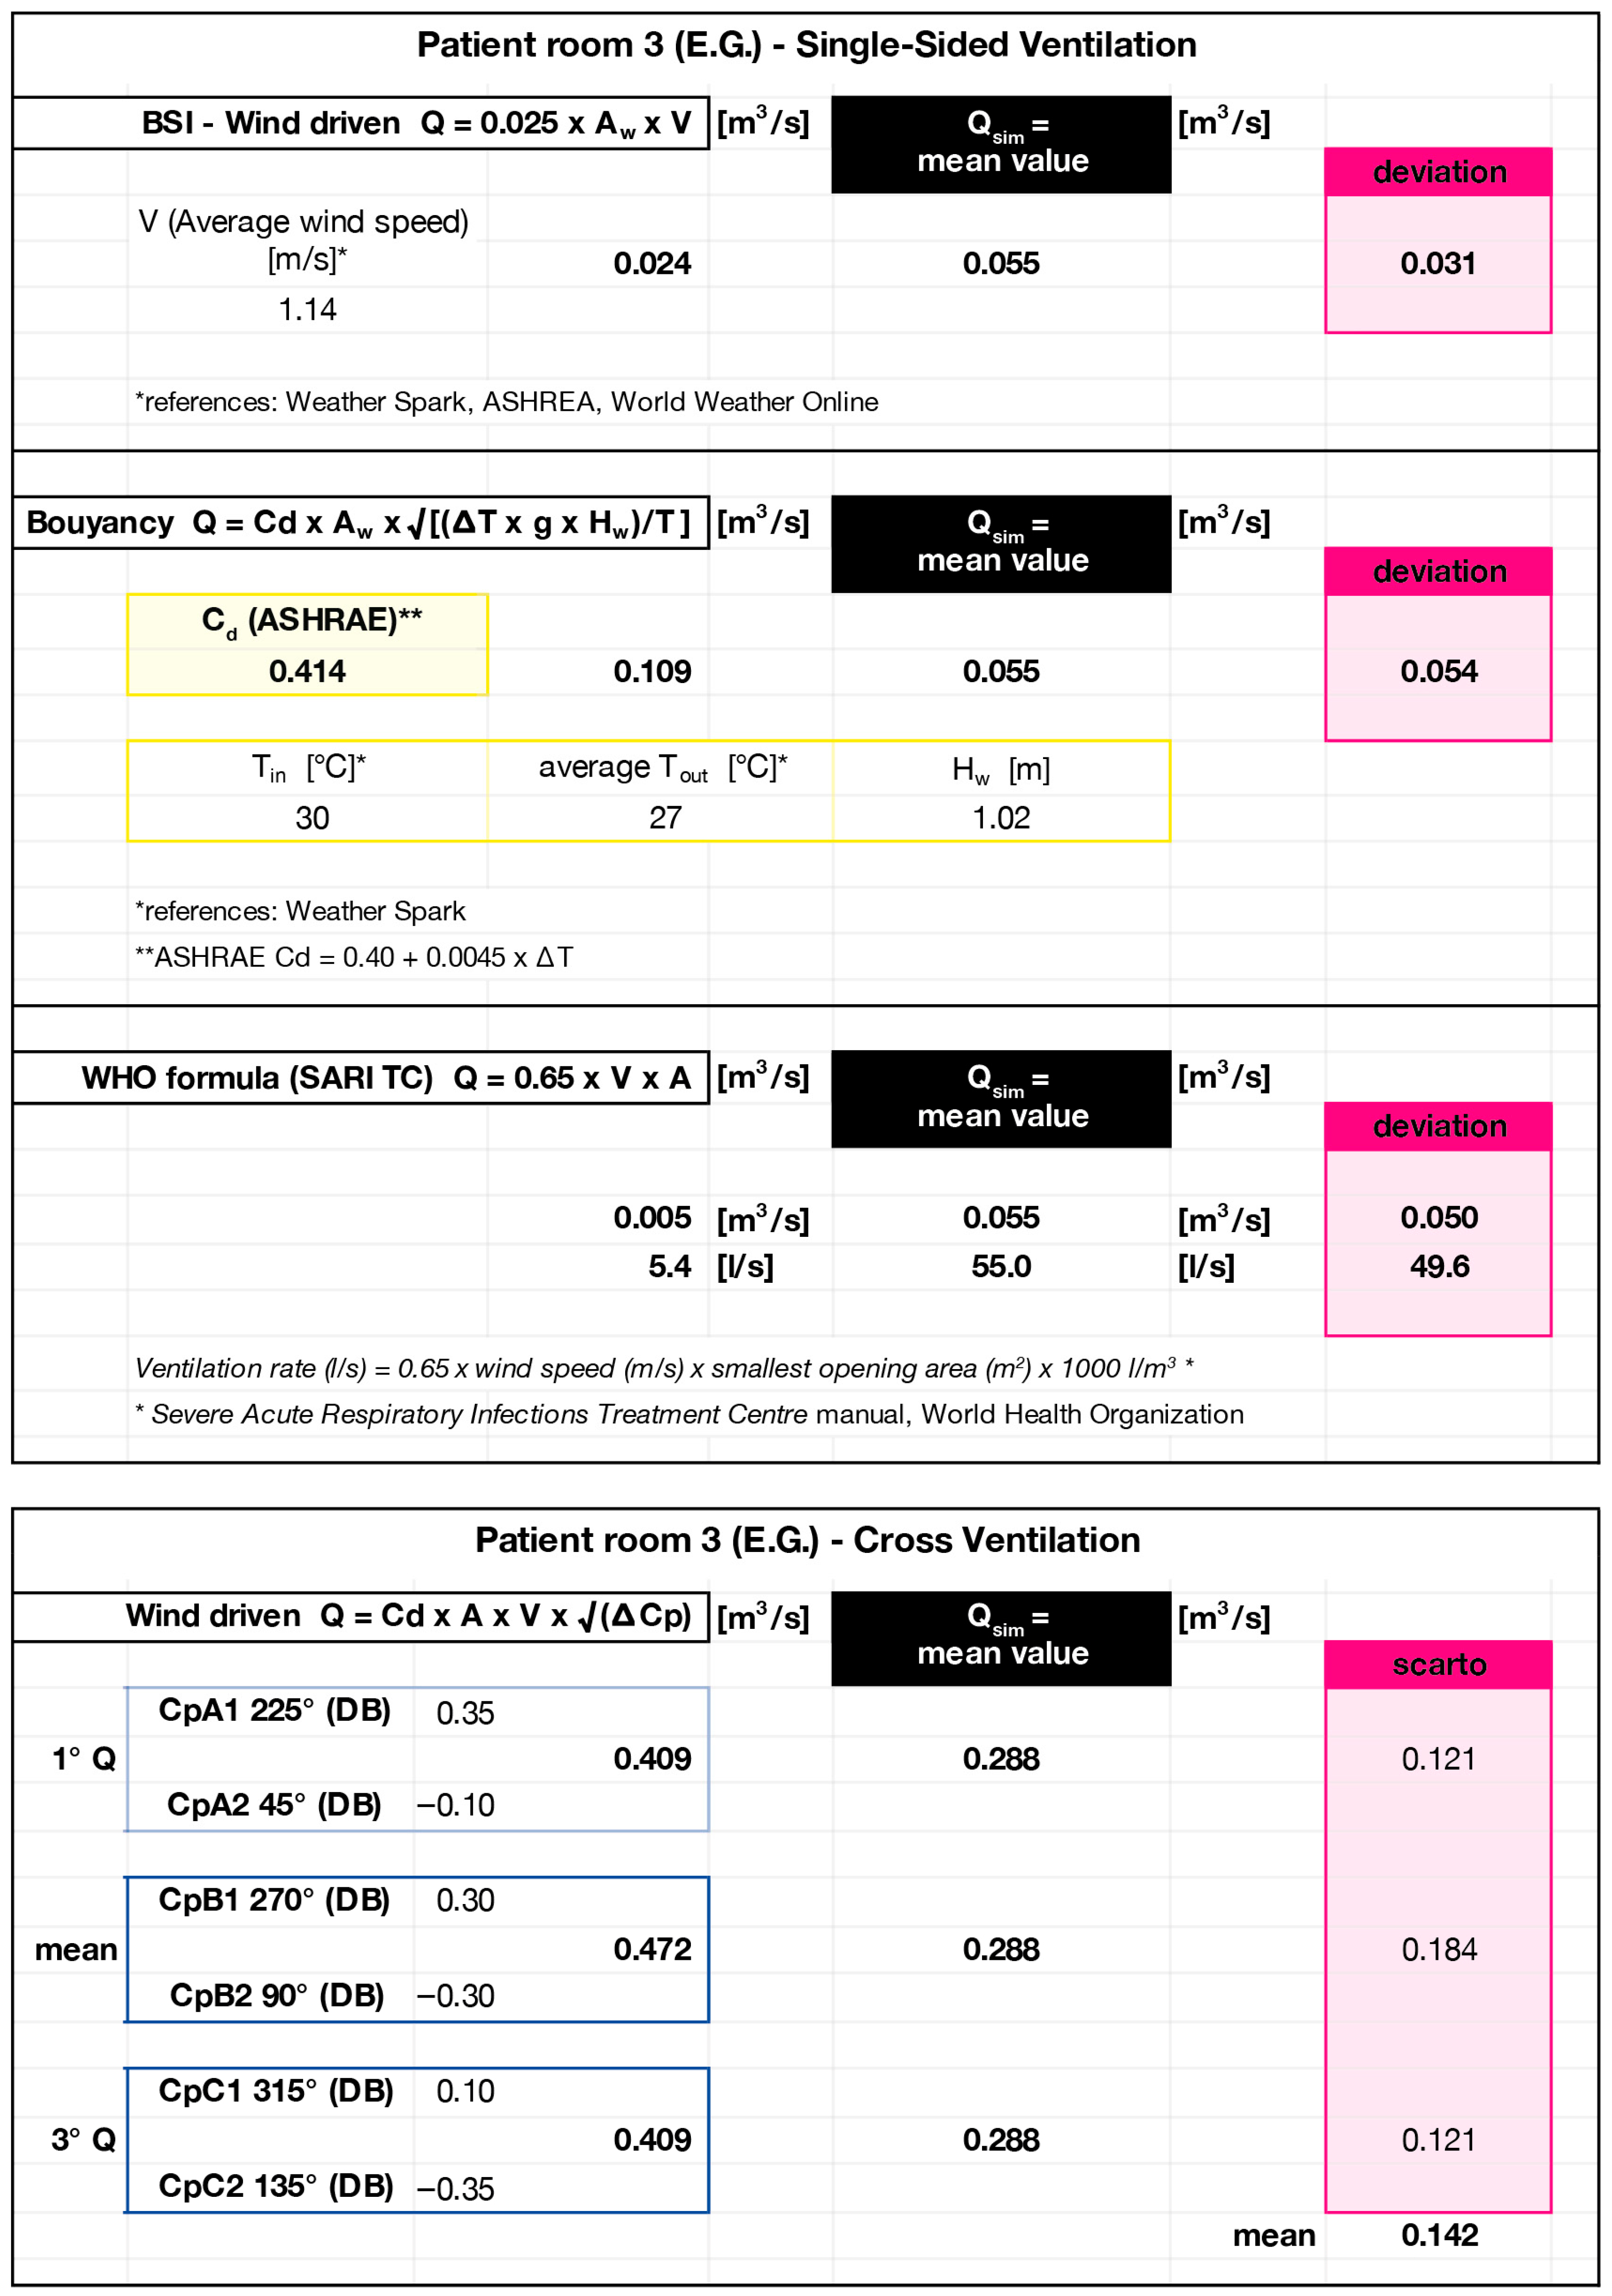
Detailed calculation tables for the reference equations and the proposed simplified wind-driven formula (single-sided and cross-ventilation configurations) are provided in
Supplementary Materials S1 and S3.
In this study, the listed formulas were therefore applied using mean site values, resulting in average airflow rates.
In parallel, a simplified equation was developed based on the analysis of simulation results.
The goal was to provide a practical calculation tool that could be used even in the absence of detailed climatic or technical data, as often occurs in emergencies.
The formula requires only two input parameters:
the geometric configuration of the space—single-sided or cross ventilation—identified through plan analysis;
an Effective Window Air Speed (EWAS), corresponding to the qualitative classification of the context (low, medium, or high wind exposure), consistent with other simplified approaches used in temporary structures and SARI treatment centers [
5,
15,
19].
The two proposed equation versions are:
for single-sided ventilation:
where A is the smallest openable area [m2]—in cross ventilation, the smaller area between the two facades—and V is the reference (Effective Window Air Speed, EWAS) [m/s].
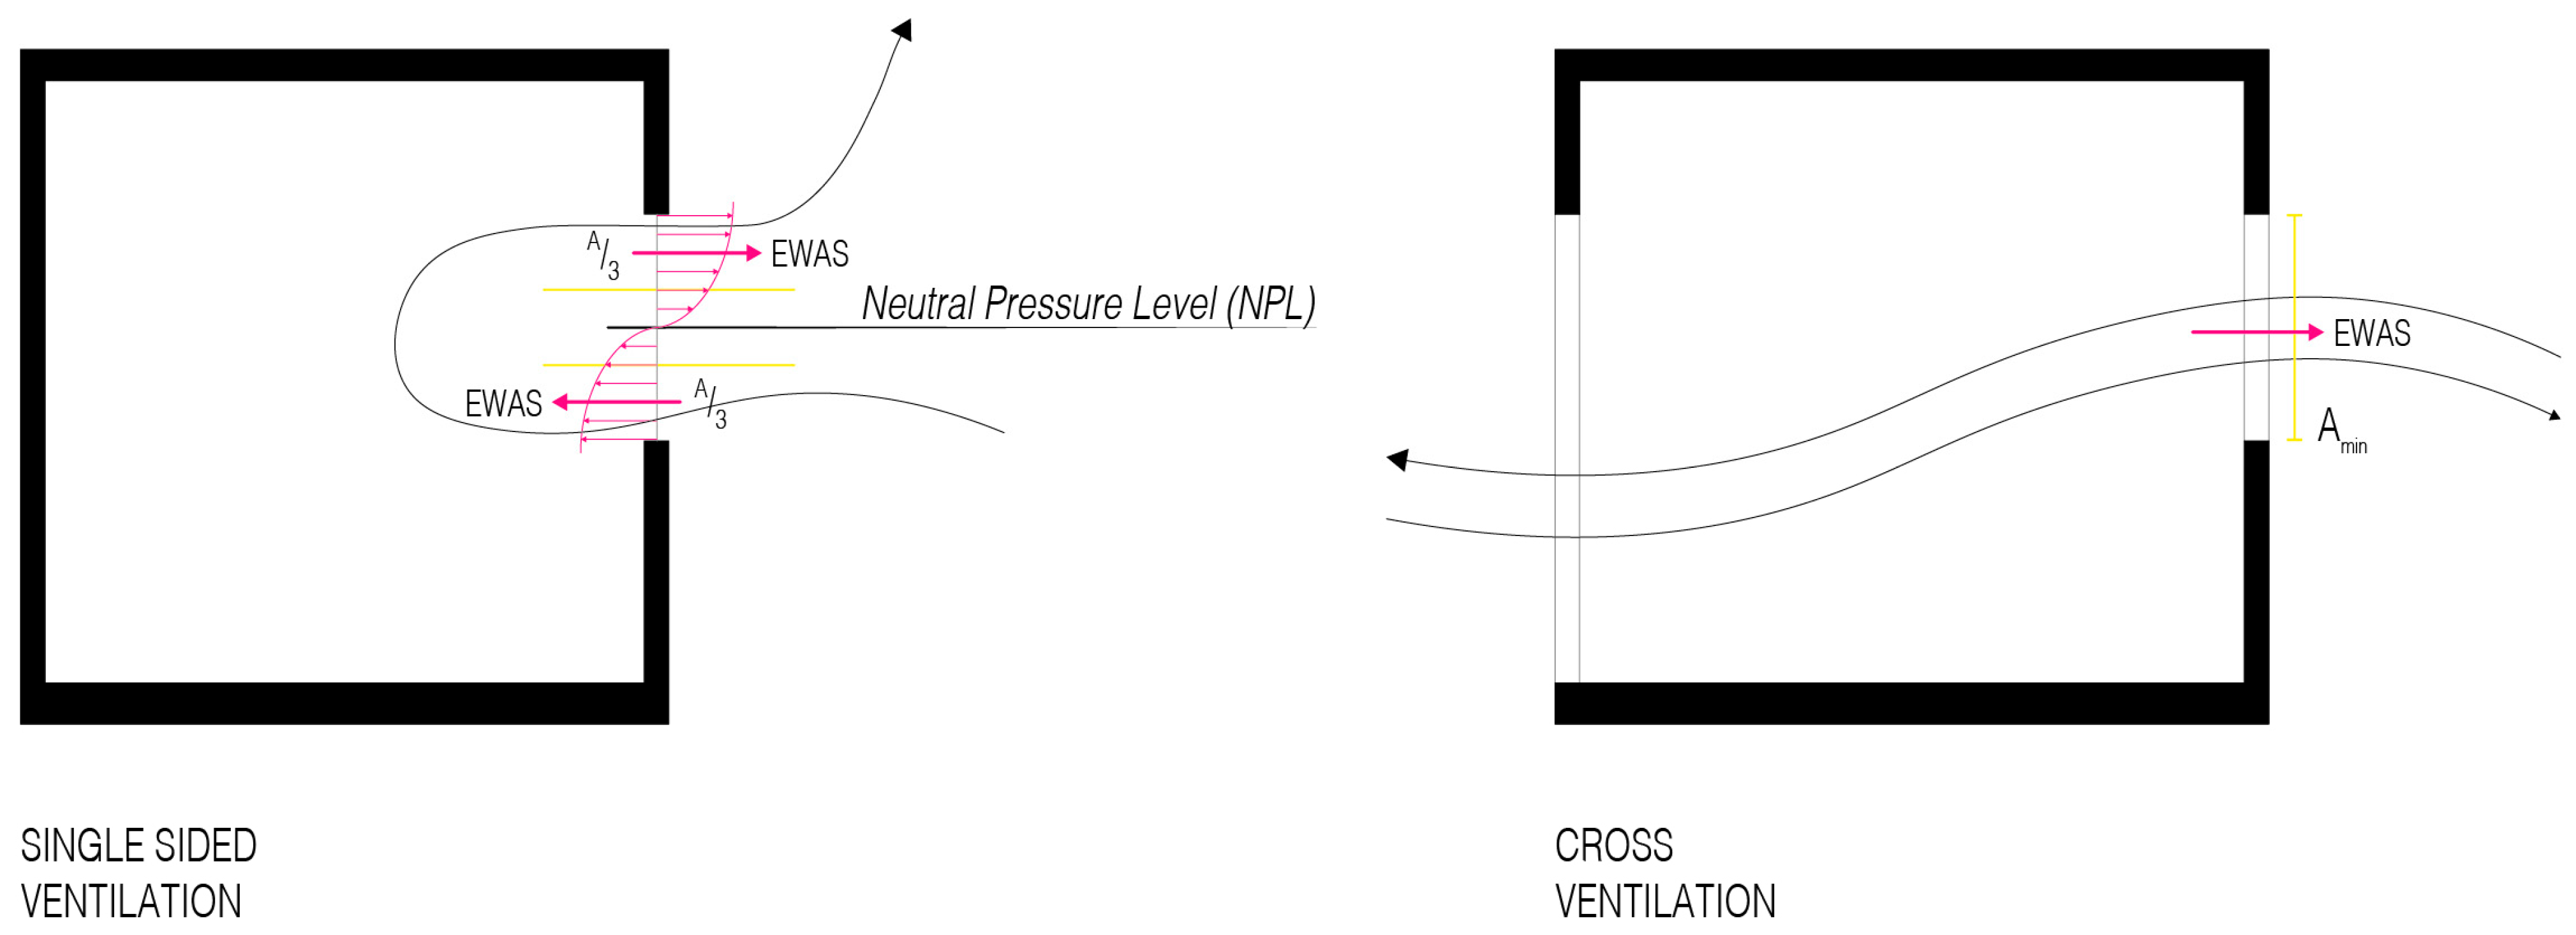
The simplified formula represents a description of a volumetric airflow through an opening characterized by an average velocity normal to its surface. In the single-sided configuration, it approximates the typical condition of a neutral plane at mid-height of the opening, where opposite air streams occur—one entering and the other exiting—while near the neutral plane, the net flow is nearly zero. For this reason, the net flow area is identified as one-third of the total opening area (
Figure 2). This simplification reflects the reduced effectiveness of single-sided airflow patterns, a concept that is commonly adopted in simplified modelling approaches for natural ventilation.
The underlying idea is that, within a given wind exposure category, the potential of natural ventilation mechanisms produces comparable average airflow velocities through the openings. These simplified flow equations were therefore inverted to derive, from simulated flow rates, the air velocities across openings that would produce equivalent flow rates. Statistical analyses of deviations and relative accuracy were performed, leading to the definition of the Effective Window Air Speeds (EWAS) to be used in the simplified formula. By multiplying these EWAS values by the available opening areas, it is possible to estimate the expected airflow rate. Consequently, preliminary design and field verification are reduced to a geometric observation (available opening area and configuration—single-sided or cross ventilation) combined with a reference effective velocity associated with the wind-exposure category.
The results obtained with the simplified formulas were compared with those provided by the British Standards Institution in the
Code of practice for Design of buildings and by the World Health Organization (WHO) for emergency contexts [
5,
7,
14]. The results show that, despite a loss of precision, the simplified approach offers a realistic and reliable solution for preliminary design under limited-information conditions.
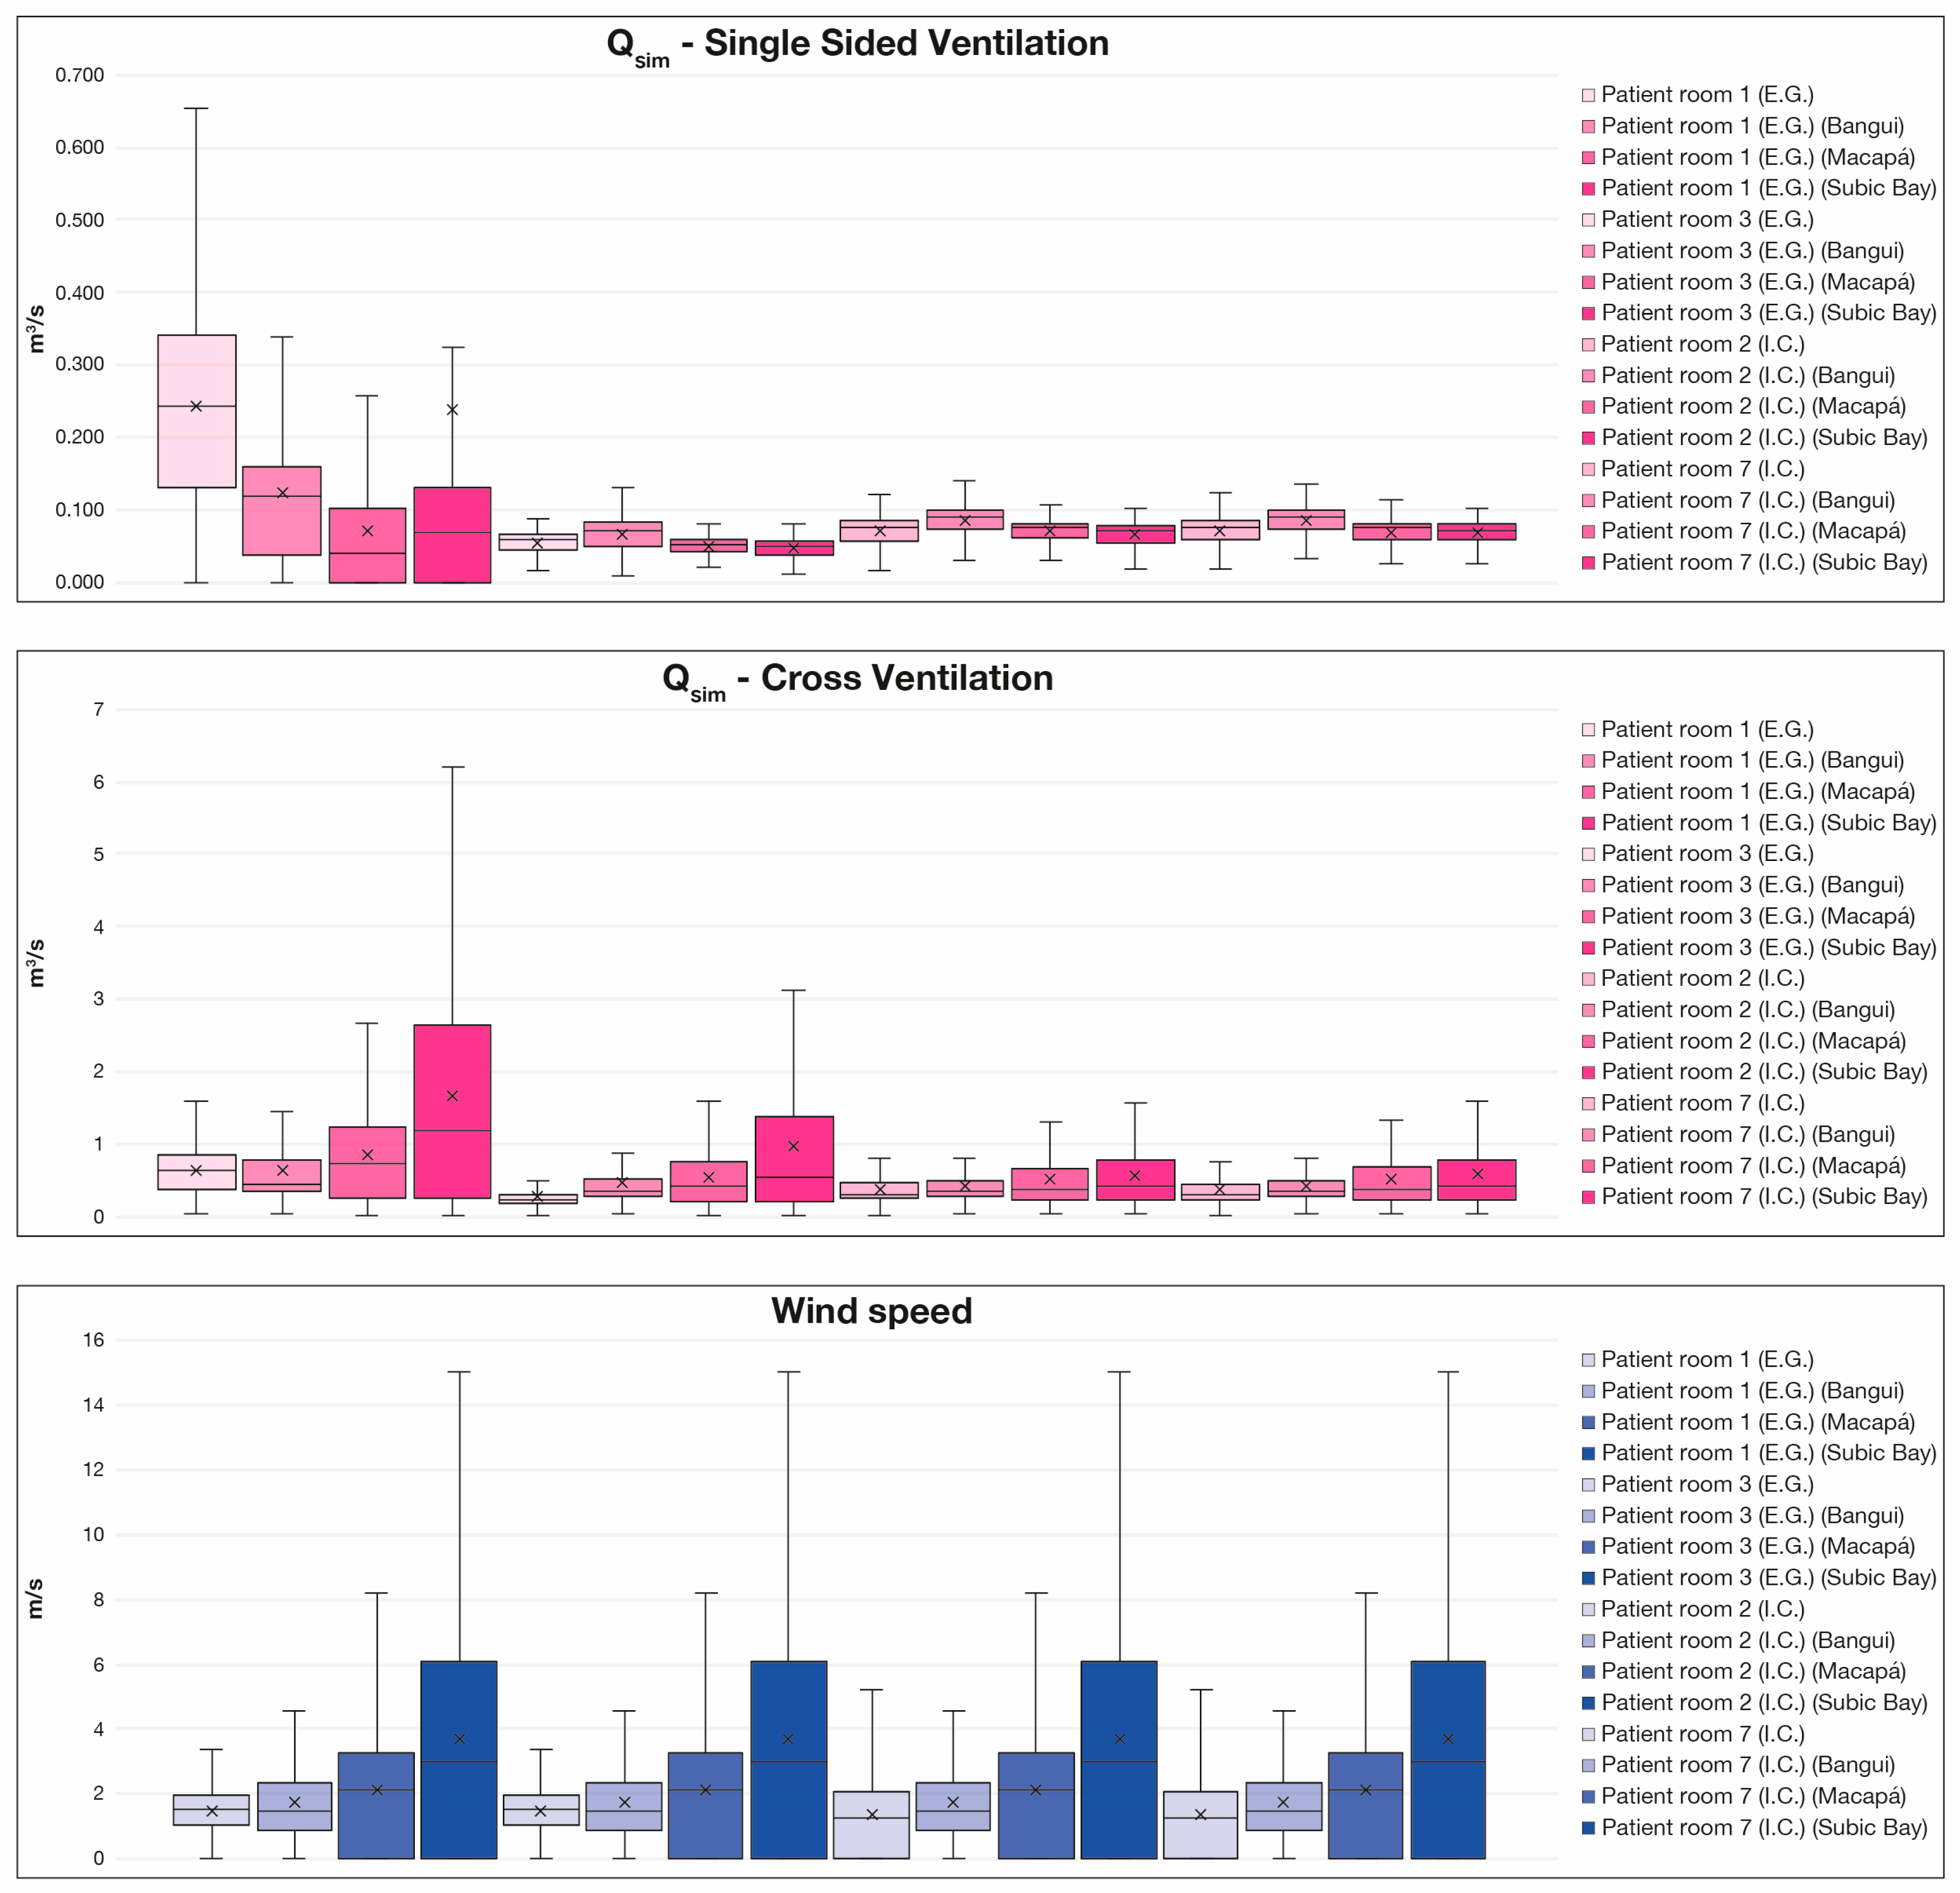
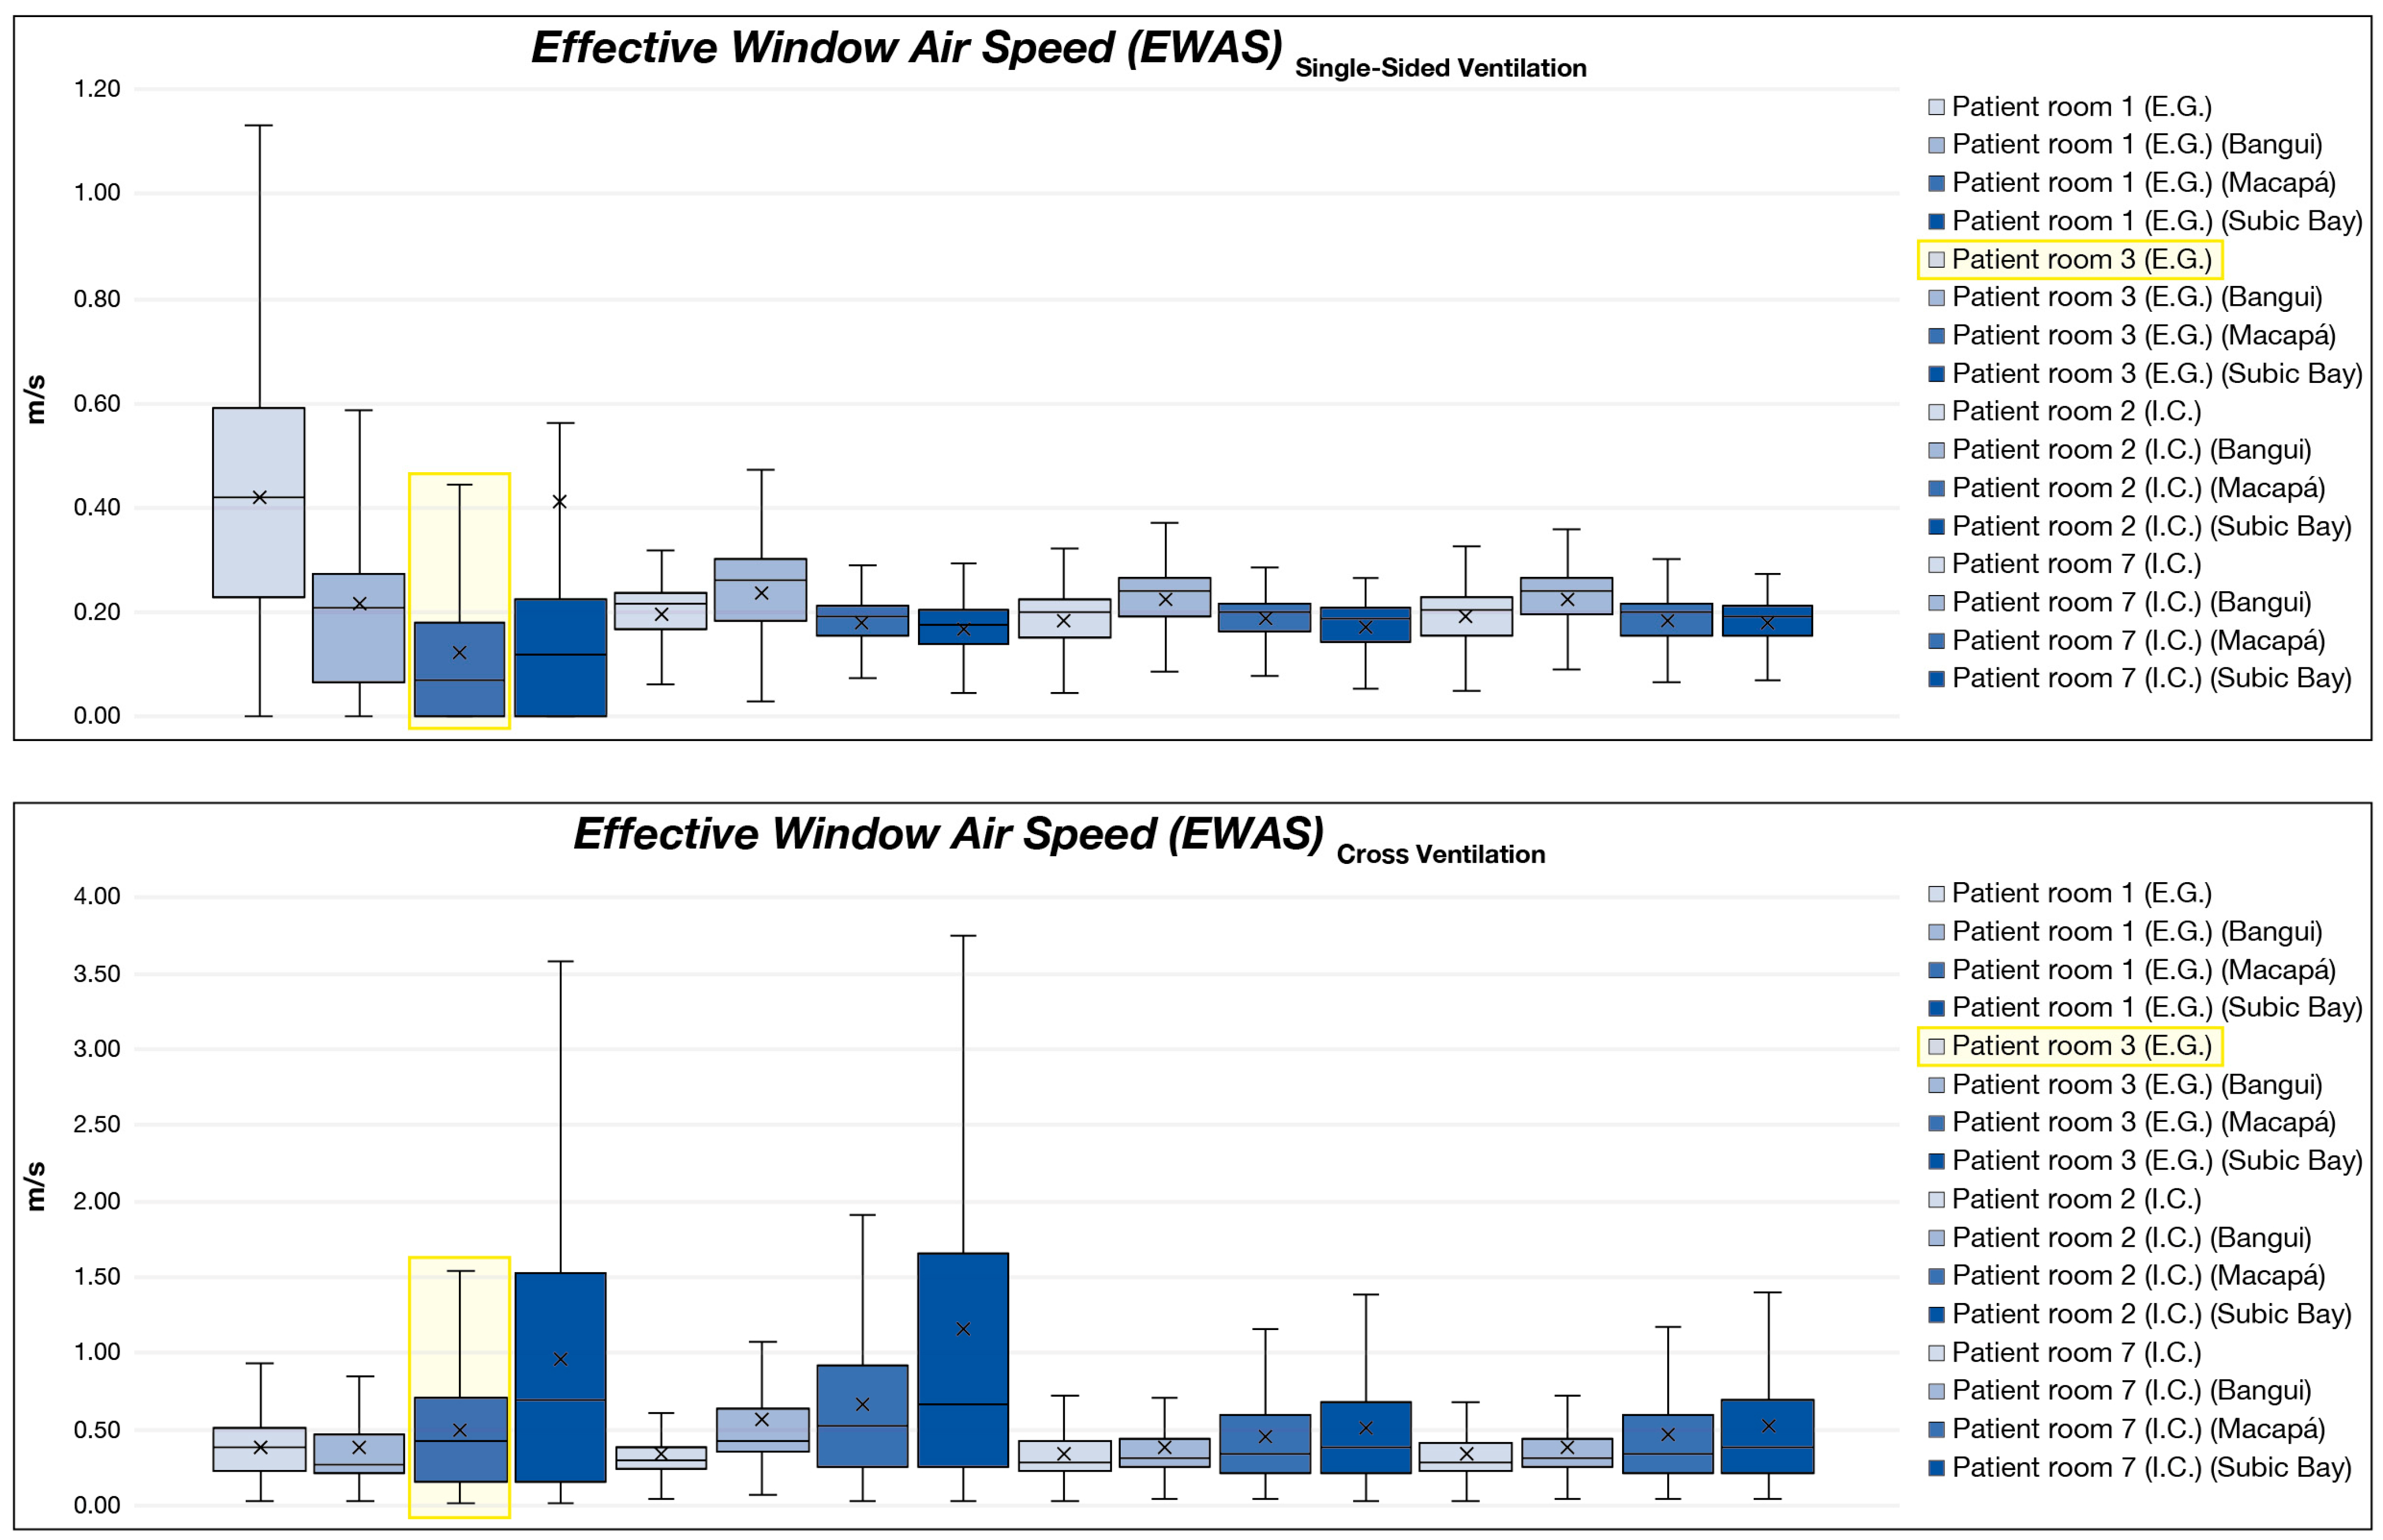
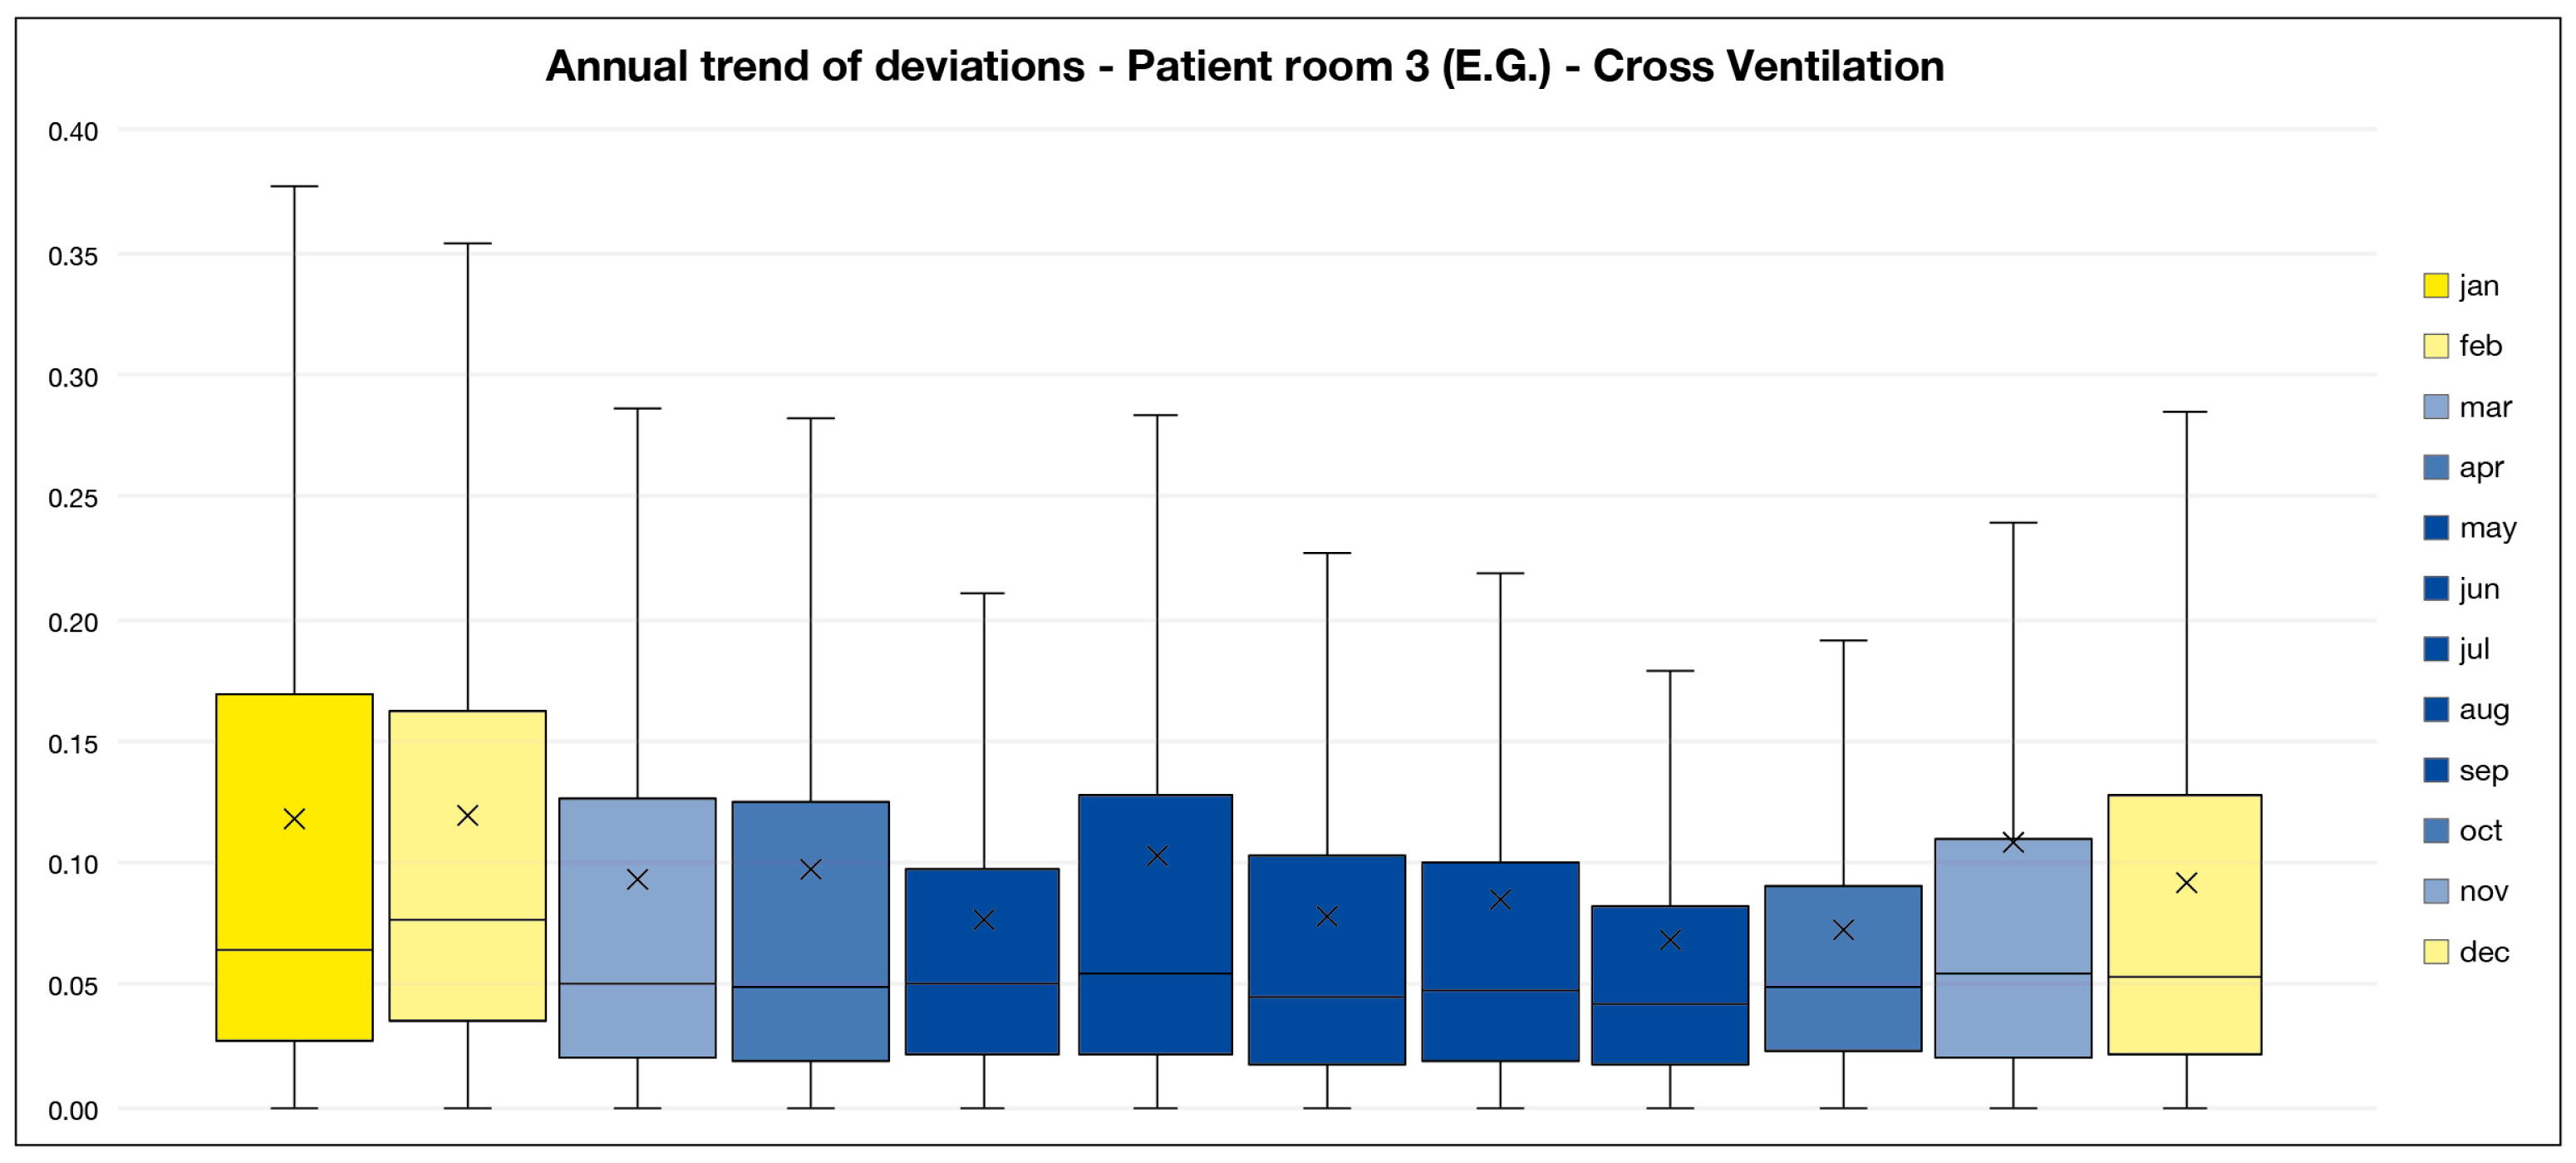
Based on the airflow rates simulated with EnergyPlus (E+) and converted into Effective Window Air Speed (EWAS) for each room (; ), reference intervals were derived for use in the proposed simplified formula.
The reported values represent the annual medians of EWAS calculated across all analyzed rooms for both configurations (single-sided and cross ventilation) and for three representative wind-exposure categories (Bangui, Macapá, Subic Bay):
Low wind exposure (e.g., Bangui, Central African Republic): 0.15–0.30 m/s for single-sided ventilation, 0.10–0.20 m/s for cross ventilation;
Medium wind exposure (e.g., Macapá, Brazil): 0.15–0.25 m/s for single-sided ventilation, 0.10–0.20 m/s for cross ventilation;
High wind exposure (e.g., Subic Bay, Philippines): 0.15–0.25 m/s for single-sided ventilation, 0.10–0.25 m/s for cross ventilation.
These annual ranges represent realistic and easily applicable average values for preliminary design. The seasonal analysis (dry and wet seasons) shows greater variability in the cross-ventilation configuration—due to the concentration of windy hours during specific periods—but not enough to compromise the validity of the annual ranges, which remain robust and conservative for use in emergency or data-scarce contexts.
Therefore, the proposed intervals can be adopted as reference inputs in the simplified formula ( for single-side and for cross ventilation), providing reliable airflow estimates as a function of the openable surface area and the qualitative level of wind exposure in the context.
6. Discussion
The results obtained highlight several relevant considerations for the design of natural ventilation systems in health emergency contexts.
First, the simulations conducted with EnergyPlus (E+) confirmed the high variability of natural ventilation performance depending on climatic conditions and opening configurations.
The distinction between low-, medium-, and high-wind scenarios proved useful for evaluating model sensitivity. In low-wind contexts (Bangui, Central African Republic), theoretical formulas tend to overestimate airflow rates, consistent with what has been observed in previous experimental validation studies [
18]. Conversely, under high-wind conditions (Subic Bay, Philippines), the real behavior of ventilation is more complex than that predicted by simplified models available in the literature due to the combined effects of turbulence and pressure distribution on facades [
15,
19].
The comparison between simulated data and established formulas (WHO, BSI, ASHRAE) showed that even the most sophisticated models introduce significant errors, stemming from the inability to fully account for dynamic variables such as wind speed and direction, temperature difference ΔT between indoor and outdoor air, and pressure coefficients. This finding confirms what earlier studies have already indicated [
8,
9]: that the direct application of such formulas in first-response contexts is complex and often impractical. These deviations are also related to the simplified assumptions inherent in traditional analytical models, which typically treat airflow as a steady-state phenomenon. These models often fail to capture the dynamic interactions between wind direction, facade pressure distribution, and short-term wind speed fluctuations. This effect is particularly evident in high-wind scenarios, such as Subic Bay, where the variability of wind speed and direction leads to greater discrepancies between analytical predictions and simulated airflow rates.
The simplified formula proposed in this study—based on only two input parameters, the geometric configuration (single-sided or cross ventilation) and a reference velocity between 0.15 and 0.30 m/s for single-sided ventilation, and between 0.10 and 0.25 m/s for cross ventilation—demonstrated consistency and adequacy of the proposed approach within the defined scope. Although it inevitably introduces a margin of error, this simplification makes it possible to estimate airflow rates comparable to those obtained from simulations, keeping deviations within acceptable limits even on a seasonal basis (wet and dry seasons). This confirms that an ultra-simplified approach can represent an effective compromise between accuracy and applicability in situations where speed and data accessibility are priorities.
From an operational standpoint, the adoption of a universal formula enables designers to rapidly assess the natural ventilation performance of a building or prefabricated module, even in the absence of detailed climatic data. This is particularly relevant for temporary treatment centers in resource-limited contexts, where the availability of calculation tools and detailed meteorological information is restricted. In practical terms, the simplified equation can be applied using a straightforward workflow:
identify the ventilation configuration (single-sided or cross ventilation);
estimate the effective openable window area;
select a reference EWAS value according to the qualitative wind exposure category;
calculate the expected airflow rate using the simplified equation.
This procedure enables a rapid preliminary evaluation of ventilation potential during the early design stages.
However, certain limitations must be acknowledged. The proposed formula does not replace detailed simulation models, which remain essential for advanced design and safety assessment in complex contexts. Moreover, the reference ranges of the Effective Window Air Speed (EWAS)—typically between 0.10 and 0.30 m/s, with limited differences among contexts with different wind exposure—are derived from a limited number of case studies and climatic scenarios. Further validation in additional contexts would be valuable to consolidate its universal applicability. Nevertheless, within these constraints, the proposed methodology represents a first step toward the systematic testing of ultra-simplified ventilation assessment tools. By explicitly defining its scope and boundaries, the study provides a structured basis for future extensions to a wider range of case studies, climatic conditions, and experimental validation efforts.
Overall, the research emphasizes that the goal is not to achieve absolute values free of error, but to provide a simple, replicable, and usable tool under emergency conditions, capable of guiding the early stages of architectural design.
The proposed reference ranges of Effective Window Air Speed (EWAS)—derived from dynamic simulations and validated through statistical analysis—typically range between 0.10 and 0.30 m/s, with limited variation across different wind contexts. These values represent a realistic and easily applicable input for the use of the simplified formula during the preliminary design phase.
7. Conclusions
This research proposed and tested a simplified equation for estimating the airflow rate Q [m3/s] in natural ventilation systems, with the aim of providing an operational tool for health emergency contexts and resource-limited areas. The approach relies on only two input parameters—the geometric configuration of the space (single-sided or cross ventilation) and a reference wind speed ranging between 0.15 and 0.30 m/s for single-sided ventilation, and between 0.10 and 0.25 m/s for cross ventilation—and is characterized by its practical immediacy, in contrast to conventional formulas that require detailed climatic data rarely available in field conditions.
The results showed that, although the simplified model inevitably introduces a margin of error compared with dynamic simulations, it provides a meaningful estimation of airflow rates, maintaining deviations within acceptable limits even on a seasonal basis. The proposed approach therefore has the potential to serve as a rapid decision-support tool during the preliminary design phases of temporary treatment centers. In such contexts, speed and computational simplicity are essential.
Given the limited number of analyzed case studies, the reference ranges of the Effective Window Air Speed (EWAS) should be interpreted as preliminary and indicative. Within this framework, it is possible to define a confidence interval for the expected EWAS values—approximately between 0.10 and 0.30 m/s for both configurations—which may evolve toward a Gaussian-like distribution as additional case studies are introduced. This highlights the need for continued research and experimental validation to refine the model and consolidate its statistical reliability. In this direction, the research group will continue developing the study, inviting the scientific community to contribute with further case studies and experimental analyses aimed at testing and improving the proposed model.
The study highlights the need for further validation on a larger number of case studies and in different climatic contexts, while laying the groundwork for the development of operational guidelines that integrate ultra-simplified computational tools into architectural practice. The proposed workflow is intended to offer a rapid assessment when time, data availability, or resources are limited. In this sense, the proposed approach represents a methodological contribution to the field of architecture for public health, reinforcing the importance of adaptable design solutions in emergency settings.